the Creative Commons Attribution 4.0 License.
the Creative Commons Attribution 4.0 License.
 | 11 Mar 2020
Comparing stability in random forest models to map Northern Great Plains plant communities in pastures occupied by prairie dogs using Pleiades imagery
Jameson R. Brennan
Patricia S. Johnson
Niall P. Hanan
Black-tailed prairie dogs (Cynomys ludovicianus) have been described as a keystone species and are important for grassland conservation, yet many concerns exist over the impact of prairie dogs on plant biomass production and consequently livestock production. The ability to map plant communities in pastures colonized by prairie dogs can provide land managers with an opportunity to optimize rangeland production while balancing conservation goals. The aim of this study was to test the ability of random forest (RF) models to classify five plant communities located on and off prairie dog towns in mixed-grass prairie landscapes of north central South Dakota, assess the stability of RF models among different years, and determine the utility of utilizing remote sensing techniques to identify prairie dog colony extent. During 2015 and 2016, Pleiades satellites were tasked to image the study site for a total of five monthly collections each summer (June–October). Training polygons were mapped in 2016 for the five plant communities and used to train RF models. Both the 2015 and 2016 RF models had low (1 %) out-of-bag error rates. However, comparisons between the predicted plant community maps using the 2015 imagery and one created with the 2016 imagery indicate over 32.9 % of pixels changed plant community class between 2015 and 2016. The results show that while RF models may predict with a high degree of accuracy, overlap of plant communities and interannual differences in rainfall may cause instability in fitted models. A final RF model combining both 2015 and 2016 data yielded the lowest error rates and was also highly accurate in determining prairie dog colony boundaries.
- Article
(926 KB) - Full-text XML
- BibTeX
- EndNote


Within the Northern Great Plains mixed-grass prairie ecosystem, black-tailed prairie dog colonization is an issue of concern for livestock producers (Miller et al., 2007). Competition between prairie dogs and livestock is a major concern for land managers looking to optimize beef production while still conserving wildlife species (Augustine and Springer, 2013). Prairie dogs have been identified as a keystone species and are often seen as ecosystem engineers providing habitat to a number of other plant and wildlife species (Davidson et al., 2010; Kotliar et al., 1999). Prairie dogs can also reduce availability of forage for livestock by directly reducing the quantity of forage available (through direct consumption, clipping plants to increase predator detection, and building soil mounds) and by changing species composition (Derner et al., 2006). Within the mixed-grass prairie, C3 midgrasses tend to decrease and C4 shortgrasses increase along an increasing gradient of grazing intensity (Irisarri et al., 2016). Due to repeated defoliation, older core areas of prairie dog towns often become characterized by extensive areas of bare ground and low vegetation production, which is generally limited to annual forb and dwarf shrub species. Pastures containing extensive areas of bare ground due to prairie dog colonization may potentially depress livestock forage intake rates and ultimately beef production. The ability to map the extent and monitor the impact of prairie dogs on the landscape can help land managers looking to optimize livestock production on prairie-dog-occupied rangelands.
Remote sensing of rangelands greatly improves our ability to study and understand complex ecological interactions across the landscape. As technology advances, monitoring of rangelands via remote sensing platforms will facilitate research products freely available to land managers (Browning et al., 2015). One of the main advantages of remote sensing data is their capacity to cover wide areas, allowing assessment of plant communities at landscape level scales compared to traditional point-based assessments (Ramoelo et al., 2015; Yu et al., 2018). Numerous studies have demonstrated the utility of remote sensing applications in monitoring rangeland condition, including mapping of vegetation communities, plant species composition, biomass estimation, and impact of grazing intensity on the landscape (Goodin and Henebry, 1997; Blanco et al., 2008; Franke et al., 2012).
Many methods for accurately classifying plant communities using remote sensing techniques have been used in ecological and natural resource studies. One method, random forest (RF) classification, has gained considerable traction in the remote sensing community for its ability to produce accurate classifications, handle highly dimensional data, and provide efficient computing times (Belgiu and Drăguţ, 2016). RF is seen as an improvement over simple classification tree analysis by reducing noise and misclassification of outliers (Laliberte et al., 2007; Nitze et al., 2015). RF is an ensemble decision tree classifier which combines bootstrap sampling to construct several individual decision trees from which a class probability is assigned (Mellor et al., 2013). RF builds each tree using a deterministic algorithm selecting a random set of variables and a random sample from the calibration dataset (Ramoelo et al., 2015).
The utility of random forest algorithms has been demonstrated in remote sensing applications across many plant communities at multiple scales (Mutanga et al., 2012; Lowe and Kulkarni, 2015; Ramoelo et al., 2015). Concerns exist, however, over the transferability of these models to different sites, across seasons, or years. For example, RF models have shown to have a high degree of classification accuracy for mapping fine-scale coastal vegetation using digital elevation maps and high-resolution orthophoto imagery, but model accuracy decreased significantly when applied to spatially separated sites (Juel et al., 2015). Selecting spatially relevant training data or including species-level cover data may help improve or explain differences observed when transferring models between sites. Incorporating additional seasons of data may also improve RF model accuracy; previous research has shown an improvement of RF model accuracy in classifying wetlands in northern Minnesota with the inclusion of Landsat 5 images across 2 years using full season data versus summer-only and fall-only models (Corcoran et al., 2013). Longer-term studies have also demonstrated the utility of using RF modeling with 30 m Landsat data to monitor rangeland cover across the western United States over a 33-year period (Jones et al., 2018). Results of these studies suggest the scale and seasonality of the imagery may play an important role in the stability and accuracy of RF models.
The stability in RF models to accurately map plant communities within prairie-dog-occupied pastures may be particularly important for managers looking to monitor prairie dog colony expansion or contraction over time. While classification rates are often reported in studies, the potential overlap in plant community composition is rarely explored as a potential source of error within the models. Many research studies focus solely on spectral differences in plant communities and fail to analyze community differences on the ground at the species level (de Colstoun et al., 2003; Geerken et al., 2005). This may be especially important within prairie-dog-occupied rangelands, where shifts in plant community composition may be driven more by the presence or absence of an herbivore species versus elevation, soils, or other landscape features. These herbivory-induced changes in plant community may facilitate or hamper classification schemes. The ability to accurately map plant communities within prairie-dog-occupied pastures can help improve management of rangelands colonized by prairie dogs, yet little research has explored the possibility of utilizing remote sensing as a tool to do so.
A large collaborative study from 2012 to 2016 was conducted to evaluate livestock production on mixed-grass prairie pastures with varying levels of prairie dog occupation. A major goal of the larger study was to determine which plant communities on the pastures cattle preferred to graze and how those preferences shifted within and between years (Olson et al., 2016). Plant communities on the site were categorized based on location (on- or off-town) and visually apparent dominant plant functional groups. Thus, plant community as defined for this study was a collection of species within an area of a relatively uniform composition different from neighboring patches. Differences in neighboring patches were evident by differences in dominant functional group (forb vs. grass) or differences in photosynthetic pathways (C3 vs. C4 grasses). The overall goal of this paper, then, was to develop maps that accurately classify plant communities based on satellite imagery collected between years. Specific objectives of this study were to (1) determine differences in the five identified plant communities based on species composition, (2) assess the utility of using a RF model with high-resolution satellite imagery to classify plant communities of interest within a mixed-grass prairie ecosystem containing prairie dogs, (3) determine the stability of the RF model when using subsequent years of satellite imagery with identical training data, and (4) determine the ability of high-resolution satellite imagery to accurately map prairie dog towns. Our ability to map and understand these plant communities at large scales will give researchers insight into applying RF models across years using high-resolution imagery. Research from this study will allow us to better assess how prairie dogs drive changes in plant communities and provide a new tool to map the extent and impact of prairie dog colonization on the landscape to better inform land management decisions.
2.1 Study site
The study area (45.74∘ N, 100.65∘ W) was located near McLaughlin, South Dakota, on a northern mixed-grass prairie ecosystem. Native prairie pastures (810 ha total area) were leased from 2012 to 2016; pastures were continuously stocked with yearling steers from June to October of each year to achieve 50% utilization. Of the 810 ha, approximately 186 ha was occupied by black-tailed prairie dogs (Cynomys ludovicianus). Predominant soils at the site were clays and loams. Ecological sites, and the plant communities they support, vary widely; loamy and clayey were the predominant ecological sites at the site with inclusions of dense clay, shallow clay, and thin claypan (Barth et al., 2014). Plant species dominating the site were largely native, including western wheatgrass (Pascopyrum smithii Rydb.), green needlegrass (Nassella viridula Trin.), and needle-and-thread grass (Hesperostipa comata Trin. & Rupr), intermixed with blue grama (Bouteloua gracilis Willd. ex Kunth), buffalo grass (Bouteloua dactyloides Nutt.), and sedges (Carex spp.). The most common non-native species on the site was Kentucky bluegrass (Poa pratensis Boivin & Love). Woody draws occupied moist drainage areas; vegetation consists primarily of bur oak (Quercus macrocarpa Nutt.), American plum (Prunus americana Marshall), and chokecherry (Prunus virginiana L.). These draws were frequently flanked by snowberry-dominated patches (Symphoricarpos occidentalis Hook.). Plant communities on areas occupied by prairie dog towns on the site were largely dominated by western wheatgrass and shortgrasses (buffalo grass, blue grama, and sedges) intermixed with patches of bare ground and annual-forb-dominated areas. Common annual forbs on prairie dog towns included prostrate knotweed (Polygonum aviculare L.), fetid marigold (Dyssodia papposa Vent.), dwarf horseweed (Conyza ramosissima Cronquist), and scarlet globe mallow (Sphaeralcea coccinea Nutt.). A weather station has been maintained on site from May 2013 operated by South Dakota Mesonet. Mean annual rainfall at the site is 446 mm and average growing season (May through September) temperature is 15.3 ∘C (South Dakota Climate and Weather, 2017).
Five plant communities of interest for our study site were identified: (1) forb-dominated sites on prairie dog towns (On-Forb), (2) grass-dominated sites on prairie dog towns (On-Grass), (3) snowberry-dominated sites off-town (Off-Snow), (4) cool-season-grass-dominated sites off-town (Off-Cool), and (5) warm-season-grass-dominated sites off-town (Off-Warm). An additional plant community labeled “Draws” was delineated visually within ArcGIS software due to difficulty in mapping these areas in the field. Areas delineated as Draws were removed from the analysis area.
2.2 Training sites
To facilitate classification, training site polygons were mapped for On-Forb, On-Grass, Off-Cool, Off-Warm, and Off-Snow plant communities using ArcPad for Trimble GPS units in the summer of 2016. Twenty training sites were mapped for each of the plant communities except Off-Warm, for which only eight sites were mapped due to the difficulty of finding homogenous stands of warm-season grasses. Plant species in the Northern Great Plains are dominated by cool-season species; warm-season species, where they occur, are typically intermixed into stands of cool-season species. Training sites for each plant community were selected from across the entire study area to capture potential site differences across research pastures. Sites were mapped in the field by walking the perimeter of the plant community patch with a Trimble GPS unit. Training polygon perimeter boundaries were always at least 3 m from the edge of the patch to minimize error introduced to the training data as a result of GPS signal noise. Identified patches were then converted into a polygon shapefile within ArcGIS to be used as training polygons for the RF classification algorithm. Within each training site polygon, three 0.25 m2 plots were randomly located by tossing plot frames into the area of interest to determine sampling area. Within each plot, percent cover by species was recorded in the summer of 2016 at the time of polygon mapping.
2.3 Plant community analysis
Plant community analysis was performed on vegetation data collected from the three 0.25 m2 plots measured in each training polygon. Differences between plant community compositions were determined using a multi-response permutation procedure (MRPP) with the Sørensen or Bray–Curtis distance method. MRPP is a nonparametric procedure used for testing hypotheses between two or more groups (Mitchell et al., 2015). Differences in community compositions were analyzed for all plant communities, and pairwise comparisons were generated. To analyze trends in species composition between plant community plots, nonmetric multidimensional scaling (NMS) ordination was used (Kruskal, 1964). Only species that occurred in three or more plots were included in the ordination analysis. NMS analysis was conducted using the Sørensen or Bray–Curtis distance method with 250 iterations and a stability criterion of 0.00001. Analysis was repeated five times to confirm ordination pattern in the data. Similarity index matrices were generated to compare plot differences between plant communities and averaged by plant community. All ordination analyses (MRPP and NMS) were performed using PC-ORD 6 software (McCune and Mefford, 2002).
2.4 Imagery
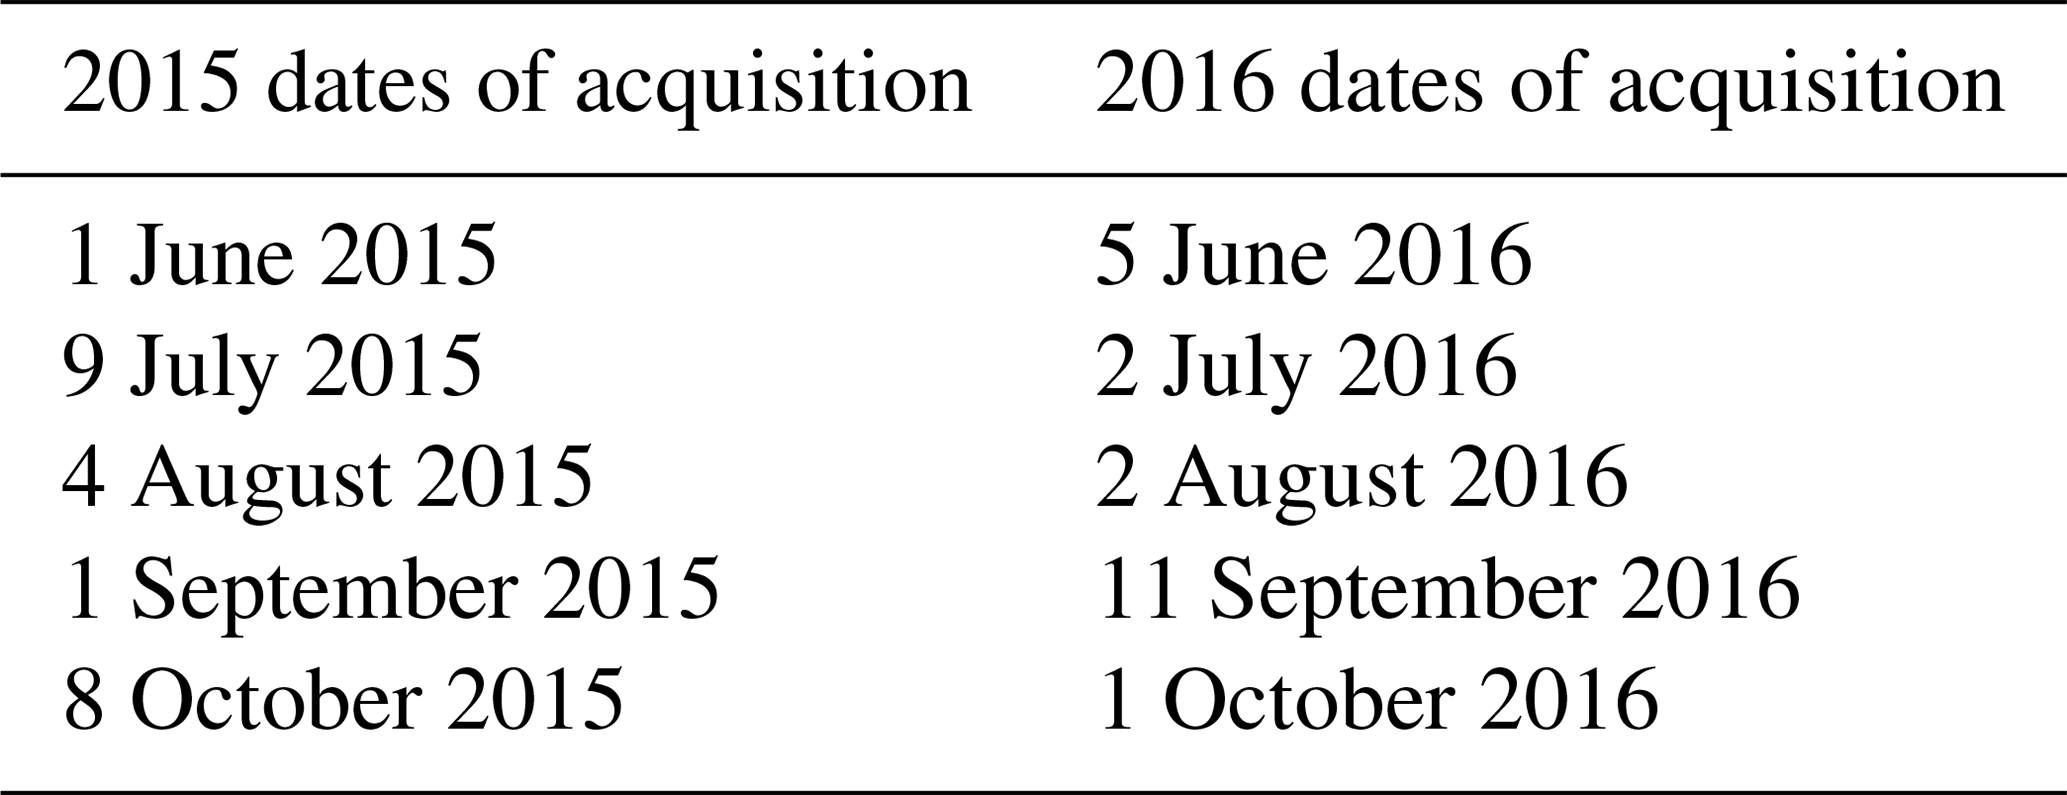
During the summers of 2015 and 2016, Pleiades satellites were tasked to image the study site. Pleiades satellites, which are members of the SPOT family of satellites, are operated by Airbus Defense and Space. This platform was chosen due to its high spatial resolution (0.5 m pan chromatic, 2 m multispectral) and four-band spectral resolution: pan chromatic (480–830 nm), red (600–720 nm), green (490–610 nm), blue (430–550 nm), and near infrared (750–950 nm). Pleiades satellites were designed for commercial tasking and monitoring, allowing multiple revisits to a project site. A total of 10 image collections were acquired in the summer of 2015 and 2016 (five each year) from June through October during the 1st–15th of each month (Table 1). Image collection times were chosen to correspond to the time periods when cattle were actively grazing on the site. Multispectral images were pan-sharpened and orthorectified by the image provider (Apollo Imaging Corp). Each monthly image collection was converted into a normalized difference vegetation index (NDVI) image. In addition, boundaries of the prairie dog town were mapped using a handheld Trimble GPS unit to compare predicted colony location with ground truth location.
Table 1Acquisition dates of Pleiades satellite imagery tasked for each month (June–October) in 2015 and 2016.
2.5 Random forest model
For the RF model, the Random Forest package of the Comprehensive R Archive Network (CRAN) implemented by Liaw and Wiener (2002) was utilized. Training data were constructed by stacking all satellite imagery spectral bands (red, blue, green, and NIR) and NDVI bands for each month of each year (25 total dimensions per year) to create a raster stack for each year's imagery (2015 and 2016). To train the model, pixel values were extracted from the satellite imagery raster stack for each training polygon mapped in the field. The random forest models were built using 200 decision trees and a default number of nodes at each split (), with plant community data as the response category (On-Grass, On-Forb, Off-Cool, Off-Warm, and Off-Snow) and spectral band values as the predictor. Models were checked for error stabilization, for all models error rates stabilized around 50 trees. Yearly models (2015 and 2016) were built for output comparison. A combined-year model was also constructed using all available spectral data from 2015 and 2016 (50 dimensions).
Within the random forest package, out-of-bag (OOB) error rates were calculated by reserving one-third of the training data to test the accuracy of the predictions. Models were then used to predict class belonging for 2015 and 2016 raster stacks and the combined 2015 and 2016 stack using the “predict” function within the program R. To assess the stability of the RF models from year to year, the “crosstab” function in the raster package in the program R was used to calculate the number of pixels that changed class from 2015 to 2016. The output was used to calculate percent of pixels that were unchanged from 2015 to 2016 model predictions and percent of pixel change that occurred between years for plant community predictions.
3.1 Plant community
MRPP pairwise comparison results showed a significant difference between all plant communities (P<0.001). Differences are evident between plant communities in the 2-D plot of the NMS ordination (final stress = 20.01, instability <0.00001 after 66 iterations), with some overlap occurring between communities (Fig. 1). Plant communities on-town and off-town are clustered at opposite ends of the ordination plot, with the greatest distance being between On-Forb and Off-Snow. Detrended correspondence analysis of plant communities ranging from uncolonized, to 2 years post colonization, to 4–6 years post colonization showed that uncolonized sites were clustered at one extreme and the 4–6-year sites at the other extreme (Archer et al., 1987). Interestingly, Off-Warm and On-Grass communities are clustered closer in ordination space. Plant community shifts on-town towards those dominated by shortgrass species have been documented (Agnew et al., 1986; Koford, 1958) and are probably attributable to the high grazing resistance of the C4 species blue grama and buffalo grass (Derner et al., 2006).
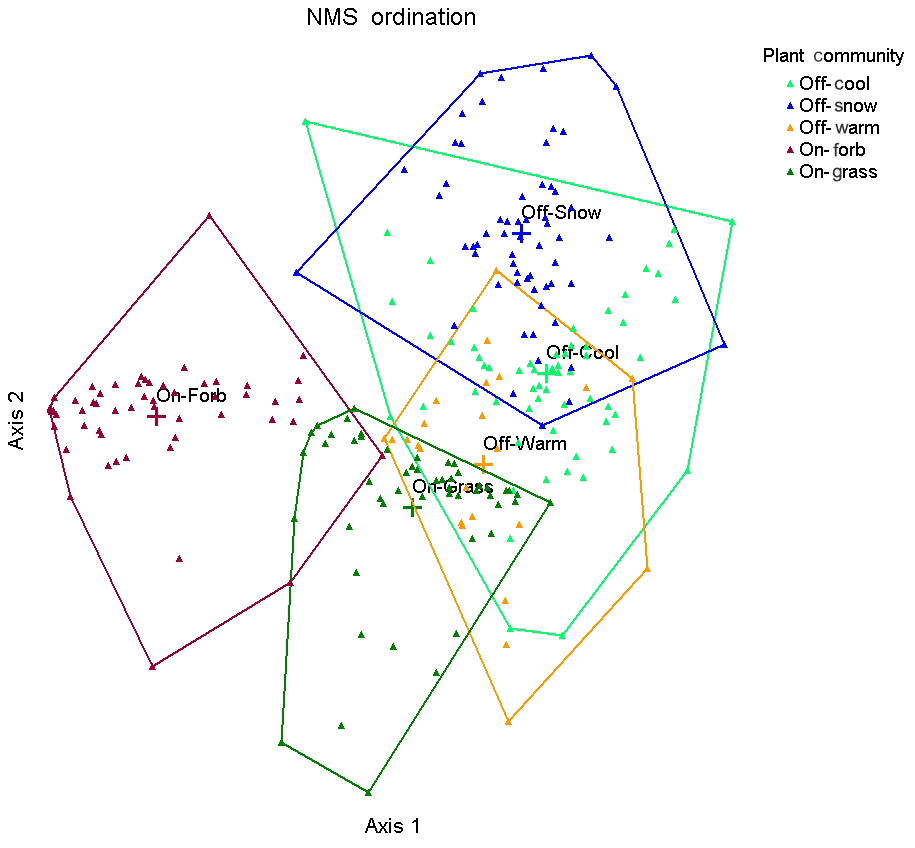
Figure 1NMS ordination plots for plant communities located on and off of prairie dog towns, based on plant cover by species data collected in 2016 on the study site in north central South Dakota. The “+” symbol followed by the community name represent the weighted mean (centroid) of the multivariate dataset. Plant communities on prairie dog towns are grass-dominated (On-Grass) and forb-dominated (On-Forb); plant communities in off-town areas are cool-season-grass-dominated (Off-Cool), warm-season-grass-dominated (Off-Warm), and snowberry-dominated (Off-Snow).
Similarity index differences between plant communities were generated from a Sørensen (Bray–Curtis) distance matrix and can be seen in Table 2. While there is some overlap between plant communities, in general similarities are low (<29 %), with the greatest distance occurring between the On-Forb communities and the off-town communities (Table 2). Based on how plant communities were selected in this study, we expected plant community composition to be distinct between groups. Though plant communities are defined by dominant functional group in this study, the amount of overlap occurring demonstrates that other functional groups and species exist within these distinct patches, which may be a potential source of instability in classification models.
Table 2Similarity index (Sørensen (Bray–Curtis) distance method) values averaged by plot across plant communities.
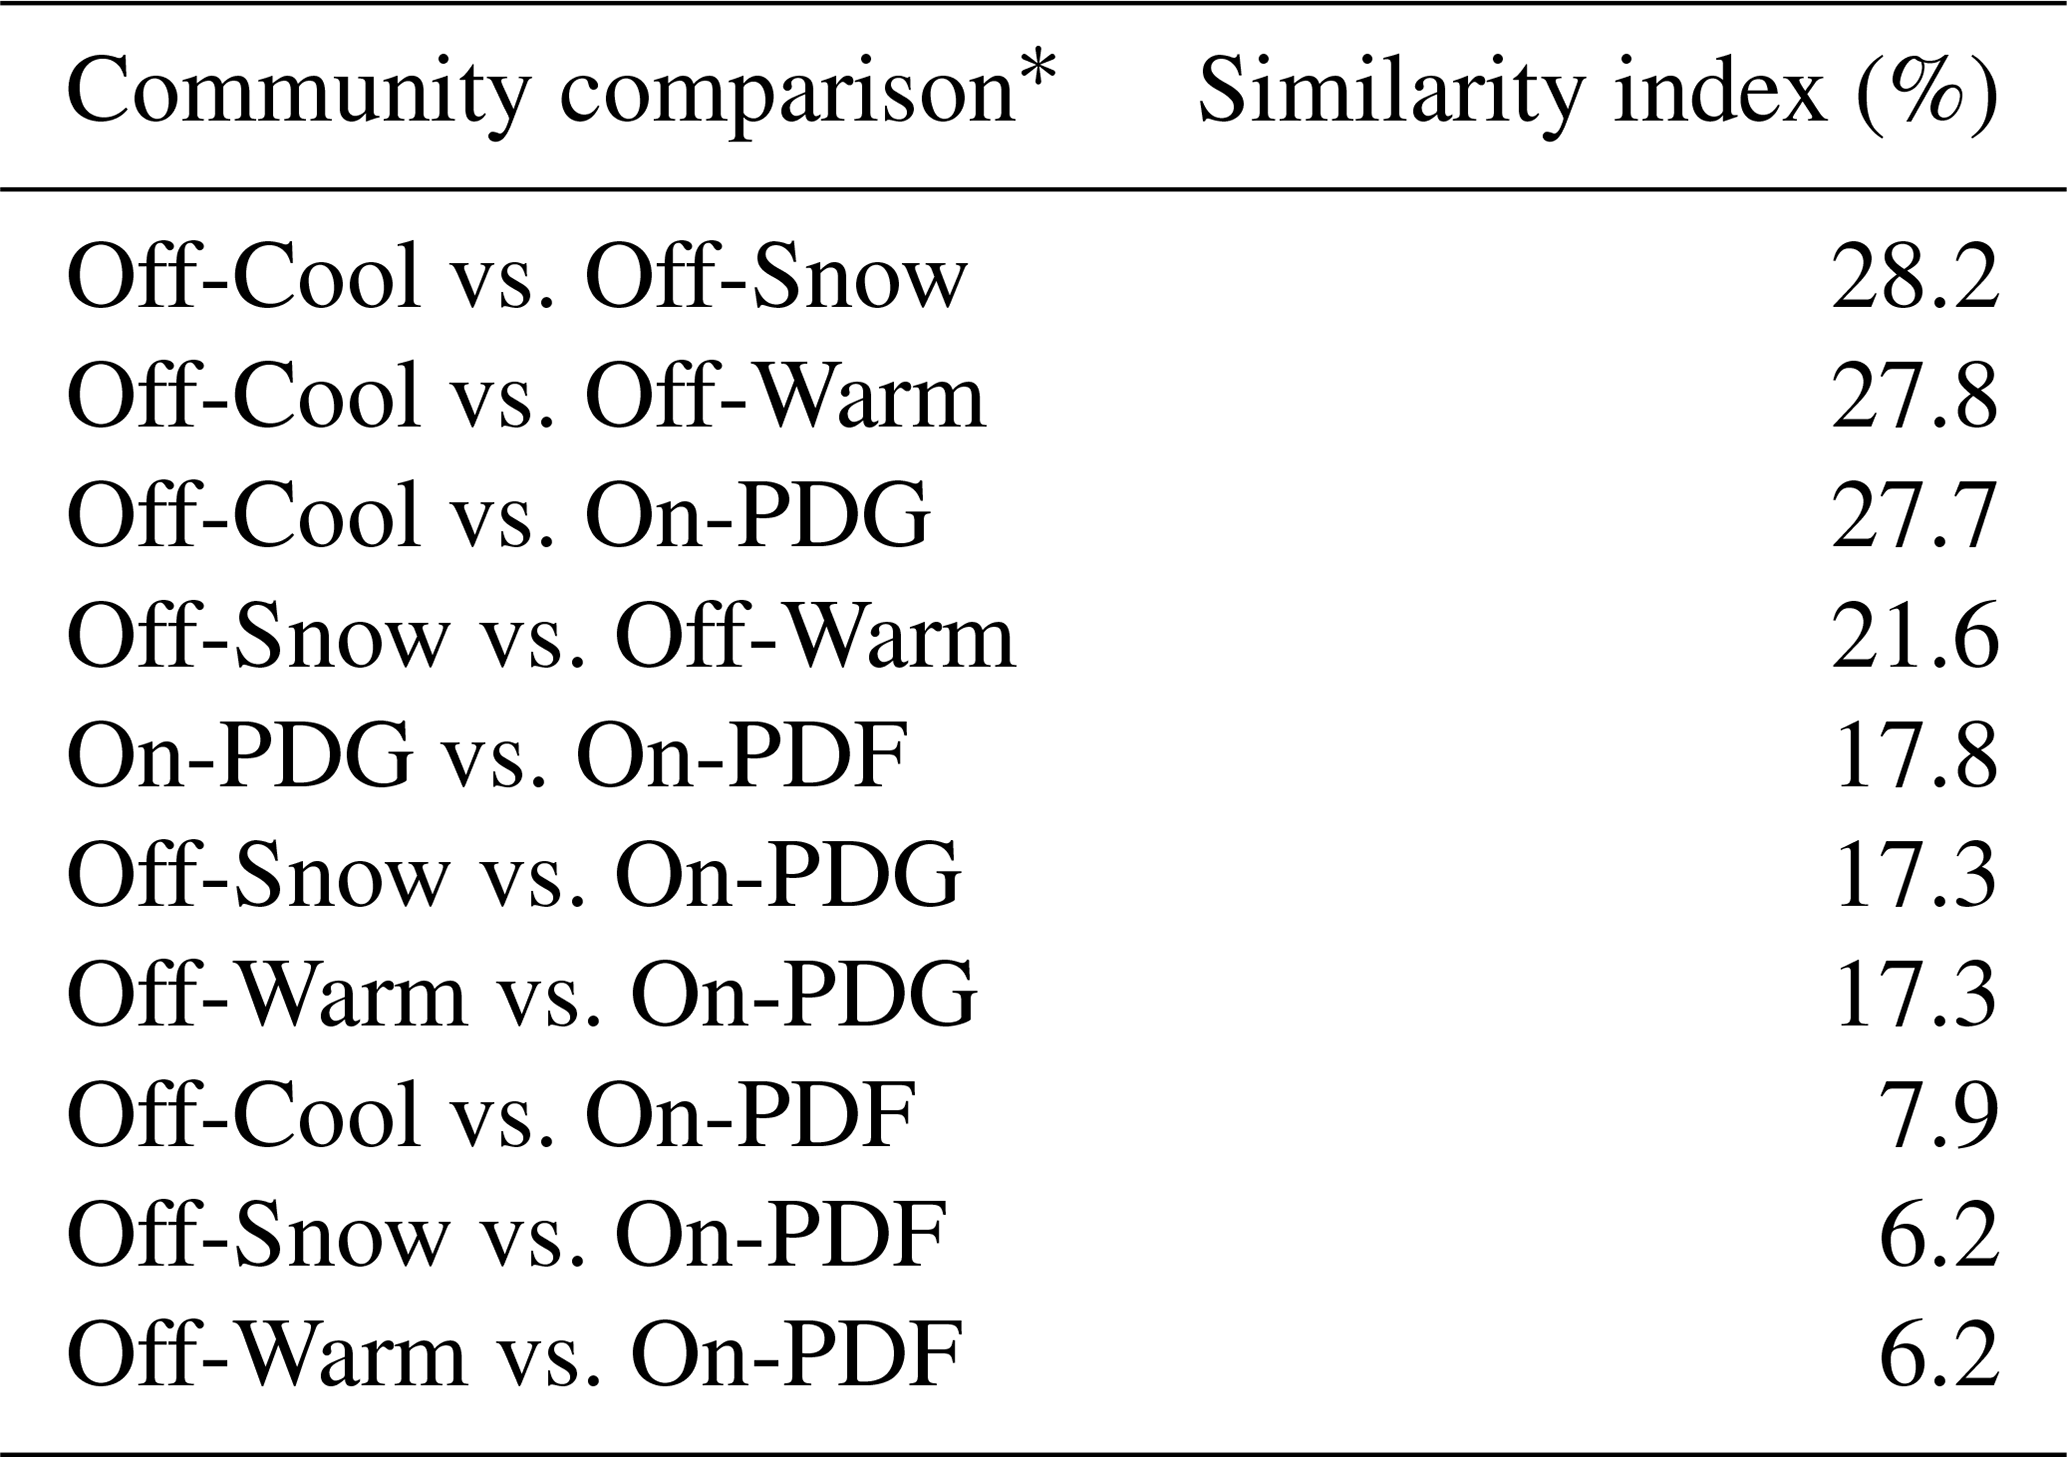
* Plant communities on prairie dog towns are grass-dominated (On-Grass) and forb-dominated (On-Forb); plant communities in off-town areas are cool-season-grass-dominated (Off-Cool), warm-season-grass-dominated (Off-Warm), and snowberry-dominated (Off-Snow).
3.2 Random forest model results
Results from the RF models show low OOB misclassification error rates for each individual plant community (Table 3), indicating a high degree of accuracy in the model. Overall the OOB model error rates were 0.9 % and 1.12 % for the 2015 and 2016 models, respectively. OOB accuracy is an unbiased estimate of the overall classification accuracy, eliminating the need for cross-validation (Breiman, 2001). OOB error rates have been shown to be reliable estimates of class accuracy for identifying invasive species (Lawrence et al., 2006) and mapping corn and soybean fields across multiple years (Zhong et al., 2014). Belgiu and Drăguţ (2016), in their review of RF applications in remote sensing, acknowledge that the reliability of OOB error measurements needs to be further tested using a variety of datasets in different scenarios. Consistency in error rates for plant communities appears to indicate stability in the 2015 and 2016 RF models which used identical training sites on consecutive yearly satellite imagery. However, when comparing yearly predicted plant community maps, differences between community classifications are slightly more pronounced, indicating the models may not be as stable as predicted based solely on the OOB error rates.
Table 3Out-of-bag misclassification error rates (%) for each plant community for 2015, 2016, and combined-year random forest models.
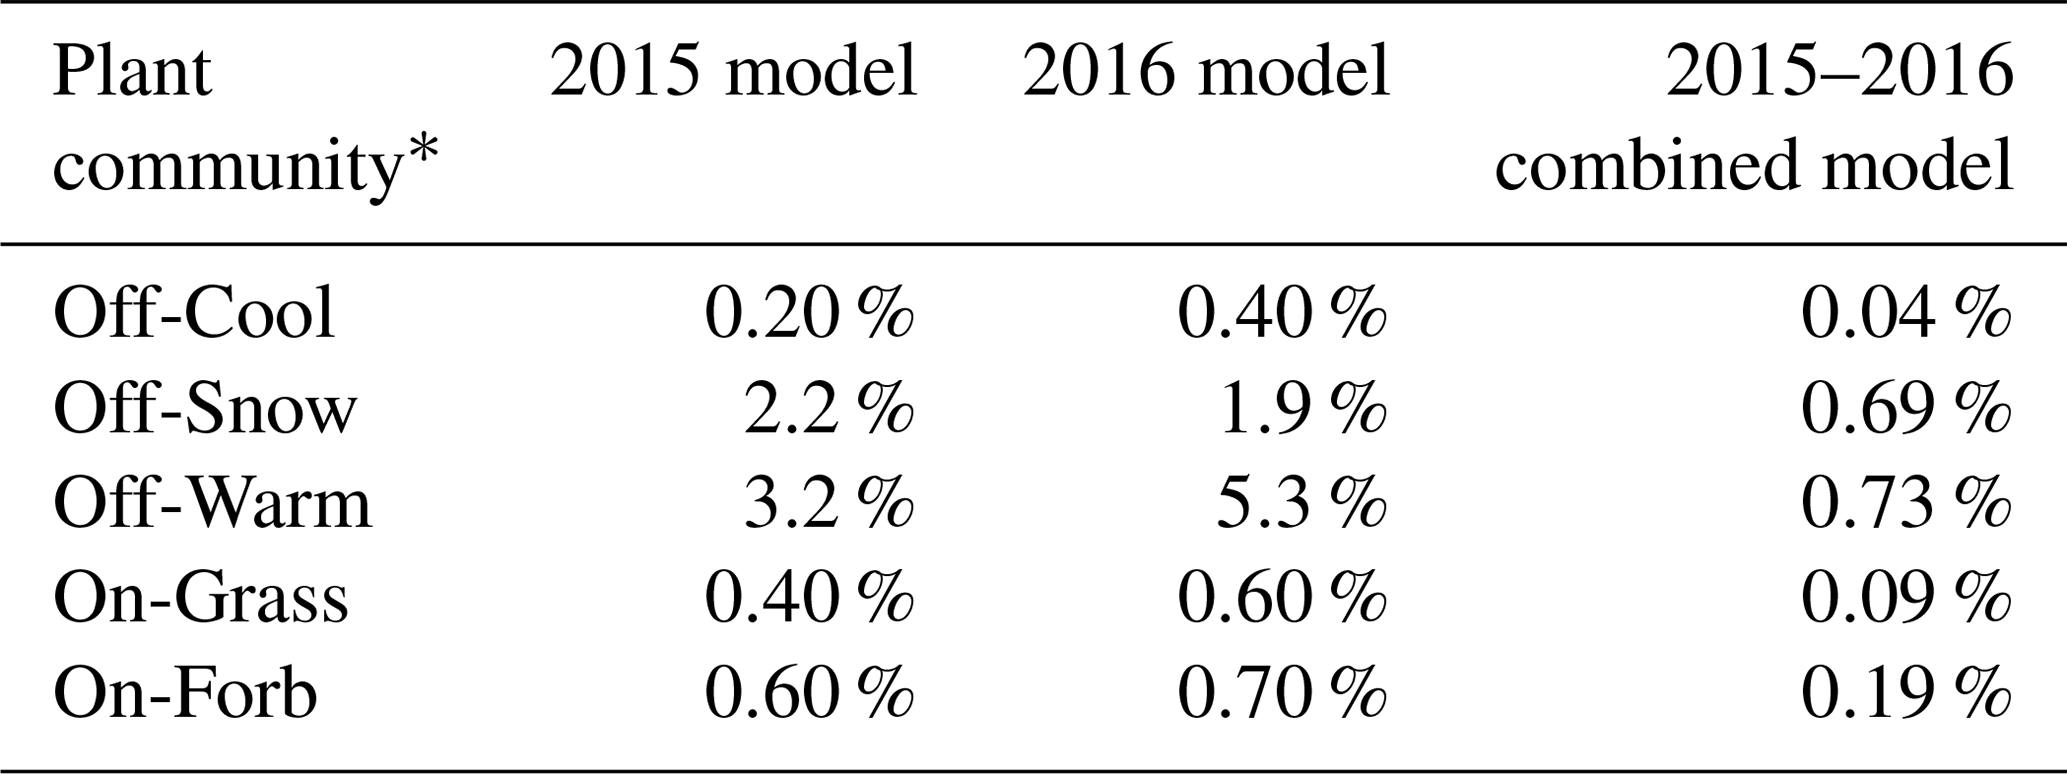
* Plant communities on prairie dog towns are grass-dominated (On-Grass) and forb-dominated (On-Forb); plant communities in off-town areas are cool-season-grass-dominated (Off-Cool), warm-season-grass-dominated (Off-Warm), and snowberry-dominated (Off-Snow).
Overall a total of 67.04 % pixels remained unchanged in their plant community classification from 2015 to 2016 (Table 4). Of the pixels that changed classification between years, 15.13 were on-town to off-town transitions, 2.26 were on-town to on-town transitions, and 15.57 were off-town to off-town plant community transitions. It is unlikely in this northern mixed-grass prairie ecosystem that all the changes in plant communities indicated by classification of pixels were real changes from one plant community type to another over 1 year. In the absence of a major disturbance event, such major shifts in species composition typically occur much more slowly (Vermeire et al., 2018). The results from the plant community analysis indicate training sites were chosen appropriately to account for differences in species composition on the ground; therefore apparent changes are much more likely due to factors that affect the spectral signature of the vegetation. Factors that may potentially affect spectral signatures could include changes resulting from prairie dog herbivory, changes in precipitation regimes, or changes occurring along plant community transition zones.
Table 4Percent of pixels within each plant community that remain unchanged and that changed class between 2015 and 2016 models.

* Plant communities (PC) on prairie dog towns are grass-dominated (On-Grass) and forb-dominated (On-Forb); plant communities in off-town areas are cool-season-grass-dominated (Off-Cool), warm-season-grass-dominated (Off-Warm), and snowberry-dominated (Off-Snow).
The pixels changing from On-Grass to Off-Cool represented the highest percentage of pixels that changed plant community classification at 7.28 %; these are likely occurring along transition zones at the prairie dog colony edge. Both On-Grass and Off-Cool plant communities have western wheatgrass as a dominant species. Similarity in species dominance may explain some of the challenges to distinguishing between some on- and off-colony plant communities. Difficulty in classifying Off-Cool and On-PDG may also be due to subtle vegetation changes likely induced by the level of herbivory. Research on a South Dakota mixed-grass prairie showed that prairie dogs remove over 4 times more biomass than cattle grazing on-town (Gabrielson, 2009). Up to 7 times more standing dead forage and 60 % less standing crop biomass has been reported on uncolonized sites compared to colonized areas, mainly attributed to prairie dogs clipping vegetation, which greatly reduced the amount of grasses that reached maturity (Johnson-Nistler et al., 2004). Areas either less maintained on-town by prairie dogs or grazed by cattle repeatedly off-town may show similar spectral signatures.
Differences in year-to-year classification could also be attributed to the interannual variability of rainfall between 2015 and 2016 (Fig. 2). Yearly rainfall patterns can result in large differences in NDVI and biomass measurements across years (Wehlage et al., 2016). While overall total rainfall between years was similar, differences in timing of precipitation that occurred likely affected timing of green-up and dormancy for many of the cool- and warm-season species on the site. This, then, would create different NDVI patterns between years (Fig. 3). Goward and Prince (1995) suggested that the relationship between NDVI and annual rainfall in any given year also depends on the previous year's history of rainfall at the site. Previous research has shown that annual aboveground primary production of shortgrass communities is related to current as well as the previous 2 years' precipitation (Oesterheld et al., 2001). The above-average rainfall at the study site in 2015 could have added to the increase in average NDVI in 2016 when compared to 2015 through an increase in cumulative biomass or production at the site. Increased cumulative biomass in 2016 may cause higher NDVI values, for example, in On-PDG plant communities, resulting in classification shifts to Off-Cool; similarly, greater NDVI values in Off-Cool in 2016 may result in some of those pixels being classified as Off-Snow.
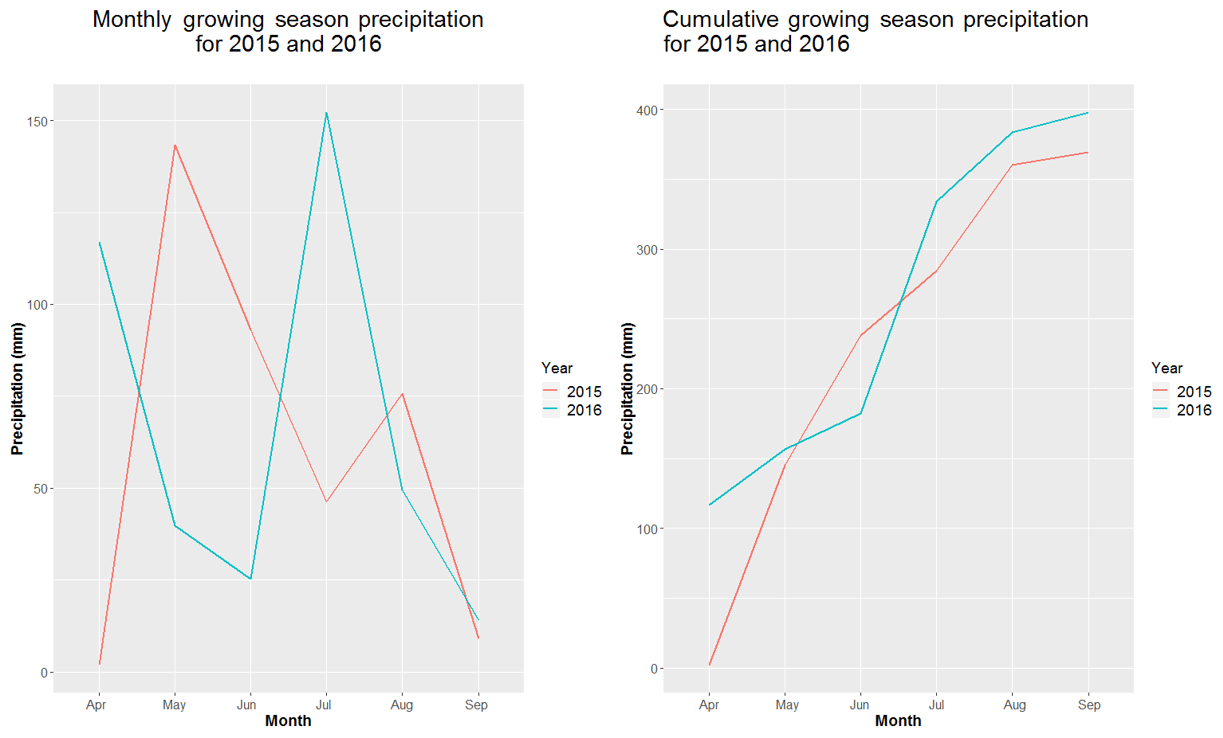
Figure 2Monthly and cumulative growing season precipitation patterns for 2015 and 2016 recorded at a weather station located in the study area in north central SD (45.737296∘ N, 100.657540∘ W) (South Dakota Climate Weather, 2018).
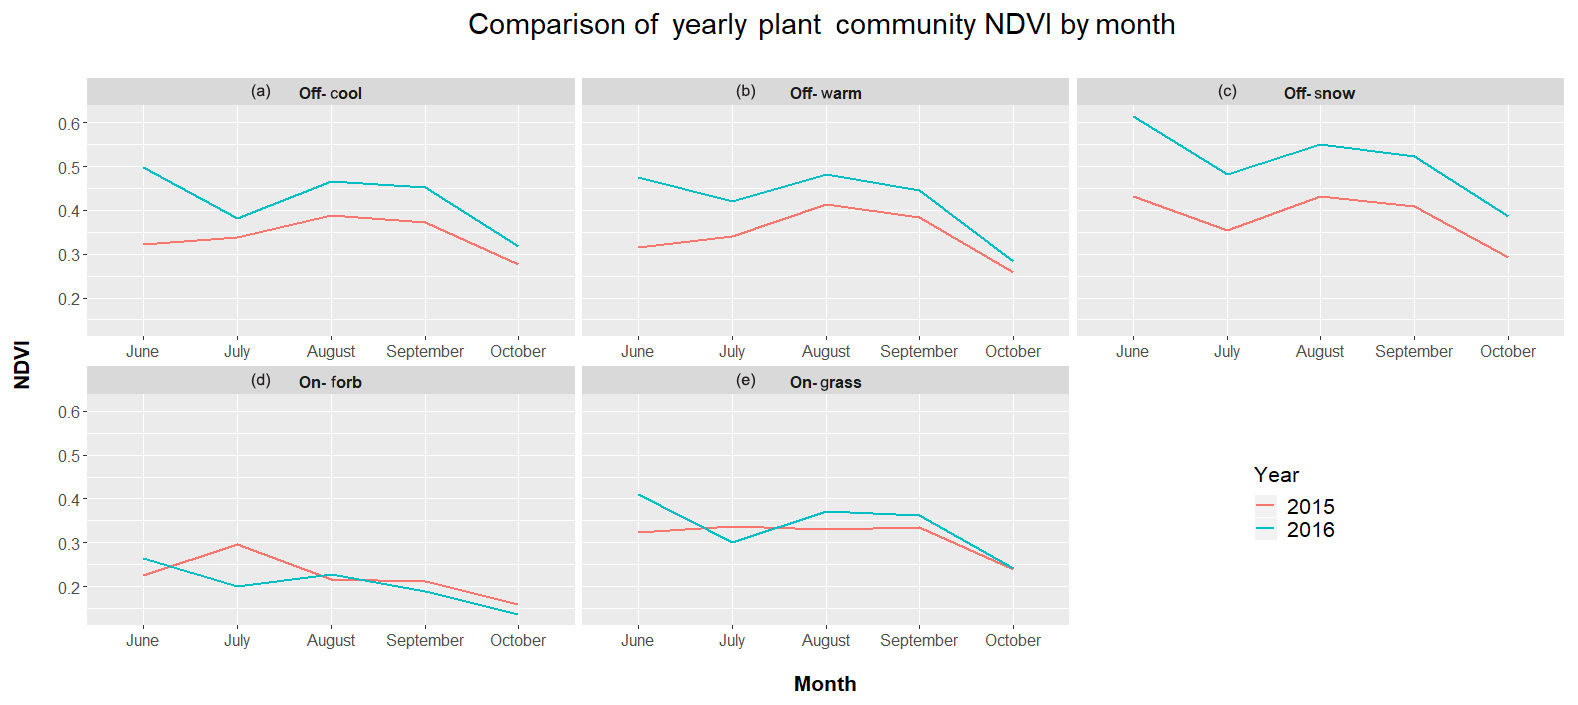
Figure 3Comparison of mean monthly NDVI for training polygons in five plant communities at the study site in north central SD. Plant communities on prairie dog towns are grass-dominated (On-PDG) and forb-dominated (On-PDF); plant communities in off-town areas are cool-season-grass-dominated (Off-Cool), warm-season-grass-dominated (Off-Warm), and snowberry-dominated (Off-Snow).
Another possible cause for changes in plant community classifications between years is overlap of species where two communities share a boundary. One issue with using categorically classified vegetation maps is that plant communities in space are rarely mutually exclusive, and they tend to change along a continuum with environmental gradients (Equihua, 1990). Plant communities in the region, which are predominantly comprised of cool-season grasses, often include varying levels of warm-season species; and snowberry thickets often have an understory of grasses, especially near the perimeter. The challenge of accurately classifying plant communities along an ecological continuum may be further exacerbated by changes induced by prairie dogs, where transition zones are less defined by environmental gradients and more defined by the level of herbivory. Thus, within and between on-town and off-town plant communities, transition zones are likely to account for a portion of the classification change between plant communities between years (Fig. 4). Alternative approaches to mapping plant communities can be the recognition of fuzzy properties enabling a single point in space to exhibit characteristics of a number of plant communities (Duff et al., 2014; Fisher, 2010). While fuzzy classification maps are more likely to give a better picture of plant community composition on a per-pixel basis, they are also more difficult to use to draw inferences of species dominance, livestock use patterns, and extent of prairie dog colonization.
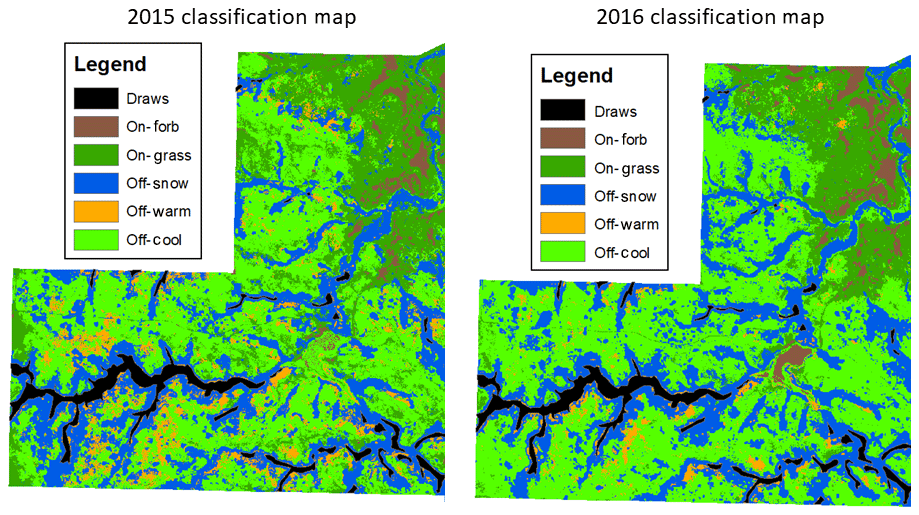
Figure 4Random forest classification maps from 2015 and 2016 of one pasture in the study area in north central South Dakota. Plant communities on prairie dog towns are grass-dominated (On-Grass) and forb-dominated (On-Forb); plant communities in off-town areas are cool-season-grass-dominated (Off-Cool), warm-season-grass-dominated (Off-Warm), and snowberry-dominated (Off-Snow).
A final RF model combining all available bands and NDVI values for 2015 and 2016 reduced error rates for all plant communities below 1 % (Table 3). While we have shown that lower error rates may not result in more stable predictions, using all available data for a model will likely improve accuracy and result in a more accurate thematic map. Other studies have reported increases in classification accuracy in RF models with the addition of combined seasonal images, hyperspectral data, lidar images, radar (synthetic aperture radar, SAR) images, and ancillary geographical data such as elevation and soil types (Corcoran et al., 2013; Pu et al., 2018; Shi et al., 2018; Xia et al., 2018; Yu et al., 2018; Zhou et al., 2018). RF models have the ability to handle highly dimensional correlated data and data combined from multiple different data sources across different temporal scales; however, one disadvantage to using nonparametric classifiers such as RF and decision trees is that they require a large number of observations to accurately estimate the mapping function (James et al., 2014). Thus the incorporation of additional predictor variables as well as additional training data will likely result in higher accuracy rates.
The variable importance graph of the combined model indicates that NDVI variables contribute the most to the model over individual bands (Fig. 5). In classifying vegetation morphology in a savanna grassland, Mishra and Crews (2014) found spectral classification features (mean NDVI or ratio NDVI) were the most significant. The variable importance plot from the combined data model also indicates that different months between years contribute highly to the classification accuracy. Of the 10 most important variables in the model, six were from 2015 and four were from 2016, suggesting additional years' data in the model are likely to yield greater classification accuracy. The internal information provided by the model, such as variable importance, can be a useful tool for researchers to select features of the greatest importance to reduce computation times in the instance of large datasets. At the size of our study area (810 ha) and a maximum of 50 variables, the combined 2015–2016 data model only slightly added to computation time, but not enough to warrant feature trimming from the dataset. Land managers looking to classify prairie dog colonies on more extensive grasslands may look to including only NDVI variables into training datasets to increase computational efficiency.

Figure 5Variable importance reported as mean decrease in accuracy. The 10 most important variables are shown, with B1 and B4 corresponding to spectral bands 1 and 4, respectively, from Pleiades image. Variable importance is determined by the model output as the decrease in accuracy due to the exclusion of that variable during the out-of-bag error calculation process. Higher mean decrease in accuracy variables is more important in classifying the data.
3.3 Remote sensing prairie dog colonies
Visual comparison of the predicted on-town plant communities versus off-town plant communities shows a clearly defined boundary between areas colonized by prairie dogs and areas not colonized (Fig. 6). Results from mapping colony boundaries with a handheld GPS device estimated the colony to be 276 ha in 2012 to 186 ha in 2015. Total colony acreage estimated from summing the pixel area occupied by the On-Grass and On-Forb community pixels from the combined 2015–2016 RF model was 246 ha. Previous research has demonstrated that colonization by prairie dogs and subsequent increases in grazing pressure can result in significant differences between on- and off-town plant community composition and production (Coppock et al., 1983; Winter et al., 2002; Johnson-Nistler et al., 2004; Geaumont et al., 2019). The results of our study demonstrate that these differences are significant enough to be identified using remote sensing techniques. Interestingly, a considerable portion of the area misclassified as on-town is from a previously colonized area that had been poisoned in 2013, suggesting that, at least spectrally, these areas still resemble plant communities similar to those actively colonized. The higher area estimate from the RF model is likely the result of transition areas controlled 2 years prior. Additionally, most other pixels misclassified as on-town are likely drainage areas with high bare ground off-town, whose variability was not captured in the dataset. One prior study had sought to identify prairie dog colonies using 30 m Landsat imagery; however it concluded that the scale was too coarse for accurately measuring prairie dog towns (Wolbrink et al., 2002). High-resolution satellite imagery used in this study appears capable of capturing fine-scale transitions that occur between plant communities along the on-town–off-town gradient.
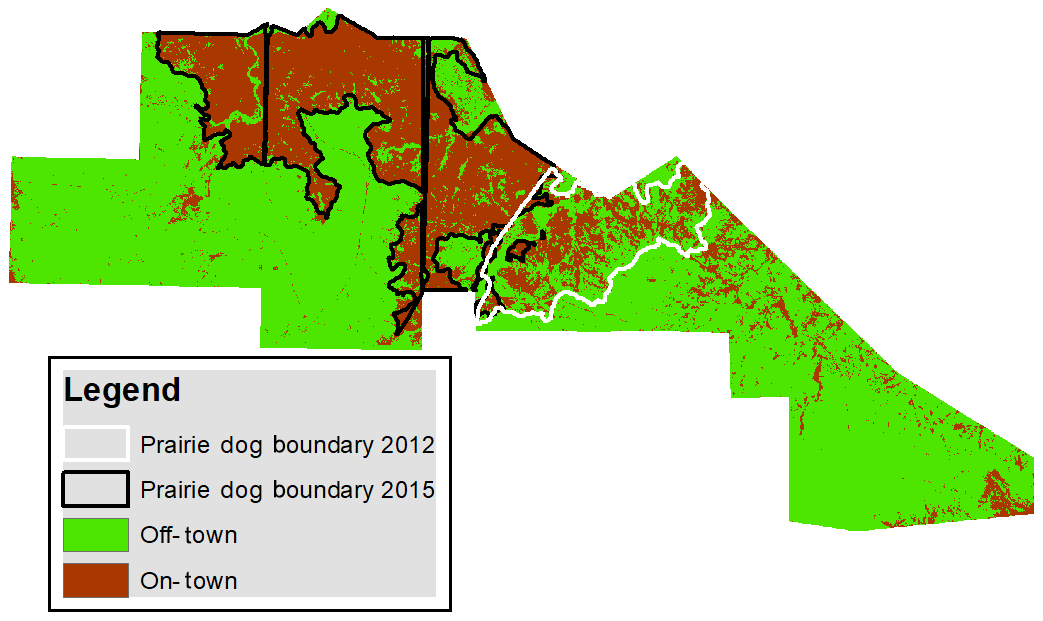
Figure 6Random forest classification map created from predictions from the combined 2015 and 2016 models. Off-town areas were created by combining the predicted off-town plant communities (Off-Cool, Off-Warm, and Off-Snow) and on-town plant communities (On-Grass and On-Forb). The prairie dog boundary was mapped using a handheld GPS unit; the outlined 2012 prairie dog boundary was former prairie dog colony poisoned in 2013.
The RF model was also able to accurately predict older core areas of prairie dog towns (On-forb) often characterized by a high percentage of bare ground, low vegetation production, and dominance by annual forb and dwarf shrub species (Coppock et al., 1983). Area estimates of On-Forb were 33 and 32 ha in 2015 and 2016, respectively. State and transition models for prairie dog towns developed within Custer State Park South Dakota found older core areas were considered undesirable for management due to losses of native grasses, increased bare ground, potential for erosion, extensive presence of exotic species, and increased inputs to restore to a more desirable state (Hendrix, 2018). The ability to monitor these older core areas of prairie dog towns remotely may help land managers limit sites from becoming highly degraded and serve as a useful tool for land managers concerned over balancing wildlife conservation with losses in livestock production.
Stability of models is important when applying similar techniques across different sites, plant communities, and in this case years. Differences in year-to-year NDVI values may alter classification results, and the addition of 2 years' worth of data likely resulted in improved model performance. One of the main benefits to RF classification in remote sensing is the relatively fast computing time (Belgiu and Drăguţ, 2016), and, given the availability of free satellite imagery, researchers would be prudent to include multiple images across years and seasons in their model to improve accuracy. Furthermore, while the desired outcome is often to produce thematic maps, recognizing that plant communities rarely exist in discrete communities is important when selecting community types to map. Combining plant community ordination results with remote sensing results can aid in understanding sources of model error and limitations of classification algorithms. This is likely to be magnified as pixel size decreases, resulting in fine-scale predictions which may be more susceptible to plant community transition zones. Results from this study indicate that plant community changes induced by prairie dogs are significant enough to be detected via remote sensing techniques. Land managers looking to optimize rangeland health on pastures occupied by prairie dogs may potentially utilize high-resolution imagery to monitor colony size and make recommendations of appropriate stocking rates based on extent of colonization.
Data are not publicly accessible. Pleiades satellite imagery comes with a private usage license and publicly disseminating the imagery data would be in violation of the terms of the license.
JRB conceived the presented idea, developed the theory, and performed the analysis. PSJ and NPH verified the analytical methods and supervised the findings of this work. All authors discussed the results and contributed to the final manuscript.
The authors declare that they have no conflict of interest.
We would like to acknowledge and thank the U.S. Department of Agriculture for funding this research as well as North Dakota State University. We would also like to thank the McLaughlin family for providing access to the land the research was conducted on.
This research has been supported by the USDA (grant no. 2011-68004-30052).
This paper was edited by Paul Stoy and reviewed by two anonymous referees.
Agnew, W. D., Uresk, W. D., and Hansen, M. R.: Flora and Fauna Associated with Prairie Dog Colonies and Adjacent Ungrazed Mixed-Grass Prairie in Western South Dakota, J. Range Manage., 39, 135–139, 1986.
Archer, S., Garrett, M. G., and Detling, J. K.: Rates of Vegetation Change Associated with Prairie Dog (Cynomys ludovicianus) Grazing in North American Mixed-Grass Prairie, Vegetatio, 72, 159–166, 1987.
Augustine, D. J. and Springer, T. L.: Competition and facilitation between a native and a domestic herbivore: trade-offs between forage quantity and quality, Ecol. Appl., 23, 850–863, 2013.
Barth, C. J., Liebig, M. A., Hendrickson, J. R., Sedivec, K. K., and Halvorson, G.: Soil Change Induced by Prairie Dogs across Three Ecological Sites, Soil Sci. Soc. Am. J., 78, 2054–2060, 2014.
Belgiu, M. and Drăguţ, L.: Random forest in remote sensing: A review of applications and future directions, ISPRS J. Photogramm., 114, 24–31, 2016.
Blanco, L. J., Aguilera, M. O., Paruelo, J. M., and Biurrun, F. N.: Grazing effect on NDVI across an aridity gradient in Argentina, J. Arid Environ., 72, 764–776, 2008.
Breiman, L.: Random Forest, Mach. Learn., 45, 5–32, 2001.
Browning, D. M., Rango, A., Karl, J. W., Laney, C. M., Vivoni, E. R., and Tweedie, C. E.: Emerging technological and cultural shifts advancing drylands research and management, Front. Ecol. Environ., 13, 52–60, 2015.
Coppock, D. L., Ellis, J. E., Detling, J. K., and Dyer, M. I.: Plant-herbivore interactions in a North American mixed-grass prairie: Responses of bison to modification of vegetation by prairie dogs, Oecologia, 56, 10–15, 1983.
Corcoran, J., Knight, J., and Gallant, A.: Influence of Multi-Source and Multi-Temporal Remotely Sensed and Ancillary Data on the Accuracy of Random Forest Classification of Wetlands in Northern Minnesota, Remote Sensing, 5, 3212, https://doi.org/10.3390/rs5073212, 2013.
Davidson, A. D., Ponce, E., Lightfoot, D. C., Fredrickson, E. L., Brown, J. H., Cruzado, J., Brantley, S. L., Sierra-Corona, R., List, R., Toledo, D., and Ceballos, G.: Rapid response of a grassland ecosystem to an experimental manipulation of a keystone rodent and domestic livestock, Ecology, 91, 3189–3200, 2010.
de Colstoun, E. C. B., Story, M. H., Thompson, C., Commisso, K., Smith, T. G., and Irons, J. R.: National Park vegetation mapping using multitemporal Landsat 7 data and a decision tree classifier, Remote Sens. Environ., 85, 316–327, 2003.
Derner, J. D., Detling, J. K., and Antolin, M. F.: Are livestock weight gains affected by black-tailed prairie dogs?, Front. Ecol. Environ., 4, 459–464, 2006.
Duff, T. J., Bell, T. L., and York, A.: Recognising fuzzy vegetation pattern: the spatial prediction of floristically defined fuzzy communities using species distribution modelling methods, J. Veg. Sci., 25, 323–337, 2014.
Equihua, M.: Fuzzy Clustering of Ecological Data, J. Ecol., 78, 519–534, 1990.
Fisher, P. F.: Remote sensing of land cover classes as type 2 fuzzy sets, Remote Sens. Environ., 114, 309–321, 2010.
Franke, J., Keuck, V., and Siegert, F.: Assessment of grassland use intensity by remote sensing to support conservation schemes, J. Nat. Conserv., 20, 125–134, 2012.
Gabrielson, M. L.: Effects of Black-tailed Prairie Dogs (Cynomys ludovicianus) and Cattle on Vegetation Composition and Disappearance in the Mixed-Grass Prairie, MS thesis, South Dakota State University, Brookings, SD, 2009.
Geaumont, B. A., Hovick, T. J., Limb, R. F., Mack, W. M., Lipinski, A. R., and Sedivec, K. K.: Plant and Bird Community Dynamics in Mixed-Grass Prairie Grazed by Native and Domestic Herbivores, Rangeland Ecol. Manag., 72, 374–384, 2019.
Geerken, R., Zaitchik, B., and Evans, J. P.: Classifying rangeland vegetation type and coverage from NDVI time series using Fourier Filtered Cycle Similarity, Int. J. Remote Sens., 26, 5535–5554, 2005.
Goodin, D. G. and Henebry, G. M.: A technique for monitoring ecological disturbance in tallgrass prairie using seasonal NDVI trajectories and a discriminant function mixture model, Remote Sens. Environ., 61, 270–278, 1997.
Goward, S. N. and Prince, S. D.: Transient Effects of Climate on Vegetation Dynamics: Satellite Observations, J. Biogeogr., 22, 549–564, 1995.
Hendrix, M. R.: Black-tailed Prairie Dog (Cynomys ludovicianus) State-and-Transition Model for Loamy Ecological Sites in MLRA 62 in Custer State Park, South Dakota, MS thesis, South Dakota State University, Brookings, SD, 2018.
Irisarri, J. G. N., Derner, J. D., Porensky, L. M., Augustine, D. J., Reeves, J. L., and Mueller, K. E.: Grazing intensity differentially regulates ANPP response to precipitation in North American semiarid grasslands, Ecol. Appl., 26, 1370–1380, 2016.
James, G., Witten, D., Hastie, T., and Tibshirani, R.: An Introduction to Statistical Learning: with Applications in R, Springer Publishing Company Inc., New York, NY, 2014.
Johnson-Nistler, C. M., Sowell, B. F., Sherwood, H. W., and Wambolt, C. L.: Black-tailed prairie dog effects on Montana's mixed-grass prairie, J. Range Manage., 57, 641–648, 2004.
Jones, M. O., Allred, B. W., Naugle, D. E., Maestas, J. D., Donnelly, P., Metz, L. J., Karl, J., Smith, R., Bestelmeyer, B., Boyd, C., Kerby, J. D., and McIver, J. D.: Innovation in rangeland monitoring: annual, 30 m, plant functional type percent cover maps for U.S. rangelands, 1984–2017, Ecosphere, 9, e02430, https://doi.org/10.1002/ecs2.2430, 2018.
Juel, A., Groom, G. B., Svenning, J.-C., and Ejrnæs, R.: Spatial application of Random Forest models for fine- scale coastal vegetation classification using object based analysis of aerial orthophoto and DEM data, Int. J. Appl. Earth Obs., 42, 106–114, 2015.
Koford, C. B.: Prairie dogs, whitefaces, and blue grama, Wildlife Society, University of Michigan, 1–78, 1958.
Kotliar, N. B., Baker, B. W., Whicker, A. D., and Plumb, G.: A Critical Review of Assumptions About the Prairie Dog as a Keystone Species, Environ. Manage., 24, 177–192, 1999.
Kruskal, J. B.: Nonmetric multidimensional scaling: A numerical method, Psychometrika, 29, 115–129, 1964.
Laliberte, A. S., Fredrickson, E. L., and Rango, A.: Combining decision trees with hierarchical object-oriented image analysis for mapping arid rangelands, Photogramm. Eng. Rem. S., 73, 197–207, 2007.
Lawrence, R. L., Wood, S. D., and Sheley, R. L.: Mapping invasive plants using hyperspectral imagery and Breiman Cutler classifications (randomForest), Remote Sens. Environ., 100, 356–362, 2006.
Liaw, A. and Wiener, M.: Classification and Regression by Random Forest, R News, 2, 18–22, 2002.
Lowe, B. and Kulkarni, A.: Multispectral Image Analysis Using Random Forest, International Journal on Soft Computing, 6, 1–14, 2015.
McCune, B. and Mefford, M.: PC-ORD for windows, Multivariate analysis of ecological data, Version 6, Wild Blueberry Media LLC, Corvallis, OR, 2002.
Mellor, A., Haywood, A., Stone, C., and Jones, S.: The Performance of Random Forests in an Operational Setting for Large Area Sclerophyll Forest Classification, Remote Sensing, 5, 2838–2856, 2013.
Miller, B. J., Reading, R. P., Biggins, D. E., Detling, J. K., Forrest, S. C., Hoogland, J. L., Javersak, J., Miller, S. D., Proctor, J., Truett, J., and Uresk, D. W.: Prairie dogs: An ecological review and current biopolitics, J. Wildlife Manage., 71, 2801–2810, 2007.
Mishra, N. B. and Crews, K. A.: Mapping vegetation morphology types in a dry savanna ecosystem: integrating hierarchical object-based image analysis with Random Forest, Int. J. Remote Sens., 35, 1175–1198, 2014.
Mitchell, S., Palmquist, K., Cohen, S., and Christensen, N. L.: Patterns of vegetation composition and diversity in pine-dominated ecosystems of the Outer Coastal Plain of North Carolina: Implications for ecosystem restoration, Forest Ecol. Manage., 356, 64–73, 2015.
Mutanga, O., Adam, E., and Cho, M. A.: High density biomass estimation for wetland vegetation using WorldView-2 imagery and random forest regression algorithm, Int. J. Appl. Earth Obs., 18, 399–406, 2012.
Nitze, I., Barrett, B., and Cawkwell, F.: Temporal optimization of image acquisition for land cover classification with Random Forest and MODIS time-series, Int. J. Appl. Earth Obs., 34, 136–146, 2015.
Oesterheld, M., Loreti, J., Semmartin, M., and Sala, O. E.: Inter-annual variation in primary production of a semi-arid grassland related to previous-year production, J. Veg. Sci., 12, 137–142, 2001.
Olson, K. C., Schauer, C., Engel, C., Kincheloe, J. J., Brennan, J. R., and Hauptman, B. L.: Effect of Grazing Prairie Dog—Colonized Rangeland on Cattle Nutrition and Performance:A Progress Report, Rangelands, 38, 29–33, 2016.
Pu, R. L., Landry, S., and Yu, Q. Y.: Assessing the potential of multi-seasonal high resolution Pleiades satellite imagery for mapping urban tree species, Int. J. Appl. Earth Obs., 71, 144–158, 2018.
Ramoelo, A., Cho, M. A., Mathieu, R., Madonsela, S., van de Kerchove, R., Kaszta, Z., and Wolff, E.: Monitoring grass nutrients and biomass as indicators of rangeland quality and quantity using random forest modelling and World View-2 data, Int. J. Appl. Earth Obs., 43, 43–54, 2015.
Shi, Y. F., Wang, T. J., Skidmore, A. K., and Heurich, M.: Important LiDAR metrics for discriminating foresttree species in Central Europe, ISPRS J. Photogramm., 137, 163–174, 2018.
South Dakota Climate and Weather: South Dakota Mesonet Database [McLaughlin], available at: https://climate.sdstate.edu/archive/, last access: 1 December 2017.
Vermeire, L. T., Strong, D. J., and Waterman, R. C.: Grazing History Effects on Rangeland Biomass, Cover, and Diversity Responses to Fire and Grazing Utilization, Rangeland Ecol. Manag., 71, 770–775, 2018.
Wehlage, D. C., Gamon, J. A., Thayer, D., and Hildebrand, D. V.: Interannual Variability in Dry Mixed-Grass Prairie Yield: A Comparison of MODIS, SPOT, and Field Measurements, Remote Sensing, 8, 872, https://doi.org/10.3390/rs8100872, 2016.
Winter, S. L., Cully, J. F., and Pontius, J. S.: Vegetation of prairie dog colonies and non-colonized short-grass prairie, J. Range Manage., 55, 502–508, 2002.
Wolbrink, G. A., Jenks, J. A., Hubbard D. E., and Klaver, R. W.: Feasibility of using Landsat satellite imagery to monitor black-tailed prairie dog towns in western South Dakota, Final report to South Dakota Department of Game, Fish and Parks, Brookings, SD, 2002.
Xia, J. S., Yokoya, N., and Iwasaki, A.: Fusion of Hyperspectral and LiDAR Data With a Novel Ensemble Classifier, IEEE Geosci. Remote S., 15, 957–961, 2018.
Yu, Y., Li, M. Z., and Fu, Y.: Forest type identification by random forest classification combined with SPOT and multitemporal SAR data, J. Forestry Res., 29, 1407–1414, 2018.
Zhong, L., Gong, P., and Biging, G. S.: Efficient corn and soybean mapping with temporal extendability: A multi-year experiment using Landsat imagery, Remote Sens. Environ., 140, 1–13, 2014.
Zhou, T., Zhao, M. F., Sun, C. L., and Pan, J. J.: Exploring the Impact of Seasonality on Urban Land-Cover Mapping Using Multi-Season Sentinel-1A and GF-1 WFV Images in a Subtropical Monsoon-Climate Region, ISPRS Int. Geo-Inf., 7, 3, https://doi.org/10.3390/ijgi7010003, 2018.