the Creative Commons Attribution 4.0 License.
the Creative Commons Attribution 4.0 License.
 | 02 Jan 2020
Benthic alkalinity and dissolved inorganic carbon fluxes in the Rhône River prodelta generated by decoupled aerobic and anaerobic processes
Jens Rassmann
Eryn M. Eitel
Bruno Lansard
Cécile Cathalot
Christophe Brandily
Martial Taillefert
Christophe Rabouille
Estuarine regions are generally considered a major source of atmospheric CO2, as a result of the high organic carbon (OC) mineralization rates in their water column and sediments. Despite this, the intensity of anaerobic respiration processes in the sediments tempered by the reoxidation of reduced metabolites near the sediment–water interface controls the flux of benthic alkalinity. This alkalinity may partially buffer metabolic CO2 generated by benthic OC respiration in sediments. Thus, sediments with high anaerobic respiration rates could contribute less to local acidification than previously thought. In this study, a benthic chamber was deployed in the Rhône River prodelta and the adjacent continental shelf (Gulf of Lion, northwestern Mediterranean) in late summer to assess the fluxes of total alkalinity (TA) and dissolved inorganic carbon (DIC) from the sediment. Concurrently, in situ O2 and pH micro-profiles, voltammetric profiles and pore water composition were measured in surface sediments to identify the main biogeochemical processes controlling the net production of alkalinity in these sediments. Benthic TA and DIC fluxes to the water column, ranging between 14 and 74 and 18 and 78 mmol m−2 d−1, respectively, were up to 8 times higher than dissolved oxygen uptake (DOU) rates (10.4±0.9 mmol m−2 d−1) close to the river mouth, but their intensity decreased offshore, as a result of the decline in OC inputs. In the zone close to the river mouth, pore water redox species indicated that TA and DIC were mainly produced by microbial sulfate and iron reduction. Despite the complete removal of sulfate from pore waters, dissolved sulfide concentrations were low and significant concentrations of FeS were found, indicating the precipitation and burial of iron sulfide minerals with an estimated burial flux of 12.5 mmol m−2 d−1 near the river mouth. By preventing reduced iron and sulfide reoxidation, the precipitation and burial of iron sulfide increases the alkalinity release from the sediments during the spring and summer months. Under these conditions, the sediment provides a net source of alkalinity to the bottom waters which mitigates the effect of the benthic DIC flux on the carbonate chemistry of coastal waters and weakens the partial pressure of CO2 increase in the bottom waters that would occur if only DIC was produced.
- Article
(3190 KB) - Full-text XML
- Companion paper
-
Supplement
(413 KB) - BibTeX
- EndNote


As a link between continental and marine environments, the coastal ocean plays a key role in the global carbon cycle (Bauer et al., 2013). In particular, large fluxes of dissolved and particulate organic carbon (POC) are delivered by rivers to neighboring continental shelves (Bianchi and Allison, 2009). In fact, even though shelf regions only occupy around 7 % of the global ocean surface area (Jahnke, 2010), they account for more than 80 % of POC burial in the oceans (Hedges and Keil, 1995; Muller-Karger et al., 2005). About half of this POC is buried in river deltas and estuaries (McKee et al., 2004; Burdige, 2005). River-dominated ocean margins receive substantial amounts of allochthonous and authigenic POC that settle to the seafloor (Rabouille et al., 2001; Burdige, 2005; Andersson et al., 2006), thus increasing the organic carbon content of the sediments and enhancing mineralization rates (Canfield et al., 1993a; Mckee et al., 2004; Muller-Karger et al., 2005; Aller et al., 2008; Burdige, 2011). These processes allow estuarine and deltaic regions to constitute a net source of CO2 to the atmosphere (Chen and Borges, 2009; Cai, 2011). In these river-dominated margins, high sedimentation rates of material containing large concentrations of POC decrease the residence time of organic carbon in the oxic sediment layers (Hartnett et al., 1998) and increase the relative contribution of anaerobic compared to aerobic degradation pathways of organic carbon (Canfield et al., 1993a). Anaerobic respiration processes, including denitrification, dissimilatory nitrate reduction to ammonium (DNRA), manganese reduction, iron reduction and sulfate reduction produce total alkalinity (TA; Berner, 1970; Dickson, 1981; Wolf-Gladrow et al., 2007, Table 1) that increases the buffer capacity of pore waters (Ben-Yaakov, 1973; Soetaert et al., 2007), drives the calcite and aragonite saturation state of the pore waters towards supersaturation, and potentially triggers carbonate mineral precipitation (Gaillard et al., 1989; Mucci et al., 2000; Jørgensen and Kasten, 2006; Soetaert et al., 2007; Burdige, 2011). In turn, the precipitation of carbonate species, such as calcite and aragonite, consumes alkalinity within the sediments (Table 1, Reaction R1; Berner, 1970; Soetaert et al., 2007; Krumins et al., 2013; Brenner et al., 2016). Anaerobically produced alkalinity may also be consumed close to the sediment–water interface (SWI) by the aerobic reoxidation of reduced species such as , Mn2+, Fe2+ and dissolved sulfide (Table 1, Reactions R2–R4; Jourabchi et al., 2005; Krumins et al., 2013; Brenner et al., 2016). However, the precipitation and ultimate burial of iron sulfide minerals may prevent reoxidation of dissolved sulfide and Fe2+ and significantly reduce alkalinity consumption in sediments. Other processes such as carbonate dissolution in surface sediments or denitrification from external sources of nitrate may also be sources of TA (Hu and Cai, 2011a). Thus, the net TA flux across the SWI depends on the type and intensity of anaerobic respiration, carbonate precipitation and dissolution, denitrification, and whether reduced species are reoxidized by dissolved oxygen after diffusion upwards or are trapped in anaerobic sediment layers by precipitation (Krumins et al., 2013; Łukawska-Matuszewska and Graca, 2018). The net flux of this anaerobically produced alkalinity also depends on its depth of production in the sediment and sedimentation rates. In river-dominated margins, episodic floods can deposit several centimeters of new sediment during a short period (days to weeks) (Cathalot et al., 2010). In these conditions, the net flux of alkalinity from the sediment depends on the net balance of alkalinity production and consumption rates in the sediment and the intensity of upward alkalinity transport. As dissolved inorganic carbon (DIC) is also produced by aerobic and anaerobic reactions, the net alkalinity flux across the SWI directly affects the partial pressure of CO2 (pCO2) in bottom waters (Andersson and Mackenzie, 2012).
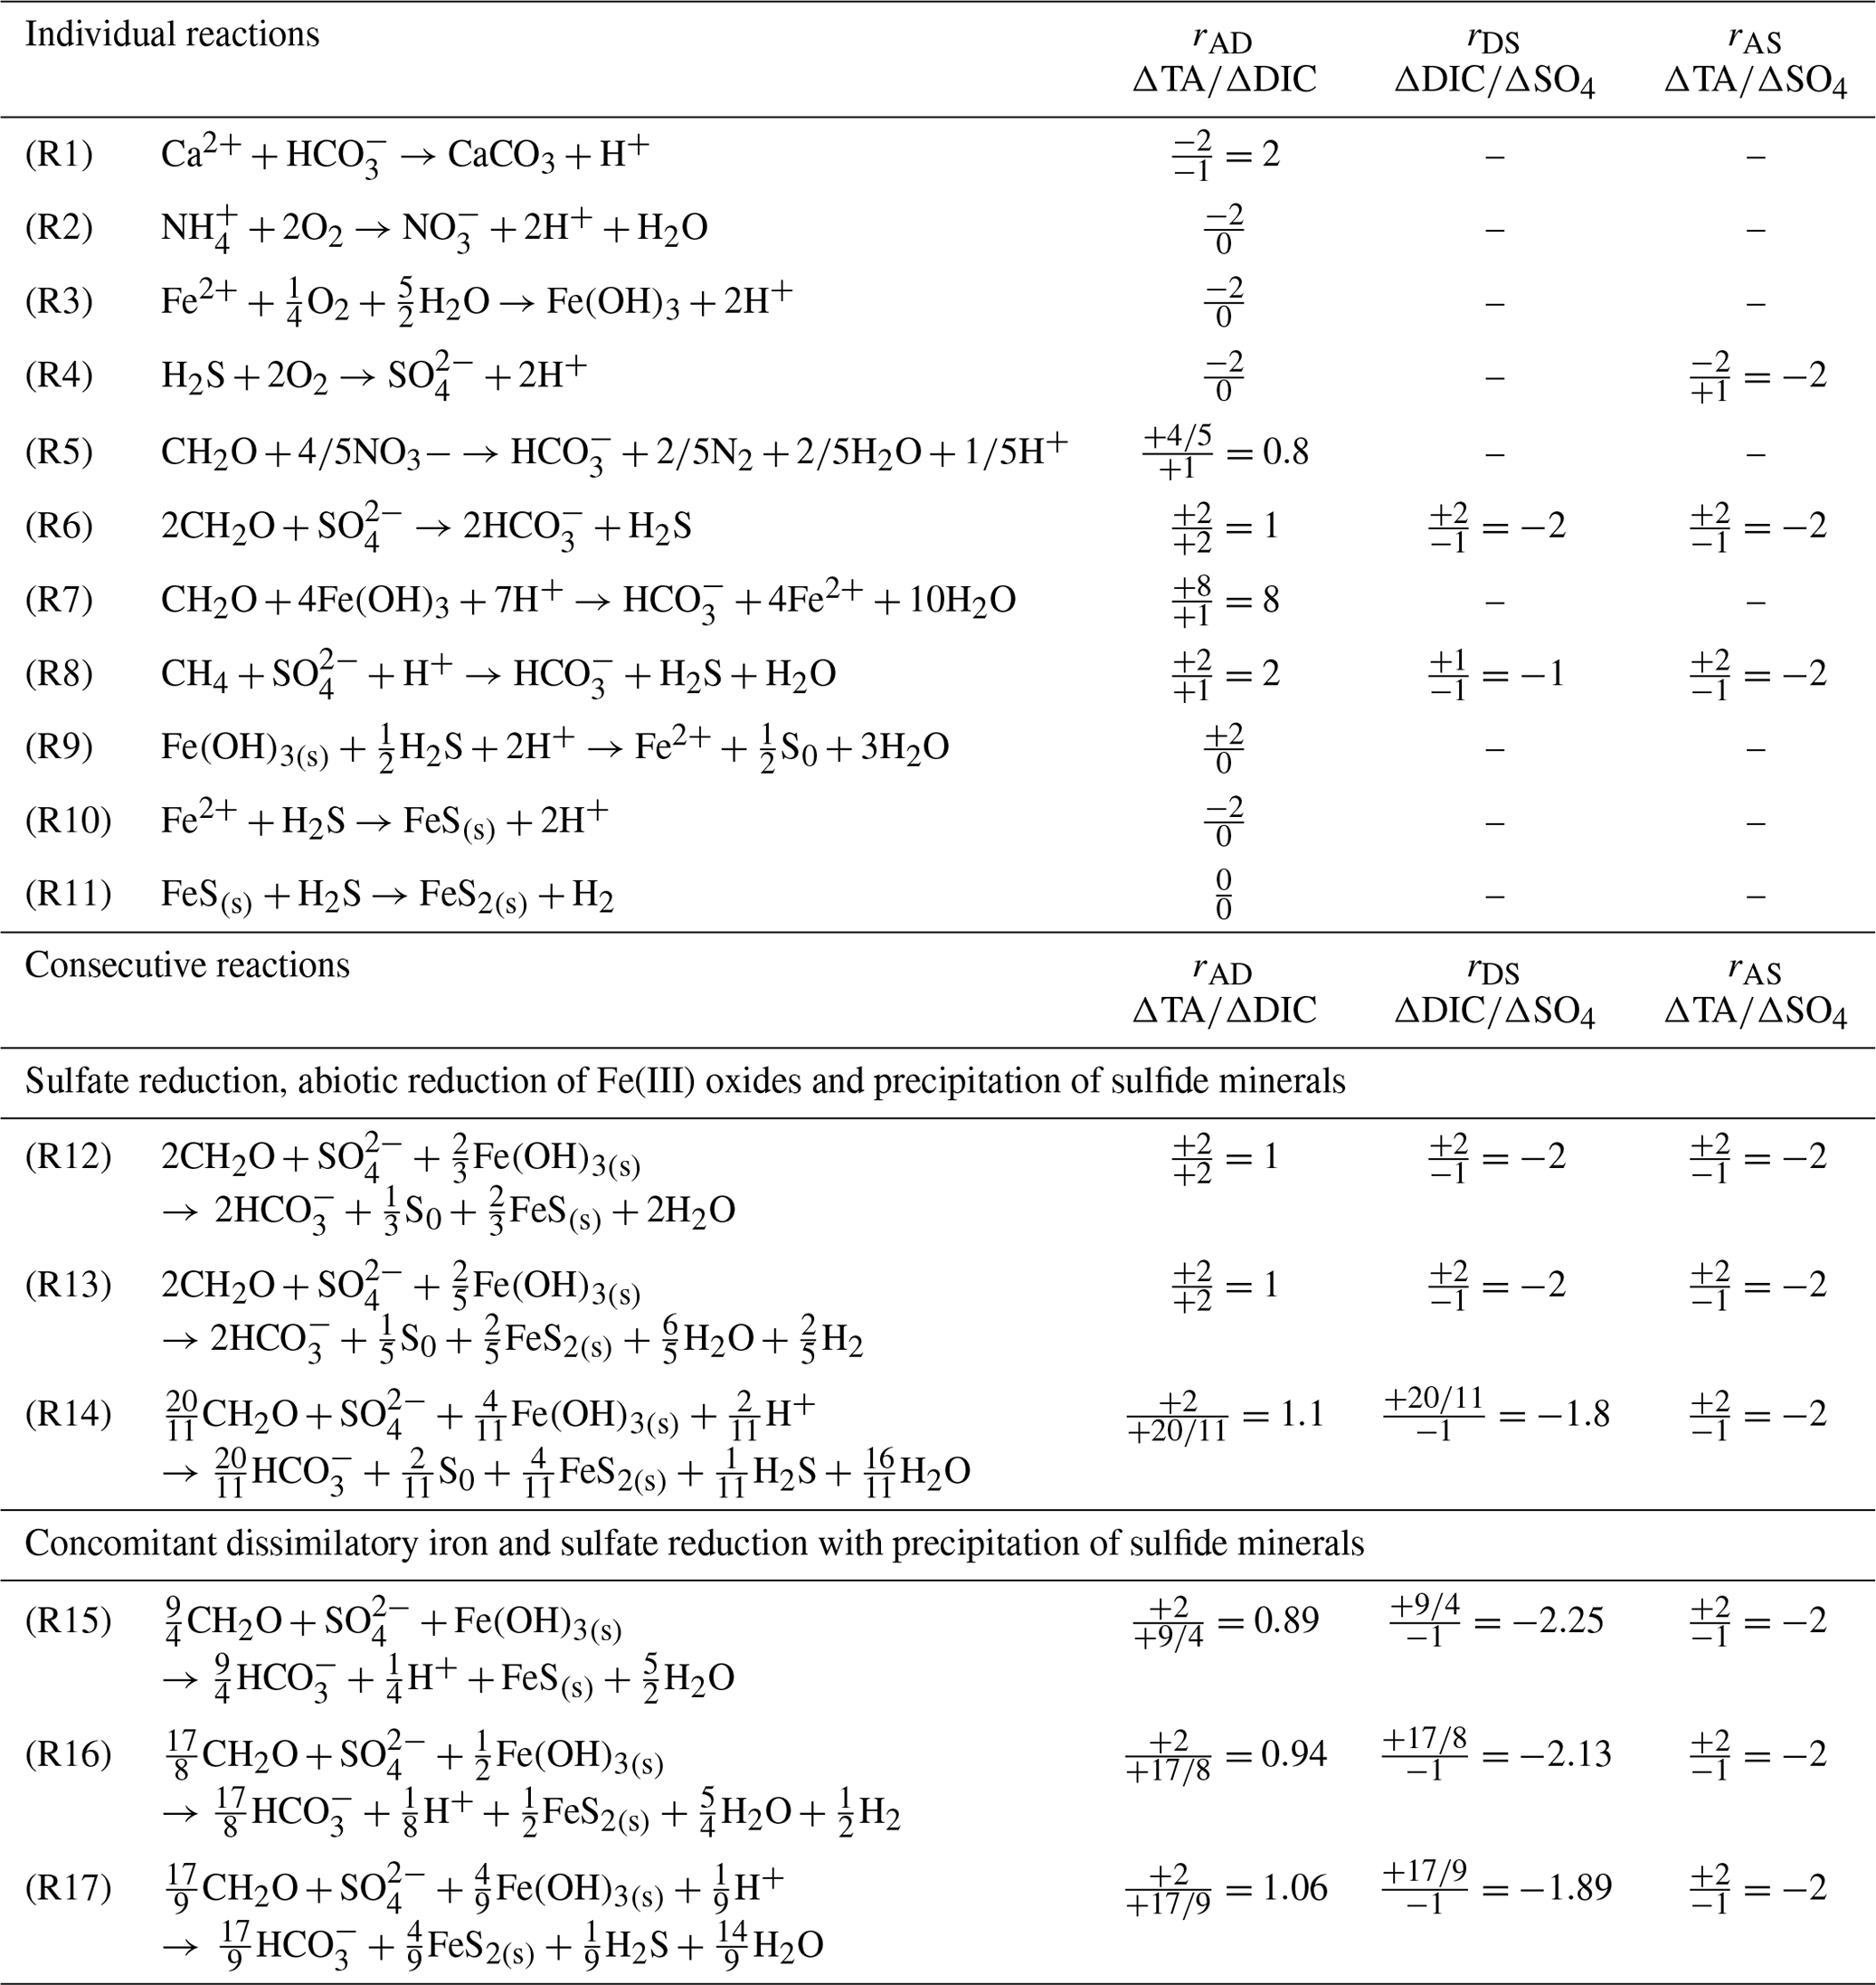
Table 1Individual and consecutive microbial and abiotic reactions that affect the theoretical ΔTA∕ΔDIC (rAD), ΔDIC∕Δ sulfate (rDS) and ΔTA∕Δ sulfate (rAS) stoichiometric ratios. Note that Reactions (R14) and (R17) include oxidation of H2 by sulfate reducing bacteria.
To characterize the biogeochemical conditions in which sediments provide an alkalinity source to coastal waters, it is crucial to relate this reaction network to net benthic fluxes of alkalinity and DIC measured in situ. A high ratio of benthic TA to DIC fluxes (>1) would increase the buffer capacity of the bottom waters and influence the coastal carbon cycle by increasing the storage capacity of CO2 in coastal waters over long timescales (Thomas et al., 2009; Andersson et al., 2006; Brenner et al., 2016). The objectives of this study were to determine the magnitude of the alkalinity flux to the bottom waters from deltaic region sediments exposed to large riverine inputs of carbon and minerals and to identify the underlying biogeochemical processes responsible for the net production of alkalinity in these sediments. This study is one of the first to simultaneously quantify the spatial distribution of benthic TA and DIC fluxes, dissolved oxygen uptake (DOU) rates, burial fluxes of reduced substances, and the main biogeochemical processes involved in organic carbon mineralization in sediments. These processes were investigated along a gradient of organic carbon and mineral inputs to the seafloor in the Rhône River delta (France) before the usual flood season in late summer.
2.1 The Rhône River delta
The Rhône River subaqueous delta, also called prodelta due to its prograding characteristics, is a wave-dominated delta located in the Gulf of Lion (France), a microtidal continental margin. The Rhône River is the main source of freshwater, suspended matter (including iron oxides) and POC to the Mediterranean Sea (Sempéré et al., 2000). The river plume is generally oriented southwestward due to the combined effects of wind forcing and the Coriolis effect (Estournel et al., 1997). The Great Rhône River mouth is characterized by a prodeltaic lobe (Got and Aloisi, 1990) that can be divided into three main areas based on bathymetry and sedimentation rates (Got and Aloisi, 1990): the proximal domain within a 2 km radius of the river outlet, with water depths between 10 and 30 m and mean apparent accumulation rates of up to 30–40 cm yr−1 (Charmasson et al., 1988); the prodelta domain between 2 and 5 km, with water depths ranging from 30 to 70 m and sedimentation rates of 1–4 cm yr−1 (Miralles et al., 2005); and the distal domain further offshore, with water depths greater than 70 m and accumulation rates of 0.1 to 1 cm yr−1 (Miralles et al., 2005). In this part of the Gulf of Lion, sediments are fine grained and of a cohesive nature (Roussiez et al., 2005; Cathalot et al., 2013). Their total organic carbon content in surface sediments is higher than 2 % close to the river mouth and decreases offshore (Lansard et al., 2008). The sedimentary inorganic carbon content ranges between 28 % and 38 % (Roussiez et al., 2005) and is, to more than 95 %, composed of calcite (Rassmann et al., 2016) originating from the calcareous belt around the Alps. The other 5 % are aragonite and magnesian calcite. The sediments of the three domains are characterized by a strong biogeochemical gradient from the Rhône River mouth to the Gulf of Lion continental slope, leading to large sediment respiration rates in the proximal domain that decrease offshore (Lansard et al., 2009; Pastor et al., 2011; Cathalot et al., 2013; Rassmann et al., 2016). These sediments are characterized by strong anaerobic production of TA and DIC (Rassmann et al., 2016), but whether this alkalinity is consumed in the oxic sediment layer or released to the bottom waters has yet to be determined.
Most of the Rhône River particles are deposited in the proximal and prodelta areas during flood events (80 % of the particles; Maillet et al., 2006; Cathalot et al., 2010; Zebracki et al., 2015), mainly in late fall and early winter, leading to the periodic accumulation of terrestrial organic-rich particles in these sediments (Radakovich et al., 1999; Roussiez et al., 2005). A large proportion of this terrestrial organic matter (>90 %; Lansard et al., 2009; Cathalot et al., 2013), with occasional coarse particles (CPOM, Charles et al., 2014), is mineralized in the spring and summer. Although data are scarce, metabolites from carbon remineralization processes probably build up progressively during winter and spring (Jens Rassmann, unpublished data). This temporal evolution yields similar diagenetic signatures from mid-spring to end of summer, including almost complete sulfate reduction, large concentrations of DIC and alkalinity (30–40 mM), 500–800 µM of dissolved iron, and no dissolved sulfide in the pore waters (Rassmann et al., 2016; Pastor et al., 2011). This pattern was observed consistently over several sampling campaigns, including April 2007 (Pastor et al., 2011), April 2013 (Dumoulin et al., 2018), May 2014 (Rassmann et al., 2016), September 2015 (this paper), and May 2018 (Christophe Rabouille, unpublished data). Altogether, the pore water data collected over the years in the Rhône prodelta system are consistent and indicate that biogeochemical processes in the critical proximal zone reach a reproducible state on a yearly basis due to the regularity of flood deposition in late fall and maturation of the system in spring and summer. This reproducibility of the spring–summer conditions probably also applies to benthic fluxes.
2.2 Bottom water sampling and analyses
The AMOR-B-Flux cruise took place on-board the RV Tethys II (CNRS-INSU) in September 2015. The investigated stations were located in the river plume along a nearshore–offshore transect (Fig. 1 and Table 2). Bottom water samples were collected with 12 L Niskin® bottles from 1 to 2 m above the seafloor. The sampling depth was checked with a mounted underwater depth gauge. The seawater temperature was measured using a thermometer with a precision of 0.1 ∘C, and the salinity was measured with a conductivity-based thermosalinometer with a precision of 0.1. Dissolved oxygen concentrations were analyzed by Winkler titration (Grasshoff et al., 1983) within 12 h after sampling with a precision of ±0.5 µM. Triplicate pH measurements were carried out at 25 ∘C within 1 h after sampling by spectrophotometry with unpurified m-cresol purple as indicator dye (Clayton and Byrne, 1993) and a precision of ±0.01 pH units. The CO2SYS software (Pierrot et al., 2006; Orr et al., 2018) was used with the equilibrium constants from Luecker et al. (2000) and DIC and pH as input parameters to report pH on the total proton scale (pHT) and at in situ temperature and salinity. As silicate and phosphate concentrations were not measured in the bottom waters, average concentrations for the Gulf of Lion were used. To obtain concentrations as close as possible to the seafloor, overlying water from the sediment cores was also sampled and analyzed for TA and DIC concentrations.
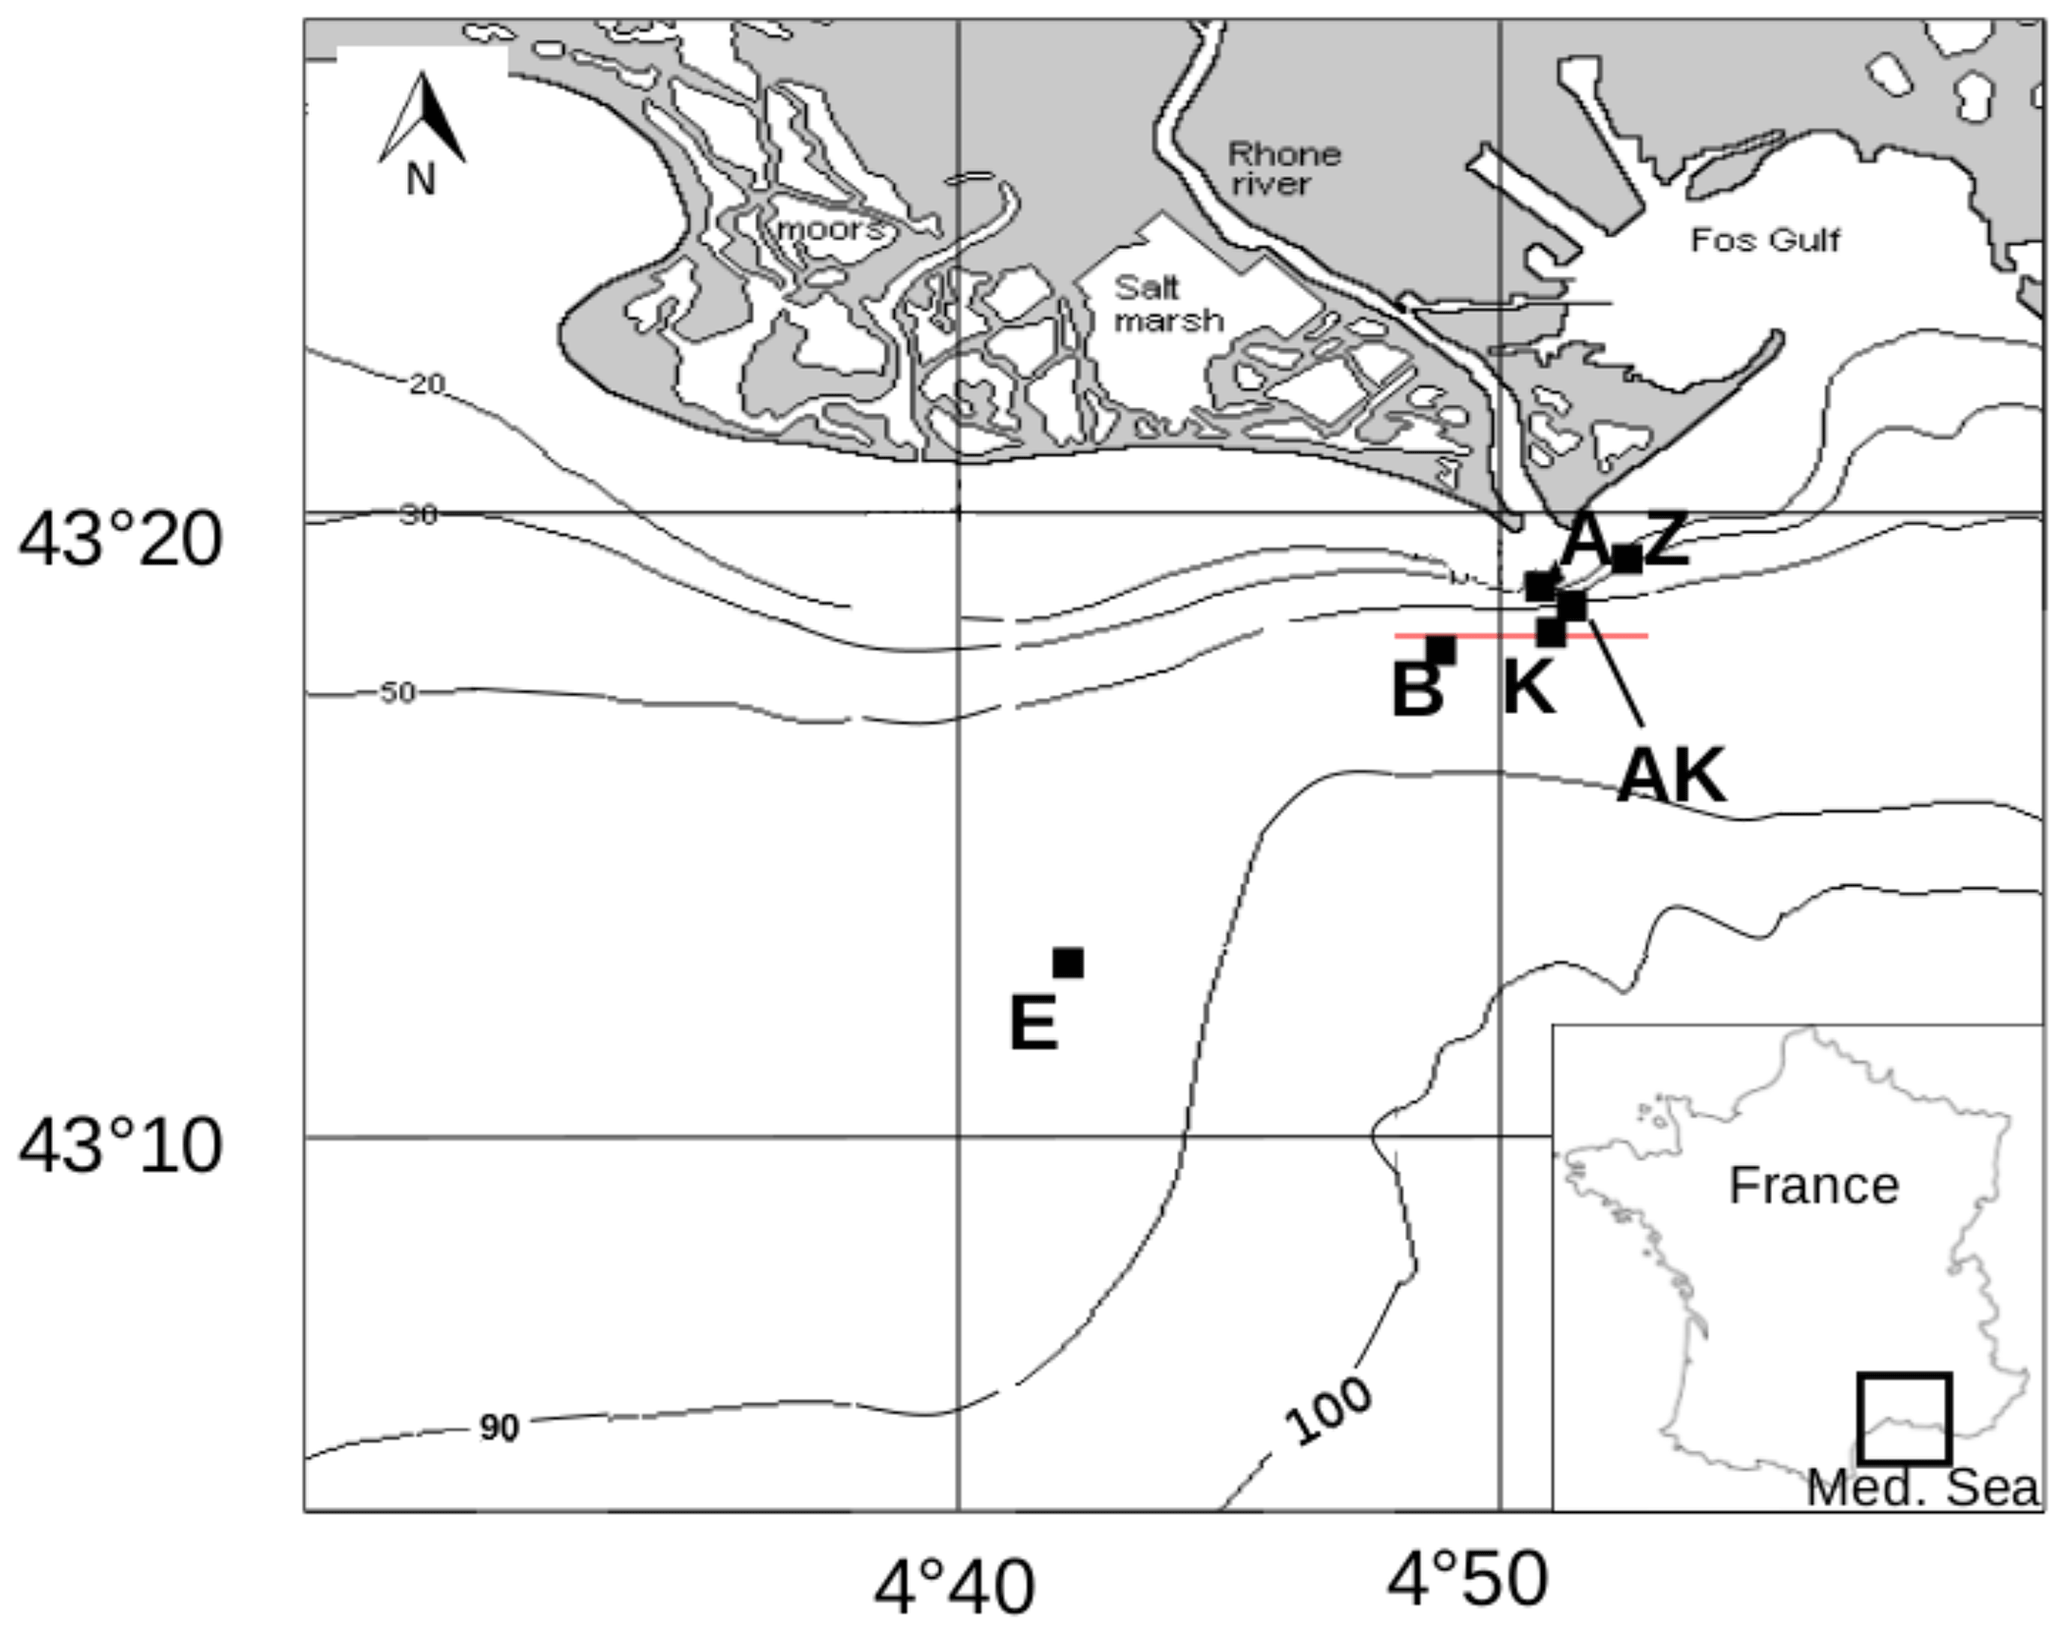
Figure 1Map of the Rhône River prodelta with the stations investigated during the AMOR-B-Flux cruise in September 2015.
Table 2Sampling sites during the AMOR-B-Flux cruise in September 2015 and main characteristics of bottom waters: dist. = distance to the Rhône River mouth; ω = sedimentation rate. Station Z was sampled twice (Z on 8 September 2015 and Z′ on 14 September 2015) to investigate spatial variability (n.d. = not determined).
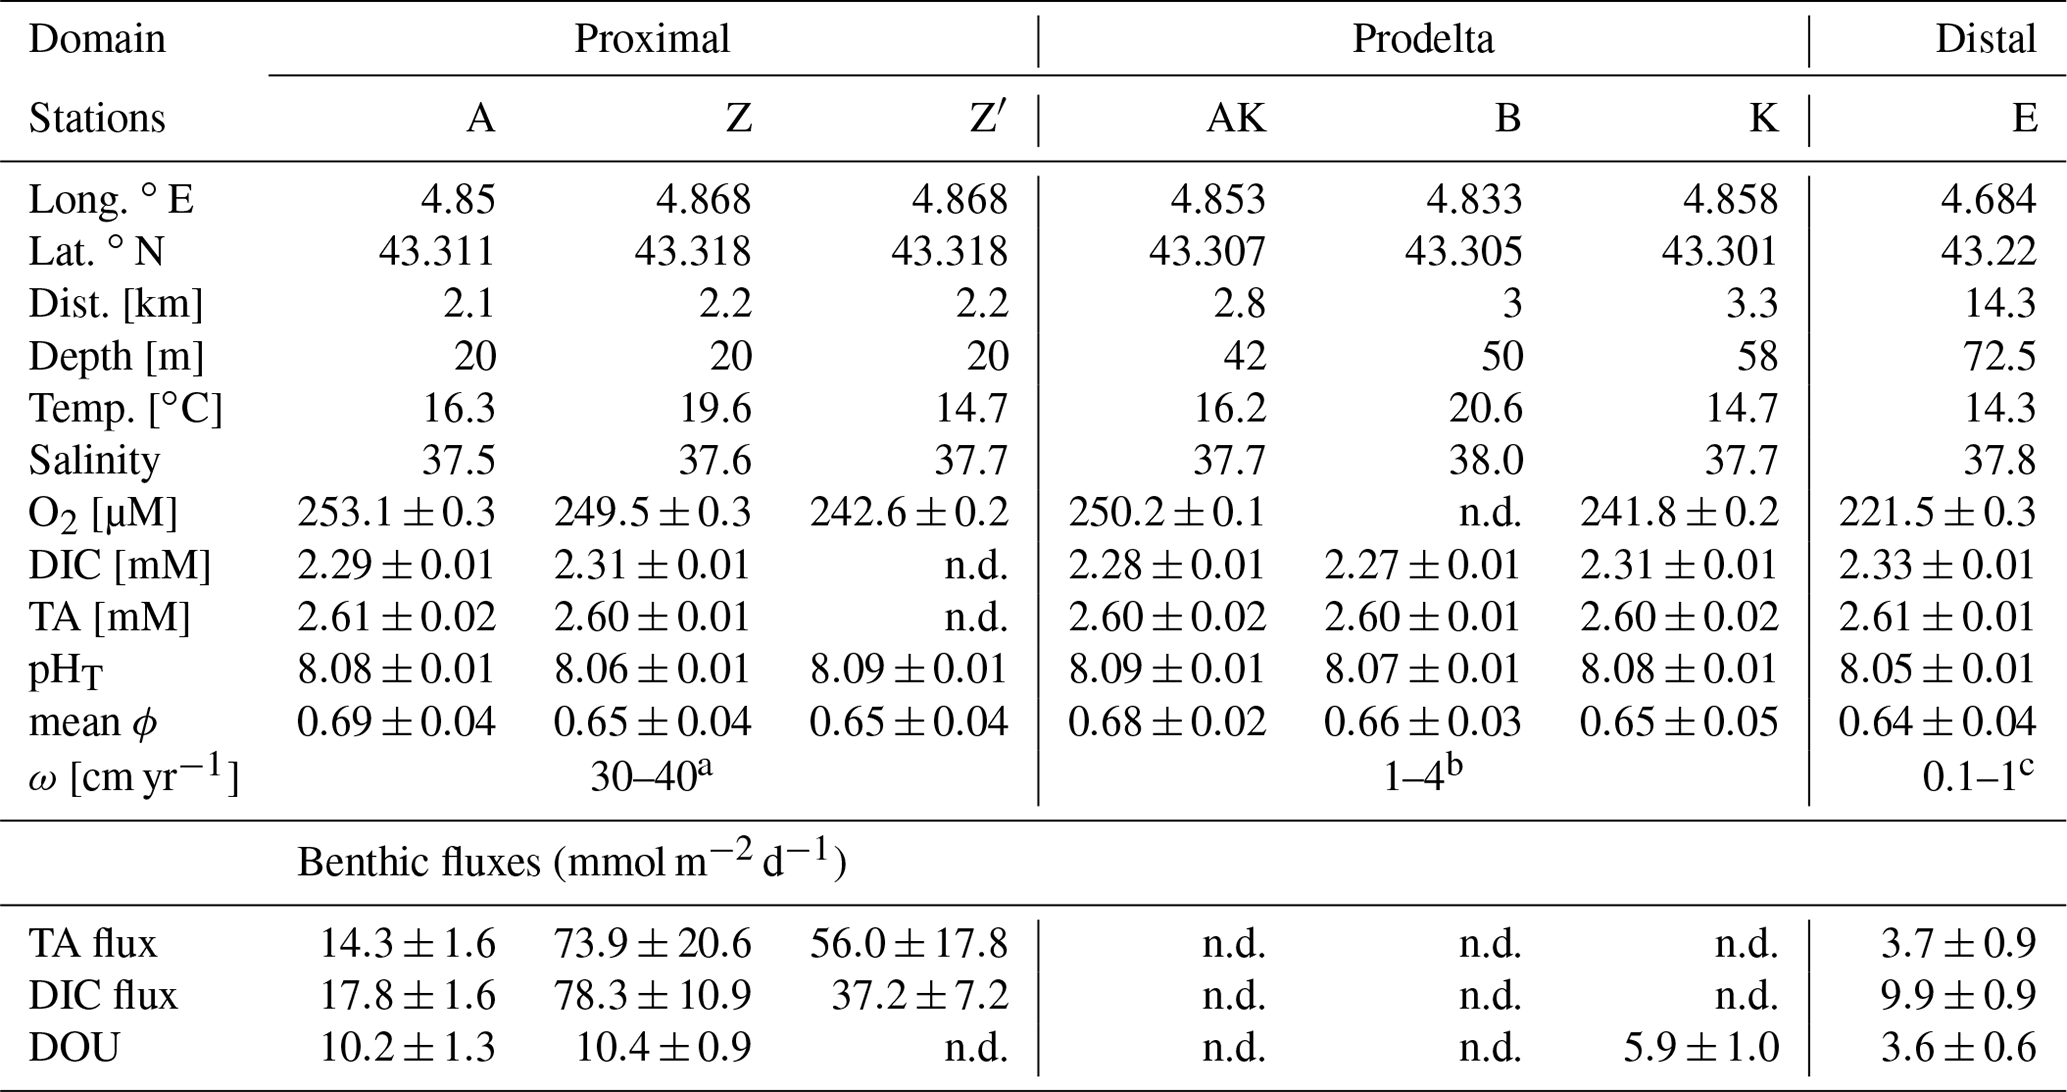
a Data from Charmasson et al. (1998). b Data from Lansard et al. (2009). c Data from Miralles et al. (2005).
2.3 In situ benthic chamber deployments
Benthic fluxes were determined with an autonomous benthic lander (Jahnke and Christiansen, 1989). The lander was equipped with a single benthic chamber and water syringe sampling system. The chamber encloses a 30×30 cm sediment surface area with a volume of overlying water determined by measuring the initial concentration of two tracers (iodide and bromide) injected after closure of the chamber within 20 min after deployment on the seafloor to ensure that the chamber and particles eventually resuspended were settled in the sediment. A mechanical stirrer integrated in the chamber lid was run at 10 rpm to homogenize the overlying waters in the chamber without interfering with sediment–water exchange processes (Buchholtz-Ten Brink et al., 1989). TA and DIC samples were collected as a function of time and their concentrations corrected for the dilution that occurred by replacing the sample volume collected by ambient water. The slopes of the concentration–time plots were estimated using the “lm” function in R, a restricted maximum likelihood estimator (REML) that takes uncertainties of individual measurements into account. Finally, benthic fluxes across the SWI (Fi in mmol m−2 d−1) were calculated from the slopes of these concentration–time plots and the chamber height (Eq. 1),
where H (m) is the overlying water height in the benthic chamber, Ci represents the concentration of the analyte i (TA or DIC, in mmol m−3) and t is time (d).
2.4 In situ micro-profiling of dissolved oxygen and pH
A separate benthic lander, carrying a benthic micro-profiler (Unisense®), was deployed to measure in situ micro-profiles of dissolved oxygen and pH (Cai and Reimers, 1993; Rabouille et al., 2003; Rassmann et al., 2016 and references therein). Up to five oxygen and two pH microelectrodes were simultaneously deployed, and vertical depth profiles were measured with a 200 µm resolution. As their response to variations in oxygen concentrations is linear, the O2 microelectrodes (Boudreau and Jorgensen, 2001) were calibrated with a two-point calibration technique using the bottom water O2 concentration determined by Winkler titration and the anoxic pore waters. The pH microelectrodes were calibrated using NBS buffers (pH 4.00, 7.00, and 9.00 at 20 ∘C) and the spectrophotometrically determined pH of the bottom waters was used to correct for the difference in the liquid junction potential between seawater and the NBS buffers. Signal drift of O2 and pH microelectrodes during profiling was checked to be less than 5 %.
2.5 Sediment sampling, porosity measurements, and ex situ voltammetric profiling
At each sampling station, six sediment cores (two for pore waters, one for porosity, one for voltammetry, one for methane and one for archives) were collected using an UWITEC® single corer (length 60 cm, inner diameter 9 cm) within 30 m of the site where the landers were deployed and processed within 30 min after collection. Sediment porosity profiles were determined by slicing one of the cores with a 2 mm resolution until 10 mm depth, a 5 mm resolution until 60 mm, and a 10 mm resolution down to the bottom of the cores. Porosity was calculated from the bottom water salinity, an average sediment density of 2.5 g cm−3, and the weight difference between the wet and dried sediment after 1 week at 60 ∘C.
Ex situ voltammetric profiles were obtained in a separate core with an AIS, Inc. DLK-70 potentiostat in a three electrode configuration, including an Hg∕Au working microelectrode constructed from Pyrex glass pulled to a tip of 0.4 mm diameter to minimize particle entrainment during the profiles (Luther et al., 2008), an Ag∕AgCl reference electrode, and a platinum counter electrode. The Hg∕Au voltammetric electrode was deployed in the sediment using a DLK MAN-1 micromanipulator (AIS, Inc). Using a combination of linear sweep and anodic and cathodic square wave voltammetry, Hg∕Au voltammetric microelectrodes are able to simultaneously quantify dissolved O2, Mn2+, Fe2+, total dissolved sulfide (including elemental sulfur and polysulfides, which cannot be easily distinguished from reduced sulfide; ), and organic complexes of Fe(III) (org-Fe(III)) and iron sulfide clusters (FeSaq), which are not quantifiable but are reported in normalized current intensities (Tercier-Waeber and Taillefert, 2008). Hg∕Au microelectrodes were calibrated for dissolved O2 using in situ temperature and salinity of the overlying waters to determine the dissolved O2 concentrations at saturation (Luther et al., 2008). They were also calibrated externally with MnCl2 to quantify all other species according to the pilot ion method (Luther et al., 2008). All voltammetric data were integrated using VOLTINT, a semiautomated Matlab® script with peak recognition software (Bristow and Taillefert, 2008).
2.6 Pore water and solid-phase extractions and analyses
Between 12 and 15 mL of sediment pore waters at each sampled depth were extracted from a third sediment core using rhizon filters with a mean pore size of 0.1 µm (Seeberg-Elverfeldt et al., 2005) in a glove bag that was extensively flushed with N2 to create an anaerobic atmosphere (monitored with an O2 sensor and verified with a 2 % ((NH4)2Fe(SO4)2⋅6H2O) solution). Pore waters were subsampled within 2 h onboard. A sample volume of 1 mL was immediately used for dissolved phosphate analysis using the paramolybdate method (Murphy and Riley, 1962), as well as for dissolved Fe2+ and total dissolved iron analysis using the ferrozine method (Stookey, 1970). Pore water and bottom water fractions were poisoned with HgCl2 for TA and DIC or acidified to pH 1 with ultrapure HCl for sulfate and stored at 4 ∘C until analysis in the laboratory. Total alkalinity was measured on 3–6 mL sample volume by open cell titration with 0.01 M HCl (Dickson et al., 2007). Depending on the available sample volume, duplicate or triplicate titrations were performed. DIC concentrations were analyzed with a DIC analyzer (Apollo/SciTech®) on 1 mL samples, as previously described (Rassmann et al., 2016), and reported as the average and standard deviations of triplicate measurements. The TA and DIC methods were calibrated using certified reference materials for oceanic CO2 measurements provided by the Scripps Institution of Oceanography (batch no. 136). The relative uncertainty for both DIC and TA was ±0.5 % of the final value. Sulfate concentrations were quantified on 100 µL sample volumes after dilution by ion chromatography on an ICS 1000 chromatograph (Dionex) with an IonPac AS 9 HC column and AG 9 HC guard by suppressed conductivity with an AERS 500 suppressor (ThermoFisher Scientific). A 9 mM solution of Na2CO3, at a flow rate of 1 mL min−1, was used as the eluent. The relative uncertainty of this method was ±1.6 %. To validate a newly developed high-performance liquid chromatography method (Beckler et al., 2014), pore water fractions from a separate core were also frozen at −18 ∘C for sulfate analysis back in the laboratory. For this new method, a Waters, Inc. 1525 binary pump with Waters 2487 absorbance detector at 215 nm was used with a Metrohm Metrosep A Supp 5 anion exchange column (150 mm × 4.0 mm) with a 1.0 mM NaHCO3/3.2 mM Na2CO3 eluent at a flow rate of 0.7 mL min−1 (Beckler et al., 2014). To measure ammonium () concentrations, 1 mL subsamples were diluted and analyzed using the indophenol blue method (Grasshof et al., 1983). The uncertainty of the method was about 5 %. Pore water fractions of 1 mL volume were also acidified with 2 % HCl for Ca2+ analysis by inductively coupled plasma atomic emission spectroscopy (Ultima 2, Horiba Scientific). The method was validated with mono-elemental standards and standard solutions (IAPSO, CASS-4, and NASS-6 seawater reference materials) and displayed an external relative uncertainty of ±2 %–3 %, depending on the sample series, and a detection limit of 100 µmol L−1.
Close to the Rhône River mouth, at stations A, Z, and AK, one additional core was subsampled for methane analysis with 1 cm diameter corers made of cut 10 mL syringes inserted every 5 cm through pre-drilled holes on the side of the core. Due to the technical challenge of sampling non soluble methane in pore waters, this sampling could not be carried out on the same cores as the other pore water analyses. The content of these subsamples was carefully inserted in gas-tight vials containing deionized water and HgCl2 solution and kept at 4 ∘C until methane analysis. Dissolved methane was quantified after degassing of the pore waters into the headspace and quantified by gas chromatography with a relative uncertainty of ±5 % (Sarradin and Caprais, 1996). The position of the sulfate–methane transition zone (SMTZ) was determined as the zone around the depth where [] = [CH4] (Komada et al., 2016). Finally, acid volatile sulfur (AVS) for the determination of FeSs was extracted from the same sediment used for the pore water extractions after slicing into layers of 1 to 5 cm. FeSs measurements were conducted in triplicate by cold acid distillation of H2S(g) under anoxic conditions that was trapped by NaOH and quantified voltammetrically (Henneke et al., 1991).
2.7 Nanoparticulate FeS and ion activity product for FeS precipitation
As a significant fraction of FeS nanoparticles may pass through the rhizon filters (0.1 µm) used to extract pore waters (Nakayama et al., 2016) and the ferrozine method is well known to dissolve FeS nanoparticles (Davison et al., 1998), the difference between spectrophotometrically determined Fe2+ concentrations ([ΣFe2+]FR) and electrochemically determined Fe2+ concentrations () in the pore waters was attributed to FeS nanoparticles (FeS0), as demonstrated previously (Bura-Nakic et al., 2009; Eq. 2).
In this interpretation, FeS0 nanoparticles encompass both the molecular clusters of FeS (FeSaq) detected electrochemically, which must be smaller than 5 nm in diameter to diffuse to the electrode (Buffle, 1988), and the larger FeS nanoparticles that are not detected voltammetrically. As electrochemically measured FeS(aq) cannot be quantified, both FeS forms can unfortunately not be compared directly.
2.8 Calculations of oxygen uptake and AVS burial rates
Diffusive oxygen uptake (DOU) rates were calculated using Fick's first law (Berner, 1980, Eq. 3),
where ϕ is the dimensionless sediment porosity, Ds is the apparent diffusion coefficient in the sediments (cm2 s−1), and is the oxygen gradient below the SWI (µmol mm−1). For the calculations, the gradient from 0 to 400 µm in the sediment was used. The Ds coefficients were adjusted for diffusion in a porous environment according to , with the diffusion coefficient in free water (D0) taken from Broecker and Peng (1974) and recalculated at in situ temperature by the Stokes–Einstein relation (Li and Gregory, 1974).
AVS burial fluxes were estimated using available sedimentation rates (Charmasson et al., 1998; Miralles et al., 2005), average AVS concentrations and porosities of each sediment core, according to Eq. (4),
where ω is the sedimentation rate (cm yr−1) and ρ is the sediment dry bulk density (g cm−3).
2.9 Stoichiometric ratios
Anaerobic mineralization of organic matter follows various complex reaction pathways (Table 1), but the relationships between key concentrations help us to understand which processes are dominant (Burdige and Komada, 2011). To determine the relationship between net TA and DIC production and to establish whether sulfate reduction represents the main source of TA and DIC in these sediments, stoichiometric ratios of the relative production of TA compared to DIC (rAD), as well as TA (rAS) and DIC (rDS) compared to sulfate consumption, were calculated from the pore water data and compared to theoretical ratios from the reaction stoichiometries (Table 1). These ratios are equivalent to slopes in DIC–TA diagrams that can be used to identify the dominant processes controlling the carbonate system (Pain et al., 2019). For each station, experimental stoichiometric ratios were obtained from the slope and standard deviation of the linear regression of ΔTA, ΔDIC and property–property plots. The Δi values represent concentration changes with respect to bottom water concentrations for component i and were corrected by multiplying their values by their diffusion coefficient (Δi⋅Di; Berner, 1980), where Di is the sediment diffusion coefficient for component i. The corresponding diffusion coefficients, corrected for temperature and salinity (cm2 s−1), were adapted from Li and Gregory (1974). At the pH of pore waters (pHT∼7.5 at 20 ∘C, S=38.0), more than 95 % of DIC and carbonate alkalinity are composed of bicarbonate ion (). Given the relatively small difference in the diffusion coefficients of HCO and (11.8 and cm2 s−1 at 25 ∘C, Li and Gregory, 1974) and the high proportion of relative to , the diffusion coefficient of was adopted for both TA and DIC diffusion.
As calcium carbonate precipitation occurs in the sediments of the Rhône River delta (Rassmann et al., 2016), the effect of CaCO3 precipitation on TA and DIC variations was also accounted for by considering the Ca2+ concentration gradients in the pore waters. We assumed that the stoichiometric ratio of CaCO3 represents a good approximation, as more than 95 % of the calcium carbonates in this area are composed of calcite (Rassmann et al., 2016). For these calculations, the absolute value of measured ΔCa2+, i.e., Ca2+ concentration relative to its bottom water concentration, was added to the ΔTA or ΔDIC after taking the corresponding diffusion coefficients into account ( for alkalinity and for DIC) and plotted against . The calculated slope provided a stoichiometric ratio corrected for the precipitation of calcium carbonate (rIJc). Pore water saturation states with respect to calcite (ΩCa) were calculated according to the equation proposed by Mucci (1983) and Millero (1983, 1995). Theoretically, organic alkalinity has to be considered in the calculation of rAD and rAS ratios; however, this study does not contain enough data to access organic alkalinity properly, and the expected effect of organic alkalinity on these ratios was low (Sect. 4.2).
3.1 Bottom water and surface sediment characteristics
At all stations, bottom water salinity ranged from 37.5 to 38.0 and temperature varied from 14.7 to 20.6 ∘C (Table 2). Average TA (2.60±0.01 mM) and DIC (2.30±0.02 mM) concentrations (Table 2) were relatively high compared to the Mediterranean Sea but common for the Gulf of Lion (Cossarini et al., 2015). The pHT of the bottom waters varied from 8.05 to 8.09, with the highest value observed at station AK and the lowest at station E. Although the oxygen concentration decreased with water depth, bottom waters were always well ventilated, with dissolved O2 concentrations higher than 220 µmol L−1. Sediment porosity ranged between 0.7 and 0.8 at the SWI, and they were similar at all stations between 20 and 400 mm depth (Table 2).
3.2 Benthic total and diffusive fluxes
The in situ pH and O2 micro-profiles reflected the differences between the three study domains under the influence of the Rhône River plume (Fig. 2). In the proximal zone (stations A and Z), the oxygen penetration depth (OPD) was only 1.5 to 2.5 mm into the sediment, as also indicated by separate micro-profile measurements (Fig. 2). The OPD increased from 2 to 6 mm at station K and reached 8 to 11 mm at the most offshore station (E). As a result of bad weather conditions, no exploitable in situ micro-profiles were recorded at stations AK and B, though ex situ voltammetric profiles determined oxygen penetration depths of 4 and 2 mm, respectively (Fig. 4). All pH micro-profiles indicated a pH minimum between 7.2 and 7.4 just below the OPD followed by an increase to between 7.5 and 7.6 in the manganese and ferruginous layers of the sediment around 5 mm inshore and below 12 mm offshore (Fig. 2). Below this depth, the pH stabilized in the pore waters.
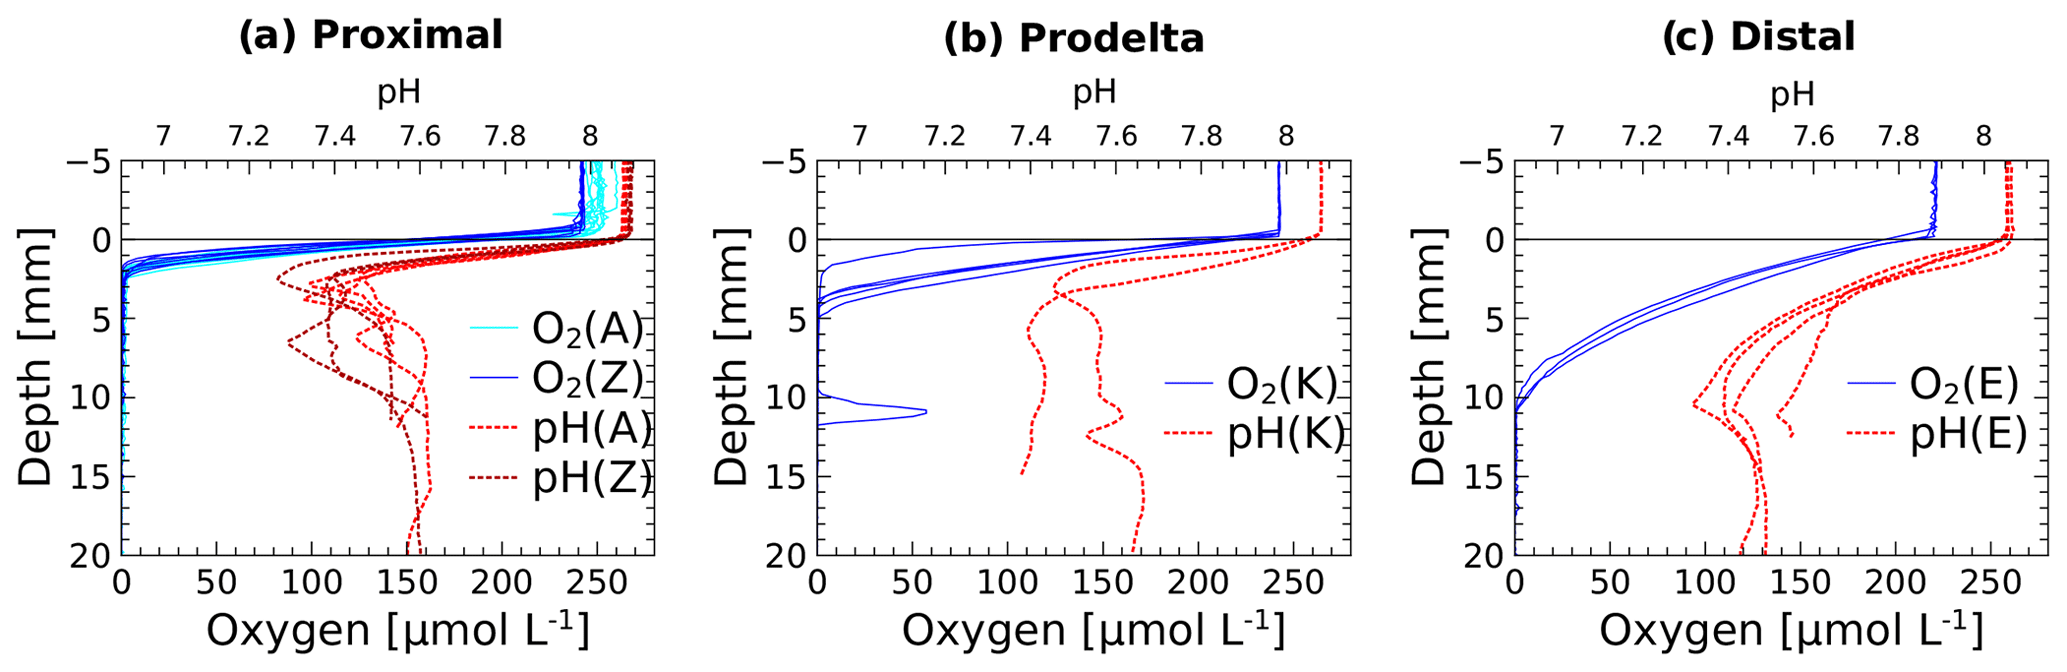
Figure 2Dissolved oxygen and pH micro-profiles recorded in situ at the sediment–water interface at stations A, Z, K and E. Stations A and Z are located in the proximal zone, K in the prodelta, and E in the distal zone (i.e., continental shelf).
The benthic chamber was deployed once at stations A and E and twice at station Z (Z′ is the replicate). Total alkalinity and DIC concentrations increased linearly with time (10 to 22 h) in the chamber (Fig. S1 in the Supplement), but concentration changes decreased along the nearshore–offshore transect. Minimal disturbance of the sediment–water interface during deployments was evidenced by the initial DIC and TA concentrations, which were within 5 % and 8 % of the bottom water concentration, respectively (Fig. S1). The highest benthic fluxes were recorded for the two deployments at station Z, with TA fluxes of 73.9±20.6 and 56.0±17.8 mmol m−2 d−1 and DIC fluxes of 78.3±10.9 and 37.2±7.2 mmol m−2 d−1 (Fig. 3, Table 2). The relatively high variability between these two measurements is probably due to the high spatial heterogeneity of the sediments due to the deposition conditions during floods. At station A, the benthic TA and DIC fluxes reached lower values of 14.3±1.6 and 17.8±1.6 mmol m−2 d−1, respectively, while benthic fluxes were lowest at station E, with a TA flux of 3.7±0.9 mmol m−2 d−1 and a DIC flux of 9.9±0.9 mmol m−2 d−1. In parallel, DOU rates reached 10.2±1.3 and 10.4±0.9 mmol m−2 d−1 at stations A and Z and decreased offshore to 5.9±1.0 mmol m−2 d−1 at station K and 3.6±0.6 mmol m−2 d−1 at station E (Fig. 3, Table 2). Although DOU rates and DIC fluxes tend to converge offshore, the TA and DIC fluxes in the proximal zone were between 2 and 8 times larger than the absolute value of the DOU rates (Fig. 3). In this area, DOU rates are quite representative of total oxygen uptake (TOU) by the sediments, as TOU : DOU ratios are typically around 1.2±0.4 (Lansard et al., 2009).
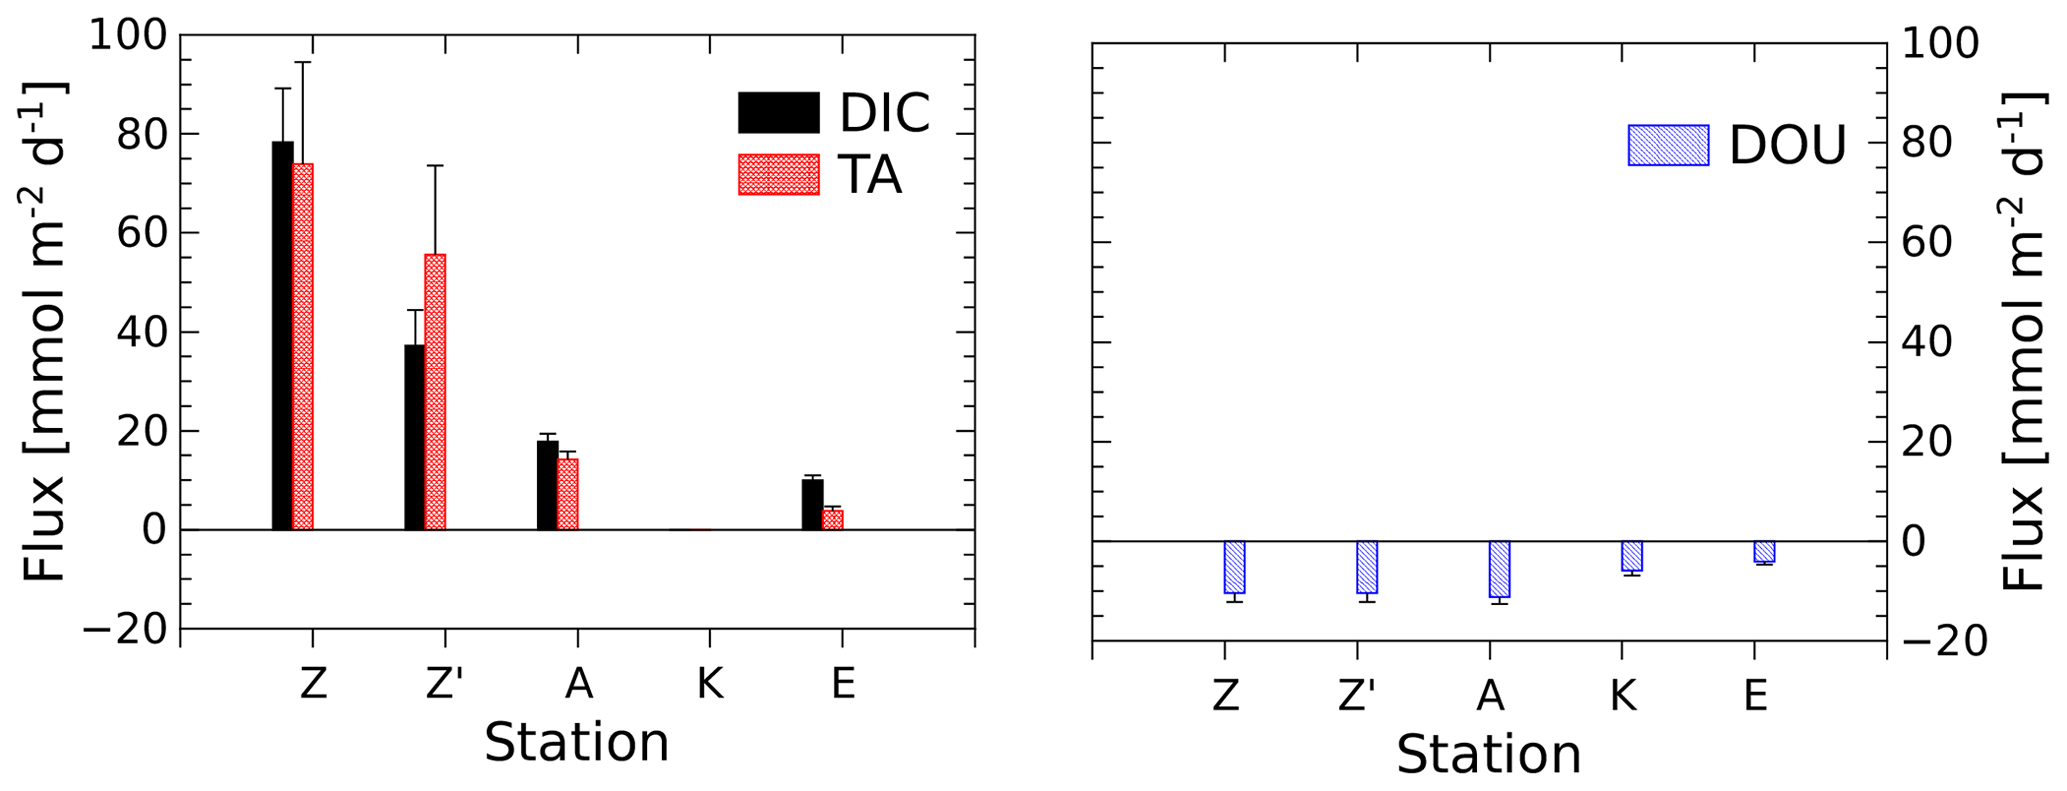
Figure 3DIC and TA fluxes measured with the benthic chamber and diffusive oxygen uptake (DOU) rates calculated from in situ microelectrode depth profiles at stations A, Z (measured during two deployments) and E. Error bars represent either uncertainties about the linear regression of the benthic DIC and TA gradients, taking into account individual error bars of each data point, or error propagation and standard deviations of multiple DOU measurements. Fluxes out of the sediment are positive and fluxes into the sediment are negative.
3.3 Electrochemistry profiles
Dissolved Fe2+ concentrations as a function of depth in the sediment mirrored the voltammetric signals of soluble organic-Fe(III) complexes at stations A, Z, AK, B and K (Fig. 4). High concentrations of dissolved Fe2+ were observed in the proximal domain at stations A (maximum of 341±22 µM) and Z (maximum of 234±25 µM), where dissolved ΣH2S was not detected (Fig. 4). At station AK, the shallowest station in the prodelta domain, dissolved Fe2+ increased to a maximum concentration of 255 µM around 2 cm depth, then decreased with sediment depth as FeSaq below 6.5 cm, and small concentrations of dissolved ΣH2S around 17 cm were produced (Fig. 4). The two deeper prodelta stations, B and K, displayed lower Fe2+ concentrations, including one peak not exceeding 81 µM (station B) or 73 µM (station K) in the top 2 cm of the sediment and a second peak not exceeding 50 µM between 12 and 14 cm (station B) and 86 µM between 5 and 7.5 cm (station K) in the sediment. Although FeSaq was only detected below 15 cm at station K, ΣH2S was produced in low concentrations (<5 µM) around 6.5 cm at stations B and K (Fig. 4). A peak of Fe2+ was initially formed in the top 5 cm of the distal domain (station E) but decreased to a minimum value with depth and did not correlate with the organic-Fe(III) voltammetric signals, which also remained low throughout the profile (Fig. 4). Finally, station E displayed generally low concentrations of ΣH2S in the pore waters (<6 µM), though the onset of ΣH2S production was much shallower (2.5 cm) and ΣH2S concentrations were consistently higher throughout the profile than at any other station.
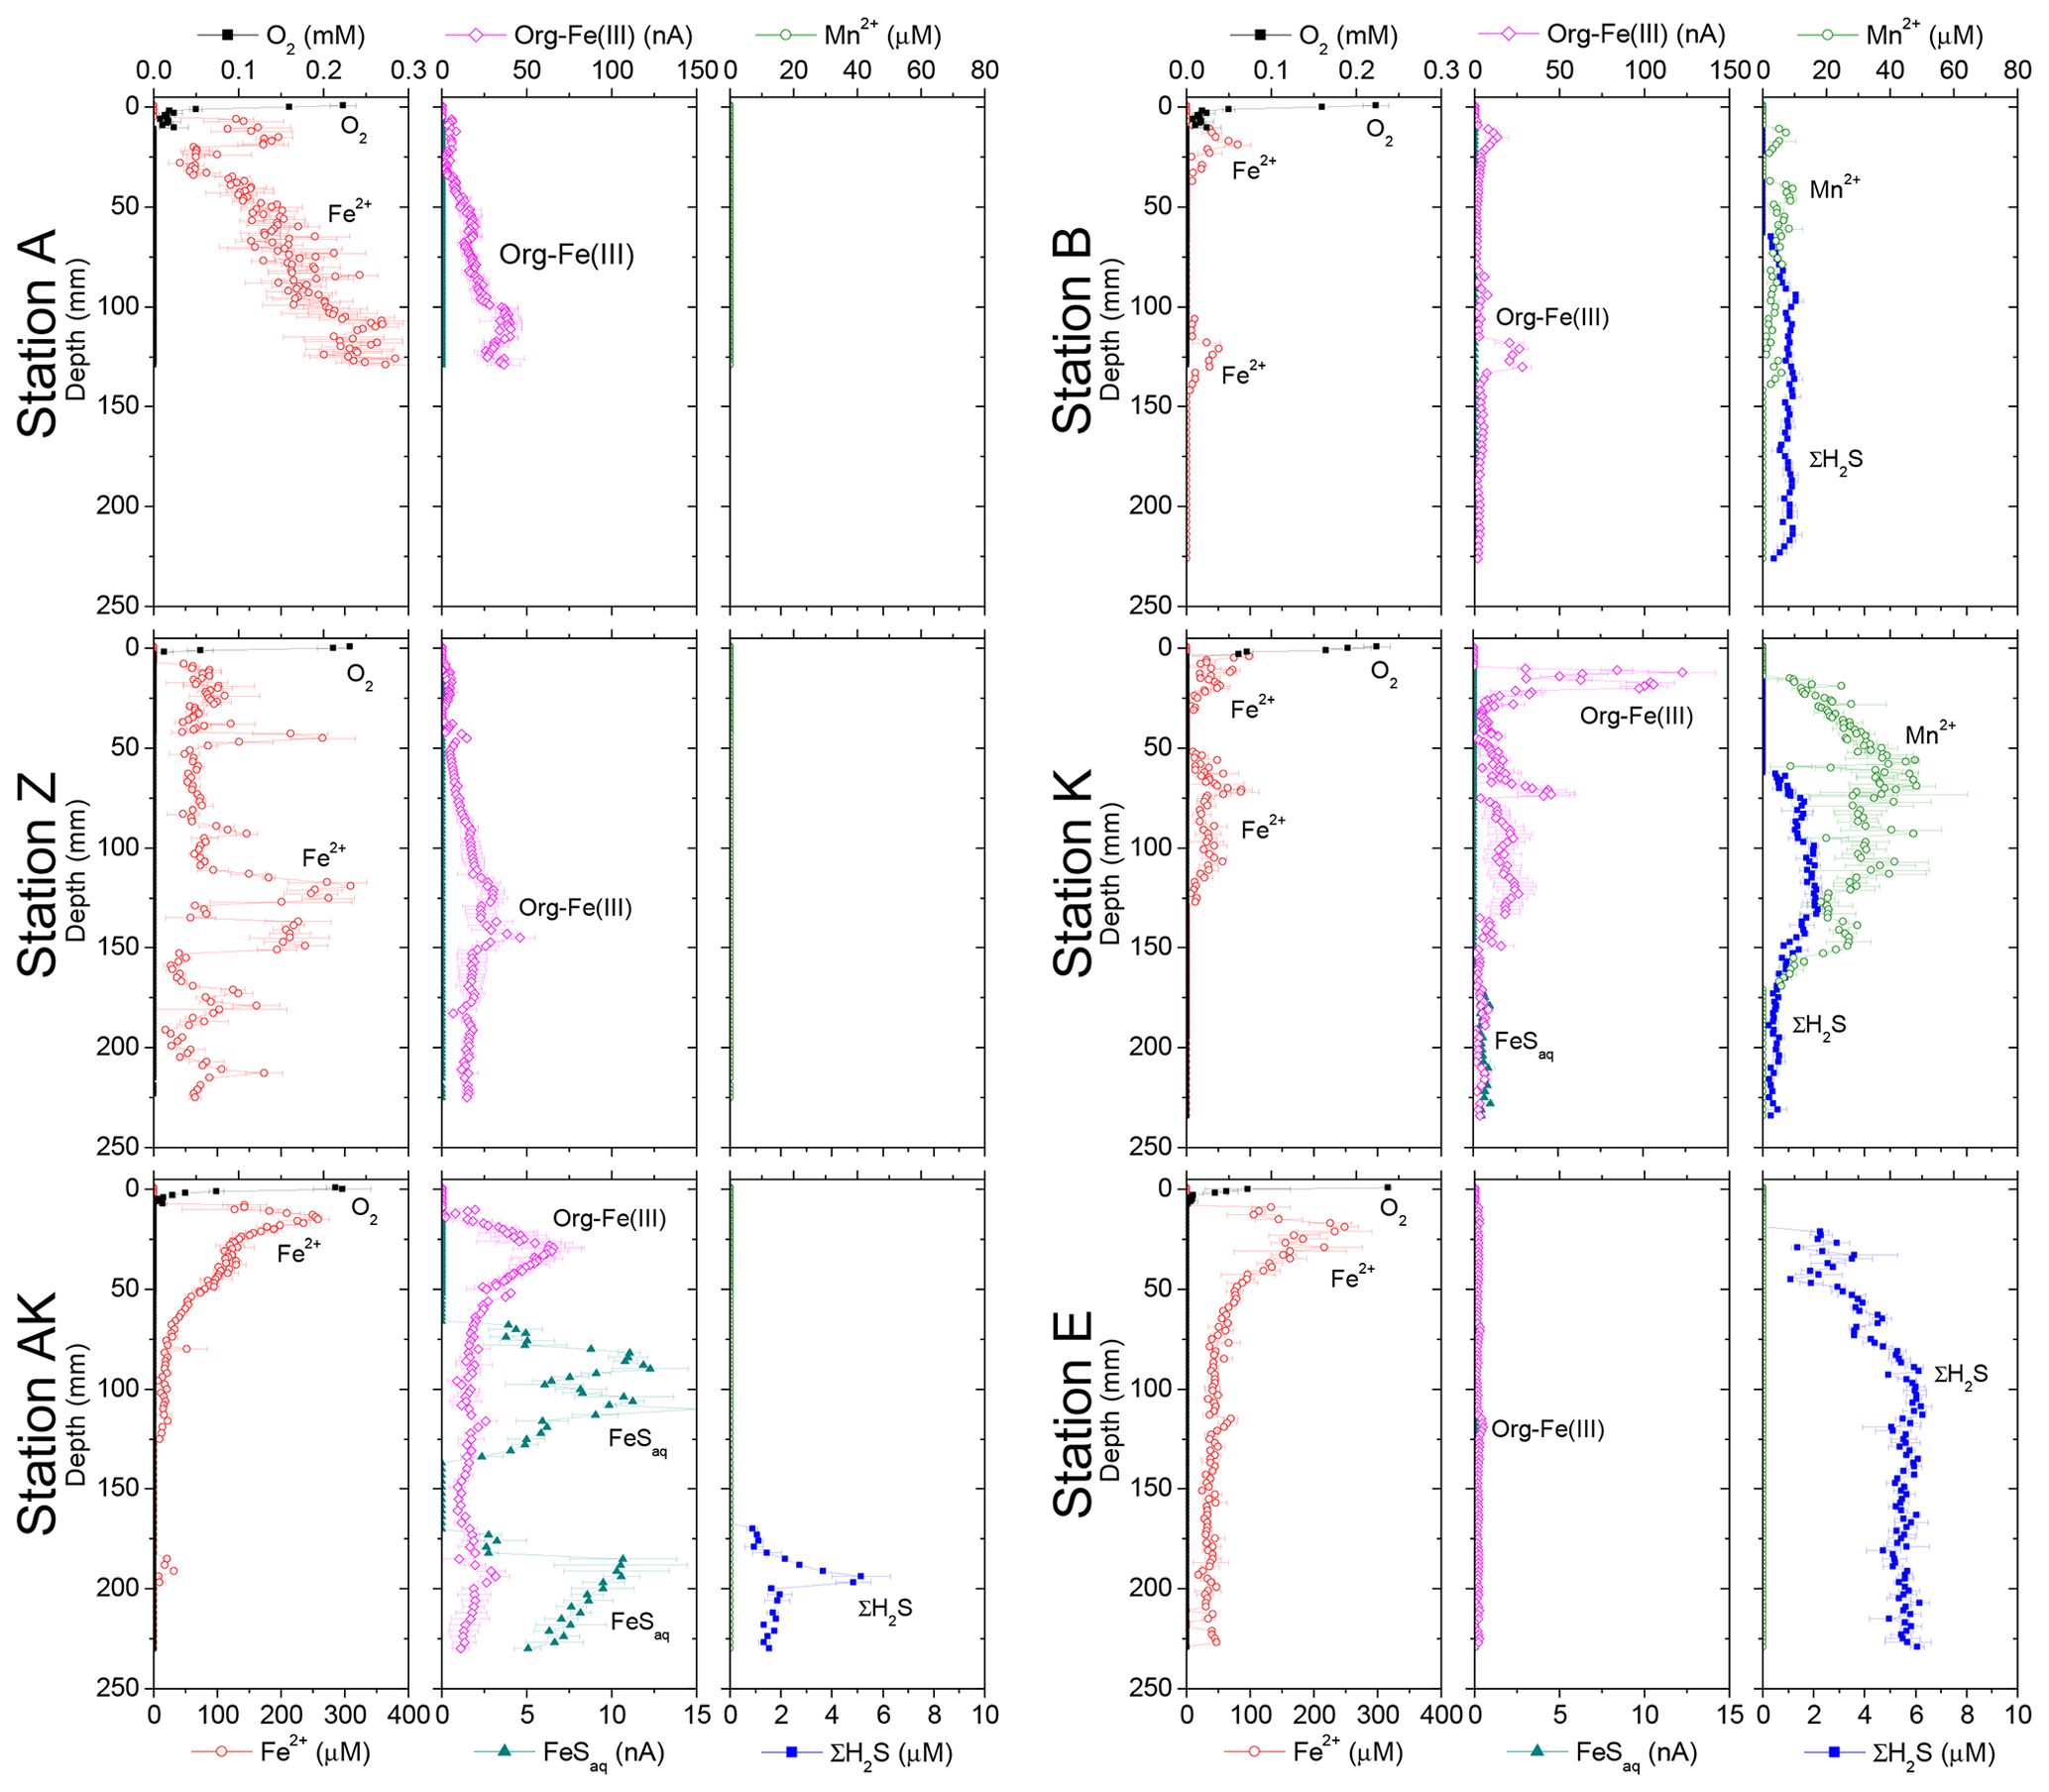
Figure 4Depth profiles of dissolved O2, Mn2+, Fe2+, org-Fe(III), FeSaq and ΣH2S concentrations measured electrochemically in intact sediment cores at stations A, Z, AK, K, B and E. Org-Fe(III) and FeSaq are reported in normalized current intensities (nA).
3.4 Geochemical characteristics of the pore waters and sediments
In general, the pore water geochemical composition of duplicate cores collected at each station matched well, except at stations A and Z, where some variations in TA, DIC and sulfate concentrations provide evidence for the heterogeneity of deposition processes in the proximal domain (Fig. 5). Both TA and DIC concentrations increased rapidly within the pore waters, likely reflecting the intensity of organic carbon mineralization rates in these sediments. At all stations, DIC pore water concentrations correlated well with TA (overall slope: 1.01±0.006, r2=0.995, n=134). The TA and DIC gradients were highest at stations A and Z, where maximum concentrations of both species reached around 55 mM (Fig. 5). At station AK, TA and DIC concentrations reached a maximum of 15 mM at 25 cm depth but decreased to 6 mM at the bottom of the core. The maximum concentrations of TA and DIC of 35 mM observed at station B were more comparable to the stations in the vicinity of the river mouth (stations A and Z) than other stations located in the prodelta domain (stations AK and K). At station K, TA and DIC concentrations reached 10 mM, whereas the lowest TA and DIC gradients were measured at station E, with concentrations reaching only 4.6 mM at the bottom of the cores (30 cm). Sulfate was completely removed from the pore waters at depths of 35, 24 and 45 cm at station A, Z and B, respectively (Fig. 5). In turn, sulfate concentrations decreased to a minimum concentration of 20 mM at 29 and 24 cm depth at stations AK and K, whereas sulfate consumption was much smaller at station E with a minimum concentration of 28 mM (bottom water sulfate concentration was 31.4 mM). As a result, TA and DIC changes in concentration at a given depth were highly inversely correlated (r2>0.98) with sulfate changes in concentration at stations A, Z, AK, B, and K (Table 3). At station E, sulfate variations with depth were limited and the uncertainty on was too large to calculate rAS and rDS. TA and DIC demonstrated strong correlations (r2>0.97) at stations A, Z, AK, B, and K (Table 3). In the proximal domain (stations A and Z), ammonium increased with sediment depth to concentrations >3 mM (Fig. 5). At station B, ammonium reached concentrations >2 mM with depth, whereas ammonium concentrations did not exceed 1.5 mM at station AK, 0.6 mM at station K and 0.3 mM at station E. Even though individual pore water profiles from replicate sampling (pore waters from two different cores were sampled and analyzed for DIC, TA, and at each station) were slightly different at some stations, the rAD, rAS and rDS ratios were the same. At all stations, nitrite plus nitrate concentrations were less than 20 µM (data not shown). Significant methane concentrations (>50 µM) were detected at the bottom of the sediment core at stations A, Z, and AK (Fig. 5), and a SMTZ was tentatively identified between 28 and 39 cm at station A and between 19 and 39 cm at station Z, as the use of pore water data from different cores is not straightforward given the high heterogeneity of sediment deposits in the proximal domain. As methane was <50 µM throughout the profile at station K and sulfate was not completely consumed inside the sediment core at station AK, the SMTZ was not determined at these two stations. Methane analyses were not carried out for the other stations.
Table 3Diffusion-corrected stoichiometric ratios rAD, rDS, and rAS and their corresponding ratios corrected for carbonate precipitation (rADc, rDSc and rASc) along with their associated determination coefficients (r2) from linear regression (n.d. = not determined).
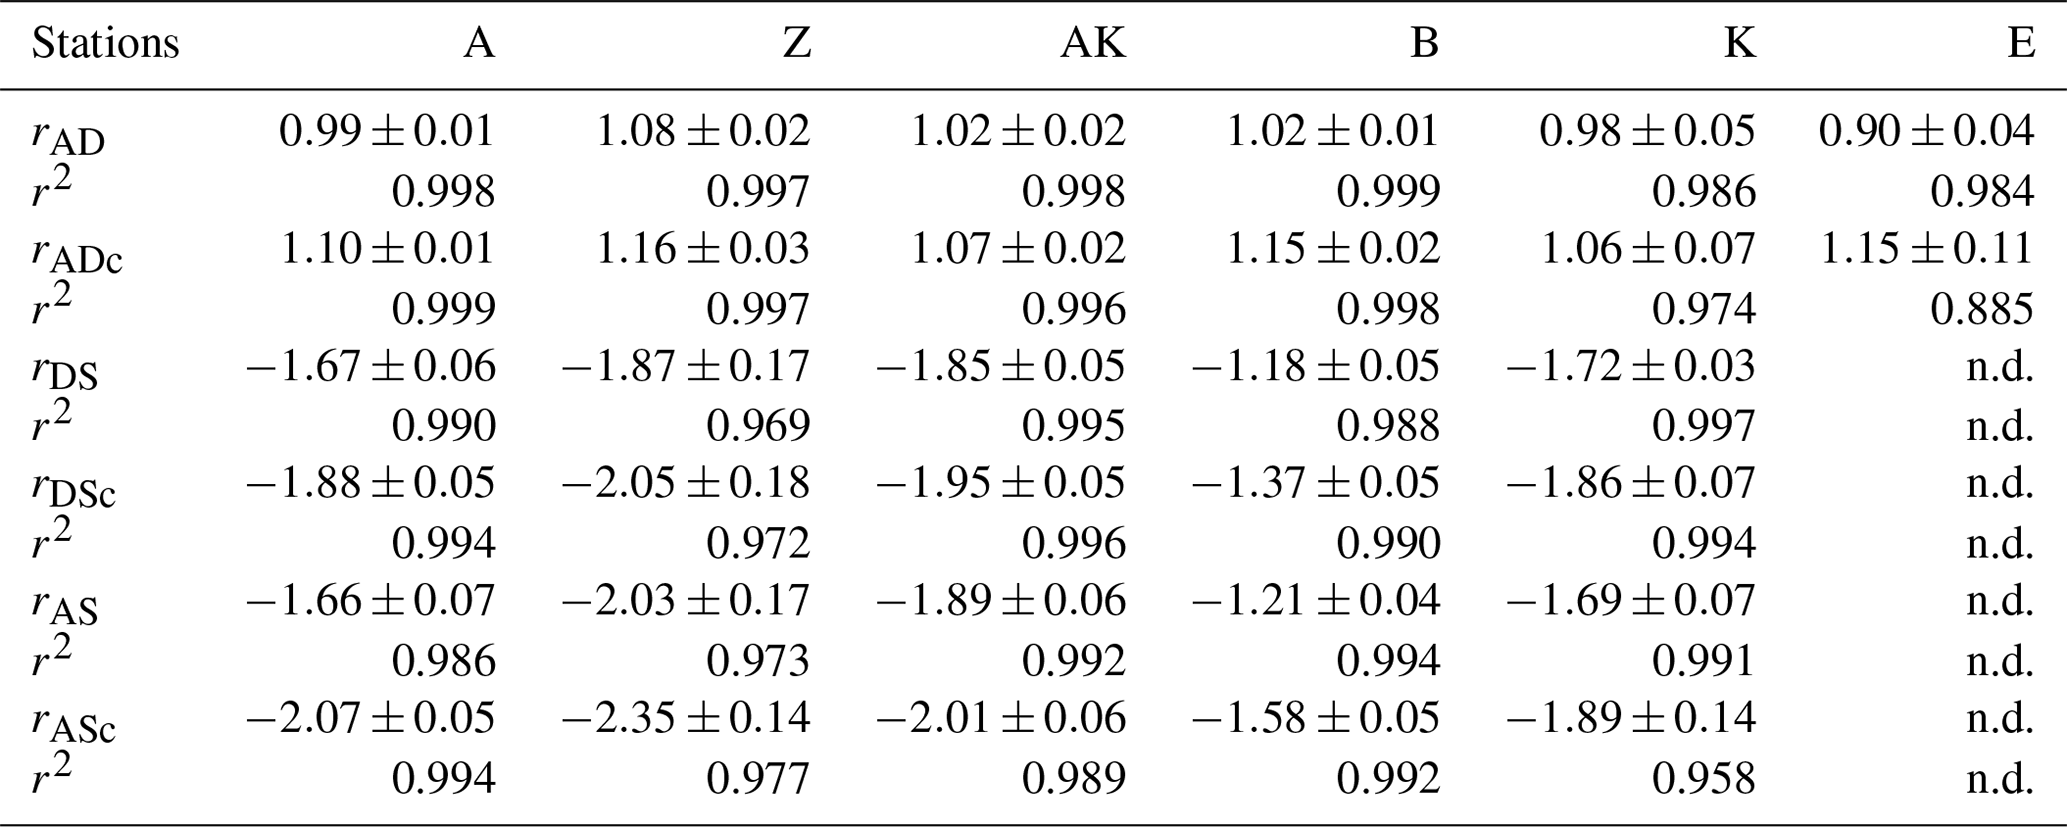
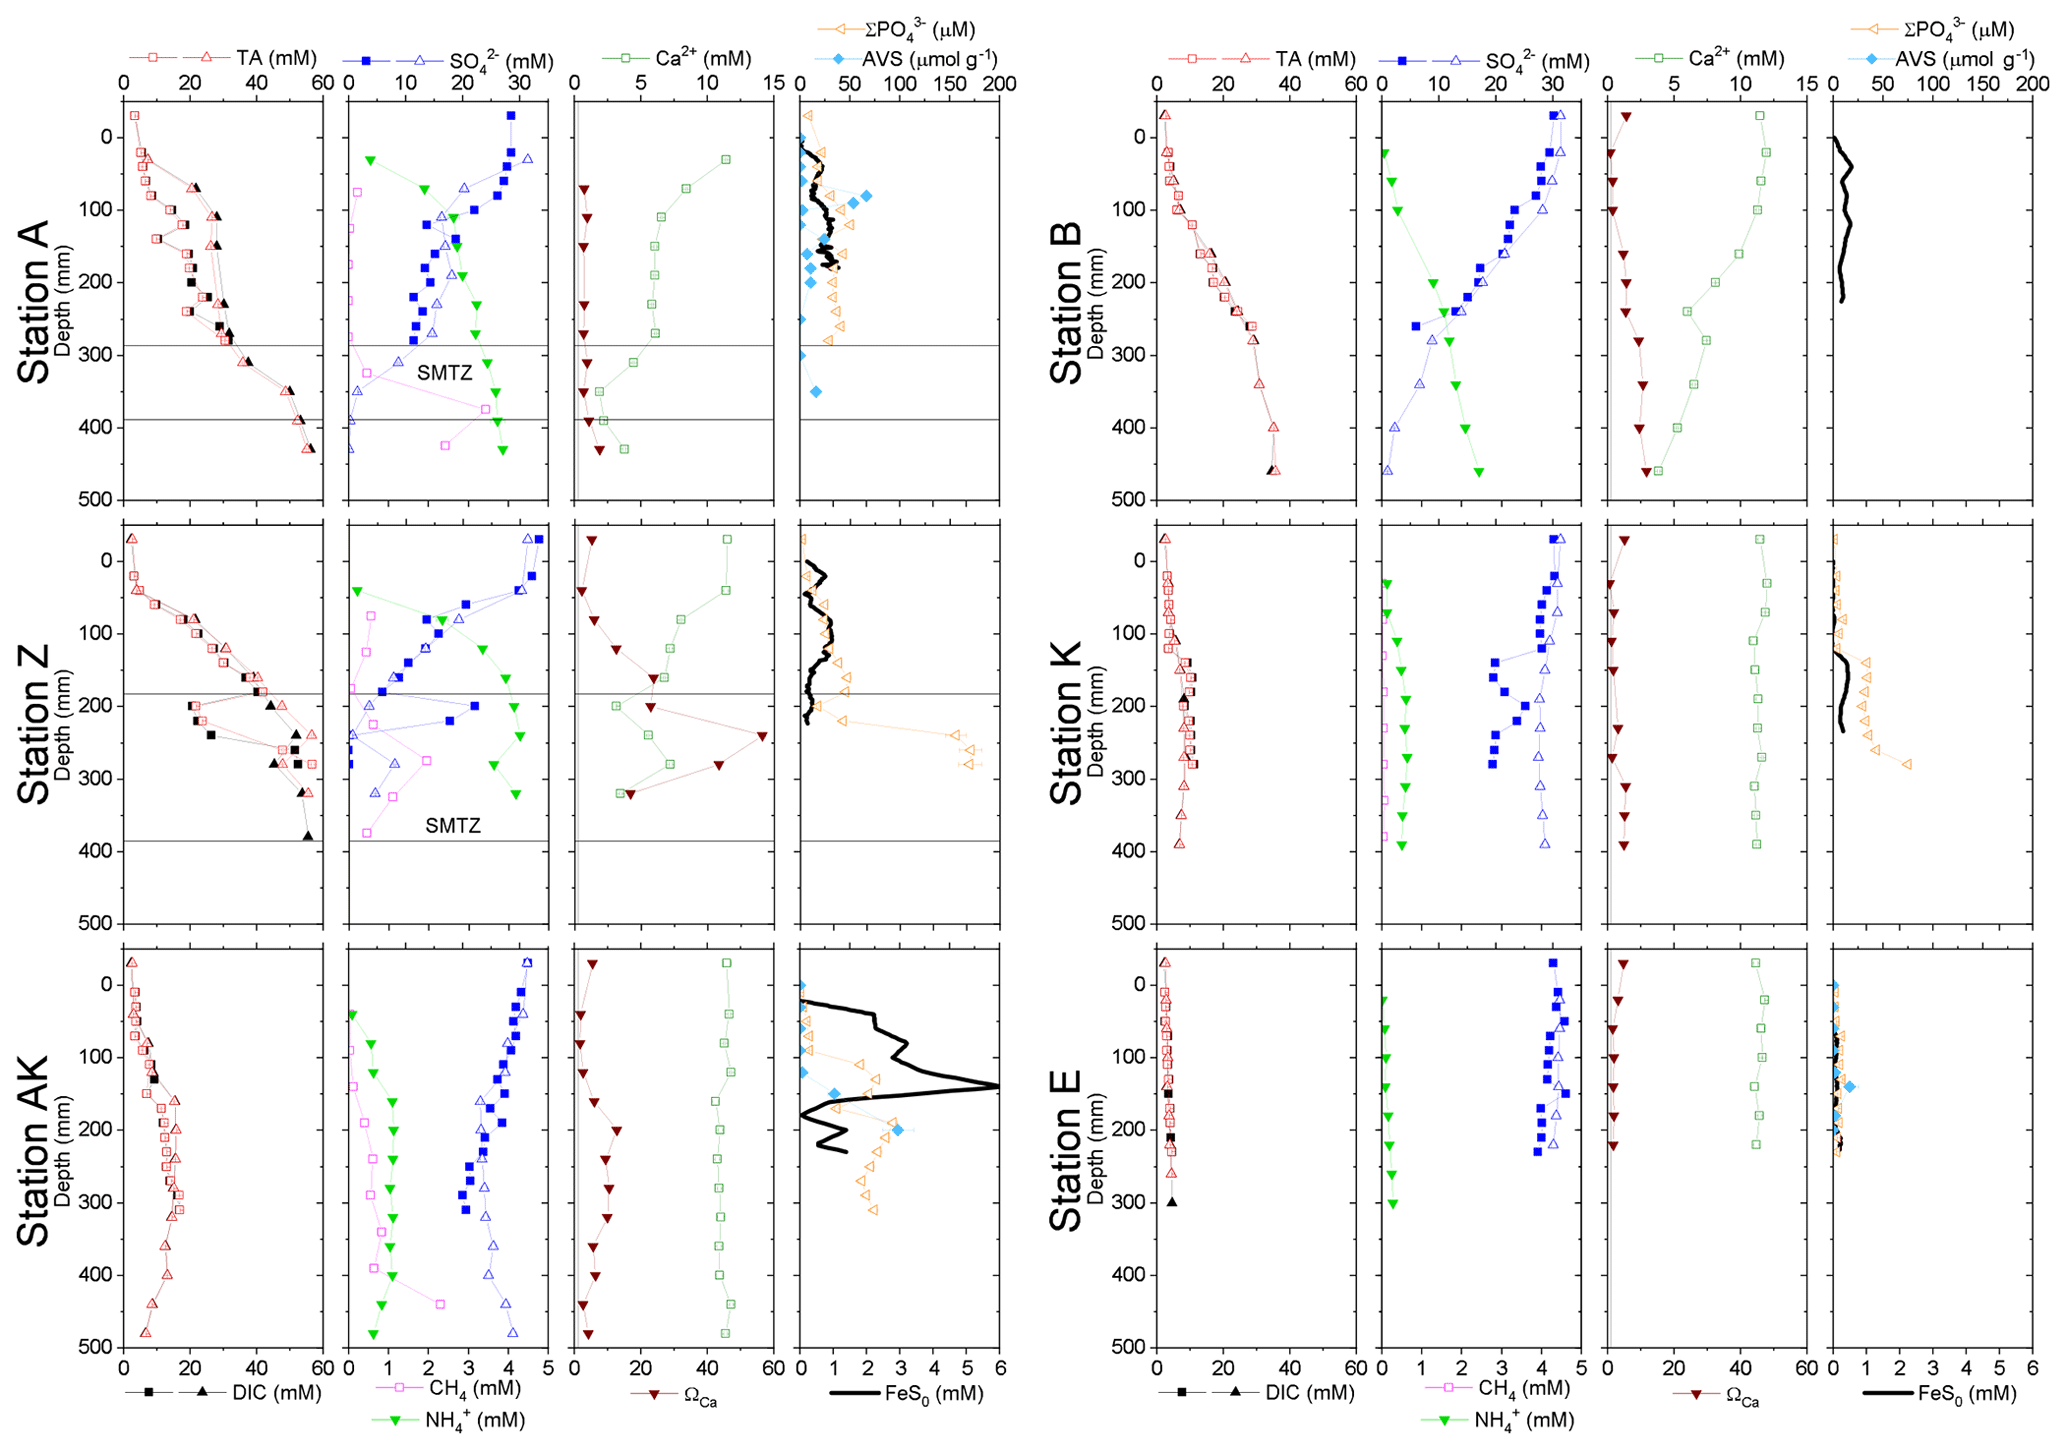
Figure 5Depth profiles of pore water TA, DIC, , , CH4, Ca2+, nanoparticulate FeS (FeS0), and AVS concentrations, along with the calcium carbonate (calcite) saturation state of the pore waters (ΩCa) at stations A, Z, AK, K, B and E. Alternating symbol shapes indicate data collected from duplicate long and short sediment cores. The calcium carbonate (calcite) saturation state (ΩCa) and pore water FeS0 concentrations were calculated, whereas AVS was determined from solid-phase extractions. The two horizontal lines identify the sulfate–methane transition zone (SMTZ) found at stations A and Z. Error bars represent standard deviations of multiple measurements for the concentrations and error propagation for Ω. Concentrations of CH4 were not measured at stations B, K and E.
The sediment pore waters were supersaturated with respect to calcite (ΩCa>1) at all stations and supersaturated with respect to aragonite except for the surface at stations B and K. At stations A, Z and B, decreasing Ca2+ concentrations in the pore waters indicated precipitation of CaCO3, whereas Ca2+ concentrations remained close to the bottom water Ca2+ concentrations (11.2 mM in Mediterranean waters) at the other stations (Fig. 5). Dissolved phosphate concentrations () were relatively high (50–100 µM) throughout the profiles at stations A, AK, K and Z, and a large increase in concentration (up to 160 µM at station Z) was observed at station AK, K and Z between 15 and 22 cm. In turn, production was minimal in station E pore waters (<10 µM). Dissolved phosphate was not measured at station B. Sediment samples were analyzed for AVS as a function of depth at stations A, AK and E to assess one station in each domain (Fig. 5). At station A, a peak in AVS (65 µmol g−1) was measured around 8.0 cm followed by a second, smaller peak (22 µmol g−1) at 14 cm, after which AVS decreased with depth. The AVS concentrations were low in the top portion of the sediment at station AK but increased with depth to 100 µmol g−1 around 15 cm. At station E, only a small AVS peak of 20 µmol g−1 was observed at 14 cm. Finally, large concentrations of FeS nanoparticles (FeS0) were found in the proximal and prodelta stations, including two broad peaks and maximum concentrations around 1 mM at stations A and Z and a large subsurface maximum up to 6 mM at 145 mm at station AK. These FeS0 concentrations increased as a function of depth to a relatively constant 0.5 mM below 4.5 cm at station B and below 12 cm at station K, whereas they remained mostly negligible at station E (Fig. 5).
The main objectives of this study were to determine the magnitude of the alkalinity source from deltaic region sediments exposed to large riverine inputs and to identify the biogeochemical processes responsible for the observed benthic TA and DIC net production. In this section, benthic TA and DIC fluxes in the Rhône River prodelta are first compared to other similar systems. In the following sections, the most likely biogeochemical processes responsible for the high benthic TA fluxes are identified based on the sediment depth profiles collected. As calcium carbonate dissolution, denitrification, and organic alkalinity can be discarded as major TA sources from these sediments (see discussion below), the role of iron sulfide mineral precipitation on the benthic TA flux is examined using a variety of analytical techniques, speciation calculations and a mass balance approach. Finally, the link between inputs to the sediment, carbon mineralization processes, sulfide mineral burial, and the benthic TA flux is provided using a conceptual model.
4.1 DIC and alkalinity fluxes from the sediment
The sediments of the Rhône proximal and prodelta zones represent important sources of both DIC and TA to the bottom waters (Fig. 3). The observed fluxes show some variability between stations in the proximal zone, most probably due to the high inter- (i.e., kilometer scale between stations A and Z) and intra-station (i.e., <100 m between Z and Z′) biogeochemical heterogeneities associated with massive and rapid deposition events during floods. This heterogeneity is also visible in pore water profiles from two different cores at station Z or A (Fig. 5). Despite this sub-kilometer variability near the river mouth, the biogeochemical gradient from the proximal zone to the continental shelf is large enough to contrast the different zones. The DIC fluxes observed in the proximal domain (18–78 mmol m−2 d−1 at station A and Z; Fig. 3) are in the range of previously measured fluxes in other deltas where anaerobic mineralization processes are dominant, including Mississippi delta sediments from core incubations (15–20 mmol m−2 d−1; Lehrter et al., 2012) or benthic chambers (36–53 mmol m−2 d−1; Rowe et al., 2002), benthic chamber measurements in Po River delta sediments and the Adriatic shelf (15–25 mmol m−2 d−1; Hammond et al., 1999), the Fly River delta during the most active season (35–42 mmol m−2 d−1; Aller et al., 2008) and near the Guadalquivir River estuary (36–46 mmol m−2 d−1; Ferron et al., 2009). In contrast, fewer alkalinity fluxes were measured in river deltas, though those obtained from benthic chambers in the Danube and Dniester deltas in the northwestern Black Sea (21–67 mmol m−2 d−1; Friedl et al., 1998) are within the range of values reported in this study (14–74 mmol m−2 d−1). Benthic TA fluxes obtained in the Guadalquivir estuary (24–30 mmol m−2 d−1; Ferron et al., 2009) and the Adriatic shelf sediments off the Po River delta (0.5–10.4 mmol m−2 d−1; Hammond et al., 1999) are in the lower range of TA fluxes measured in the present study, likely because the sampling stations were located further on the shelf. The biogeochemical origin of these TA benthic fluxes is discussed in the next sections.
4.2 Production of alkalinity by calcium carbonate dissolution and denitrification in coastal marine sediments
Calcium carbonate dissolution, denitrification from imported nitrate, and burial of FeS or FeS2 following iron hydroxide and sulfate reduction produce significant alkalinity in coastal marine sediments that may be transferred to the overlying waters (Hu and Cai, 2011a). In this section we examine if the first two processes contribute to the observed TA fluxes in the Rhone delta area.
Calcium carbonate dissolution may occur immediately below the SWI as a result of the acidity generated by aerobic respiration, and may thus represent a possible contributor to TA fluxes as demonstrated in carbonate-rich permeable sediments (e.g., Burdige and Zimmerman, 2002; Cyronak et al., 2013; Rao et al., 2014). As about 95 % of the CaCO3 minerals in this area are made of calcite (Rassmann et al., 2016), the discussion is focused on this phase, but the calculations have also been made for aragonite. In the proximal zone, both the water column (ΩCa=5.5) and the pore waters at depth (ΩCa>1) are largely supersaturated with respect to calcite and aragonite (Rassmann et al., 2016; Fig. 5) suggesting that carbonate mineral dissolution is not significant. These findings are corroborated by a large decrease in Ca2+ concentration in the pore waters, indicating instead CaCO3 precipitation at depth in proximal zone sediments. Yet, the large pH decrease in the first millimeters below the sediment–water interface (Fig. 2) may induce carbonate dissolution at this scale. Calcium carbonate saturation states at a millimeter scale near the SWI were calculated from pH profiles and interpolation of the centimeter-scale DIC profiles using the Seacarb software (Fig. 6). These calculations show that in the proximal zone, the saturation state with respect to calcite is always above 1.5 and always above 1 for aragonite. Such saturation state precludes massive carbonate dissolution at the sediment surface and discounts shallow carbonate dissolution as playing a large role on the benthic alkalinity fluxes observed in proximal sediments. Minor quantities of calcium carbonate or magnesian calcite may be dissolved in micro-niches where the pH could be lower than 7.4. These processes, however, do not visibly imprint the Ca2+ profile (Fig. 5) and surely represent an insignificant fraction of the large TA benthic flux measured in the proximal zone. At the distal shelf station (Station E, Fig. 6c), the saturation state was close to 1 for calcite and slightly undersaturated for aragonite, which may indicate a potential contribution of calcium carbonate dissolution to the benthic alkalinity flux in this area.
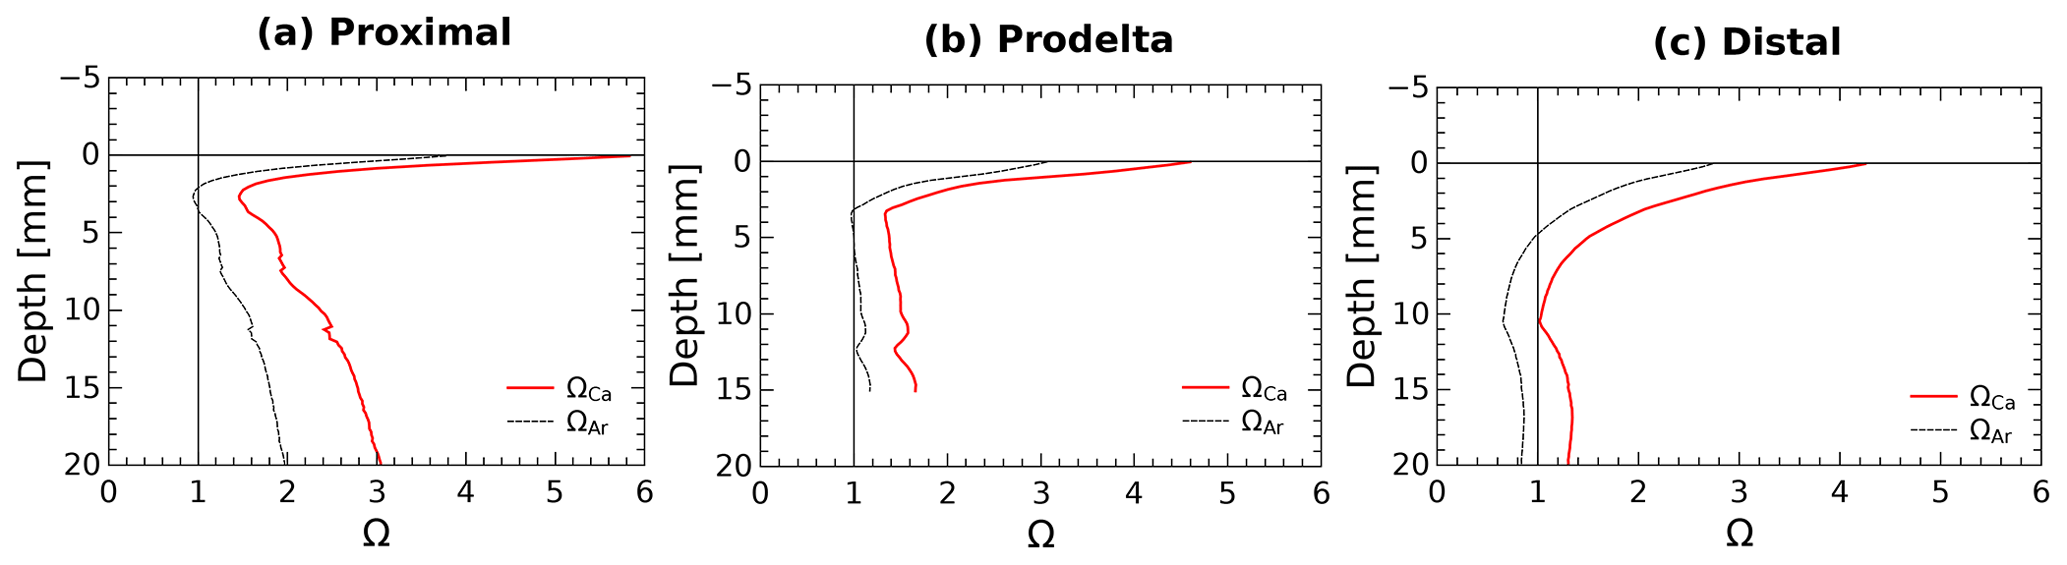
Figure 6Average pore water saturation states with respect to calcite and aragonite in the first centimeter of the sediment at stations: (a) proximal (St. A, Z), (b) prodelta (St. K), and (c) distal (St. E) calculated using the DIC gradients at the SWI together with the average measured pH micro-profiles.
As coupled nitrification–denitrification is neutral to TA net production, denitrification based on an external source of nitrate represents the second potential net source of TA in marine sediments (Hu and Cai, 2011b). In the Rhône prodelta, the stratification of the water column prevents large inputs of riverine nitrate to bottom waters, as evidenced by their high salinity (Table 2) and low nitrate concentrations ( µmol L−1; Bonin et al., 2002). Furthermore, nitrate profiles in pore waters generally display a subsurface peak, indicating nitrate efflux, which also prevents benthic denitrification of bottom water nitrate (Pastor et al., 2011). It can therefore be concluded that the contribution of denitrification to TA fluxes is minimal in the sediments of the Rhône River delta.
In the bottom waters, organic alkalinity was estimated from TA, pH and DIC concentrations to represent less than 1 % of TA. In the pore waters, the data set did not allow estimating organic alkalinity directly, but the rAD close to 1 indicates that the organic alkalinity fraction is limited contrarily to previous findings where organic alkalinity plays an important role and rAD ratios >1.3 have been recorded at similar pH (Łukawska-Matuszewska, 2016).
In the next sections, we detail the last process producing alkalinity, i.e., FeS production and burial.
4.3 DIC and TA produced by sulfate reduction
Sulfate reduction typically represents a major organic carbon mineralization pathway in organic-rich sediments that simultaneously produces 2 mol of TA and 2 mol of DIC per mole of sulfate reduced (Table 1, Reaction R6) (Canfield et al., 1993b; Burdige, 2011). Dissimilatory iron reduction (Table 1, Reaction R7) in turn produces 0.25 mol of DIC () and consumes 1.75 mol of H+, resulting in 2 mol of TA produced per mole of Fe. As these two processes equally produce 2 mol of TA per mole of terminal electron acceptor (Table 1, Reaction R6 for and Reaction R7 for Fe(OH)3), they can both contribute significantly to the bulk alkalinity production in sediment pore waters. The low concentration of nitrate, relatively low production of reduced metals in the pore waters (Fig. 4), and intense ammonium and DIC production in parallel with sulfate consumption at depth (Fig. 5) confirm that sulfate reduction is one of the dominant mineralization pathways in the Rhône River prodelta sediments (Pastor et al., 2011; Rassmann et al., 2016). Assuming that sulfate reduction is responsible for the majority of the bulk alkalinity production, experimentally derived stoichiometric ratios of the relative production of DIC and TA compared to sulfate consumption may identify the effect of other reaction pathways responsible for bulk alkalinity production or consumption in these sediments (Burdige and Komada, 2011). Factoring carbonate precipitation using pore water Ca2+ data, the rDSc ranged between −2.05 and −1.86, except for one value at −1.37 (station B), whereas the rASc ratios ranged between −2.35 and −1.89, with the exception of station B at −1.58 (Table 3). Theoretically, the rDS and rAS should equal −2.0 if sulfate reduction is the only control on DIC and TA production (Table 1, Reaction R6), suggesting that, except at station B, the influence of other diagenetic processes on rASc and rDSc is limited. At station B, however, the higher rDSc ratio (Table 3) may indicate significant anaerobic oxidation of methane (AOM Table 1, Reaction R8), which generates a theoretical rDS of −1 (Borowski et al., 1996; Komada et al., 2016). Unfortunately, methane sampling was not performed at station B, preventing precise identification of AOM at this station.
4.4 Formation of iron sulfide species
Although the complete depletion of sulfate in the first 30 cm of the sediment at stations A, Z and B implies an equivalent production of dissolved sulfide (ΣH2S) (Table 1, Reaction R6), pore waters displayed little to no ΣH2S (Fig. 4). If all of the produced ΣH2S diffused upward and reacted in the oxic sediment layers, the alkalinity produced by sulfate reduction would be consumed by the oxidation of ΣH2S by dissolved O2 and the pH should be lowered significantly given the large acidity generated by this reaction (Table 1, Reaction R4). Although ΣH2S was nearly absent of pore waters (Fig. 4), the pH minimum was never lower than 7.2 and the observed alkalinity fluxes across the SWI were substantial (Fig. 3), indicating that ΣH2S was removed from the pore waters below the oxic layer. Abiotic reduction of Fe(III) oxides by ΣH2S (Table 1, Reaction R9), followed by precipitation of FeS in the anoxic zone (Table 1, Reaction R10; Berner, 1970; Pyzik and Sommer, 1981; Carman and Rahm, 1997; Soetaert et al., 2007), and eventually formation of pyrite (Table 1, Reaction R11; Rickard and Luther, 1997) may represent a significant ΣH2S removal pathway. As the precipitation of siderite is too slow to compete with FeS precipitation (Jiang and Tosca, 2019; Pyzik and Sommer, 1981) and the abiotic reduction of Fe(III) oxides by ΣH2S coupled with either FeS or FeS and pyrite precipitation (Table 1, Reactions R9–R11) does not alter alkalinity overall, bacterial sulfate reduction followed by abiotic precipitation of iron and sulfide from the pore waters to either FeS or pyrite (Table 1, Reactions R12 and R13) should result in rAD=1 and . Formation of pyrite is accompanied by the consumption of molecular H2 by sulfate-reducing bacteria, resulting in a slight increase in the rAD and rDS to 1.1 and −1.81 for the overall reaction, while the rAS ratio should not change (Table 1, Reaction R14).
The observed range of rADc (1.06 to 1.15) and rDSc (−2.05 to −1.86) ratios in the proximal and prodelta stations, except at station B (Table 3), is fully compatible with sulfate reduction coupled to iron reduction and FeS precipitation (possibly followed by pyritization), though rADc and rDSc ratios are not able to distinguish abiotic and microbial pathways of iron reduction. Indeed, the concomitant production of Fe2+ by dissimilatory iron reduction (Table 1, Reaction R7) and ΣH2S by sulfate reduction followed by precipitation of FeS decreases the net rAD and rDS ratios to 0.89 and −2.25, whereas the rAS ratio remains at −2 (Table 1, Reaction R15). With ensuing formation of pyrite, theoretical mole ratios change slightly to rAD=0.94 and without H2 reoxidation (Table 1, Reaction R16) or 1.06 and −1.89 with H2 reoxidation (Table 1, Reaction R17). The occurrence of dissimilatory iron reduction in the proximal and prodelta domains, however, is substantiated by several other pieces of evidence. First, the production of soluble organic-Fe(III) complexes deeper than the oxygen penetration depths (Fig. 4) indicates that these species did not result from the oxidation of Fe2+ by dissolved O2 in the presence of organic ligands (Taillefert et al., 2000). Second, as soluble organic-Fe(III) complexes are produced as intermediates in the reduction of Fe(III) oxides by iron-reducing bacteria (Taillefert et al., 2007; Jones et al., 2010), their concomitant detection with Fe2+ at all stations in the proximal and prodelta domains (Fig. 4) suggests they were produced during dissimilatory iron reduction. Third, the positive correlation between the current intensities of organic-Fe(III) complexes and Fe2+ concentrations is in line with the same correlation obtained in iron-rich deep-sea sediments (Fig. 7) where sulfate reduction was not significant (Beckler et al., 2016). Finally, as these organic-Fe(III) complexes are readily reduced by ΣH2S (Taillefert et al., 2000), their presence in zones of sulfate reduction suggests these sediments are biogeochemically dynamic with periods of microbial iron reduction followed by sulfate reduction and rapid FeS precipitation that culminates in spring and summer. These dynamics may be temporally initiated by the input of organic and inorganic material from the Rhône River in the proximal domain during major floods in late fall and winter, which generates, during spring and summer, large DIC and TA concentrations and large iron(II) concentrations and completely exhausts sulfate at depth in the pore waters (Pastor et al., 2018) in a reproducible manner over the years.
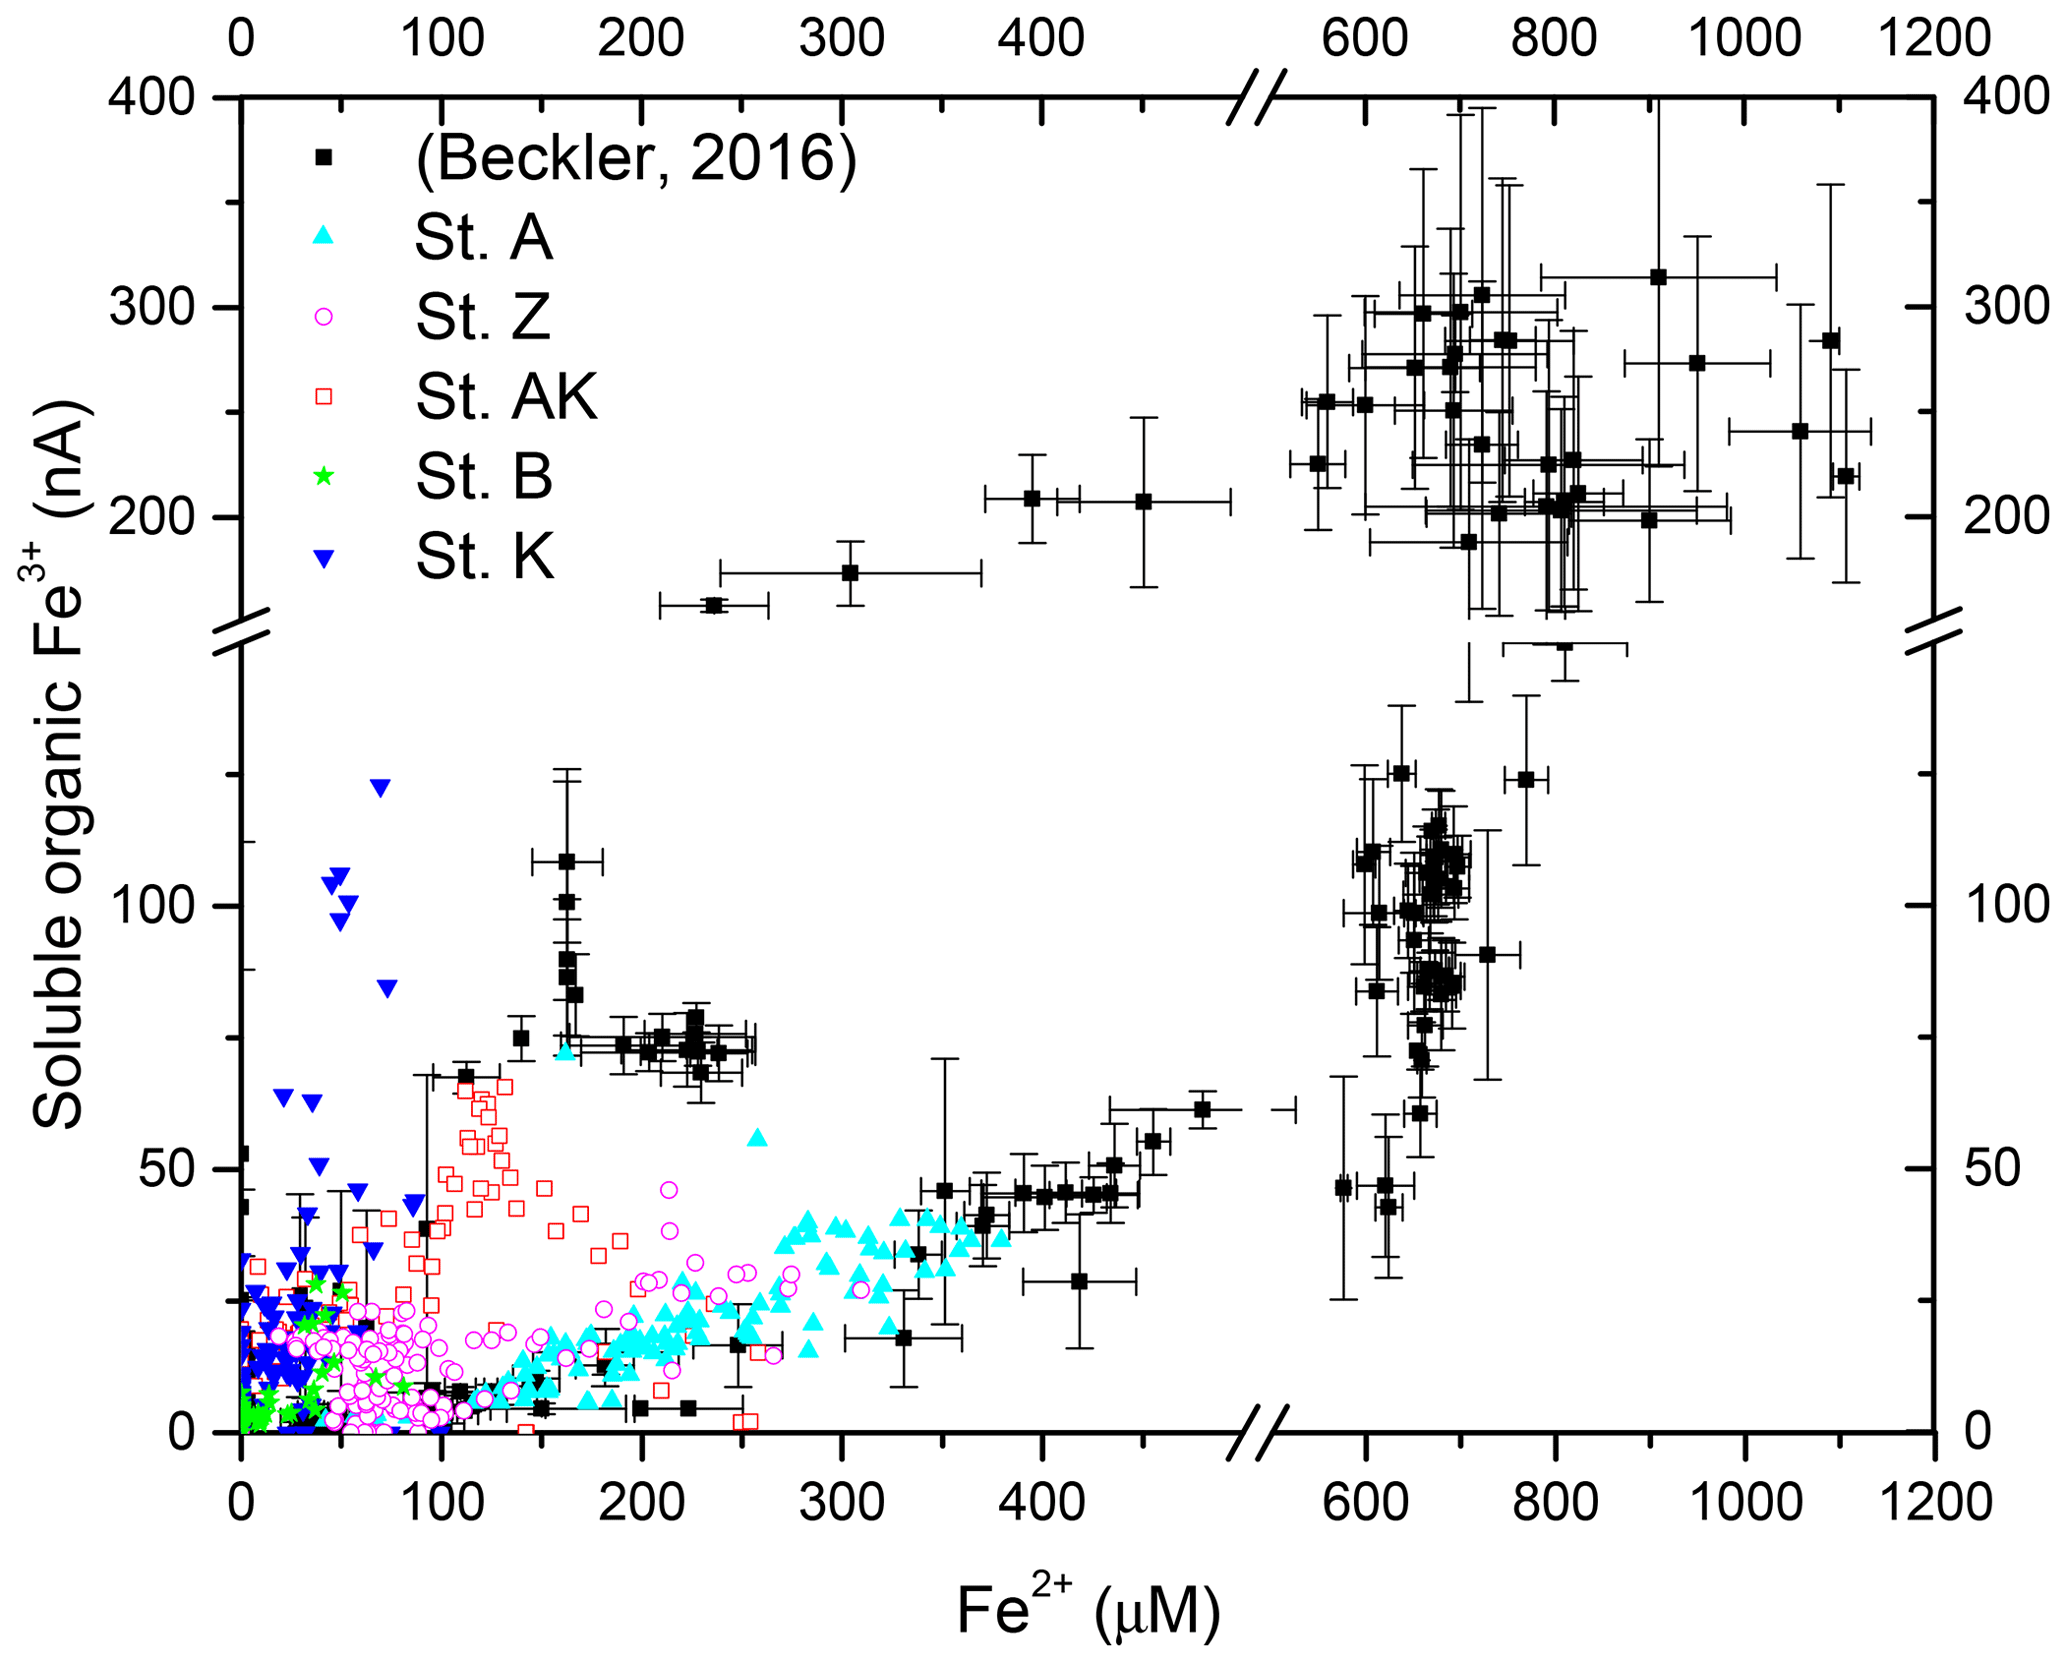
Figure 7Current intensities of organic-Fe(III) complexes as a function of Fe2+ concentrations measured at each depth at stations A, Z, AK, B and K compared to the same data obtained from iron-rich deep-sea sediments (Beckler et al., 2016).
4.5 FeS precipitation
The discrepancy between sulfate consumption and the low concentration of ΣH2S along with the high benthic TA fluxes clearly suggests that much of the sulfide was precipitated in the solid phase. Indeed, AVS measurements show precipitation of FeS in the proximal and prodelta domains (Fig. 5). In addition, the large phosphate concentrations observed at depth in the proximal and prodelta domains (Fig. 5) suggest that adsorbed to Fe(III) oxides was released in the pore waters during secondary conversion of Fe(III) oxides to FeS (Anschutz et al., 1998; Rozan et al., 2002). More importantly, large concentrations of nanoparticulate FeS (FeS0 in the range of 1–6 mM) were identified in the proximal and prodelta stations and decreased with distance from shore (Fig. 5). The existence of FeS0 suggests that large fractions of Fe2+ and ΣH2S were actively removed from the pore waters at the time of measurements and eventually immobilized under the form of sulfide minerals. Although soluble FeSaq clusters detected electrochemically when the system is supersaturated with respect to FeS (Theberge and Luther III, 1997) are considered good indicators of the active precipitation of iron sulfide minerals (Luther and Ferdelman, 1993; Davison et al., 1998; Taillefert et al., 2000), they were rarely observed in the Rhône River delta (Fig. 4). Collectively, the large concentrations of FeS0 compared well with the small electrochemically active FeSaq complexes; the absence of ΣH2S despite complete removal of sulfate along with the generally low saturation state of the pore waters with respect to FeS (Fig. S2) indicate that the proximal stations and some of the prodelta stations were not at equilibrium and that FeS was partly aggregated during this time period.
4.6 Benthic alkalinity flux as a result of iron sulfide burial
As sediments rapidly accumulate in the proximal domain during flood events (Maillet et al., 2006; Cathalot et al., 2010; Zebracki et al., 2015), the burial of FeS becomes irreversible and thus represents a net source of alkalinity to the bottom waters (Berner, 1982; Hu and Cai, 2011a; Brenner et al., 2016). With the precipitation of FeS, about 2 to 3 mol of alkalinity equivalent should be produced for each mole of sulfur precipitated (Table 1, Reactions R12 and R15). Assuming dissimilatory microbial iron and sulfate reduction dominate in the proximal and prodelta zones, a conservative ratio of 2 mol of TA equivalent per mole of FeS precipitated can be estimated (Table 1, Reaction R15). The calculated AVS burial flux provides an alkalinity-equivalent flux of 25.0±7.7 mmol m−2 d−1 in the proximal domain (Table 4), which falls within the range of benthic alkalinity fluxes measured by benthic chamber at stations A and Z (14–74 mmol m−2 d−1; Fig. 3 and Table 4). The connection between alkalinity fluxes at the sediment–water interface and FeS burial at depth is questionable given the low residence time of the sediment near the interface (<1 year in the first 30 cm) and the temporal variability in deposition processes (see Sect. 2.1). Chemical gradients, and thus benthic fluxes, are shaped by biogeochemical reactions occurring within the diffusion length, i.e., the distance (d) that can be traveled by diffusion of chemical species over a given time:
where d is the diffusive length (cm), Ds the diffusion coefficient in the sediment (cm2 s−1) and t the time (s). For a period of 6 months (between fall and spring), using the diffusion coefficient of ( cm2 s−1 at 20 ∘C), the diffusion distance reaches around 15 cm. This distance represents a minimal estimates as transport is likely enhanced by bioturbation and bioirrigation such that 20 cm of sediment and pore water may be considered connected to the SWI on a semiannual basis. These findings indicate that biogeochemical processes over that depth interval are able to shape net benthic alkalinity fluxes at the SWI over a 6-month period after the fall floods (Anschutz et al., 2002). The FeS burial effect is strengthened by the episodic but large deposition of new sediment during the following fall floods.
Table 4Calculated FeS burial fluxes and their TA-equivalent production at each station compared to measured TA benthic fluxes (n.d. = not determined).
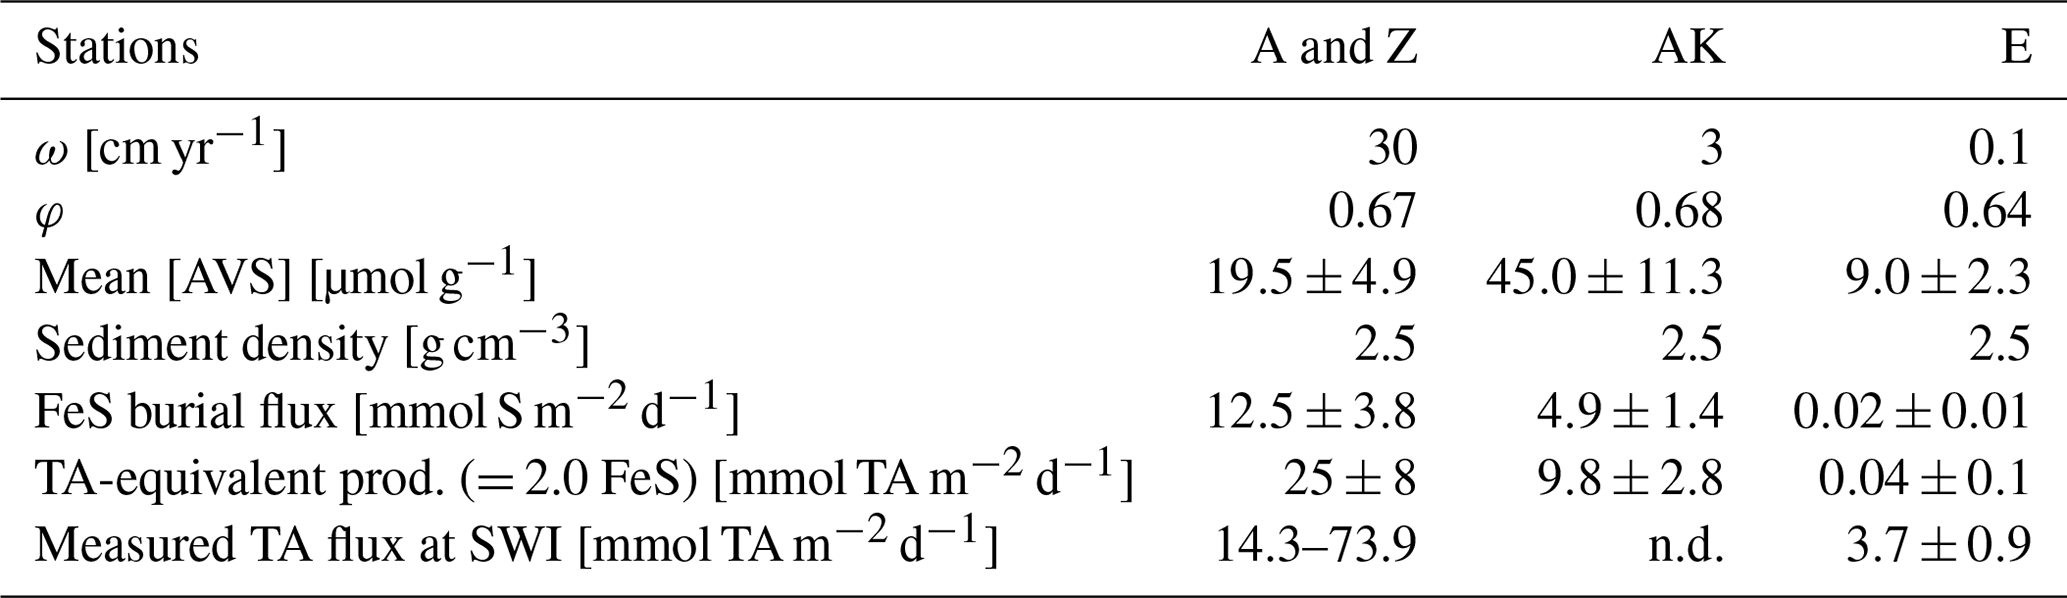
In the prodelta, the alkalinity-equivalent flux resulting from FeS burial is estimated at 9.8±2.8 mmol m−2 d−1 at station AK (Table 4). This, unfortunately, cannot be compared to benthic alkalinity fluxes, as they were not measured. In the distal domain, however, a low alkalinity-equivalent flux of 0.04±0.1 mmol m−2 d−1 is estimated from the average FeS burial flux at station E. This flux is much lower than the 3.7±0.9 mmol m−2 d−1 flux measured by benthic chamber (Fig. 3), a difference that could be due to shallow carbonate dissolution.
4.7 Linking TA and DIC fluxes to mineralization processes
Overall, the present findings indicate that FeS burial modifies the alkalinity budget in the proximal and prodelta sediments (Brenner et al., 2016). As the measured benthic alkalinity fluxes are compatible with the alkalinity generated during the reduction of Fe(III) oxides, sulfate and subsequent FeS burial in the proximal zone, these processes are likely responsible for the large benthic alkalinity fluxes reported in this high-sedimentation delta and, potentially, other similar systems (Hu and Cai, 2011a). Although precipitation of pyrite may also preserve the bulk alkalinity generated in the pore waters, pyrite precipitation is slow enough compared to FeS precipitation (Rickard, 1995; Rickard and Luther, 1997) that it may occur only deeper in the sediment.
The biogeochemical cycling of C, Fe, S, and TA close to the Rhône River mouth can be theoretically summarized as follows (Fig. 8): (i) the high pore water DIC concentrations resulting from the production of metabolic CO2 during organic carbon mineralization lead to benthic DIC fluxes that are only modulated by the precipitation of carbonate minerals. (ii) The high pore water TA concentrations result from intense iron and sulfate reduction as a result of the high supply of organic matter and Fe(III) oxides to the sediment and are limited by the diffusion of sulfate in the sediment. (iii) The precipitation of FeS and the high sedimentation rates near the river mouth preserve the majority of reduced iron and ΣH2S buried in the form of solid FeS minerals and potentially pyrite within the anoxic sediments (Aller et al., 1986). (iv) Ultimately, the TA-consuming reoxidation of reduced metabolites (i.e., , ΣH2S, Fe2+) is not important in the oxic sediment layers, and a significant fraction of the anaerobically produced TA is transferred across the SWI (Fig. 8, red line). (v) Benthic alkalinity fluxes may be sustained on a annual basis, as the large input of sediment to the prodelta during fall floods is followed by the development of anaerobic respiration processes during the spring and summer seasons. In these conditions, anaerobic and aerobic processes are decoupled, and the consumption of oxygen no longer reflects the overall respiration rates within these sediments (Pastor et al., 2011), as observed by the relatively low DOU rates compared to TA and DIC fluxes in the proximal domain (Fig. 3).
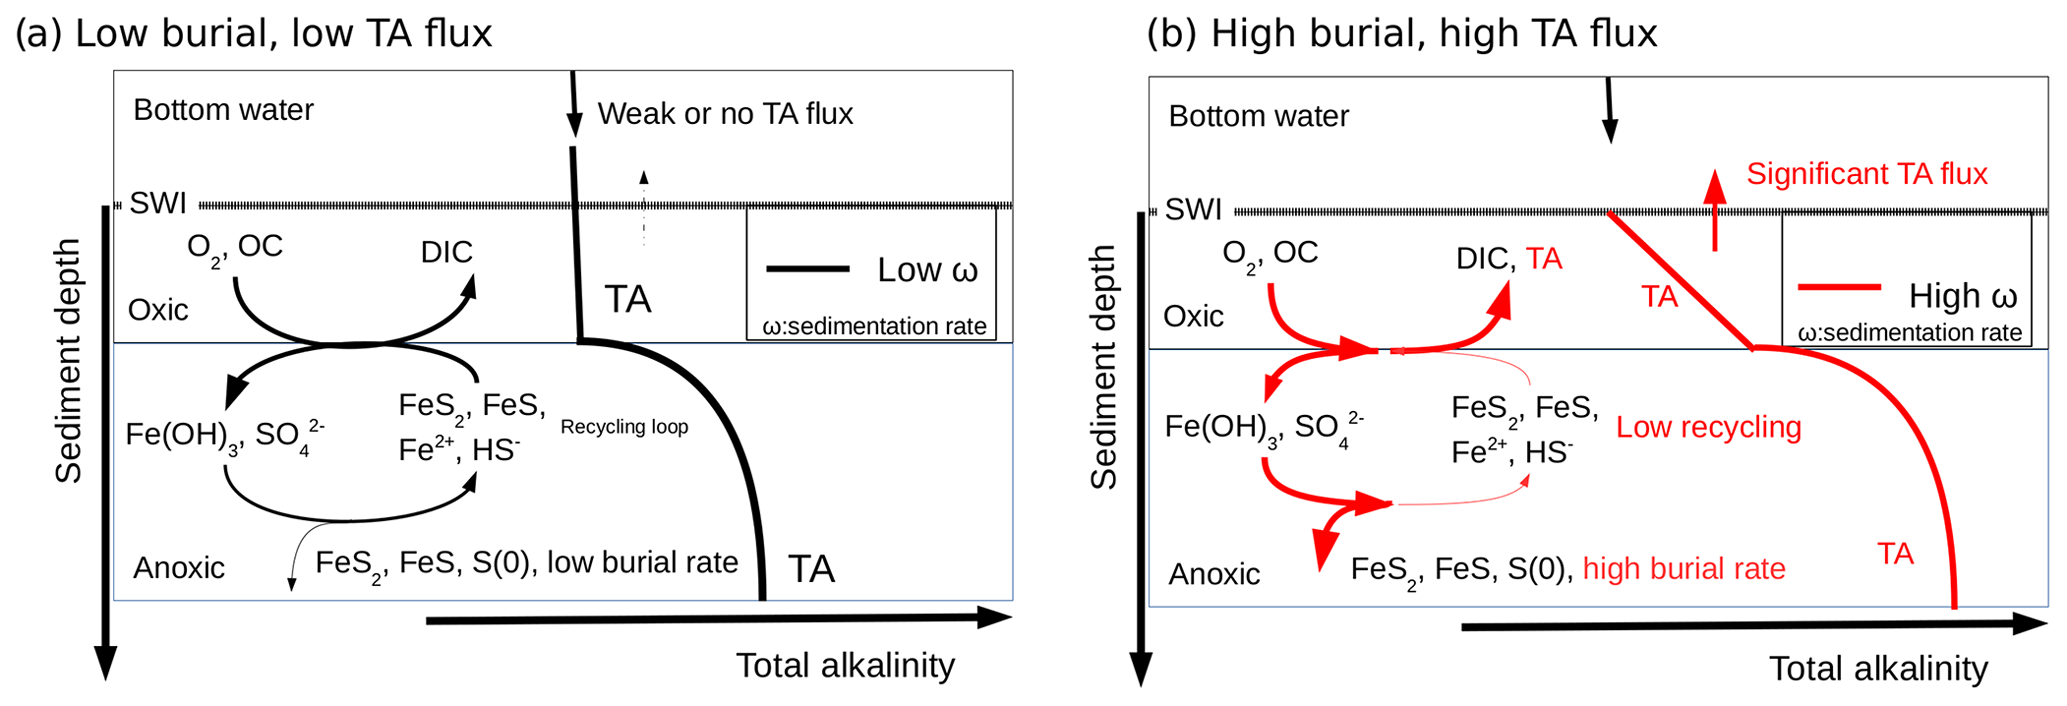
Figure 8Conceptual model for visualizing the link between the burial of iron sulfide minerals and benthic alkalinity fluxes in the case of low sedimentation and OC flux (black) and high sedimentation rates and OC flux (red). The total alkalinity (TA) produced under anaerobic conditions at depth diffuses upwards towards the aerobic sediment layer where it is consumed during reoxidation of Fe2+ and ΣH2S by dissolved oxygen (black). If the precipitation of sulfide minerals is significant, the reduced iron and sulfide metabolites produced during anaerobic respiration are not reoxidized by dissolved oxygen, and the TA produced is able to reach the bottom waters (red). The intensity of the alkalinity flux into the bottom waters is indicated by the thickness of the arrow at the SWI.
In contrast, sedimentation rates (Table 2), overall respiration rates (Fig. 3), and the intensity of iron and sulfate reduction (Fig. 5) decrease in the distal domain (station E), and as a consequence the relative proportion of aerobic processes increases (Pastor et al., 2011). Despite the relatively small decrease in pore water sulfate concentrations with depth and low ΣH2S concentrations (<10 µmol L−1) at the most offshore station E, ΣH2S concentrations were the highest of all the stations. These findings likely reflect the fact that less riverine Fe(III) oxides were available for FeS precipitation and that this system is probably iron limited. With low sedimentation rates (0.1 to 1 cm yr−1), and thus low input of organic matter and Fe(III) oxides, the overall carbon turnover is decreased and the reduced by-products of sulfate and/or iron reduction may be transported back to the oxic sediment layers to be reoxidized by dissolved oxygen (Fig. 8). In this case, the alkalinity generated by anaerobic respiration processes is consumed by reoxidation of the reduced metabolites, and the flux of alkalinity near the SWI decreases to weak values at station E (Figs. 3 and 8, black line).
The strong TA flux to the overlying waters measured in the Rhône River delta may contribute, along with riverine inputs, to the overall high alkalinity of the Gulf of Lion waters compared to the Mediterranean average (Cossarini et al., 2015). However, the influence of the benthic TA flux on the water column pH, and ultimately the absorption of atmospheric CO2, depends mainly on the TA to DIC benthic flux ratio (FTA∕FDIC), vertical mixing in the water column, and thus the residence time of the bottom waters (Hu and Cai, 2011b; Andersson and Mackenzie, 2012). The FTA∕FDIC ratios, ranging between 0.8 and 1 in the proximal and prodelta zones of the Rhône River delta (Fig. 9), are in the high range of a compilation of TA to DIC flux ratios obtained in different coastal systems and continental shelves (expanded from Hu and Cai, 2011b). As these ratios do not exceed 1, alkalinity generated in the sediments will not decrease pCO2 in the bottom waters and thus not draw significant atmospheric CO2 into the coastal ocean. Yet, the large benthic TA fluxes generated from deltaic sediments as a result of the periodic FeS sink in these sediments after large floods will definitely impact water-column TA and carbonate system dynamics on the long term. The elevated FTA∕FDIC ratio (>0.8), which were unknown in the Rhône River prodelta before this study, will therefore modify the carbonate cycle paradigm in these coastal regions.
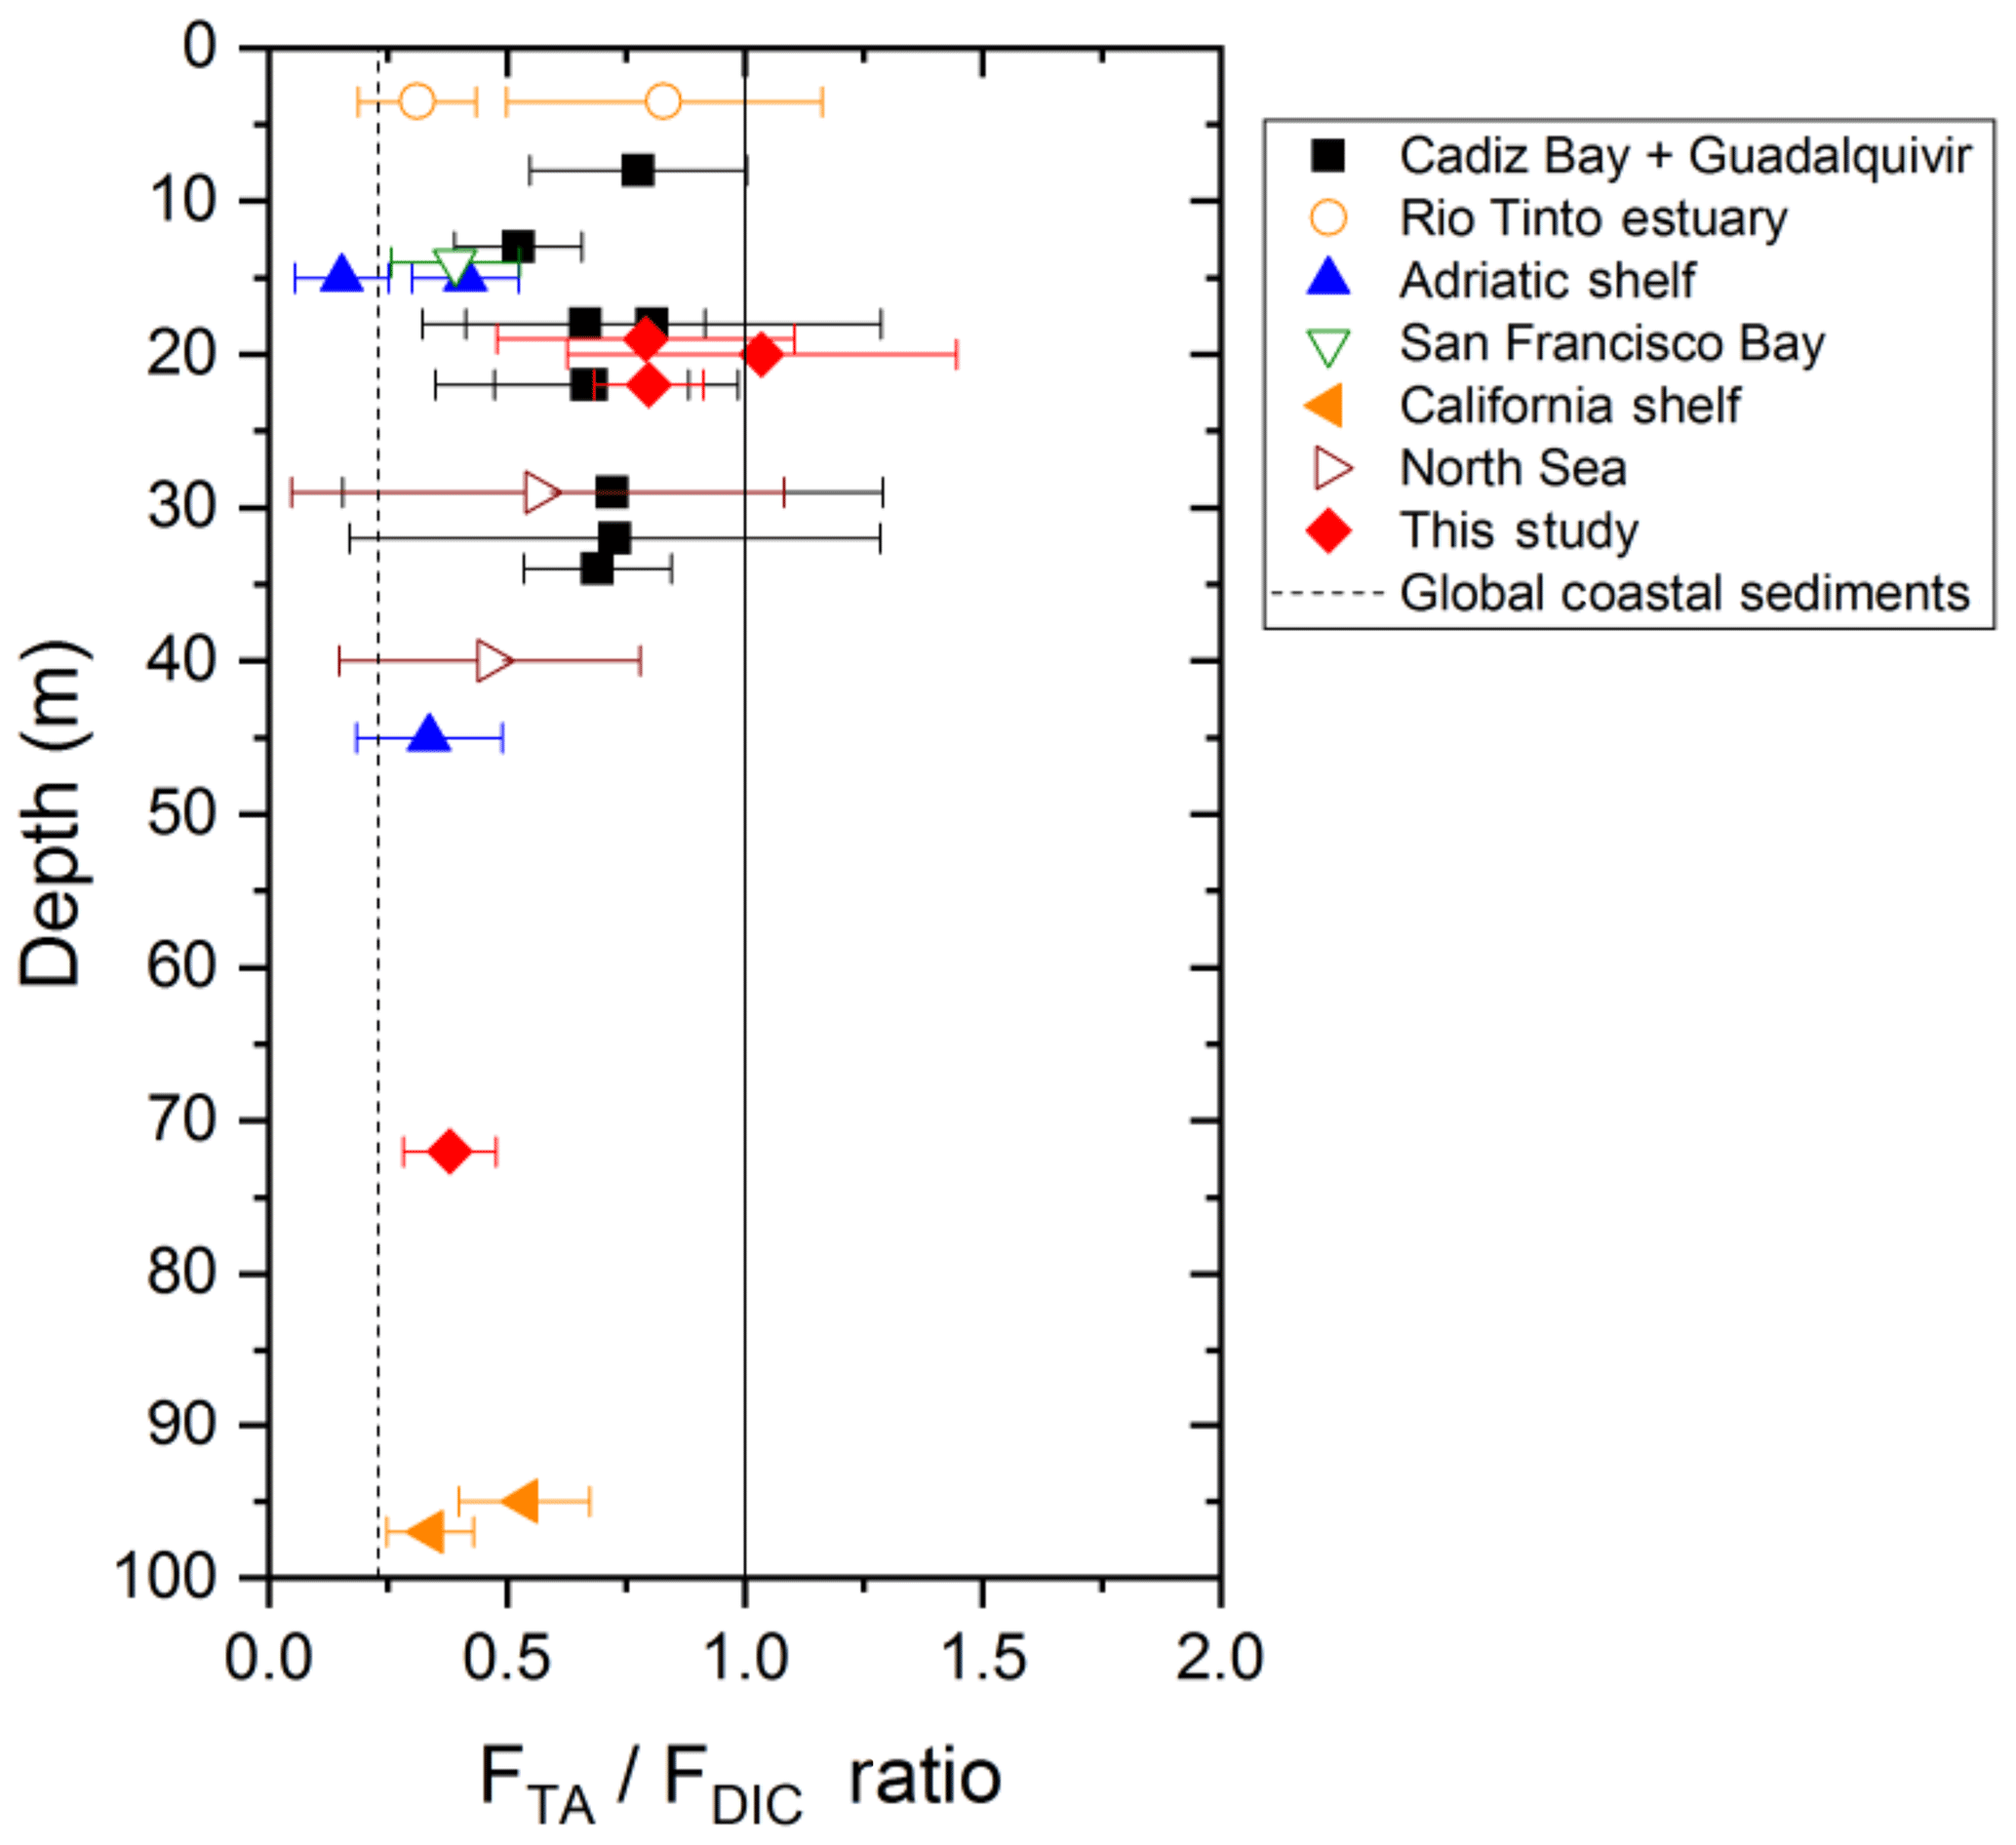
Figure 9TA to DIC benthic flux ratios as a function of depth at stations A, Z and E of the Rhône River delta compared to different coastal regions of water depth <100 m, where this ratio was quantified from in situ benthic flux measurements (modified from Hu and Cai, 2011b). Other coastal regions include Cadiz Bay and the Guadalquivir continental shelf (Spain; Ferron et al., 2009), the Rio Tinto estuary (Spain; Ortega et al., 2008), the Po River delta and nearby Adriatic shelf (Italy; Hammond et al., 1999), San Francisco Bay (USA; Hammond et al., 1985), and the California shelf (USA; Berelson et al., 1996). The global coastal average TA to DIC flux ratio predicted from Krumins et al. (2013) is also reported for reference. Note that this average is different from that reported by Hu and Cai (2011b), which was corrected in their later publication (Hu and Cai, 2013).
Benthic alkalinity fluxes are generally attributed to the dissolution of calcium carbonate minerals or denitrification in marine sediments without thorough examination of the biogeochemical processes responsible for net alkalinity production in pore waters. In this study, benthic mineralization processes, as well as benthic alkalinity and DIC fluxes were quantified in the Rhône River delta using a combination of benthic landers and depth profiles of redox and carbonate constituents. These measurements demonstrated that sediments from the proximal and prodelta domains represent a strong source of alkalinity to the water column. The highest alkalinity and DIC fluxes were detected in the vicinity of the Rhône River mouth and were much stronger than fluxes of dissolved oxygen, indicating the decoupling of oxic and anoxic biogeochemical processes. As denitrification was not significant in these sediments and pore water supersaturation with respect to calcite prevented carbonate dissolution from occurring over the entire sediment column, the high benthic alkalinity fluxes resulted from the high intensity of sulfate reduction and precipitation of iron sulfide minerals, with contributions from dissimilatory iron reduction and AOM, modulated by the precipitation of authigenic carbonates. The high intensity of anaerobic respiration processes was likely driven by pulsed sediment accumulations during fall river floods that promoted precipitation and burial of iron sulfide minerals deep in the sediments.
Consequently, a significant fraction of the total alkalinity generated in the pore waters was transferred to the bottom waters (benthic TA fluxes ranging from 14 to 74 mmol m−2 d−1). The intensity of the alkalinity and DIC fluxes decreased offshore as the sedimentation rate and the relative importance of anaerobic mineralization pathways compared to aerobic processes decreased. In these conditions the more “classical” coupling between aerobic and anaerobic reactions generated much lower benthic alkalinity fluxes. Overall, these findings suggest that deltaic sediments exposed to large riverine inputs of inorganic and organic material may provide a large source of alkalinity to the overlying waters and thus weaken the increase in pCO2 more significantly than previously thought in coastal waters.
Data can be found at https://doi.org/10.17882/70376 (Rassmann et al., 2019).
The supplement related to this article is available online at: https://doi.org/10.5194/bg-17-13-2020-supplement.
All authors except CB contributed to the cruise and the analysis of the samples. CB performed the methane analysis in the laboratory. All authors contributed to the initial version of the manuscript, which was jointly written by JR and EME. BL, MT and CR supported JR and EME during the revision phase by supplying comments replies and manuscript revisions.
The authors declare that they have no conflict of interest.
The authors thank the captain and crew of the RV Tethys II for their support at sea and Bruno Bombled for his technical help on-board and in the laboratory. We thank Gael Monvoisin for the analysis of sulfate samples at GEOPS (Paris-Sud University), Joel Craig and Olivia Studebaker for the analysis of nutrients and AVS at Georgia Tech, and Celine Liorzou for the ICP-AES measurements at Pôle Spéctrométrie Océan in Brest. The authors would also like to thank Jack Middelburg for handling the manuscript and two anonymous reviewers for their constructive comments that helped improve an earlier version of the paper. Finally, we are grateful to Sabine Kasten, Sandra Arndt, and Andrew Dale for the interesting discussions about the interactions of AOM with carbonates and iron minerals and sediment dynamics. This research was funded by the project Mistrals/MERMEX-Rivers, the French state program “Investissement d'avenir” run by the National Research Agency (AMORAD project ANR-11-RSNR-0002) and the National Science Foundation (OCE-1438648).
This paper was edited by Jack Middelburg and reviewed by Olivier Sulpis and two anonymous referees.
Aller, R. C., Mackin, J. E., and Cox, R. T.: Diagenesis of Fe and S in Amazon inner shelf muds: apparent dominance of Fe reduction and implications for the genesis of ironstones, Cont. Shelf. Res., 6, 263–289, 1986.
Aller, R. C., Blair, N. E., and Brunskill, G. J.: Early diagenetic cycling, incineration, and burial of sedimentary organic carbon in the central Gulf of Papua (Papua New Guinea), J. Geophys. Res., 113, 1–22, 2008.
Andersson, A. J. and Mackenzie, F. T.: Revisiting four scientific debates in ocean acidification research, Biogeosciences, 9, 893–905, https://doi.org/10.5194/bg-9-893-2012, 2012.
Andersson, A. J., Mackenzie, F. T., and Lerman, A.: Coastal ocean CO2-carbonic acid-carbonate sediment system of the Anthropocene, Global Biogochem. Cy., 20, GB1S92, https://doi.org/10.1029/2005GB002506, 2006.
Anschutz, P., Zhong, S., Sundby, B., Mucci, A., and Gobeil, C.: Burial efficiency of phosphorus and the geochemistry of iron in continental margin sediments, Limnol. Oceanogr., 43, 53–64, 1998.
Anschutz, P., Jorissen, F. J., Chaillou, G., Abu-Zied, R., and Fontanier, C.: Recent turbidite deposition in the eastern Atlantic: Early diagenesis and biotic recovery, J. Mar. Res., 60, 835–854, 2002.
Bauer, J. E., Cai, W.-J., Raymond, P. A., Bianchi, T. S., Hopkinson, C. S., and Regnier, P. A. G.: The changing carbon cycle of the coastal ocean, Nature, 504, 61–70, 2013.
Beckler, J., Nuzzio, D., and Taillefert, M.: Development of single-step liquid chromatography methods with ultraviolet detection for the measurement of inorganic anions in marine waters, Limnol. Oceanogr.-Meth., 12, 563–576, 2014.
Beckler, J. S., Kiriazis, N., Rabouille, C., Stewart, F. J., and Taillefert, M.: Importance of microbial iron reduction in deep sediments of river-dominated continental-margins, Mar. Chem., 178, 22–34, 2016.
Ben-Yaakov, S.: pH buffering of pore water of recent anoxic marine sediments, Limnol. Oceanogr., 18, 86–94, 1973.
Berelson, W., McManus, J., Coale, K. H., Johnson, K. S., Kilgorel, T., Burdige, D. J., and Pilskaln, C.: Biogenic matter diagenesis on the sea floor: A comparison between two continental margin transects, J. Mar. Res., 54, 731–762, 1996.
Berner, R. A.: Sedimentary pyrite formation, Am. J. Sci., 268, 1–23, 1970.
Berner, R. A.: Early Diagenesis: A Theoretical Approach, Princeton University Press, Princeton, 241 pp., 1980.
Berner, R. A.: Burial of organic carbon and pyrite sulfur in the modern ocean; its geochemical and environmental significance, Am. J. Sci., 282, 451–473, 1982.
Bianchi, S. T. and Allison, M. A.: Large-river delta-front estuaries as natural “recorders” of global environmental change, P. Natl. Acad. Sci. USA, 106, 8085–8092, 2009.
Bonin, P., Tamburini, C., and Michotey, V.: Determination of the bacterial processes which are sources of nitrous oxide production in marine samples, Water Res., 36, 722–732, 2002.
Borowski, W. S., Pau, C. K., and Ussler, W.: Marine pore-water sulfate profiles indicate in situ methane flux from underlying gas hydrate, Geology, 24, 655–658, 1996.
Boudreau, B. P. and Jorgensen, B. B.: The Benthic Boundary Layer Transport Proceses and Biogeochemistry, Oxford University Press, New York, 2001.
Brenner, H., Braeckman, U., Le Guitton, M., and Meysman, F. J. R.: The impact of sedimentary alkalinity release on the water column CO2 system in the North Sea, Biogeosciences, 13, 841–863, https://doi.org/10.5194/bg-13-841-2016, 2016.
Bristow, G. and Taillefert, M.: VOLTINT: A Matlab (R)-based program for semi-automated processing of geochemical data acquired by voltammetry, Comp. Geosci., 29, 153–162, 2008.
Broecker, W. S. and Peng, T.-H.: Gas exchange rates between air and sea, Tellus, 26, 21–35, 1974.
Buchholtz-Ten Brink, M. R., Gust, G., and Chavis, D.: Calibration and performance of a stirred benthic chamber, Deep-Sea Res., 36, 1083–1101, 1989.
Buffle, J.: Complexation reactions in aquatic systems an analytical approach, Halsted Press, New York, 692 pp., 1988.
Bura-Nakic, E., Viollier, E., Jezequel, D., Thiam, A., and Ciglenecki, I.: Reduced sulfur and iron species in anoxic water column of meromictic crater Lake Pavin (Massif Central, France), Chem. Geol., 266, 311–317, 2009.
Burdige, D.: Burial of terrestrial organic matter in marine sediments: A re-assessment, Global Biogeochem. Cy., 19, GB4011, https://doi.org/10.1029/2004GB002368, 2005.
Burdige, D.: Estuarine and Coastal Sediments – Coupled Biogeochemical Cycling, Treat. Estuar. Coast. Sci., 5, 279–316, 2011.
Burdige, D. J. and Komada, T.: Anaerobic oxidation of methane and the stoichiometry of remineralization processes in continental margin sediments, Limnol. Oceanogr., 56, 1781–1796, 2011.
Burdige, D. J. and Zimmerman, R. C.: Impact of sea grass density on carbonate dissolution in Bahamian sediments, Limnol. Oceanogr., 47, 1751–1763, 2002.
Cai, W.-J.: Estuarine and Coastal Ocean Carbon Paradox: CO2 Sinks or Sites of Terrestrial Carbon Incineration?, Annu. Rev. Mar. Sci., 3, 123–145, 2011.
Cai, W.-J. and Reimers, C. E.: The development of pH and pCO2 microelectrodes for studying the carbonate chemistry of pore waters near the sediment-water interface, Limnol. Oceanogr., 38, 1762–1773, 1993.
Canfield, D. E., Jørgensen, B. B., Fossing, H., Glud, R., Gundersen, J., Ramsing, N. B., Thamdrup, B., Hansen, J. W., Nielsen, L. P., and Hall, P. O. J.: Pathways of organic carbon oxidation in three continental margin sediments, Mar. Geol., 113, 27–40, 1993a.
Canfield, D. E., Thamdrup, B., and Hansen, J. W.: The anaerobic degradation of organic matter in Danish coastal sediments: iron reduction, manganese reduction, and sulfate reduction, Geochim. Cosmochim. Ac., 57, 3867–3883, 1993b.
Carman, R. and Rahm, L.: Early diagenesis and chemical characteristics of interstitial water and sediments in the deep deposition bottoms of the Baltic proper, J. Sci. Res., 37, 25–47, 1997.
Cathalot, C., Rabouille, C., Pastor, L., Deflandre, B., Viollier, E., Buscail, R., Grémare, A., Treignier, C., and Pruski, A.: Temporal variability of carbon recycling in coastal sediments influenced by rivers: assessing the impact of flood inputs in the Rhône River prodelta, Biogeosciences, 7, 1187–1205, https://doi.org/10.5194/bg-7-1187-2010, 2010.
Cathalot, C., Rabouille, C., Tisnérat-Laborde, N., Toussaint, F., Kerhervé, P., Buscail, R., Loftis, K., Sun, M.-Y., Tronczynski, J., Azoury, S., Lansard, B., Treignier, C., Pastor, L., and Tesi, T.: The fate of river organic carbon in coastal areas: A study in the Rhône River delta using multiple isotopic (δ13C, Δ14C) and organic tracers, Geochim. Cosmichim. Ac., 118, 33–55, 2013.
Charles, F., Coston-Guarini, J., Lantoine, F., Guarini, J. M., and Yucel, M.: Ecogeochemical fate of coarse organic particles in sediments of the Rhône River prodelta, Estuar. Coast. Shelf Sci., 141, 97–103, https://doi.org/10.1016/j.ecss.2014.03.005, 2014.
Charmasson, S., Radakovitch, O., Arnaud, M., Bouisset, P., and Pruchon, A.-S.: Long-core profiles of 137Cs, 134Cs, 60Co and 210Pb in sediment near the Rhône River (Northwestern Mediterranean Sea), Estuaries, 21, 367–378, 1998.
Chen, C.-T. A. and Borges, A. V.: Reconciling opposing views on carbon cycling in the coastal ocean: Continental shelves as sinks and near-shore ecosystems as sources of atmospheric CO2, Deep-Sea Res. Pt. II, 8, 578–590, 2009.
Clayton, T. D. and Byrne, R. H.: Spectrophotometric seawater pH measurements: total hydrogen ion concentration scale calibration of m-cresol purple and at-sea results, Deep-Sea Res. Pt. I, 40, 2115–2129, 1993.
Cossarini, G., Lazzari, P., and Solidoro, C.: Spatiotemporal variability of alkalinity in the Mediterranean Sea, Biogeosciences, 12, 1647–1658, https://doi.org/10.5194/bg-12-1647-2015, 2015.
Cyronak, T., Santos, I. R., McMahon, A., and Eyre, B. D.: Carbon cycling hysteresis in permeable carbonate sands over a diel cycle: Implications for ocean acidification, Limnol. Oceanogr., 58, 131–143, 2013.
Davison, W., Buffle, J., and DeVitre, R.: Voltammetric characterization of a dissolved iron sulphide species by laboratory and field studies, Anal. Chim. Acta, 377, 193–203, 1998.
Dickson, A. G.: An exact definition of total alkalinity and a procedure for the estimation of alkalinity and total inorganic carbon from titration data, Deep-Sea Res. Pt. A, 28, 609–623, 1981.
Dickson, A. G., Sabine, C. L., and Christian, J. R.: Guide to best practices for ocean CO2 measurements, in: PICES Special Publication, edited by: Dickson, A. G., Sabine, C. L., and Christian, J. R., 2007.
Dumoulin, J.-P., Pozzato, L., Rassmann, J., Toussaint, F., Fontugne, M., Tisnérat-Laborde, N., Beck, L., Caffy, I., Delqué-Kolic, E., Moreau, C., and Rabouille, C.: Isotopic signature (δ13C, Δ14C) of DIC in sediment porewaters: an example from the Rhone River Delta, Radiocarbon, 60, 1465–1481, 2018.
Estournel, C., Kondrachoff, V., Marsaleix, P., and Vehil, R.: The Plume of the Rhone: numerical simulation and remote sensing, Cont. Shelf. Res., 17, 899–924, 1997.
Ferron, S., Alonso-Perez, F., Ortega, T., and Forja, J. M.: Benthic respiration on the northeastern shelf of the Gulf of Cádiz, Mar. Ecol.-Prog. Ser., 392, 69–80, 2009.
Friedl, G., Dinkel, C., and Wehrli, B.: Benthic fluxes of nutrients in the northwestern Black Sea, Mar. Chem., 62, 77–88, 1998.
Gaillard, J.-F., Pauwels, H., and Michard, G.: Chemical diagenesis in coastal marine sediments, Oceanol. Acta, 12, 173–187, 1989.
Got, H. and Aloisi, J. C.: The Holocene sedimentation on the Gulf of Lions margin: a quantitative approach, Cont. Shelf. Res., 10, 841–855, 1990.
Grasshof, K., Ehrhardt, M., and Kremling, K.: Methods of Seawater Analysis, 2nd revised and extended Edn., Verlag Chemie GmbH, 6940 Weinheim, Germany, 420 pp., 1983.
Hammond, D. E., Fuller, C., Harmon, D., Hartman, B., Korosec, M., Miller, L. G., Real, R., Warren, S., Berelson, W., and Hager, S. W.: Benthic fluxes in San Francisco Bay, Hydrobiologia, 129, 69–90, 1985.
Hammond, D. E., Giordani, P., Berelson, W. M., and Poletti, R.: Diagenesis of carbon and nutrients and benthic exchange in sediments of the Northern Adriatic Sea, Mar. Chem., 66, 53–79, 1999.
Hartnett, H. E., Keil, R. G., Hedges, J. I., and Devol, A.: Influence of oxygen exposure time on organic carbon preservation in continental margin sediments, Nature, 391, 572–575, 1998.
Hedges, J. I. and Keil, R. G.: Sedimentary organic matter preservation: an assessment and speculative synthesis, Mar. Chem., 49, 81–115, 1995.
Henneke, E., Luther, G., and Delange, G.: Determination of inorganic Sulfur Speciation with Polarographic Techniques – some preliminary Results for Recent Hypersaline Anoxic Sediments, Mar. Geol., 100, 115–123, 1991.
Hu, X. and Cai, W.-J.: An assessment of ocean margin anaerobic processes on oceanic alkalinity budget, Global Biogeochem. Cy., 25, 1–11, 2011a.
Hu, X. and Cai, W.-J.: The impact of denitrification on the atmospheric CO2 uptake potential of seawater, Mar. Chem., 127, 192–198, 2011b.
Hu, X. and Cai, W. J.: Estuarine acidification and minimum buffer zone – A conceptual study, Geophys. Res. Lett., 40, 5176–5181, 2013.
Jahnke, R. A. and Christiansen, M. B.: A free-vehicle benthic chamber instrument for sea floor studies, Deep-Sea Res., 36, 625–637, 1989.
Jahnke, R. A.: A Global synthesis, in: Carbon and Nutrient Fluxes in Continental Margins, edited by: Liu, K.-K., Atkinson, L., Quinones, R., and Talaue-McManus, L., Springer, Berlin, 597–615, 2010.
Jiang, C. Z. and Tosca, N. J.: Fe(II)-carbonate precipitation kinetics and the chemistry of anoxic ferruginous seawater, Earth Planet. Sc. Lett., 506, 231–242, 2019.
Jones, M., Fennessey, C., DiChristina, T., and Taillefert, M.: Shewanella oneidensis MR-1 mutants selected for their inability to produce soluble organic-Fe(III) complexes are unable to respire Fe(III) as anaerobic electron acceptor, Environ. Microbiol., 12, 938–950, 2010.
Jørgensen, B. B. and Kasten, S.: Sulfur cycling and methane oxidation, in: Marine Geochemistry, edited by: Schulz, H. D. and Zabel, M., 271–310, Springer Verlag, Berlin, 2006.
Jourabchi, P., Van Cappellen, P., and Regnier, P.: Quantitative interpretation of pH distributions in aquatic sediments: A reaction-transport modeling approach, Am. J. Sci., 305, 919–956, 2005.
Komada, T., Burdige, D. J., Li, H.-L., Magen, C., Chanton, J. P., and Cada, A. K.: Organic matter cycling across the sulfate-methane transition zone of the Santa Barbara Basin, California Borderland, Geochim. Cosmochim. Ac., 176, 259–278, 2016.
Krumins, V., Gehlen, M., Arndt, S., Van Cappellen, P., and Regnier, P.: Dissolved inorganic carbon and alkalinity fluxes from coastal marine sediments: model estimates for different shelf environments and sensitivity to global change, Biogeosciences, 10, 371–398, https://doi.org/10.5194/bg-10-371-2013, 2013.
Lansard, B., Rabouille, C., Denis, L., and Grenz, C.: In situ oxygen uptake rates by coastal sediments under the influence of the Rhône River (NW Mediterranean Sea), Cont. Shelf. Res., 28, 1501–1510, 2008.
Lansard, B., Rabouille, C., Denis, L., and Grenz, C.: Benthic remineralization at the land–ocean interface: A case study of the Rhône River (NW Mediterranean Sea), Estuar. Coast. Shelf Sc., 81, 544–554, 2009.
Lehrter, J., Beddick, D., Devereux, R., Yates, D., and Murrel, M.: Sediment-water fluxes of dissolved inorganic carbon, O2, nutrients, and N2 from the hypoxic region of the Louisiana continental shelf, Biogeochemistry, 109, 233–252, 2012.
Li, Y.-H. and Gregory, S.: Diffusion of ions in sea water and in deep-sea sediments, Geochim. Cosmochim. Ac., 38, 703–714, 1974.
Luecker, T. J., Dickson, A. G., and Keeling, C. D.: Ocean pCO2 calculated from dissolved inorganic carbon, alkalinity, and equations for K1 and K2: validation based on laboratory measurements of CO2 in gas and seawater at equilibrium, Mar. Chem., 70, 105–119, 2000.
Łukawska-Matuszewska, K.: Contribution of non-carbonate inorganic and organic alkalinity to total measured alkalinity in pore waters in marine sediments (Gulf of Gdansk, S-E Baltic Sea), Mar. Chem., 186, 211–220, https://doi.org/10.1016/j.marchem.2016.10.002, 2016.
Łukawska-Matuszewska, K. and Graca, B.: Pore water alkalinity below the permanent halocline in the Gdańsk Deep (Baltic Sea) – Concentration variability and benthic fluxes, Mar. Chem., 204, 49–61, 2018.
Luther, G. W. and Ferdelman, T.: Voltametric Characterization of Iron (II) Sulfide Complexes in Laboratory Solutions and in Marine Waters and Porewaters, Environ. Sci. Technol., 27, 1154–1163, 1993.
Luther, G. W., Glazer, B., Ma, S., Trouwborst, R., Moore, T., Metzger, E., Kraiya, C., Waite, T., Druschel, G., Sundby, B., Taillefert, M., Nuzzio, D., Shank, T., Lewis, B., and Brendel, P.: Use of voltammetric solid-state (micro)electrodes for studying biogeochemical processes: Laboratory measurements to real time measurements with an in situ electrochemical analyzer(ISEA), Mar. Chem., 108, 221–235, 2008.
Maillet, G. M., Vella, C., Berné, S., Friend, P. L., Amos, C. L., Fleury, T. J., and Normand, A.: Morphological changes and sedimentary processes induced by the December 2003 flood event at the present mouth of the Grand Rhône River (southern France), Mar. Geol., 234, 159–177, 2006.
McKee, B. A., Aller, R. C., Allison, M. A., Bianchi, T. S., and Kineke, G. C.: Transport and transformation of dissolved and particulate materials on continental margins influenced by major rivers: benthic boundary layer and seabed processes, Cont. Shelf. Res., 24, 899–926, 2004.
Millero, F. J.: The estimation of the pK of acids in seawater using the Pitzer equations, Geochim. Cosmochim. Ac., 47, 2121–2129, 1983.
Millero, F. J.: Thermodynamics of the carbon dioxide system in the oceans, Geochim. Cosmochim. Ac., 59, 661–677, 1995.
Miralles, J., Radakovitch, O., and Aloisi, J.-C.: 210Pb sedimentation rates from the Nothwestern Mediterranean margin, Mar. Geol., 216, 155–167, 2005.
Mucci, A.: The solubility of calcite and aragonite in seawater at various salinities, temperatures and one atmosphere total pressure, Am. J. Sci., 283, 780–799, 1983.
Mucci, A., Sundby, B., Gehlen, M., Arakaki, T., Zhong, S., and Silverberg, N.: The fate of carbon in continental shelf sediments of eastern Canada: a case study, Deep-Sea Res. Pt. II, 47, 733–760, 2000.
Muller-Karger, F. E., Varela, R., Thunell, R., Luerssen, R., Hu, C., and Walsh, J. J.: The importance of continental margins in the global carbon cycle, Geophys. Res. Lett., 32, L01602, https://doi.org/10.1029/2004GL021346, 2005.
Murphy, J. and Riley, J. P.: A modified single solution method for determination of phosphate in natural waters, Anal. Chim. Acta, 27, 31–36, 1962.
Nakayama, N., Tokieda, T., Suzuki, A., Kim, T., Gamo, T., and Obata, H.: Size fractionation of nanoparticulate metal sulfides in oxic water of Lake Teganuma, Japan, Geochem. J., 50, 281–286, 2016.
Orr, J. C., Epitalon, J.-M., Dickson, A. G., and Gattuso, J.-P.: Routine uncertainty propagation for the marine carbon dioxide system, Mar. Chem., 207, 84–107, 2018.
Ortega, T., Ponce, R., Forja, J., and Gomez-Parra, A.: Benthic fluxes of dissolved inorganic carbon in the Tinto-Odiel system (SW of Spain), Cont. Shelf. Res., 28, 458–469, 2008.
Pain, A. J., Martin, J. B., and Young, C. R.: Sources and sinks of CO2 and CH4 in siliciclastic subterranean estuaries, Limnol. Oceanogr., 64, 1500–1514, 2019.
Pastor, L., Cathalot, C., Deflandre, B., Viollier, E., Soetaert, K., Meysman, F. J. R., Ulses, C., Metzger, E., and Rabouille, C.: Modeling biogeochemical processes in sediments from the Rhône River prodelta area (NW Mediterranean Sea), Biogeosciences, 8, 1351–1366, https://doi.org/10.5194/bg-8-1351-2011, 2011.
Pastor, L., Rabouille, C., Metzger, E., Thibault de Chanvalon, A., Viollier, E., and Deflandre, B.: Transient early diagenetic processes in Rhône prodelta sediments revealed in contrasting flood events, Cont. Shelf Res., 166, 65–76, https://doi.org/10.1016/j.csr.2018.07.005, 2018.
Pierrot, D., Lewis, E., and Wallace, D. W. R.: MS Excel program developed for CO2 system calculations, ORNL/CDIAC-105a, Carbon Dioxide Information Analysis Center, Oak Ridge National Laboratory, U.S. Department of Energy, Oak Ridge, Tennessee, 2006.
Pyzik, A. and Sommer, S.: Sedimentary Iron Monosulfides – Kinetics and Mechanism of Formation, Geochim. Cosmochim. Ac., 45, 687–698, 1981.
Rabouille, C., Mackenzie, F. T., and Ver, L. M.: Influence of the human perturbation on carbon, nitrogen, and oxygen biogeochemical cycles in the global coastal ocean, Geochim. Cosmochim. Ac., 65, 3615–3641, 2001.
Rabouille, C., Denis, L., Dedieu, K., Stora, G., Lansard, B., and Grenz, C.: Oxygen demand in coastal marine sediments: comparing in situ microelectrodes and laboratory core incubations, J. Exp. Mar. Biol. Ecol., 285, 49–69, 2003.
Radakovitch, O., Cherry, R., and Heussner, S.: 210Pb and 210Po: tracers of particle transfer on the Rhône continental margin (NW Mediterranean), Deep-Sea Res. Pt. I, 46, 1539–1563, 1999.
Rao, A. M. F., Malkin, S. Y., Montserrat, F., and Meysman, F. J. R.: Alkalinity production in intertidal sands intensified by lugworm bioirrigation, Estuar. Coast. Shelf S., 148, 36–47, 2014.
Rassmann, J., Lansard, B., Pozzato, L., and Rabouille, C.: Carbonate chemistry in sediment porewaters of the Rhône River delta driven by early diagenesis (northwestern Mediterranean), Biogeosciences, 13, 5379–5394, https://doi.org/10.5194/bg-13-5379-2016, 2016.
Rassmann, J., Eitel, E. M., Lansard, B., Cathalot, C., Brandily, C., Taillefert, M., and Rabouille, C.: AMOR-Bflux porewater and sediment data, SEANOE, https://doi.org/10.17882/70376, 2019.
Rickard, D.: Kinetics of FeS precipitation: Part 1. Competing reaction mechanisms, Geochim. Cosmochim. Ac., 59, 4367–4379, 1995.
Rickard, D. and Luther, G. W.: Kinetics of pyrite formation by the H2S oxidation of iron(II) monosulfide in aqueous solutions between 25 and 125 ∘C: the mechanism, Geochim. Cosmochim. Ac., 61, 135–147, 1997.
Roussiez, V., Aloisi, J.-C., Monaco, A., and Ludwig, W.: Early muddy deposits along the Gulf of Lions shoreline: A key for a better understanding of land-to-sea transfer of sediments and associated pollutant fluxes, Mar. Geol., 222–223, 345–358, 2005.
Rowe, G., Kaegi, M., Morse, J., Boland, G., and Briones, E.: Sediment community metabolism associated with continental shelf hypoxia, Northern Gulf of Mexico, Estuaries, 25, 1097–1106, 2002.
Rozan, T., Taillefert, M., Trouwborst, R., Glazer, B., Ma, S., Herszage, J., Valdes, L., Price, K., and Luther, G.: Iron-sulfur-phosphorus cycling in the sediments of a shallow coastal bay: Implications for sediment nutrient release and benthic macroalgal blooms, Limnol. Oceanogr., 47, 1346–1354, 2002.
Sarradin, P.-M. and Caprais, J.-C.: Analysis of dissolved gases by headspace sampling gas chromatography with column and detector switching: Preliminary results, Anal. Commun., 33, 371–373, 1996.
Seeberg-Elverfeldt, J., Schlüter, M., Feseker, T., and Kölling, M.: Rhizon sampling of pore waters near the sediment/water interface of aquatic systems, Limnol. Oceanogr.-Meth., 3, 361–371, 2005.
Sempéré, R., Charrière, B., Wambeke, F. V., and Cauwet, G.: Carbon inputs of the Rhône River to the Mediterranean Sea: Biogeochemical implications, Global Biogeochem. Cy., 14, 669–681, 2000.
Soetaert, K., Hofmann, A. F., Middelburg, J. J., Meysman, F. J. R., and Greenwood, J.: The effect of biogeochemical processes on pH, Mar. Chem., 105, 30–51, 2007.
Stookey, L.: Ferrozine – a new spectrophotometric reagent for iron, Anal. Chem., 42, 779–781, 1970.
Taillefert, M., Bono, A. B., and Luther, G. W.: Reactivity of freshly formed Fe(III) in synthetic solutions and (pore)waters: Voltammetric evidence of an aging process, Environ. Sci. Technol., 34, 2169–2177, 2000.
Taillefert, M., Beckler, J., Carey, E., Burns, J., Fennessey, C., and DiChristina, T.: Shewanella putrefaciens produces an Fe(III)-solubilizing organic ligand during anaerobic respiration on insoluble Fe(III) oxides, J. Inorg. Biochem., 101, 1760–1767, 2007.
Tercier-Waeber, M. and Taillefert, M.: Remote in situ voltammetric techniques to characterize the biogeochemical cycling of trace metals in aquatic systems, J. Environ. Monitor., 10, 30–54, 2008.
Theberge, S. M. and Luther III, G. W.: Determination of the electrochemical properties of a soluble aqueous FeS species present in sulfidic solutions, Aquat. Geochem., 3, 191–211, 1997.
Thomas, H., Schiettecatte, L.-S., Suykens, K., Koné, Y. J. M., Shadwick, E. H., Prowe, A. E. F., Bozec, Y., de Baar, H. J. W., and Borges, A. V.: Enhanced ocean carbon storage from anaerobic alkalinity generation in coastal sediments, Biogeosciences, 6, 267–274, https://doi.org/10.5194/bg-6-267-2009, 2009.
Wolf-Gladrow, D. A., Zeebe, R. E., Klaas, C., Körtzinger, A., and Dickson, A. G.: Total alkalinity: The explicit conservative expression and its application to biogeochemical processes, Mar. Chem., 106, 287–300, 2007.
Zebracki, M., Eyrolle-Boyer, F., Evrard, O., Claval, D., Mourier, B., Gairoard, S., Cagnat, X., and Antonelli, C.: Tracing the origin of suspended sediment in a large Mediterranean river by combining continuous river monitoring and measurement of artificial and natural radionuclides, Sci. Total Environ., 502, 122–132, 2015.