the Creative Commons Attribution 4.0 License.
the Creative Commons Attribution 4.0 License.
 | 03 Apr 2020
Microstructure and composition of marine aggregates as co-determinants for vertical particulate organic carbon transfer in the global ocean
Katharina D. Six
Irene Stemmler
Soeren Ahmerkamp
Tatiana Ilyina
Marine aggregates are the vector for biogenically bound carbon and nutrients from the euphotic zone to the interior of the oceans. To improve the representation of this biological carbon pump in the global biogeochemical HAMburg Ocean Carbon Cycle (HAMOCC) model, we implemented a novel Microstructure, Multiscale, Mechanistic, Marine Aggregates in the Global Ocean (M4AGO) sinking scheme. M4AGO explicitly represents the size, microstructure, heterogeneous composition, density and porosity of aggregates and ties ballasting mineral and particulate organic carbon (POC) fluxes together. Additionally, we incorporated temperature-dependent remineralization of POC. We compare M4AGO with the standard HAMOCC version, where POC fluxes follow a Martin curve approach with (i) linearly increasing sinking velocity with depth and (ii) temperature-independent remineralization. Minerals descend separately with a constant speed. In contrast to the standard HAMOCC, M4AGO reproduces the latitudinal pattern of POC transfer efficiency, as recently constrained by Weber et al. (2016). High latitudes show transfer efficiencies of , and the subtropical gyres show lower values of about 0.10±0.03. In addition to temperature as a driving factor for remineralization, diatom frustule size co-determines POC fluxes in silicifier-dominated ocean regions, while calcium carbonate enhances the aggregate excess density and thus sinking velocity in subtropical gyres. Prescribing rising carbon dioxide (CO2) concentrations in stand-alone runs (without climate feedback), M4AGO alters the regional ocean atmosphere CO2 fluxes compared to the standard model. M4AGO exhibits higher CO2 uptake in the Southern Ocean compared to the standard run, while in subtropical gyres, less CO2 is taken up. Overall, the global oceanic CO2 uptake remains the same. With the explicit representation of measurable aggregate properties, M4AGO can serve as a test bed for evaluating the impact of aggregate-associated processes on global biogeochemical cycles and, in particular, on the biological carbon pump.
- Article
(14143 KB) - Full-text XML
- BibTeX
- EndNote


Marine aggregates transfer biologically bound carbon and nutrients from the sunlit surface waters, the euphotic zone, to the interior of the oceans. While uncertainty with respect to primary production estimates exists, about 4.0 to 11.2 Gt C yr−1 of biologically bound carbon is annually exported out of the euphotic zone of the global ocean (Laws et al., 2000; Najjar et al., 2007; Henson et al., 2012). The net withdrawal of carbon dioxide (CO2) from the ocean surface through export of carbon bound in particulate organic matter (POM) and biogenic minerals and subsequent release through microbial remineralization and dissolution during aggregate descent determine the strength of the so-called biological carbon pump. The biological carbon pump critically depends on phytoplankton growth, the replenishment of the euphotic zone with nutrients through mixing and upwelling processes, and the efficiency of biologically bound carbon transfer from surface waters to the interior of the oceans (Williams and Follows, 2011). The region and depth of carbon sequestration eventually determine the residence time of the biologically bound carbon upon recurrence at the ocean surface. Representing transport and fate of marine aggregates in Earth system models (ESMs) is therefore key in quantifying the future evolution of biogeochemical cycles and particularly the biological carbon pump and its feedback on the Earth system under climate change (Ilyina and Friedlingstein, 2016). In the present study, we thus aim to advance the representation of marine aggregates in an ESM framework.
Marine aggregates are porous entities which are heterogeneously composed of POM, biogenic and inorganic minerals. The sinking velocity of marine aggregates, their microbial remineralization and zooplankton grazing govern the attenuation of vertical particulate organic carbon (POC) fluxes. The sinking velocity of aggregates is primarily determined by their size. In addition, the internal microstructure, defined by the porosity and heterogeneous composition, entails high variability in excess density and thus sinking speed of aggregates (Iversen and Robert, 2015). Biogenic calcium carbonate (CaCO3) and opal structures, primarily formed by coccolithophores and diatoms, act as ballasting minerals in organic aggregates (De La Rocha and Passow, 2007; Armstrong et al., 2002). On the contrary, the available amount of POC, acting as glue, is suggested to limit the uptake capability for ballasting minerals before aggregates disintegrate (Passow, 2004; Passow and De La Rocha, 2006; De La Rocha et al., 2008). Ballasting increases the POC transfer efficiency (Klaas and Archer, 2002; Balch et al., 2010; Cram et al., 2018), defined as the fraction of POC exported out of the euphotic zone that reaches a particular depth, e.g., 1000 m (Francois et al., 2002). As CaCO3 is significantly denser than opal, CaCO3 is suggested to be a more effective ballasting material for marine aggregates (Balch et al., 2010), implying higher POC transfer efficiency in CaCO3-production-dominated regions. Phytoplankton communities possess spatio-temporally varying patterns and prime the sinking flux ratios of detritus to ballasting minerals, i.e., the rain ratios. High CaCO3-to-opal ratios are found in oligotrophic regions of the mid-latitude subtropical gyres, while opal is the prevalent ballasting mineral in high latitudes and upwelling-influenced equatorial regions (Balch et al., 2010). However, simple ballasting relationships on aggregates are questioned, and the prevailing plankton network is suggested as an additional driver for POC fluxes (Wilson et al., 2012; Henson et al., 2012; Guidi et al., 2016). For example, cell size and morphology present in the phytoplankton community are suggested as a primary determining factor for sinking velocity of marine aggregates (Laurenceau-Cornec et al., 2015; Bach et al., 2016). In turn, the attenuation of POC fluxes is hypothesized to be modulated by microbial remineralization and by zooplankton grazing in oligotrophic and eutrophic regions (Guidi et al., 2009). Since temperature controls enzymatic reaction kinetics, and thus microbial remineralization of POC, slower attenuation and thus higher transfer efficiency are suggested in cold high latitudes compared to warm oligotrophic regions (Marsay et al., 2015). For a long time, the aforementioned variable factors and processes, the limited understanding of aggregation and fragmentation processes that shape the aggregate size spectrum, and the sparse number of data have retarded the emergence of a detailed picture of global pattern of POC fluxes attenuation and thus transfer efficiency.
However, quantification of the regionally varying POC transfer efficiency and its variability is key in understanding global biogeochemical cycles, in particular the carbon cycle (Falkowski et al., 1998). Recently, global POC fluxes have been constrained to possess high transfer efficiency in high latitudes and upwelling regions and lower efficiency in the subtropical gyres (Weber et al., 2016). The underlying controls for the transfer efficiency pattern seem to exhibit a distinct latitudinal variability (Cram et al., 2018). The simplified model study of Cram et al. (2018) suggests aggregate size, ballasting of particles by CaCO3 and opal, temperature effects on microbial aerobic and anaerobic remineralization, water density, and molecular viscosity as major controls of the transfer efficiency pattern.
Processes of marine snow formation, ballasting and sinking are currently underrepresented in ESMs despite the relevance of aggregates for the transfer and sequestration of POC to the deep ocean. Only a few global models explicitly incorporate aggregation of phytoplankton mechanistically (e.g., Gehlen et al., 2006; Schwinger et al., 2016) while neglecting ballasting effects or vice versa (Gehlen et al., 2006; Heinemann et al., 2019). POC sinking velocities in ESMs are typically formulated to reproduce the Martin curve (Martin et al., 1987) or heuristically describe ballasting of POC with opal and CaCO3 (e.g., Gehlen et al., 2006; Heinemann et al., 2019), which limits the process-based adaptation of sinking velocities under changing environmental conditions associated with climate change.
As a first step, we develop the Microstructure, Multiscale, Mechanistic, Marine Aggregates in the Global Ocean (M4AGO) sinking scheme that explicitly represents composition, microstructure, and related properties such as porosity and density of aggregates. We aim to consistently define marine aggregates with their in situ measurable properties in an ESM framework. We implement M4AGO in the global HAMburg Ocean Carbon Cycle (HAMOCC) model, which is part of the Max Planck Institute – Earth system model (MPI-ESM), to explicate the emerging pattern of aggregate properties and examine their effect on sinking velocity and the global pattern of POC transfer efficiency. We particularly aim to (i) represent the POC transfer efficiency pattern of Weber et al. (2016), (ii) provide further understanding into the underlying driving factors for this pattern and (iii) give insights into the impact of M4AGO on the global CO2 flux pattern. We focus on the transfer efficiency pattern identified by Weber et al. (2016), as it was derived by diagnosing phosphate fluxes from World Ocean Atlas 2009 phosphate concentration via inverse modeling. This approach benefits from many more observations used compared to direct flux observations (Usbeck et al., 2003; Weber et al., 2016) and can thus be regarded as, to date, more reliable than previous estimates with a partly opposing latitudinal pattern (e.g., Henson et al., 2012; Marsay et al., 2015).
With M4AGO, we represent marine aggregates at the global scale to provide a test bed for future investigations of aggregate-associated processes in ESMs, e.g., particle-size-, microstructure- and composition-dependent remineralization rates.
The HAMburg Ocean Carbon Cycle (HAMOCC) model is a global biogeochemical model which features biology and resolves the carbon chemistry (Six and Maier-Reimer, 1996; Ilyina et al., 2013; Paulsen et al., 2017; Mauritsen et al., 2019). HAMOCC assumes a fixed stoichiometry for dead and living organic matter and represents the nutrients phosphate, nitrate, silicate and iron. Phytoplankton in HAMOCC, namely bulk phytoplankton and diazotrophs, can thus experience nutrient co-limitation. Diazotrophs assimilate gaseous dinitrogen under nitrate limitation and compete for phosphorus with bulk phytoplankton. Diazotrophs grow slower than bulk phytoplankton and have their optimal growth temperature at about 28 ∘C (Paulsen et al., 2017, 2018). Zooplankton feeds on bulk phytoplankton and releases POM, which enters the common detritus pool. During detritus formation through bulk phytoplankton or zooplankton, opal or CaCO3 is produced depending on silicate availability. This treatment adequately depicts the spatial distribution of silicifying and calcifying plankton communities (Heinze et al., 1999). HAMOCC represents sediment processes (Heinze et al., 1999) and is coupled to the global three-dimensional Max Planck Institute Ocean Model (MPIOM; Marsland et al., 2003; Jungclaus et al., 2013). HAMOCC is described and evaluated in previous studies; for details, see, e.g., Six and Maier-Reimer (1996), Ilyina et al. (2013), Paulsen et al. (2017), and Mauritsen et al. (2019). In the following, we therefore focus on processes in the standard version, i.e., sinking and remineralization, which we modify with the M4AGO sinking scheme. A table with the used mathematical symbols can be found in Appendix D, Table .
2.1 HAMOCC standard representation of sinking fluxes and remineralization
The standard version of HAMOCC (Mauritsen et al., 2019) represents sinking fluxes of POC, FPOC, at depth z>z0, according to the concept of the Martin curve (Martin et al., 1987; Kriest and Oschlies, 2008):
where F0 is the POC flux out of the euphotic zone at export depth z0. For simplicity, the export depth is globally defined as being z0=100 m in HAMOCC. Above z0, a constant sinking speed of 3.5 m d−1 is assumed. Below z0, we assume a linearly increasing mass concentration-weighted mean sinking velocity with depth. The ratio between the remineralization rate of POC, RPOC,remin, and the vertical gradient of the sinking velocity, , determines the POC flux slope, (Kriest and Oschlies, 2008). In the standard version of HAMOCC, remineralization of POC is temperature-independent and comprehends oxygen-concentration-dependent aerobic remineralization as well as sulfate reduction and denitrification under sub-anoxic and anoxic conditions.
The sinking tracers, opal and CaCO3, are treated separately from POC and sink with their own, constant sinking velocity. Aeolian dust is, apart from the release of bioavailable iron in surface waters, inert and sinks slowly through the water column. The opal dissolution rate in the standard model is linearly temperature-dependent. HAMOCC accounts for dissolution in carbonate ion undersaturated conditions below the dynamically emerging lysocline. In the following, we refer to this version of HAMOCC as “standard”.
2.2 The novel M4AGO sinking scheme in HAMOCC
Natural waters exhibit a size spectrum of aggregates whose diameter, d, composition and microstructure determine their terminal sinking velocity. In the M4AGO approach, we explicitly represent microstructure and heterogeneous composition of aggregates. For the aggregate size spectrum, we limit the representation to a variable power law number distribution, n(d), with slope b and power law factor a (following e.g., Kriest and Evans, 1999; Gehlen et al., 2006; Schwinger et al., 2016):
This way, we avoid the computational costs of size-class-based model approaches (Jackson, 1990; Stemmann et al., 2004; Sherwood et al., 2018).
The local concentration-weighted mean sinking velocity, 〈ws〉, in M4AGO is eventually computed from the number distribution (Eq. 2) that is truncated at the minimum and maximum aggregate sizes, dmin and dmax, respectively, and expressions for the aggregate mass, m(d), and the sinking velocity of aggregates, ws(d), of a particular diameter, d. Integration over the aggregate size spectrum yields 〈ws〉
We only implicitly account for aggregation and fragmentation and explicitly represent the temporally and spatially variable heterogeneity and microstructure of aggregates and their effect on the mean sinking velocity. We refrain from representing the potential heterogeneity of aggregate composition within the local size spectrum (see, e.g., Jackson, 1998). Consequently, and in contrast to the standard configuration, the settling tracers in HAMOCC, opal, CaCO3, detritus and dust sink in M4AGO at the same mean sinking velocity of aggregates (Eq. 3). In contrast to Gehlen et al. (2006), Schwinger et al. (2016) and Heinemann et al. (2019), we explicitly incorporate both variable aggregate size and ballasting through heterogeneous composition. Under the above assumptions, we derive the terms for b, m(d), ws(d), dmin and dmax in the following sections.
2.2.1 Representation of aggregate microstructure and heterogeneous composition
Marine aggregates are porous (Alldredge and Gotschalk, 1990) and feature a self-similar microstructure which can be described via a fractal dimension df (Logan and Wilkinson, 1990; Kranenburg, 1994). df=1 would depict a chain of aggregate constituents, where the length equals the aggregate diameter, and df=3 describes a solid sphere. Consequently, the mass of an aggregate, m(d), grows disproportionately to the aggregates volume and can be expressed as
where mf is a mass factor for the smallest entity. Thus, the density of an aggregate ρf decreases with increasing diameter. Aggregates consist of, for example, phytoplankton cells or coccolithophore shells (Alldredge and Gotschalk, 1990), which we consider to be spherical primary particles. Primary particles exhibit their own density ρp and diameter dp. Taking the fractal scaling of aggregate mass into account, the excess density of an aggregate with respect to surrounding fluid density ρ can be expressed as (Kranenburg, 1994)
Furthermore, the aggregate porosity, ϕ, is defined as
and, hence, both excess density and porosity are regulated by the fractal dimension and primary-particle size. The Δρf can be introduced to the well-known Stokes (1851) terminal sinking velocity, ws:
For small particle Reynolds numbers, , the drag coefficient is and the sinking velocity, ws, becomes
where μ and ν are molecular dynamic and kinematic viscosity (Matthäus, 1972), respectively, and g is the gravitational acceleration constant. However, this approach assumes homogeneous, mono-sized primary particles, while it displays the potential importance of primary-particle size and density as well as aggregate microstructure for sinking velocity. To better represent aggregates in natural systems, the heterogeneity of primary particles was thus far considered either for size or density (Jackson, 1998; Maggi, 2009; Khelifa and Hill, 2006). With M4AGO, we represent aggregates composed of poly-dense, poly-sized primary particles under the assumption of a singled value fractal dimension throughout the aggregate size spectrum. This allows for representing heterogeneous primary particles such as diatom frustules, coccoliths, dust particles and detritus as principal components of marine aggregates.
Bushell and Amal (1998) derived a representation of the mean primary-particle size,
for an aggregate that is composed of mono-dense spherical primary particles of different diameters dp,i. Poly-sized formed aggregates disobey the traditional mass fractal relationship, but the fractal nature continues to emerge in a power law scaling for the mass present in a radial shell from an occupied point in the aggregate (Bushell and Amal, 1998). The approach of Bushell and Amal (1998) conserves the size of the aggregate and the encapsulated solid volume of the primary particles, and thus the porosity of the aggregate is unimpaired, while the calculation does not presume an equal number of mean, n, and individual primary particles, ∑ini (hence, with for poly-sized primary particles), which is negligible in the following, as we do not consider n any further.
Under the assumption that aggregates feature the same composition and hence same heterogeneity in a size spectrum, the aggregate-composing primary-particle types are always the same for any aggregate of diameter d in a unit volume and thus . This further implies that the ratio Ki, between the total number of primary particles of one particle type, ni,tot, and the total number of primary particles, , in a unit volume is equal to the ratio found in an individual aggregate:
Rewriting Eq. (10), , and inserting it into Eq. (9) gives
where the factors Ki can be expressed in HAMOCC via the concentration of each aggregate-forming tracer Ci. Namely, we consider the HAMOCC tracers detritus, opal, calcite and dust in taking part in the formation of heterogeneously composed aggregates. Calculating the number of primary particles from the tracer concentration requires the molecular concentration to mass factor, Ri, the tracer-related primary-particle diameter, volume , and density ρp,i:
The advantage of Eq. (11) is that it allows us to determine the mean primary-particle diameter in HAMOCC while solid volume and density of primary particles are conserved. Ensuring mass conservation, we introduce the volume-weighted primary-particle mean density
and, hence, multiplication by the volume of the mean primary particle then yields the mass of a mean primary particle (see also Fig. 1):
Substituting Eq. (14) into Eq. (4), we derive the mass factor for heterogeneous aggregates . The derivation of the mean primary-particle diameter (Eq. 11), density (Eq. 13) and mass (Eq. 14) allows for applying common fractal laws for the calculation of aggregate mass, density and thus sinking velocity. Hence, can be expressed as . For a single type of primary particle, all underlying equations reduce to the traditional fractal-scaling relationship (Logan and Wilkinson, 1990; Kranenburg, 1994).

Figure 1Underlying assumptions for the representation of aggregates composed of poly-dense, poly-sized primary particles. Primary particles, like dust particles, coccoliths and diatom frustules (a), are assumed to be spherical and exhibit their characteristic density (b). Once aggregated, we assume the diameter of the aggregate to be constant and the total volume and mass of primary particles to be preserved (c). Vp,i is the primary-particle volume, ρp,i is the primary-particle density and dp,i is the primary-particle diameter of primary-particle type i. m(d) is the mass of an aggregate of diameter d. 〈dp〉 and 〈ρp〉 represent mean primary-particle diameter and density, respectively.
2.2.2 Mean sinking velocity of marine aggregates
In the preceding section, we derived a formulation for the mean primary-particle size (Eq. 11), which we apply as a lower integration bound in Eq. (3), and, hence, dmin=〈dp〉 (following Kriest and Evans, 1999). The maximum aggregate diameter of the size spectrum, dmax, is limited by fragmentation of particles. Several mechanisms can cause fragmentation of aggregates. Flow-induced turbulent shear has been suggested as the dominant process in the upper ocean, where turbulent shear reaches typical values of the order of 1 s−1 (Jackson, 1990). By contrast, Alldredge et al. (1990) showed that marine aggregates often withstand oceanic turbulence conditions and suggested biological processes as a mediating factor for shaping the size distribution. Zooplankton also generates turbulent shear that is strong enough to rupture aggregates (Dilling and Alldredge, 2000). Hill (1998) proposed an alternative control on aggregate size, namely the sinking of aggregates that produces shear of the same order of magnitude as ambient turbulent shear in the ocean (Bagster and Tomi, 1974; Adler, 1979; Alldredge et al., 1990). Sinking could thus cause fragmentation in deeper regions of the ocean, where turbulent shear is small (O(0.01 s−1); McCave, 1984; Waterhouse et al., 2014). Since modeling of particle-reactive thorium suggests continued fragmentation during particle descent in the deep ocean (Lam and Marchal, 2015), we adopt the hypothesis of sinking-induced fragmentation and limit the size distribution based on the particle Reynolds number, Rep,:
Kiørboe et al. (2001) suggested the particle Reynolds number being in a typical range of up to Rep=20, while, for example, Alldredge and Gotschalk (1988) measured particle Reynolds numbers of up to Rep=32. Aggregates thus can exhibit larger Rep than the laminar case (Rep<0.1). The drag coefficient, cD, in Eq. (7) can be represented by the expression for solid spheres of White (2005), valid up to Rep<105:
This drag representation leads to smaller settling velocities for large aggregates than the classical Stokes drag (). Hence, aggregates can grow larger until they reach the globally fixed critical Rep for fragmentation, Recrit, which leads to a more realistic representation of the size range of aggregates. We approximate the White drag representation to be (Jiang and Logan, 1991)
to avoid iteration and to allow for an analytical solution of Eq. (3). Applying the parameter values of ; , for ; and , for introduces maximum errors of less than 10 % compared to Eq. (16) for Rep<100 (Jiang and Logan, 1991).
By introducing Eq. (17) in Eq. (7), and applying Eq. (5) using mean primary-particle properties, the approximation for the sinking velocity becomes
By substituting Eq. (18) into Eq. (15), the piecewise integration boundaries, , according to the cD approximation for Eq. (3), become a function of Rep:
Consequently, the concentration-weighted mean sinking velocity (Eq. 3) can then be expressed as
where dmax=dj(Recrit) is the maximum diameter of aggregates, and by applying , the lower integration boundary equals the mean primary-particle diameter.
2.2.3 The particle distribution slope, b
Observed aggregate size spectra in the ocean exhibit a spatio-temporally dependent slope ranging between approximately 3.2 and 5.4 (DeVries et al., 2014) or even lower (≈2; Guidi et al., 2009). A smaller slope parameter, b, translates to more large aggregates relative to a larger b and enhances mean sinking velocity. The evolution of the particle-size spectra underlies the interacting processes of growth and decay of phytoplankton, aggregation, fragmentation and sinking of aggregates. Instead of modeling the processes of aggregation and fragmentation explicitly or prescribing b, we assume a dynamic steady state between aggregation and fragmentation to describe the slope of the number distribution. According to dimensional analysis, the slope of the number distribution in dynamic steady state depends on the fractal dimension of aggregates and the process of aggregation, aggregation due to shear, differential sinking and Brownian motion (Jiang and Logan, 1991). Aggregation due to Brownian motion is only relevant for particles smaller ≈1 µm (McCave, 1984), which we neglect here. We further assume that aggregation in the majority of the global ocean is dominated by differential settling and express the particle distribution slope, b, as (Jiang and Logan, 1991)
where bJ is a fixed parameter for the sinking velocity dependency on the particle Reynolds number that we fix for simplicity to . The assumption of differential-settling-dominated aggregation is likely violated in the euphotic zone, where shear aggregation is probably more relevant and steady-state assumption is questionable, which we will address in the discussion (Sect. 3.10).
2.2.4 Heuristic approach to variable aggregate stickiness and fractal dimension
Adhesion properties of particles affect the fractal structure of aggregates and the collision efficiency (“stickiness”) of particles (Meakin, 1988; Liu et al., 1990). Theoretical studies show that the stronger the surface adhesive forces are, the higher the stickiness of particles and the smaller the intrusion of particles and particle clusters into each other are (Liu et al., 1990). As a result, this leads to a looser structure, which translates to a small fractal dimension. Stickiness of phytoplankton is species-specific (Hansen and Kiørboe, 1997) and depends on the growth phase (Simon et al., 2014). Furthermore, phytoplankton releases extracellular polymeric substances (EPS; Decho, 1990) such as transparent exopolymer particles (TEPs), which are suggested to be aggregation-priming, sticky materials (Alldredge et al., 1993; Azam and Malfatti, 2007; Thornton, 2002; Passow, 2002; Engel et al., 2004). The resulting fractal dimension is typically determined as one value across all aggregate sizes. We thus assign a single fractal dimension to an aggregate population and depict the linkage between stickiness and fractal dimension in a qualitative manner. We attribute a stickiness value, αi, to each sinking tracer in HAMOCC and calculate the mean stickiness for the aggregates that is then mapped to a fractal dimension. Since adhesion, and thus stickiness, is a surface property, we calculate the mean stickiness,
weighted by the primary-particle surfaces . We map the mean stickiness to a range between 0 and 1:
where and .
Nicolás-Carlock et al. (2016) introduced a scaling parameter for the effective aggregation range in microscopic aggregation models to stipulate a defined fractal dimension across aggregate sizes. The scaling parameter can be perceived as an indicator of stickiness that defines the effective aggregation range; i.e., higher stickiness results in a larger effective aggregation range. We introduce, as an analogy for the dependency of the fractal dimension on the scaling parameter of Nicolás-Carlock et al. (2016), a transfer function for the mapped mean stickiness to fractal dimension, df(〈α〉map),
with , where df,min and df,max are the parameterized minimum and maximum fractal dimension of aggregates. Modeled stickier aggregates thus exhibit lower fractal dimensions than non-sticky particles, which is in qualitative agreement with previous studies (Meakin, 1988; Liu et al., 1990; Block et al., 1991; Nicolás-Carlock et al., 2016).
2.2.5 Diatoms as a special case of primary particles
Diatoms are silicifying phytoplankton that possesses a hollow opal skeleton, the diatom frustule, and are thus different from a homogeneous, solid primary particle like a coccolith. Diatoms feature a wide range of sizes, from about a few microns to millimeters (Armbrust, 2009). Since sinking velocities of aggregates are proportional to their diameter, primary-particle density and size (Eq. 8), aggregate-incorporated large diatom shells likely enhance the sinking velocity of particles. Indeed, un-remineralized, intact diatom frustules were even found in deeper regions of the ocean (Assmy et al., 2013), which is in agreement with previously found high sinking speeds of large diatom aggregates (Alldredge and Gotschalk, 1988). We therefore explicitly account for diatom shells by treating them as hollow opal spheres, filled (i) with detritus and (ii) increasing water content with ongoing remineralization while sinking (see Fig. 2).
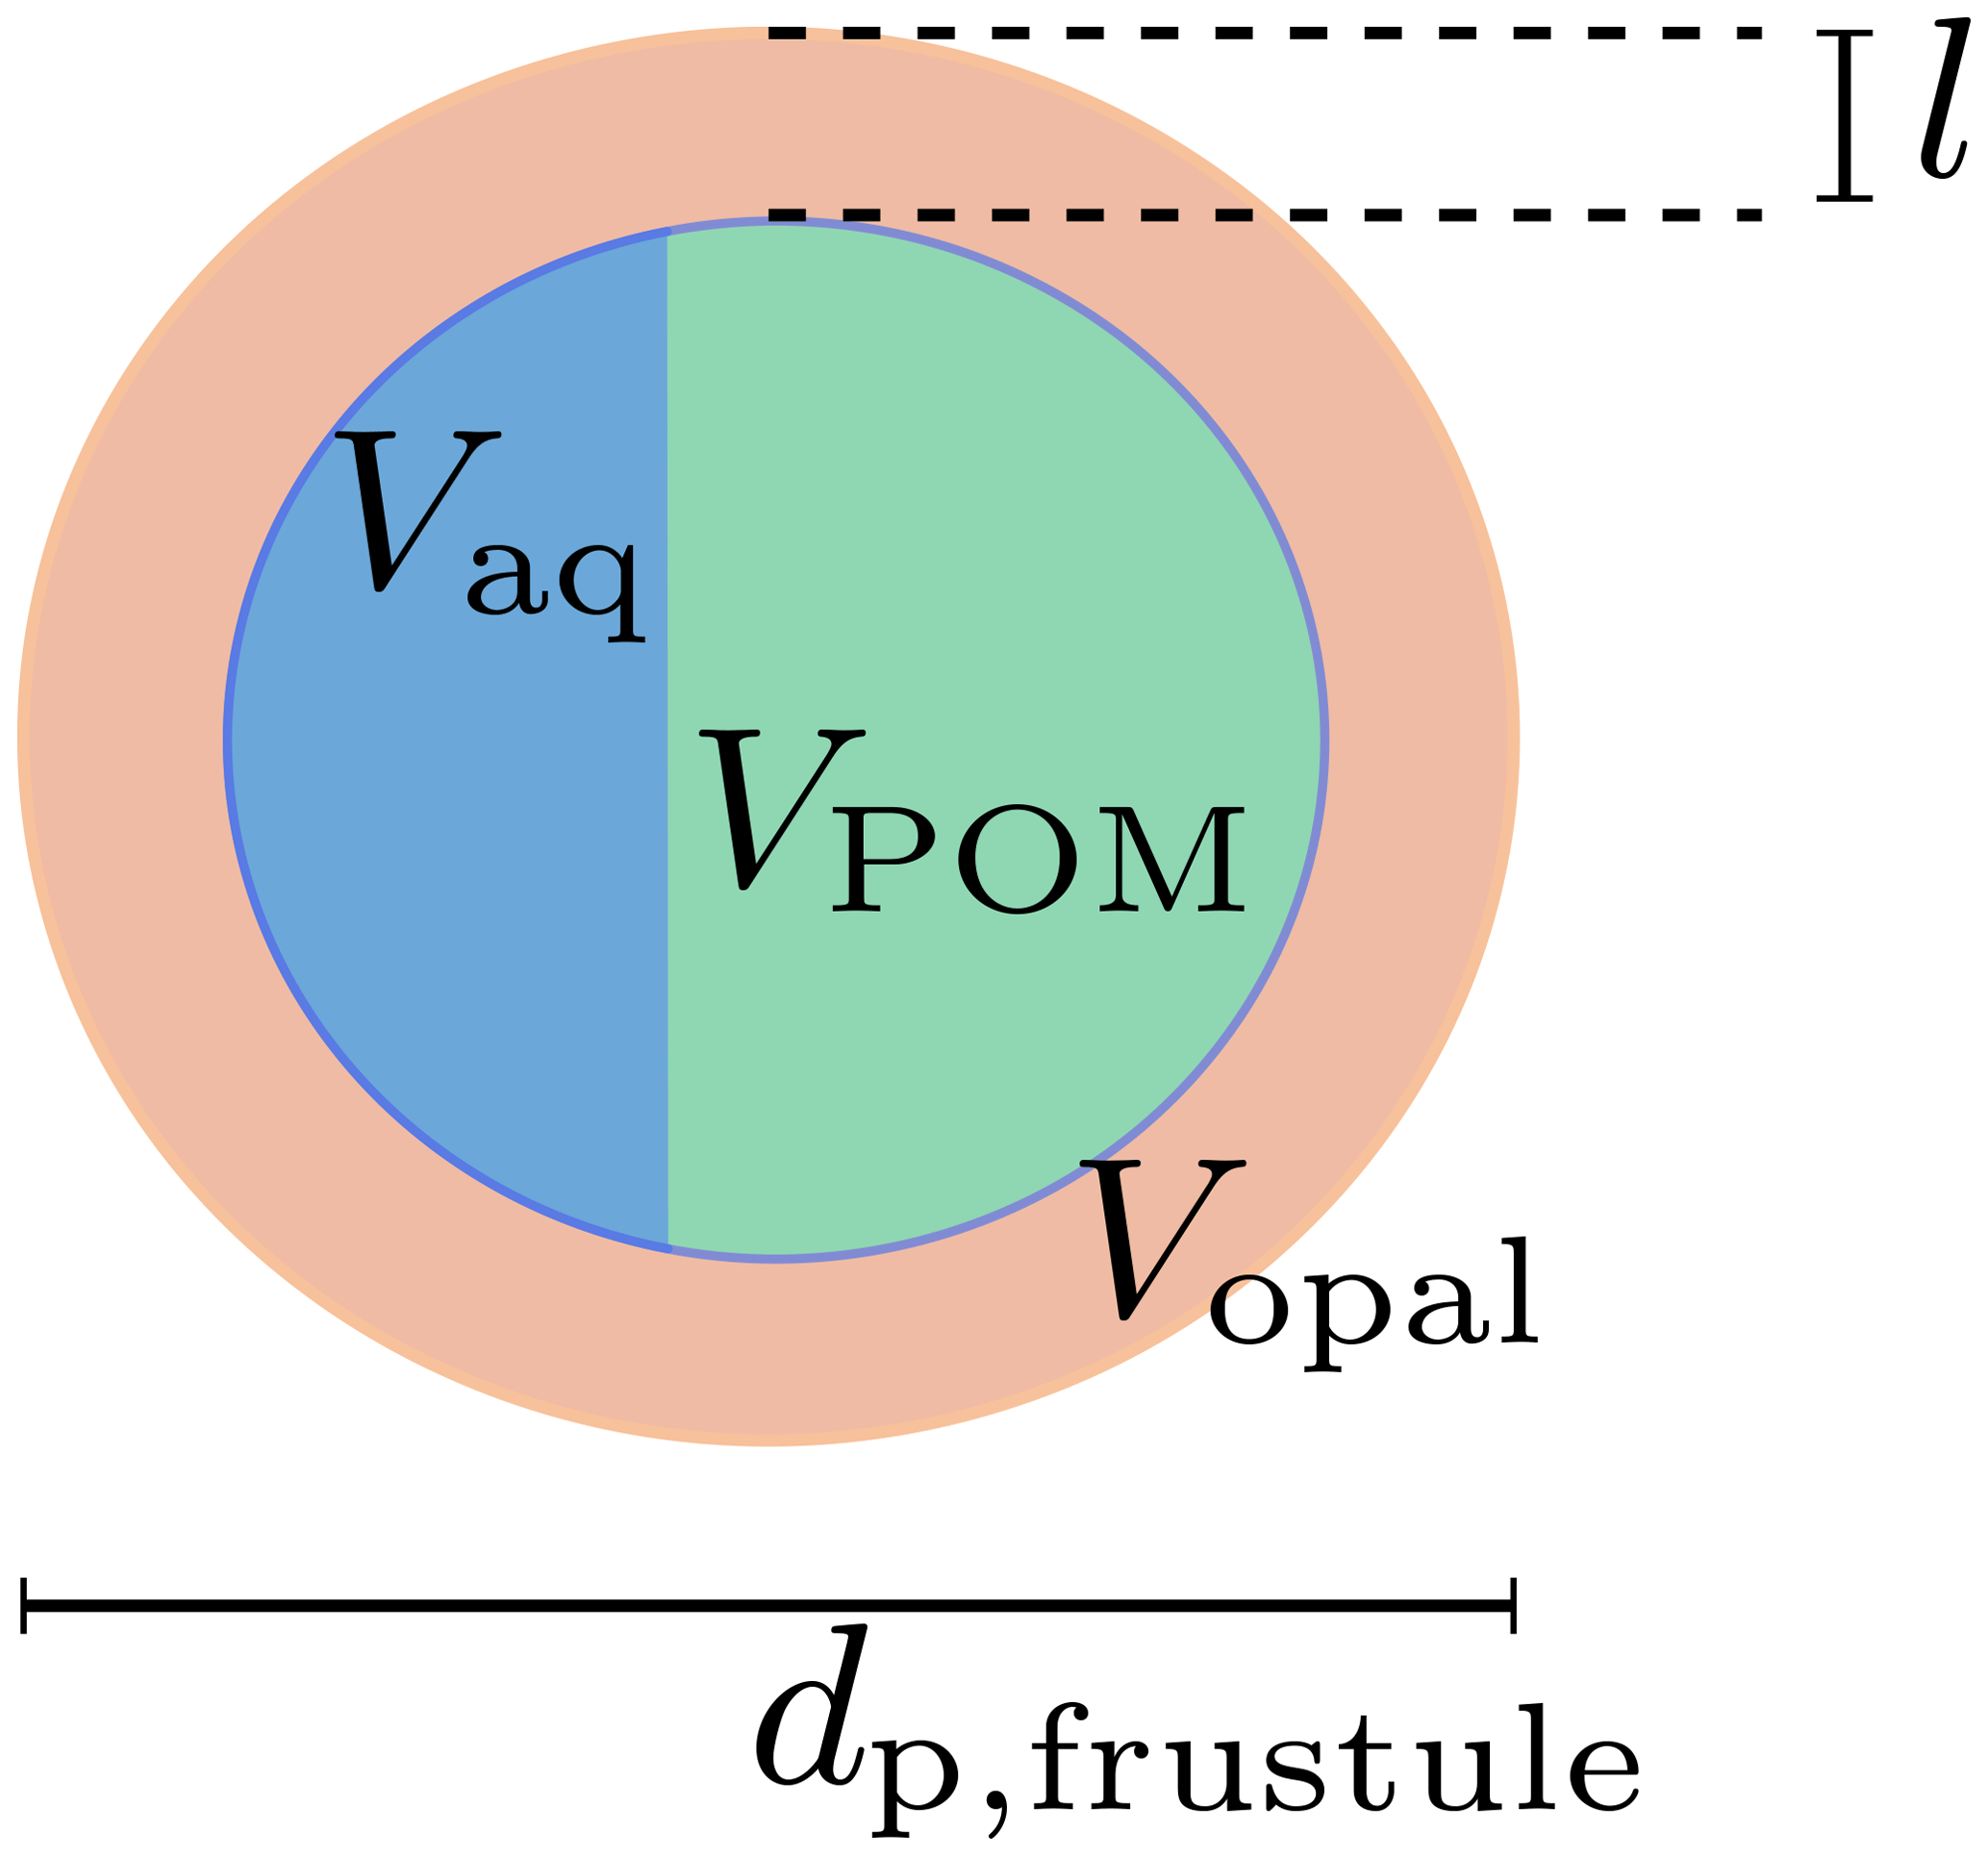
Figure 2Diatom frustule and the remineralization state-dependent composition of the void. l denotes the thickness of the opal shell with volume Vopal; Vaq and VPOM are the encapsulated volumes of water and POM, respectively. dp,frustule is the diameter of the diatom frustule.
The opal volume of a modeled diatom is
where dp,fustule is the diameter of the diatom, whose opal shell thickness l is expressed in terms of the fixed opal-to-phosphorus formation ratio. The number of diatom frustules per unit volume,
can therefore be deduced from the present opal concentration, [opal], and the opal mole-to-weight factor Ropal according to Eq. (12). We assume that the modeled detritus pool can be split into a free external, non-diatom and a diatom frustule-related, void-filling detritus part. We further assume that the external pool is remineralized before the intracellular pool of volume VPOM and thus neglect cell lysis observed prior to aggregation (Armbrecht et al., 2014) and rather assume mineral protection of detritus (Hedges et al., 2001). If more detritus is remineralized than the frustules void would hold, it is replaced with the respective volume of water Vaq of density ρ. The frustule density is thus
During growth and decay, diatoms excrete TEPs which are positively buoyant and possess a density of about ρTEP=700 to 840 kg m−3 (Azetsu-Scott and Passow, 2004; Mari et al., 2017). TEPs are suggested to play a prominent role in aggregation processes, as they are probably sticky and thus enhance aggregation (Dam and Drapeau, 1995; Passow, 2002). In HAMOCC, phytoplankton excretion of TEPs is not resolved explicitly. We therefore treat TEPs virtually and assume a linear dependency of diatom stickiness and density on the freshness of detritus, defined as the mass ratio between the actual amount of detritus, me=nfrustule VPOM ρdet, and the potential mass of detritus linked to diatom frustules, . An additional underlying assumption is that TEPs are remineralized with the same rates as normal detritus. Hence, we define the stickiness of diatoms as
for mpotential>0, where αTEP and αopal are the stickiness of TEPs and pure opal, respectively. To account for the additional buoyancy through TEPs (Jokulsdottir and Archer, 2016; Mari et al., 2017), here we simplify and assume that the frustule density is lowered by TEPs in dependency on the freshness of detritus. Eventually, the diatom density, ρdiatom, becomes
TEPs thus have a 2-fold effect on aggregates in our model: (i) TEPs increase stickiness and loosen the aggregate structure, thus decreasing the fractal dimension of aggregates, and (ii) TEPs decrease the fresh diatom frustules' density and thus add buoyancy without violating tracer mass conservation (see also model discussion in Sect. 3.10).
2.3 Temperature-dependent opal dissolution and POC remineralization
Marine aggregates tie heterogeneous components together that are disparately remineralized or dissolved. By contrast, in the standard model, detritus, opal and CaCO3 were sinking separately from each other, and the global remineralization and dissolution rates are tuned independently because the processes are artificially decoupled. In M4AGO, remineralization of detritus and dissolution of, in particular, opal is tightly linked through the same sinking velocity which let us re-evaluate and revise the formulations for opal dissolution and remineralization.
Opal dissolution is temperature-dependent (Ragueneau et al., 2000, 2006) and is microbially mediated (Bidle et al., 2002). Intact diatom frustules are protected from dissolution by an organic matrix (Lewin, 1961). Once the organic protection surrounding the silicate frustule becomes utilized by temperature-dependent microbes, they initiate and mediate the dissolution of opal (Bidle et al., 2002). Hence, opal dissolution follows a sequential process: (i) an initial temperature-dependent remineralization of the organic coating of the silicate frustule and (ii) the microbially mediated dissolution of opal with a temperature dependency of Q10≈2.3 (Bidle et al., 2002). We here focus on the temperature-dependent microbially mediated dissolution and introduce a Q10 temperature-dependent opal dissolution:
where ropal is the opal dissolution rate at the reference water temperature Tref,opal and T is the ambient water temperature. In the standard version, we remain with the former linearly temperature-dependent opal dissolution (; Ragueneau et al., 2000; Segschneider and Bendtsen, 2013).
Analogously to opal, we incorporate a temperature-dependent Q10 factor to aerobic POC remineralization (Dell et al., 2011; Mislan et al., 2014) which depends on oxygen concentration, [O2] (Mauritsen et al., 2019), where is the half-saturation constant in Michaelis–Menten kinetics, and rPOC is the remineralization rate at reference temperature Tref,POC:
We keep the anaerobic remineralization temperature-independent, since we do not expect temperature shifts in ocean depths, where oxygen minimum zones appear in HAMOCC. In the standard run, the remineralization rates are temperature-independent ().
2.4 Model setup, parametrization and evaluation
2.4.1 General model setup
The M4AGO sinking scheme was implemented in HAMOCC, which is coupled to the MPIOM (Jungclaus et al., 2013). For the flow of calculations in the M4AGO sinking scheme, see Fig. 3. We run both the standard and the M4AGO run in a GR15/L40 setup with climatological forcing. This translates to a horizontal resolution of about 1.5∘ and 40 uneven vertical layers with highest resolution in the first few hundred meters of the ocean. The climatological atmospheric boundary conditions are derived from the second European Centre for Medium-Range Weather Forecasts (ECMWF) reanalysis project (ERA-40; Simmons and Gibson, 2000; Röske, 2005). The mean annual cycle of wind stress, heat and freshwater fluxes is resolved on a daily basis. The continental freshwater runoff is provided by means of a runoff model (Röske, 2005). The loss of POM, opal and CaCO3 due to sedimentation and subsequent burial was accounted for through homogeneously applied weathering rates which were adjusted for the standard run (and the M4AGO run): globally, we add ≈99.6 (101.5) G mol P yr−1 as dissolved organic phosphorus and ≈3.2 (2.3) T mol Si yr−1. To compensate for the loss of CaCO3, we add ≈17.2 (26.5) T mol C yr−1 to surface dissolved inorganic carbon (DIC) and a corresponding amount to surface total alkalinity, AT, as in DIC : 2AT. We start the M4AGO run from the standard run at steady state and spin it up until steady state is reached in surface and mesopelagic waters, which translates to 1700 model years. Through the long overturning times of the global ocean, we still see drifts of nutrient concentrations in deep, old North Pacific waters at this state (i.e., on average ∼7.1 µmol P m−3 per century below 2000 m, which amounts to a centennial change of about 0.25 %). We neglect this drift, as we focus on the aggregate properties and their effects on POC fluxes throughout the euphotic and mesopelagic zone.
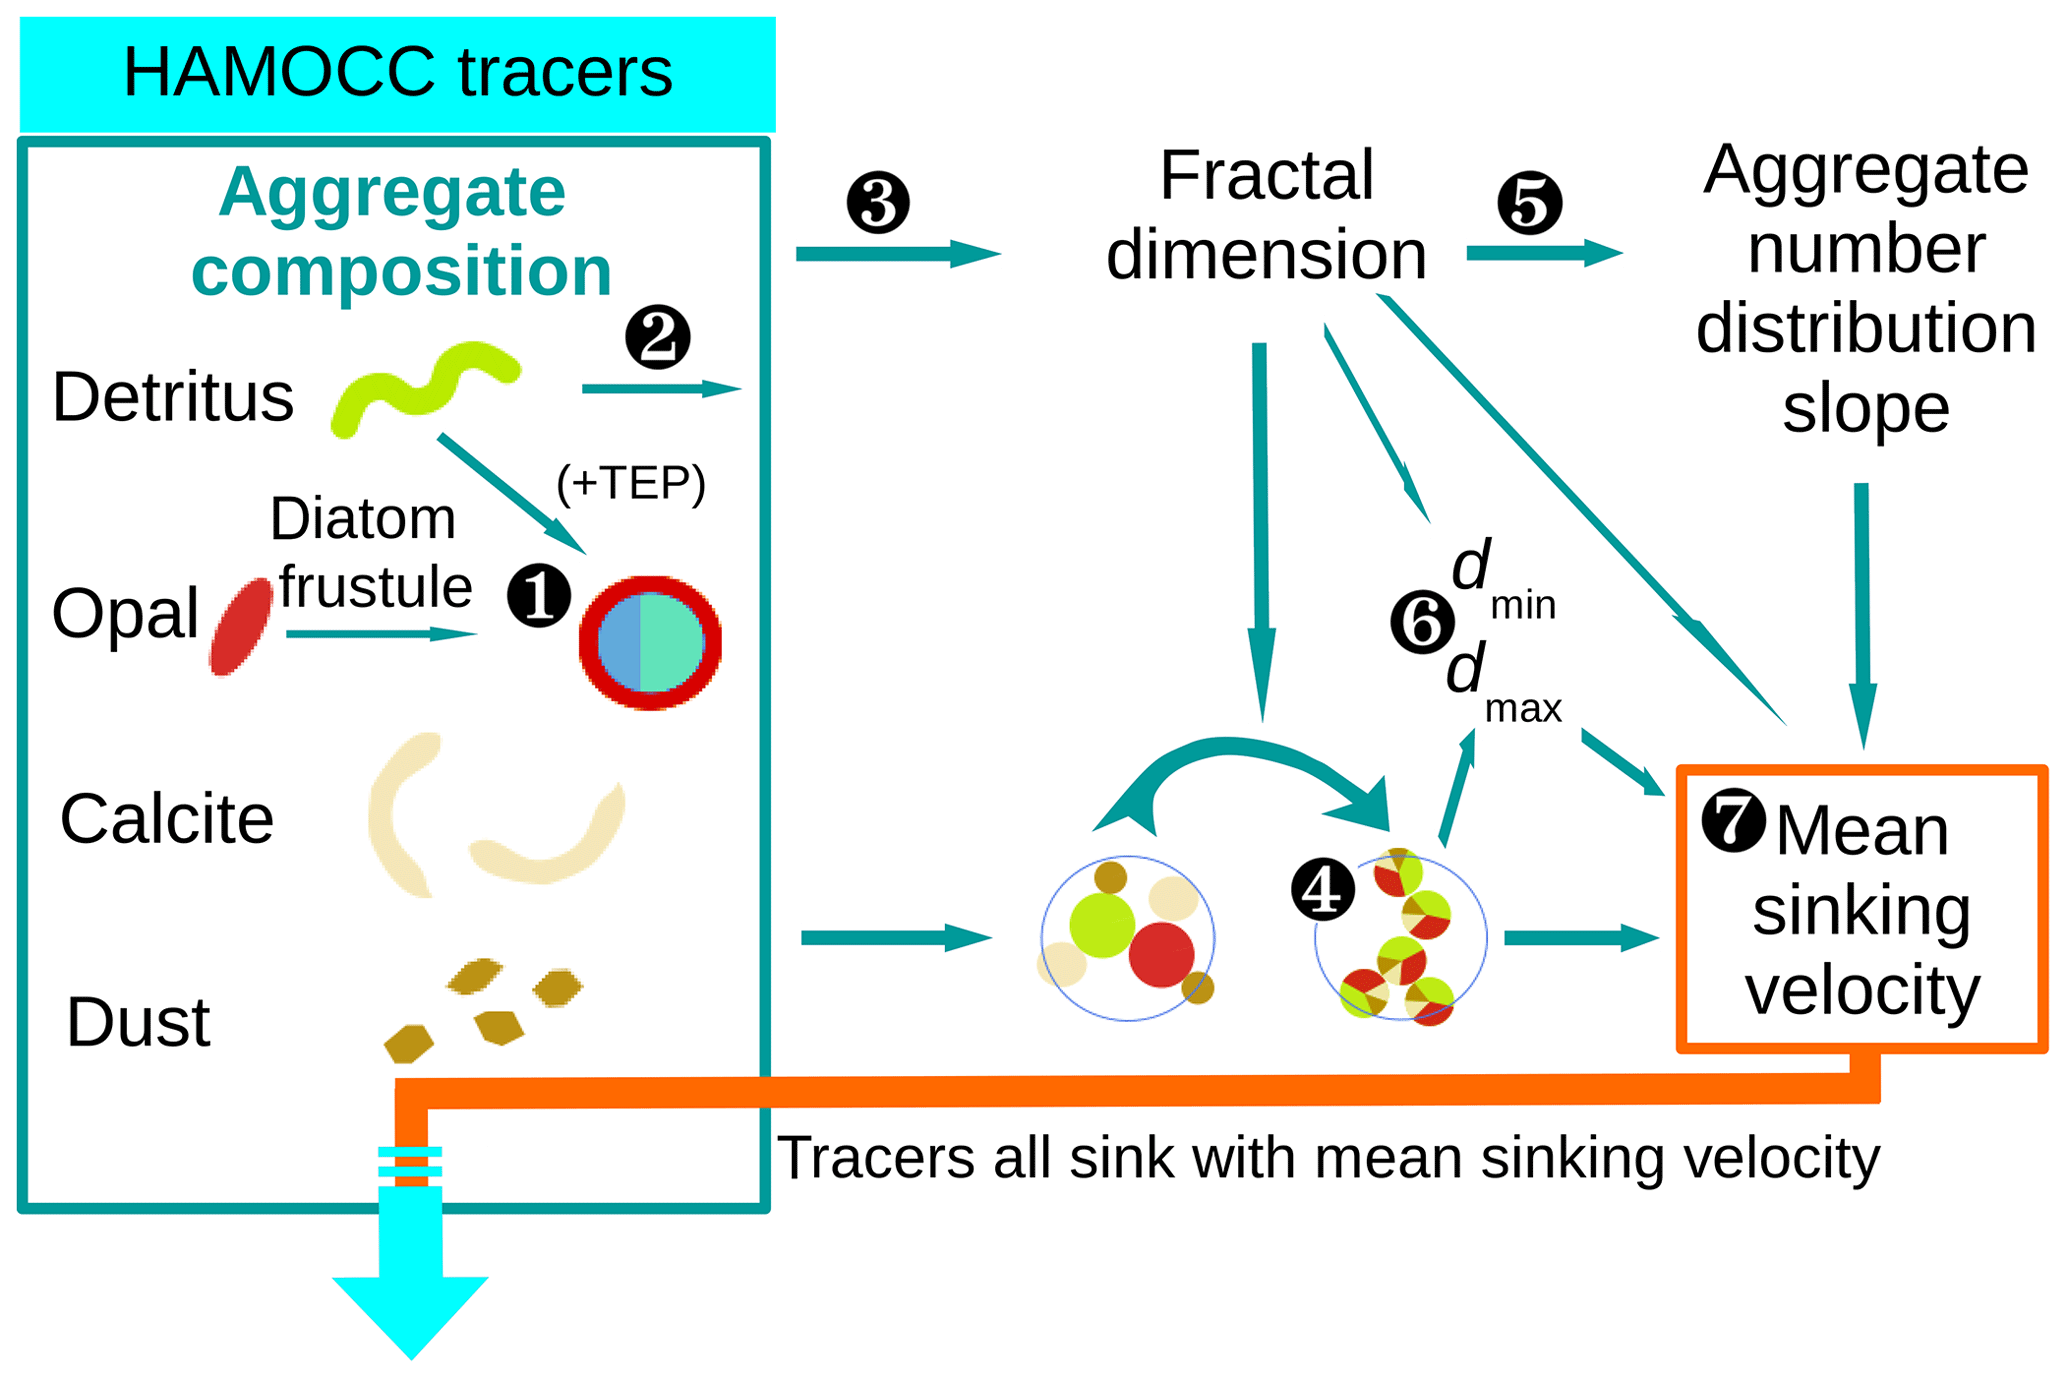
Figure 3Flow diagram of calculations for the M4AGO sinking scheme carried out at every ocean grid point and time step. Marine aggregates in M4AGO are composed of spherical primary particles derived from HAMOCC tracers. Primary particles featuring size, density and stickiness are detritus, diatom frustules, coccoliths (CaCO3) and dust minerals. ![]() The number of diatom frustules (Eq. 26), related diatom density (Eq. 29) and stickiness (Eq. 28) are estimated from opal and detritus concentration. Diatoms are then considered to be primary particles which feature particular characteristics.
The number of diatom frustules (Eq. 26), related diatom density (Eq. 29) and stickiness (Eq. 28) are estimated from opal and detritus concentration. Diatoms are then considered to be primary particles which feature particular characteristics. ![]() The remaining detritus is considered to be detritus primary particles.
The remaining detritus is considered to be detritus primary particles. ![]() The calculation of the fractal dimension (Eq. 24) and
The calculation of the fractal dimension (Eq. 24) and ![]() the calculations of mean primary-particle size (Eq. 11) and density (Eq. 13) are carried out.
the calculations of mean primary-particle size (Eq. 11) and density (Eq. 13) are carried out. ![]() The fractal dimension determines the number distribution slope (Eq. 21).
The fractal dimension determines the number distribution slope (Eq. 21). ![]() The minimum, dmin=〈dp〉, and maximum, dmax, aggregate diameter (Eq. 19) are estimated.
The minimum, dmin=〈dp〉, and maximum, dmax, aggregate diameter (Eq. 19) are estimated. ![]() The mean sinking velocity (Eq. 20), with which the tracers sink, can eventually be determined.
The mean sinking velocity (Eq. 20), with which the tracers sink, can eventually be determined.
2.4.2 Parameters of the M4AGO scheme
The M4AGO sinking scheme introduces a set of new parameters, in particular the primary-particle characteristics, which require constraining and tuning (summarized in Table 1).
Hansen and Kiørboe (1997)Simon et al. (2014)Filella (2007)Kiørboe et al. (1990)Dam and Drapeau (1995)Alldredge and McGillivary (1991)Tambo and Hozumi (1979)Jiang and Logan (1991)Maher et al. (2010)Mahowald et al. (2014)Young and Ziveri (2000)Henderiks (2008)Litchman et al. (2009)Logan and Wilkinson (1990)Kranenburg (1999)Bidle et al. (2002)Mislan et al. (2014)Dell et al. (2011)Bidle et al. (2002)Iversen and Ploug (2010)Azetsu-Scott and Passow (2004)Fettweis (2008)Fettweis (2008)Fettweis (2008)Takahashi et al. (1985)Alldredge and Gotschalk (1988)Kiørboe et al. (2001)Table 1Model parameters for M4AGOa and, if adjusted in comparison to the standard HAMOCC, the standard values.

a Refers to manual tuning of parameter – all other parameters were fixed from beginning. b Measured dissolution and remineralization rates include temperature-dependence, which is represented by the Q10 factor in M4AGO.
We applied HAMOCC's standard sediment densities for opal, CaCO3 and dust to the densities of primary particles, namely ρopal=2200 kg m−3, ρcalc=2600 kg m−3 and ρdust=2600 kg m−3. For suspended detritus, we chose ρdet=1100 kg m−3 (Fettweis, 2008). As density of TEPs, we applied ρTEP=800 kg m−3, which is within the measured range of 700 to 840 kg m−3 (Azetsu-Scott and Passow, 2004).
While the density of primary particles is comparably well constrained, the adhesion forces of primary particles, namely related stickiness and fractal dimension of aggregates, are less studied and are weakly constrained. There is still no standardized way to investigate stickiness, fractal dimension and their interdependence for aggregates in natural waters. Stickiness is experimentally defined as the interparticle attachment rate divided by the interparticle collision rate. Uncertainties in either of the two rates, e.g., due to ignoring the fractal structure of aggregates, aggregate permeability, etc., directly affect the calculated stickiness (Filella, 2007). In addition, stickiness is phytoplankton species-specific (Hansen and Kiørboe, 1997) and depends on the growth phase (Simon et al., 2014). The methodological limitations, the heterogeneity of marine aggregate constituents and their variable formation process lead to a wide spread of indirectly inferred values for stickiness and fractal dimension (see, e.g., Filella, 2007, for a broader overview). Diatom aggregates seem to feature a wide spread of fractal dimensions ranging from df≈1.26 to df≈2.46 (Alldredge and Gotschalk, 1988; Guidi et al., 2008) and 〈α〉 of about 0.03 to 0.88 (Kiørboe et al., 1990; Dam and Drapeau, 1995; Alldredge and McGillivary, 1991). Indirectly inferred fractal dimensions for reworked aggregates exhibit values of df≈2.26 to df≈2.46 (Guidi et al., 2008), and mineral-dominated aggregates also feature high fractal dimensions of about df≈2 (Winterwerp, 1998) to df≈2.6 (Kranenburg, 1999) and low stickiness of (Tambo and Hozumi, 1979). Since stickiness of in situ primary particles is seldom measured, we choose it to our best knowledge and order the stickiness for modeled primary particles according to the mean stickiness of observed aggregate types: (see also Table 1). Hence, detritus and TEP-rich aggregates are modeled with a loose structure and low fractal dimension, while degraded, mineral-rich aggregates are more compact and thus feature a higher fractal dimension (see Eq. 24) which is in congruence with the present conceptual understanding of aggregates becoming compacted during their descent (Mari et al., 2017). For the minimum and maximum fractal dimension of marine aggregates, we chose conservative bounds of 1.6 (Logan and Alldredge, 1989; Li and Logan, 1995; Alldredge, 1998) and 2.4 (in the range of df≈2.26 to 2.46 for reworked aggregates; Guidi et al., 2008), which is well within the observed range of 1.26 (Logan and Wilkinson, 1990) to 2.6 (Kranenburg, 1999) for marine particles.
For the primary-particle sizes, we conceptually assume that the tracer characteristics of opal and CaCO3 are primarily related to phytoplankton mineral structures such as diatom silicate frustules and the coccoliths of coccolithophores. This implies that modeled zooplankton egests biogenic mineral structures of algae, while their own larger mineral body structures play, in numbers, a minor role in biogenic mineral fluxes (as described by, for example, Berelson et al., 2007; Ziveri et al., 2007; Fischer and Karakas̨, 2009; Fischer et al., 2016). Coccolith diameters range from about 1.5 to 15.5 µm (Young and Ziveri, 2000; Henderiks and Pagani, 2008; Henderiks, 2008). The globally ubiquitous coccolithophore Emiliania Huxleyi (Read et al., 2013) exhibits coccoliths of about 3 to 4 µm in diameter (Young and Ziveri, 2000). We set µm, which is thus at the lower bound of the observed range, to account for the volumetric density effect of non-spherical plate-like coccoliths. Diatom frustules feature sizes of a few micrometers to millimeters (Armbrust, 2009), with a dominant size range of about 12 to 58 µm (equivalent spherical diameter of body volumes 103–105 µm3; Litchman et al., 2009). We define the diatom frustule size as µm. The primary-particle size of detritus is weakly constrained and likely ranges from sub-micrometers of microgels and bacteria to millimeter scales of zooplankton body structures (Verdugo et al., 2004). We here chose µm. Aeolian dust particles feature a typical size ranging from submicron to about 20 µm in size, with a mass median diameter of about 1.5 to 3 µm (Maher et al., 2010; Mahowald et al., 2014). In summary, we assumed the following order of primary-particle sizes for the tracers: .
The size distribution-limiting maximum aggregate diameter, dmax, is variable in the model domain and depends on the critical particle Reynolds number Recrit. Recrit and its potential dependency on aggregate properties are weakly constrained, which lets us fix the value globally to Recrit=20, a conservative value compared to the measured maximum particle Reynolds number of up to 32 by Alldredge and Gotschalk (1988).
Opal dissolution and detritus remineralization are Q10 temperature-dependent in M4AGO. Typically, the Q10 factor for biological processes is in the range between 2 and 3. We here chose (similar to Mislan et al., 2014, who applied ). For opal, we tuned compared to 2.3 suggested by Bidle et al. (2002).
2.4.3 Model tuning and evaluation
The newly parameterized processes of sinking and remineralization directly affect the transfer efficiency and thus the climatological nutrient fields. This close connectedness hampers the clear distinction between data employed for model tuning or for model evaluation, when comparing the model results to literature values for transfer efficiency (Weber et al., 2016) and World Ocean Atlas data (Garcia et al., 2014a, b). The transfer efficiency, in combination with the general circulation pattern, affects the nutrient climatology in the long term. In turn, sinking velocity, remineralization and dissolution define the transfer efficiency on timescales of days to months. A direct comparison of modeled to observed sinking velocities and fluxes is challenging, as scale dissimilarities introduce uncertainty for comparisons between models and observations (Bisson et al., 2018). Furthermore, sediment trap data for POC and mineral fluxes exhibit high uncertainties which complicate model comparisons and even make different parameterizations for vertical fluxes undistinguishable (Cael and Bisson, 2018). As a consequence, we perform a general evaluation of our model results.
Long simulations with high computational costs to reach steady state are required in the process of model tuning, which prevents intensive parameter variations. We performed parameter variations aiming at a quantitative agreement with the transfer efficiency of Weber et al. (2016). Since the adjustment of the sinking velocity versus the remineralization and dissolution rates, and thus the transfer efficiency, occurs within a few years, this strategy was useful for selecting for promising parameter sets. With respect to the primary-particle characteristics, we kept the stickiness values, once chosen to our best knowledge, untouched and minimally varied the primary-particle sizes within the range of literature values. We primarily focused on tuning the remineralization and dissolution rates of POC and opal, respectively. We choose this strategy since reliable remineralization and dissolution rate measurements are available to evaluate the tuned rates (see ranges in Table 1). We aimed at keeping global mean values of primary production, export production of POC, opal and CaCO3, and their fluxes to sediment within estimated literature ranges. This let us minimally vary the fraction of maximum CaCO3 production, cmax, in M4AGO compared to the standard run.
We here compare and evaluate the M4AGO run with respect to (i) where possible, the standard run, (ii) the regional transfer efficiency, as derived by Weber et al. (2016), (iii) World Ocean Atlas data from the World Ocean Database (Boyer et al., 2013; Garcia et al., 2014b), and, independently, (iv) sediment trap-sampled POC and biogenic mineral fluxes compiled by Mouw et al. (2016a, b). The Mouw et al. (2016a, b) data were time- and depth-weighted to receive monthly climatological values for the respective grid boxes in MPIOM, where the sediment trap records were taken. Model results are presented as yearly mean of the last simulated year, unless stated otherwise.
In the following, we evaluate the global net primary production, the export of POC to the mesopelagic zone and the associated pattern of biogenic mineral fluxes (Sect. 3.1). In M4AGO, the pattern of POC and associated minerals determines the aggregate properties, which we explicate in Sect. 3.2. In Sect. 3.3, we present the global pattern of transfer efficiency. In Sects. 3.4 and 3.5, we examine the contributions of remineralization rates, sinking velocity and aggregate properties to the transfer efficiency pattern. Thereafter, we evaluate the modeled rain ratios (Sect. 3.6) and the biogeochemical tracer distributions (Sect. 3.7). In Sect. 3.8, we discuss the consequence of the transfer efficiency pattern on regional CO2 fluxes. Subsequently, we examine the sensitivity of the transfer efficiency to selected model parameters (Sect. 3.9) and conclude with a critical review of underlying assumptions of M4AGO (Sect. 3.10).
3.1 Spatial distribution of POC export fluxes and associated biogenic minerals
The global pattern of the depth-integrated primary production is dominated by global circulation and thus nutrient transport. The global pattern of annual mean integrated primary production therefore remains similar between the standard and the M4AGO run (Fig. 4). Globally integrated, the annual net primary production is ≈55.3 Gt C yr−1 in M4AGO compared to ≈44.7 Gt C yr−1 in the standard run.
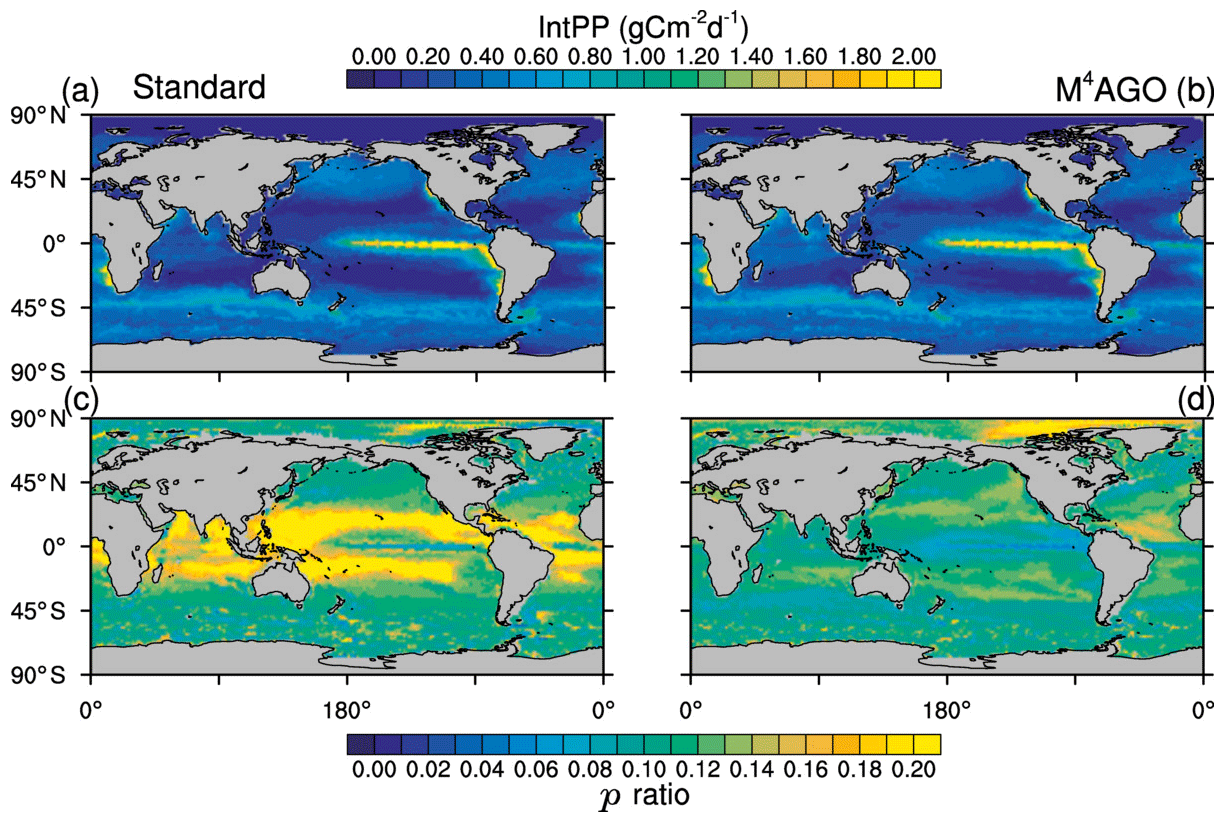
Figure 4Yearly mean integrated primary production in (a) the standard and (b) the M4AGO run. The export efficiency (p ratio) in (c) the standard and (d) the M4AGO run.
The ratio between carbon export out of the euphotic zone at depth z0=100 m and the net primary production, NPP,
provides an estimate of how efficient the export is with respect to the net primary production. Globally, about 5.56 and 6.28 Gt C yr−1 is exported out of the euphotic zone in M4AGO and the standard run, respectively. In the standard run, the subtropical gyres exhibit p ratios of more than 0.2, and the high latitudes feature lower export efficiency (Fig. 4c). In the M4AGO run, the equatorial Pacific exhibits the lowest export efficiencies, the subtropical gyres feature maximum values of about 0.14–0.16 and the Arctic region maximum value is about 0.20 (Fig. 4d). The M4AGO run thus possesses smaller latitudinal variability in the p ratio compared to the standard run.
In comparison to previous estimates on global primary production, both model runs are well within the range of 30 to 70 Gt C yr−1 and show similar pattern of NPP (Carr et al., 2006). The higher NPP in M4AGO is due to the enhanced remineralization rates in surface waters, which also lead to the lower export efficiencies in the equatorial and subtropical regions. Estimates of the export efficiency from satellite data, in situ observations or models lead to partly contrasting patterns (e.g., Lutz et al., 2002; DeVries and Weber, 2017; Henson et al., 2011, 2012; Buesseler, 1998; Neuer et al., 2002; Siegel et al., 2014; Cram et al., 2018). In contrast to our two model runs, the highest p ratios are suggested to be found in the North Pacific and Antarctic Ocean (e.g., Dunne et al., 2005; Henson et al., 2011; DeVries and Weber, 2017). In the tropical and subtropical regions, the M4AGO run reduces the bias with respect to previously found low export efficiencies of about 1 % to 10 % (Buesseler, 1998; Neuer et al., 2002).
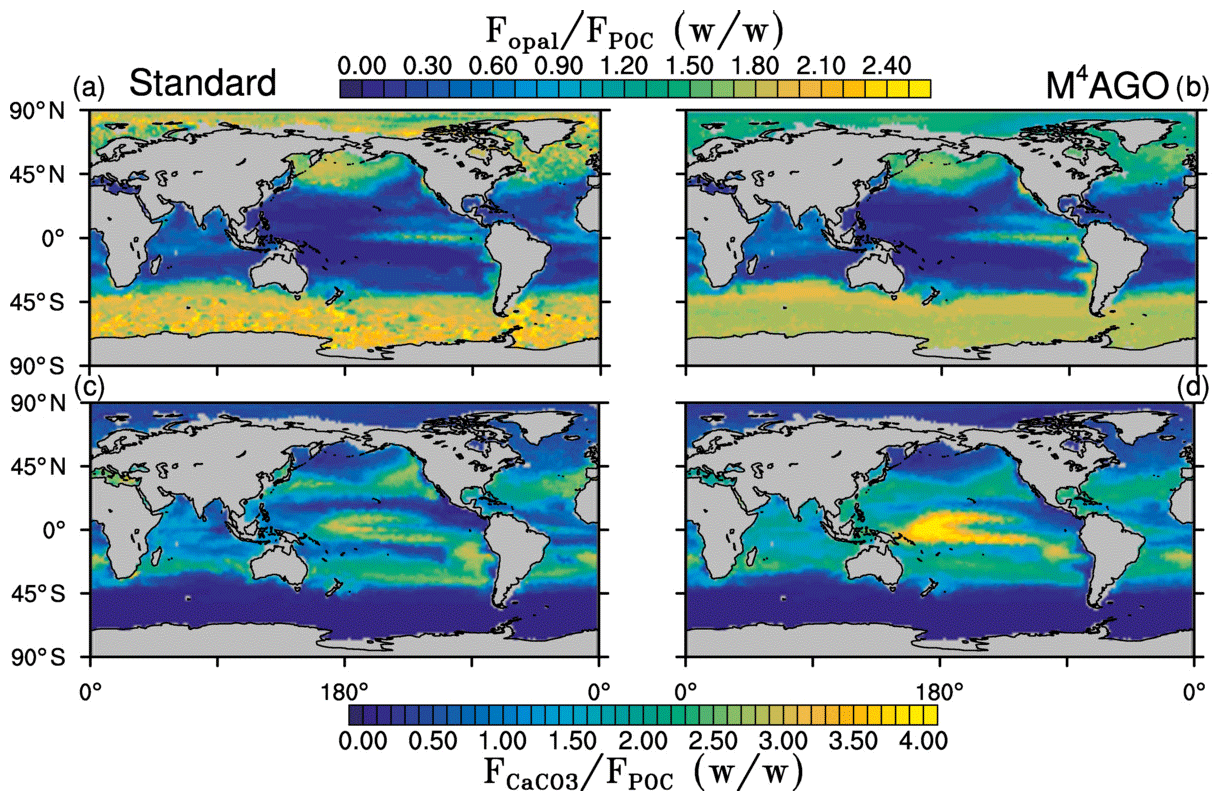
Figure 5Yearly mean flux ratios of opal (SiO2) to POC in (a) the standard and (b) the M4AGO run. Yearly mean flux ratios of CaCO3 to POC in (c) the standard and (d) the M4AGO run.
The exported POC is accompanied by biogenic minerals and dust. The export flux ratios between opal and detritus exhibit a clear latitudinal pattern, with high values in the high latitudes and upwelling regions compared to the subtropical gyres (Fig. 5a, b). Both model simulations show a similar pattern of opal-to-detritus flux ratios. Higher CaCO3-to-detritus flux ratios are confined to equatorial and subtropical regions where silicate depletion favors calcification (Fig. 5c, d). M4AGO exhibits a higher CaCO3-to-detritus-mass flux ratio in the western tropical and subtropical Pacific than the standard run. The higher remineralization in the surface waters in this region reduces the amount of detritus that can coalesce with CaCO3. The spatial distributions of sinking tracers and their ratios prime the marine aggregate properties in M4AGO.
3.2 Spatial distribution of marine aggregate properties
The spatial patterns of detritus and mineral fluxes are reflected in the distribution of aggregate properties (cf. pattern in Figs. 5b and d to 6a–f). The primed characteristics further evolve while aggregates descend through the water column and become remineralized. Hence, the information of the tracer distribution in the euphotic zone propagates into the mesopelagic zone. The mean primary-particle density, 〈ρp〉, ranges at export depth (100 m) from about 1100 kg m−3 in diatom-dominated regions to 1850 kg m−3 in the western Pacific, where CaCO3-to-detritus export ratios are high (Figs. 5b and d and 6a). In the Arctic, some regions harbor 〈ρp〉 of maximum 2600 kg m−3 where aggregates in our model are dominated by dust particles (Fig. 6a). Particularly in regions of high CaCO3-to-detritus export ratios, 〈ρp〉 increases with depth (Figs. 6a and g and 7a). Accordingly, the volume-weighted mean excess aggregate density, Δ〈ρf〉V, exhibits the same pattern as 〈ρp〉, while it ranges from about 2 kg m−3 in diatom-dominated regions to 35 kg m−3 in calcifier-dominated regions (Fig. 6d). Note that we chose Δ〈ρf〉V to account for the increasing porosity with size (Eq. 6), thus decreasing aggregate excess density with size (Eq. 5). As a mean value, Δ〈ρf〉V thus underestimates excess density for small aggregates, while it overestimates excess density for large aggregates. Generally both 〈ρp〉 and Δ〈ρf〉V tend to increase with depth (Fig. 7a, d). In the Pacific, CaCO3 as ballasting mineral becomes dissolved below the lysocline, and modeled 〈ρp〉 decreases again in the deep ocean (Fig. 7a, d). The mean primary-particle size, 〈dp〉, ranges between the attributed minimum and maximum primary-particle size of tracers, 2 to 20 µm, respectively. Mean primary-particle size shows an opposing pattern to 〈ρp〉 (Figs. 6a, b, g and h and 7a and b), since regions are either dominated by small, dense coccoliths or large, less dense diatom frustules. The global pattern of 〈dp〉, primed through export fluxes of detritus and minerals, varies only little throughout the water column (Fig. 7b), since we assumed invariance of primary-particle size to remineralization, dissolution and other processes.
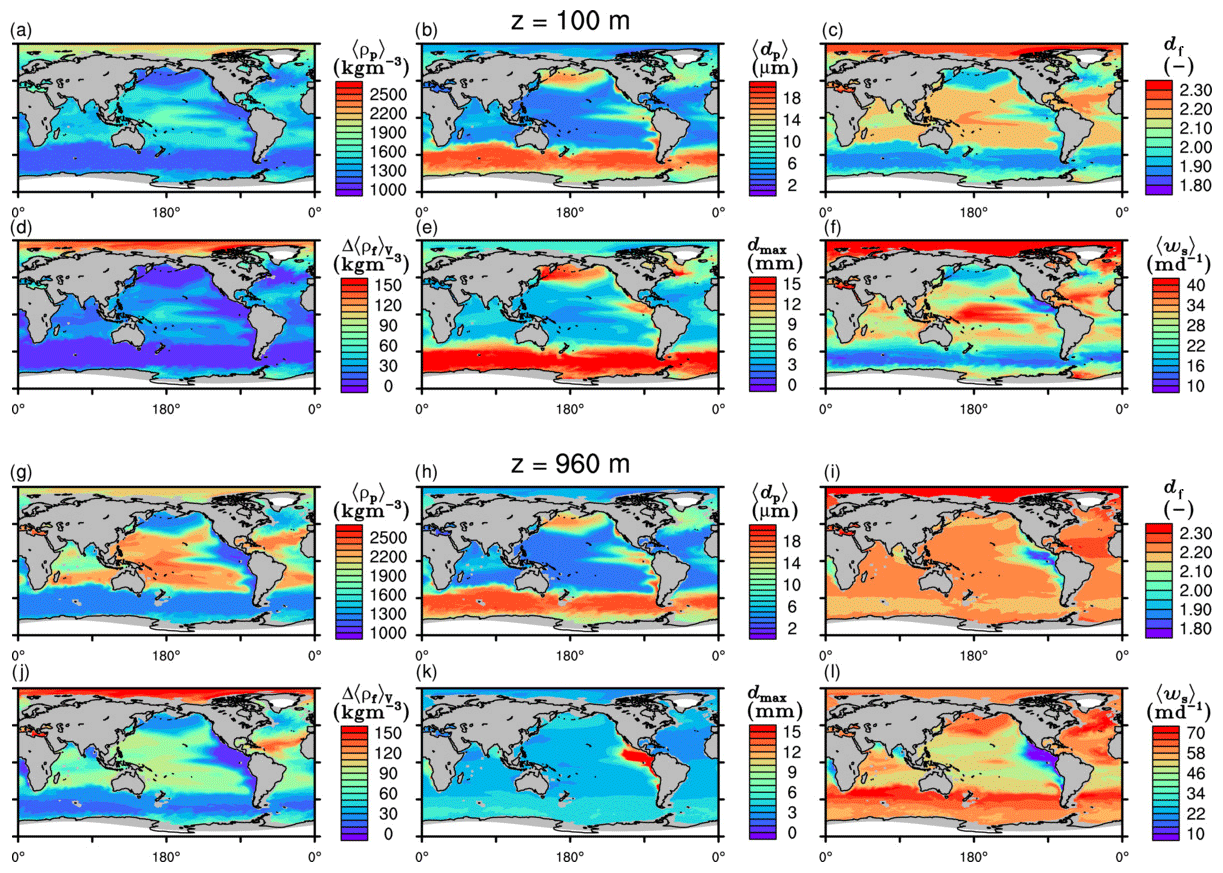
Figure 6Modeled marine aggregate properties at (a–f) 100 m and (g–l) 960 m depth. Mathematical symbols are as follows: 〈ρp〉 – mean primary-particle density; 〈dp〉 – mean primary particle diameter; df – microstructure (fractal dimension); Δ〈ρf〉V – volume-weighted mean excess aggregate density; dmax – maximum aggregate diameter; 〈ws〉 – concentration-weighted mean sinking velocity of aggregates. Note that 〈ws〉 comprises the full range of many micrometer-sized to rare, large aggregates with low (O(1 m d−1)) and high (O(>100 m d−1)) sinking velocities. For the mean stickiness, 〈α〉, volume-weighted mean porosity, 〈ϕ〉V, and the number distribution slope, b, see Fig. A1.
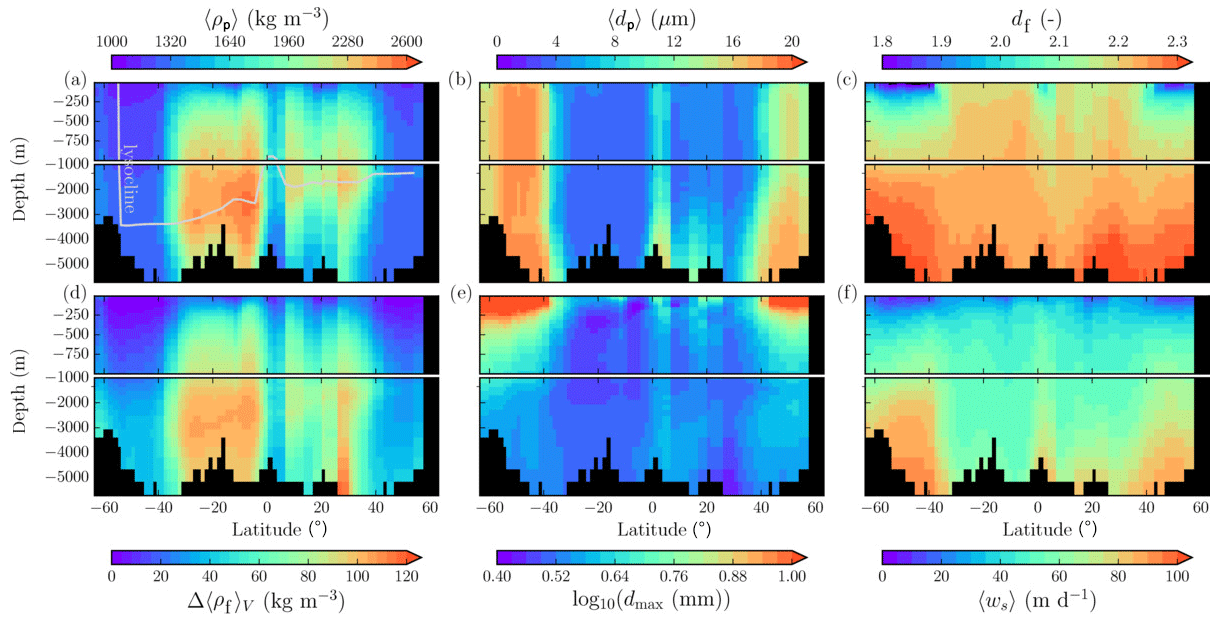
Figure 7Modeled marine aggregate properties on the Pacific WOA transect P16, which is located at about 150∘ W. For symbol descriptions, see caption of Fig. 6.
Our simulated dmax is largest in the surface waters of the Southern Ocean and upwelling regions, where TEP-rich aggregates prevail. In calcifier-dominated regions, the maximum aggregate size is small. Generally, dmax tends to decrease with depth (Fig. 7e).
The microstructure of marine aggregates, modeled as fractal dimension, df, shows a pronounced spatial distribution. At 100 m depth, df ranges from about 1.7 in upwelling regions and the Southern Ocean to about 2.2 in the western equatorial Pacific and features maximum values of 2.38 in Arctic regions (Fig. 6c). With increasing depth in the mesopelagic zone, aggregates tend to experience a rapid compaction as df increases (Fig. 7c). Ongoing POM remineralization during aggregates' descent shifts the aggregate composition towards mineral components, which feature lower stickiness in our model. Thus the fractal dimension increases, which mimics compaction of aggregates. The global pattern tends to homogenize with depth at about 1000 m, where modeled aggregates feature df values of about 2.2 (Fig. 6i). Exceptions are upwelling regions, where df remains low, since detritus is slowly remineralized anaerobically in the associated oxygen minimum zones (OMZs). Below 1000 m, df only increases slowly with depth (Fig. 7c).
Particle properties and molecular dynamic viscosity determine the concentration-weighted mean sinking velocity of aggregates, 〈ws〉 (Fig. 6f, l). For 〈ws〉, M4AGO considers particle sizes ranging from few micrometers to millimeters and thus the full size spectrum, where sinking velocities of O(1 m d−1) to O(>100 m d−1) are represented. 〈ws〉 thus can significantly differ from reported sinking velocities for large individual aggregates. At the export depth, 〈ws〉 ranges from about 10 m d−1 in the Southern Ocean and North Pacific region to about 35 m d−1 in the western equatorial Pacific and reaches maximum values of ∼48 m d−1 in dust-dominated Arctic regions (Fig. 6f, l). Upwelling-influenced surface waters tend to show smaller 〈ws〉 than the western equatorial Pacific. Generally, 〈ws〉 appears to increase rapidly with depth within the mesopelagic zone (Fig. 7f). At about 1000 m, the latitudinal pattern changes and the high latitudes, in the Southern Ocean at around 45∘ S, exhibit the highest 〈ws〉 of about 65 m d−1. Along the Equator, outside the OMZs, 〈ws〉 exhibits similarly high values of about 55 m d−1 (Fig. 7f). Inside the OMZs, where remineralization is slower than in oxygenated waters, the detritus residence time is longer and leads to lower 〈ws〉 (Fig. 6l). The subtropical regions, dominated by calcifiers, show a rather homogeneous mean sinking velocity (〈ws〉≈50 m d−1) throughout the water column apart from the first few hundred meters and near bottom regions. By contrast, diatom-dominated waters feature a significantly increasing 〈ws〉 with depth, which reaches values of up to approximately 80 m d−1 (Fig. 7f). Diatom-dominated aggregates in surface waters feature a high buoyancy through TEPs and a loose structure which diminishes with continuous remineralization during their descent.
The aggregate properties entering the M4AGO scheme are all directly or indirectly measurable. The comparison of simulated and measured aggregate properties is, however, difficult, as M4AGO depicts mean values of aggregate populations that in situ encompass heterogeneous composition among size spectra. In addition, measurements are often limited to particular aggregate characteristics, while others remain unconstrained within the same data set. We therefore compare M4AGO to field and laboratory measurements which examine subsets of the simulated aggregate characteristics.
The modeled aggregate excess densities in diatom-dominated regions compare well to former field and laboratory measurements, where marine aggregates showed excess densities of about 0 to ∼10 kg m−3 (Alldredge and Gotschalk, 1988; Ploug et al., 2008; Iversen and Ploug, 2013; Laurenceau-Cornec et al., 2019). In calcifier-dominated regions, aggregate excess densities are about ∼35 kg m−3, which is in the upper range of measured values of 2.1 to 41 kg m−3 (Engel et al., 2009). The increased excess density of CaCO3-dominated aggregates of about 100 to 150 kg m−3 in about 1000 m depth compares well with that of observed fecal pellets egested by coccolith-consuming zooplankton (White et al., 2018). These fecal pellets also show similar mean sinking velocities to our modeled 〈ws〉≈50 m d−1. The change of the excess density is linked to the increasing df of aggregates with depth that is in qualitative agreement with present conceptual understanding (Mari et al., 2017). The increasing df depicts the expected continuous repacking of aggregates and the zooplankton-mediated compaction in fecal pellets. The latter particularly takes place in the upper few hundred meters of the ocean and is a major pathway of coccolith transport (De La Rocha and Passow, 2007; Honjo, 1976).
The general difference in typical size between diatom-rich aggregates and CaCO3 shell-enriched aggregates compares well to observations that also showed smaller CaCO3-dominated aggregates (Biermann and Engel, 2010). The decreasing dmax with depth is in qualitative agreement with observed vertically decreasing aggregate mean diameters (De La Rocha and Passow, 2007). Decreasing maximum aggregate sizes with depth and reduced organic matter content also agree qualitatively well with experiments of Hamm (2002) and Passow and De La Rocha (2006). Both studies showed a significant decrease in aggregate size with increasing mineral components. In their experimental setups, it remains elusive if a certain threshold of carrying capacity of POM was reached (Passow and De La Rocha, 2006) or if the balance between adhesive forces within the aggregates and the sinking-induced shear forces (Adler, 1979; Brakalov, 1987) was shifted towards smaller aggregates. It is likely that both effects happen at the same time, since natural polymers possess stronger adhesive surface properties than biogenic minerals (Eisma, 1986). In M4AGO, only the compaction towards higher fractal dimensions through lower internal binding forces, expressed as stickiness of the primary particles, is represented. Compaction can coincide with an increasing number of binding links in aggregates, which can lower the overall susceptibility of aggregates to shear stress. In M4AGO, we disregard this effect and keep Recrit globally constant.
In summary, the resulting mean sinking velocity in M4AGO is of same order of magnitude as that found in observations (Alldredge and Gotschalk, 1988; White et al., 2018; Villa-Alfagame et al., 2016). We note, however, that mean sinking velocities estimated from observations potentially overestimate 〈ws〉, as they (i) are methodologically constrained to particles larger than a lower detection limit, which is typically much larger than primary-particle size, and (ii) depend on often uncertain size-to-mass relationships. We emphasize further that our modeled 〈ws〉 embraces numerous slowly sinking aggregates of primary-particle size (ws≈O(1 m d−1)) as well as rare, but large, fast sinking aggregates (ws≈O(1000 m d−1)). This range hence encompasses observations for single cells and coccoliths up to large marine snow aggregates and fecal pellets (Miklasz and Denny, 2010; Alldredge and Gotschalk, 1988; Biermann and Engel, 2010). Generally, the spatio-temporal variability in 〈ws〉 in M4AGO differs significantly from the simple underlying assumption of a linearly increasing sinking velocity with depth in the standard run. M4AGO resembles the strongly increasing sinking velocity found in the mesopelagic zone in observations (e.g., Villa-Alfagame et al., 2016) and a modeling approach (DeVries et al., 2014).
3.3 Global pattern of transfer efficiency
The transfer efficiency of POC from z0=100 m to depth z in the ocean,
provides an estimate on the fraction of exported POC that reaches a particular depth and is determined by sinking velocity and remineralization. In the Martin curve (Eq. 1), the slope constant, β, prescribes the transfer efficiency,
to a particular depth and leads to an almost homogeneous global transfer efficiency of to about 1000 m depth in our standard run (Fig. 8a). The lower remineralization rates in sub-anoxic or even anoxic OMZs compared to oxygenated regions lead to higher transfer efficiencies, visible in the equatorial eastern Pacific Ocean, the northern Indian Ocean, and upwelling regions off the coast of Peru and Africa. Apart from these regions, the standard run features only little variability, as expected from the relationship between the Martin curve slope parameter and the transfer efficiency. The remaining variability is related to ocean currents and spatially variable turbulent mixing. By contrast, the transfer efficiency in M4AGO exhibits a distinct global pattern and possesses higher efficiency in high-latitude and upwelling regions compared to the subtropical gyres where low appears. Similar to the standard run, the OMZ regions feature high transfer efficiencies in M4AGO. Since local Martin curves provide meaningful information on the attenuation of POC fluxes with depth, we analyzed the effective slope parameter, β′, for both the standard and the M4AGO run. We fitted the Martin curve (Eq. 1), to modeled POC fluxes below z0 to estimate β′. As expected, the standard run shows little spatial variability apart from the OMZs and features a global, area-weighted mean slope of . In agreement with the transfer efficiency pattern, M4AGO possesses a strong latitudinal pattern of the effective slope β′ that varies between 0.59 and 0.67 in high latitudes (Antarctic zone – AAZ; North Pacific – NP; subantarctic zone – SAZ) and ≈0.30 and 0.60 in OMZ regions and with a maximum in the subtropical Pacific gyres (Fig. B1).
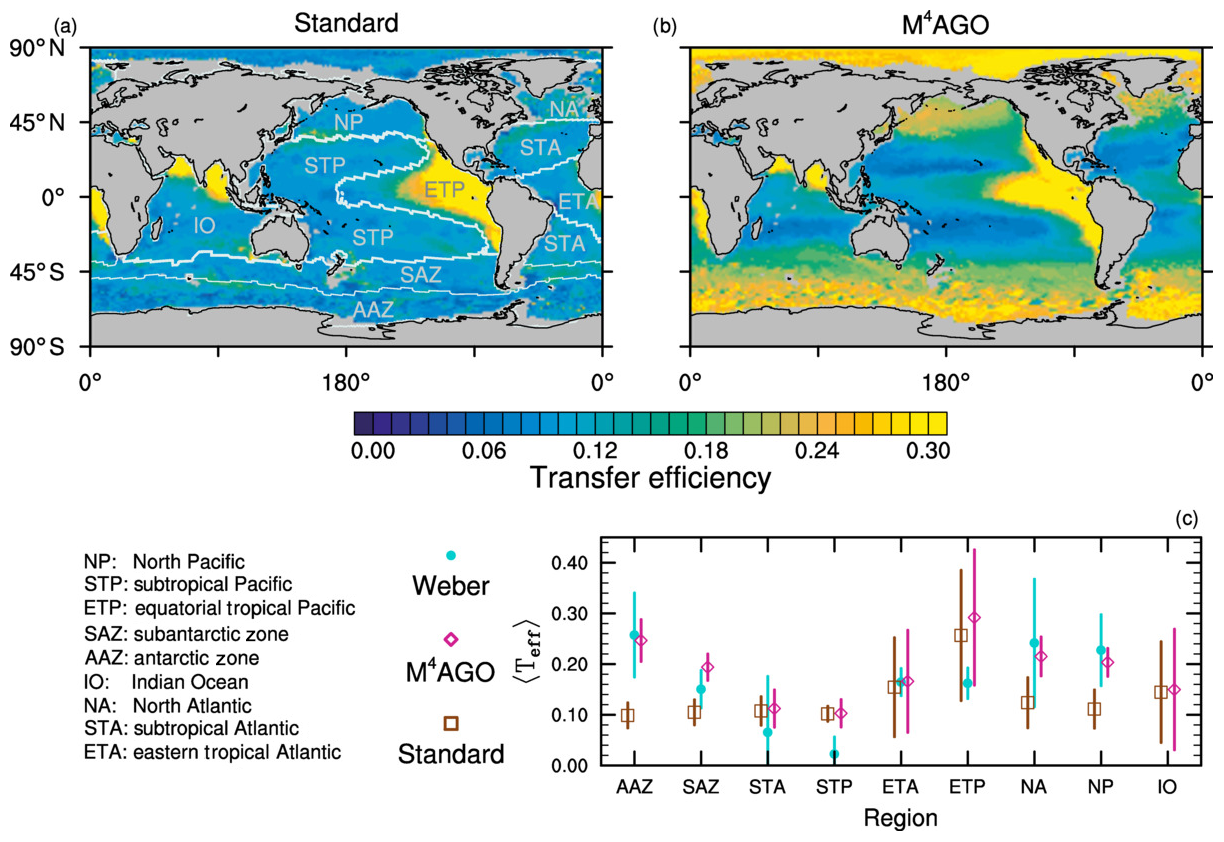
Figure 8Annual mean transfer efficiency for POC in (a) standard and (b) M4AGO from export depth (100 m) to about 1000 m (960 m). In (c) the mean transfer efficiency in regions, as defined in (a), is compared to the reconstructed transfer efficiency by Weber et al. (2016). Error bars for Weber et al. (2016) represent uncertainty for the reconstruction of the regional transfer efficiency. For the model results, error bars indicate the spatial standard deviation. For the resulting effective β′ in M4AGO, see Fig. B1. For a seasonal evolution of the transfer efficiency in M4AGO, see Fig. C1.
Recently, Weber et al. (2016) reconstructed the global transfer efficiency pattern by diagnosing particulate organic phosphate fluxes. Reconstructing the transfer efficiency via inverse modeling from phosphate concentrations circumnavigates the obstacle of sparse direct observations of fluxes and allows for a more reliable constrain on POC transfer efficiency (Usbeck et al., 2003; Weber et al., 2016). The comparison of the standard and M4AGO run reveals the inherent inability of the Martin approach to capture the latitudinal variability (Fig. 8a–c). M4AGO agrees qualitatively and quantitatively well with the reconstructed transfer efficiency pattern of Weber et al. (2016). The overestimation of the transfer efficiency in the equatorial tropical Pacific (ETP) by both the standard and M4AGO run is due to the models overestimation of OMZs extensions (Bopp et al., 2013). The large OMZ causes diminished remineralization and, hence, reduced attenuation of POC fluxes. In general, however, the increased transfer efficiency associated to OMZs is in agreement with observations that suggest lower flux attenuation and, hence, small β (Roullier et al., 2014; Löscher et al., 2016; Le Moigne et al., 2017). Lower remineralization in OMZs keeps the POC-to-ballasting-minerals ratio higher when compared to oxygenated waters. Thus, the lower remineralization rates are potentially accompanied by lower sinking velocities, which provides a positive feedback loop on the OMZ evolution. The larger the vertical extent of the OMZ becomes, the longer the retention time becomes through higher POM aggregate content and lower sinking velocities. Eventually, OMZ evolution is balanced by the oxygen supply through mixing and transport processes. The global pattern of β′ in M4AGO agrees well with the geographical range and pattern found by Buesseler and Boyd (2009) and suggested by Marsay et al. (2015). However, M4AGO shows lower maximum values of compared to suggested by Marsay et al. (2015). Globally averaged, M4AGO exhibits an effective slope parameter of , which is lower than the slope of , originally published by Martin et al. (1987) based on local observations. Noticeably, however, the trend of smaller to larger β′ values from the nearshore to open waters off the Pacific US coast is in agreement with the elusive trend found by Martin et al. (1987). Overall, M4AGO clearly improves the representation of the POC transfer efficiency pattern compared to the standard Martin approach.
3.4 Contributions of 〈ws〉 and temperature-dependent remineralization to the transfer efficiency pattern
The attenuation of POC fluxes is primarily regulated by the sinking velocity and total remineralization rate of POC. Depth-dependent, sheared lateral transport and vertical water motion can additionally affect the vertical distribution of particulate matter and thus vertical fluxes. We neglect these processes in the following, since (i) the timescale of sinking from one layer to the next layer below is typically shorter than the lateral transport at grid resolutions used in our model runs, and (ii) sinking velocity is faster than typical vertical motions represented by models with this grid resolution. The remineralization length scale (RLS), , is given by the local ratio of 〈ws〉 to remineralization (RPOC,remin),
and defines the vertical distance in which POC would decay to 1∕e (≈37 %) of its initial value, the POC e-folding depth (Cram et al., 2018). The RLS can be locally calculated and enables (i) exploring the local effects of remineralization and sinking velocity on the attenuation of POC fluxes and (ii) better understanding the depth-integrated information provided by the transfer efficiency or Martin's effective slope parameter, β′.
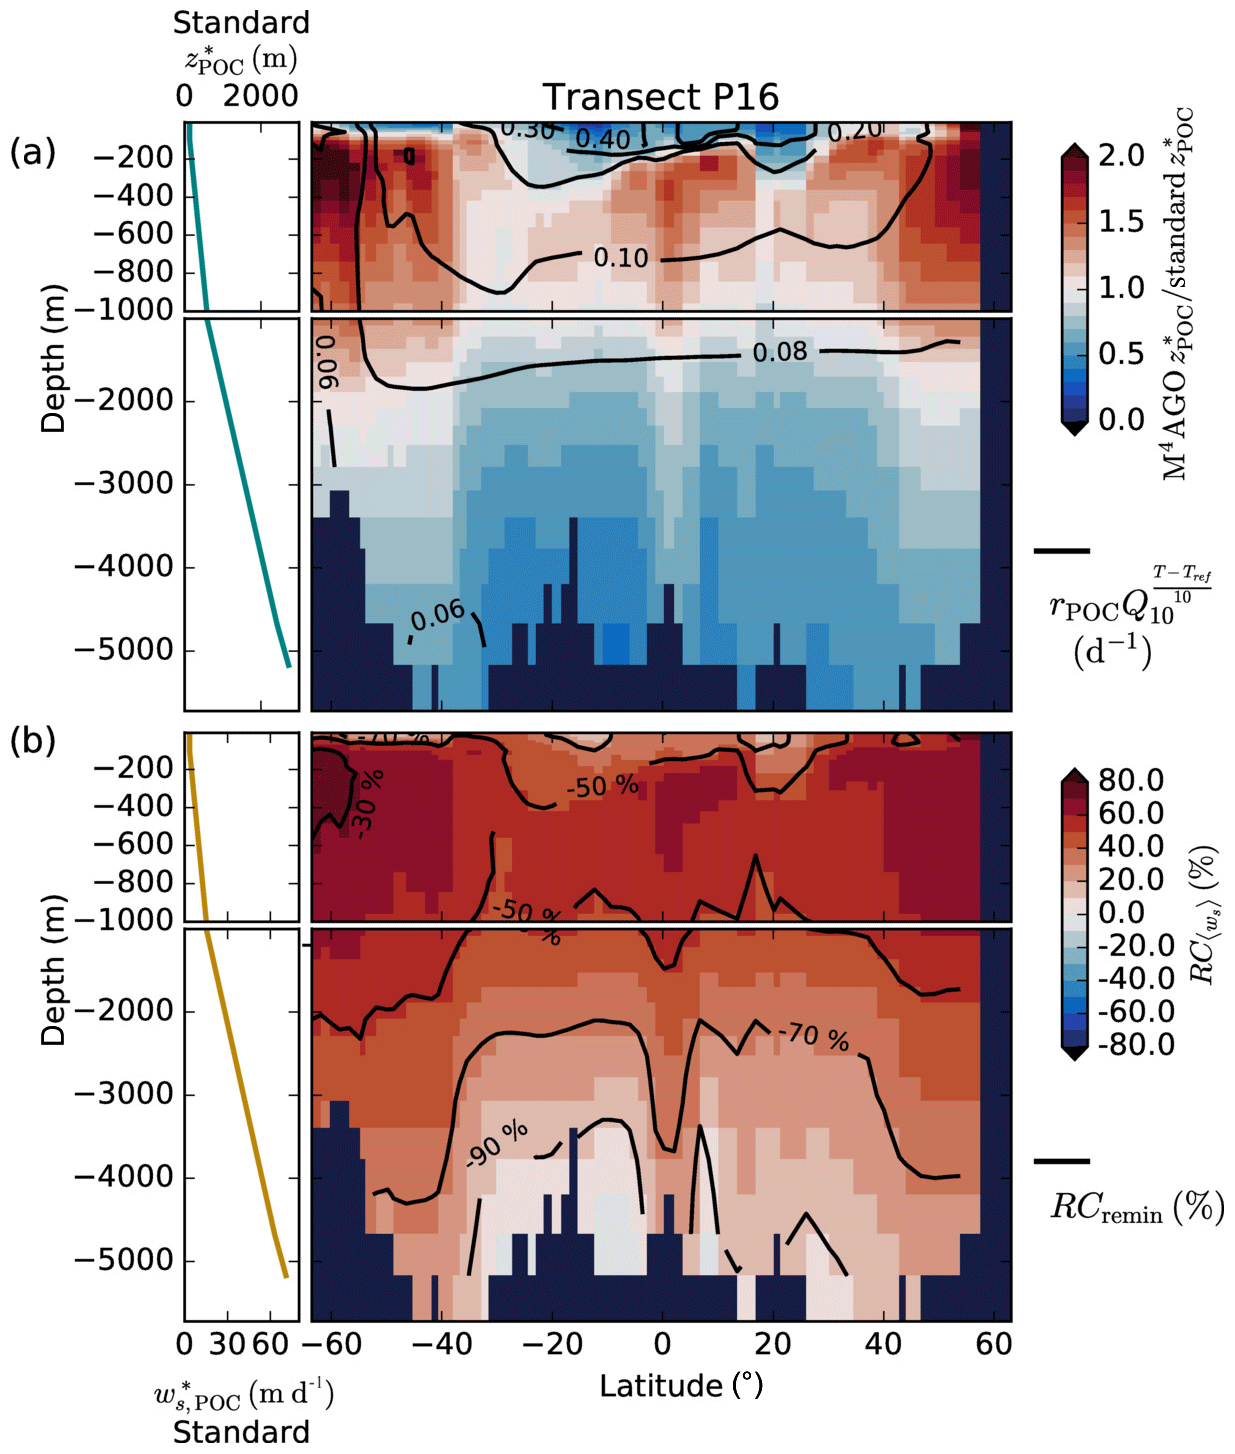
Figure 9(a) Remineralization length scale ratio of M4AGO to the standard model version at the World Ocean Atlas transect P16. We here focus on showcasing the temperature effect on remineralization and calculated the remineralization length scales, , without oxygen limitation of remineralization, which cancels out for equal O2 concentrations. Values smaller than 1 imply stronger POC flux attenuation in M4AGO than in the standard run. For reference, the RLS in the standard run is given in the top left. The standard RLS increases due to increasing sinking velocity, , with depth (shown bottom left). Contour lines provide the Q10 factor temperature-dependent remineralization rates with rPOC at reference temperature Tref in M4AGO. In the standard run, the aerobic rate is globally constant (0.026 d−1). (b) Relative contributions of sinking, , and remineralization, RCremin, to difference between standard and M4AGO run. Contour lines provide the relative contribution of remineralization.
The RLSs in surface waters and the upper mesopelagic zone of subtropical and equatorial regions are shorter in the M4AGO run than in the standard run by more than a factor of 2 (Fig. 9a). This higher turnover causes the lower p ratio in M4AGO compared to the standard run in these regions (Fig. 4b). In the mesopelagic zone, the RLSs in M4AGO are similar or pronounced longer and decrease again in deeper regions compared to the standard run (Fig. 9a). The longer RLSs in the mesopelagic zone of the high-latitude ocean are the reason for the higher transfer efficiency of M4AGO compared to the standard run. In order to analyze which of the two processes, sinking or remineralization, is of primary importance for the change in the RLS and thus the transfer efficiency, we define their relative contributions to the difference between M4AGO and the standard run as
where the processes, , refer to Eq. (35), is the partial derivative of with respect to the process Pi (applying the standard run rates), and ΔPi,x is the difference between the value in the M4AGO run and the standard run at spatial point x. M4AGO possesses generally higher remineralization rates than the standard run, which would increase the flux attenuation compared to the standard run. The temperature-dependent remineralization in M4AGO shows lower rates in the cold waters of the high latitudes than in the equatorial and subtropical regions (Fig. 9a). Within M4AGO, this pattern enhances the RLSs, and thus transfer efficiency, in the high latitudes compared to the equatorial regions, which is in agreement with Marsay et al. (2015) and Cram et al. (2018). Compared to the standard run, higher 〈ws〉 overcompensates the effect of intensified remineralization below the thermocline and leads to a longer RLS (Fig. 9b) in the mesopelagic zone, which is particularly true in diatom-dominated regions. In CaCO3-dominated subtropical gyres, 〈ws〉 falls below the sinking velocity of the standard model in regions deeper than 3000 m and thus contributes further to the stronger flux attenuation compared to the standard run. The higher 〈ws〉 in M4AGO turns out to dominate over remineralization and increases the RLS, and hence the transfer efficiency, in the mesopelagic zone of the high latitudes. In summary, the temperature dependence of remineralization in M4AGO induces a latitudinal pattern of longer RLSs, and thus higher transfer efficiency, in high latitudes, which is further amplified by high sinking velocities of diatom-dominated aggregates in the mesopelagic zone.
3.5 Impact of mineral size and ballasting effect on sinking velocity
The analysis of the RLS changes compared to the standard run emphasizes the role of sinking velocity for the longer RLS in the mesopelagic zone in high latitudes and thus for the enhanced transfer efficiency. We therefore aim to better understand the underlying factors that control the mean sinking velocity. We suggest in the following that the size of primary particles might be as important as the density of the ballasting material for defining the sinking velocity of aggregates.
M4AGO allows for assessing the contributions of aggregate properties and molecular viscosity to 〈ws〉. We define the relative contributions of the modeled particle properties and the molecular viscosity that control 〈ws〉 at particular depth z based on a first-order approach:
where , and , but , and is the global mean of the contributing property at depth z. The relative contributions provide information about the main driving factors for the local 〈ws〉 when compared to 〈ws〉 of global average aggregates. For example, what is the percentage-wise contribution to the local sinking velocity by local primary-particle density compared to the global mean primary-particle density? By neglecting the higher-order terms, we provide only qualitative insights into the role of the different aggregate properties and molecular viscosity in 〈ws〉.
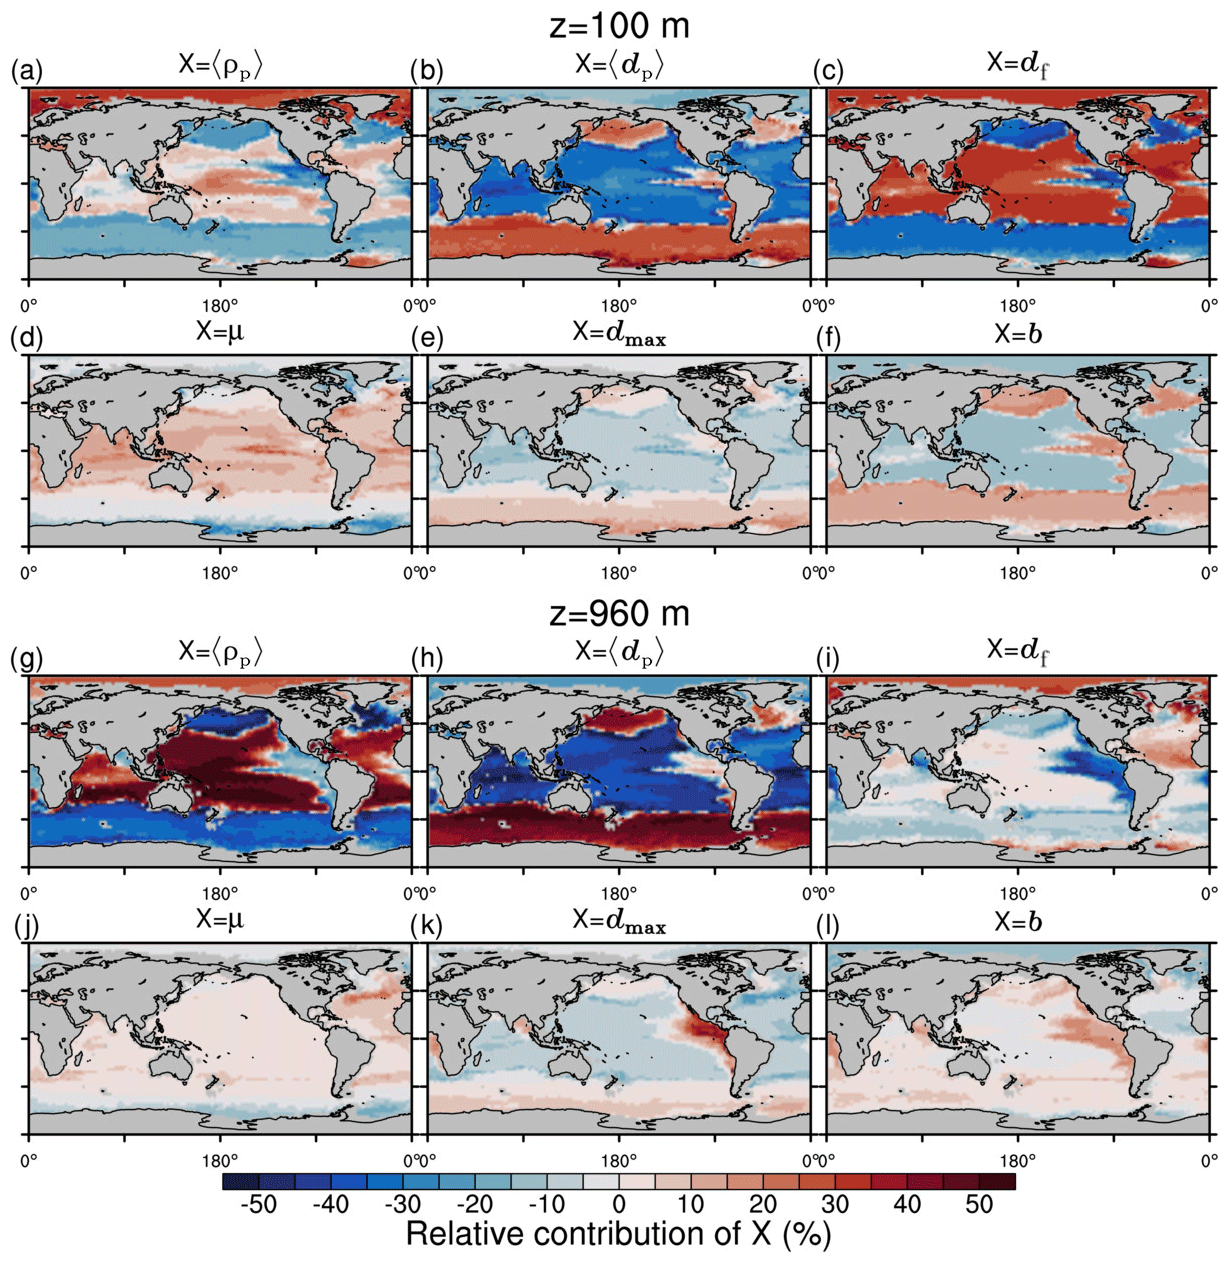
Figure 10Qualitative first-order relative contributions of marine aggregate properties to the change of local mean sinking velocity compared to a global mean aggregate spectrum at depth z. (a–f) 100 m; (g–l) 960 m. Mathematical symbols are as follows: 〈ρp〉 – mean primary-particle density; 〈dp〉 – mean primary-particle diameter; df – fractal dimension; μ – dynamic molecular viscosity; dmax – maximum aggregate diameter; b – aggregate number distribution slope.
CaCO3 acts as a strong positive, 〈ws〉-increasing factor for sinking velocities in the equatorial and subtropical regions due to its high primary-particle density (Fig. 10a). As an exogenous factor, the low molecular viscosity in warm regions contributes positively to sinking velocity (Fig. 10d). Additionally, in our model, df increases particle excess density and thus 〈ws〉 in CaCO3-rich areas (Fig. 10c). In the Southern Ocean, North Pacific, North Atlantic and upwelling regions, particularly the large 〈dp〉 in diatom-dominated regions enhances 〈ws〉 (Fig. 10b). According to our model, dmax of aggregates and the number distribution slope, b, contribute positively to 〈ws〉 in the high latitudes, except for the Arctic Ocean, where mineral material strongly affects the aggregate properties. The pattern of highly variable endogenous and exogenous controls on 〈ws〉 emerges particularly in the upper ocean, while in deeper regions of about 1000 m depth, the aggregate properties become more and more homogeneous, except for 〈dp〉 and 〈ρp〉 and in OMZs (Fig. 10g–l). With homogenization of most aggregate properties with depth, the contrasting relative contributions of dense mean primary particles and large mean primary particles to 〈ws〉 become even more pronounced. Denser, small CaCO3 particles contribute to 〈ws〉 in the subtropical, oligotrophic regions of the oceans, while comparably less dense but larger opal frustules lead to high 〈ws〉 in nutrient-rich upwelling and high-latitude regions. Even though our formulation for 〈ws〉 is highly non-linear, we expect the qualitative pattern of the relative contributions to 〈ws〉, particularly through 〈dp〉 and 〈ρp〉, to be coherent. In sum, we therefore emphasize the potential role of primary-particle size, in particular that of diatom frustules, in determining 〈ws〉 and thus POC fluxes.
The effects of microstructure on in situ 〈ws〉 are not well studied, and df of aggregates is weakly constrained. It therefore warrants further investigation, especially if a spatially variable df effect occurs on in situ 〈ws〉 in the upper ocean. Vertically varying df has been suggested (Mari et al., 2017), and given the general importance of the microstructure for sinking velocity, a deeper understanding of the factors and processes influencing df is hence highly desirable.
Microstructure df directly prescribes the aggregate number distribution slope, b, in M4AGO (see Fig. A1c and f for a map of b). Observations show a higher variability in b≈2 to 5 (Guidi et al., 2009) than in M4AGO, where b varies between ≈ 3.19 and 3.76 and thus likely underestimates the spatial variability and relative contribution of b to 〈ws〉. At present, M4AGO is limited to the steady-state size distribution that represents the characteristic processes of aggregation and fragmentation in the system. Explicit modeling of the dynamics of the aggregate size spectrum would be required to cover the variability in measured b, which would further enhance the variability in 〈ws〉. We briefly discuss this current model limitation in Sect. 3.10.
Previous studies support our finding that CaCO3 acts as a strong ballasting agent (e.g., Francois et al., 2002; Balch et al., 2010; Cram et al., 2018). By contrast, opal density of the hollow silicate structures has a smaller effect on 〈ρp〉 (see Fig. 7a). Instead, silicate frustule size of diatoms significantly affects 〈ws〉 (see Figs. 10b and h and 7b). This contrasts the assumption of opal acting solely as ballasting material (Cram et al., 2018) and is congruent with Francois et al. (2002), who noticed that factors other than particle density likely play a role. As indicated by Eqs. (5) and (6), primary-particle size affects the excess density and porosity of aggregates, which have decisive effects on sinking velocity (Laurenceau-Cornec et al., 2019). Deciphering the size effect of primary particles on in situ 〈ws〉 and fluxes might be particularly challenging in regions with a diverse size structure of the phytoplankton community. Oligotrophic regions typically harbor a narrower size distribution of phytoplankton (see, e.g., size ranges and standing stocks in Kostadinov et al., 2016), which may produce more homogeneous aggregates and thus more predictable POC fluxes, as found by Guidi et al. (2016), who correlated POC fluxes to the oligotrophic phytoplankton community. In addition, interannual variability in the dominant size of primary producers has been suggested to drive the interannual change in export fluxes (Boyd and Newton, 1995). In contrast to oligotrophic phytoplankton communities, diatom-dominated communities feature a higher size diversity (Tréguer et al., 2018) and different morphologies, which both affect the sinking velocity of aggregates (Laurenceau-Cornec et al., 2015; Bach et al., 2016). Phytoplankton community size structure and morphology thus introduce higher variability to sinking velocity, which complicates attribution of cell size and morphology effects on POC fluxes. The higher size and morphology variability in diatom-dominated phytoplankton communities, together with variable cellular silicate-to-carbon ratios (Brzezinski, 1985), likely explains the poor correlations of opal to POC fluxes (e.g., found by Francois et al., 2002). Similarly, the correlation between POC fluxes and, by number and size, more variable foraminiferal CaCO3 is weaker than for coccolith fluxes (De La Rocha and Passow, 2007). We therefore suggest to factor in, or even focus on, frustule sizes and morphology as explanatory variables for POC fluxes when carrying out mineral ballasting and rain ratio studies in diatom-dominated regions.
3.6 Regional fluxes and rain ratios
Biogenic minerals, dust particles and detritus are tied together in M4AGO and define the composition, microstructure and thus sinking velocity of aggregates. In turn, the tracers are independently remineralized or dissolved. Both processes affect 〈ws〉 and thus the e-folding depth of tracers. For example, the remineralization of POC increases 〈ws〉 of diatom-dominated aggregates and thus increases the dissolution length scale of opal, which we refer to as the “opal RLS”. The combined sinking thus (i) affects the RLS of POC and opal (and CaCO3 when dissolution takes place) and (ii) couples the timing of mineral and POC fluxes at depth.
The Martin curve concept can be applied to represent the effective attenuation of opal fluxes. The effective Martin curve slope for opal, , exhibits similar regional variability in the M4AGO run compared to the standard run (Fig. 11). However, the equatorial tropical Pacific (ETP) region shows higher spatial variability. The low POC remineralization in OMZs leads to small 〈ws〉 of aggregates and decreases the opal RLS and thus increases . Similar to POC fluxes, opal fluxes exhibit shorter opal RLSs in the surface waters, while they exceed the standard RLSs in the mesopelagic zone and below (not shown). Particularly in the deep waters of the high latitudes, the opal RLSs are longer than in the standard run. This is due to the aggregates' higher sinking velocity than the 25 m d−1 opal sinking speed in the standard run and partially to the reformulation of temperature-dependent opal dissolution. In the subtropical regions, opal is remineralized faster below 2000 m and fluxes are generally small (see Fig. 5a, b).
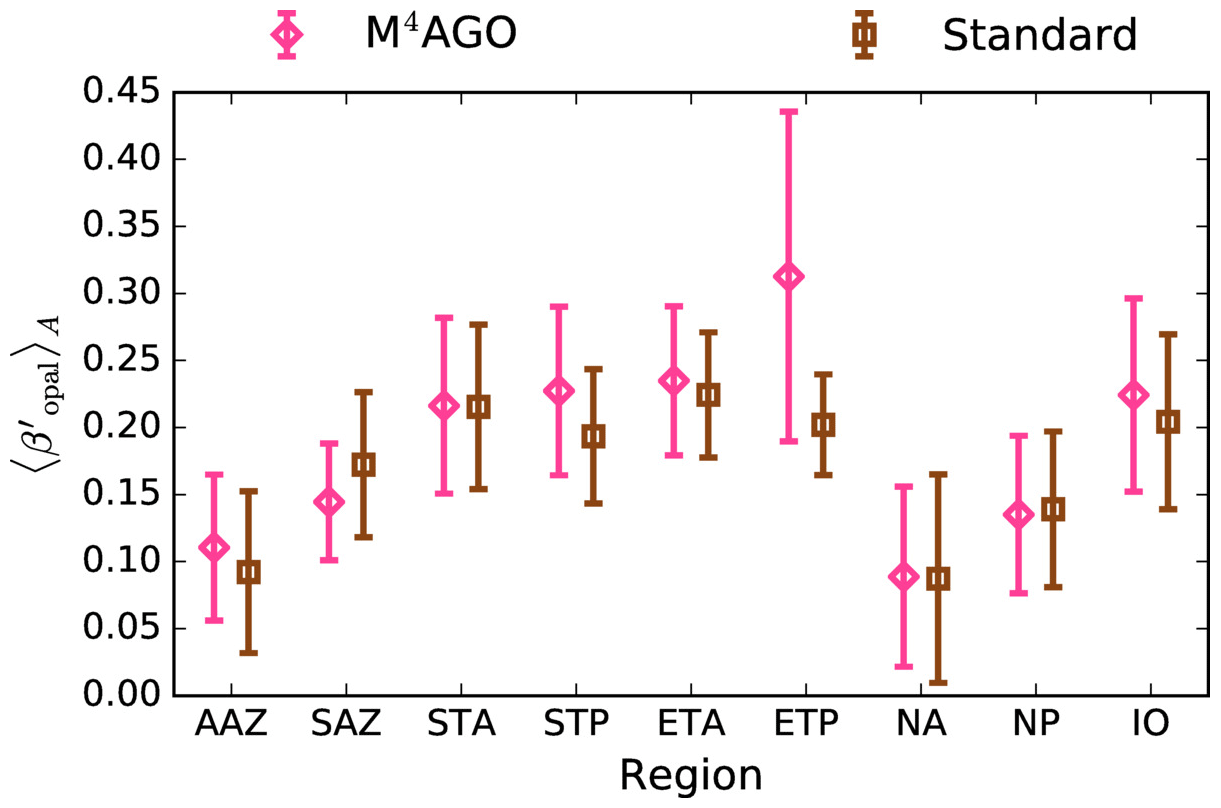
Figure 11Area-weighted mean effective power function slopes for opal fluxes, , in the regions defined in Fig. 8. Calculated for opal fluxes below 100 m. Error bars show regional standard deviation.
In sum, M4AGO estimates that globally ∼1.03 Gt Si yr−1 (∼1.04 Gt Si yr−1 in the standard run) reaches the seafloor, which is in good agreement with present estimates of about 1 Gt Si yr−1 (Tréguer, 2002). Generally, the modeled is well within the range of observations with estimates of (Boyd et al., 2017). In M4AGO, dissolution of opal has the implication that ballasting mineral ratios between opal and CaCO3 shift towards higher importance of CaCO3 with depth. Since the dissolution of opal is temperature-dependent, the preservation efficiency for opal-to-CaCO3 ratios is thus lowest in regions with strong vertical temperature gradients.
The direct coupling of POC and biogenic mineral fluxes through marine aggregates potentially enhances the models' ability to represent rain ratios in space and time. We therefore aggregated the sediment trap data set of Mouw et al. (2016a, b) with 15 792 individual POC flux measurements at 673 unique locations to a monthly climatology of POC, particulate inorganic carbon (PIC) and silicate fluxes. We accounted for the time spans of sediment trap deployment ranging from hours to years by time-weighting with a minimum weight of 1 d per month in cases of few hours of measurement and for each covered month the full monthly weight in cases of a yearly measurement. We compared the climatologies to modeled monthly mean flux ratios at the stations at their respective depths. The M4AGO run represents the POC∕PIC flux ratio equally as well as the standard run (not shown). For POC∕Si fluxes, the scatter around the 1 : 1 line is reduced in M4AGO compared to the standard run (Fig. 12).
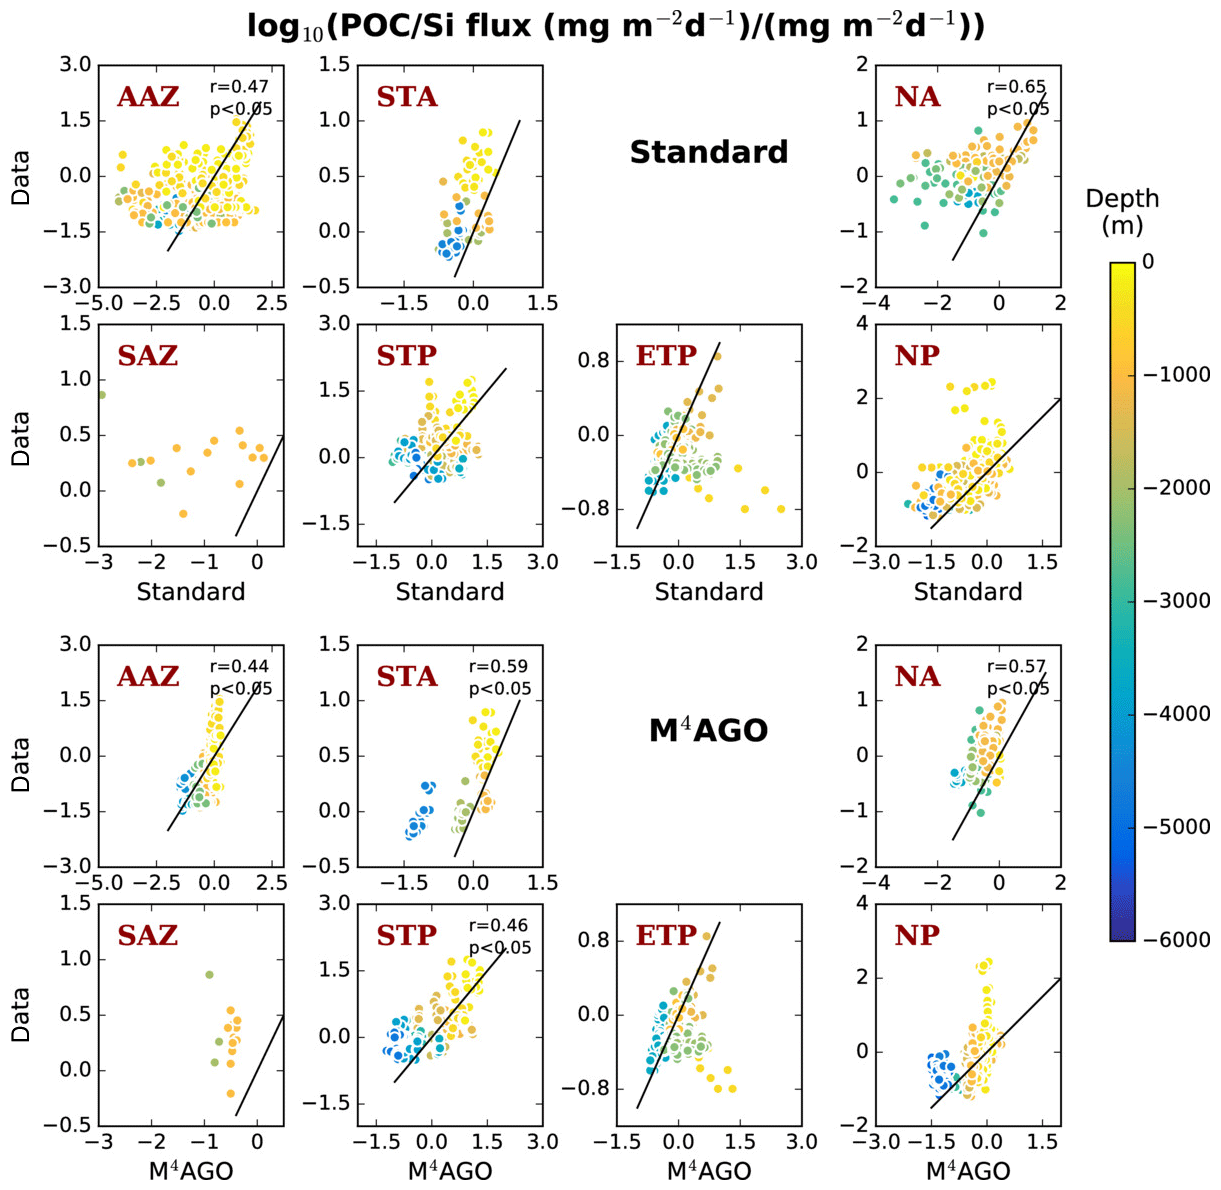
Figure 12Monthly POC∕Si rain ratios in the standard run and in M4AGO compared to the monthly climatological mean derived from the Mouw et al. (2016a, b) data set. The black line denotes the 1 : 1 line. Notice that the axes are in log and have different limits among regions but are comparable between runs. No data are available for opal fluxes in the equatorial tropical Atlantic (ETA), where opal fluxes are small (refer to Fig. 5a, b). Correlation coefficient, r, and significance value, p, are given if r>0.4.
However, M4AGO introduces a bias in regions deeper than ∼4000 m towards smaller POC∕Si ratios. The RLSs in the deep ocean are hence too short in M4AGO. While the scatter of the POC∕Si ratio reduces in M4AGO, the overall variability in the flux ratios becomes compressed compared to the measured variability. This compression might be caused by several factors. First, we assume a tight connection of aggregate components and ignore heterogeneous composition among local particle-size spectra which would potentially cause different sinking velocities among the different components. Second, HAMOCC ignores changing diatom silicification caused by temperature (see Ragueneau et al., 2006, and references therein) and by seasonal changes in nutrient availability (Assmy et al., 2013). Generally, deficits exist in both the model runs and sediment trap data. The lack of resolving small-scale variability through eddies and their role in shaping the phytoplankton community, as well as general timing, internal variability, and spatial current shifts, limit the global models' ability to represent local features. Measurement limitations of sediment traps have the potential to additionally increase the mismatch (see, e.g., Usbeck et al., 2003, and references therein).
3.7 Evaluation of biogeochemical tracer distributions
We evaluate the simulated spatial distribution of nutrients, oxygen and alkalinity by comparison to gridded observation climatologies. Silicate, phosphate, nitrate and oxygen are compared to the World Ocean Atlas (WOA; Boyer et al., 2013; Garcia et al., 2014b). Alkalinity, AT, is compared to the Global Ocean Data Analysis Project (GLODAPv2) climatology (Lauvset et al., 2016). We present the results in Taylor diagrams (Taylor, 2001), which aggregate correlation, root-mean-square deviation (RMSD), and standard deviation of simulated and observed variables into distances between model results and the reference observations (Fig. 13a–d). Here, we use spatial grid-cell-wise statistics derived from temporally averaged (100 year mean) fields for which we interpolated the observational data to the model grid. To be able to show all parameters in one plot, we derive normalized standard deviations and RMSDs. We evaluate the Atlantic and the Pacific Ocean separately to account for their different hydrographical features. For example, the Atlantic Ocean is characterized by ventilation through deep water formation in the high latitudes, a feature that does not exist in the Pacific. Furthermore, we select four depth levels: surface waters (6 m depth); the two depths that determine the transfer efficiency, 100 m and approximately 1000 m; and an intermediate depth in the mesopelagic zone, 362 m.
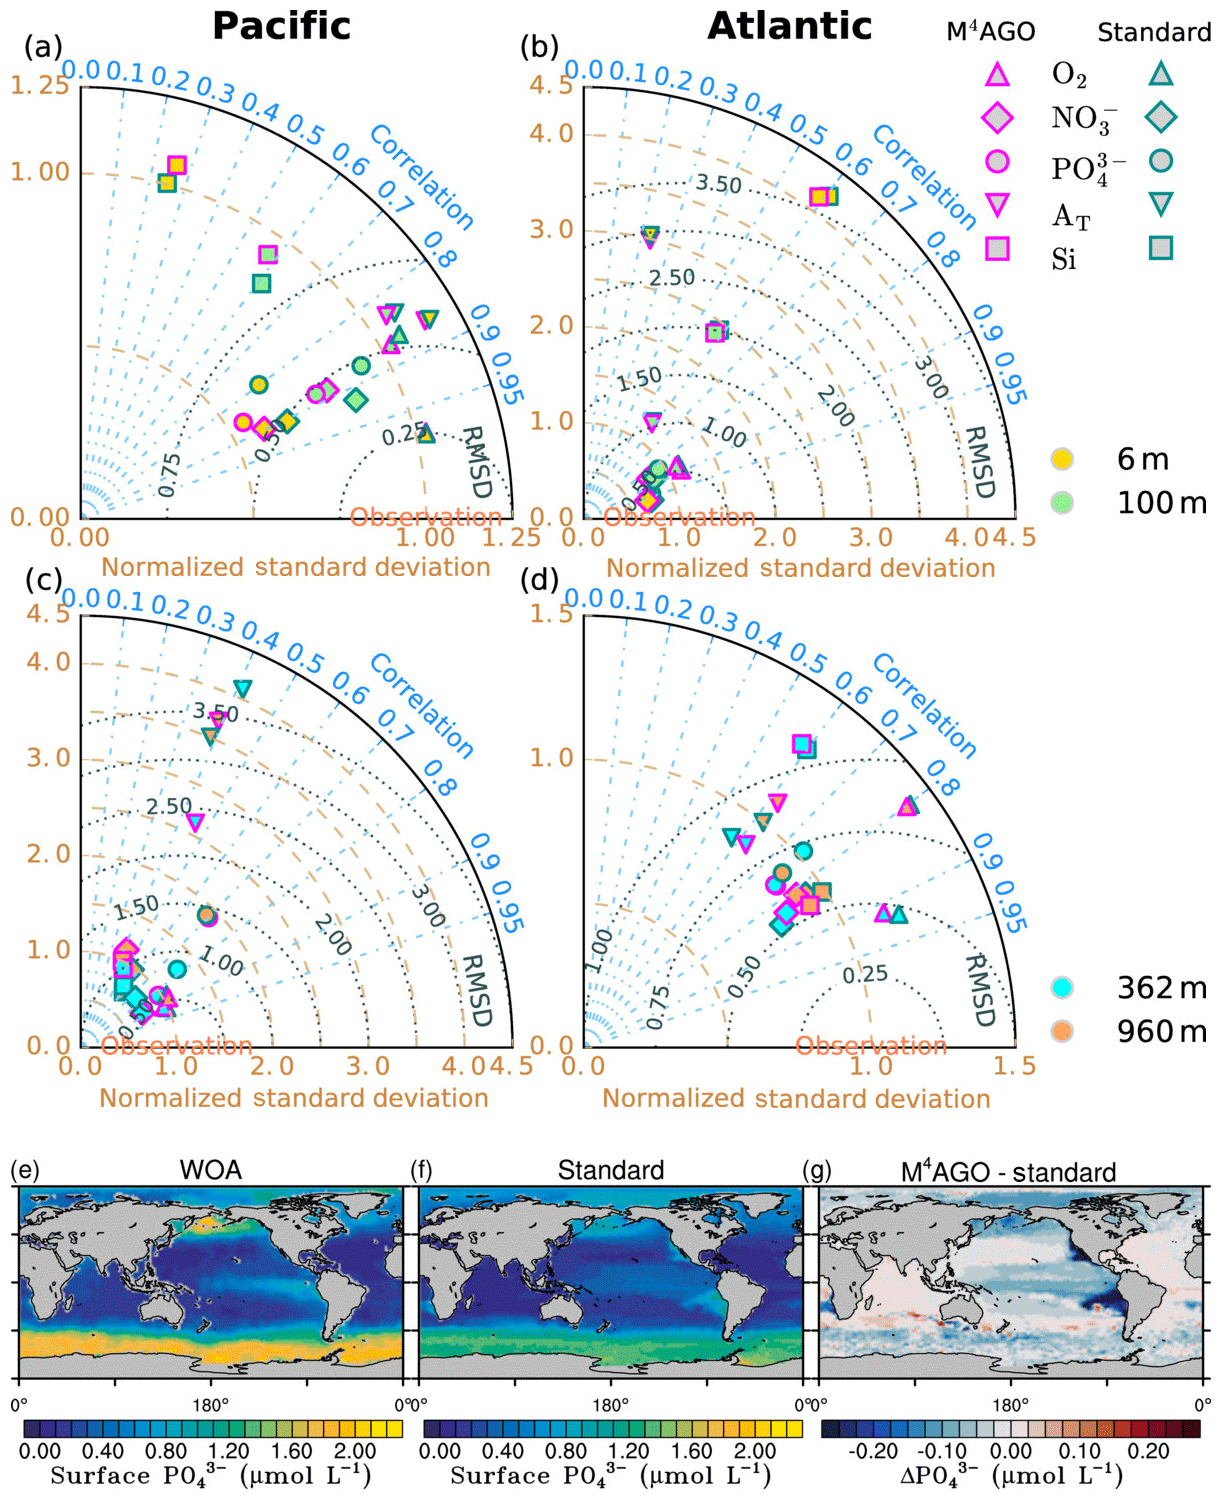
Figure 13(a–d) Taylor diagram for tracers (oxygen – O2; nitrate – ; phosphate – ; silicate – Si) in comparison to the World Ocean Atlas data (Boyer et al., 2013; Garcia et al., 2014b) and, in the case of total alkalinity, AT, to GLODAPv2 data (Lauvset et al., 2016). (a, c) Pacific and (b, d) Atlantic for (a, b) 6 and 100 m; (c, d) are for 362 and 960 m. (e) Surface phosphate concentration in WOA (f) in the standard run and (g) difference plot between M4AGO and the standard run.
Generally, the two model runs represent nutrients, silicate and oxygen distributions equally well at these depth (Fig. 13a–d); i.e., differences to observations are larger than among the two models. This is expected, as tracer distributions in the model are predominantly determined by the flow field and both simulations use identical physical model conditions. The Taylor diagram captures matches of spatial pattern such as location of fronts, extension of gyres and the location of water masses in an aggregated form. The ocean model represents such features realistically (Jungclaus et al., 2013), but we cannot expect a perfect match of the circulation pattern with in situ conditions for multiple reasons. The climatological, simplistic atmospheric forcing damps in particular the interannual variability in ocean currents and can contribute to spatial shifts of, for example, frontal regions with respect to the observed climatology. In addition, the coarse horizontal resolution of the model and atmospheric forcing affects features such as upwelling strength (Milinski et al., 2016) and location. In turn, the spatio-temporal interpolation of data, necessary through scarcity of observations, limits the resolution of nutrient variability and introduces uncertainty, particularly in deeper regions, where the density of observations is lower than in surface waters. As a consequence, a mismatch between modeled biogeochemical tracers and the climatological mean of observations is expected.
Tracers undergoing less complex biogeochemical cycling, such as phosphate or silicate, reflect the quality of the flow field more directly than tracers such as nitrate, oxygen or alkalinity (see also England and Maier-Reimer, 2001). The latter tracers are therefore generally more prone to biogeochemical model reformulation, and larger differences can be expected between M4AGO and the standard run. In addition, M4AGO links the cycles of phosphate and silicate closer to nitrate and oxygen through common sinking of particulate matter. Phosphate and silicate therefore experience an additional biogeochemical cycle imprint in M4AGO compared to the standard run. In surface waters of the Pacific, this led, for example, to a slight improvement of the phosphate correlation with WOA observations, while it increased the normalized standard deviation compared to the standard run (Fig. 13a). The improvement is related to the better representation of surface phosphate concentrations off the coast of Peru and the western coast of North America (see Fig. 13e–g).
In both simulations, biogeochemical tracer distributions in the Pacific are strongly influenced by the OMZ in the eastern boundary upwelling region. An exception is oxygen in surface waters, which is primarily determined by gas exchange processes. As a common feature of all state-of-the-art global ocean biogeochemistry models, OMZs are too large and result from nutrient trapping through a sluggish circulation and associated insufficient supply of oxygen (Dietze and Loeptien, 2013). The sluggish circulation and mixing are likely associated with underrepresented equatorial currents, particularly the equatorial intermediate current system and equatorial deep jets (Brandt et al., 2012; Shigemitsu et al., 2017). The OMZ shape in the eastern Pacific Ocean, though, changes between the runs. In M4AGO, the water column above 800 m is more oxygenated and below 800 m is less oxygenated than in the standard run. The change in OMZ shape imprints on AT, as anaerobic and aerobic remineralization processes change alkalinity in a different manner; i.e., denitrification and sulfate reduction increase alkalinity, whereas aerobic remineralization decreases alkalinity. While AT and silicate are generally worse than other tracers when compared to observations, M4AGO improves the representation of AT in the Pacific at 360 m compared to the standard run. This is visible through the higher correlation (∼0.45 compared to 0.4) and lower RMSD of ∼2.3 compared to ∼3.75 in the standard run (Fig. 13c; 362 m depth). The increased RMSD of silicate in surface waters and 100 m in M4AGO are associated to the eastern equatorial and upwelling regions in the Pacific. The lower remineralization in OMZs not only decreases the sinking velocity of detritus but also increases the retention time of the tightly coupled opal in M4AGO and thus enhances the opal dissolution and silicate concentration. In general, the tighter coupling of silicate to nutrients through common sinking in aggregates leads to a higher sensitivity of silicate to ocean circulation and temperature deficiencies in M4AGO than in the standard run. The high RMSD and low correlation for silicate compared to observations, particularly in the euphotic zone, can have additional implications for M4AGO, since the silicate distribution in the euphotic zone directly affects opal production and thus the sinking velocity of aggregates, transfer efficiency and nutrient distributions. The tighter coupling of silicate to other biogeochemical cycles in M4AGO therefore warrants further future investigation.
3.8 Regional CO2 fluxes
In a 100-year climatological steady state, both model runs show the Southern Hemisphere ocean acting as a net source of CO2 to the atmosphere, while the Northern Hemisphere acts as a net sink (Fig. 14a). Consequently, net oceanic CO2 transport across the Equator from the Northern to the Southern Hemisphere exists. In the simulation with M4AGO, a stronger CO2 uptake compared to the standard run occurs in the region between 60 and 45∘ S, which coincides with deeper transfer of POM reflected by an increased transfer efficiency (Fig. 8). In both model runs, the tropical regions outgas CO2 to the atmosphere. As is visible from the decreasing difference between the cumulative zonal CO2 fluxes, M4AGO exhibits stronger outgassing in the tropical region, particularly in the Northern Hemisphere (Fig. 14a). Even though a small residual of zonally integrated fluxes of about 0.02 Gt C yr−1 between the two model runs remains, the small residual CO2 flux imbalance of 0.07 and 0.05 Gt C yr−1 in M4AGO and the standard run, respectively, indicate well-spun-up model runs. In general, the latitudinal zonal CO2 fluxes and the cross-equatorial southward oceanic CO2 transport agree qualitatively and quantitatively well with former forward-integrated models for preindustrial conditions (e.g., Sarmiento et al., 2000; Gloor et al., 2003; Mikaloff Fletcher et al., 2007).

Figure 14(a) Climatological cumulative zonal CO2 flux in the standard and the M4AGO run (from south to north). Generally, negative fluxes represent net CO2 uptake by the ocean. Note the second y axis for the difference between the two runs (also in c–k). (b) Global annual net CO2 flux under linearly increasing atmospheric CO2 concentration. (c–k) Regional cumulative CO2 fluxes under increasing atmospheric CO2 (regions as defined in Fig. 8).
To study the effect of the changed transfer efficiency in M4AGO on the CO2 uptake without indirect climate effects, we perform model runs in which we linearly increase the atmospheric CO2 concentration with a yearly increment from ∼285 to 400 ppm within 150 years. The transient forcing does not feed back onto the physical climate state. We therefore emphasize that no climate feedback on, for example, ocean temperature, stratification, and thus primary production and remineralization occurs in these model runs.
During the atmospheric CO2 increase, both model runs show similar global annual oceanic CO2 uptake (Fig. 14b). About 181–185 Gt C is taken up by the global ocean throughout the 150-year period. The discrepancy of ≈4 Gt C between the two runs arises to a large extent from the residual imbalance of 0.02 Gt C yr−1 uptake, cumulated over 150 years.
The general trends in the regional cumulative fluxes remain the same between the two model runs (Fig. 14c–k), and most regions act as net sinks of CO2. Only the upwelling regions of the equatorial tropical Atlantic (ETA) and Pacific (ETP) are net sources of CO2 to the atmosphere at the end of the 150-year period. The magnitude of the regional cumulative fluxes, however, varies among the two model runs.
Since we can rule out temperature-driven effects on the differences in CO2 uptake when comparing the two climatologically forced runs, a different state and/or changes in AT and dissolved inorganic carbon (DIC) concentration determine the partial pressure of CO2, pCO2 and thus CO2 fluxes. In our runs, major changes in AT and DIC can locally occur due to a change in, first, the CaCO3-to-detritus rain ratio as a result of varying CaCO3 and POM production and remineralization, or, second, an increase in the POC transfer efficiency, for example, which reflects a transfer of carbon to deeper waters where CO2 is withdrawn from immediate exchange with the atmosphere. In addition, such different signals can be transported by the flow field, and remote effects can appear. Quantitatively, differences of regional cumulative CO2 fluxes larger than 5 Gt C appear in the Antarctic zone (AAZ), the subtropical Pacific (STP), the equatorial tropical Pacific (ETP) and the Indic Ocean (IO; Fig. 14c–k). In the upwelling and high-latitude regions, the pCO2 is lower in M4AGO than in the standard run, which translates to higher oceanic uptake (in AAZ and NP) or less outgassing (in ETP). Qualitatively, this coincides well with the primary production, respective export and the higher transfer efficiencies in these regions (cf. Figs. 4 and 8). In regions of higher transfer efficiency but similar CO2 fluxes when compared to the standard run, either POC export fluxes are small (e.g., in the Arctic Ocean) or physical processes such as mixing or upwelling dominate over biologically induced CO2 fluxes (e.g., in the SAZ). In the STP region, where high CaCO3-to-detritus rain ratios occur (refer to Fig. 5), AT is about 0.2 % lower in M4AGO than in the standard run, which enhances pCO2 by about 2 % and thus decreases the CO2 uptake.
In summary, under linearly increasing CO2 in a non-interactive mode, the global CO2 fluxes remain similar for the standard and the M4AGO run. However, regional CO2 fluxes change, which is potentially linked to the changing pattern of transfer efficiency and the CaCO3-to-detritus rain ratio. A detailed study on the feedbacks between the transfer efficiency, represented by M4AGO, and a transient climate on oceanic CO2 uptake is out of the scope of this paper and will be part of future investigations.
3.9 Sensitivity analysis
With M4AGO, the processes of temperature-dependent remineralization and a number of new model parameters to represent variable sinking velocity of marine aggregates were introduced to HAMOCC. We carried out three sensitivity experiments to provide insights into the response of HAMOCC to the uncertainty of selected parameters (see below for the criteria). As target variables, we chose (i) the transfer efficiency, (ii) phosphate as an essential nutrient for primary production, and (iii) silicate as a nutrient and circulation-reflecting agent.
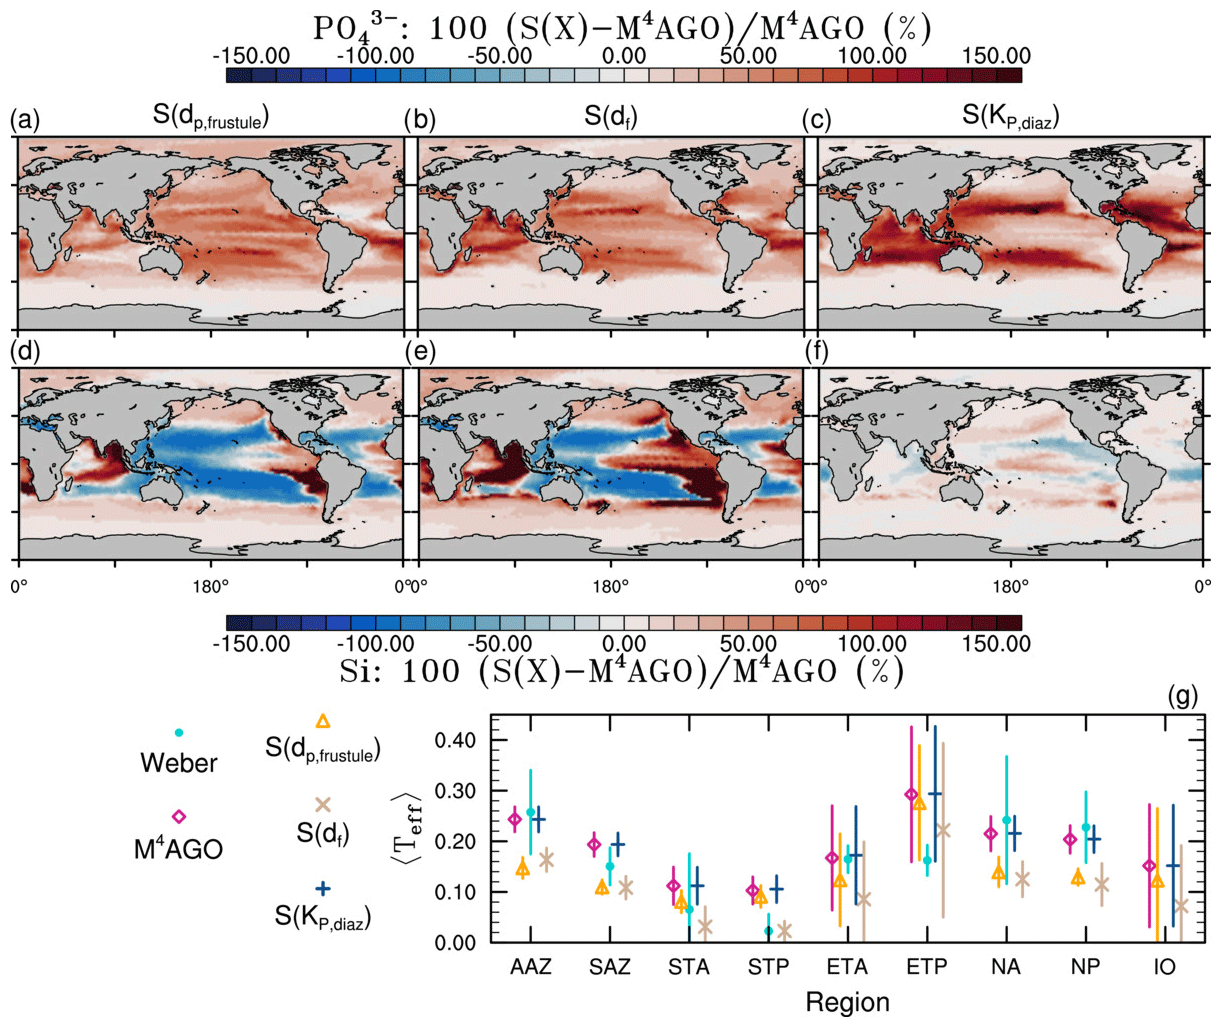
Figure 15Sensitivity of (a–c) surface phosphate, (d–f) silicate concentrations, and (g) POC transfer efficiency to diatom frustule size, dp,frustule (S(dp,frustule), modified from 20 to 10 µm), the half-saturation constant for phosphate uptake by diazotrophs (S(KP,diaz), modified from 0.05 to 0.1 µmol L−1), and fractal dimension, df (S(df), from variable to constant df=2). Error bars in (g) represent regional standard deviation and, for Weber et al. (2016), the uncertainty for the reconstruction of the regional transfer efficiency.
Previously in Sect. 3.5, we suggested the size of primary particles, particularly that of opal frustules, to be an important factor for regulating 〈ws〉 and thus the transfer efficiency. We thus study the effect of primary-particle size in the sensitivity experiment S(dp,frustule) exemplarily for diatom frustules because (i) diatom size is highly variable, (ii) HAMOCC does not explicitly represent algae size classes and (iii) algae body size is expected to decrease with rising water temperatures (Daufresne et al., 2009). We decrease their size by 50 %, from 20 µm to 10 µm. In the second sensitivity experiment, S(df), the varying fractal dimension, ranging between 1.6 and 2.4 in the M4AGO run, is set to a constant, df=2, to eliminate its variable effect on b and 〈ws〉. In the third experiment, S(KP,diaz), we showcase the sensitivity of phosphate concentration in the subtropical gyres to diazotrophs' standing stock, which we noticed during the process of tuning the M4AGO run. Here, we increase the half-saturation constant for phosphate uptake by diazotrophs from 0.05 to 0.10 µmol L−1. All sensitivity runs are in a quasi-steady state, as reflected by surface properties that are in steady state.
Decreasing the opal frustule size by 50 % compared to the M4AGO run reduces 〈ws〉 and thus the RLS in diatom-dominated regions. As a consequence, the transfer efficiency in silicifier-dominated regions is lower in S(dp,frustule) than in M4AGO (Fig. 15g). Accordingly, opal dissolves closer to surface waters and the silicate concentration increases compared to the M4AGO run in silicifier-dominated regions, particularly in and downstream of coastal upwelling regions (Fig. 15d). In the subtropical gyres, where silicate is diminished, it further decreases in S(dp,frustule). The higher remineralization in the euphotic zone in upwelling regions increases the phosphate concentrations downstream in the subtropical gyres (Fig. 15a). In sum, the sensitivity to dp,frustule underpins the potential importance of primary-particle size for 〈ws〉 and thus for biogeochemical cycling.
Generally, eco-physiological responses of primary producers are typically neglected in ESM-type models such as HAMOCC. Under the premise that the size of primary particles is of importance to represent 〈ws〉 as depicted by M4AGO, changes of the phytoplankton size structure with ongoing ocean warming could affect RLSs, transfer efficiency and thus the biological carbon pump. Indeed, body size decreases with increasing water temperature (Daufresne et al., 2009). The increasing water temperature has been suggested to shift eco-physiological regions polewards by rates of about 22 to 36 km per decade (Lefort et al., 2015, and references therein). S(dp,frustule) shows that decreasing primary-particle size reduces the transfer efficiency and thus likely weakens the biological carbon pump. Yet, the net effect of such eco-physiological responses and adaptability of primary producers on transfer efficiency and CO2 uptake under ongoing climate change remains elusive and thus demands further future investigation.
In the sensitivity study S(df), df in surface waters is increased in diatom-dominated waters and reduced in calcifier-dominated waters compared to the M4AGO run (cf. Fig. 6c). In the M4AGO run, aggregates experience rapid compaction within the depth of about 150 to 250 m in diatom-dominated regions, df increases rapidly (see Fig. 7c) and, hence, so does 〈ws〉. By contrast, 〈ws〉 is only enhanced in the productive surface waters of the SAZ, upwelling regions and the associated OMZs due to the larger df and the dependent smaller b in S(df). The lower 〈ws〉 in large parts of the mesopelagic zone and below leads to a generally decreased transfer efficiency in S(df) (Fig. 15g). Consequently, the RLSs are shorter and enhance the silicate concentrations in surface waters in diatom-dominated regions (Fig. 15e). In the subtropical gyres, the silicate diminishes even further, which is likely related to the enhanced bulk phytoplankton growth through higher phosphate concentrations. Phosphate is remineralized more rapidly than silicate and thus can be transported downstream the equatorial current into the subtropical gyres, where it is enhanced in S(df) compared to M4AGO (Fig. 15b). As a consequence of the potential sensitivity of biogeochemical cycles on df, more knowledge of processes affecting the aggregate microstructure is required, among them, for example, are compaction through repacking and zooplankton egestion of fecal pellets.
Diazotrophs in HAMOCC can grow independently of nitrate on phosphate. They are regionally confined to warm tropical and subtropical regions (Paulsen et al., 2017, 2018). Diazotrophs modulate the phosphate concentration in the subtropical gyres. The diazotrophs' global primary production increases from about 2.2 Gt C yr−1 in the standard run to ≈2.9 Gt C yr−1 in the M4AGO run. A slower growth response to phosphate concentrations, enforced by raising the half-saturation constant from 0.05 to 0.10 µmol L−1 in S(KP,diaz), increases the phosphate concentrations in the subtropical gyres to more than 150 % (Fig. 15c). The primary production through diazotrophs reduces significantly from a former global value of ≈2.9 to ≈1.9 Gt C yr−1 in S(KP,diaz) and regionally particularly in the equatorial Panama Basin. By contrast, diazotrophs feature primary production of more than 5 and 7 Gt C yr−1 in S(dp,frustule) and S(df), respectively, due to the increased phosphate concentrations in the subtropical gyres. Diazotrophs in the model only produce organic matter. In S(KP,diaz), the lower diazotroph primary production in the equatorial upwelling regions (ETA and ETP) thus leads to a shift of the aggregate composition towards higher opal-to-detritus ratios, which slightly increases the transfer efficiency and reduces the available silicate (Fig. 15f). Phosphate previously utilized by diazotrophs in the Panama Basin now partially populates the downstream equatorial current and reaches the subtropical gyres. In comparison to the standard run, this phenomenon is generally intensified in M4AGO through the shallower remineralization and lower transfer efficiency in the subtropical gyres (Fig. 8c). In conclusion, the representation and effects of diazotrophs in HAMOCC, particularly in conjunction with M4AGO, require further future evaluation.
3.10 Current limitations of M4AGO
Developing M4AGO, we followed a process-oriented approach and explicitly incorporated ballasting and microstructure of aggregates of heterogeneous composition to calculate the mean sinking velocity. Introducing such complexity in ESMs typically comes at the cost of high computational efforts. This is a non-negligible factor for model development which we reduce to a minimum with M4AGO. Acknowledging the trade-off between increasing model complexity and computational limitations lets us deploy a number of simplifying assumptions that we critically review in the following.
In the euphotic zone of the oceans, changing phytoplankton community structure, phytoplankton growth, decay and grazing through zooplankton lead to a dynamic supply of various small particles that potentially aggregate and eventually sink and become remineralized. Assuming homogeneous composition of aggregates throughout a dynamic steady-state size distribution is therefore only the first step towards a model representation of marine snow, where local diversity of particles and the processes of aggregation and fragmentation are explicitly resolved. By assuming a dynamic steady state for the size distribution, we only represent the characteristic processes within the system and underestimate the variability in the number distribution slope, which ranges between b≈ 3.19 and 3.76, compared to measurements, where b≈2 to 5 (Guidi et al., 2009). As a consequence, M4AGO probably underestimates the variability in sinking velocity, particularly in the upper ocean, where the size distribution dynamically evolves.
In M4AGO, TEPs are simplistically considered. In agreement with Mari et al. (2017), TEPs are microstructure-loosening and buoyancy-adding for diatom-dominated aggregates. For CaCO3, we only considered the coccolith size which decreases sinking velocity compared to an aggregate composed of intact coccospheres. For simplicity, we assumed that aggregated TEP and intact cells sink as fast as coccoliths and detritus. To decipher the role of TEPs for aggregate formation (Passow, 2002; Mari et al., 2017), our model would require (i) representing TEPs and disintegrating coccospheres and (ii) considering aggregation and fragmentation processes explicitly to depict the dynamic evolution of marine aggregate distributions. Such a dynamic approach is necessary for, for example, studying short-term events of high POC export hypothesized to be driven by silicate depletion and TEP release by diatoms and their subsequent aggregation (Martin et al., 2011). More detailed models, such as, for example, the 1-D Lagrangian approach of Jokulsdottir and Archer (2016), can likely provide more insights into aggregate dynamics and can help to further improve the aggregate representation in ESM frameworks. Furthermore, an explicit representation of aggregation and fragmentation enables transient size distributions and would allow for a direct comparison to a growing number of particle distribution slope measurements (e.g., Guidi et al., 2009).
We implemented the novel Microstructure, Multiscale, Mechanistic, Marine Aggregates in the Global Ocean (M4AGO) scheme in HAMOCC to improve the representation of the biological carbon pump in an Earth system model framework. M4AGO accounts for the heterogeneity and microstructure of aggregates and thus clearly defines measurable statistic aggregate properties in HAMOCC. M4AGO links the nutrient and silicate cycle closer together by incorporating opal and other ballasting minerals in aggregate formation and sinking. This lets us introduce a consistent Q10 temperature-dependent dissolution and aerobic remineralization of opal and POC, respectively.
In contrast to the standard HAMOCC version, M4AGO provides a mechanistic understanding for the recently published global transfer efficiency pattern and represents it well. We identify primary-particle size, particularly of diatom frustules, and the compaction of aggregates with depth as strong driving factors for sinking velocity that, in combination with temperature-dependent remineralization, co-determine the high POC transfer efficiency in high latitudes and upwelling regions. Our model results support previous findings that CaCO3 with its high density acts as ballasting mineral in calcifier-dominated regions of the ocean. The changed transfer efficiency pattern in combination with the CaCO3-to-detritus rain ratio alters regional CO2 fluxes, while the global uptake remains the same as in the standard run, when atmospheric CO2 is linearly increased without climate feedbacks.
The highest uncertainties in parametrizing M4AGO are with respect to the weakly constrained primary-particle surface properties and their likely effect on the related microstructure of aggregates. Since sinking velocity and transfer efficiency are highly sensitive to the microstructure of aggregates, gaining insights into the controlling factors and processes for microstructure is desirable. Future model development for the representation of marine aggregates would highly benefit from sub-aggregate-scale measurements of microstructure, adhesive surface properties and primary-particle composition.
Our findings and the underlying model concept suggest a number of implications. First, the finding that the size of aggregate constituents, particularly of diatom frustules, acts as a potential factor for high sinking velocities, suggests widening the perspective of mineral ballast studies towards a size-and-ballast hypothesis. Further, such an extended size-and-ballast hypothesis requires factoring in the different temperature-dependent remineralization and dissolution rates that aggregates experience during their descent. Accounting for cell size and morphology will aid in better assessing the role of the phytoplankton community size structures in POC fluxes, particularly in nutrient-rich upwelling regions, where a wide, variable size spectrum of diatoms prevails. Second, the indirect temperature effect on phytoplankton cell size (e.g., Daufresne et al., 2009) poses the challenging task of resolving the temperature-adapting cell size structure of the phytoplankton community in global carbon cycle models to depict the potential effect on sinking velocity and thus the biological feedback on rising CO2 in the atmosphere.
In conclusion, M4AGO provides well-defined aggregate properties in an ESM framework and can thus serve as a test bed for upscaling aggregate-associated processes to potential global impacts on biogeochemical cycles and, in particular, on the biological carbon pump.
In addition to the aggregate properties presented in Fig. 6, M4AGO involves the aggregate mean stickiness and the number distribution slope that are tightly connected to each other via df (Fig. A1). In addition, the porosity of aggregates (Eq. 6) can be deduced from aggregate size, primary-particle size and df. Porosity is frequently calculated for aggregates (Alldredge and Gotschalk, 1988; Ploug et al., 2008). Its potential dependency on the microstructure and primary-particle size is, however, seldom covered. We therefore calculated the mean volume-weighted porosity of aggregates, 〈ϕ〉V, to provide perspective on how aggregate porosity varies with the aggregate properties shown in Fig. 6 in the global ocean (Fig. A1).
As defined by the attributed primary-particle stickiness, aggregates in diatom-dominated regions show the highest stickiness values in surface waters, since the virtual TEP particles linked to detritus increase the 〈α〉 in M4AGO (Fig. A1). At the bottom of the mesopelagic zone, 〈α〉 is almost homogeneous apart from the OMZ regions, where the lower anaerobic remineralization retains higher detritus concentrations that lead to higher 〈α〉 in conjunction with diatom frustules. The number distribution shows an inverted picture compared to 〈α〉 with the smallest decay slope, b, in diatom-dominated and OMZ regions and the strongest decline in calcifier-dominated surface waters (Fig. A1c, f). In M4AGO, 〈ϕ〉V is tightly connected to 〈α〉 in the euphotic zone (Fig. A1b). With increasing depth, aggregates get compacted, df increases and the maximum size of aggregates decreases. Both lead to lower 〈ϕ〉V, particularly in the diatom-dominated regions. In OMZs, however, 〈ϕ〉V is high. Generally, the exceptional behavior of aggregate properties in OMZs due to implicitly modeled TEPs is likely overestimated. TEPs possess higher remineralization rate than detritus (Mari et al., 2017), which likely reduces the TEPs occurrence in deep OMZs and thus their influence on aggregate properties.
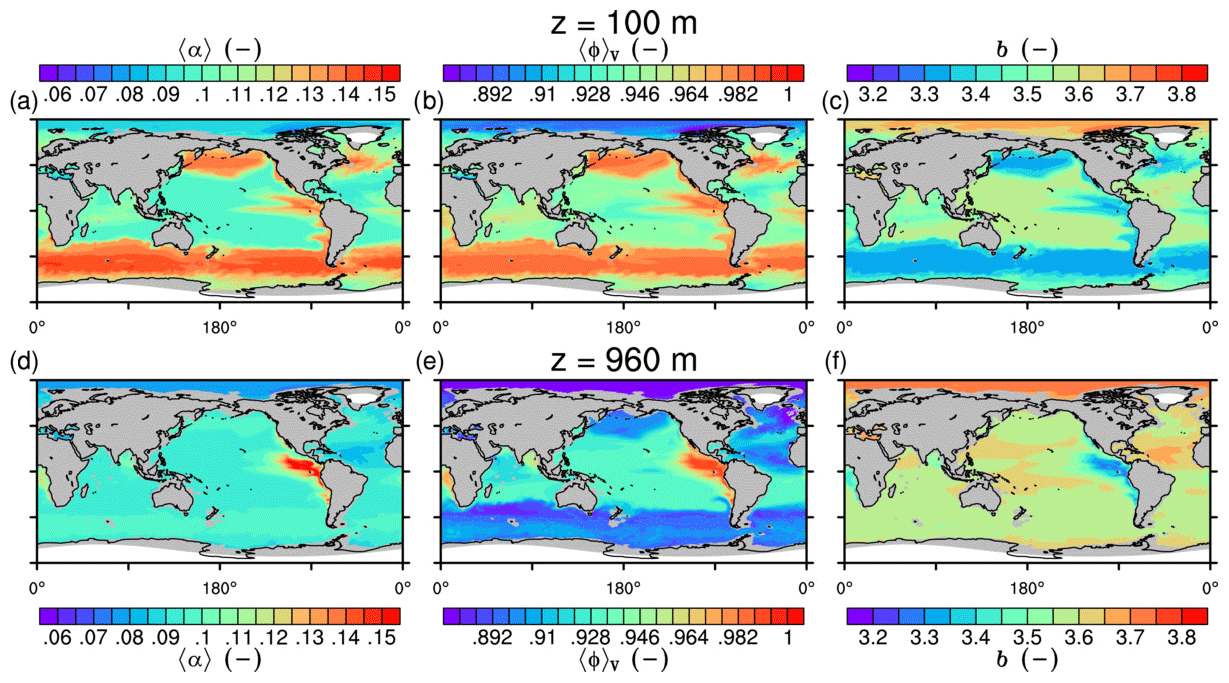
The effective Martin curve slope β′ provides a meaningful measure on the attenuation of POC fluxes. This made β′ a widely used measure to evaluate POC concentration and flux observations (e.g., Lutz et al., 2007; Lam et al., 2011; Marsay et al., 2015). In M4AGO, we found a β′ pattern similar to the inverse of the transfer efficiency (Fig. B1 compared to Fig. 8, respectively). The smallest β′ values are found in the models OMZ regions and the shallow Arctic shelf regions. In the North Pacific and North Atlantic, β′ features values of about 0.47 to 0.60 and reaches maximum values of about 1.31 in the subtropical gyres. Qualitatively, the pattern thus follows and underpins the previously suggested POC flux attenuation pattern (Marsay et al., 2015; Weber et al., 2016; DeVries and Weber, 2017). By contrast, in our standard run, we found, apart from OMZs, a rather homogeneous β′ with a global value of that is smaller than the prescribed value of β=1.00 in oxygen-saturated waters. This discrepancy can be attributed to a number of processes. First, the global is reduced by the lower anaerobic remineralization in OMZs. Second, turbulent diffusion and vertical transport processes represented by MPIOM in addition to sinking contribute to vertical POC concentration profiles and fluxes (Boyd et al., 2019). Third, the artificial numerical diffusion inherent in HAMOCC's implicit upstream scheme for particle sinking contributes to higher mass transport to depth than prescribed by β=1. This inherent numerical diffusion is, however, implicitly accounted for during the process of tuning β in the model.
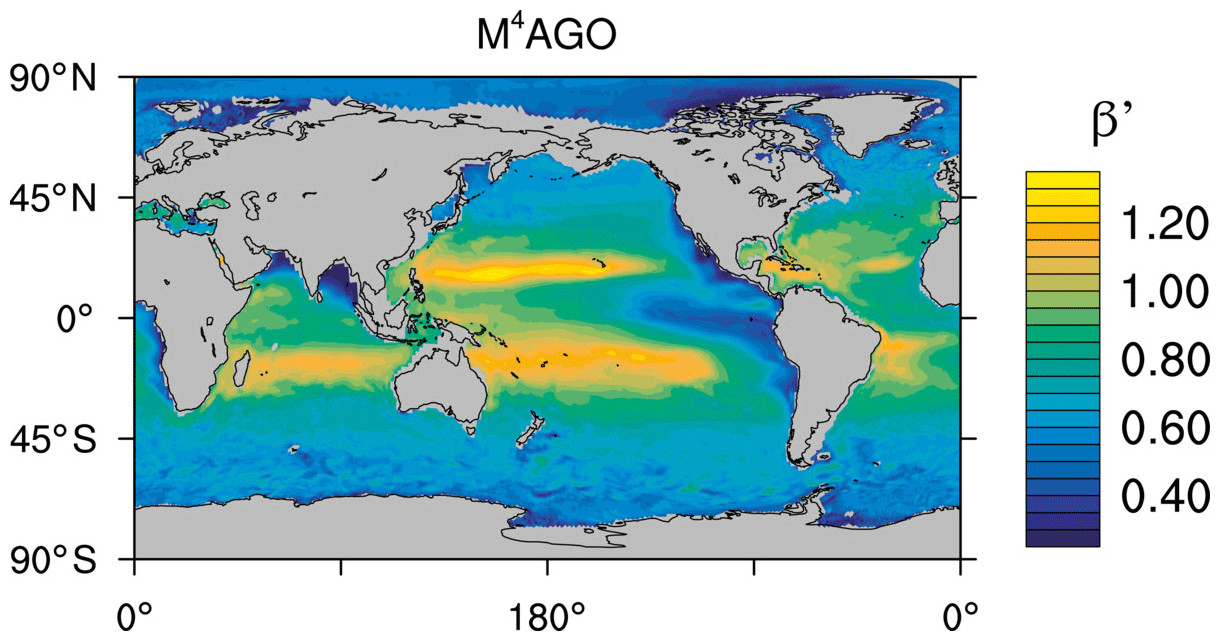
Figure B1Effective Martin curve slope for POC in M4AGO, β′.
The inversely identified transfer efficiency pattern by Weber et al. (2016) provides an estimate on time-integrated climatological POC fluxes. In regions of high seasonal variability in primary production, POC fluxes can undergo strong seasonal variation, and so does transfer efficiency (Lutz et al., 2007). For example, if we assume an average sinking speed of about 25 m d−1, a pulsed flux at 100 m reaches the depth of 1000 m about a month later and can strongly alter flux and concentration profiles (Lam et al., 2011; Giering et al., 2017). Accordingly, single measured POC concentration profiles can even show higher concentration at depth than in surface waters, which results in negative β′ values and thus higher transfer efficiency than 1. In turn, transfer efficiency can be extremely small at the beginning of a phytoplankton bloom. Seasonal transfer efficiency can thus heavily deviate from the climatological state. This seasonal behavior is reflected in M4AGO, which shows high transfer efficiency in late autumn and early times of low primary production after the bloom in high latitudes (Fig. C1). Even though the standard run exhibits a similar qualitative pattern, the seasonal amplitude of the transfer efficiency in high latitudes is lower in M4AGO compared to the standard run.

Figure C1Seasonal evolution of the transfer efficiency in M4AGO. Note the difference of the color bar values compared to Fig. 8.
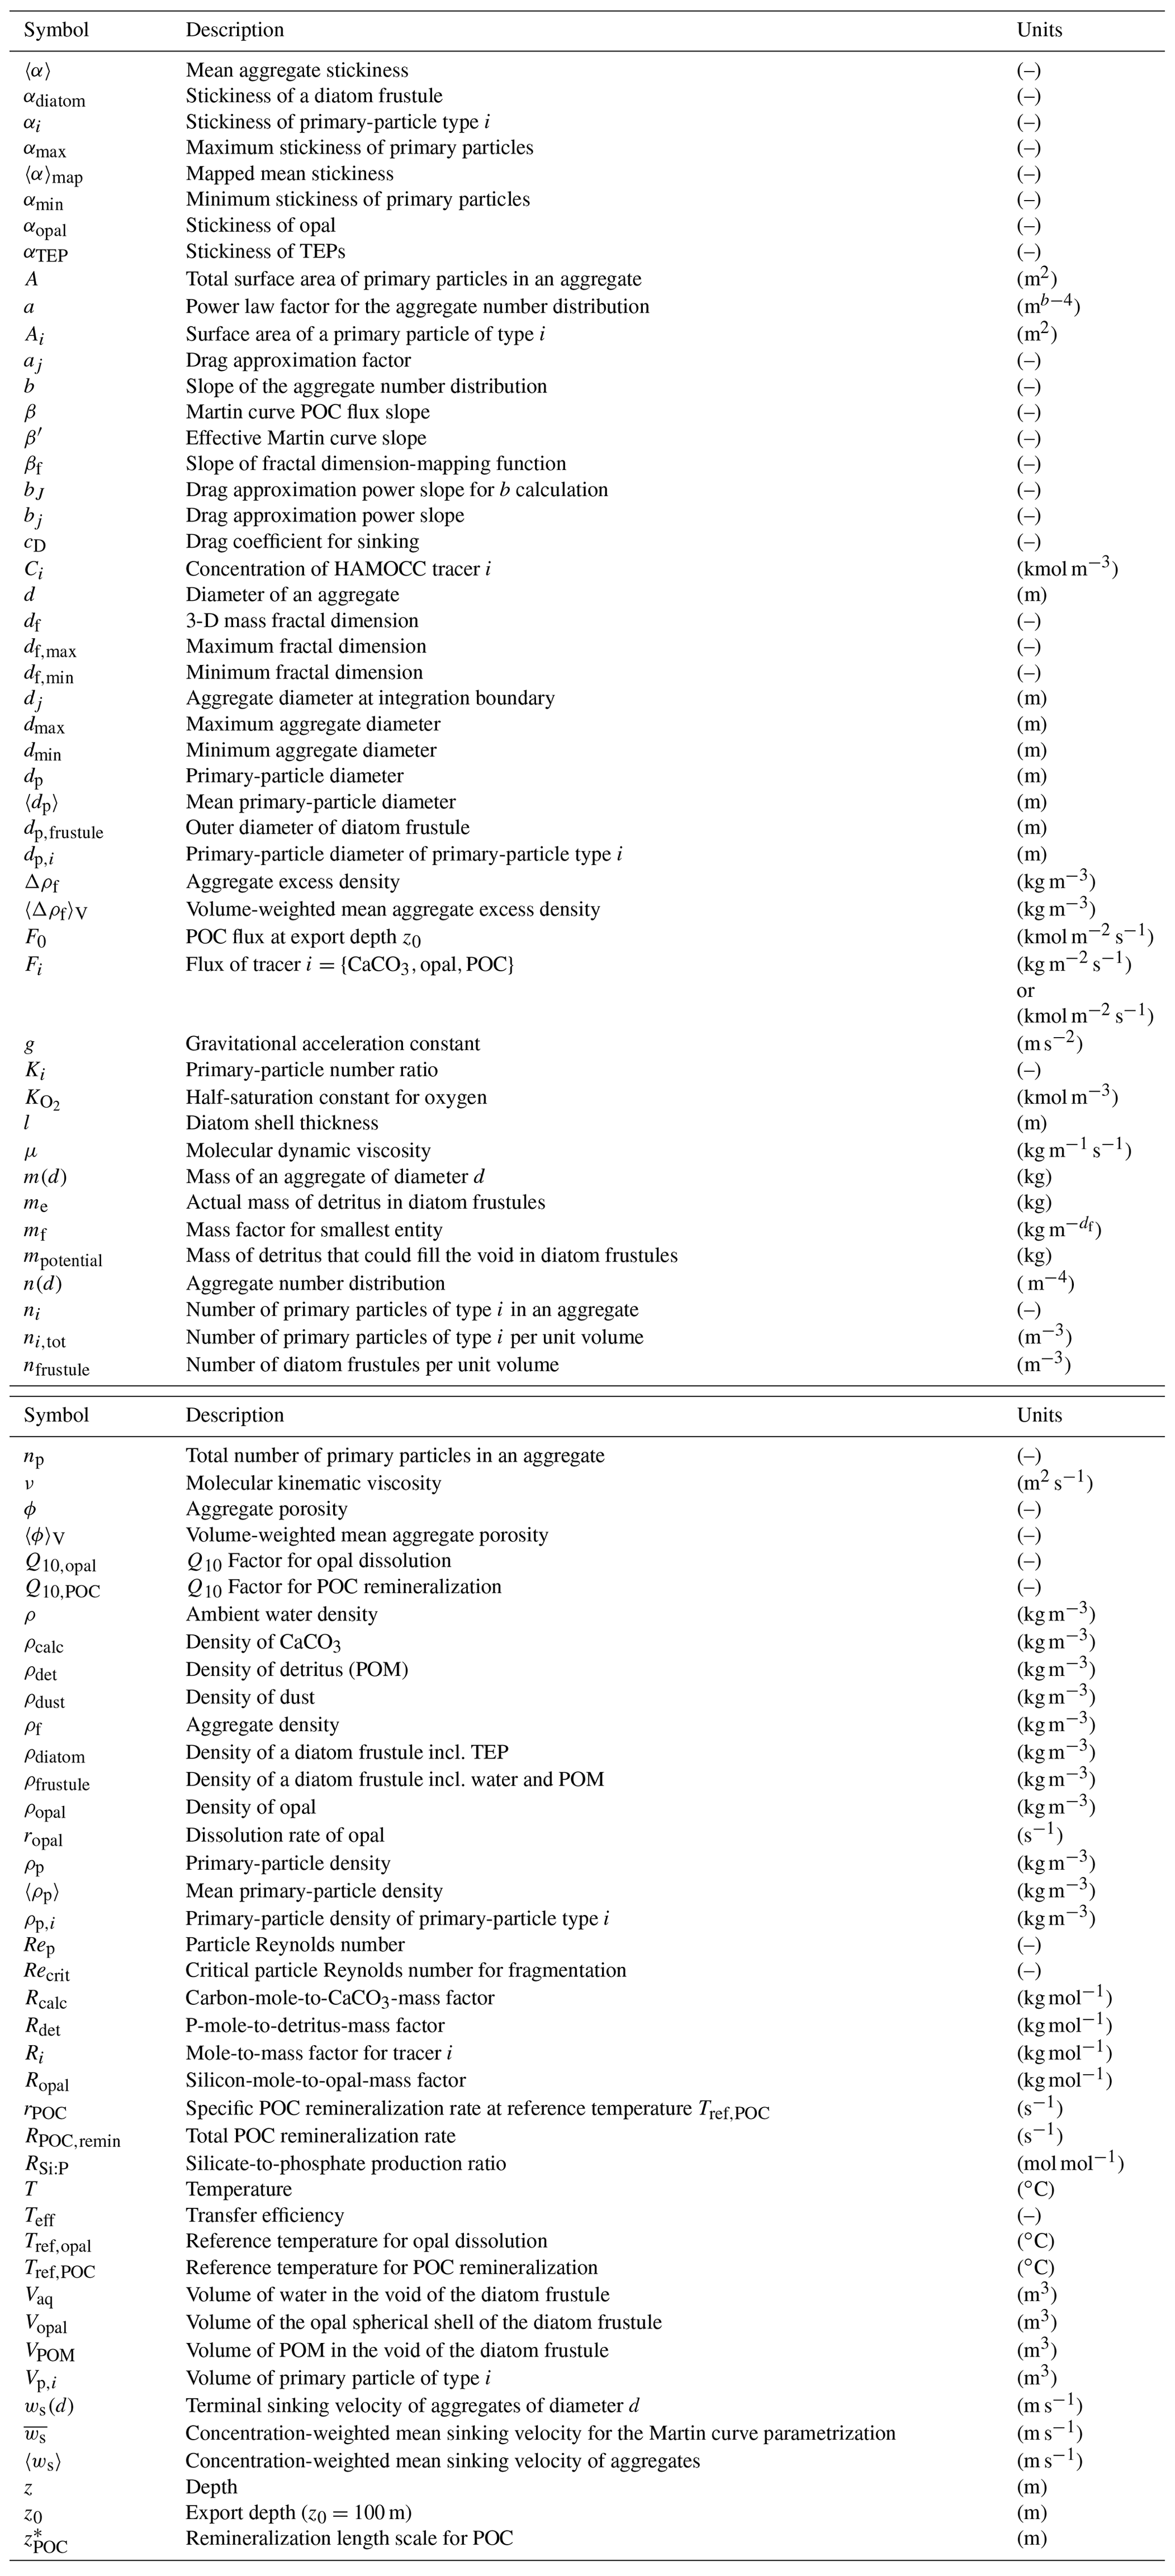
Primary data and code for this study are stored and made available through the Max Planck Society Publication Repository (https://pure.mpg.de/; last access: 17 March 2020): http://hdl.handle.net/21.11116/0000-0004-BD3E-3 (Max Planck Society, Munich, 2020). The respective MPIOM and HAMOCC model code (revision numbers: r4981 and r5003) is available on request after agreeing to the MPI-ESM license agreement and registering at the MPI-ESM-Forum (https://www.mpimet.mpg.de/en/science/models/licenses/, Max Planck Institute for Meteorology, Hamburg and Max Planck Society, Munich, 2020).
JM performed the M4AGO model development and the HAMOCC model runs and wrote the paper. KDS and IS significantly contributed in tuning the M4AGO sinking scheme in HAMOCC and aided during implementation. SA contributed significant discussions on aggregate microphysics. All authors of the paper critically discussed the presented results and contributed by providing valuable feedback during the paper compilation.
The authors declare that they have no conflict of interest.
The authors thank Thomas Weber for sharing the results on the transfer efficiency and Adrian Burd for the discussion on fractal dimension of aggregates. The authors thank Bo Liu for the internal review and comments on the paper. The authors thank the two anonymous reviewers for their constructive and valuable comments on the paper. Joeran Maerz thanks Ulrike Feudel for earlier discussions on the topic of marine aggregates. The Multiscale Approach on the Role of Marine Aggregates (MARMA) project is funded by the Max Planck Society (MPG). This work contributes to the project PalMod of the German Federal Ministry of Education and Research (BMBF) as a Research for Sustainable Development (FONA) initiative. Thanks to Thyng et al. (2016) for providing the cmocean colormap. All simulations were performed at the German Climate Computing Center (DKRZ).
This research has been supported by the European Commission H2020 Research Infrastructures (CRESCENDO (grant no. 641816)).
The article processing charges for this open-access
publication were covered by the Max Planck Society.
This paper was edited by Carolin Löscher and reviewed by two anonymous referees.
Adler, P. M.: A study of disaggregation effects in sedimentation, AlChE Journal, 25, 487–493, 1979. a, b
Alldredge, A.: The carbon, nitrogen and mass content of marine snow as a function of aggregate size, Deep-Sea Res. Pt. I, 45, 529–541, 1998. a
Alldredge, A. L. and Gotschalk, C.: In situ settling behaviour of marine snow, Limnol. Oceanogr., 33, 339–351, 1988. a, b, c, d, e, f, g, h, i
Alldredge, A. L. and Gotschalk, C. C.: The relative contribution of marine snow of different origins to biological processes in coastal waters, Cont. Shelf Res., 10, 41–58, 1990. a, b
Alldredge, A. L. and McGillivary, P.: The attachment probabilities of marine snow and their implications for particle coagulation in the ocean, Deep-Sea Res., 38, 431–443, 1991. a, b
Alldredge, A. L., Granata, T. C., Gotschalk, C. C., and Dickey, T. D.: The physical strength of marine snow and its implications for particle disaggregation in the ocean, Limnol. Oceanogr., 35, 1415–1428, 1990. a, b
Alldredge, A. L., Passow, U., and Logan, B. E.: The abundance and significance of a class of large, transparent organic particles in the ocean, Deep-Sea Res. Pt. I, 40, 1131–1140, 1993. a
Armbrecht, L. H., Smetacek, V., Assmy, P., and Klaas, C.: Cell death and aggregate formation in the giant diatom Coscinodiscus wailesii (Gran & Angst, 1931), J. Exp. Mar. Biol. Ecol., 452, 31–39, 2014. a
Armbrust, E. V.: The life of diatoms in the world's ocean, Nature, 459, 185–192, 2009. a, b
Armstrong, R. A., Lee, C., Hedges, J. I., Honjo, S., and Wakeham, S. G.: A new, mechanistic model for organic carbon fluxes in the ocean based on the quantitative association of POC with ballast minerals, Deep-Sea Res. Pt. II, 49, 219–236, 2002. a
Assmy, P., Smetacek, V., Montresor, M., Klaas, C., Henjes, J., Strass, V. H., Arieta, J. M., Bathmann, U., Berg, G. M., Breitbarth, E., Cisewski, B., Friedrichs, L., Fuchs, N., Herndl, G. J., Jansen, S., Krägefsky, S., Latasa, M., Peeken, I., Röttgers, R., Scharek, R., Schüller, S. E., Steigenberger, S., Webb, A., and Wolf-Gladrow, D.: Thick-shelled, grazer protected diatoms decouple ocean carbon and silicon cycles in the iron-limited Antarctic Circumpolar Current, P. Natl. Acad. Sci. USA, 110, 20633–20638, https://doi.org/10.1073/pnas.1309345110, 2013. a, b
Azam, F. and Malfatti, F.: Microbial structuring of marine ecosystems, Nature, 5, 782–791, 2007. a
Azetsu-Scott, K. and Passow, U.: Ascending marine particles: Significance of transparent exopolymer particles (TEP) in the upper ocean, Limnol. Oceanogr., 49, 741–748, 2004. a, b, c
Bach, L. T., Boxhammer, T., Larsen, A., Hildebrandt, N., Schulz, K. G., and Riebesell, U.: Influence of plankton community structure on the sinking velocity of marine aggregates, Global Biogeochem. Cy., 30, 971–994, https://doi.org/10.1002/2016GB005372, 2016. a, b
Bagster, D. F. and Tomi, D.: The stresses within a sphere in simple flow fields, Chem. Eng. Sci., 29, 1773–1783, 1974. a
Balch, W. M., Bowler, B. C., Drapeau, D. T., Poulton, A. J., and Holligan, P. M.: Biominerals and the vertical flux of particulate organic carbon from the surface ocean, Geophys. Res. Lett., 37, L22605, https://doi.org/10.1029/2010GL044640, 2010. a, b, c, d
Berelson, W. M., Balch, W. M., Najjar, R., Feely, R. A., Sabine, C., and Lee, K.: Relating estimates of CaCO3 production, export, and dissolution in the water column to measurements of CaCO3 rain into sediment traps and dissolution on the sea floor: A revised global carbonate budget, Global Biogeochem. Cy., 21, GB1024, https://doi.org/10.1029/2006GB002803, 2007. a
Bidle, K. D., Manganelli, M., and Azam, F.: Regulation of oceanic silicon and carbon preservation by temperature control on bacteria, Science, 298, 1980–1984, 2002. a, b, c, d, e, f
Biermann, A. and Engel, A.: Effect of CO2 on the properties and sinking velocity of aggregates of the coccolithophore Emiliania huxleyi, Biogeosciences, 7, 1017–1029, https://doi.org/10.5194/bg-7-1017-2010, 2010. a, b
Bisson, K. M., Siegel, D. A., DeVries, T., Cael, B. B., and Buesseler, K. O.: How data set characteristics influence ocean carbon export models, Global Biogeochem. Cy., 32, 1312–1328, https://doi.org/10.1029/2018GB005934, 2018. a
Block, A., von Bloh, W., and Schellnhuber, H. J.: Aggregation by attractive particle-cluster interaction, J. Phys. A-Math. Gen., 24, L1037–L1044, 1991. a
Bopp, L., Resplandy, L., Orr, J. C., Doney, S. C., Dunne, J. P., Gehlen, M., Halloran, P., Heinze, C., Ilyina, T., Séférian, R., Tjiputra, J., and Vichi, M.: Multiple stressors of ocean ecosystems in the 21st century: projections with CMIP5 models, Biogeosciences, 10, 6225–6245, https://doi.org/10.5194/bg-10-6225-2013, 2013. a
Boyd, P. and Newton, P.: Evidence of the potential influence of planctonic community structure on the interannual variability of particulate organic carbon flux, Deep-Sea Res. Pt. I, 42, 619–639, 1995. a
Boyd, P. W., Ellwood, M. J., Tagliabue, A., and Twining, B. S.: Biotic and abiotic retention, recycling and remineralization of metals in the ocean, Nat. Geosci., 10, 167–174, 2017. a
Boyd, P. W., Claustre, H., Levy, M., Siegel, D. A., and Weber, T.: Multi-faceted particle pumps drive carbon sequestration in the ocean, Nature, 568, 327–335, 2019. a
Boyer, T. P., Antonov, J. I., Baranova, O. K., Coleman, C., Garcia, H. E., Grodsky, A., Johnson, D. R., Locarnini, R. A., Mishonov, A. V., O'Brien, T. D., Paver, C. R., Reagan, J. R., Seidov, D., Smolyar, I. V., and Zweng, M. M.: World Ocean Database 2013, Tech. rep., NOAA National Oceanic and Atmospheric Administration, National Oceanographic Data Center User Services Team, NOAA/NESDIS E/OC1, Silver Spring, https://doi.org/10.7289/V5NZ85MT, 2013. a, b, c
Brakalov, L. B.: A connection between the orthokinetic coagulation capture efficiency of aggregates and their maximum size, Chem. Eng. Sci., 42, 2373–2383, 1987. a
Brandt, P., Greatbatch, R. J., Claus, M., Didwischus, S.-H., Hormann, V., Funk, A., Hahn, J., Krahmann, G., Fischer, J., and Körtzinger, A.: Ventilation of the equatorial Atlantic by the equatorial deep jets, J. Geophys. Res., 117, C12015, https://doi.org/10.1029/2012JC008118, 2012. a
Brzezinski, M. A.: The ratio of marine diatoms: interspecific variability and the effect of some environmental variables, J. Phycol., 21, 347–357, 1985. a
Buesseler, K. O.: The decoupling of production and particulate export in the surface ocean, Global Biogeochem. Cy., 12, 297–310, 1998. a, b
Buesseler, K. O. and Boyd, P. W.: Shedding light on processes that control particle export and flux attenuation in the twilight zone of the open ocean, Limnol. Oceanogr., 54, 1210–1232, 2009. a
Bushell, G. and Amal, R.: Fractal aggregates of polydisperse particles, J. Colloid Interf. Sci., 205, 459–469, 1998. a, b, c
Cael, B. B. and Bisson, K.: Particle flux parameterizations: quantitative and mechanistic similarities and differences, Frontiers in Marine Science, 5, 395, https://doi.org/10.3389/fmars.2018.00395, 2018. a
Carr, M.-E., Friedrich, M. A. M., Schmeltz, M., Aita, M. N., Antoine, D., Arrigo, K. R., Asanuma, I., Aumont, O., Barber, R., Behrenfeld, M., Bidigare, R. E. T., Campbell, J., Ciotti, A., Dierssen, H., Dowell, M., Dunne, J., Esaias, W., Gentili, B., Gregg, W., Groom, S., Hoepffner, N., Ishizaka, J., Kameda, T., Le Quéré, C., Lohrenz, S., Marra, J., Mélin, F., Moore, K., Morel, A., Reddy, T. E., Ryan, J., Scardi, M., Smyth, T., Turpie, K., Tilstone, G., Waters, K., and Yamanaka, Y.: A comparison of global estimates of marine primary production from ocean color, Deep-Sea Res., 53, 741–770, 2006. a
Cram, J. A., Weber, T., Leung, S. W., McDonnell, A. M. P., Liang, J.-H., and Deutsch, C.: The role of particle size, ballast, temperature, and oxygen in the sinking flux to the deep sea, Global Biogeochem. Cy., 32, 858–876, https://doi.org/10.1029/2017GB005710, 2018. a, b, c, d, e, f, g, h
Dam, H. G. and Drapeau, D. T.: Coagulation efficiency, organic-matter glues and the dynamics of particles during a phytoplankton bloom in a mesocoms study, Deep-Sea Res. Pt. II, 42, 111–123, 1995. a, b, c
Daufresne, M., Lengfeller, K., and Sommer, U.: Global warming benefits the small in aquatic ecosystems, P. Natl. Acad. Sci. USA, 106, 12788–12793, 2009. a, b, c
De La Rocha, C. L. and Passow, U.: Factors influencing the sinking of POC and the efficiency of the biological carbon pump, Deep-Sea Res. Pt. II, 54, 639–658, 2007. a, b, c, d
De La Rocha, C. L., Nowald, N., and Passow, U.: Interactions between diatom aggregates, minerals, particulate organic carbon, and dissolved organic matter: Further implications for the ballast hypothesis, Global Biogeochem. Cy., 22, GB4005, https://doi.org/10.1029/2007GB003156, 2008. a
Decho, A. W.: Microbial exopolymer secretions in oceanic environments: their role(s) in food webs and marine processes, Oceanogr. Mar. Biol., 28, 73–153, 1990. a
Dell, A. I., Pawar, S., and Savage, V. M.: Systematic variation in the temperature dependence of physiological and ecological traits, P. Natl. Acad. Sci. USA, 108, 10591–10596, 2011. a, b
DeVries, T. and Weber, T.: The export and fate of organic matter in the ocean: New constraints from combining satellite and oceanographic tracer observations, Global Biogeochem. Cy., 31, 535–555, 2017. a, b, c
DeVries, T., Liang, J.-H., and Deutsch, C.: A mechanistic particle flux model applied to the oceanic phosphorus cycle, Biogeosciences, 11, 5381–5398, https://doi.org/10.5194/bg-11-5381-2014, 2014. a, b
Dietze, H. and Loeptien, U.: Revisiting “nutrient trapping” in global coupled biogeochemical ocean circulation models, Global Biogeochem. Cy., 27, 1–20, https://doi.org/10.1002/gbc.20029, 2013. a
Dilling, L. and Alldredge, A. L.: Fragmentation of marine snow by swimming macrozooplankton: A new process impacting carbon cycling in the sea, Deep-Sea Res. Pt. I, 47, 1227–1245, 2000. a
Dunne, J. P., Armstrong, R. A., Gnanadesikan, A., and Sarmiento, J. L.: Empirical and mechanistic models for the particle export ratio, Global Biogeochem. Cy., 19, GB4026, https://doi.org/10.1029/2004GB002390, 2005. a
Eisma, D.: Flocculation and de-flocculation of suspended matter in estuaries, Neth. J. Sea Res., 20, 183–199, 1986. a
Engel, A., Thoms, S., Riebesell, U., Rochelle-Newall, E., and Zondervan, I.: Polysaccharide aggregation as a potential sink of marine dissolved organic carbon, Nature, 428, 929–932, 2004. a
Engel, A., Szlosek, J., Abramson, L., Liu, Z., and Lee, C.: Investigating the effect of ballasting by CaCO3 in Emiliania huxleyi, I. Formation, settling velocities and physical properties of aggregates, Deep-Sea Res. Pt. II, 56, 1396–1407, 2009. a
England, M. H. and Maier-Reimer, E.: Using chemical tracers to assess ocean models, Rev. Geophys., 39, 29–70, 2001. a
Falkowski, P. G., Barber, R. T., and Smetacek, V.: Biogeochemical Controls and Feedbacks on Ocean Primary Productivity, Science, 281, 200–206, 1998. a
Fettweis, M.: Uncertainty of excess density and settling velocity of mud flocs derived from in situ measurements, Estuar. Coast. Shelf S., 78, 426–436, 2008. a, b, c, d
Filella, M.: Colloidal properties of submicron particles in natural waters, in: Environmental Colloids and Particles: Behaviour, Separation and Characterisation, IUPAC Series on Analytical and Physical Chemistry of Environmental Systems, chap. 2, 17–93, John Wiley & Sons, Inc., Chichester, UK, 2007. a, b, c
Fischer, G. and Karakaş, G.: Sinking rates and ballast composition of particles in the Atlantic Ocean: implications for the organic carbon fluxes to the deep ocean, Biogeosciences, 6, 85–102, https://doi.org/10.5194/bg-6-85-2009, 2009. a
Fischer, G., Romero, O., Merkel, U., Donner, B., Iversen, M., Nowald, N., Ratmeyer, V., Ruhland, G., Klann, M., and Wefer, G.: Deep ocean mass fluxes in the coastal upwelling off Mauritania from 1988 to 2012: variability on seasonal to decadal timescales, Biogeosciences, 13, 3071–3090, https://doi.org/10.5194/bg-13-3071-2016, 2016. a
Francois, R., Honjo, S., Krishfield, R., and Manganini, S.: Factors controlling the flux of organic carbon to the bathypelagic zone of the ocean, Global Biogeochem. Cy., 16, 1087, https://doi.org/10.1029/2001GB001722, 2002. a, b, c, d
Garcia, H. E., Locarnini, R. A., Boyer, T. P., Antonov, J. I., Baranova, O. K., Zweng, M. M., Reagan, J. R., and Johnson, D. R.: World Ocean Atlas 2013, NOAA Atlas NESDIS 75, Volume 3: Dissolved Oxygen, Apparent Oxygen Utilization, and Oxygen Saturation, 27 pp., 2014a. a
Garcia, H. E., Locarnini, R. A., Boyer, T. P., Antonov, J. I., Baranova, O. K., Zweng, M. M., Reagan, J. R., and Reagan, D. R.: World Ocean Atlas 2013, NOAA Atlas NESDIS 76, Volume 4: Dissolved Inorganic Nutrients (phosphate, nitrate, silicate), 25pp, 2014b. a, b, c, d
Gehlen, M., Bopp, L., Emprin, N., Aumont, O., Heinze, C., and Ragueneau, O.: Reconciling surface ocean productivity, export fluxes and sediment composition in a global biogeochemical ocean model, Biogeosciences, 3, 521–537, https://doi.org/10.5194/bg-3-521-2006, 2006. a, b, c, d, e
Giering, S. L. C., Sanders, R., Martin, A. P., Henson, S. A., Riley, J. S., Marsay, C. M., and Johns, D. G.: Particle flux in the oceans: Callenging the steady state assumption, Global Biogeochem. Cy., 31, 159–171, 2017. a
Gloor, M., Gruber, N., Sarmiento, J., Sabine, C. L., Feely, R. A., and Rödenbeck, C.: A first estimate of present and preindustrial air-sea CO2 flux patterns based on ocean interior carbon measurements and models, Geophys. Res. Lett., 30, 1010, https://doi.org/10.1029/2002GL015594, 2003. a
Guidi, L., Jackson, G. A., Stemmann, L., Miquel, J. C., Picheral, M., and Gorsky, G.: Relationship between particle size distribution and flux in the mesopelagic zone, Deep-Sea Res. Pt. I, 55, 1364–1374, 2008. a, b, c
Guidi, L., Stemmann, L., Jackson, G. A., Ibanez, F., Claustre, H., Legendre, L., Picheral, M., and Gorsky, G.: Effects of phytoplankton community on production, size and export of large aggregates: A world-ocean analysis, Limnol. Oceanogr., 54, 1951–1963, 2009. a, b, c, d, e
Guidi, L., Chaffron, S., Bittner, L., Eveillard, D., Larhlimi, A., Roux, S., Darzi, Y., Audic, S., Berline, L., Brum, J. R., Coelho, L. P., Espinoza, J. C. I., Malviya, S., Sunagawa, S., Dimier, C., Kandels-Lewis, S., Picheral, M., Poulain, J., Searson, S., Tara Oceans Consortium Coordinators, Stemmann, L., Not, F., Hingamp, P., Speich, S., Follows, M., Karp-Boss, L., Boss, E., Ogata, H., Pesant, S., Weissenbach, J., Wincker, P., Acinas, S. G., Bork, P., de Vargas, C., Iudicone, D., Sullivan, M. B., Raes, J., Karsenti, E., Bowler, C., and Gorsky, G.: Plankton networks driving carbon export in the oligotrophic ocean, Nature, 532, 465–481, 2016. a, b
Hamm, C. E.: Interactive aggregation and sedimentation of diatoms and clay-sized lithogenic material, Limnol. Oceanogr., 47, 1790–1795, 2002. a
Hansen, J. L. S. and Kiørboe, T.: Quantifying interspecific coagulation efficiency of phytoplankton, Mar. Ecol.-Prog. Ser., 159, 75–79, 1997. a, b, c
Hedges, J. L., Baldock, J. A., Gélinas, Y., Lee, C., Peterson, M., and Wakeham, S. G.: Evidence for non-selective preservation of organic matter in sinking marine particles, Nature, 409, 801–804, 2001. a
Heinemann, M., Segschneider, J., and Schneider, B.: CO2 drawdown due to particle ballasting by glacial aeolian dust: an estimate based on the ocean carbon cycle model MPIOM/HAMOCC version 1.6.2p3, Geosci. Model Dev., 12, 1869–1883, https://doi.org/10.5194/gmd-12-1869-2019, 2019. a, b, c
Heinze, C., Maier-Reimer, E., Winguth, A. M. E., and Archer, D.: A global oceanic sediment model for long-term climate studies, Global Biogeochem. Cy., 13, 221–250, 1999. a, b
Henderiks, J.: Coccolithophore size rules – Reconstructing ancient cell geometry and cellular calcite quota from fossil coccoliths, Mar. Micropaleontol., 67, 143–154, 2008. a, b
Henderiks, J. and Pagani, M.: Coccolithophore cell size and the Paleogene decline in atmopheric CO2, Earth Planet. Sc. Lett., 269, 576–584, 2008. a
Henson, S. A., Sanders, R., Madsen, E., Morris, P. J., Le Moigne, F., and Quartly, G. D.: A reduced estimate of the strength of the ocean's biological carbon pump, Geophys. Res. Lett., 38, L04606, https://doi.org/10.1029/2011GL046735, 2011. a, b
Henson, S. A., Sanders, R., and Madsen, E.: Global patterns in efficiency of particulate organic carbon export and transfer to the deep ocean, Global Biogeochem. Cy., 265, GB1028, https://doi.org/10.1029/2011GB004099, 2012. a, b, c, d
Hill, P. S.: Controls on floc size in the sea, Oceanography, 11, 13–18, 1998. a
Honjo, S.: Coccoliths: Production, transportation and sedimentation, Mar. Micropaleontol., 1, 65–79, 1976. a
Ilyina, T. and Friedlingstein, P.: WCRP Grand Challenge – Carbon feedbacks in the climate system, Tech. rep., WCRP, available at: https://www.wcrp-climate.org/JSC37/Documents/BGCGC_whitepaper_submission.pdf (last access: 19 March 2020), 2016. a
Ilyina, T., Six, K. D., Segschneider, J., Maier-Reimer, E., Li, H., and Núñez-Riboni, I.: Global ocean biogeochemistry model HAMOCC: Model architecture and performance as component of the MPI-Earth system model in different CMIP5 experimental realizations, J. Adv. Model. Earth Sy., 5, 1–29, 2013. a, b
Iversen, M. H. and Ploug, H.: Ballast minerals and the sinking carbon flux in the ocean: carbon-specific respiration rates and sinking velocity of marine snow aggregates, Biogeosciences, 7, 2613–2624, https://doi.org/10.5194/bg-7-2613-2010, 2010. a
Iversen, M. H. and Ploug, H.: Temperature effects on carbon-specific respiration rate and sinking velocity of diatom aggregates – potential implications for deep ocean export processes, Biogeosciences, 10, 4073–4085, https://doi.org/10.5194/bg-10-4073-2013, 2013. a
Iversen, M. H. and Robert, M. L.: Ballasting effects of smectite on aggregate formation and export from a natural plankton community, Mar. Chem., 175, 18–27, 2015. a
Jackson, G. A.: A model of the formation of marine algal flocs by physical coagulation processes, Deep-Sea Res., 37, 1197–1211, 1990. a, b
Jackson, G. A.: Using fractal scaling and two-dimensional particle size spectra to calculate coagulation rates for heterogeneous systems, J. Colloid Interf. Sci., 202, 20–29, 1998. a, b
Jiang, Q. and Logan, B. E.: Fractal dimension of aggregates determined from steady-state size distributions, Environ. Sci. Technol., 25, 2031–2038, 1991. a, b, c, d, e
Jokulsdottir, T. and Archer, D.: A stochastic, Lagrangian model of sinking biogenic aggregates in the ocean (SLAMS 1.0): model formulation, validation and sensitivity, Geosci. Model Dev., 9, 1455–1476, https://doi.org/10.5194/gmd-9-1455-2016, 2016. a, b
Jungclaus, J. H., Fischer, N., Haak, H., Lohmann, K., Marotzke, J., Matei, D., Mikolajewicz, U., Notz, D., and von Storch, J. S.: Characteristics of the ocean simulations in the Max Planck Institute Ocean Model (MPIOM) the ocean component of the MPI-Earth system model, J. Adv. Model. Earth Sy., 5, 422–446, https://doi.org/10.1002/jame.20023, 2013. a, b, c
Khelifa, A. and Hill, P. S.: Models for effective density and settling velocity of flocs, J. Hydraul. Res., 44, 390–401, 2006. a
Kiørboe, T., Andersen, K. P., and Dam, H. G.: Coagulation efficiency and aggregate formation in marine phytoplankton, Mar. Biol., 107, 235–245, 1990. a, b
Kiørboe, T., Ploug, H., and Thygesen, U. H.: Fluid motion and solute distribution around sinking aggregates. I. Small-scale fluxes and heterogeneity of nutrients in the pelagic environment, Mar. Ecol.-Prog. Ser., 211, 1–13, 2001. a, b
Klaas, C. and Archer, D. E.: Association of sinking organic matter with various types of mineral ballast in the deep sea: Implications for the rain ratio, Global Biogeochem. Cy., 16, 1116, https://doi.org/10.1029/2001GB001765, 2002. a
Kostadinov, T. S., Milutinović, S., Marinov, I., and Cabré, A.: Carbon-based phytoplankton size classes retrieved via ocean color estimates of the particle size distribution, Ocean Sci., 12, 561–575, https://doi.org/10.5194/os-12-561-2016, 2016. a
Kranenburg, C.: The fractal structure of cohesive sediment aggregates, Estuar. Coast. Shelf S., 39, 451–460, 1994. a, b, c
Kranenburg, C.: Effects of floc strength on viscosity and deposition of cohesive sediment suspensions, Cont. Shelf Res., 19, 1665–1680, 1999. a, b, c
Kriest, I. and Evans, G. T.: Representing phytoplankton aggregates in biogeochemical models, Deep-Sea Res. Pt. I, 46, 1841–1859, 1999. a, b
Kriest, I. and Oschlies, A.: On the treatment of particulate organic matter sinking in large-scale models of marine biogeochemical cycles, Biogeosciences, 5, 55–72, https://doi.org/10.5194/bg-5-55-2008, 2008. a, b
Lam, P. J. and Marchal, O.: Insights into particle cycling from thorium and particle data, Annu. Rev. Mar. Sci., 7, 159–184, 2015. a
Lam, P. J., Doney, S. C., and Bishop, J. K. B.: The dynamic ocean biological pump: Insights from a global compilation of particulate organic carbon, CaCO3, and opal concentration profiles from the mesopelagic, Global Biogeochem. Cy., 25, GB3009, https://doi.org/10.1029/2010GB003868, 2011. a, b
Laurenceau-Cornec, E. C., Trull, T. W., Davies, D. M., De La Rocha, C. L., and Blain, S.: Phytoplankton morphology controls on marine snow sinking velocity, Mar. Ecol.-Prog. Ser., 520, 35–56, 2015. a, b
Laurenceau-Cornec, E. C., Le Moigne, F. A. C., Gallinari, M., Moriceau, B., Toullec, J., Iversen, M. H., Engel, A., and De La Rocha, C. L.: New guidelines for the application of Stokes' models to the sinking velocity of marine aggregates, Limnol. Oceanogr., https://doi.org/10.1002/lno.11388, online first, 2019. a, b
Lauvset, S. K., Key, R. M., Olsen, A., van Heuven, S., Velo, A., Lin, X., Schirnick, C., Kozyr, A., Tanhua, T., Hoppema, M., Jutterström, S., Steinfeldt, R., Jeansson, E., Ishii, M., Perez, F. F., Suzuki, T., and Watelet, S.: A new global interior ocean mapped climatology: the 1∘ × 1∘ GLODAP version 2, Earth Syst. Sci. Data, 8, 325–340, https://doi.org/10.5194/essd-8-325-2016, 2016. a, b
Laws, E. A., Falkowski, P. G., Smith Jr., W. O., Ducklow, H., and McCarthy, J. J.: Temperature effects on export production in the open ocean, Global Biogeochem. Cy., 14, 1231–1246, 2000. a
Lefort, S., Aumont, O., Bopp, L., Arsouze, T., Gehlen, M., and Maury, O.: Spatial and body-size dependent response of marine pelagic communities to projected global climate change, Glob. Change Biol., 21, 154–164, https://doi.org/10.1111/gcb.12679, 2015. a
Le Moigne, F. A. C., Cisternas-Novoa, C., Piontek, J., Maßmig, M., and Engel, A.: On the effect of low oxygen concentrations on bacterial degradation of sinking particles, Sci. Rep.-UK, 7, 16722, https://doi.org/10.1038/s41598-017-16903-3, 2017. a
Lewin, J. C.: The dissolution of silica from diatom walls, Geochim. Cosmochim. Ac., 21, 182–198, 1961. a
Li, X. and Logan, B. E.: Size distributions and fractal properties of particles during a simulated phytoplankton bloom in a mesocosm, Deep-Sea Res. Pt. II, 42, 125–138, 1995. a
Litchman, E., Klausmeier, C. A., and Yoshiyama, K.: Contrasting size evolution in marine and freshwater diatoms , P. Natl. Acad. Sci. USA, 106, 2665–2670, 2009. a, b
Liu, J., Shih, W. Y., Sarikaya, M., and Aksay, I. A.: Fractal colloidal aggregates with finite interparticle interactions: Energy dependence of the fractal dimension, Phys. Rev. A, 41, 3206–3213, https://doi.org/10.1103/PhysRevA.41.3206, 1990. a, b, c
Logan, B. E. and Alldredge, A. L.: Potential for increased nutrient uptake by flocculating diatoms, Mar. Biol., 101, 443–450, 1989. a
Logan, B. E. and Wilkinson, D. B.: Fractal geometry of marine snow and other biological aggregates, Limnol. Oceanogr., 35, 130–136, 1990. a, b, c, d
Löscher, C. R., Bange, H. W., Schmitz, R. A., Callbeck, C. M., Engel, A., Hauss, H., Kanzow, T., Kiko, R., Lavik, G., Loginova, A., Melzner, F., Meyer, J., Neulinger, S. C., Pahlow, M., Riebesell, U., Schunck, H., Thomsen, S., and Wagner, H.: Water column biogeochemistry of oxygen minimum zones in the eastern tropical North Atlantic and eastern tropical South Pacific oceans, Biogeosciences, 13, 3585–3606, https://doi.org/10.5194/bg-13-3585-2016, 2016. a
Lutz, M., Dunbar, R., and Caldeira, K.: Regional variability in the vertical flux of particulate organic carbon in the ocean interior, Global Biogeochem. Cy., 16, 1037, https://doi.org/10.1029/2000GB001383, 2002. a
Lutz, M. J., Caldeira, K., Dunbar, R. B., and Behrenfeld, M. J.: Seasonal rhythms of net primary production and particulate organic carbon flux to depth describe the efficiency of biological pump in the global ocean, J. Geophys. Res., 112, C10011, https://doi.org/10.1029/2006JC003706, 2007. a, b
Maggi, F.: Biological flocculation of suspended particles in nutrient-rich aqueous ecosystems, J. Hydrol., 376, 116–125, 2009. a
Maher, B. A., Prospero, J. M., Mackie, D., Gaiero, D., Hesse, P. P., and Balkanski, Y.: Global connections between aeolian dust, climate and ocean biogeochemistry at the present day and at the last glacial maximum, Earth-Sci. Rev., 99, 61–97, 2010. a, b
Mahowald, N., Albani, S., Kok, J. F., Engelstaeder, S., Scanza, R., Ward, D. S., and Flanner, M. G.: The size distribution of desert dust aerosols and its impact on the Earth system, Aeolian Res., 15, 53–71, 2014. a, b
Mari, X., Passow, U., Migon, C., Burd, A. B., and Legendre, L.: Transparent exopolymer particles: Effects on carbon cycling in the ocean, Prog. Oceanogr., 151, 13–37, 2017. a, b, c, d, e, f, g, h
Marsay, C. M., Sanders, R. J., Henson, S. A., Pabortsava, K., Achterberg, E. P., and Lampitt, R. S.: Attenuation of sinking particulate organic carbon flux through the mesopelagic ocean, P. Natl. Acad. Sci. USA, 112, 1089–1094, 2015. a, b, c, d, e, f, g
Marsland, S. J., Haak, H., Jungclaus, J. H., Latif, M., and Röske, F.: The Max-Planck-Institute global ocean/sea ice model with orthogonal curvilinear coordinates, Ocean Model., 5, 91–127, 2003. a
Martin, J. H., Knauer, G. A., Karl, D. M., and Broenkow, W. W.: VERTEX: carbon cycling in the northeast Pacific, Deep-Sea Res., 34, 267–285, 1987. a, b, c, d
Martin, P., Lampitt, R. S., Perry, M. J., Sanders, R., Lee, C., and D'Asaro, E.: Export and mesopelagic particle flux during a North Atlantic spring diatom bloom, Deep-Sea Res. Pt. I, 58, 338–349, 2011. a
Matthäus, W.: Die Viskosität des Meerwassers, Beitr. Meereskd., 29, 93–107, 1972 (in German). a
Mauritsen, T., Bader, J., Becker, T., Behrens, J., Bittner, M., Brokopf, R., Brovkin, V., Claussen, M., Crueger, T., Esch, M., Fast, I., Fiedler, S., Fläschner, D., Gayler, V., Giorgetta, M., Goll, D. S., Haak, H., Hagemann, S., Hedemann, C., Hohenegger, C., Ilyina, T., Jahns, T., Jimenéz-de-la Cuesta, D., Jungclaus, J., Kleinen, T., Kloster, S., Kracher, D., Kinne, S., Kleberg, D., Lasslop, G., Kornblueh, L., Marotzke, J., Matei, D., Meraner, K., Mikolajewicz, U., Modali, K., Möbis, B., Müller, W. A., Nabel, J. E. M. S., Nam, C. C. W., Notz, D., Nyawira, S.-S., Paulsen, H., Peters, K., Pincus, R., Pohlmann, H., Pongratz, J., Popp, M., Raddatz, T. J., Rast, S., Redler, R., Reick, C. H., Rohrschneider, T., Schemann, V., Schmidt, H., Schnur, R., Schulzweida, U., Six, K. D., Stein, L., Stemmler, I., Stevens, B., von Storch, J.-S., Tian, F., Voigt, A., Vrese, P., Wieners, K.-H., Wilkenskjeld, S., Winkler, A., and Roeckner, E.: Developments in the MPI-M Earth System Model version 1.2 (MPI-ESM1.2) and Its Response to Increasing CO2, J. Adv. Model. Earth Sy., 11, 1–41, https://doi.org/10.1029/2018MS001400, 2019. a, b, c, d
Max Planck Institute for Meteorology, Hamburg and Max Planck Society, Munich: MPI-ESM User Forum, available at: https://www.mpimet.mpg.de/en/science/models/licenses/, last access: 17 March 2020. a
Max Planck Society, Munich: Max Planck Society Publication Repository MPG.PuRe, available at: http://hdl.handle.net/21.11116/0000-0004-BD3E-3, last access: 17 March 2020. a
McCave, I. N.: Size spectra and aggregation of suspended particles in the deep ocean, Deep-Sea Res., 31, 329–352, 1984. a, b
Meakin, P.: Models for colloidal aggregation, Annu. Rev. Phys. Chem., 39, 237–267, 1988. a, b
Mikaloff Fletcher, S. E., Gruber, N., Jacobson, A. R., Gloor, M., Doney, S. C., Dutkiewicz, S., Gerber, M., Follows, M., Joos, F., Lindsay, K., Menemenlis, D., Mouchet, A., Müller, S. A., and Sarmiento, J. L.: Inverse estimates of the oceanic sources and sinks of natural CO2 and the implied oceanic carbon transport, Global Biogeochem. Cy., 21, GB1010, https://doi.org/10.1029/2006GB002751, 2007. a
Miklasz, K. A. and Denny, M. W.: Diatom sinking speeds: Improved predictions and insights from a modified Stokes' law, Limnol. Oceanogr., 55, 2513–2525, 2010. a
Milinski, S., Bader, J., Haak, H., Siongco, A. C., and Jungclaus, J. H.: High atmospheric horizontal resolution eliminates the wind-driven coastal warm bias in the southeastern tropical Atlantic, Geophys. Res. Lett., 43, 10455–10462, https://doi.org/10.1002/2016GL070530, 2016. a
Mislan, K. A. S., Stock, C. A., Dunne, J. P., and Sarmiento, J.: Group behaviour among model bacteria influences particulate carbon mineralization depths, J. Mar. Res., 72, 183–218, 2014. a, b, c
Mouw, C. B., Barnett, A., McKinley, G. A., Gloege, L., and Pilcher, D.: Global ocean particulate organic carbon flux merged with satellite parameters, Earth Syst. Sci. Data, 8, 531–541, https://doi.org/10.5194/essd-8-531-2016, 2016a. a, b, c, d
Mouw, C. B., Barnett, A., McKinley, G. A., Gloege, L., and Pilcher, D.: Global Ocean Particulate Organic Carbon flux merged with satellite parameters, PANGAEA, https://doi.org/10.1594/PANGAEA.855600, 2016b. a, b, c, d
Najjar, R. G., Jin, X., Louanchi, F., Aumont, O., Caldeira, K., Doney, S. C., Dutay, J.-C., Follows, M., Gruber, N., Joos, F., Lindsay, K., Maier-Reimer, E., Matear, R. J., Matsumoto, K., Monfray, P., Mouchet, A., Orr, J. C., Plattner, G.-K., Sarmiento, J. L., Schlitzer, R., Slater, R. D., Weirig, M. F., Yamanaka, Y., and Yool, A.: Impact of circulation on export production, dissolved organic matter, and dissolved oxygen in the ocean: Results from Phase II of the Ocean Carbon-cycle Model Intercomparison Project (OCMIP-2), Global Biogeochem. Cy., 21, GB3007, https://doi.org/10.1029/2006GB002857, 2007. a
Neuer, S., Davenport, R., Freudenthal, T., Wefer, G., Llinás, O., Rueda, M.-J., Steinberg, D. K., and Karl, D. M.: Differences in the biological carbon pump at three subtropical ocean sites, Geophys. Res. Lett., 29, 1885, https://doi.org/10.1029/2002GL015393, 2002. a, b
Nicolás-Carlock, J. R., Carrillo-Estrada, J. L., and Dossetti, V.: Fractality à la carte: a general particle aggregation model, Sci. Rep.-UK, 6, 19505, https://doi.org/10.1038/srep19505, 2016. a, b, c
Passow, U.: Transparent exopolymer particles (TEP) in aquatic environments, Prog. Oceanogr., 55, 287–333, 2002. a, b, c
Passow, U.: Switching perspectives: Do mineral fluxes determine particulate organic carbon fluxes or vice versa?, Geochem. Geophy. Geosy., 5, Q04002, https://doi.org/10.1029/2003GC000670 2004. a
Passow, U. and De La Rocha, C. L.: Accumulation of mineral ballast on organic aggregates, Global Biogeochem. Cy., 20, GB1013, https://doi.org/10.1029/2005GB002579, 2006. a, b, c
Paulsen, H., Ilyina, T., Six, K. D., and Stemmler, I.: Incorporating a prognostic representation of marine nitrogen fixers into the global ocean biogeochemical model HAMOCC, J. Adv. Model. Earth Sy., 9, 438–464, https://doi.org/10.1002/2016MS000737, 2017. a, b, c, d
Paulsen, H., Ilyina, T., Jungclaus, J. H., Six, K. D., and Stemmler, I.: Light absorption by marine cyanobacteria affects tropical climate mean state and variability, Earth Syst. Dynam., 9, 1283–1300, https://doi.org/10.5194/esd-9-1283-2018, 2018. a, b
Ploug, H., Iversen, M. H., and Fischer, G.: Ballast, sinking velocity, and apparent diffusivity within marine snow and zooplankton fecal pellets: Implications for substrate turnover by attached bacteria, Limnol. Oceanogr., 53, 1878–1886, 2008. a, b
Ragueneau, O., Teguér, P., Leynaert, A., Anderson, R. F., Brzezinski, M. A., DeMaster, D. J., Dugdale, R. C., Dymond, J., Fischer, G., François, R., Heinze, C., Maier-Reimer, E., Martin-Jézéquel, V., Nelson, D. M., and Quéguiner, B.: A review of the Si cycle in the modern ocean: recent progress and missing gaps in the application of biogenic opal as a paleoproductivity proxy, Global Planet. Change, 26, 317–365, 2000. a, b
Ragueneau, O., Schultes, S., Bidle, K., Claquin, P., and Moriceau, B.: Si and C interactions in the world ocean: Importance of ecological processes and implications for the role of diatoms in the biological pump, Global Biogeochem. Cy., 20, GB4S02, https://doi.org/10.1029/2006GB002688, 2006. a, b
Read, B. A., Kegel, J., Klute, M. J., Kuo, A., Lefebvre, S. C., Maumus, F., Mayer, C., Miller, J., Monier, A., Salamov, A., Young, J., Aguilar, M., Claverie, J.-M., Frickenhaus, S., Gonzalez, K., Herman, E. K., Lin, Y.-C., Napier, J., Ogata, H., Sarno, A. F., Shmutz, J., Schroeder, D., de Vargas, C., Verret, F., von Dassow, P., Valentin, K., Van de Peer, Y., Wheeler, G., Consortium, E. H. A., Allen, A. E., Bidle, K., Borodovsky, M., Bowler, C., Brownlee, C., Mark, C. J., Elias, M., Gladyshev, V. N., Groth, M., Guda, C., Hadaegh, A., Debora Iglesias-Rodriguez, M., Jenkins, J., Jones, B. M., Lawson, T., Leese, F., Lindquist, E., Lobanov, A., Lomsadze, A., Malik, S.-B., Marsh, M. E., Mackinder, L., Mock, T., Mueller-Roeber, B., Pagarete, A., Parker, M., Probert, I., Quesneville, H., Raines, C., Rensing, S. A., Riaño-Pachón, D. M., Richier, S., Rokitta, S., Shiraiwa, Y., Soanes, D. M., van der Giezen, M., Wahlund, T. M., Williams, B., Wilson, W., Wolfe, G., Wurch, L. L., Dacks, J. B., Delwiche, C. F., Dyhrman, S. T., Glöckner, G., John, U., Richards, T., Worden, A. Z., Zhang, X., and Grigoriev, I. V.: Pan genome of the phytoplankton Emiliania underpins its global distribution, Nature, 499, 209, https://doi.org/10.1038/nature12221, 2013. a
Röske, F.: Global oceanic heat and fresh water forcing datasets based on ERA-40 and ERA-15, Tech. Rep. 13, Max Planck Institue for Meteorology, Hamburg, 2005. a, b
Roullier, F., Berline, L., Guidi, L., Durrieu De Madron, X., Picheral, M., Sciandra, A., Pesant, S., and Stemmann, L.: Particle size distribution and estimated carbon flux across the Arabian Sea oxygen minimum zone, Biogeosciences, 11, 4541–4557, https://doi.org/10.5194/bg-11-4541-2014, 2014. a
Sarmiento, J. L., Monfray, P., Maier-Reimer, E., Aumont, O., Murnane, R. J., and Orr, J. C.: Sea-air CO2 fluxes and carbon transport: A comparison of three ocean general circulation models, Global Biogeochem. Cy., 14, 1267–1281, 2000. a
Schwinger, J., Goris, N., Tjiputra, J. F., Kriest, I., Bentsen, M., Bethke, I., Ilicak, M., Assmann, K. M., and Heinze, C.: Evaluation of NorESM-OC (versions 1 and 1.2), the ocean carbon-cycle stand-alone configuration of the Norwegian Earth System Model (NorESM1), Geosci. Model Dev., 9, 2589–2622, https://doi.org/10.5194/gmd-9-2589-2016, 2016. a, b, c
Segschneider, J. and Bendtsen, J.: Temperature-dependent remineralization in a warming ocean increases surface pCO2 through changes in marine ecosystem composition, Global Biogeochem. Cy., 27, 1214–1225, 2013. a
Sherwood, C. R., Aretxabaleta, A. L., Harris, C. K., Rinehimer, J. P., Verney, R., and Ferré, B.: Cohesive and mixed sediment in the Regional Ocean Modeling System (ROMS v3.6) implemented in the Coupled Ocean–Atmosphere–Wave–Sediment Transport Modeling System (COAWST r1234), Geosci. Model Dev., 11, 1849–1871, https://doi.org/10.5194/gmd-11-1849-2018, 2018. a
Shigemitsu, M., Yamamoto, A., Oka, A., and Yamanaka, Y.: One possible uncertainty in CMIP5 projections of low-oxygen water volume in the Eastern Tropical Pacific, Global Biogeochem. Cy., 31, 804–820, https://doi.org/10.1002/2016GB005447, 2017. a
Siegel, D. A., Buesseler, K. O., Doney, S. C., Sailley, S. F., Behrenfeld, M. J., and Boyd, P. W.: Global assessment of ocean carbon export by combining satellite observations and food-web models, Global Biogeochem. Cy., 28, 181–196, 2014. a
Simmons, A. J. and Gibson, J. K.: The ERA-40 Project Report Series 1, Tech. rep., ECMWF, 2000. a
Simon, H., Lipsewers, Y. A., Giebel, H.-A., Wiltshire, K. H., and Simon, M.: Temperature effects on aggregation during a spring diatom bloom, Limnol. Oceanogr., 59, 2089–2100, 2014. a, b, c
Six, K. D. and Maier-Reimer, E.: Effects of plankton dynamics on seasonal carbon fluxes in an ocean general circulation model, Global Biogeochem. Cy., 10, 559–583, 1996. a, b
Stemmann, L., Jackson, G. A., and Ianson, D.: A vertical model of particle size distributions and fluxes in the midwater column that includes biological and physical processes – Part I: model formulation, Deep-Sea Res. Pt. I, 51, 865–884, 2004. a
Stokes, G. G.: On the effect of the internal friction of fluids on the motion of pendulums, Cambridge Philos Trans, IX, 8–106, 1851 (reprinted in Mathematical and Physical Papers, 2nd Edn., Vol. 3, New York, Johnson Reprint Corp., 1 pp., 1966). a
Takahashi, T., Broecker, W. S., and Langer, S.: Redfield ratio based on chemical data from isopycnical surfaces, J. Geophys. Res., 90, 6907–6924, 1985. a
Tambo, N. and Hozumi, H.: Physical aspect of flocculation process-II. Contact flocculation, Water Res., 13, 441–448, 1979. a, b
Taylor, K. E.: Summarizing multiple aspects of model performance in a single diagram, J. Geophys. Res., 106, 7183–7192, 2001. a
Thornton, D. C. O.: Diatom aggregation in the sea: mechanisms and ecological implications, Eur. J. Phycol., 37, 149–161, 2002. a
Thyng, K. M., Greene, C. A., Hetland, R. D., Zimmerle, H. M., and DiMarco, S. F.: True colors of oceanography: Guidelines for effective and accurate colormap selection, Oceanography, 29, 9–13, 2016. a
Tréguer, P.: Silica and the cycle of carbon in the ocean, CR Geosci., 334, 3–11, 2002. a
Tréguer, P., Bowler, C., Moriceau, B., Dutkiewicz, S., Gehlen, M., Aumont, O., Bittner, L., Dugdale, R., Finkel, Z., Iudicone, D., Jahn, O., Guidi, L., Lasbleiz, M., Leblanc, K., Levy, M., and Pondaven, P.: Influence of diatom diversity on the ocean biological carbon pump, Nat. Geosci., 11, 27–37, 2018. a
Usbeck, R., Schlitzer, R., Fischer, G., and Wefer, G.: Particle fluxes in the ocean: comparison of sediment trap data with results from inverse modeling, J. Marine Syst., 39, 167–183, 2003. a, b, c
Verdugo, P., Alldredge, A. L., Azam, F., Kirchman, D. L., Passow, U., and Santschi, P. H.: The oceanic gel phase: a bridge in the DOM-POM continuum, Mar. Chem., 92, 67–85, 2004. a
Villa-Alfagame, M., de Soto, F. C., Ceballos, E., Giering, S. L. C., Le Moigne, F. A. C., Henson, S., Mas, J. L., and Sanders, R. J.: Geographical, seasonal, and depth variation in sinking particle speeds in the North Atlantic, Geophys. Res. Lett., 43, 8609–8616, https://doi.org/10.1002/2016GL069233, 2016. a, b
Waterhouse, A. F., MacJinnon, J. A., Nash, J. D., Alford, M. H., Kunze, E., Simmons, H. L., Polzin, K. L., Laurent, L. C. S., Sun, O. M., Pinkel, R., Talley, L. D., Whalen, C. B., Huussen, T. N., Carter, G. S., Fer, I., Waterman, S., Naveira Garabato, A. C., Sanford, T. B., and Lee, C. M.: Global Patterns of Diapycnal Mixing from Measurements of the Turbulent Dissipation Rate, J. Phys. Oceanogr., 44, 1854–1872, 2014. a
Weber, T., Cram, J. A., Leung, S. W., DeVries, T., and Deutsch, C.: Deep ocean nutrients imply large latitudinal variation in particle transfer efficiency, P. Natl. Acad. Sci. USA, 113, 8606–8611, 2016. a, b, c, d, e, f, g, h, i, j, k, l, m, n, o, p
White, F. M.: Viscous Fluid Flow, 3rd Edn., McGraw-Hill, New York, USA, 2005. a
White, M. M., Waller, J. D., Lubelczyk, L., Drapeau, D. T., Bowler, B. C., Balch, W. M., and Fields, D. M.: Coccolith dissolution within copepod guts affects fecal pellet density and sinking rate, Sci. Rep.-UK, 8, 9758, https://doi.org/10.1038/s41598-018-28073-x, 2018. a, b
Williams, R. G. and Follows, M. J.: Ocean Dynamics and the Carbon Cycle: Principles and Mechanisms, Cambridge University Press, Cambridge, 2011. a
Wilson, J. D., Barker, S., and Ridgwell, A.: Assessment of the spatial variability in particulate organic matter and mineral sinking fluxes in the ocean interior: Implications for the ballast hypothesis, Global Biogeochem. Cy., 26, GB4011, https://doi.org/10.1029/2012GB004398, 2012. a
Winterwerp, J. C.: A simple model for turbulence induced flocculation of cohesive sediment, J. Hydraul. Res., 36, 309–326, 1998. a
Young, J. R. and Ziveri, P.: Calculation of coccolith volume and its use in calibration of carbonate flux estimates, Deep-Sea Res. Pt. II, 47, 1679–1700, 2000. a, b, c
Ziveri, P., de Bernardi, B., Baumann, K.-H., Stoll, H. M., and Mortyn, P. G.: Sinking of coccolith carbonate and potential contribution to organic carbon ballasting in the deep ocean, Deep-Sea Res. Pt. II, 54, 659–675, 2007. a
- Abstract
- Introduction
- Model description
- Results and discussion
- Summary and conclusions
- Appendix A: Additional aggregate properties
- Appendix B: Effective Martin slope in M4AGO
- Appendix C: Seasonal transfer efficiency
- Appendix D: Mathematical symbols
- Code and data availability
- Author contributions
- Competing interests
- Acknowledgements
- Financial support
- Review statement
- References