the Creative Commons Attribution 4.0 License.
the Creative Commons Attribution 4.0 License.
 | 20 Jan 2020
Low sensitivity of gross primary production to elevated CO2 in a mature eucalypt woodland
Jinyan Yang
Belinda E. Medlyn
Martin G. De Kauwe
Remko A. Duursma
Mingkai Jiang
Dushan Kumarathunge
Kristine Y. Crous
Teresa E. Gimeno
Agnieszka Wujeska-Klause
David S. Ellsworth
The response of mature forest ecosystems to a rising atmospheric carbon dioxide concentration (Ca) is a major uncertainty in projecting the future trajectory of the Earth's climate. Although leaf-level net photosynthesis is typically stimulated by exposure to elevated Ca (eCa), it is unclear how this stimulation translates into carbon cycle responses at the ecosystem scale. Here we estimate a key component of the carbon cycle, the gross primary productivity (GPP), of a mature native eucalypt forest exposed to free-air CO2 enrichment (the EucFACE experiment). In this experiment, light-saturated leaf photosynthesis increased by 19 % in response to a 38 % increase in Ca. We used the process-based forest canopy model, MAESPA, to upscale these leaf-level measurements of photosynthesis with canopy structure to estimate the GPP and its response to eCa. We assessed the direct impact of eCa, as well as the indirect effect of photosynthetic acclimation to eCa and variability among treatment plots using different model scenarios.
At the canopy scale, MAESPA estimated a GPP of 1574 g C m−2 yr−1 under ambient conditions across 4 years and a direct increase in the GPP of +11 % in response to eCa. The smaller canopy-scale response simulated by the model, as compared with the leaf-level response, could be attributed to the prevalence of RuBP regeneration limitation of leaf photosynthesis within the canopy. Photosynthetic acclimation reduced this estimated response to 10 %. After taking the baseline variability in the leaf area index across plots in account, we estimated a field GPP response to eCa of 6 % with a 95 % confidence interval (−2 %, 14 %). These findings highlight that the GPP response of mature forests to eCa is likely to be considerably lower than the response of light-saturated leaf photosynthesis. Our results provide an important context for interpreting the eCa responses of other components of the ecosystem carbon cycle.
- Article
(1780 KB) - Full-text XML
-
Supplement
(310 KB) - BibTeX
- EndNote


Forests represent the largest long-term terrestrial carbon storage (Bonan, 2008; Pan et al., 2011). The atmospheric carbon dioxide concentration (Ca) has increased significantly since the beginning of the industrial era (Joos and Spahni, 2008), but the increase would have been considerably larger without forest carbon sequestration, which is estimated to have offset 25 %–33 % of recent anthropogenic CO2 emissions (Le Quéré et al., 2018). Ca is projected to continue to increase by 1–5 µmol mol−1 yr−1 into the future (IPCC, 2014), but the rate of this rise depends on the magnitude of the forest feedback on Ca. At the leaf scale, the direct physiological effects of rising Ca are well understood: elevated Ca (eCa) stimulates plant photosynthesis (Kimball et al., 1993; Ellsworth et al., 2012) and reduces stomatal conductance (Morison, 1985; Saxe et al., 1998), which together increase leaf water-use efficiency (De Kauwe et al., 2014). These physiological responses at the leaf scale can increase ecosystem carbon uptake, which in turn may result in increased carbon storage in the ecosystem, mitigating the rise in Ca. However, projecting the response of the terrestrial carbon sink to future increases in Ca is a major uncertainty in models (Friedlingstein et al., 2014), highlighting an urgent need to make greater use of data from manipulative experiments at the leaf scale to inform terrestrial biosphere models (Medlyn et al., 2015).
Our understanding of ecosystem responses to eCa relies on both experiments and observations. However, results from different types of studies show some important areas of disagreement (Fatichi et al., 2019). At the global scale, satellite data provide evidence of a strong greening trend over the last 20 years, indicating an increase in leaf area and/or above-ground biomass, which has been attributed to the gradual increase in CO2 (Donohue et al., 2009, 2013; Yang et al., 2016; Zhu et al., 2016). A positive response of carbon uptake/greenness is also found in manipulative eCa open-top chamber experiments with young trees (Eamus and Jarvis, 1989; Curtis and Wang 1998; Saxe et al., 1998; Medlyn et al., 1999) and ecosystem-scale FACE experiments in young, aggrading forest stands (Ainsworth and Long, 2005; Norby et al., 2005; Ellsworth et al., 2012; Walker et al., 2019). In contrast, individual-tree experiments with mature trees (> 30 years old) have found relatively small responses of tree growth to eCa despite an apparent increase in leaf photosynthesis (Dawes et al., 2011; Sigurdsson et al., 2013; Klein et al., 2016). Moreover, tree-ring studies indicate an apparent lack of stimulation of vegetation growth in mature forests over the last century (Peñuelas et al., 2011; Silva and Anand, 2013; van der Sleen et al., 2014). These studies raise important questions about how mature ecosystems will respond to eCa.
The Eucalyptus FACE experiment (EucFACE; Australia) is the first replicated, ecosystem-scale experiment where a mature native forest has been experimentally subjected to eCa and provides a valuable case study to assess the response of a mature forest to eCa under field conditions (Ellsworth et al., 2017). Results from the first 5 years (2013–2018) of leaf gas exchange measurements showed a consistent stimulation of leaf-level light-saturated net photosynthesis (A) of 19 % (Ellsworth et al., 2017; Wujeska-Klause et al., 2019). Nevertheless, the increase in A did not lead to a detectable change in above-ground growth (Ellsworth et al., 2017). These experimental results are consistent with empirical evidence arising from tree-ring studies (Peñuelas et al., 2011; Silva and Anand, 2013; van der Sleen et al., 2014) and also with experimental evidence from individual mature trees (Körner et al., 2005; Dawes et al., 2011; Klein et al., 2016).
As a first step towards reconciling the eCa responses of leaf photosynthesis and above-ground growth in this experiment, we quantify how the whole canopy carbon uptake, or gross primary productivity (GPP), increased under eCa. The response of the GPP is important because it provides a reference point against which to compare the response of other components of the ecosystem carbon balance, such as above-ground growth. It needs to be quantified explicitly because the response of the GPP to eCa may be quite different to that of the leaf net photosynthesis. The leaf-level response of photosynthesis to eCa is usually measured on sunlit leaves under saturating light (Ainsworth and Rogers, 2007). As a result, these leaf-level eCa responses largely reflect the responses of the photosynthesis rate when limited by maximum Rubisco activity (Vcmax). However, depending on the canopy architecture and the ambient light conditions, the canopy could have many shaded leaves, which would mean that the emergent rate of photosynthesis could actually be limited by RuBP regeneration (J). RuBP-regeneration-limited photosynthesis has a smaller response to eCa than Rubisco-limited photosynthesis (Ainsworth and Rogers, 2007), resulting in a smaller response of the GPP than the leaf photosynthesis under saturating light.
The transition from RuBP-regeneration-limited to Rubisco-limited photosynthesis of the canopy is determined by the ratio of the maximum capacities for RuBP regeneration and Rubisco activity, Jmax and Vcmax (Friend, 2001; Zaehle et al., 2014; Rogers et al., 2017). Wullschleger (1993) reported a Jmax:Vcmax ratio of 2, which has been widely adopted in models (e.g. Wang et al., 1998; Luo et al., 2001; Rogers et al., 2017). However, recent studies have suggested that the Jmax:Vcmax ratio varies systematically across forest ecosystems and can range from 1 to 3 (Kattge and Knorr, 2007; Ellsworth et al., 2012; Kumarathunge et al., 2018). A lower Jmax:Vcmax ratio results in more frequent RuBP regeneration limitation of photosynthesis, which reduces the response of the GPP to eCa.
It is difficult to directly measure the eCa effect on the GPP. In some previous eCa experiments, the GPP has been estimated by scaling up from leaf-level measurements using a canopy model. Wang et al. (1998) and Luo et al. (2001) both used the tree array model, MAESPA, which can simulate the radiative transfer within and between tree crowns and can be parameterized to describe the spatial locations and sizes of trees in eCa experiments. In these previous applications of MAESPA, the direct response of GPP to eCa was consistently half of that observed at the leaf level due to the large contribution of RuBP-regeneration-limited photosynthesis to the GPP (Wang et al., 1998; Luo et al., 2001). However, the direct effect of eCa on photosynthesis was modified by two major indirect effects: (1) when LAI increased under eCa, the additional leaf area amplified the GPP response by up to 60 %; and (2) the downregulation of photosynthesis under eCa, or photosynthetic acclimation (Long et al., 2004; Ainsworth and Rogers, 2007; Rogers, et al., 2017). Under long-term exposure to eCa, some plants have been observed to reduce nitrogen allocation to Rubisco, which results in a decrease in the photosynthetic capacity (Gunderson and Wullschleger, 1994). The average decrease of Vcmax among plants in FACE experiments was found to be 13 % for all species and 6 % for trees (Ainsworth and Long, 2005). Both Wang et al. (1998) and Luo et al. (2001) tested the impact of photosynthetic acclimation and showed a moderate reduction in the canopy GPP (5 %–6 %) due to photosynthetic acclimation (10 %–20 %).
Following Wang et al. (1998) and Luo et al. (2001), we used MAESPA (Duursma and Medlyn, 2012) to estimate the canopy GPP at EucFACE in ambient and elevated Ca treatments. The model has previously been evaluated using leaf- and tree-scale measurements from EucFACE (Yang et al., 2019). Here, we first parameterized the model using physiological and structural data measured during the experiment. Then, we quantified the response of the canopy GPP to eCa and partitioned this response into the direct stimulation of the GPP and the indirect effects of the photosynthetic acclimation and variation of LAI. The overall goal of this study was to estimate the magnitude of the response of the forest canopy GPP to eCa in order to provide a baseline against which to compare changes in other components of the ecosystem carbon balance.
2.1 Site
The EucFACE experiment (technical details in Gimeno et al., 2015) is located in western Sydney, Australia (33.617∘ S, 150.741∘ E). It consists of six circular plots, each of which has a diameter of 25 m, enclosing 15–25 mature forest trees (referred to as “rings” hereafter). The rings are divided into two groups: control (with ambient Ca; 390–400 µmol mol−1 during the study period) and experimental (eCa; +150 µmol mol−1). The tree canopy is dominated by Eucalyptus tereticornis Sm. which are ∼20 m in height and have a basal area of ∼24 m2 ha−1. The site receives a mean annual precipitation of 800 mm yr−1, a mean annual photosynthetically active radiation (PAR) of 2600 MJ m−2 yr−1, and has a mean annual temperature of 17 ∘C.
2.2 Model
The MAESPA model is a process-based tree-array model (Wang and Jarvis, 1990) that calculates canopy carbon and water exchange (https://bitbucket.org/remkoduursma/maespa/src/Yang_et_al_2019/, last access: 4 July 2019). At each 30 min time step, the model simulates the radiative transfer, photosynthesis, and transpiration of individual trees mechanistically. The soil moisture balance can be calculated dynamically, but here we chose to improve accuracy by using soil moisture as an input to the model (Duursma and Medlyn, 2012).
The model represents the tree canopy as an array of tree crowns. The location and dimensions of each crown are specified based on on-site measurements (see Sect. 2.3.2 below). Calculations of carbon and water fluxes are made for each tree crown, which is divided into six layers. Here, it was assumed that crowns are represented by an ellipsoidal shape and that leaf area is uniformly distributed across layers within the tree crown. The leaf angles were assumed to follow a spherical distribution to ensure consistency with the method used to estimate leaf area index (LAI) in Duursma et al. (2016). Within each layer, the model evaluates the radiation transfer and leaf gas exchange at 12 grid points such that each crown is represented by a total of 72 grid points. The radiation intercepted at each grid point is calculated for direct and diffuse components by considering shading from the upper crown and surrounding trees, solar angle (zenith and azimuth), and light source (diffuse or direct). Penetration by direct radiation to each grid point is used to estimate the sunlit and shaded leaf area at each grid point. The radiation intercepted by the fraction of sunlit and shade foliage is then used to calculate the leaf gas exchange.
The gas exchange sub-model combines the leaf photosynthesis model of Farquhar et al. (1980) with a stomatal optimization model, following Medlyn et al. (2011). Stomatal conductance is modelled as follows:
where gs is the stomatal conductance to water vapour (mol m−2 s−1), g1 is a parameter that represents the gs sensitivity to photosynthesis (kPa0.5; see definition in Medlyn et al., 2011), Anet is the net CO2 assimilation rate (µmol m−2 s−1), Ca is the atmospheric CO2 concentration (µmol mol−1), and D is the vapour pressure deficit (kPa). The factor 1.6 converts the conductance of CO2 to that of H2O.
The impact of soil moisture on gs is represented via an empirical function that links soil water availability to g1 following (Drake et al., 2017):
where the g1,max is the maximum g1 value; θ is volumetric soil water content (%); θmax and θmin are the upper and lower limit within which θ has impact on g1, respectively; and q describes the nonlinearity of the curve. The equations used to calculate Anet are given in the Supplement (Supplement S1, Eqs. S1–S6).
Following Yang et al. (2019), MAESPA considers a non-stomatal limitation to the biochemical parameters Jmax and Vcmax at high D:
where Vmax,t is the Jmax or Vcmax at a given leaf temperature (Supplement S1), and cD is a fitted parameter (Table 1). This relationship is empirical and fitted to data collected in EucFACE. Incorporating this relationship was shown to improve the predicted photosynthesis by the leaf gas exchange model (Yang et al., 2019).
Combining Eqs. (1)–(3) and (S1)–(S6) yields the gs and Anet of each grid point, which is then multiplied by the leaf area at each grid point and summed to give the whole-tree photosynthesis. Photosynthesis of individual trees is then summed to give the whole-canopy photosynthesis.
2.3 Model parameterization
2.3.1 Meteorological forcing
The model is driven by in situ PAR, wind speed, air temperature, D, and soil moisture measurements from 2013 to 2016 (Figs. 1, 2). Each ring has a set of PAR (LI-190, LI-COR, Lincoln, NE, USA), wind speed (WINDCAP Ultrasonic WMT700 Vaisala, Vantaa, Finland), humidity, and temperature sensors (HUMICAP® HMP 155 Vaisala, Vantaa, Finland) in the centre of the ring above the canopy at 23.5 m. The PAR, air temperature, and relative humidity were measured every 5 min in each ring and were then gap-filled by linear interpolation and aggregated to 30 min mean time slices across all six rings (Fig. 1). D was calculated from temperature and humidity measurements.
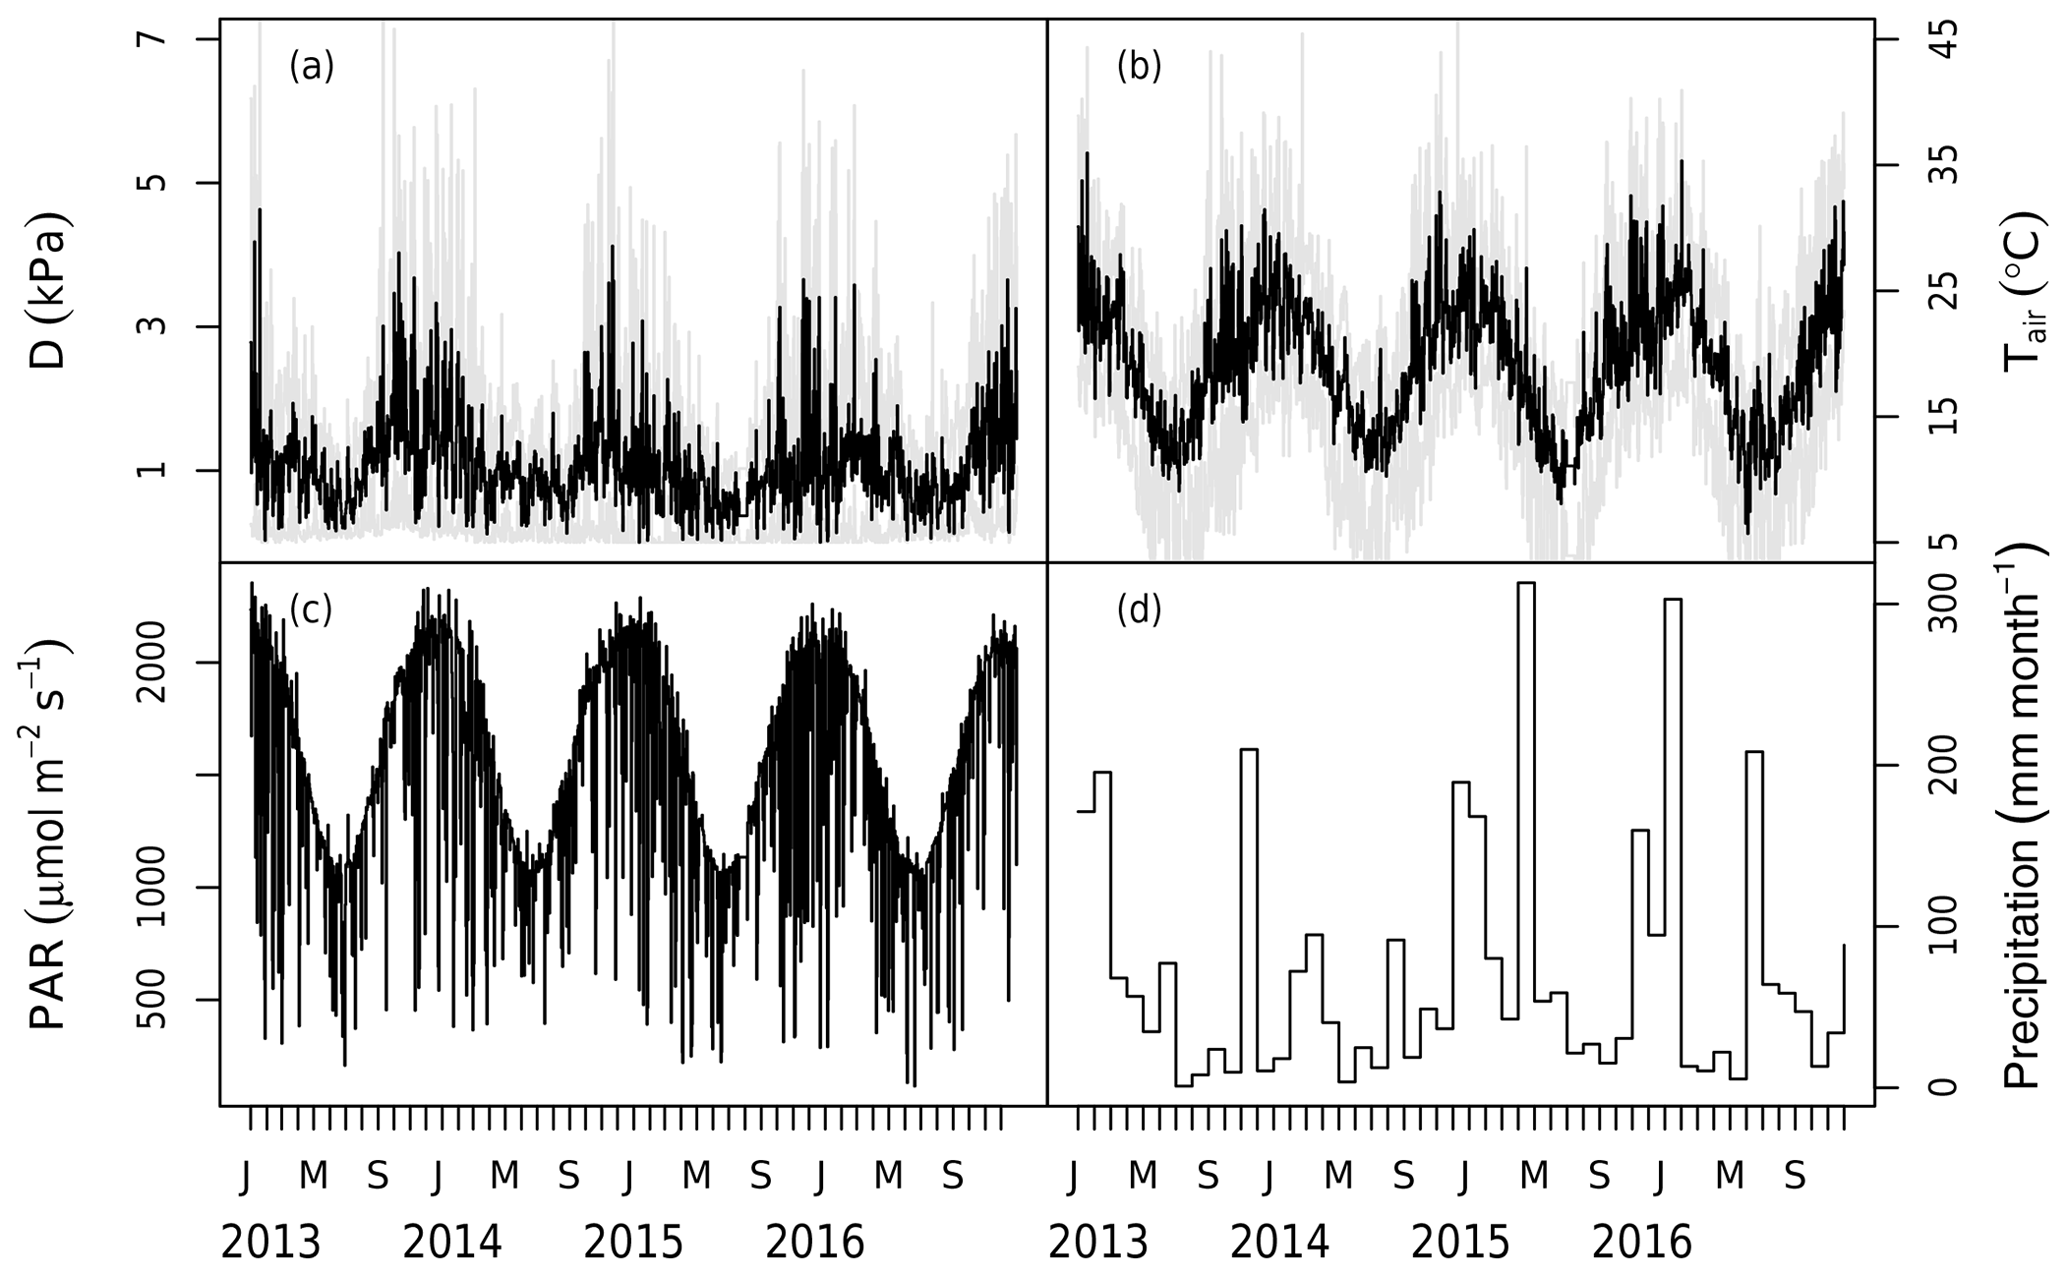
Figure 1Meteorological data measured at the site during the 2013–2016 period. Panels show (a) the daily mean vapour pressure deficit (D) with the shaded area marking the maximum and minimum of the day, (b) the daily mean air temperature (Tair) with the shaded area marking the maximum and minimum of the day, (c) the daily maximum photosynthetically active radiation (PAR), and (d) the monthly total precipitation. Note that precipitation has no direct impact in the model but modifies stomatal conductance via the change in soil moisture.
Two levels of Ca were used in the model according to the measured Ca (LI-840, LI-COR, Lincoln, NE, USA). The ambient Ca was gap-filled (there were < 10 d in total during the 4 years, with gaps due to a power outage) and aggregated to 30 min mean time slices from the 5 min measurements across the three ambient rings (rings 2, 3, and 6). The eCa was processed in the same way but using data from the experimental rings (rings 1, 4, and 5).
The volumetric soil water content (θ) was used as an estimate of plant water availability and was taken every 20 d using neutron measurements at 25 cm intervals (503DR Hydroprobe, Instroteck, NC, USA) and averaged to the top 150 cm (Fig. 2). There were two probes in each ring and the average of these probes was used to represent the ring average for each measurement date. θ was updated on the days of measurements and thus not gap-filled.
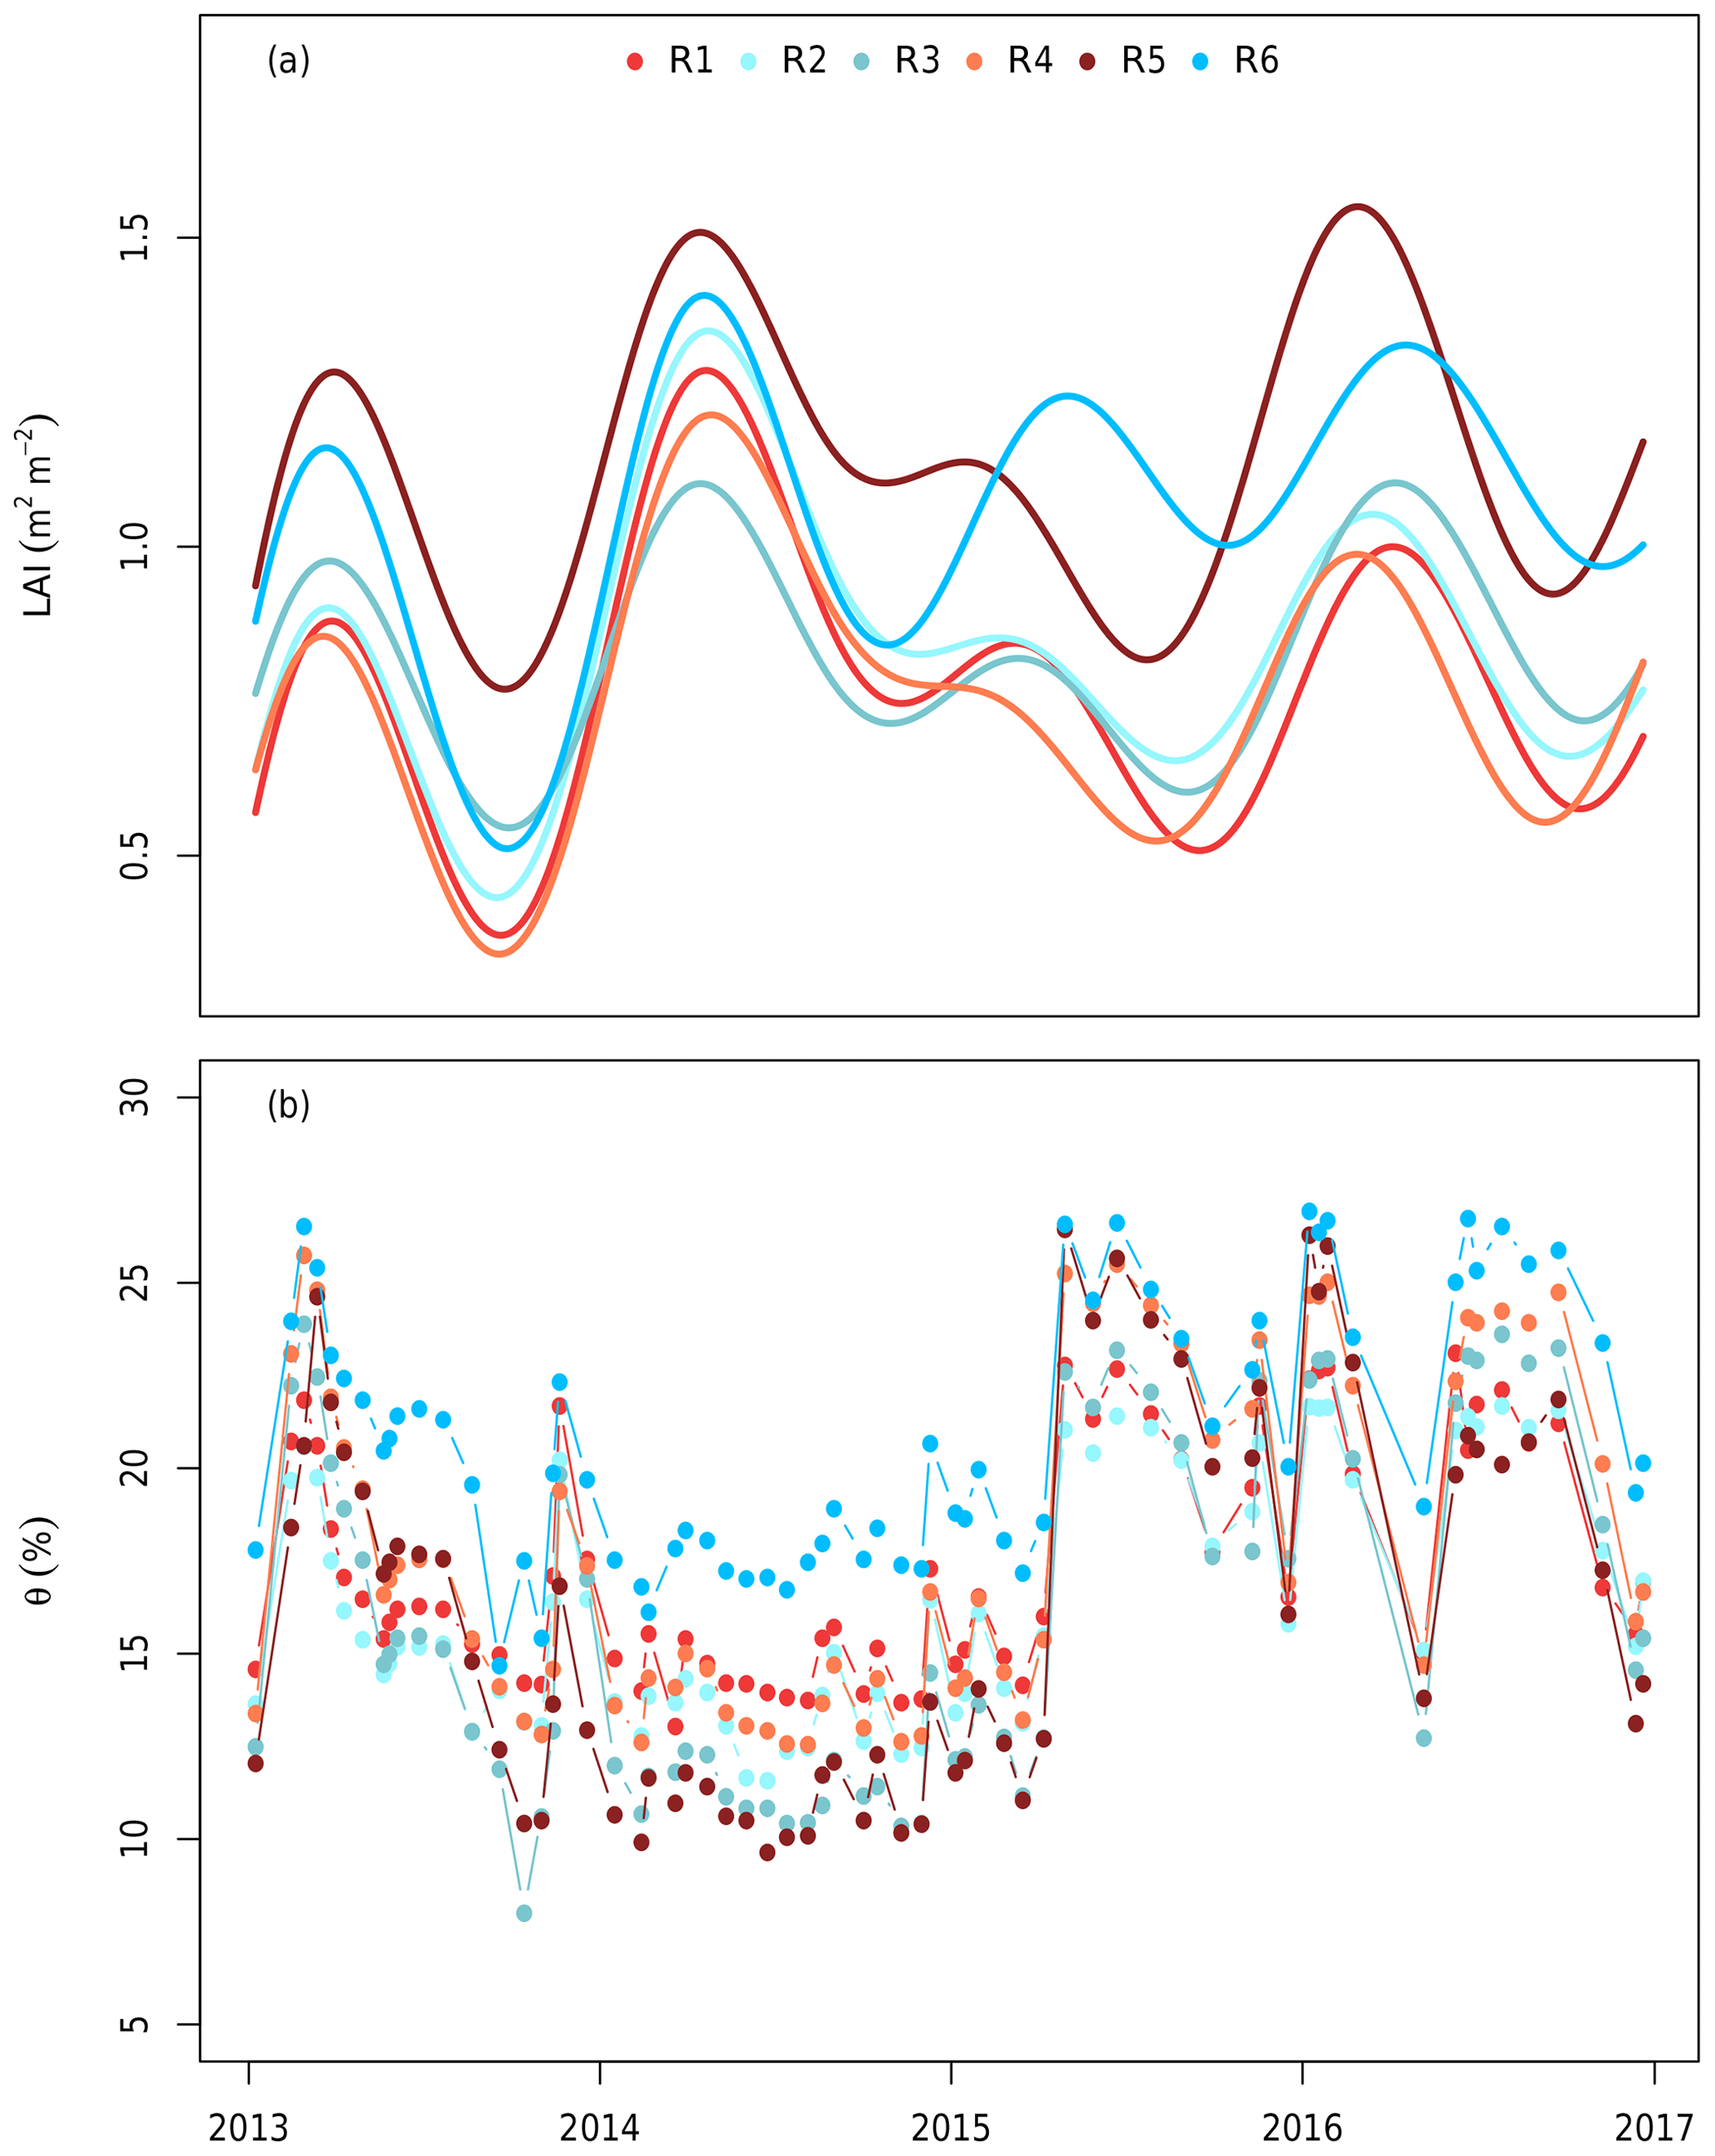
Figure 2(a) The leaf area index (LAI) and (b) soil volumetric water content (θ) used to drive the model. The LAI was estimated in each ring from measurements of understorey PAR and smoothed using a generalized additive model following Duursma et al. (2016). θ was measured using neutron probes in the top 150 cm biweekly (Gimeno et al., 2018). Each line colour indicates a different plot. Red shows elevated CO2 plots (treatment), whereas blue shows ambient CO2 plots (control). The x axis ticks mark the start of each year.
2.3.2 Canopy structure
Trees in MAESPA were represented by their actual location, height, and crown size to mimic the realistic effects of shading. Tree location, crown height, crown base, and stem diameter were measured in January 2013 at the start of the experiment. For each ring, a time series of the LAI was obtained based on measurements of above- and below-canopy PAR (Duursma et al., 2016). This LAI represents the plant area index, which includes the woody component as well as leaves and does not account for clumping. In order to retrieve the actual LAI, we assumed a constant branch and stem cover (0.8 m2 m−2) based on the lowest LAI during November 2013 when the canopy shed almost all leaves. Thus, the LAI used in this study was the plant area index estimate from Duursma et al. (2016), which was less 0.8 m2 m−2 (Fig. 2a). As the LAI is the only parameter besides the soil moisture that differed by ring, the canopy structure (i.e. the LAI and its distribution) was the major driver of inter-ring variability.
The total leaf area (m2) of each ring was calculated as the product of the LAI and the ground area of each plot (491 m2). This total leaf area (LA) was then assigned to each tree based on an allometric relationship between the total leaf area (m2) and the diameter at breast height (DBH; cm). The allometric relationship was derived from data in the BAAD database (Falster et al., 2015) for Eucalyptus trees grown in natural conditions with DBH values less than 1 m to match the characteristics of EucFACE. In total, this database yielded a total of 66 observations with which to estimate the relationship between the LA and DBH:
where Lallom is the theoretical leaf area based on an allometric relationship with the DBH. The values obtained via fitting for a and b were 492.6 and 1.8 respectively, with a root mean square error of 14.4 (m2) and a correlation coefficient of 0.83. Equation (4) was used to assign the total LA of each ring to each tree using the following steps: (i) the Lallom for each tree was calculated based on the DBH; (ii) the Lallom was summed to obtain a total LA for each ring; and (iii) the fractional contribution of each tree to the ring total LA was calculated. The total LA based on the LAI was then assigned to each tree based on this fraction.
The crown radius was calculated using a linear function with the DBH based on measurements made in August 2016. The data consisted of the DBH and crown radius (one on a north–south axis and one on an east–west axis) of four trees in each ring. The crown radius measurements were averaged by tree and used to fit a linear model with the DBH. The estimated slope and intercept of the relationship are 0.095 (m cm−1) and 0.765 (m) respectively.
MAESPA also considered the shading from surrounding trees outside the rings. However, no measurements of locations or diameters were available for the trees surrounding the rings. Therefore, a total of 80 surrounding trees were arbitrarily assumed to form two uniform and circular layers around each ring. They were assigned the mean height, mean crown radius, and mean leaf area estimated from all trees in EucFACE. Except for shading, the surrounding trees have no impact on the trees within the rings. Ring 1 is shown in Fig. S1 in the Supplement as an example of the representation of canopy structure in MAESPA.
2.3.3 Physiology
The physiological parameters were estimated from field gas exchange measurements as described below. The data were collected with portable photosynthesis systems (Li-6400, LI-COR, Inc., USA). The only parameter found to differ between ambient and elevated Ca rings was Vcmax,25 (Vcmax at 25 ∘C; Ellsworth et al., 2017). Hence, all other parameters (e.g. the temperature responses of photosynthesis and respiration) were estimated by combining all data across CO2 treatments. Fitted parameter values are given in Table 1.
A set of temperature-controlled photosynthesis–CO2 response (A−Ci) curves was measured at different leaf temperatures (20–40 ∘C) under saturating light in February 2016. The data set was used to quantify the temperature dependencies of Jmax and Vcmax by fitting a peaked Arrhenius function (Eq. S5) to the measurements. We assumed that these temperature response functions applied throughout the period of the study.
Light- and temperature-controlled A−Ci curves were also measured in the morning for 10 field campaigns from 2013 to 2016. All A−Ci curves were started at the growth Ca of 395 µmol mol−1 or 545 µmol mol−1 (depending on the eCa treatment) with a saturating light of 1800 µmol m−2 s−1 and a flow rate of 500 µmol s−1 with temperature controlled to a constant based on the seasonal temperature. These data were used to estimate Jmax and Vcmax at 25 ∘C using the “fitaci” function in the “plantecophys” R package (Duursma, 2015), utilizing the measured temperature responses of Jmax and Vcmax described in the previous paragraph to correct to 25 ∘C.
Repeated gas exchange measurements were made on the same leaves in the morning and afternoon under prevailing field conditions and saturating light (photon flux density = 1800 µmol m−2 s−1) on four occasions in 2013 (“diurnal”; Gimeno et al., 2018). To expand the diurnal data set, we obtained the points from A−Ci curves at field Ca and combined the two data sets. These data were used to estimate the g1 parameter in the stomatal conductance model (Eq. 1) using the “fitBB” function in the plantecophys R package (Duursma, 2015). One g1 value was fitted to the data from each treatment and date. The g1 values were then regressed against θ measured in each treatment group to estimate the impact of soil moisture availability on leaf gas exchange, following Eq. (2). The g1 values were related to the nearest measurements of θ (within 2 weeks). There was no rainfall between g1 and θ measurement dates. Equation (2) was fitted to this data set using the non-linear least squares method (Fig. 3).
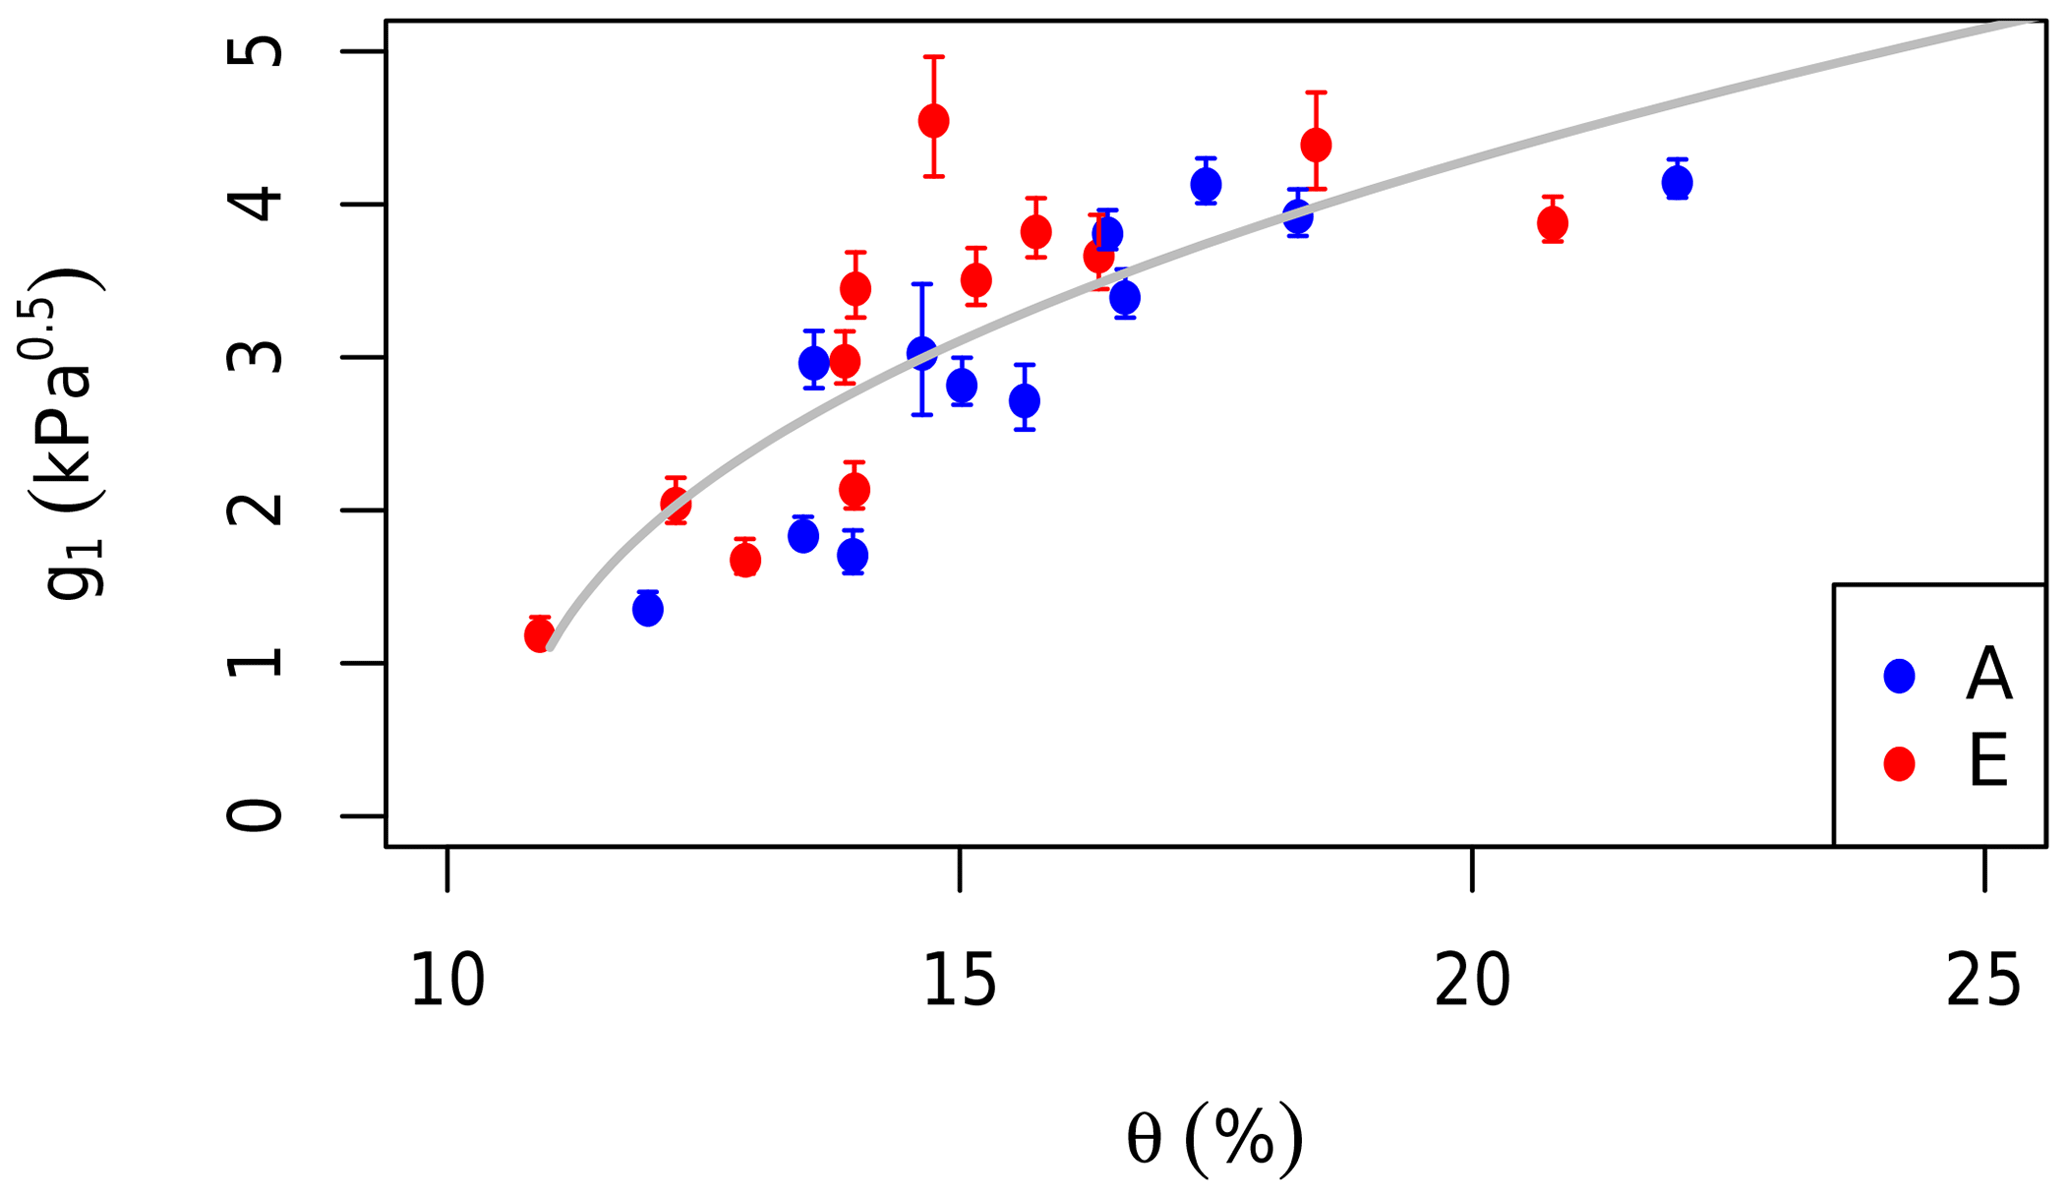
Figure 3The impact of the soil moisture content (θ) in the top 150 cm on stomatal regulation. The g1 parameter values are fitted to measurements of leaf gas exchange grouped by month and treatment. Red dots are fitted to data from elevated rings while blue are ambient rings. Error bars indicate the standard errors of the fitted values. The grey line shows the fit of Eq. (2) to the data.
The dark respiration rate of foliage, Rdark, was measured at least 3 h after sunset at a range of leaf temperatures (14–60 ∘C) in February 2016 (also with the Li-6400). The temperature dependence of Rdark was fitted to all of the measured data with Eq. (S6) using the non-linear least squared method. Light responses of photosynthesis were measured on two trees from each ring in October 2014 (Crous et al., unpublished). This data set was used to constrain the light response parameters (αJ and θJ) in Eq. (S4). Details of fitting the light response curves are provided in the Supplement (Supplement S1).
2.4 Model simulations and analysis
MAESPA was used to simulate radiation interception and gas exchange of all six rings between 1 January 2013 and 31 December 2016 on a 30 min basis. The model simulated the 30 min gross primary production (GPP) of each tree, which was then summed for all trees in each ring to get the total annual GPP for each ring and year.
Four different sets of simulations were used to estimate carbon uptake under ambient and eCa conditions and to identify the key limiting factors on the canopy GPP response to eCa. Firstly, we carried out a simulation of leaf-scale (“leaf scenario”) photosynthesis with measured meteorological data but fixed physiological data (g1=3.3 kPa0.5, , and µmol m−2 s−1). This simulation aimed to quantify the CO2 response of Rubisco-limited and RuBP-limited photosynthesis at the leaf scale. This calculation was made using the “Photosyn” function in the plantecophys R package (Duursma, 2015). This function implements the leaf gas exchange routine used in MAESPA.
Secondly, MAESPA was run for all six rings with ambient Ca and with Vcmax,25 from ambient measurements (“ambient scenario”). The results of this simulation were used to calculate the GPP of each ring under ambient conditions. The ambient GPP values were also used to evaluate the inherent variability among the rings.
Thirdly, all six rings were simulated with eCa and Vcmax,25 based on measurements from ambient rings (“elevated scenario”). The results of this simulation were compared to those from the ambient scenario to illustrate the instantaneous response of canopy GPP to eCa in each ring and year. This simulation also quantifies the variation of the GPP response to eCa across rings and years.
Lastly, we simulated the response of the three rings exposed to eCa (rings 1, 4, and 5) using the Vcmax,25 and eCa measured from these elevated rings (“field scenario”). Results from the field scenario were used for two analyses: (i) to compare the GPP from the field scenario to that of the three rings from the elevated scenario (i.e. eCa and ambient Vcmax,25), which allows us to quantify the impact of photosynthetic acclimation (i.e. due to a reduction in Vcmax); and (ii) to calculate the difference in the GPP between the three ambient rings in ambient scenario and elevated rings in the field scenario to estimate the response of the GPP to eCa in the field.
Table 1Summary table of parameter definitions, units, and sources used in this study.
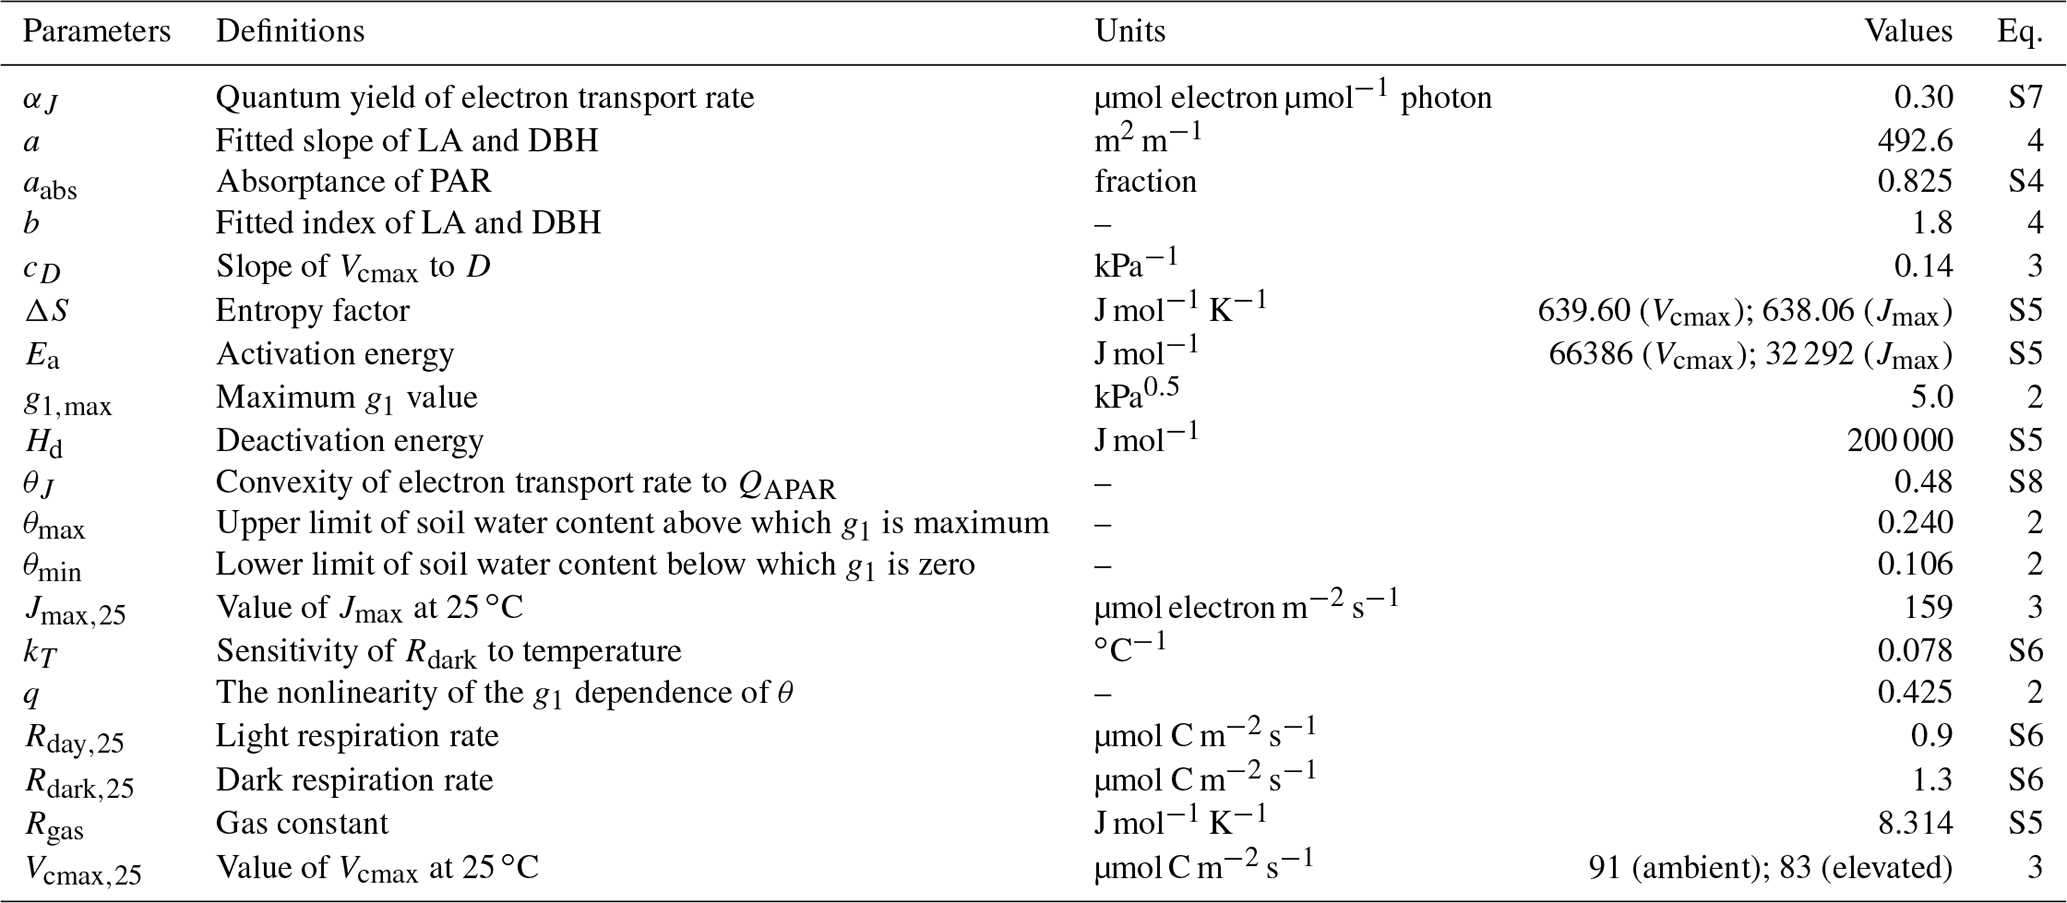
Figure 4 summarizes the results from measurements and the different simulations conducted in this study. It demonstrates that the impact of eCa diminishes as calculations are scaled from the instantaneous leaf-level response (Ainst) to the long-term canopy response (GPPfield) and the various feedback effects are accounted for. Each row in Fig. 4 is explained in detail in the following paragraphs.
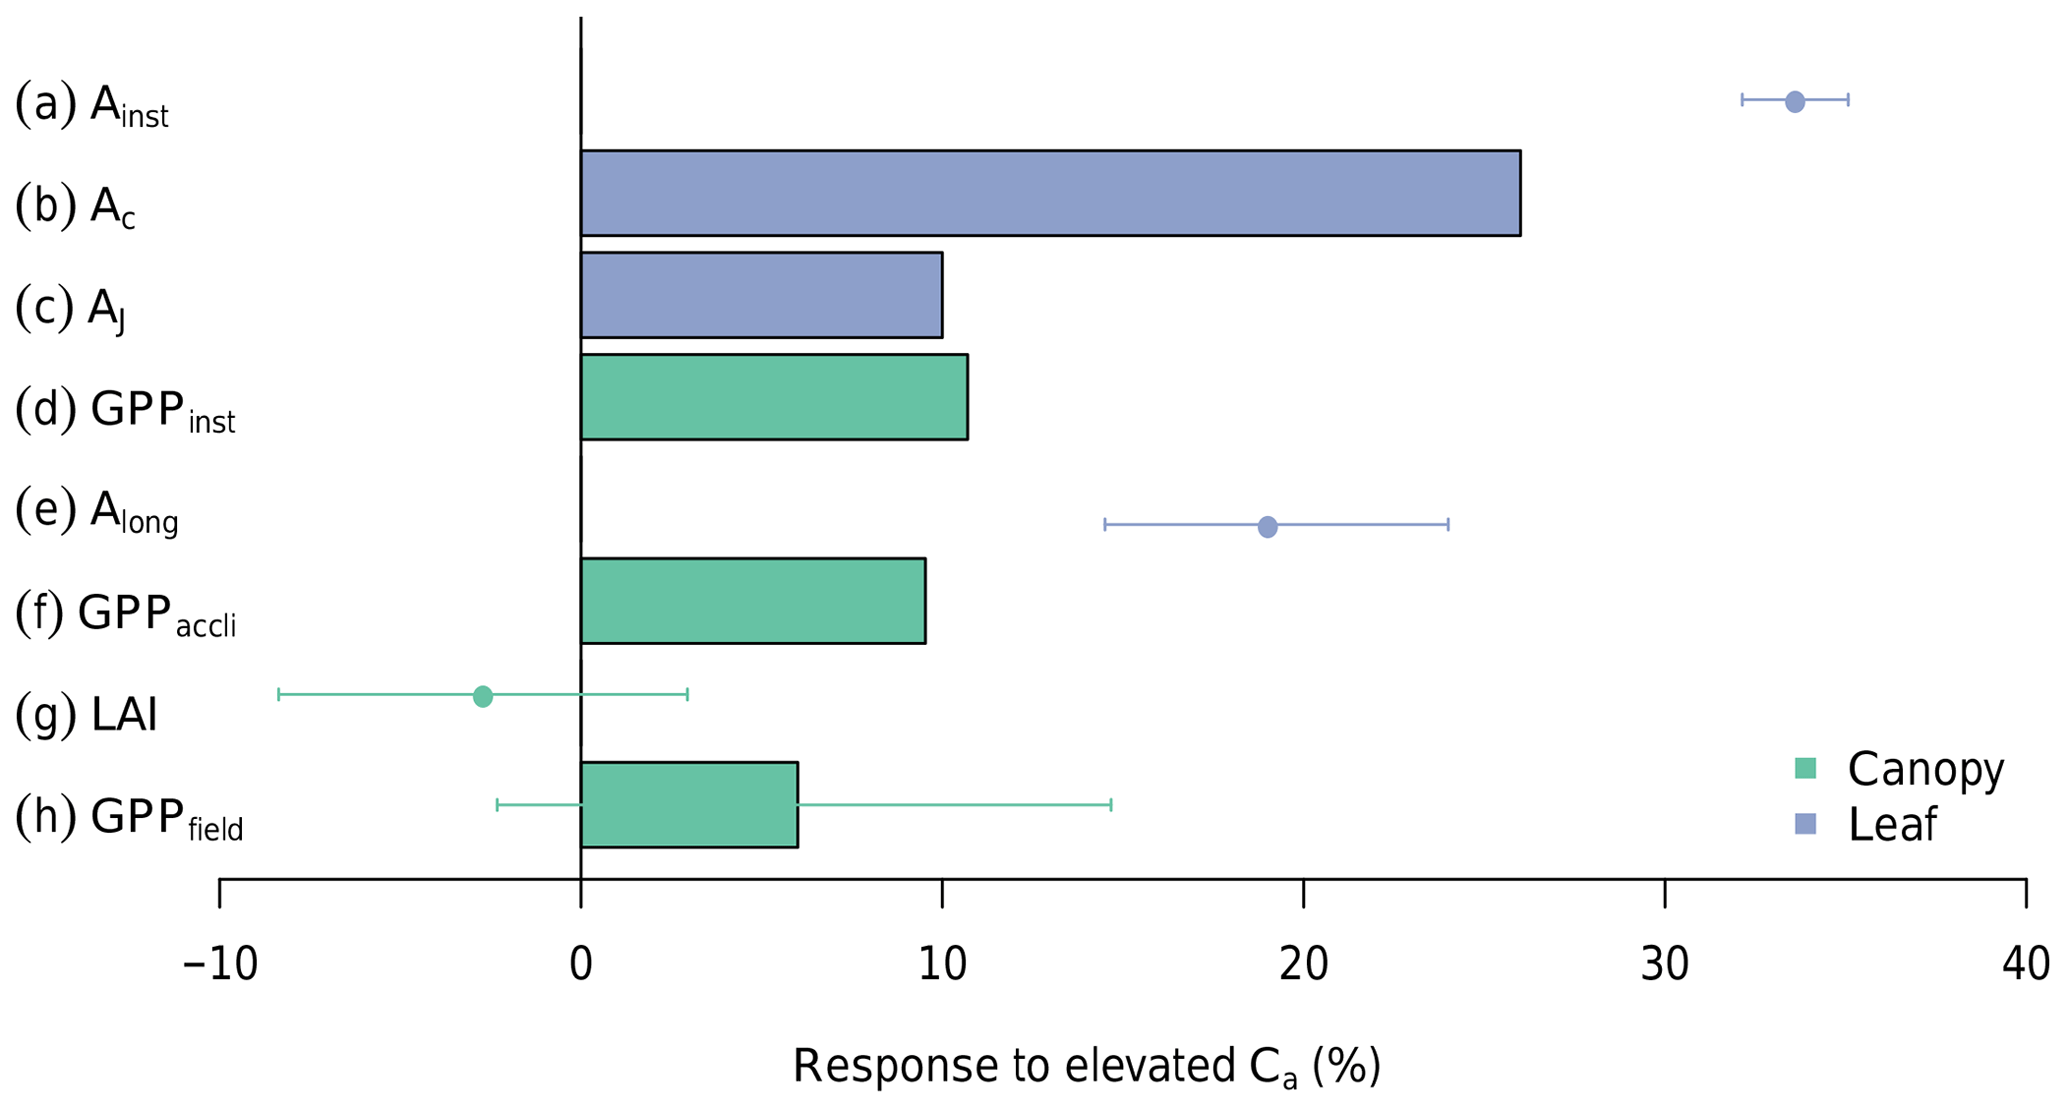
Figure 4The response of photosynthesis to eCa on different scales and limited by different factors. In summary, from top to bottom, the figure demonstrates how a large increase in leaf photosynthesis can diminish into a statistically nonsignificant change in the canopy GPP under eCa. Entries from top to bottom are as follows: (a) Ainst is the instantaneous response of leaf photosynthesis to eCa obtained from A-Ci measurements in ambient rings (error bars indicate 95 % CI); (b) Ac is the modelled response of Rubisco-limited leaf photosynthesis, assuming no downregulation, averaged over the range of diurnal air temperatures experienced during the experimental period; (c) AJ is the modelled response of RuBP-regeneration-limited leaf photosynthesis; (d) GPPinst is the direct effect of eCa on the canopy GPP, modelled with MAESPA, assuming no downregulation of photosynthesis and averaged across all six rings; (e) Along is the long-term response of leaf photosynthesis to eCa obtained from leaf photosynthesis measured at treatment CO2 concentrations (see Ellsworth et al., 2017) – this value is different from Ainst because it incorporates photosynthetic acclimation; (f) GPPlong is the effect of eCa on the canopy GPP once the measured downregulation of Vcmax is taken into account; (g) LAI is the measured difference in the average LAI between eCa and ambient Ca rings over the experiment period (data from Duursma et al., 2016); and (h) GPPfield is the GPP response modelled with MAESPA comparing the three elevated rings with the three ambient rings. The bars represent model outputs, and points represent observations. See the text for further explanation.
3.1 Instantaneous Ca response of photosynthesis at the leaf and canopy scale
The mean instantaneous Ca response of leaf-level photosynthesis (Ainst) was +33 % (Fig. 4a). This response ratio was calculated from ∼600 light- and temperature-controlled A−Ci curves measured in the ambient rings. From the curves, we extracted the photosynthesis at 400 and 550 Ca (µmol mol −1) and calculated the instantaneous Ca effect as their ratio. This approach allows for an estimation of the direct CO2 response independent of the impact of photosynthetic acclimation.
By contrast, the modelled direct GPP response to eCa was considerably less (just +11 %) as shown in Fig. 4d (“GPPinst”). This canopy response rate was calculated by comparing the modelled GPP of all six rings under ambient and elevated Ca conditions (“ambient” vs. “elevated” scenario). As a result, this direct canopy GPP response also excludes the impact of photosynthetic acclimation.
Our results show that the major reason for the difference between the direct leaf and canopy photosynthesis responses to eCa is the relative contributions from Rubisco-limited and RuBP-regeneration-limited photosynthesis (cf. Fig. 4b and c). Figure 5 shows that the response of photosynthesis to eCa is considerably higher when Rubisco activity limits photosynthesis (Ac) than when RuBP regeneration limits photosynthesis (AJ). When averaged over the range of leaf temperatures experienced during the 4 years of the experiment, the Ac response to eCa on average (+26 %; Fig. 4b) is larger than that of AJ (+10 %; Fig. 4c). Leaf gas exchange measurements were taken in saturating light (1800 µmol m−2 s−1) and, thus, are mostly Rubisco-limited. Therefore, the observed response rate of Ainst is close to that of Ac.

Figure 5The modelled Ca response of Rubisco-limited leaf photosynthesis (Ac) and RuBP-regeneration-limited leaf photosynthesis (AJ) to leaf temperature (Tleaf). The responses are calculated for temperatures during the 2013–2016 period. Parameters are as given in Table 1, except that Vcmax,25 and g1 were assumed to be constant for clarity ( kPa0.5 and µmol m−2 s−1).
At the canopy scale, a large fraction of the modelled canopy photosynthesis is limited by RuBP regeneration. In Fig. 6, we show the distribution of Ac and AJ during the 4 years of simulation as calculated by MAESPA. On average, 70 % of the canopy photosynthesis is limited by RuBP regeneration under ambient conditions (“ambient scenario”). The high fraction of AJ is partly a consequence of the relatively low ratio of Jmax,25 to Vcmax,25 (J:V ratio) which was estimated to be 1.7 (Table 1). In Fig. 7, we estimated the PAR level at which Rubisco activity becomes limiting to leaf photosynthesis. The transition point from Rubisco-limited to RuBP-regeneration-limited photosynthesis was calculated from the leaf gas exchange sub-model by assuming a constant Ca (390 µmol mol−1), D (1.5 kPa), g1 (3.3 kPa0.5), and Vcmax,25 (90 µmol m−2 s−1), but varying leaf temperature. As shown, under these conditions, when the temperature is 25 ∘C and the J:V ratio is 1.7, Rubisco activity limits photosynthesis only when incident PAR is greater than 1800 µmol m−2 s−1. Using a higher J:V ratio such as the commonly used value of 2 would decrease the saturating PAR value at which photosynthesis becomes Rubisco-limited. We ran additional simulations assuming a J:V ratio of 2 and found that, with this ratio, MAESPA estimated 48 % of photosynthesis to be RuBP-regeneration-limited under ambient conditions and a direct GPP response of 15 % (data not shown).
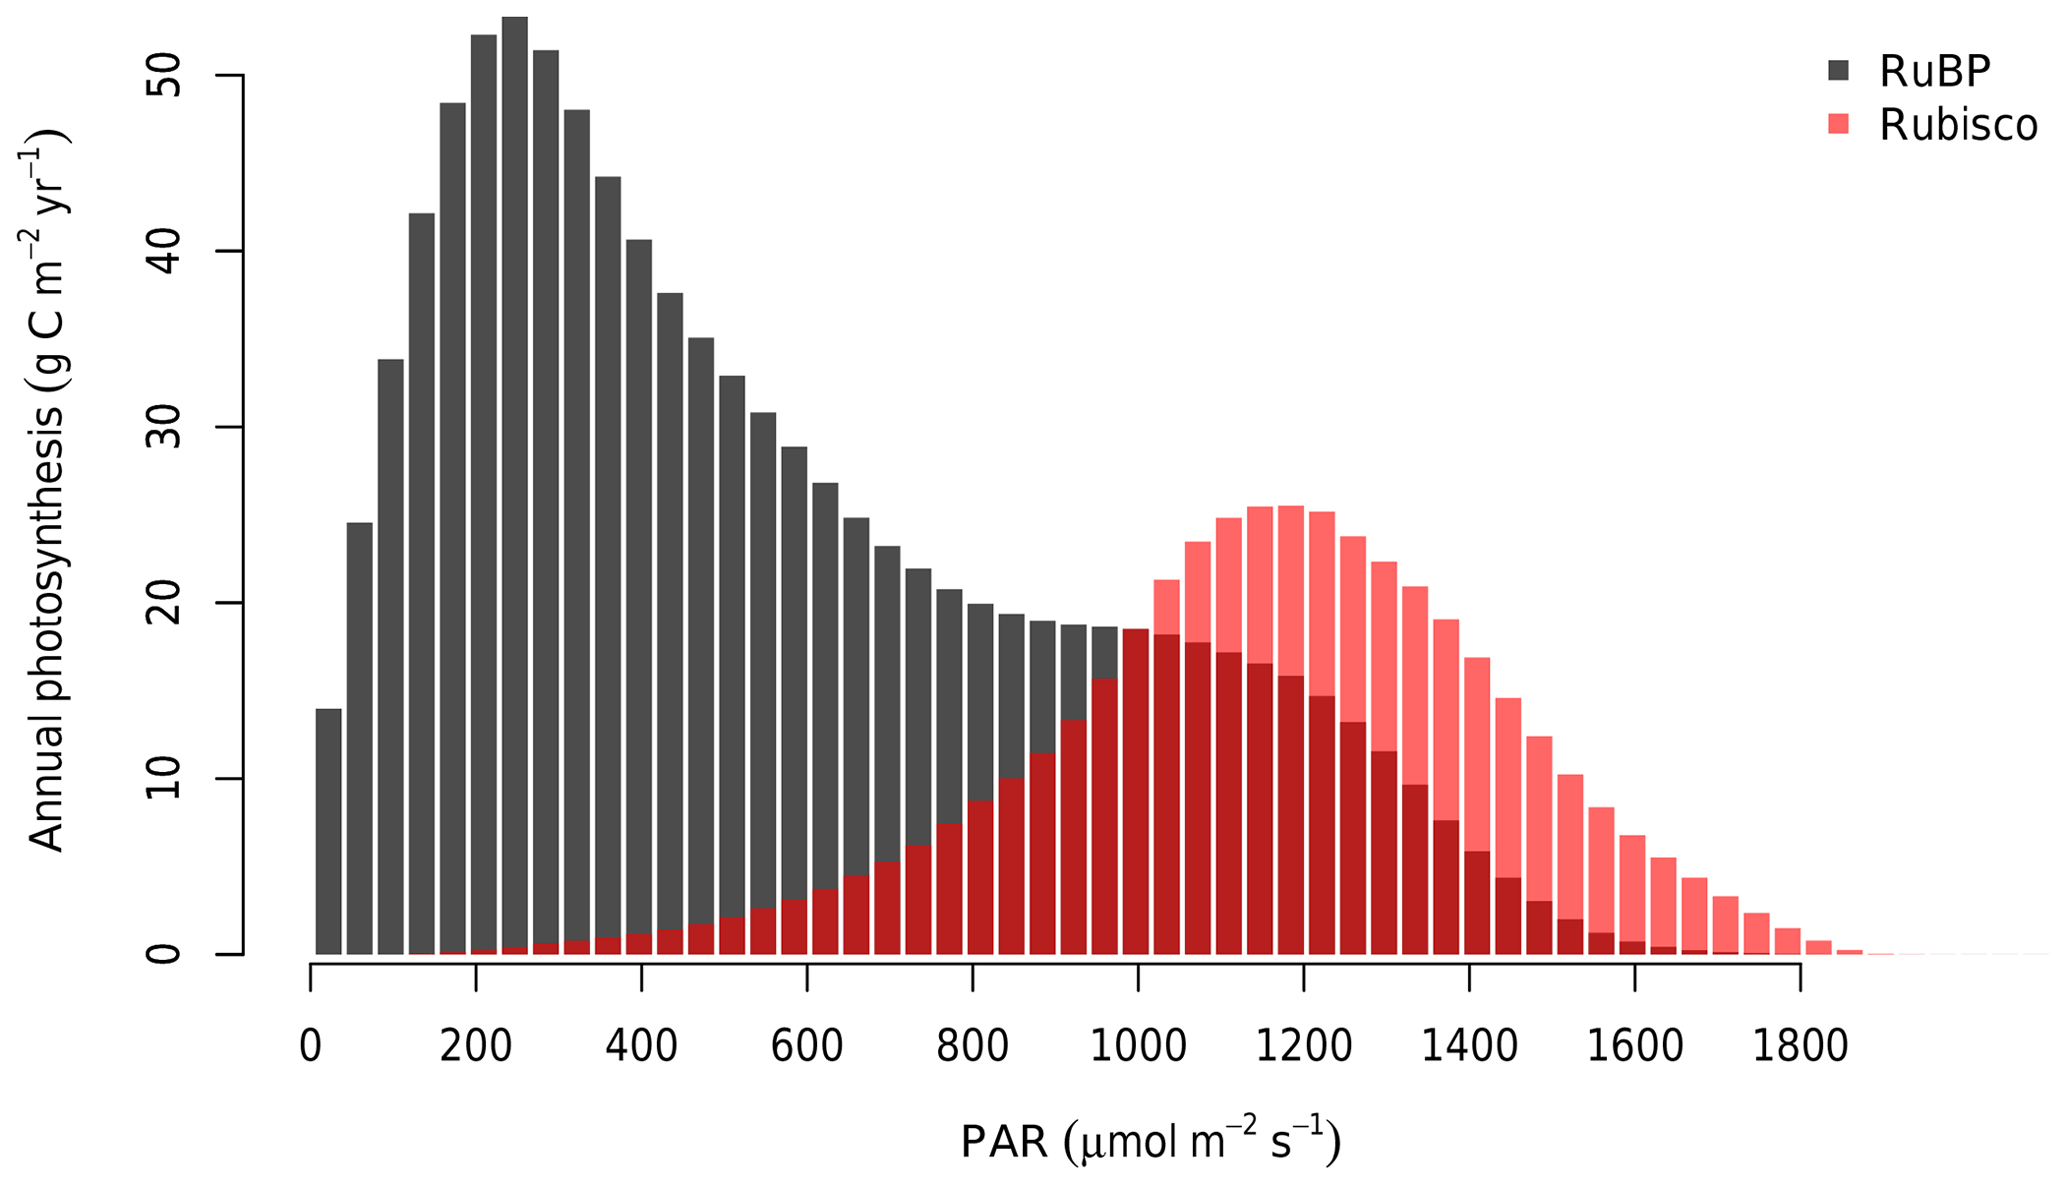
Figure 6Distribution of average annual photosynthesis limited by Rubisco activity and RuBP regeneration in bins of PAR (30 µmol m−2 s−1). As calculated by MAESPA across all rings from 2013 to 2016. The histogram was constructed by calculating the photosynthesis (either limited by Rubisco or RuBP) falling into each bin for every 30 min in the “ambient scenario”. These values were then summed to each year and ring and averaged over six rings and 4 years.
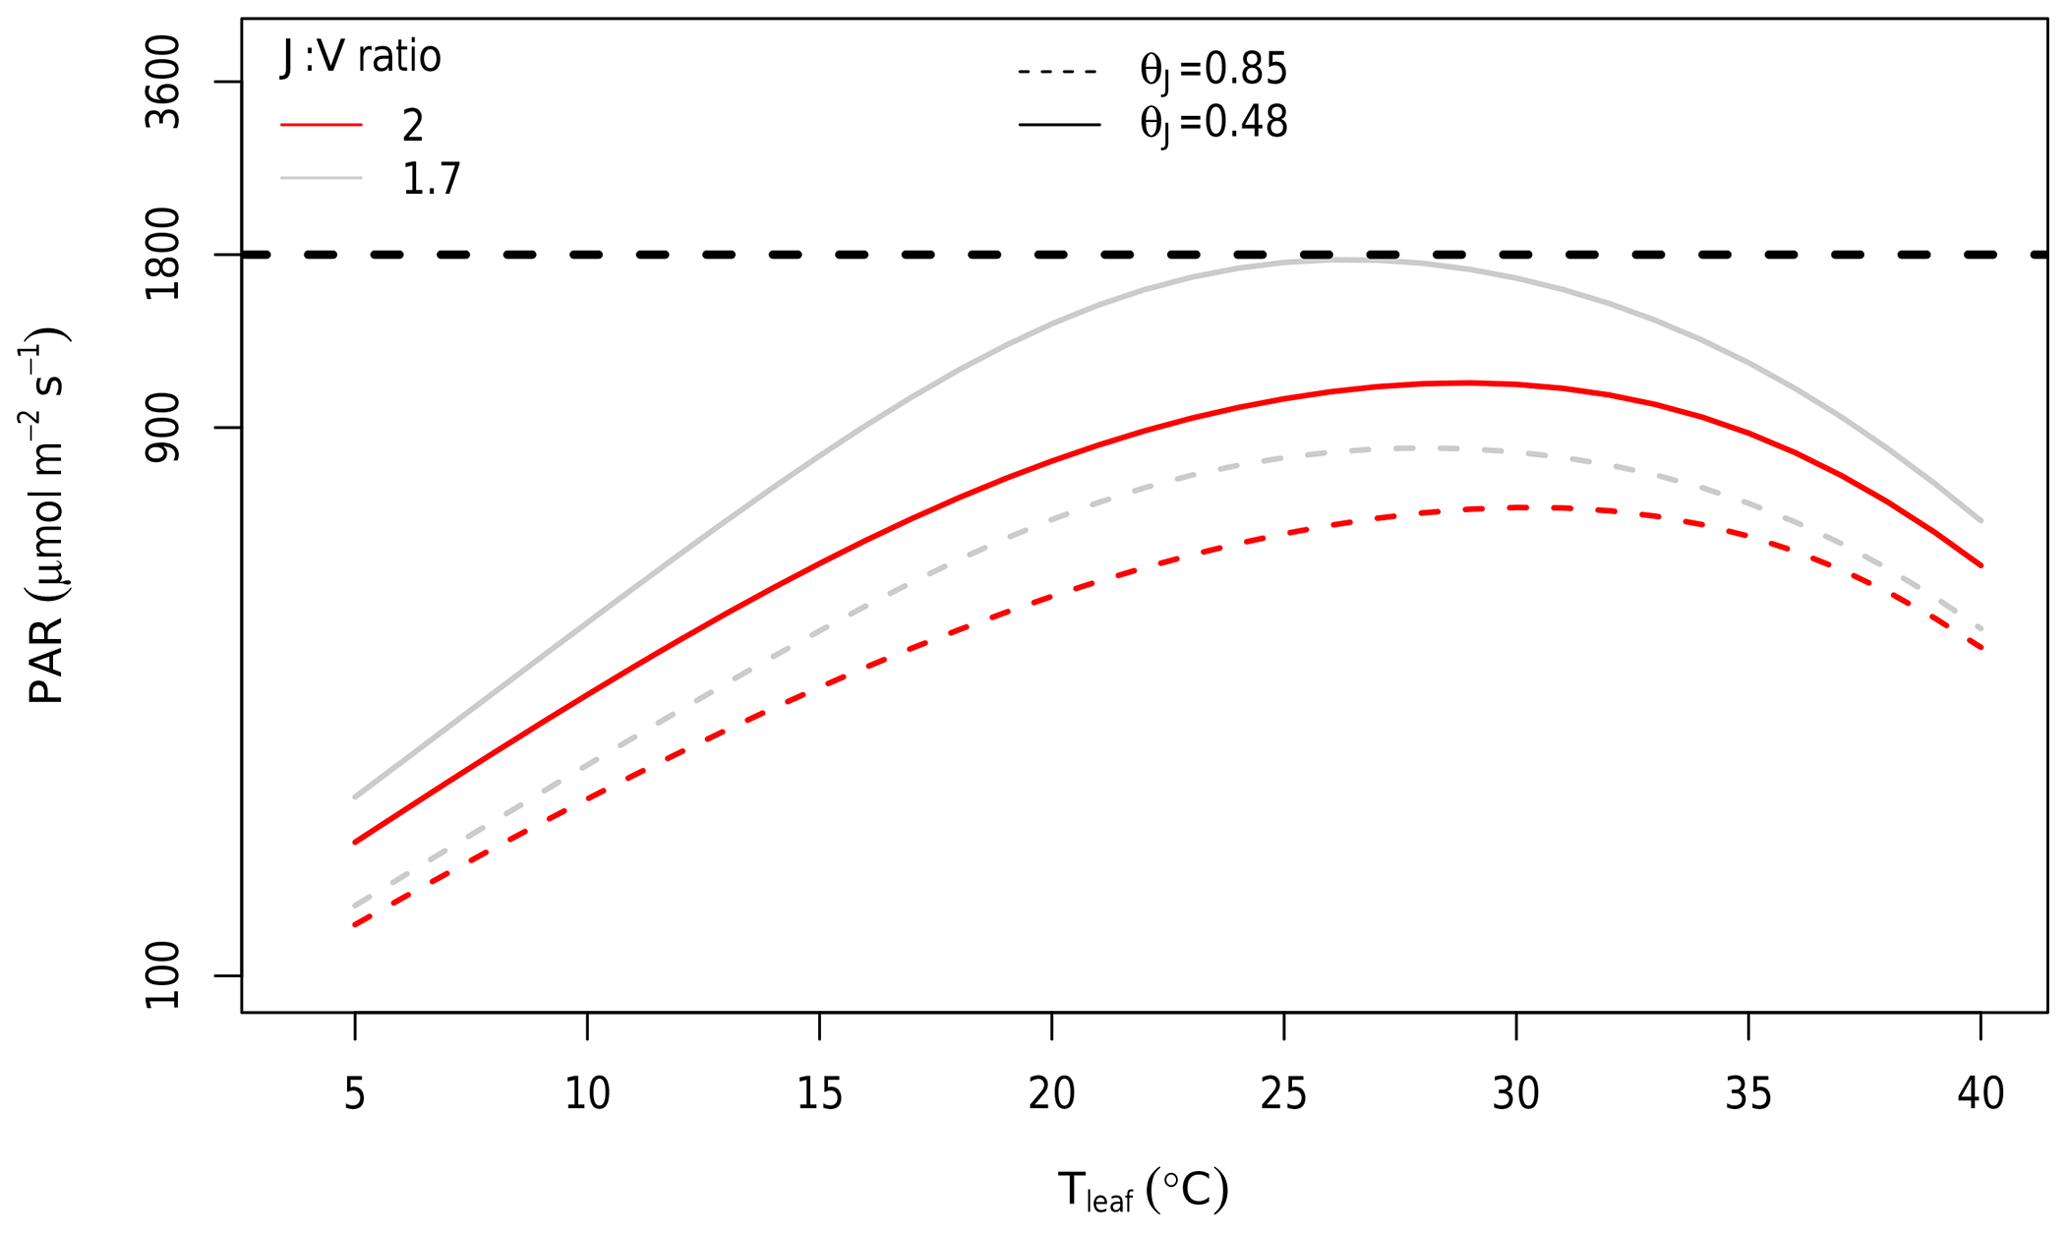
Figure 7Estimated PAR value at which limitation to photosynthesis shifts from RuBP regeneration to Rubisco at different leaf temperatures and J:V ratios. Rubisco limitation occurs at PAR values above the curves; RuBP regeneration limitation occurs below the curves. The curves were calculated using the Photosyn function in the plantecophys R package (Duursma, 2015). Parameters other than PAR and Tleaf were assumed to be constant: Ca of 390 µmol mol−1, D of 1.5 kPa, g1 of 3.3 kPa0.5, and Vcmax,25 of 90 µmol m−2 s−1. The temperature and light dependences of photosynthesis were assumed to be the same as in MAESPA. The grey line was predicted by assuming µmol m−2 s−1 (i.e. a J:V ratio of 1.7). This J:V ratio was observed consistently in EucFACE across campaigns and rings. The red line was predicted by assuming µmol m−2 s−1 (i.e. a J:V ratio of 2). This J:V ratio has been commonly reported and used in other studies. The horizontal dashed line shows the PAR = 1800 µmol m−2 s−1 at which leaf-level measurements of EucFACE were made. Note the log scale of the y axis. The dashed curves are based on quantum yield of electron transport (αJ; mol mol−1) and the convexity of light response of RuBP, θJ, unitless values from the CABLE model (Haverd et al., 2018).
The shape of the light response curve also determines the transition point from RuBP-limited to Rubisco-limited photosynthesis. We explored this effect by investigating the effect of varying the convexity, θJ, which is assumed to be the same as the convexity of overall photosynthesis. At EucFACE, we estimated this parameter to be 0.48 from light-response curves of photosynthesis collected on site, indicating a shallow curvature and a high light saturation point, in contrast to the more commonly assumed 0.85, representing a steeper curvature and a lower light saturation point. Using a value of 0.85 for θJ resulted in a much lower PAR being required for photosynthesis to became Rubisco-limited (dashed curves in Fig. 7). With a θJ of 0.85 and a J:V ratio of 1.7, MAESPA estimated 40 % of photosynthesis to be RuBP-regeneration-limited under ambient conditions and a direct GPP response of 16 % (data not shown). With a θJ of 0.85 and a J:V ratio of 2, MAESPA estimated just 34 % of photosynthesis to be RuBP-regeneration-limited under ambient conditions and a direct GPP response of 18 % (Fig. S2). Thus, the simulated CO2 response of canopy carbon uptake depends heavily on the parameterization of light response and the J:V ratio.
3.2 Acclimation of photosynthesis
The above calculations are made considering only the instantaneous response of photosynthesis to eCa. However, photosynthetic acclimation has been observed at the leaf scale (Ellsworth et al., 2019), and will also reduce the response of the GPP to eCa at the canopy scale. At the leaf-level, photosynthesis measured in the elevated rings after 5 years of treatment (Along) was 19 % higher than that measured in ambient rings (Fig. 4e; Ellsworth et al., 2017). Thus, Along accounts for the photosynthetic acclimation in the elevated rings after 4 years of exposure to eCa. Along is considerably smaller than Ainst (19 % vs. 33 %; Fig. 4a and e), indicating a large effect of photosynthetic acclimation on the eCa response of light-saturated photosynthesis.
Accounting for the impact of photosynthetic acclimation in MAESPA, by using the Vcmax from elevated rings (“field” vs. “ambient” scenarios), reduced the response of the GPP to Ca from 11 % to 10 % (GPPlong; Fig. 4f). As such, the photosynthetic acclimation had a relatively modest impact on the modelled annual GPP in the model. The small impact of photosynthetic acclimation on canopy photosynthesis relative to the effect on leaf photosynthesis can be explained by the fact that the leaf photosynthesis data are measured under saturating light and, thus, are typically Rubisco-limited, so a reduction in Vcmax had a large effect. In contrast, at the canopy scale, much of the photosynthesis was limited by RuBP regeneration and was largely unaffected by a reduction in Vcmax.
3.3 Influence of LAI
The realized GPP response to eCa also depends on the canopy structure, specifically the LAI. In this experiment, there was no significant change in the LAI with eCa (; Fig. 4g; see also Duursma et al., 2016). The effect of eCa on the LAI was calculated as the average effect between the elevated and ambient annual mean LAI. However, there was inherent variability in the LAI across the rings (Fig. 2a), which does not fundamentally change the effect of eCa but requires a detailed analysis of the potential effects of natural variability on the response to eCa.
The small pretreatment difference in the LAI across rings gives rise to a range of estimates for the GPP response to eCa in the field (6 %±8 %; Fig. 4h). This result is explored further in Fig. 8, which combines the results from “ambient”, “elevated”, and “field” scenarios. The average GPP across all six rings under ambient Ca was 1574 g C m−2 yr−1 over the 4-year simulation (“ambient scenario”; Fig. 8). However, there was significant variability in the ambient GPP across rings, related in part to the inherent variability in the LAI across rings. We characterized the pre-existing differences in the LAI by the initial LAI (LAIi), measured on 26 October 2012. These initial values are low, as they are measured immediately before the seasonal leaf flush, but characterize the difference in the LAI across rings over the full experimental period. Rings 1 and 4 (both experimental rings) have the lowest LAIi (< 0.3 m2 m−2) and thus the lowest average GPP under ambient conditions (1206 g C m−2 yr−1). Ring 5 (the other experimental ring) has the second highest LAIi (∼0.4 m2 m−2) and also the highest GPP under ambient conditions (2359 g C m−2 yr−1). Therefore, the variability among rings in the ambient GPP (SD of 15 %) is larger than the modelled direct effect of Ca on GPP, which is similar in all rings (+11 %).
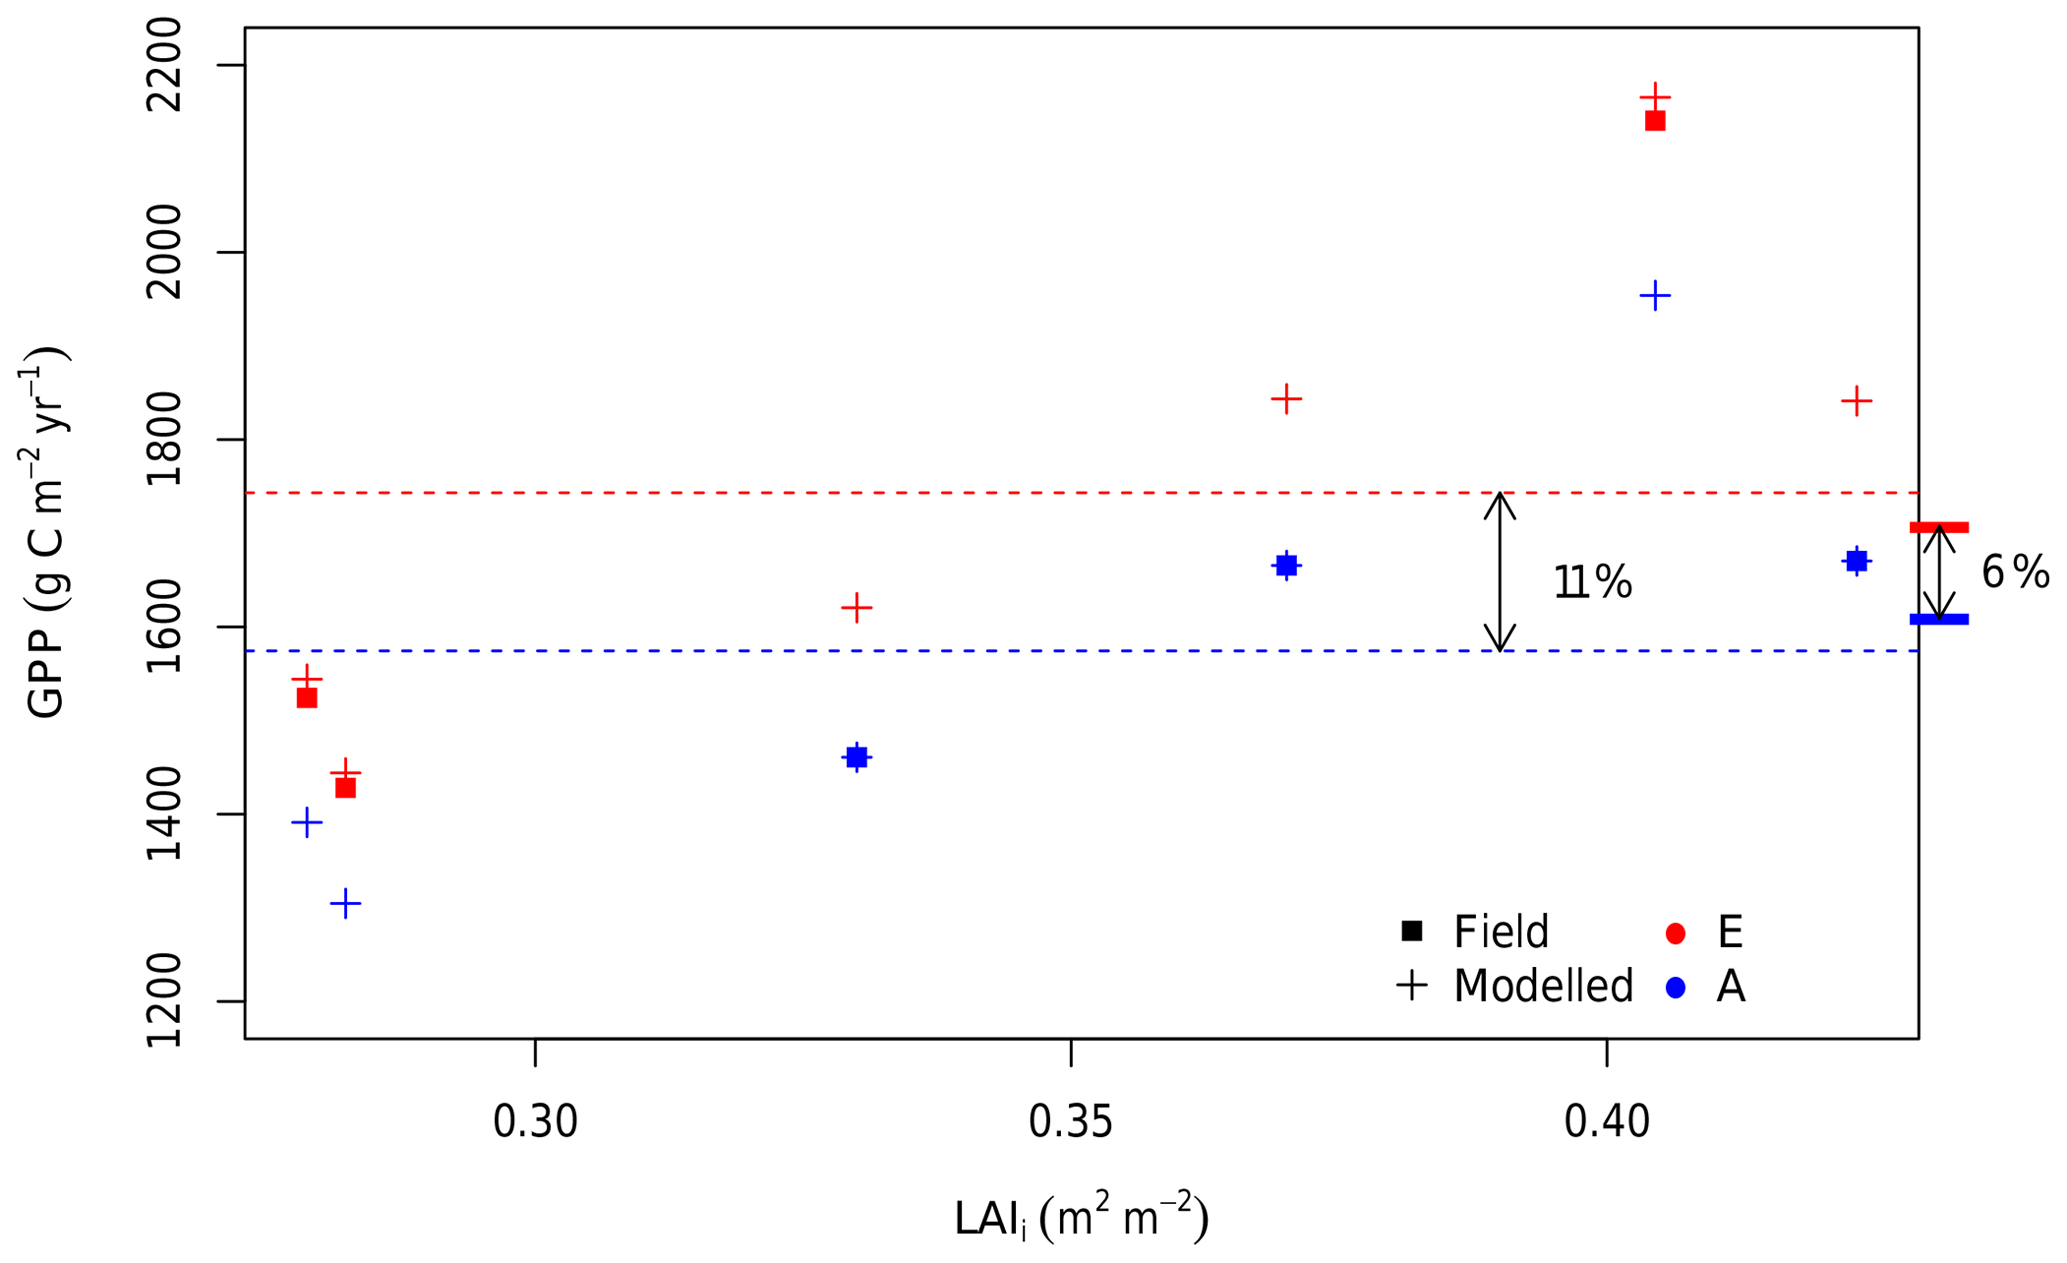
Figure 8The 4-year average GPP of all six rings under ambient and eCa conditions plotted against the initial leaf area index (LAIi). The LAIi is the LAI measurement taken on the 26 October 2012 and is a proxy for the inherent variation among the rings. For all six rings, the estimated GPP is shown for ambient Ca (blue) and eCa (red). Crosses indicate the GPP from simulations in which the Ca is varied, and squares indicate the GPP under field conditions. The flat bars on the right-hand side of the plot indicate the average ambient Ca GPP for ambient rings only (the average of blue squares) and the average eCa GPP for elevated rings only (the average of red squares). Dashed lines indicate the average ambient Ca (the average of blue crosses) and the eCa GPP across all six rings (the average of red crosses). Thus, the flat bars mark the modelled response without inter-ring variability, whereas the dashed lines mark the modelled realized response, including inter-ring variability.
Owing to the variability among rings represented by the LAIi, the estimated mean GPP response to eCa across the experimental rings has a sizable confidence interval (±8 %, Fig. 4h). The actual eCa response was estimated as an average effect between the ambient and elevated GPP values considering the impacts of photosynthetic acclimation and inter-ring variability. The average GPP of experimental rings under field conditions (eCa) was estimated to be 1698 g C m−2 yr−1, whereas the average GPP of control rings under field conditions (ambient Ca) was 1599 g C m−2 yr−1, which is an increase of 6 % as shown in the Fig. 4h. The variation of the annual average GPP of the control and experimental groups (blue and red squares in Fig. 8) are consequently represented by the CI in Fig. 4h.
We have shown how a large response of leaf-level photosynthesis to eCa diminishes when integrated to the canopy scale, according to the synthesis of 4 years of leaf measurements at EucFACE with a stand-scale model, MAESPA. We estimated that the canopy GPP of a mature Eucalyptus woodland under ambient Ca conditions varied from 1084 to 2129 g C m−2 yr−1 by ring and year with a mean of 1574 g C m−2 yr−1. The model, constrained by site measurements, predicted that once scaled to the canopy, the response of the GPP to eCa only increased by 6 % (95 % CI of ±8 %) compared with the 19 % (95 % CI of ±5 %) observed in leaf-scale measurements. We were able to quantify the response of the GPP to eCa and attribute the reduction in the response to various factors including (i) Rubisco limitations vs. RuBP regeneration limitations to photosynthesis, (ii) photosynthetic acclimation, and (iii) inter-ring variability in the LAI. Together, these findings provide valuable insights into the relative importance of each factor and help close a key knowledge gap in our understanding of how mature forests respond to eCa.
4.1 Performance of MAESPA under ambient conditions
The ambient GPP of EucFACE estimated by MAESPA was comparable to that measured with eddy covariance in similar evergreen eucalypt forests in southeastern Australia. At a nearby eddy covariance site (< 1 km), Renchon et al. (2018) estimated the ecosystem GPP from eddy covariance to be 1561 g C m−2 yr−1 from 2013 to 2016; this is within the range estimated for the ambient rings in this study, although this latter site and the EucFACE site are not the same in terms of canopy structure and LAI. Furthermore, our version of MAESPA was evaluated against leaf photosynthesis and whole-tree sap flow measurements in EucFACE (R2 of 0.77 and 0.8 respectively; Yang et al., 2019). These comparisons indicate that MAESPA is a useful tool to explore the canopy carbon uptake, and the predicted GPP could provide a baseline for future studies.
4.2 RuBP-regeneration-limited photosynthesis
Our results show that the canopy GPP at EucFACE was predominantly limited by RuBP regeneration. The reason for the frequent RuBP regeneration limitation is that the measured J:V ratio was relatively small in EucFACE (1.7), and stomata tend to close at midday when light levels are higher and Rubisco limitation is expected (Gimeno et al., 2015). A lower J:V ratio increases the PAR threshold required for the photosynthesis model to switch between the RuBP regeneration limitation and the Rubisco limitation (from < 1000 to < 1800 µmol m−2 s−1; Fig. 7). Previous studies have highlighted the need to consider the J:V ratio for a correct prediction of the CO2 response (Long et al., 2004; Zaehle et al., 2014; Rogers et al., 2017). However, as shown by Zaehle et al. (2014), Medlyn et al. (2015), and Rogers et al. (2017), current models differ with respect to their predictions of the transition from RuBP-regeneration-limited to Rubisco-limited photosynthesis, suggesting the uncertainty of the predicted CO2 response of the GPP could be reduced by using a realistic J:V ratio.
Previous modelling studies applying MAESPA to eCa experiments both assumed a higher J:V ratio (2) and estimated a higher GPP response to eCa, presumably due to less frequent RuBP regeneration limitation (Wang et al., 1998; Luo et al., 2001). A J:V ratio of 2 was suggested by Wullschleger (1993) and has been used in many modelling studies (e.g. the seven terrestrial biosphere models assessed by Rogers et al., 2017 all assumed a J:V ratio of between 1.9 and 2). Global terrestrial biosphere models such as JULES and others frequently estimate Jmax on the basis of this ratio (e.g. Clark et al., 2011). However, the relatively low J:V ratio observed at EucFACE is not unique. At the Duke Forest FACE site in the US, Ellsworth et al. (2012) reported a J:V ratio of ∼1.7, which is the same as that estimated for EucFACE. Kattge and Knorr (2007) analysed Vcmax and Jmax values from 36 species across the world and found a low J:V ratio (< 1.8) in herbaceous, coniferous, and broad-leaved species. Most recently, Kumarathunge et al. (2018) studied the variation in the J:V ratio in data sets obtained from around the globe and found that it declined with increasing growing season temperature. The ratio varied from 2.5 in tundra environments to less than 1.5 in tropical environments. The value of 1.7 observed at EucFACE falls within this prediction for the prevailing growth temperature at this site. Thus, the inclusion of this relationship between the J:V ratio and temperature will be important for capturing the GPP response to eCa globally.
We also found that the convexity of the light response of photosynthesis affected the predicted GPP response to eCa (Fig. 7). The parameter value we fitted to data measured in situ (θJ=0.48) is lower than the value commonly assumed in the models (e.g. 0.7 in Bonan et al., 2011). Note that some model studies assume that θJ is lower than the convexity of overall photosynthesis (typically over 0.8; e.g. 0.9 in Medlyn et al., 2002; 0.85 in Haverd et al., 2018). Here, we assumed that the convexity of the electron transport rate and overall photosynthesis are the same (see Supplement S1 for details). Nonetheless, our relatively low θJ value (< 0.7) is not unique, as it is also supported by a number of studies on different species around the world (Ögren, 1993; Valladares et al., 1997; Lewis et al., 2000; Hjelm and Ögren, 2004). The inclusion of a higher θJ value would predict a much higher direct GPP response to eCa (e.g. 16 % vs. 11 % in this study), as higher θJ results in a large proportion of the GPP being Rubisco-limited. This finding calls for careful examination of the light response of photosynthesis, which has a large effect on the predicted eCa response
4.3 Photosynthetic acclimation
Some degree of photosynthetic acclimation (i.e. a long-term reduction of Vcmax under eCa) has been widely reported in FACE studies and has been attributed to a reduction in the leaf nitrogen concentration (Saxe et al., 1998; Ainsworth and Long, 2005). The response of the GPP to eCa would be linearly related to Vcmax if photosynthesis were mostly limited by Rubisco activity. Photosynthetic acclimation was responsible for the reduced response of leaf-scale light-saturated photosynthesis from 33 % (Ainst) to 19 % (Along). However, this reduction in Vcmax only translated into a ∼2 % reduction in the GPP modelled by MAESPA. Wang et al. (1998) also showed that photosynthetic acclimation (−21 % in Vcmax) reduced the modelled canopy GPP by only 6 % due to RuBP regeneration being the primary limitation of canopy photosynthesis. Thus, these findings suggest that photosynthetic acclimation may only have a small effect on the GPP response to eCa when canopy photosynthesis is mostly RuBP-regeneration-limited. Therefore, this response is consistent with the hypothesis that the reduction in Vcmax represents a reallocation of nitrogen to optimize the nitrogen use efficiency under eCa (Chen et al., 1993; Medlyn et al., 1996).
4.4 Constraining the carbon balance response to eCa
At EucFACE, after 4 years of eCa treatment, there was no evidence of increased above-ground tree growth (Ellsworth et al., 2017). Furthermore, the trees at EucFACE also did not show any significant change in the LAI (Duursma et al., 2016). The relatively small response of the GPP and the effect of ring-to-ring variation provides important context for these statistically nonsignificant responses of tree growth at the stand scale at EucFACE. Firstly, the effect size calculated for the GPP of +11 % (+169 g C m−2 yr−1) constrains the likely effect size for plant growth and other components of the ecosystem carbon balance and is a more useful baseline for comparison than the response of light-saturated leaf photosynthesis (+19 % = 299 g C).
Secondly, the inherent ring-to-ring variation in this natural forest stand is larger than the GPP response, which highlights the importance of considering both the effect size and variability in the observations rather than just focusing on statistical significance. It is important to note that the EucFACE site could be considered relatively homogeneous for a mature woodland. The site is flat, trees appear to be similar with respect to age, and almost the entire overstorey is comprised of a single species. In addition, plots were carefully sited to minimize variation in basal area. However, there are small-scale variations in soil type, depth, and nutrient availability that cause variation in the LAI. This scale of variation is likely to present in other natural forests, and, indeed, other studies on mature trees also note that background variability can contribute to a lack of statistically significant findings (Fatichi and Leuzinger, 2013; Sigurdsson et al., 2013). We highlight the need to focus on effect size and its uncertainty, rather than the dichotomous significant/nonsignificant approach when evaluating experimental results from native forests.
4.5 Implications for terrestrial biosphere models
Seven terrestrial biosphere models (TBMs) were used to predict the GPP and LAI responses to eCa in advance of the EucFACE experiment (Medlyn et al., 2016). The predicted eCa responses of the GPP ranged from +2 % to +24 % across the seven models, while the predicted responses of the LAI ranged from +1 % to +20 %. With our results, it is possible to disprove some of the assumptions made in these model simulations and identify directions for model improvement. The model with the lowest GPP response (CLM4-P) assumed very strong downregulation of photosynthesis owing to phosphorus limitation. However, this downregulation was not observed here. The models with the highest GPP responses (GDAY, O-CN, and SDGVM) had a J:V ratio of 2, which is higher than that observed at EucFACE, and also had a positive feedback to the GPP via increased LAI (+5 % to 15 %), which did not occur (Duursma et al., 2016). The model rendering the most similar prediction for the GPP response to eCa to the output of MAESPA incorporating empirical observations was the CABLE model. This latter model predicted an eCa response of GPP of ∼12 % with a large proportion of RuBP-regeneration-limited photosynthesis, both of which are similar to the findings in this study. Future TBMs may benefit from incorporating a more realistic representation of the relative contribution of RuBP-regeneration-limited and Rubisco-limited photosynthesis to the GPP. For instance, adding the temperature dependency of the J:V ratio could help capture the variation in the J:V ratio globally (e.g. Kumarathunge et al., 2018).
Our study provides a number of process-based insights that can be used to improve model performance both qualitatively and quantitatively. Our modelling exercise is also a major contribution to the understanding of the EucFACE experiment as it quantifies the amount of extra carbon input into the system by canopy-level photosynthesis and, thus, provides a reference for assessing the impacts of eCa on growth and soil respiration. Finally, our study highlights that the eCa effect on canopy-scale GPP may be considerably lower than the effect on the photosynthesis of the light-saturated leaves, due to the contrasting relative limitations to photosynthesis operation and the different scales. In future work, our GPP estimates will be used as an input to calculate the overall effect of eCa on the carbon balance at the whole EucFACE site.
The data and parameter values used to drive the model are freely available from https://doi.org/10.5281/zenodo.3610698 (Yang, 2019).
The supplement related to this article is available online at: https://doi.org/10.5194/bg-17-265-2020-supplement.
JY, BEM, MGDK, and RAD conceived and designed the analysis. KYC, DE, and TG designed the sampling of the leaf physiological data; DE and RD designed the sampling of the canopy structure data. KYC, DSE, TEG, AWK, RAD, and JY collected data. RAD and DK provided analysis tools. JY and BEM performed the analysis. JY, BEM, MGDK, and MJ wrote the paper. All authors edited and approved the paper.
The authors declare that they have no conflict of interest.
Jinyan Yang was supported by a PhD scholarship from the Hawkesbury Institute for the Environment, Western Sydney University. Martin G. De Kauwe was supported by the NSW Research Attraction and Acceleration Program (RAAP). EucFACE was built as an initiative of the Australian Government as part of the Nation Building Economic Stimulus Plan and is supported by the Australian Commonwealth in collaboration with Western Sydney University. It is also part of a TERN SuperSite facility. We thank Vinod Kumar, Craig McNamara, and Craig Barton for their excellent technical support. We also thank Elise Dando for help with measuring crown radius, Steven Wohl for crane driving, and Julia Cooke and Burhan Amiji for installing the neutron probe access tubes.
This research has been supported by the Western Sydney University (Graduate research scholarship).
This paper was edited by Paul Stoy and reviewed by Simone Fatichi and one anonymous referee.
Ainsworth, E. A. and Long, S. P.: What have we learned from 15 years of free-air CO2 enrichment (FACE)? A meta-analytic review of the responses of photosynthesis, canopy properties and plant production to rising CO2, New Phytol., 165, 351–372, https://doi.org/10.1111/j.1469-8137.2004.01224.x, 2005.
Bonan, G. B.: Forests and Climate Change: Forcings, Feedbacks, and the Climate Benefits of Fiorests, Science, 320, 1444–1449, https://doi.org/10.1126/science.1155121, 2008.
Bonan, G. B., Lawrence, P. J., Oleson, K. W., Levis, S., Jung, M., Reichstein, M., Lawrence, D. M., and Swenson, S. C.: Improving canopy processes in the Community Land Model version 4 (CLM4) using global flux fields empirically inferred from FLUXNET data, J. Geophys. Res., 116, 1–22, https://doi.org/10.1029/2010jg001593, 2011.
Chen, J. L., Reynolds, J. F., Harley, P. C., and Tenhunen, J. D.: Coordination theory of leaf nitrogen distribution in a canopy, Oecologia, 93, 63–69, https://doi.org/10.1007/BF00321192, 1993.
Clark, D. B., Mercado, L. M., Sitch, S., Jones, C. D., Gedney, N., Best, M. J., Pryor, M., Rooney, G. G., Essery, R. L. H., Blyth, E., Boucher, O., Harding, R. J., Huntingford, C., and Cox, P. M.: The Joint UK Land Environment Simulator (JULES), model description – Part 2: Carbon fluxes and vegetation dynamics, Geosci. Model Dev., 4, 701–722, https://doi.org/10.5194/gmd-4-701-2011, 2011.
Curtis, P. S. and Wang, X.: A meta-analysis of elevated CO2 effects on woody plant mass, form, and physiology, Oecologia, 113, 299–313, https://doi.org/10.1007/s004420050381, 1998.
Dawes, M. A., Hättenschwiler, S., Bebi, P., Hagedorn, F., Handa, I. T., Körner, C., and Rixen, C.: Species-specific tree growth responses to 9 years of CO2 enrichment at the alpine treeline, J. Ecol., 99, 383–394, https://doi.org/10.1111/j.1365-2745.2010.01764.x, 2011.
De Kauwe, M. G., Medlyn, B. E., Zaehle, S., Walker, A. P., Dietze, M. C., Wang, Y. P., Luo, Y., Jain, A. K., El-Masri, B., Hickler, T., Wårlind, D., Weng, E., Parton, W. J., Thornton, P. E., Wang, S., Prentice, I. C., Asao, S., Smith, B., Mccarthy, H. R., Iversen, C. M., Hanson, P. J., Warren, J. M., Oren, R., and Norby, R. J.: Where does the carbon go? A model-data intercomparison of vegetation carbon allocation and turnover processes at two temperate forest free-air CO2 enrichment sites, New Phytol., 203, 883–899, https://doi.org/10.1111/nph.12847, 2014.
Donohue, R. J., Mcvicar, T. R., and Roderick, M. L.: Climate-related trends in Australian vegetation cover as inferred from satellite observations, 1981–2006, Glob. Change Biol., 15, 1025–1039, https://doi.org/10.1111/j.1365-2486.2008.01746.x, 2009.
Donohue, R. J., Roderick, M. L., McVicar, T. R., and Farquhar, G. D.: Impact of CO2 fertilization on maximum foliage cover across the globe's warm, arid environments, Geophys. Res. Lett., 40, 3031–3035, https://doi.org/10.1002/grl.50563, 2013.
Drake, J. E., Power, S. A., Duursma, R. A., Medlyn, B. E., Aspinwall, M. J., Choat, B., Creek, D., Eamus, D., Maier, C., Pfautsch, S., Smith, R. A., Tjoelker, M. G., and Tissue, D. T.: Stomatal and non-stomatal limitations of photosynthesis for four tree species under drought: A comparison of model formulations, Agr. Forest Meteorol., 247, 454–466, https://doi.org/10.1016/j.agrformet.2017.08.026, 2017.
Duursma, R. A.: Plantecophys – An R package for analysing and modelling leaf gas exchange data, PLoS One, 10, 1–13, https://doi.org/10.1371/journal.pone.0143346, 2015.
Duursma, R. A. and Medlyn, B. E.: MAESPA: a model to study interactions between water limitation, environmental drivers and vegetation function at tree and stand levels, with an example application to [CO2] × drought interactions, Geosci. Model Dev., 5, 919–940, https://doi.org/10.5194/gmd-5-919-2012, 2012.
Duursma, R. A., Gimeno, T. E., Boer, M. M., Crous, K. Y., Tjoelker, M. G., and Ellsworth, D. S.: Canopy leaf area of a mature evergreen Eucalyptus woodland does not respond to elevated atmospheric [CO2] but tracks water availability, Glob. Change Biol., 22, 1666–1676, https://doi.org/10.1111/gcb.13151, 2016.
Eamus, D. and Jarvis, P. G.: The direct effects of increase in the global atmospheric CO2 concentration on natural and commercial temperate trees and forests, Adv. Ecol. Res., 19, 1–55, 1989.
Ellsworth, D. S., Thomas, R., Crous, K. Y., Palmroth, S., Ward, E., Maier, C., Delucia, E., and Oren, R.: Elevated CO2 affects photosynthetic responses in canopy pine and subcanopy deciduous trees over 10 years: A synthesis from Duke FACE, Glob. Change Biol., 18, 223–242, https://doi.org/10.1111/j.1365-2486.2011.02505.x, 2012.
Ellsworth, D. S., Anderson, I. C., Crous, K. Y., Cooke, J., Drake, J. E., Gherlenda, A. N., Gimeno, T. E., Macdonald, C. A., Medlyn, B. E., Powell, J. R., Tjoelker, M. G., and Reich, P. B.: Elevated CO2 does not increase eucalypt forest productivity on a low-phosphorus soil, Nat. Clim. Change, 7, 279–282, https://doi.org/10.1038/nclimate3235, 2017.
Falster, D. S., Duursma, R. A., Ishihara, M. I., Barneche, D. R., FitzJohn, R. G., Vårhammar, A., Aiba, M., Ando, M., Anten, N., Aspinwall, M. J., Baltzer, J. L., Baraloto, C., Battaglia, M., Battles, J. J., Lamberty, B. B., Van Breugel, M., Camac, J., Claveau, Y., Coll, L., Dannoura, M., Delagrange, S., Domec, J. C., Fatemi, F., Feng, W., Gargaglione, V., Goto, Y., Hagihara, A., Hall, J. S., Hamilton, S., Harja, D., Hiura, T., Holdaway, R., Hutley, L. B., Ichie, T., Jokela, E. J., Kantola, A., Kelly, J. W. G., Kenzo, T., King, D., Kloeppel, B. D., Kohyama, T., Komiyama, A., Laclau, J. P., Lusk, C. H., Maguire, D. A., Le Maire, G., Mäkelä, A., Markesteijn, L., Marshall, J., McCulloh, K., Miyata, I., Mokany, K., Mori, S., Myster, R. W., Nagano, M., Naidu, S. L., Nouvellon, Y., O’Grady, A. P., O’Hara, K. L., Ohtsuka, T., Osada, N., Osunkoya, O. O., Peri, P. L., Petritan, A. M., Poorter, L., Portsmuth, A., Potvin, C., Ransijn, J., Reid, D., Ribeiro, S. C., Roberts, S. D., Rodríguez, R., Acosta, A. S., Santa-Regina, I., Sasa, K., Selaya, N. G., Sillett, S. C., Sterck, F., Takagi, K., Tange, T., Tanouchi, H., Tissue, D., Umehara, T., Utsugi, H., Vadeboncoeur, M. A., Valladares, F., Vanninen, P., Wang, J. R., Wenk, E., Williams, R., De Aquino Ximenes, F., Yamaba, A., Yamada, T., Yamakura, T., Yanai, R. D., and York, R. A.: BAAD: a Biomass And Allometry Database for woody plants, Ecology, 96, 1445, https://doi.org/10.1890/14-1889.1, 2015.
Farquhar, G. D., Caemmerer, S., and Berry, J. A.: A biochemical model of photosynthetic CO2 assimilation in leaves of C3 species, Planta, 149, 78–90, https://doi.org/10.1007/BF00386231, 1980.
Fatichi, S. and Leuzinger, S.: Reconciling observations with modeling: The fate of water and carbon allocation in a mature deciduous forest exposed to elevated CO2, Agr. Forest Meteorol., 174/175, 144–157, https://doi.org/10.1016/j.agrformet.2013.02.005, 2013.
Fatichi, S., Pappas, C., Zscheischler, J., and Leuzinger, S.: Modelling carbon sources and sinks in terrestrial vegetation, New Phytol., 221, 652–668, https://doi.org/10.1111/nph.15451, 2019.
Friedlingstein, P., Meinshausen, M., Arora, V. K., Jones, C. D., Anav, A., Liddicoat, S. K., and Knutti, R.: Uncertainties in CMIP5 climate projections due to carbon cycle feedbacks, J. Clim., 27, 511–526, https://doi.org/10.1175/JCLI-D-12-00579.1, 2014.
Friend, A.: Modelling canopy CO2 fluxes: are “big-leaf” simplifications justified?, Glob. Ecol. Biogeogr., 10, 603–619, 2001.
Gimeno, T. E., Crous, K. Y., Cooke, J., O'Grady, A. P., Ósvaldsson, A., Medlyn, B. E., and Ellsworth, D. S.: Conserved stomatal behaviour under elevated CO2 and varying water availability in a mature woodland, Funct. Ecol., 30, 700–709, https://doi.org/10.1111/1365-2435.12532, 2015.
Gimeno, T. E., McVicar, T. R., O’Grady, A. P., Tissue, D. T., and Ellsworth, D. S.: Elevated CO2 did not affect the hydrological balance of a mature native Eucalyptus woodland, Glob. Change Biol., 24, 3010–3024, https://doi.org/10.1111/gcb.14139, 2018.
Gunderson, C. A. and Wullschleger, S. D.: Photosynthetic acclimation in trees to rising atmospheric CO2: A broader perspective, Photosynth. Res., 39, 369–388, https://doi.org/10.1007/BF00014592, 1994.
Haverd, V., Smith, B., Nieradzik, L., Briggs, P. R., Woodgate, W., Trudinger, C. M., Canadell, J. G., and Cuntz, M.: A new version of the CABLE land surface model (Subversion revision r4601) incorporating land use and land cover change, woody vegetation demography, and a novel optimisation-based approach to plant coordination of photosynthesis, Geosci. Model Dev., 11, 2995–3026, https://doi.org/10.5194/gmd-11-2995-2018, 2018.
Hjelm, U. and Ögren, E.: Photosynthetic responses to short-term and long-term light variation in Pinus sylvestris and Salix dasyclados, Trees, 18, 622–629, https://doi.org/10.1007/s00468-004-0329-8, 2004.
IPCC: Climate Change 2014: Synthesis Report, Contribution of Working Groups I, II and III to the Fifth Assessment Report of the Intergovernmental Panel on Climate Change, edited by: Core Writing Team, Pachauri, R. K., and Meyer, L. A., IPCC, Geneva, Switzerland, 151 pp., 2014.
Joos, F. and Spahni, R.: Rates of change in natural and anthropogenic radiative forcing over the past 20,000 years, P. Natl. Acad. Sci. USA, 105, 1425–1430, https://doi.org/10.1073/pnas.0707386105, 2008.
Kattge, J. and Knorr, W.: Temperature acclimation in a biochemical model of photosynthesis: A reanalysis of data from 36 species, Plant, Cell Environ., 30, 1176–1190, https://doi.org/10.1111/j.1365-3040.2007.01690.x, 2007.
Kimball, B. A., Mauney, J. R., Nakayama, F. S. I., and Idso, S. B.: Effects of increasing atmospheric CO2 on vegetation, Vegetatio, 104/105, 65–75, 1993.
Klein, T., Bader, M. K. F., Leuzinger, S., Mildner, M., Schleppi, P., Siegwolf, R. T. W., and Körner, C.: Growth and carbon relations of mature Picea abies trees under 5 years of free-air CO2 enrichment, edited by: Lines, E., J. Ecol., 104, 1720–1733, https://doi.org/10.1111/1365-2745.12621, 2016.
Körner, C., Asshoff, R., Bignucolo, O., Hattenschwiler, S., Keel, S. G., Pelaez-Riedl, S., Pepin, S., Siegwolf, R. T. W., and Zotz, G.: Carbon flux and growth in mature deciduous forest trees exposed to elevated CO2, Science, 309, 1360–1362, 2005.
Kumarathunge, D. P., Medlyn, B. E., Drake, J. E., Tjoelker, M. G., Aspinwall, M. J., Battaglia, M., Cano, F. J., Carter, K. R., Cavaleri, M. A., Cernusak, L. A., Chambers, J. Q., Crous, K. Y., De Kauwe, M. G., Dillaway, D. N., Dreyer, E., Ellsworth, D. S., Ghannoum, O., Han, Q., Hikosaka, K., Jensen, A. M., Kelly, J. W. G., Kruger, E. L., Mercado, L. M., Onoda, Y., Reich, P. B., Rogers, A., Slot, M., Smith, N. G., Tarvainen, L., Tissue, D. T., Togashi, H. F., Tribuzy, E. S., Uddling, J., Vårhammar, A., Wallin, G., Warren, J. M., and Way, D. A.: Acclimation and adaptation components of the temperature dependence of plant photosynthesis at the global scale, New Phytol., 222, 768–784, https://doi.org/10.1111/nph.15668, 2019.
Le Quéré, C., Andrew, R. M., Friedlingstein, P., Sitch, S., Pongratz, J., Manning, A. C., Korsbakken, J. I., Peters, G. P., Canadell, J. G., Jackson, R. B., Boden, T. A., Tans, P. P., Andrews, O. D., Arora, V. K., Bakker, D. C. E., Barbero, L., Becker, M., Betts, R. A., Bopp, L., Chevallier, F., Chini, L. P., Ciais, P., Cosca, C. E., Cross, J., Currie, K., Gasser, T., Harris, I., Hauck, J., Haverd, V., Houghton, R. A., Hunt, C. W., Hurtt, G., Ilyina, T., Jain, A. K., Kato, E., Kautz, M., Keeling, R. F., Klein Goldewijk, K., Körtzinger, A., Landschützer, P., Lefèvre, N., Lenton, A., Lienert, S., Lima, I., Lombardozzi, D., Metzl, N., Millero, F., Monteiro, P. M. S., Munro, D. R., Nabel, J. E. M. S., Nakaoka, S., Nojiri, Y., Padin, X. A., Peregon, A., Pfeil, B., Pierrot, D., Poulter, B., Rehder, G., Reimer, J., Rödenbeck, C., Schwinger, J., Séférian, R., Skjelvan, I., Stocker, B. D., Tian, H., Tilbrook, B., Tubiello, F. N., van der Laan-Luijkx, I. T., van der Werf, G. R., van Heuven, S., Viovy, N., Vuichard, N., Walker, A. P., Watson, A. J., Wiltshire, A. J., Zaehle, S., and Zhu, D.: Global Carbon Budget 2017, Earth Syst. Sci. Data, 10, 405–448, https://doi.org/10.5194/essd-10-405-2018, 2018.
Lewis, J. D., McKane, R. B., Tingey, D. T., and Beedlow, P. A.: Vertical gradients in photosynthetic light response within an old-growth Douglas-fir and western hemlock canopy, Tree Physiol., 20, 447–456, https://doi.org/10.1093/treephys/20.7.447, 2000.
Long, S. P., Ainsworth, E. A., Rogers, A., and Ort, D. R.: Rising atmospheric carbon dioxide: Plants FACE the Future, Annu. Rev. Plant Biol., 55, 591–628, https://doi.org/10.1146/annurev.arplant.55.031903.141610, 2004.
Luo, Y., Medlyn, B., Hui, D., Ellsworth, D., Reynolds, J., and Katul, G.: Gross primary productivity in duke forest: Modeling synthesis of CO2 experiment and eddy-flux data, Ecol. Appl., 11, 239–252, https://doi.org/10.2307/3061070, 2001.
Medlyn, B., Badeck, F.-W., De Pury, D., Barton, C., Broadmeadow, M., Ceulemans, R., De Angelis, P., Forstreuter, M., Jach, M., Kellomäki, S., Laitat, E., Marek, M., Philippot, S., Rey, A., Strassemeyer, J., Laitinen, K., Liozon, R., Portier, B., Robertntz, P., Wang, K., and Jarvis, P.: Effects of elevated [CO2] on photosynthesis in European forest species: a meta-analysis of model parameters, Plant Cell Environ., 22, 1475–1495, 1999.
Medlyn, B. E.: Interactive effects of atmospheric carbon dioxide and leaf nitrogen concentration on canopy light use efficiency: A modeling analysis, Tree Physiol., 16, 201–209, https://doi.org/10.1093/treephys/16.1-2.201, 1996.
Medlyn, B. E., Dreyer, E., Ellsworth, D., Forstreuter, M., Harley, P. C., Kirschbaum, M. U. F., Le Roux, X., Montpied, P., Strassemeyer, J., Walcroft, A., Wang, K., and Loustau, D.: Temperature response of parameters of a biochemically based model of photosynthesis, II. A review of experimental data, Plant Cell Environ., 25, 1167–1179, https://doi.org/10.1046/j.1365-3040.2002.00891.x, 2002.
Medlyn, B. E., Duursma, R. A., Eamus, D., Ellsworth, D. S., Prentice, I. C., Barton, C. V. M., Crous, K. Y., De Angelis, P., Freeman, M., and Wingate, L.: Reconciling the optimal and empirical approaches to modelling stomatal conductance, Glob. Change Biol., 17, 2134–2144, https://doi.org/10.1111/j.1365-2486.2010.02375.x, 2011.
Medlyn, B. E., Zaehle, S., De Kauwe, M. G., Walker, A. P., Dietze, M. C., Hanson, P. J., Hickler, T., Jain, A. K., Luo, Y., Parton, W., Prentice, I. C., Thornton, P. E., Wang, S., Wang, Y. P., Weng, E., Iversen, C. M., Mccarthy, H. R., Warren, J. M., Oren, R., and Norby, R. J.: Using ecosystem experiments to improve vegetation models, Nat. Clim. Change, 5, 528–534, https://doi.org/10.1038/nclimate2621, 2015.
Medlyn, B. E., De Kauwe, M. G., Zaehle, S., Walker, A. P., Duursma, R. A., Luus, K., Mishurov, M., Pak, B., Smith, B., Wang, Y. P., Yang, X., Crous, K. Y., Drake, J. E., Gimeno, T. E., Macdonald, C. A., Norby, R. J., Power, S. A., Tjoelker, M. G., and Ellsworth, D. S.: Using models to guide field experiments: a priori predictions for the CO2 response of a nutrient- and water-limited native Eucalypt woodland, Glob. Change Biol., 22, 2834–2851, https://doi.org/10.1111/gcb.13268, 2016.
Morison, J. I. L.: Sensitivity of stomata and water use efficiency to high CO2, Plant Cell Environ., 8, 467–474, 1985.
Norby, R. J., DeLucia, E. H., Gielen, B., Calfapietra, C., Giardina, C. P., King, J. S., Ledford, J., McCarthy, H. R., Moore, D. J. P., Ceulemans, R., De Angelis, P., Finzi, A. C., Karnosky, D. F., Kubiske, M. E., Lukac, M., Pregitzer, K. S., Scarascia-Mugnozza, G. E., Schlesinger, W. H., and Oren, R.: Forest response to elevated CO2 is conserved across a broad range of productivity, P. Natl. Acad. Sci. USA, 102, 18052–18056, https://doi.org/10.1073/pnas.0509478102, 2005.
Ögren, E.: Convexity of the Photosynthetic Light-Response Curve in Relation to Intensity and Direction of Light during Growth, Plant Physiol., 101, 1013–1019, 1993.
Pan, Y., Birdsey, R. A., Fang, J., Houghton, R., Kauppi, P. E., Kurz, W. A., Phillips, O. L., Shvidenko, A., Lewis, S. L., Canadell, J. G., Ciais, P., Jackson, R. B., Pacala, S. W., McGuire, A. D., Piao, S., Rautiainen, A., Sitch, S., and Hayes, D.: A large and persistent carbon sink in the world's forests, Science, 333, 988–993, https://doi.org/10.1126/science.1201609, 2011.
Peñuelas, J., Canadell, J. G., and Ogaya, R.: Increased water-use efficiency during the 20th century did not translate into enhanced tree growth, Glob. Ecol. Biogeogr., 20, 597–608, https://doi.org/10.1111/j.1466-8238.2010.00608.x, 2011.
Renchon, A. A., Griebel, A., Metzen, D., Williams, C. A., Medlyn, B., Duursma, R. A., Barton, C. V. M., Maier, C., Boer, M. M., Isaac, P., Tissue, D., Resco De DIos, V., and Pendall, E.: Upside-down fluxes Down Under: CO2net sink in winter and net source in summer in a temperate evergreen broadleaf forest, Biogeosciences, 15, 3703–3716, https://doi.org/10.5194/bg-15-3703-2018, 2018.
Rogers, A., Medlyn, B. E., Dukes, J. S., Bonan, G., von Caemmerer, S., Dietze, M. C., Kattge, J., Leakey, A. D. B., Mercado, L. M., Niinemets, ??lo, Prentice, I. C., Serbin, S. P., Sitch, S., Way, D. A., and Zaehle, S.: A roadmap for improving the representation of photosynthesis in Earth system models, New Phytol., 213, 22–42, https://doi.org/10.1111/nph.14283, 2017.
Saxe, H., Ellsworth, D. S., and Heath, J.: Tree and forest functioning in an enriched CO2 atmosphere, New Phytol., 139, 395–436, https://doi.org/10.1046/j.1469-8137.1998.00221.x, 1998.
Sigurdsson, B. D., Medhurst, J. L., Wallin, G., Eggertsson, O., and Linder, S.: Growth of mature boreal Norway spruce was not affected by elevated [CO2] and/or air temperature unless nutrient availability was improved, Tree Physiol., 33, 1192–1205, https://doi.org/10.1093/treephys/tpt043, 2013.
Silva, L. C. R. and Anand, M.: Probing for the influence of atmospheric CO2 and climate change on forest ecosystems across biomes, Glob. Ecol. Biogeogr., 22, 83–92, https://doi.org/10.1111/j.1466-8238.2012.00783.x, 2013.
Valladares, F., Allen, M. T., and Pearcy, R. W.: Photosynthetic responses to dynamic light under field conditions in six tropical rainforest shrubs occurring along a light gradient, Oecologia, 111, 505–514, https://doi.org/10.1007/s004420050264, 1997.
van der Sleen, P., Groenendijk, P., Vlam, M., Anten, N. P. R., Boom, A., Bongers, F., Pons, T. L., Terburg, G., and Zuidema, P. A.: No growth stimulation of tropical trees by 150 years of CO2 fertilization but water-use efficiency increased, Nat. Geosci., 8, 24–28, https://doi.org/10.1038/ngeo2313, 2015.
Walker, A. P., De Kauwe, M. G., Medlyn, B. E., Zaehle, S., Iversen, C. M., Asao, S., Guenet, B., Harper, A., Hickler, T., Hungate, B. A., Jain, A. K., Luo, Y., Lu, X., Lu, M., Luus, K., Megonigal, J. P., Oren, R., Ryan, E., Shu, S., Talhelm, A., Wang, Y.-P., Warren, J. M., Werner, C., Xia, J., Yang, B., Zak, D. R., and Norby, R. J.: Decadal biomass increment in early secondary succession woody ecosystems is increased by CO2 enrichment, Nat. Commun., 10, 454, https://doi.org/10.1038/s41467-019-08348-1, 2019.
Wang, Y. P., Rey, A., and Jarvis, P. G.: Carbon balance of young birch trees grown in ambient and elevated atmospheric CO2 concentrations, Glob. Change Biol., 4, 797–807, https://doi.org/10.1046/j.1365-2486.1998.00170.x, 1998.
Wujeska-Klause, A., Crous, K. Y., Ghannoum, O., and Ellsworth, D. S.: Lower photorespiration in elevated CO2 reduces leaf N concentrations in mature Eucalyptus trees in the field, Glob. Change Biol., 25, 1282–1295, https://doi.org/10.1111/gcb.14555, 2019.
Wullschleger, S. D.: Biochemical Limitations to Carbon Assimilation in C3 Plants – A Retrospective Analysis of the A/Ci Curves from 109 Species, J. Exp. Bot., 44, 907–920, https://doi.org/10.1093/jxb/44.5.907, 1993.
Yang, J.: MAESPA_EUCFACE_PARAM: Low sensitivity of gross primary production to elevated CO2 in a mature eucalypt woodland, https://doi.org/10.5281/zenodo.3610698, 2019.
Yang, Y., Guan, H., Batelaan, O., McVicar, T. R., Long, D., Piao, S., Liang, W., Liu, B., Jin, Z., and Simmons, C. T.: Contrasting responses of water use efficiency to drought across global terrestrial ecosystems, Sci. Rep., 6, 23284, https://doi.org/10.1038/srep23284, 2016.
Yang, J., Duursma, R. A., De Kauwe, M. G., Kumarathunge, D., Jiang, M., Mahmud, K., Gimeno, T. E., Crous, K. Y., Ellsworth, D. S., Peters, J., Choat, B., Eamus, D., and Medlyn, B. E.: Incorporating non-stomatal limitation improves the performance of leaf and canopy models at high vapour pressure deficit, Tree Physiol., 1–14, 2019.
Zaehle, S., Medlyn, B. E., De Kauwe, M. G., Walker, A. P., Dietze, M. C., Hickler, T., Luo, Y., Wang, Y. P., El-Masri, B., Thornton, P., Jain, A., Wang, S., Warlind, D., Weng, E., Parton, W., Iversen, C. M., Gallet-Budynek, A., Mccarthy, H., Finzi, A., Hanson, P. J., Prentice, I. C., Oren, R., and Norby, R. J.: Evaluation of 11 terrestrial carbon-nitrogen cycle models against observations from two temperate Free-Air CO2 Enrichment studies, New Phytol., 202, 803–822, https://doi.org/10.1111/nph.12697, 2014.
Zhu, Z., Piao, S., Myneni, R. B., Huang, M., Zeng, Z., Canadell, J. G., Ciais, P., Sitch, S., Friedlingstein, P., Arneth, A., Liu, R., Mao, J., Pan, Y., Peng, S., Peñuelas, J., and Poulter, B.: Greening of the Earth and its drivers, Nat. Clim. Change, 6, 791–795, https://doi.org/10.1038/NCLIMATE3004, 2016.