the Creative Commons Attribution 4.0 License.
the Creative Commons Attribution 4.0 License.
 | 16 Jul 2020
Wide discrepancies in the magnitude and direction of modeled solar-induced chlorophyll fluorescence in response to light conditions
Nicholas C. Parazoo
Troy Magney
Alex Norton
Brett Raczka
Cédric Bacour
Fabienne Maignan
Ian Baker
Yongguang Zhang
Bo Qiu
Mingjie Shi
Natasha MacBean
Dave R. Bowling
Sean P. Burns
Peter D. Blanken
Jochen Stutz
Katja Grossmann
Christian Frankenberg
Recent successes in passive remote sensing of far-red solar-induced chlorophyll fluorescence (SIF) have spurred the development and integration of canopy-level fluorescence models in global terrestrial biosphere models (TBMs) for climate and carbon cycle research. The interaction of fluorescence with photochemistry at the leaf and canopy scales provides opportunities to diagnose and constrain model simulations of photosynthesis and related processes, through direct comparison to and assimilation of tower, airborne, and satellite data. TBMs describe key processes related to the absorption of sunlight, leaf-level fluorescence emission, scattering, and reabsorption throughout the canopy. Here, we analyze simulations from an ensemble of process-based TBM–SIF models (SiB3 – Simple Biosphere Model, SiB4, CLM4.5 – Community Land Model, CLM5.0, BETHY – Biosphere Energy Transfer Hydrology, ORCHIDEE – Organizing Carbon and Hydrology In Dynamic Ecosystems, and BEPS – Boreal Ecosystems Productivity Simulator) and the SCOPE (Soil Canopy Observation Photosynthesis Energy) canopy radiation and vegetation model at a subalpine evergreen needleleaf forest near Niwot Ridge, Colorado. These models are forced with local meteorology and analyzed against tower-based continuous far-red SIF and gross-primary-productivity-partitioned (GPP) eddy covariance data at diurnal and synoptic scales during the growing season (July–August 2017). Our primary objective is to summarize the site-level state of the art in TBM–SIF modeling over a relatively short time period (summer) when light, canopy structure, and pigments are similar, setting the stage for regional- to global-scale analyses. We find that these models are generally well constrained in simulating photosynthetic yield but show strongly divergent patterns in the simulation of absorbed photosynthetic active radiation (PAR), absolute GPP and fluorescence, quantum yields, and light response at the leaf and canopy scales. This study highlights the need for mechanistic modeling of nonphotochemical quenching in stressed and unstressed environments and improved the representation of light absorption (APAR), distribution of light across sunlit and shaded leaves, and radiative transfer from the leaf to the canopy scale.
- Article
(5025 KB) - Full-text XML
-
Supplement
(733 KB) - BibTeX
- EndNote


Our ability to estimate and measure photosynthesis beyond the leaf scale is extremely limited. This inhibits the ability to evaluate the performance of terrestrial biosphere models (TBMs) that are designed to quantify the direct impact and feedbacks of the carbon cycle with climate change. Consequently, there are substantial uncertainties in estimating the gross primary production (GPP) response to environmental changes and carbon–climate feedback (Friedlingstein et al., 2014). The global, multiscale remote sensing of solar-induced fluorescence (SIF) may represent a major breakthrough in alleviating this deficiency (Mohammed et al., 2019). Spaceborne data indicate a linear relationship between SIF and GPP at large spatial (kilometer) and temporal (biweekly) scales (e.g., Sun et al., 2017) for several ecosystems, while theoretical models and ground-based measurements indicate a more nonlinear relationship at the leaf and canopy scales (Zhang et al., 2016; Gu et al., 2019a; van der Tol et al., 2014; Magney et al., 2017, 2019a).
Chlorophyll fluorescence is re-emitted energy produced during the photosynthetic light reactions, in which a small fraction (roughly 2 %) of photosynthetic active radiation (PAR) absorbed by chlorophyll is re-emitted at longer wavelengths (650–850 nm) as fluorescence. In ambient conditions, the emission of SIF represents a byproduct of two primary de-excitation pathways, photochemical (PQ) and nonphotochemical (NPQ) quenching. Plants have evolved these regulatory mechanisms to prevent damage to photosynthetic machinery when the amount of absorbed radiation is greater than that which can be used to drive photochemistry. Chlorophyll fluorescence responds dynamically to changes in photochemistry and NPQ from instantaneous to hourly, daily, and seasonal timescales, as a function of changing environmental conditions and plant structural properties (Porcar-Castell et al., 2014; Demmig-Adams et al., 2012). SIF is fundamentally different than steady-state fluorescence yield typically measured at the leaf scale, as it is sensitive to both changes in photochemistry as well as absorbed PAR (APAR; related to incident light, canopy structure, and biochemical content). The response of canopy SIF to APAR is well documented in deciduous and evergreen forests and cropping ecosystems (Yang et al., 2018; Badgley et al., 2017; Miao et al., 2018; Magney et al., 2019b; Li et al., 2020). More recently, Magney et al. (2019b) showed that seasonal changes in canopy SIF for cold-climate evergreen systems is influenced by changes in needle physiology and photoprotective pigments (Magney et al., 2019b).
To properly account for these factors, process-based SIF models must represent these underlying nonlinear biophysical and chemical processes. Several modeling groups have adapted TBMs to incorporate various SIF formalisms for the purpose of model evaluation, data assimilation, and improved model prediction (Lee et al., 2015; Koffi et al., 2015; Thum et al., 2017; Norton et al., 2019; Bacour et al., 2019; Raczka et al., 2019). With these goals in mind, TBM–SIF modeling requires two important steps: (1) a representation of SIF at the leaf scale that accounts for NPQ and photochemistry and (2) the canopy radiative transfer of SIF, which enables a comparison to large field-of-view observations (e.g., tower and satellites). The second step involves accounting for radiative transfer within the canopy and has typically relied on incorporating the Soil Canopy Observation Photosynthesis Energy model (SCOPE; van der Tol et al., 2009, 2014), which simulates chlorophyll fluorescence as a function of biophysics, canopy structure, environmental conditions, and sun-sensor geometries. This approach has been adopted by TBMs in various ways using different assumptions for fluorescence modeling and radiative transfer, as will be discussed in Sect. 2.
Typically, measuring chlorophyll fluorescence and competing pathways (PQ and NPQ) has been done at the leaf scale via pulse-amplitude modulation (PAM) fluorescence (Schreiber et al., 1986). Recently, commercially available spectrometers have made it possible to measure SIF directly in the field at the leaf and canopy scales and also enable the study of structural, environmental, and directional controls (Cogliati et al., 2015; Daumard et al. 2010; Migliavacca et al. 2017; Yang et al. 2015; Grossman et al., 2018; Aasen et al., 2019; Gu et al., 2019b; Zhang et al., 2019). The use of field-deployable instruments on eddy covariance towers has increased rapidly since 2014, providing coverage of multiple vegetation types across various climates around the world (Yang et al., 2018; Magney et al., 2019a,b; Parazoo et al., 2019). These data enable an improved understanding of the relationship between SIF, GPP, APAR, and environmental effects at canopy scales. Novel tower-mounted spectrometer systems such as Fluospec2 (Yang et al., 2018), PhotoSpec (Grossman et al., 2018), and FloX (fluorescence box; e.g., Julitta et al., 2017; Shan et al., 2019) have made it possible to monitor canopy SIF continuously in the field with high precision over multiple years, providing opportunities for a more direct comparison and evaluation of satellite data (Grossman et al., 2018; Yang et al., 2015, 2018; Wohlfahrt et al., 2018; Magney et al., 2019b). PhotoSpec offers the additional benefits (and challenge) of (a) a precise field of view capable of resolving leaf-level SIF and (b) canopy scanning at azimuth and elevation angles. These features enable SIF integration from the leaf to the canopy scale and the interpretation of directional variations of the emitted radiance.
Canopy-scanning spectrometers such as PhotoSpec thus provide an opportunity to understand the physical processes that lead to a breakdown of SIF–GPP linearity at the leaf to the canopy scale (or conversely, emergence of linearity at an increasing scale) and for the detailed evaluation and diagnosis of TBM performance. This study provides a preliminary benchmarking site-level assessment for simulations of SIF within a TBM framework and across an ensemble of TBMs, with the primary purpose being an initial investigation into the response of modeled SIF and GPP to light during peak summer. We leverage the continuous measurements of SIF and GPP at the Niwot Ridge US-NR1 AmeriFlux flux tower in Colorado from June to July 2017 (Magney et al., 2019b) and simulations of canopy radiative transfer, photosynthesis, and fluorescence from a stand-alone version of SCOPE to (1) benchmark TBM–SIF modeling, (2) evaluate the sensitivity to underlying processes and scaling techniques, (3) identify the strengths and weaknesses in current modeling strategies, and (4) recommend strategies for models and observations.
The paper is organized as follows: Sect. 2 describes SCOPE and the seven TBM–SIF models (SiB3 – Simple Biosphere Model, SiB4, ORCHIDEE – Organizing Carbon and Hydrology In Dynamic Ecosystems, BEPS – Boreal Ecosystems Productivity Simulator, BETHY – Biosphere Energy Transfer Hydrology, CLM4.5 – Community Land Model, and CLM5) which have recently been published or are in review and provides more details on site-level benchmarking observations. Section 3 summarizes results comparing modeled and predicted SIF and GPP at hourly and daily scales as they relate to absorbed light, GPP and SIF yields, and quantum yields. Section 4 discusses results in more detail, including the attribution of SIF magnitude and temporal phasing biases and sensitivities to absorbed light and areas for improvement.
2.1 Site in Niwot Ridge, Colorado
Our study focuses on an AmeriFlux (https://ameriflux.lbl.gov/) site in Niwot Ridge, Colorado, USA (US-NR1), where a tower-based eddy covariance system has been continuously measuring the net ecosystem exchange of carbon dioxide (NEE) over a high-elevation subalpine forest since 1999 and a spectrometer system has been continuously monitoring SIF since June 2017 (Grossman et al., 2018; Magney et al., 2019b). The 26 m tall tower is located in a high-elevation forest (3050 ) located in the Rocky Mountains of Colorado (Burns et al., 2015; Hu et al., 2010; Monson et al., 2002) and consists primarily of the evergreen species of lodgepole pine (Pinus contorta), Engelmann spruce (Picea engelmannii), and subalpine fir (Abies lasiocarpa). The mean annual temperature is 1.5 ∘C, and mean annual precipitation is 800 mm (65 % as snow). The forest is roughly 120 years old with a mean canopy height of 11.5 m and a leaf area index of 4.2 m2 m−2. More site-specific details can be found in Burns et al. (2015).
At Niwot Ridge, interannual variations in GPP are closely linked to winter snowfall amount, which typically melts by early June, and summer precipitation, characterized by afternoon convective thunderstorms triggered by upslope flow (Burns et al., 2015; Albert et al., 2017) and climatological peak precipitation around 14:00 LT (Fig. 1a). We note that our study period of July–August 2017 is unusual for NR1 (relative to the 2015–2018 mean) in its bimodal distribution of diurnal precipitation (morning and afternoon peaks), lower-than-normal afternoon precipitation, cooler temperatures, and reduced vapor pressure deficit (Fig. 1a–c). The early morning peak is due to a strong storm system that moved through from 22 to 24 July (Fig. 1e) and does not show up when these days are removed. This period also shows a decrease in incoming shortwave radiation relative to climatology despite lower precipitation (Fig. 1d). We note that a second storm passed through in early August. The combination of these two storms produced net decreases in air temperature (Fig. 1f), vapor pressure deficit (Fig. 1g), and sunlight (Fig. 1h) over a 2-week period from late July to early August.
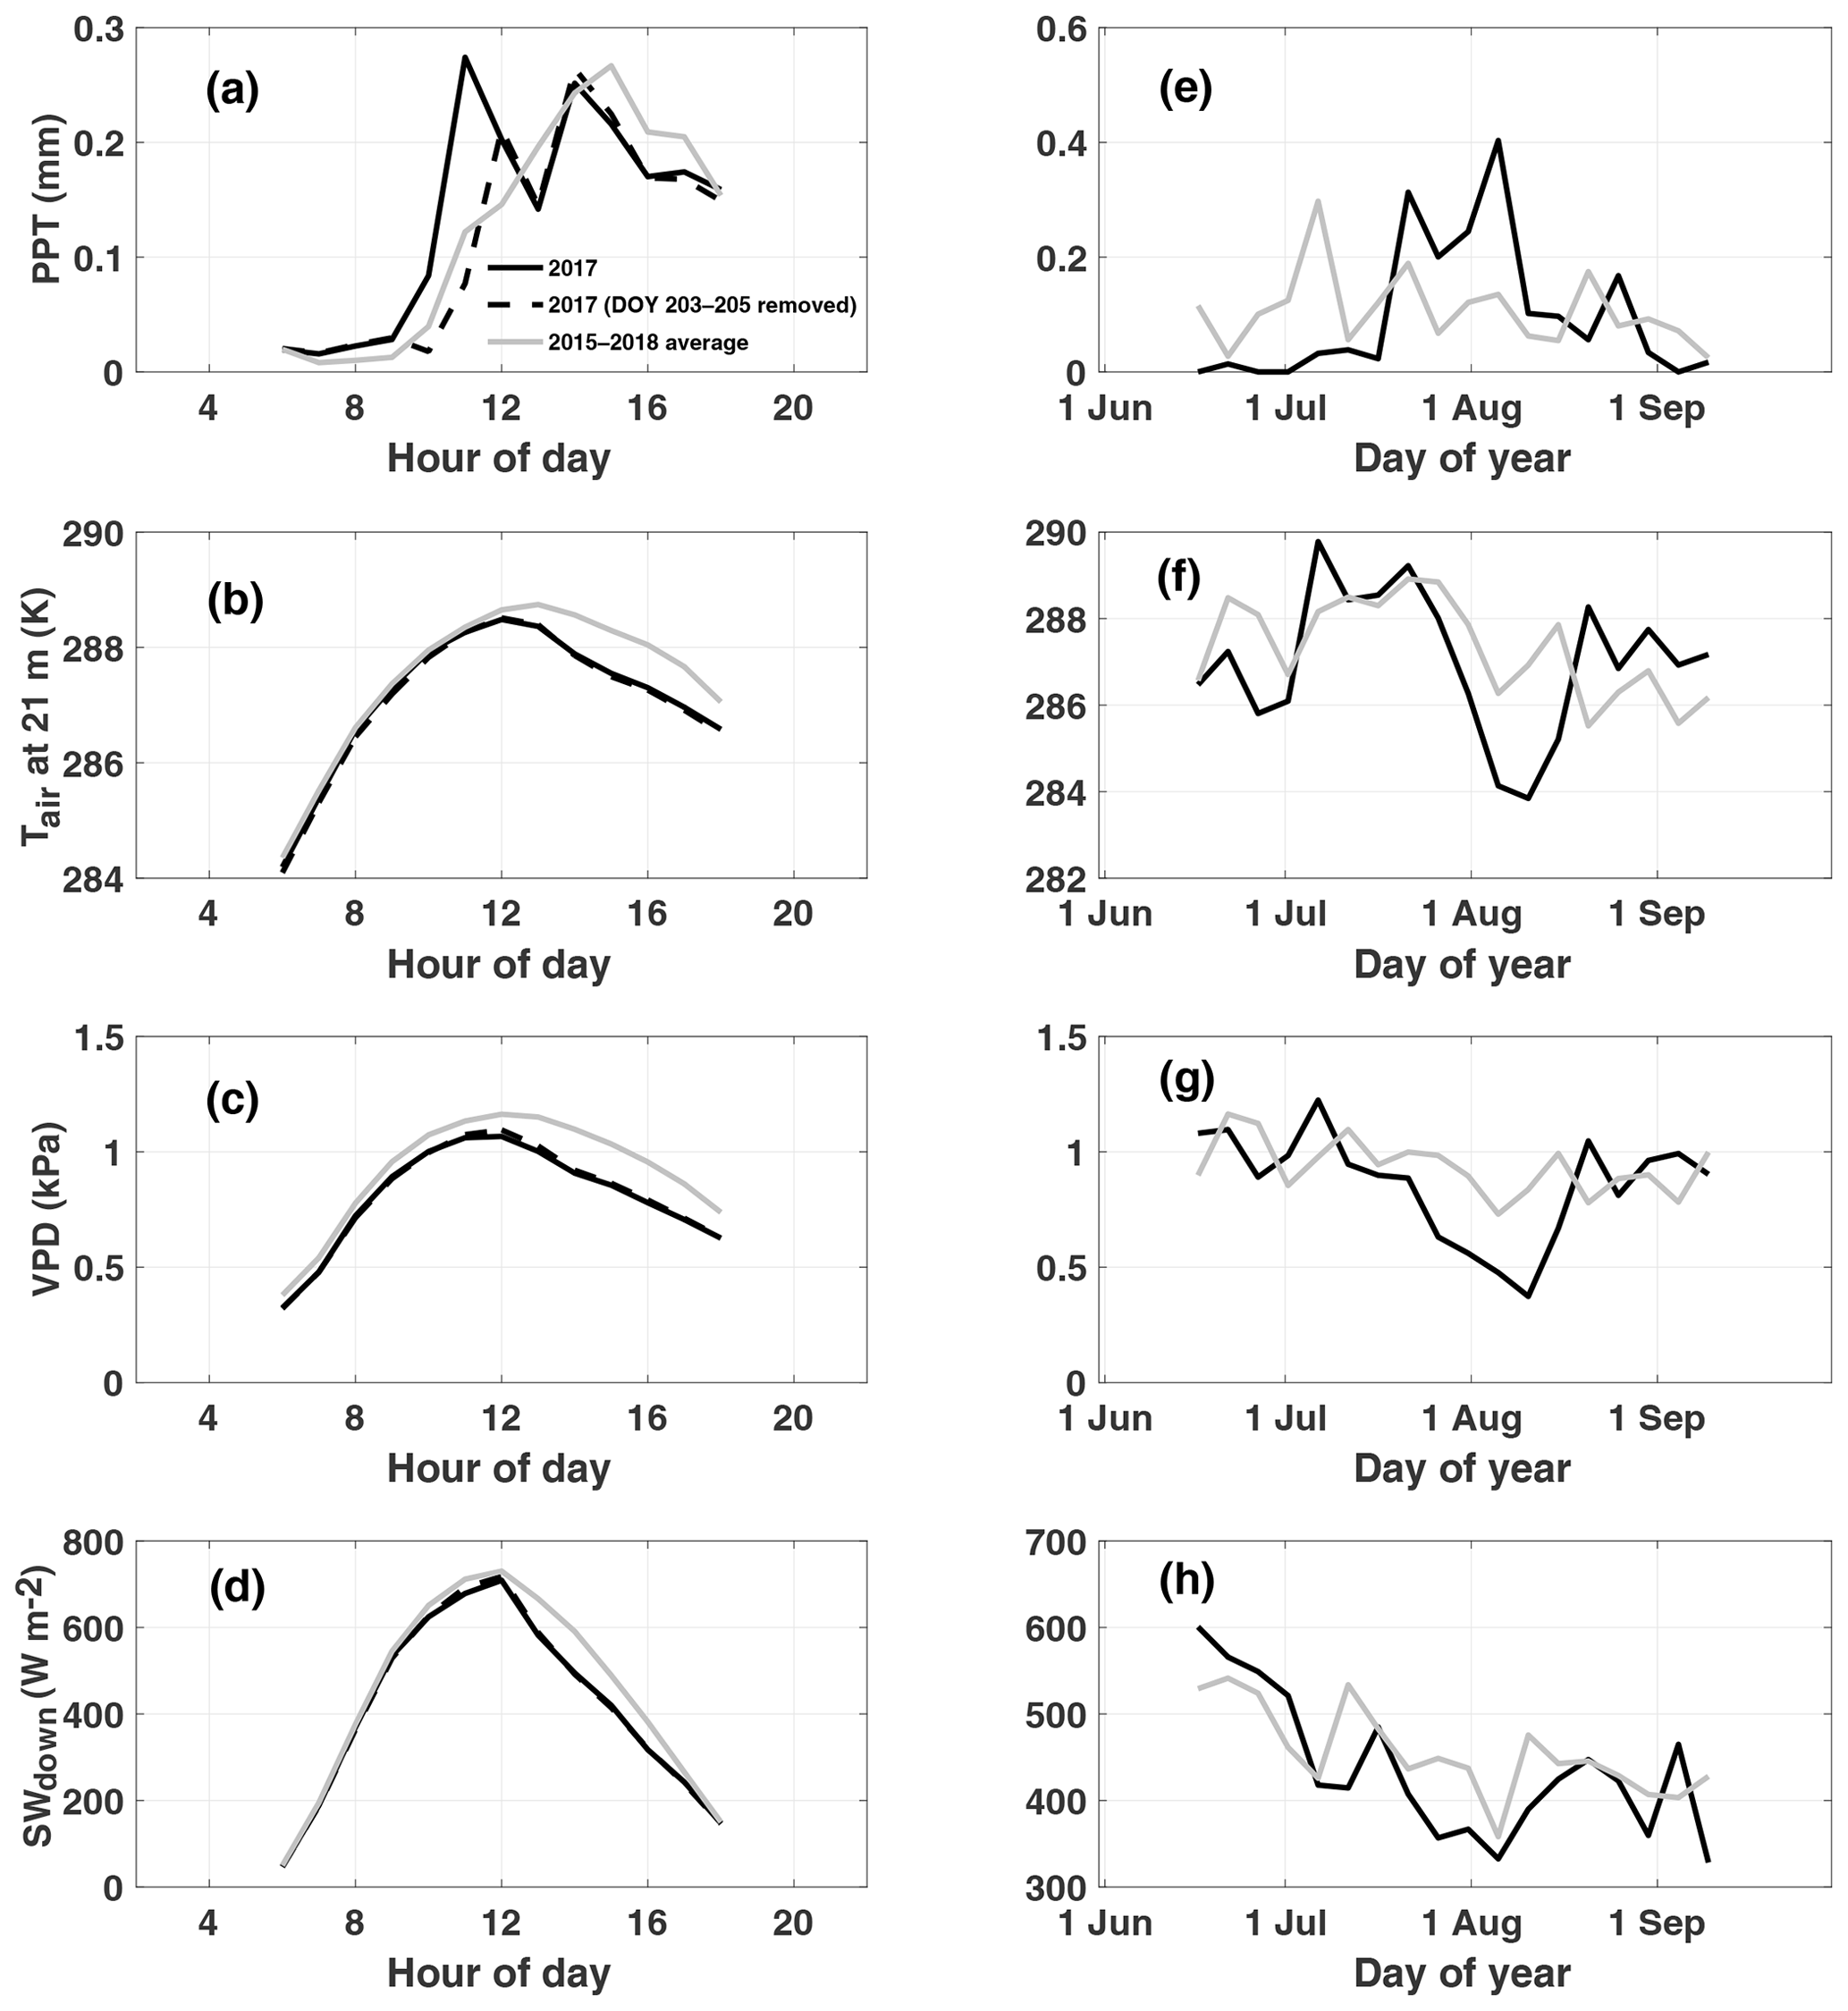
Figure 1Observed diurnal (a–d) and synoptic (e–h) precipitation (PPT), air temperature at 21 m (Tair), vapor pressure deficit (VPD), and downwelling shortwave (SWdown) radiation. Diurnal cycles are averaged over July–August 2017. Synoptic cycles are plotted as 5 d averages from 15 June to 15 September. Data from 2017 are shown in black, and climatology (2015–2018) is shown in grey. Typically, peak rainfall occurs in the afternoon at this site (a). A substantial rain event which occurred from DOY (day of year) 203 to 205 is removed from the 2017 average to show the impact on diurnal variability and to demonstrate the dominance of the afternoon monsoon upon diurnal precipitation in summer.
2.2 Tower-based measurements: PAR, SIF, and CO2 flux
2.2.1 Absorbed PAR
The site is equipped with two main upward-facing PAR sensors. The first (LI-COR LI-190R), mounted on the PhotoSpec telescope unit, provides an independent measurement of direct and diffuse light and can be used to calibrate PhotoSpec (Grossman et al., 2018). The second (Apogee Instruments SQ-500-SS), mounted on the main flux tower, is part of a larger array of upward- and downward-oriented PAR sensors above and below the canopy used for the calculation of the fraction of PAR absorbed by the vegetation canopy (fAPAR). The two PAR sensors show a similar diurnal pattern during July–August 2017 (Fig. S1 in the Supplement), including an afternoon dip and relatively smaller values overall compared to 2018 (the only other year with available PAR for comparison).
Full-spectrum quantum sensors (Apogee Instruments SQ-500-SS) were new and factory-calibrated together just before installation. Above-canopy sensors (one upward- and one downward-facing) were mounted on the main flux tower, and below-canopy sensors (six upward- and six downward-facing) were mounted at the 2 m height above ground on shorter canopy-access towers. APAR was calculated for each pair of below-canopy sensors relative to above-canopy sensors for every half hour, then averaged among sensors over daylight hours to create a daytime average. We then estimate hourly APAR by multiplying hourly incoming PAR (measured and integrated from 400 to 700 nm) at the top of the canopy (PAR) by the daytime average of fAPAR. Figure S2 in the Supplement shows the mean diurnal cycle for July–August 2017 for each sensor and the across-sensor average, with APAR data collection beginning on 13 July 2017. We note that APAR measurements are only as representative as the distribution of PAR sensors beneath the canopy; while they are placed within the footprint of SIF (Sect. 2.2.3) and fetch of eddy covariance (Sect. 2.2.4) measurements, they cannot be a perfect representation of canopy APAR for each eddy covariance and SIF measurement.
2.2.2 Fluorescence parameters
We define and clarify three important quantities that define the relationship between absorbed light and emitted SIF at the leaf and canopy scales. ϕF is the quantum yield of fluorescence, representing the probability that an absorbed photon will be fluoresced. This quantity can be observed at the leaf level using PAM fluorimetry or calculated by models as a function of rate coefficients for energy transfer (Sect. 2.3.3). SIFyield is the canopy-emitted SIF per photon absorbed. The quantity is estimated from models and observations as the ratio of absolute canopy SIF to APAR (SIFcanopy / APAR). SIFyield is our best attempt to account for the effects of (a) canopy-absorbed light and (b) SIF reabsorption within the canopy on the canopy-integrated emission of SIF. However, factors such as observation angle, the fraction of sunlit and shaded canopy components, and the difference in footprint from APAR necessitate an additional diagnostic variable defined as relative SIF (SIFrel). SIFrel is emitted SIF per reflected radiance in the far-red spectrum where SIF retrievals occur (SIF/Reffr). This is useful because it normalizes for the exact amount of “illuminated” canopy components within the sensor field of view, whereas APAR measurements are integrated for the entire canopy.
These quantities represent different but equally important versions of reality. It is difficult for models to exactly reproduce the distribution and timing of sunlight in the canopy as observed by PhotoSpec. While SIFrel removes model-observation differences in illumination, it confounds our interpretation of the relationship with GPPyield, which is derived from APAR. As such, we provide both results to be comprehensive but note the temporal stability associated with SIFrel as the more physical interpretation of canopy yield for this short period of study.
2.2.3 Tower-based measurements of solar-induced chlorophyll fluorescence (SIF)
SIF data have been collected from a scanning spectrometer (PhotoSpec) installed at the AmeriFlux US-NR1 tall tower since 17 June 2017. PhotoSpec sits atop the tower at 26 m above the ground and roughly 15 m above the forest canopy top, transferring reflected sunlight and SIF data collected from the needleleaf canopy through a trifurcated optical cable to three spectrometers in a shed at the base of the tower. These spectrometers measure far-red fluorescence in the 745–758 nm retrieval window at high spectral resolution (full width at half maximum of 0.3 nm) and with a 0.7∘ field of view (FOV), resulting in a 20 cm diameter footprint at the nadir on top of the canopy. The far-red SIF data are then scaled to 740 nm for model intercomparison using the first principal component of the spectral shape in Magney et al. (2019a). PhotoSpec scans from the nadir to the horizon in 0.7∘ steps at two azimuth directions, with a time resolution of ∼ 20 s per measurement and complete scan time of 20 min. For this study, we aggregate scans across all azimuth and elevation angles into hourly canopy-level averages to benchmark model estimates of top-of-canopy (TOC) or canopy-averaged SIF (BETHY only; see Sect. 2.3.4) at diurnal and synoptic timescales. We refer the reader to Grossman et al. (2018) and Magney et al. (2019b) for further details regarding PhotoSpec, the implementation at US-NR1, and data filtering and to Magney et al. (2019c) regarding data access. We focus our model data analysis on the 2017 growing season (July–August 2017) to maximize the overlap between observations of SIF, GPP, and APAR.
Diurnal composites of PhotoSpec SIF in 2017 show a late-morning peak and afternoon dip (Fig. S3A in the Supplement). The afternoon dip is consistent with decreased incoming shortwave radiation, PAR and APAR (Figs. S1 and S2, respectively). However, we note the retrieved signal from PhotoSpec is also affected by (1) viewing geometry, (2) fraction of sunlit vs. shaded leaves (sunlit and shaded fraction, i.e., the quantity of needles illuminated by incident sunlight) due to self-shading within the canopy, and (3) direct and diffuse fraction due to cloud cover. Structural and bidirectional effects lead to different SIF emission patterns depending on view angles and scanning patterns (Yang and van der Tol, 2018). The viewing geometry of PhotoSpec (as implemented at NR1 in 2017) causes a higher fraction of illuminated vegetation in the morning, which leads to a 2 to 3 h offset in the timing of peak SIF (Fig. S3a) and incoming far-red reflected radiance within the retrieval window (Fig. S3b), from the peak zenith angle of the sun at noon (coinciding with the expected peak in PAR) to late morning. Normalizing SIF by far-red reflected radiance as relative SIF (SIFrel; Fig. S3c) and rescaling to SIF (Fig. S3d) shifts the peak back to noon and preserved the afternoon dip (albeit with reduced magnitude). SIFrel helps to account for factors 1–3 listed above because it accounts for the amount of reflected radiation in the field of view of PhotoSpec, which is impacted by canopy structure, sun angle, and direct and diffuse light. As discussed above, SIFrel is likely a better approximation of SIFyield because it normalizes for the exact amount of illuminated canopy components in each retrieval, whereas APAR integrates the entire canopy. As such, we expect SIFrel to have a strong seasonal change associated with the downregulation of photosynthesis and a more subtle diurnal change, as during midsummer the SIF signal is primarily driven by light intensity.
It is important to note that the PhotoSpec system is highly sensitive to the sunlit and shaded fraction in the canopy (factor 2) due to the narrow FOV of the PhotoSpec telescoping lens. Increased afternoon cloud cover during summer causes diurnal asymmetry in incident PAR (Fig. S1a). We examine this effect in more detail (Sect. 3) by analyzing SIF and GPP under clear and diffuse sky conditions using a threshold (0.5; top-of-canopy and top-of-atmosphere incoming shortwave radiation) similar to that used in Yang et al. (2017, 2018).
2.2.4 CO2 flux and GPP partitioning
NEE measurements are screened using ustar filtering, and partitioned into gross primary production (GPP) and terrestrial ecosystem respiration components using the so-called nighttime method which is based on the relationship between NEE during the nighttime (PAR < 50 ) and air temperature (Reichstein et al., 2005). Diurnal averages of GPP based on nighttime partitioning show similar diurnal structure to PAR and SIF including the afternoon dip and reduced overall magnitude compared to the 2015–2018 mean (Fig. S4 in the Supplement). Similar results are found using daytime light partitioning of NEE (Lasslop et al., 2010; Fig. S4), and thus only nighttime-partitioned GPP data are reported for the remainder of this study. All GPP estimates are processed as half-hourly means and are then gap-filled and averaged hourly. We note the tower location near the Continental Divide in the Rocky Mountains of Colorado presents slope flow challenges for eddy covariance during nighttime, but the relatively flat area of the tower reduces impact on daytime flux measurements (Burns et al., 2018). Details on the flux measurements, data processing, and quality control are provided in Burns et al. (2015).
2.3 Modeling approach
2.3.1 TBM–SIF overview
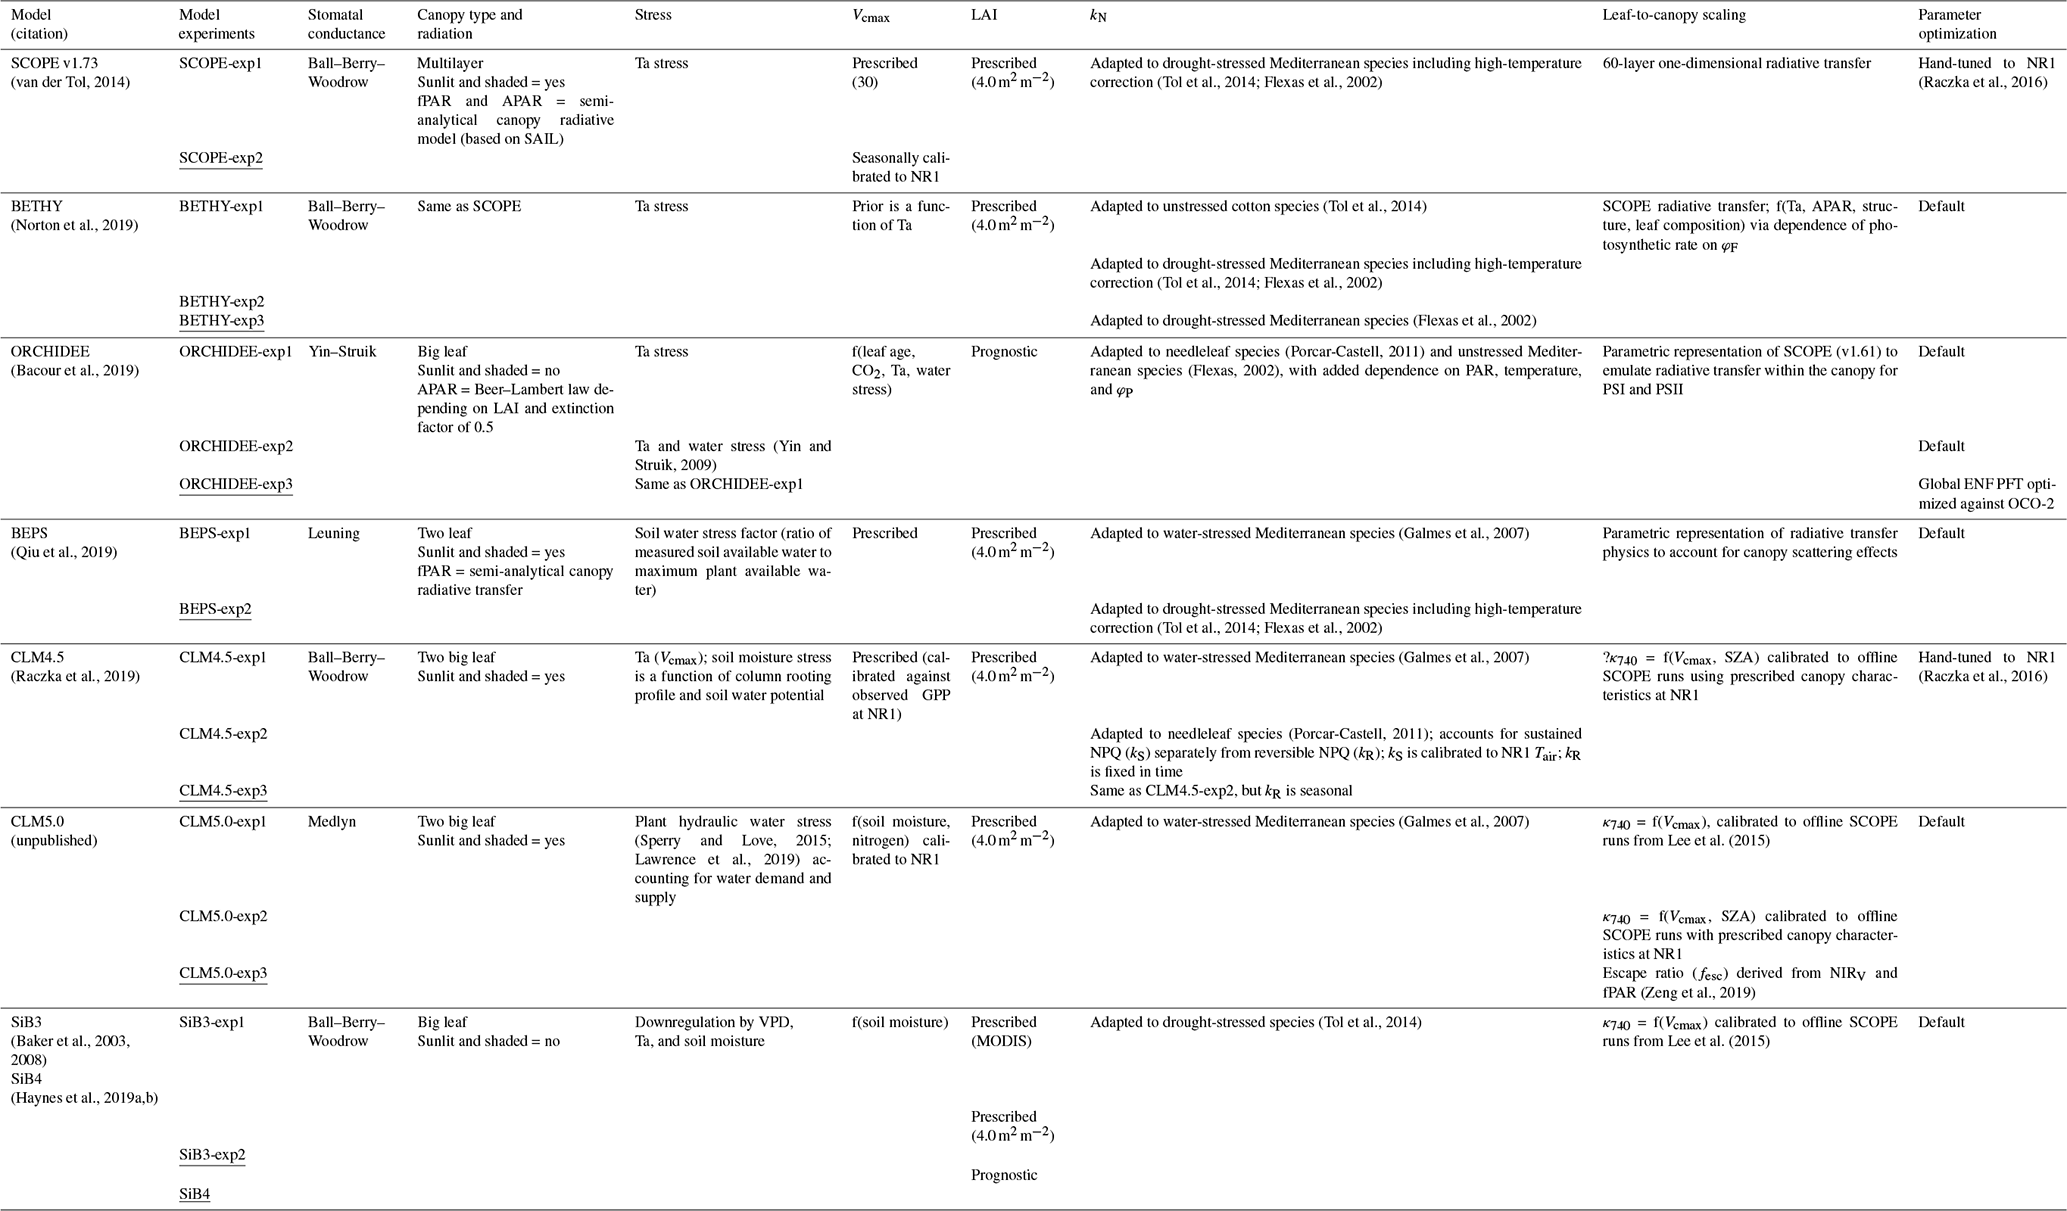
The parent TBMs are designed to simulate the exchanges of carbon, water, and energy between the biosphere and atmosphere, from global to local scales depending on inputs from meteorological forcing, soil texture, and plant functional type. The addition of a fluorescence model that simulates SIF enables a direct comparison to remotely sensed observations for benchmarking, process diagnostics, and parameter and state optimization (data fusion) for improved GPP estimation. The TBM–SIF models analyzed here differ in ways too numerous to discuss. We refer the reader to the appropriate references in Sect. 2.3.4 for more detailed model descriptions. Instead, we focus on key differences affecting the joint simulation of GPP and leaf- and canopy-level SIF at diurnal and synoptic scales, during the peak of summer. These differences, which are summarized in Table 1, include the representation of stomatal conductance (all use Ball–Berry–Woodrow except CLM5.0, BEPS, and ORCHIDEE), canopy absorption of incoming radiation (all account for sunlit and shaded radiation except ORCHIDEE, SiB3, and SiB4), limiting factors for photosynthesis (Vcmax – maximum rate of Rubisco carboxylase activity, LAI – leaf area index, radiation, and stress) and SIF (kN – rate coefficient for nonphotochemical quenching – and fluorescence photon reabsorption), scaling and radiative transfer methods for transferring leaf-level SIF simulations to the top of the canopy, and parameter optimization. Further details on (a) photosynthetic structural formulation and parameter choice, (b) the representation of leaf-level processes important to SIF (kN and ϕP), and (c) the leaf-to-canopy-scaling approach (SIFcanopy) are provided in Sect. 2.3.2 and 2.3.3.
Table 1Summary of TBM–SIF models and within-model experiments illustrating model components that may have led to differences in modeled SIF. These include a representation of stomatal conductance (column 3), canopy absorption of incoming radiation (column 4), limiting factors for photosynthesis (stress, Vcmax, and LAI; columns 5–7) and SIF (kN; column 8), leaf-to-canopy scaling of SIF (column 9), and parameter optimization (column 10). The underlined model experiment was used for model intercomparison. OCO-2: Orbiting Carbon Observatory 2. SZA: solar zenith angle. MODIS: Moderate Resolution Imaging Spectroradiometer. NIRV: near-infrared reflectance of vegetation. ENF: boreal needleleaf evergreen. PFT: plant functional type. fPAR: fraction of photosynthetically active radiation. SAIL: Scattering by Arbitrary Inclined Leaves.
2.3.2 Photosynthesis models
All TBM–SIF models in this paper used enzyme kinetic models to simulate leaf assimilation rate (gross photosynthesis) as limited by the efficiency of the photosynthetic enzyme system, the amount of PAR captured by leaf chlorophyll, and the capacity of leaves to utilize end products of photosynthesis (Farquhar et al., 1980; Collatz et al., 1991, 1992; Sellers et al., 1996). However, there are important differences in the representation of (a) stomatal conductance that couples carbon and water cycles and (b) limiting factors on carbon assimilation due to leaf physiology (maximum carboxylation capacity, Vcmax), radiation (APAR or fAPAR), canopy structure (LAI and leaf angle distribution), and stress (water supply and demand and temperature) that affect plant physiological processes and canopy radiative transfer. The underlying stomatal-conductance models in the TBMs analyzed here are represented by the Ball–Berry–Woodrow family of empirical models rooted in the leaf–gas exchange equation but with different representations of atmospheric demand (relative humidity or vapor pressure deficit), including the Ball–Berry–Woodrow model (Ball et al., 1987), the Leuning model (Leuning, 1995), the Yin–Stuik model (Yin and Struik, 2009), and the Medlyn model (Medlyn et al., 2011). These structural and parametric differences also influence calculated values such as the degree of light saturation (Sect. 2.3.3), which influence both the fluorescence and quantum yield as used by the fluorescence models. Differences in stomatal conductance, canopy type and radiation scheme, stress, Vcmax, and LAI are summarized in Table 1.
2.3.3 Fluorescence-modeling approach
Following the general approach described in Lee et al. (2015) and van der Tol et al. (2014), the flux of total leaf-level emitted fluorescence, SIFleaf, can be diagnosed using a light use efficiency framework analogous to the expression for photosynthesis (Monteith, 1972),
where PAR and fAPAR are defined in Sect. 2.2.1 but measured at the leaf level and ϕF is the quantum yield of fluorescence, representing the number of photons emitted by fluorescence per absorbed photon. We note that photosystems I and II (PS1 and PSII, respectively) contribute to leaf-level fluorescence, but only PSII is considered in models analyzed here (with the exception of ORCHIDEE and BETHY, Sect. 2.3.4.2). ϕF is estimated as follows:
where k represents the rate coefficients for the different pathways for the transfer of energy from excited chlorophyll (kF is fluorescence, kD is heat dissipation, and kN is nonphotochemical quenching – NPQ) and ϕP is the quantum yield of electron transport (see Sect. 2.3.2). kF is typically set to a constant value (0.05) in models following van der Tol et al. (2014). kD is also typically set to a constant value of 0.95 or temperature corrected in some cases (e.g., ORCHIDEE, CLM4.5, CLM5.0, and BETHY). kN has a substantial and variable impact on energy partitioning at diurnal and seasonal scales which varies as a function of light saturation (e.g., Raczka et al., 2019; Porcar-Castell, 2011). Once leaf-level emissions are known, an approach is needed to estimate the total TOC fluorescence flux (SIFcanopy) for comparison to PhotoSpec data. Fluorescence modeling at the leaf and canopy levels is described in more detail in Sect. 2.3.3.1 and 2.3.3.2 below.
Leaf-level SIF emission
The “quantum-yield” approach has been used in SIF models to characterize the fraction of photons that are used for PQ, NPQ, or re-emitted as fluorescence (van der Tol, 2014). It is important to note that this does not translate into the actual amount of SIF emission leaving the leaf but is used as an approximation. TBM–SIF models typically represent ϕP using lake model formalism, which assumes large connectivity between photosynthetic units (Genty et al., 1989; van der Tol et al., 2014). ϕP is expressed in terms of the degree of light saturation (x), derived from the native photosynthesis module of the parent TBM and represents the balance between actual and potential electron transport rates and the maximum photochemical yield under dark-acclimated conditions (ϕPmax), which is derived from the fluorescence model and defined in terms of rate coefficients in Eq. (2).
ϕN accounts for the ability of plants to dissipate excess energy as heat via NPQ through the regulation of xanthophyll cycle pigments (Demmig-Adams and Adams, 2006). NPQ can be represented as a sum of reversible (kR) and sustain (kS) components (). kR accounts for the relatively fast (diurnal), reversible NPQ response to light. kS accounts for the relatively slow (seasonal), sustained NPQ response to light and other environmental factors. With the exception of CLM4.5, models do not typically account for kS.
A significant challenge in fluorescence models is to find an appropriate relationship between kN and the degree of light saturation (x). The TBM–SIF models represent kN through an approach similar to the one used in SCOPE, which uses a parametric model of kN derived from PAM fluorometry measurements (van der Tol et al., 2014).
NPQ models can be classified as stressed (drought) and unstressed relative to water availability depending on the dataset from which empirical fits are derived. The unstressed model is ideal for irrigated systems such as crops, and the stressed model is more appropriate for water-limited ecosystems such as Niwot Ridge. We examine each of these models using drought and unstressed models from van der Tol (2014) and a drought-based model from Flexas et al. (2002). These models use different empirical fits but are otherwise identical. In general, kN increases more rapidly with APAR (light saturation) and ramps up to a higher level, in the drought-based model compared to the unstressed model. Additionally, some models provide unique improvements such as dependence on environmental conditions (e.g., water stress vs. no water stress in ORCHIDEE), and equations for reversible and sustained NPQ to represent the different timescales (minutes to seasonal) at which NPQ regulation occurs (e.g., CLM4.5), influenced by pigmentation changes in the leaf.
Leaf-to-canopy scaling
The TBM–SIF models produce leaf-level fluorescence which needs to be converted to canopy-level fluorescence (SIFcanopy) to be directly compared to PhotoSpec and satellite observations. Leaf-to-canopy-level conversion of SIF requires a representation of canopy radiative transfer, which in general is too computationally expensive to include within the TBMs in this study, that are designed for global-scale application. Therefore, most TBMs analyzed here account for canopy radiative transfer of SIF using some representation of SCOPE (van der Tol, 2009a, b). The most commonly used approach is to run independent simulations of SIF from SCOPE to create an empirical conversion factor (κ740) between the leaf- and canopy-level SIF that is a function of Vcmax (Lee et al., 2015). This conversion factor accounts for the integration over the fluorescence emission spectrum, observation angle, and unit conversion. Model variations of this empirical approach, as well additional approaches utilizing the full SCOPE model and a SCOPE emulator, are summarized below and in Table 1.
2.3.4 TBM–SIF models
Here we provide a brief description of individual TBM–SIF models and within-model experiments. We point out key differences in the modeling of photosynthesis, fluorescence, and leaf-to-canopy scaling. We note that within-model experiments, labeled as experiment 1 (exp1), experiment 2 (exp2), etc., represent an increasing order of realism rather than a specific set of conditions common across models. As such, experiment 1 in BETHY (BETHY-exp1) is not equivalent to experiment 1 in CLM4.5 (CLM4.5-exp1).
BETHY
The Biosphere Energy Transfer Hydrology (BETHY) model is the land surface component of the Carbon Cycle Data Assimilation System (CCDAS) developed to ingest a range of observational data for estimating terrestrial carbon fluxes at a global scale (Rayner et al., 2005; Kaminski et al., 2013; Koffi et al., 2012; Anav et al., 2015). Koffi et al. (2015) was the first to combine a process-based model of SIF with a global TBM. The native canopy radiative transfer and photosynthesis schemes of BETHY were effectively replaced with corresponding schemes and a fluorescence model from SCOPE (Koffi et al., 2015), thus enabling the spatially explicit simulation of GPP and SIF as a function of plant function type. This model was extended to include a module for prognostic leaf growth (Norton et al., 2018) and more recently adapted with a formal optimization algorithm for assimilating spaceborne SIF data (Norton et al., 2019). It has been updated for this study to accept hourly meteorological forcing. BETHY-SCOPE, denoted here as BETHY, remains the first and only global TBM–SIF model to simulate vertically integrated (one-dimensional) fluorescence radiative transfer and energy balance.
We include three experiments to examine the impact of calibrating the kN model against PAM fluorometry data to different species: (1) BETHY-exp1 is adapted to unstressed cotton species (van der Tol et al., 2014); (2) BETHY-exp2 is adapted to drought-stressed Mediterranean species (i.e., vineyard in a controlled environment subjected to drought) including higher temperature correction (Flexas et al., 2002; van der Tol et al., 2014); and (3) BETHY-exp3 is adapted to drought-stressed Mediterranean species (Flexas et al., 2002).
We further leverage SCOPE-enabled SIF modeling in BETHY (BETHY-exp3 specifically) to examine (a) leaf- and canopy-level SIF and quenching under sunlit and shaded leaves and (b) SIF emissions at the top of the canopy (SIFcanopy) vs. the average emission within the canopy (SIFave), which accounts for the average emission from sunlit and shaded leaves. The latter analysis facilitates the comparison to PhotoSpec, which observes the entire canopy.
An important caveat in the analysis of BETHY simulations is that, at the time of this writing, the prescribed meteorological forcing at NR1 is only available for 2015. While this degrades comparison to diurnal and synoptic variation observed by PhotoSpec in 2017, we find that the analysis of magnitude, light sensitivities, and within-model experiments still provides useful insight for the interpretation of other TBM–SIF models and future modeling requirements in general.
ORCHIDEE
The Organizing Carbon and Hydrology In Dynamic Ecosystems (ORCHIDEE) model (Krinner et al., 2005) is the land surface component of the earth system model of the Institut Pierre-Simon Laplace IPSL-CM (climate model; Dufresne et al., 2013) involved in recent exercises of the Coupled Model Intercomparison Project (CMIP) established by the World Climate Research Programme (https://www.wcrp-climate.org/wgcm-cmip, last access: 6 January 2019). Recently a mechanistic SIF observation operator was developed for ORCHIDEE to simulate the regulation of photosystem II ϕF at the leaf level using a novel parameterization of NPQ as a function of temperature, PAR, and normalized ϕP. It emulates the radiative transfer of SIF to the top of the canopy using a parametric simplification of SCOPE. The details of the SIF modeling approach are provided in Bacour et al. (2019).
We include three experiments to examine the impact of water stress and parameter optimization (using OCO-2 SIF; see Sect. 2.4): (1) ORCHIDEE-exp1 is the standard configuration with default parameters; (2) ORCHIDEE-exp2 is the same as ORCHIDEE-exp1 with the two key differences that (a) water stress is applied to the stomatal conductance, mesophyll conductance, and photosynthetic capacity and (b) the tree height (12 m instead of 15 m) was set specifically for the NR1 site; and (3) ORCHIDEE-exp3 is the same as ORCHIDEE-exp1 but includes OCO-2 optimized parameters.
BEPS
The Boreal Ecosystem Product Simulator (BEPS) is an enzyme kinetic two-leaf model for simulating carbon and water cycles for different plant functional types (Chen et al., 1999; Liu et al., 2003). BEPS uses a modified Ball–Berry–Woodrow stomatal-conductance model (Leuning et al., 1995) and semi-analytical canopy radiative transfer. The canopy architecture is well considered in the BEPS model, which has not only remote-sensed LAI but also the global map of the foliage clumping index. The fluorescence emission at the leaf level follows the approach of Lee et al. (2015). SIF emission for sunlit and shaded leaves are separately simulated based on illumination and canopy geometry in BEPS. In addition, multiple scattering SIF is also simulated to account for the scattering process within the canopy. The scaling of leaf-level fluorescence emission to the canopy is based on a novel scheme for single-layer models which accounts for canopy scattering and extinction from sunlit and shaded leaves (Qiu et al., 2019). This scaling scheme is an effective approach to simulate the radiative transfer of SIF for a given canopy structure. We include two experiments similar to BETHY-exp1 and BETHY-exp2 in the calibration of the kN model against unstressed vs. stressed species (BEPS-exp1 and BEPS-exp2, respectively).
CLM4.5
The Community Land Model version 4.5 (CLM4.5) provides a description of the biogeochemical profile spanning from the subsurface bedrock to the top of the vegetation canopy. The fluorescence submodel follows Raczka et al. (2019), in which the degree of light saturation is calculated from the potential and actual electron transport rate as determined from the photosynthesis model described above. ϕF is formulated as described in Eq. (2), and ϕP is formulated as a function of the maximum ϕP under dark acclimated conditions and the degree of light saturation. CLM4.5 uses independent site-level SCOPE simulations that match the observed canopy characteristics and observed GPP at Niwot Ridge to calculate a leaf-to-canopy-level conversion factor (κ740) for estimating SIFcanopy. In CLM4.5, κ740 is fitted to the modeled SCOPE data as a function of the solar zenith angle (and implicitly Vcmax).
Similar to Raczka et al. (2019), here we examine three separate approaches to parameterize kN. CLM4.5-exp1 only considers reversible NPQ (kR), such that kN=kR, and the relationship between kR and the degree of light saturation is fitted to PAM fluorometry data based on Mediterranean shrubs (Flexas et al., 2002; Galmes et al., 2007). CLM4.5-exp2 parameterizes kR with PAM fluorometry from a Scots pine forest (Porcar-Castell, 2011) and defines the rate coefficient in terms of both a reversible and sustained component (). It has been found that sustained NPQ is important for cold-climate evergreen conifer forests such as Niwot Ridge (Miguez et al., 2015; Magney et al., 2019b), and Raczka et al. (2019) found that representing both components provided improved simulations of seasonal SIF. CLM4.5-exp3 is similar to CLM4.5-exp3 but includes a seasonally varying representation of kR. All model experiments use hand-tuned parameters specific to US-NR1 (Raczka et al., 2016).
CLM5.0
CLM version 5.0 (CLM5.0) is similar to CLM4.5 with respect to the implementation of the fluorescence submodel yet includes several important updates to the representation of photosynthesis from CLM4.5, including a prognostic calculation of Vcmax based upon leaf nitrogen and environmental conditions, a revised nitrogen limitation scheme, the Medlyn stomatal-conductance model, and plant hydraulic water stress (Kennedy et al., 2019). To represent NPQ, we use a single approach for kN (see CLM4.5-exp1) but examine three approaches for estimating κ740: (1) CLM5.0-exp1 uses κ740 as a function of Vcmax following Lee et al. (2015); (2) CLM5.0-exp2 follows the approach of CLM4.5; and (3) CLM5.0-exp3 adapts the approach proposed by Zeng et al. (2019) that estimates the fraction of total emitted SIF escaping the canopy by combining the near-infrared reflectance of vegetation (NIRV) and fPAR.
SiB3
The Simple Biosphere Model version 3 (SiB3) involves the use of explicit biophysical mechanisms to directly calculate carbon assimilation by photosynthesis (Baker et al., 2003; 2008). SiB3 includes the prognostic calculation of temperature, moisture, and trace gases in the canopy air space but requires the prescription of most structural properties including LAI. We examine two approaches for prescribing LAI: (1) SiB3-exp1 using values prescribed from MODIS and (2) SiB3-exp2 uses values observed at the study site (4.0 m2 m−2). In general, the fluorescence submodel follows the approach of Lee et al. (2015), except that kN is adapted to drought-stressed species following van der Tol et al. (2014).
SiB4
SiB4 (Haynes et al., 2019a, b) shares many similarities with SiB3 with respect to the functional aspects of photosynthesis and fluorescence; however, SiB4 uses prognostic rather than prescribed phenology and LAI.
2.3.5 SCOPE
SCOPE is a multilayer canopy model which explicitly represents the within-canopy radiative transfer of fluorescence, whereas TBM–SIF models analyzed here (with the exception of BETHY) only provide an empirical representation. We provide results from a stand-alone version of SCOPE, v1.73 (van der Tol et al., 2014), as an additional benchmark for TBM–SIF simulations of APAR, GPP, SIF, and quantum yields. There are three important reasons for this. (1) It is inherently difficult to provide representative and accurate in situ measurements of APAR, SIF, and GPP for comparison to models. (2) SCOPE provides estimates of quantum yields for fluorescence, photochemistry, and nonphotochemical quenching, which are not measured continuously in the canopy at NR1. (3) SCOPE offers a more direct benchmark for evaluating more simplified representations of canopy radiative transfer in TBM–SIF models. Unlike the TBM–SIF models, SCOPE does not include a representation of biogeochemical cycling or carbon pools, and thus no spin up is required. As such, we prescribe LAI (4 m2 m−2), canopy height (13 m), and leaf chlorophyll content (25 µg cm−2) following Raczka et al. (2019). We also examine two approaches for prescribing Vcmax: (1) SCOPE-exp1 uses the default constant value of 30, similar to BETHY, and (2) SCOPE-exp2 uses a seasonal varying value calibrated to NR1, following Raczka et al. (2016, 2019), which follows a bimodal distribution peaking near 45 in early summer (DOY = 150) and 40 in late summer (DOY = 250).
2.4 Data assimilation
Details of the data assimilation protocols for ORCHIDEE are provided in Bacour et al. (2019). An ensemble of parameters related to photosynthesis (including optimal Vcmax) and phenology were optimized for several plant functional types. Note that none of the assimilated pixels encompass the location of the US-NR1 tower. In ORCHIDEE, the study site is treated as boreal needleleaf evergreen (ENF); as such, the ORCHIDEE-exp3 simulations in this study are based on parameters optimized against OCO-2 SIF data using an ensemble of worldwide ENF pixels. Note that for BETHY, each experiment uses the same set of optimized parameters, whereas in ORCHIDEE the SIF simulations are performed separately for the standard parameters (ORCHIDEE-exp1 and ORCHIDEE-exp2) and optimized parameters (ORCHIDEE-exp3), thus providing a test of sensitivity to parameter optimization as discussed below.
2.5 Illumination conditions
In order to gain insight into how SIF emissions and quantum yields vary with illumination, we further analyze PhotoSpec and a subset of models with respect to (a) changes in incoming light and (b) self-shading within the canopy, respectively. For PhotoSpec, we analyze changes in canopy-average SIF and SIFrel under conditions of predominantly direct vs. diffuse PAR, using a 0.5 threshold to distinguish between the two conditions (Sect. 2.2.3). For models, we focus on emissions from sunlit vs. shaded leaves. We analyze leaf- vs. canopy-level SIF emissions (SIFleaf and SIFcanopy) in CLM4.5-exp3 and leaf-level quantum yields (ϕF, ϕP, and ϕN) in SCOPE-exp2. We further compare predictions of quantum yield at the top of the canopy to canopy averages in SCOPE-exp2. The motivation here is that top-of-canopy leaves see most of the sunlight and thus should have different yields compared to shade-adapted leaves lower in the canopy. This also provides a more direct comparison for PhotoSpec.
2.6 Modeling protocol
Models are run for the period 2000–2018 (except BETHY, which is for 2015 only, and SCOPE, which is for 2017 only) using identical, hourly, gap-filled meteorological observations. The primary hourly output fields analyzed are the top-of-canopy SIF (SIFcanopy at 740 nm), GPP, ϕF, ϕP, and APAR. Model-observation comparisons are made for absolute and relative SIF, GPP, SIFyield (SIFcanopy / APAR) and GPPyield (GPP / APAR), sunlit vs. shaded canopies (CLM4.5-exp3 and SCOPE-exp2), and TOC vs. canopy-average SIF (SIFcanopy vs. SIFave, respectively, from SCOPE-exp2). Quantum yields and within-model experiments provide context to understand canopy-integrated results. We focus our analysis on 08:00–16:00 LT from July to August 2017 for comparison to available PhotoSpec and APAR data.
Models are controlled for meteorological forcing (meteorological data described in Burns et al., 2015), but other factors such as spin-up, land surface characteristics, parameter tuning, and model state are not controlled for and are treated separately according to each model's protocol. For example, CLM4.5 is better suited than others in prescribing observed vegetation characteristics at the study site. One ORCHIDEE experiment (ORCHIDEE-exp3) is preliminary optimized by assimilating independent Orbiting Carbon Observatory 2 (OCO-2) SIF data at the global scale (Sect. 2.4). We emphasize that our point here is not to identify the best model but to identify common patterns in model behavior through normalized SIF and deviation from observed behavior to identify areas requiring the most attention.
The results are organized around two parallel themes. The first theme addresses four key processes driving canopy-level fluorescence: (1) incoming illumination; (2) energy partitioning on incoming light between photochemistry, fluorescence, and NPQ; and (3) leaf-to-canopy-emitted SIF, including the linearity of yields at the leaf and canopy scales. The second theme addresses the sensitivity of these processes to environmental conditions at diurnal and synoptic scales. Here, the synoptic scale refers to the impact of day-to-day changes in weather, including two storm events which brought sustained cool, wet, and cloudy conditions from 22 to 31 July and then from 6 to 10 August.
Incoming illumination
Two key features dominate observed APAR variability: afternoon depression (Fig. 2a) and reduction during two summer storms (Fig. 2d). Both features are captured by models. More generally, models capture synoptic variability with a high correlation (r>0.8) and low across-model spread (σ=10 %). The exception is BETHY, which is simulated outside our observation year (2015). High model fidelity is expected given that observed PAR is prescribed, and it is promising that models show a consistent response to changes in illumination. The primary shortcoming across TBM–SIF models and SCOPE is a systematic high bias in APAR magnitude (129 %), with most models exceeding the upper range of observed APAR (as determined from the six within-canopy PAR sensors; Fig. S2) and high model spread. These errors are likely related to differences in predicted fAPAR. In the case of ORCHIDEE, high APAR is expected due to the big-leaf assumption, where all leaves are considered as opaque and fully absorbing.
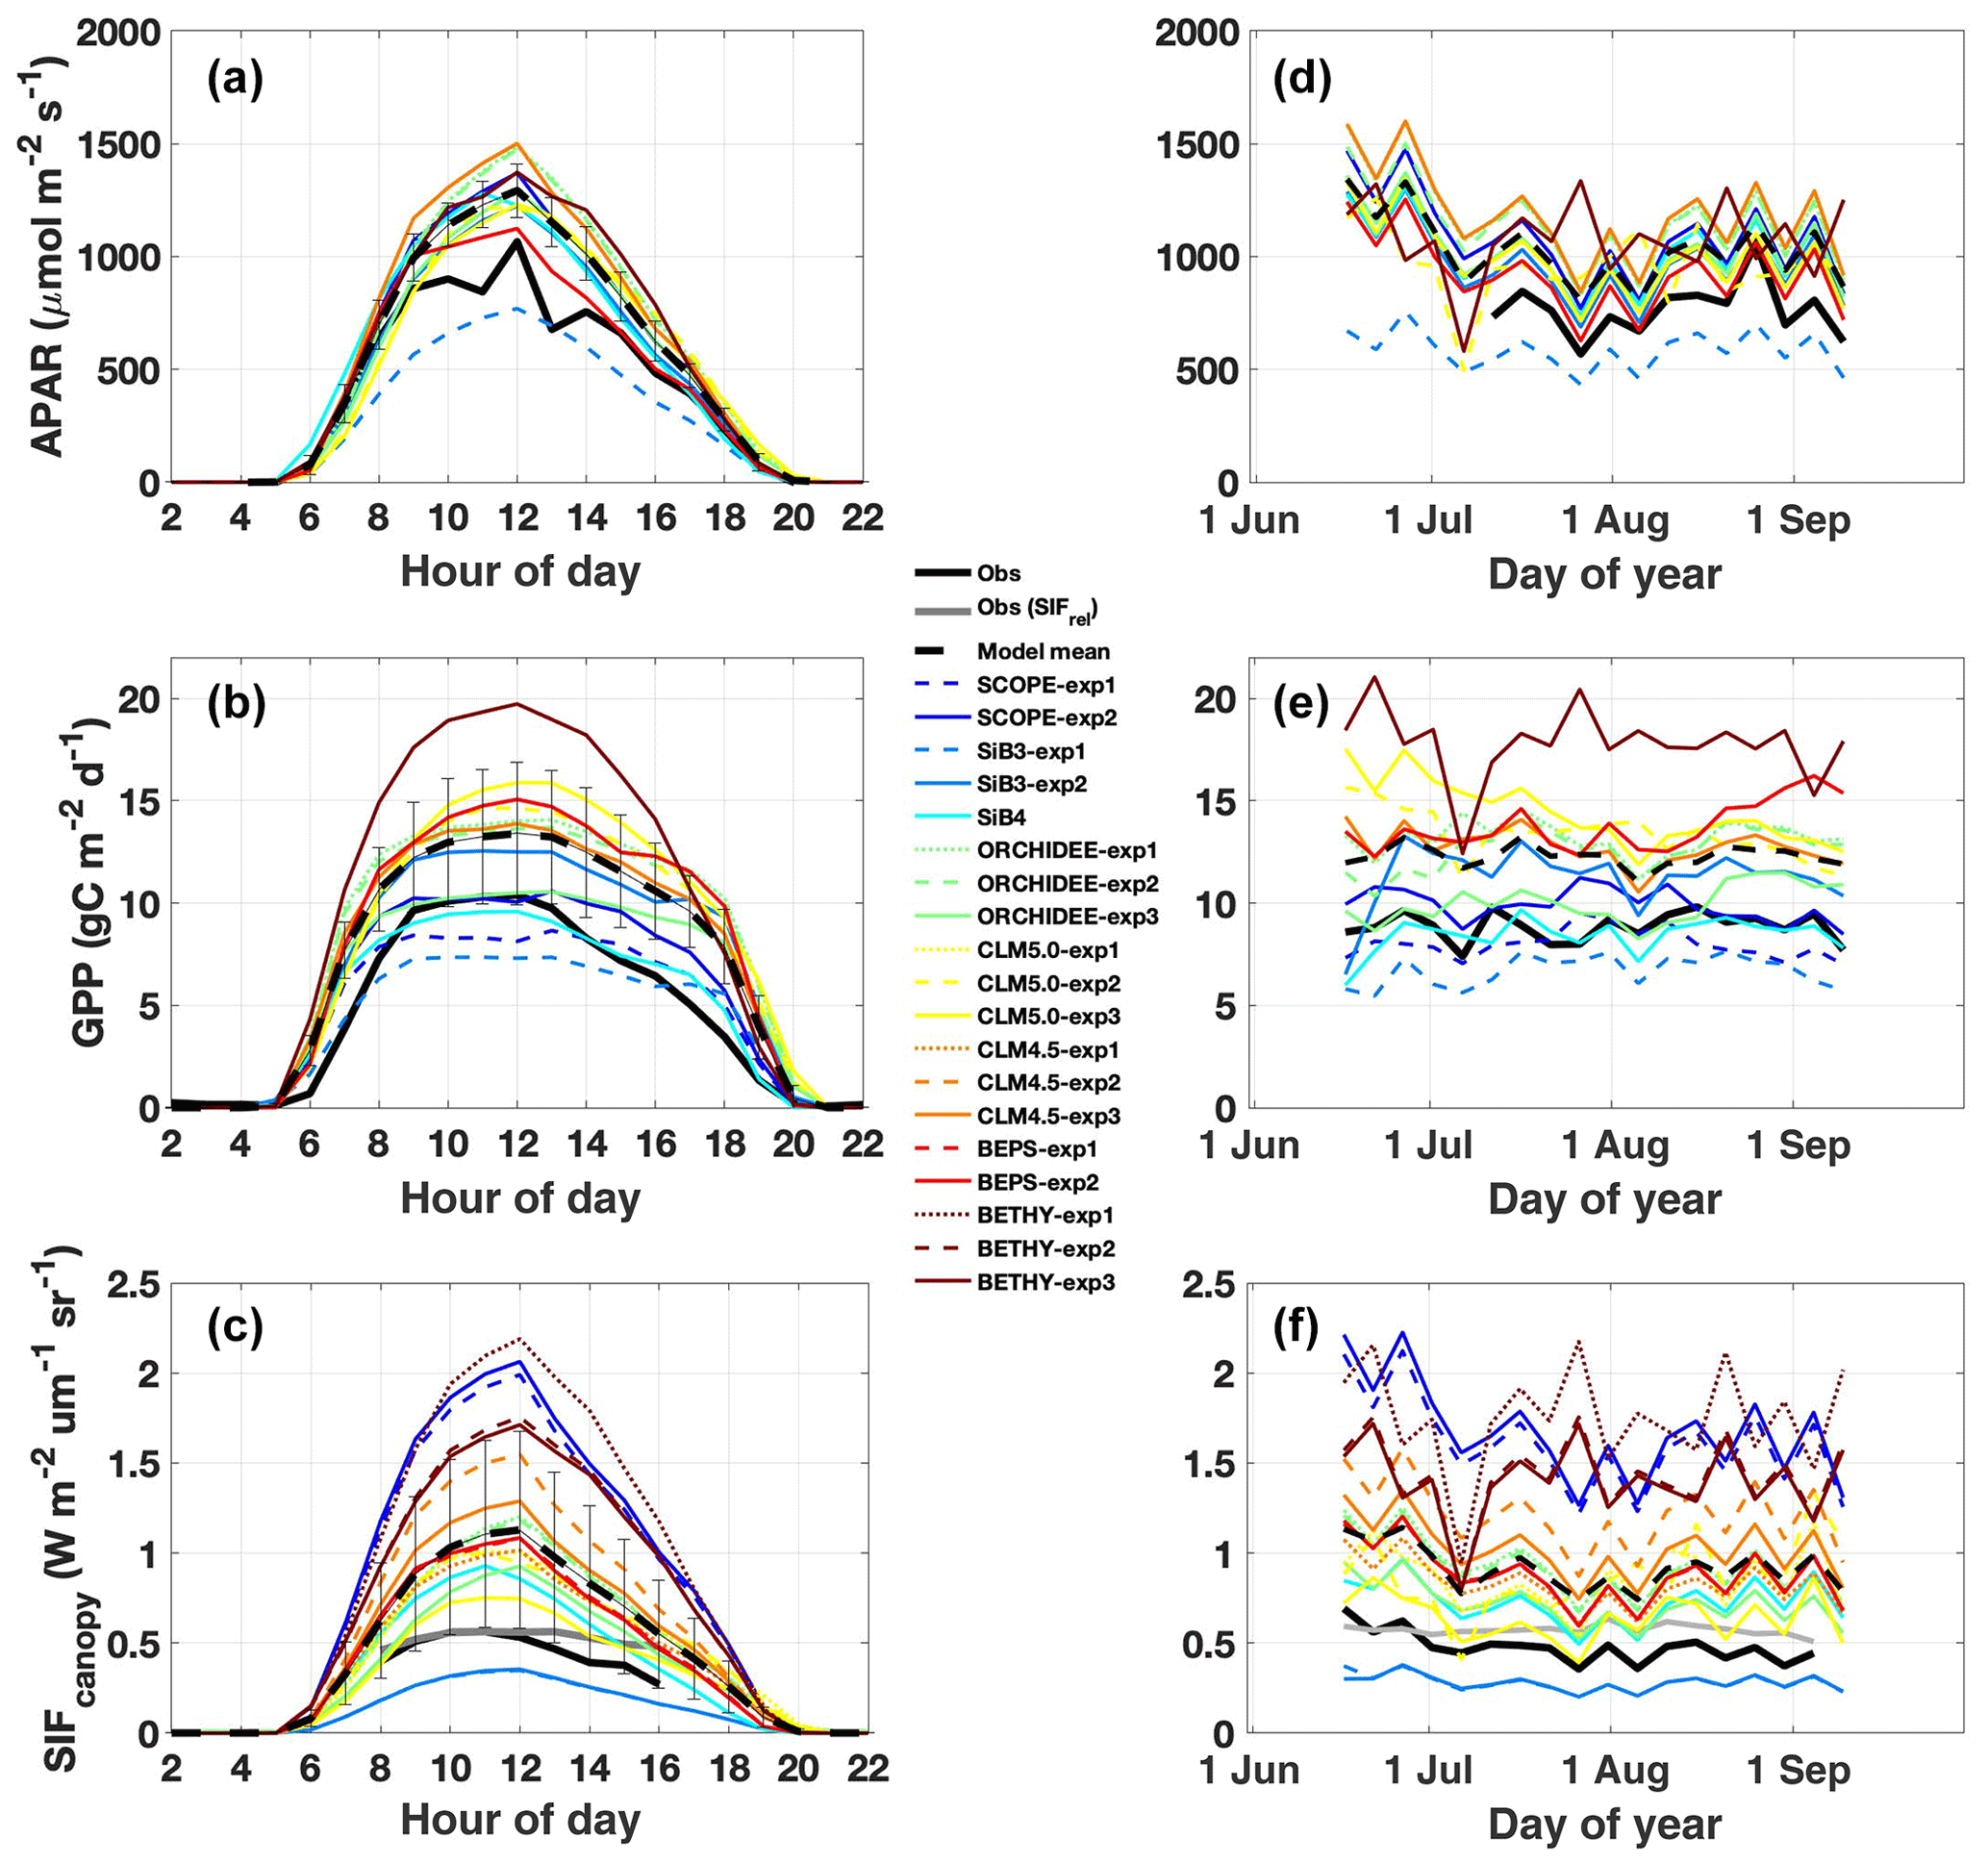
Figure 2Observed and simulated diurnal and synoptic cycles of APAR, GPP, and SIF. Diurnal cycles (a–c) are averaged over July–August 2017. Synoptic cycles (d–f) are plotted as 5 d averages from 15 June to 15 September. Observations are shown in black, with relative SIF (SIFcanopy and far-red reflected radiance) included in panels (c) and (f) in grey. The across-model average (dashed black line) represents the average of “best-case” model scenarios (solid lines; SCOPE-exp2, SiB3-exp2, SiB4, ORCHIDEE-exp3, CLM5.0-exp3, CLM4.5-exp3, BEPS-exp2, and BETHY-exp3) with uncertainty bars indicating the across-model 1σ uncertainty.
Canopy photosynthesis
Observed GPP shows a broad peak from mid morning to early afternoon (∼ 09:00 to 13:00 LT), followed by a slight decrease until 16:00 (Fig. 2b), consistent with afternoon cooling and reduced light availability (Fig. 1b–d). The 2-month period under investigation is relatively flat with generally weak day-to-day variability (σ=17 %) but a modest correlation with APAR (r=0.61; Fig. 2e). Some models capture the afternoon GPP depression, but all models strongly underestimate its magnitude, apparently independent of stomatal-conductance formulation or more explicit accounting for plant hydraulic water stress such as in CLM5.0. SCOPE and BETHY, which do not account for water stress, show no afternoon depression. Models are mostly uncorrelated with observed GPP at the synoptic scale (r ranges from −0.2 to 0.36; highest value in SiB4), are highly biased, and show increased spread (in predicted magnitude) relative to APAR (143 ± 23 %). SCOPE-exp2 shows a slight improvement in GPP magnitude with the larger Vcmax value in late summer.
While observed GPPyield is mostly stable over the diurnal cycle, most models (except BEPS) show a distinct midday minimum (Fig. 3a). Half of the models show a similar midday minimum in photochemical quantum yield (ϕP, Fig. 4a), with the other half either increasing or decreasing in the afternoon (CLM5.0 and SiB3 and SiB4, respectively). The midday dip in yield is likely associated with reduced photosynthetic efficiency at high light levels, as demonstrated by reductions in GPP, GPPyield, and ϕP with APAR (Fig. 5a, c, and e).
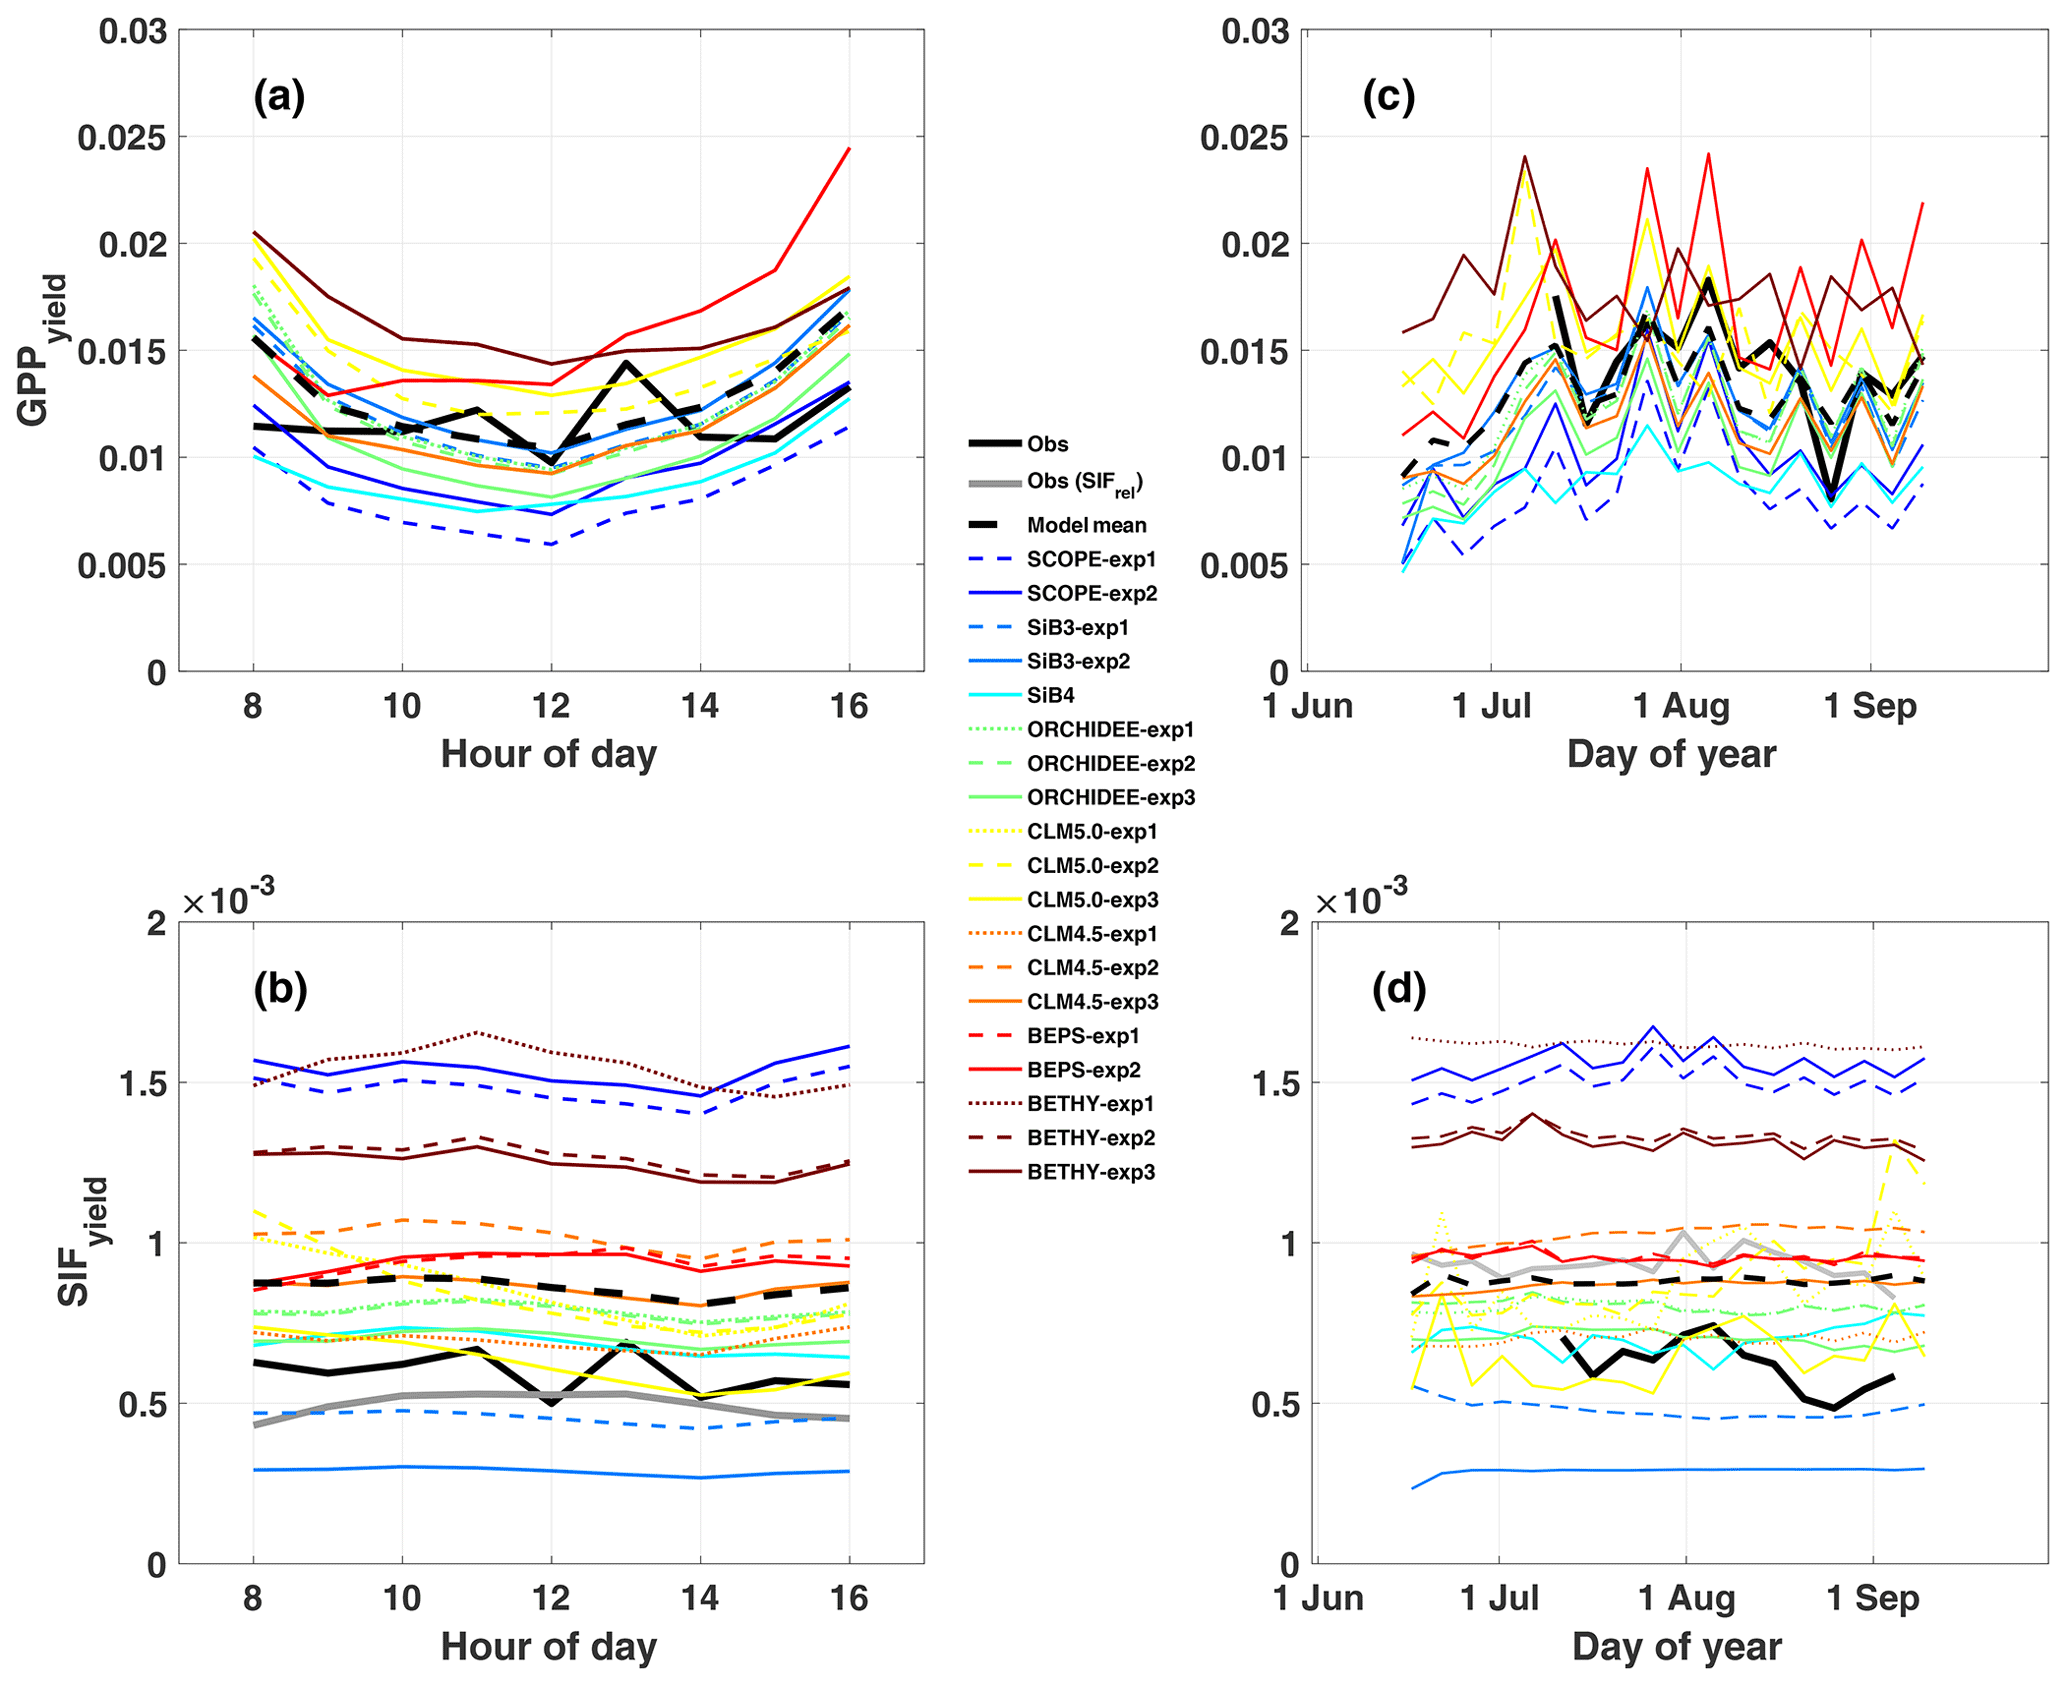
Figure 3Same as Fig. 2 except for SIFyield and GPPyield. Here, SIFyield= SIFcanopy / APAR, and GPPyield= GPP / APAR. As with Fig. 2, the left column shows the mean diurnal cycle, and the right column shows a time series of 5 d averages.

Figure 4Same as Fig. 2, except for the quantum yield of fluorescence (ϕF) and photochemistry (ϕP).
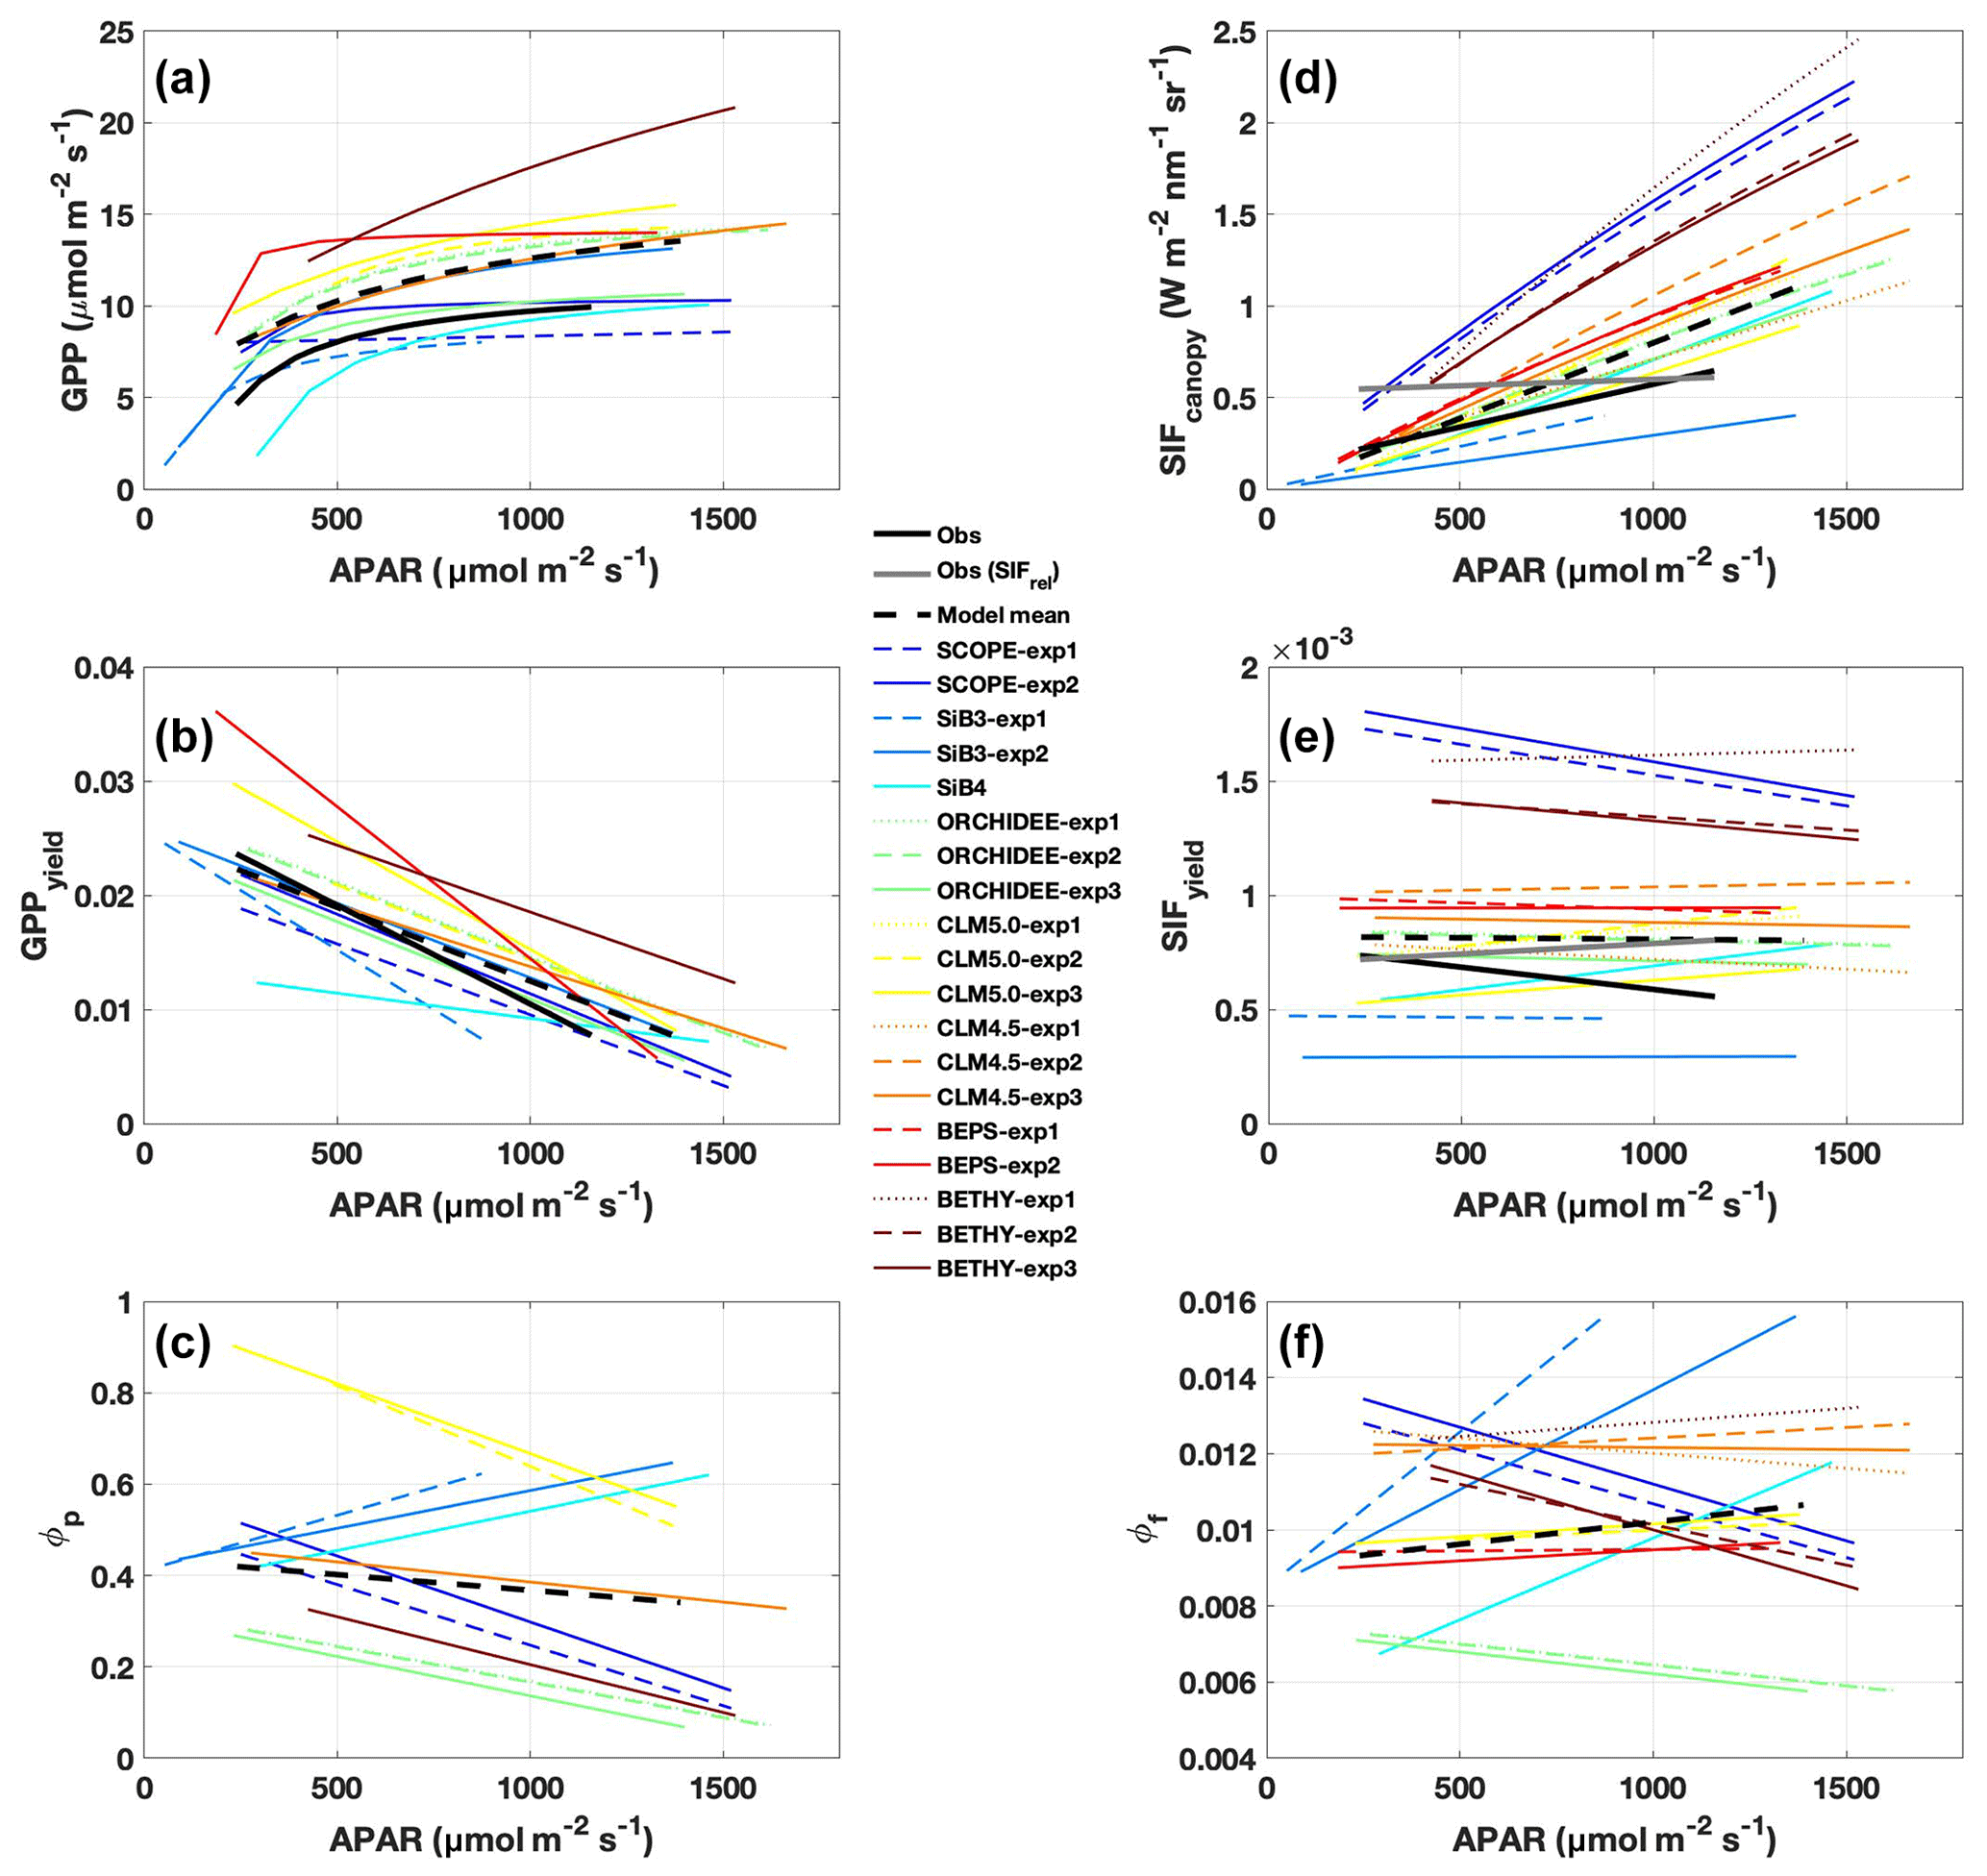
Figure 5Observed and predicted change in GPP, SIF, and yields with APAR. Regression lines are shown for (a) GPP, (b) GPPyield, (c) photochemical quantum yield (ϕP), (d) SIFcanopy, (e) SIFyield, and (f) fluorescence quantum yield (ϕF), as a function of APAR, using daily mean (08:00–16:00 LT) values over the period July–August 2017. Observations are shown in solid black; individual models and experiments are in color; the across-model average is a dashed black line. Relative SIF is shown in grey in panels (d) and (e).
Observed GPPyield shows a significant structure at the synoptic temporal scale (Fig. 3c), most notably increased yield during the cool and rainy period (reduced heat and water stress) and decreased yield in mid-to-late August (increased heat and water stress following the cooling pattern). In contrast to predicted GPP, models show high fidelity in capturing the magnitude and variability of GPPyield at the synoptic scale (r ranges from 0.35 to 0.76; highest values in SCOPE and CLM4.5 and CLM5.0). Individual models are self-consistent in their predictions of GPPyield and ϕP at the synoptic scale (r=0.592–0.935), except for SiB3 and SiB4 (r<0.1; Fig. 4b).
Canopy fluorescence
Observed SIFcanopy is strongly correlated with observed APAR at the diurnal and synoptic scales (r=0.77), with common features including an afternoon depression and reduction during rainy periods (Fig. 2c and f). Observed PAR also feeds into the fluorescence submodel and, unlike GPP, strongly correlates with SIFcanopy at the synoptic scale (r ranges from 0.58 to 0.92; highest values in SCOPE and ORCHIDEE). However, we find a persistent positive model bias in SIFcanopy (170 ± 45 %) consistent with, but not proportional in magnitude to, the APAR bias. We note that models are especially oversensitive to APAR at high light levels (Fig. 5d).
We investigate the high bias in SIFcanopy in more detail using SCOPE-exp2 and CLM4.5-exp3. Specifically, we examine leaf- and canopy-level SIF and quenching under sunlit and shaded leaves. Analysis of quantum yields in SCOPE-exp2 (Fig. S5 in the Supplement) shows a reversal in the fractional amounts of absorbed energy going to SIF and PQ vs. NPQ in low- vs. high-light conditions that is consistent with leaf-level data and theory (Porcar-Castell et al., 2014). More specifically, SCOPE-exp2 predicts low ϕF and ϕP and high ϕN in sunlit leaves relative to shaded leaves, with more energy going to fluorescence and photochemistry than to NPQ in shaded leaves and more energy going to (shed off by) NPQ in sunlit leaves (Fig. S5). Likewise, total ϕF shows decreasing values with increasing APAR in SCOPE and BETHY-exp2 and BETHY-exp3 compared to BETHY-exp1, consistent with observed SIFyield (Fig. 5e and f), as ϕN ramps up to higher levels in the drought-parameterized kN model. Moreover, in stark contrast to SIFyield and SIFcanopy, ϕF does not show high values relative to other models (Fig. 4d). These results point to an issue in SCOPE and BETHY with leaf-to-canopy scaling in needleleaf forests.
Analysis of CLM4.5-exp3 suggests several possible reasons for oversensitivity to APAR. First, we focus on emissions from sunlit and shaded portions of the canopy (Fig. S6 in the Supplement). CLM4.5-exp3 and PhotoSpec both show higher SIF under “high-light” conditions (sunlit leaves and direct radiation, respectively) compared to “low-light” conditions (shaded leaves and diffuse radiation, respectively), which is promising (Fig. S6A and D). Comparing the ratio of sunlit-to-shaded SIF in CLM4.5-exp3 to the ratio of direct-to-diffuse SIF in PhotoSpec (Fig. S6b and e) shows a higher ratio in CLM4.5-exp3 on average. The difference peaks in midday, when sunlit leaf area is maximized (self-shading minimized) in CLM4.5 but with no major difference in the amount of direct radiation and decreases with an increasing sun angle (morning and afternoon) and with increasing rainfall (in the afternoon on average and during the rainy period in late July to early August), both of which increase the shaded fraction. As such, accounting for the view angle and different illumination metrics for PhotoSpec and CLM4.5 (most comparable in morning, afternoon, and during rainy days) reduces, but does not entirely remove, the positive bias in high-light conditions.
Second, the degree of light saturation (x) is twice as high in the sunlit canopy in CLM4.5 (Fig. S7 in the Supplement), which leads to low fluorescence efficiency in sunlit leaves and high fluorescence efficiency in shaded leaves. While this produces high photochemistry in shaded leaves, it contributes a small fraction of SIF to the total canopy (∼ 20 %) despite higher fractions of shaded leaves (about two-thirds at noon; Fig. S6C), and thus sunlit leaves dominate SIFyield and SIFcanopy. Therefore, it seems likely that a model's representation of canopy structure including the partitioning between sunlit and shaded leaf area fractions has an important impact upon canopy SIF. Biases in the sunlit and shaded fraction will likely propagate into the simulated value of canopy SIF. However, it is important to know that the observed sunlit and shaded fraction from PhotoSpec is estimated as well, since it is currently not possible to determine the precise sunlit and shaded fraction within PhotoSpec FOV.
Additionally, all formulations of CLM4.5 (and most models except BETHY and SCOPE) show a lack of decline in SIFyield with APAR compared to measurements of absolute SIF (Fig. 5e). For CLM4.5, the relationship between SIFyield and APAR depends upon the relationship between the degree of light saturation and reversible NPQ (Raczka et al., 2019). This suggests that it is important to properly represent the NPQ response to environmental conditions when simulating SIF.
While most of the model bias is reduced in SIFyield (126 %; mostly attributed to BETHY and SCOPE), the remaining signal, representing the dynamic response to synoptic conditions (e.g., Magney et al., 2019), is poorly represented in models, as demonstrated in a time series of 5 d means (Fig. 3d). Most models show zero to strongly negative correlation with observations at the synoptic scale, and only three models (SCOPE, ORCHIDEE-exp3, and BETHY-exp2 and BETHY-exp3), produce a correlation greater than 0.5. These are the only three models that also capture a negative relationship between SIFyield and APAR (Fig. 5e).
In general, predicted SIFyield is stable during our short study period (Fig. 3). Half of the models show a significant positive correlation with GPPyield (r>0.85), and half show zero or a negative correlation (Fig. S8 in the Supplement). While these findings run counter to observed SIFyield, which shows a clear response during and following the storm event and moderate positive correlation with observed GPPyield (r=0.40), they show some consistency with observed SIFrel (grey line in Figs. 3 and S8A), which like many models is stable and uncorrelated with GPPyield. We refer the reader to Sect. 2.2.2 for clarification of the important difference between SIFyield and SIFrel.
Leaf-to-canopy scaling
Several methods have been proposed to transfer predicted leaf-level SIF emissions to the top of the canopy. While leaf-to-canopy scaling enables efficient global-scale simulation, the diversity of novel methods adds uncertainty to the canopy-level estimate of SIF (in addition to aforementioned uncertainties in structure, APAR, photochemistry, and fluorescence). These differences are evident in a comparison of Figs. 3 and 4, in which yields are plotted on a similar scale.
At least at the diurnal scale, there is some evidence that leaf and canopy emissions look more similar for models adopting simplified empirical scaling functions (SiB3, SiB4, CLM4.5, CLM5.0, and BEPS) than for models that more explicitly account for radiative transfer (SCOPE, BETHY, and ORCHIDEE). For the more explicit models, the diurnal cycle of ϕF is out of phase with SIFyield, the former of which peaks in the afternoon and the latter of which peaks in the morning. This produces a reasonable agreement with PhotoSpec in phase and magnitude between SIFyield and SIFrel for ORCHIDEE, but it produces divergence in the magnitude of SIFcanopy for ORCHIDEE.
Model performance in leaf-to-canopy scaling is summarized in Fig. S8. The only three models with a positive relationship between yields (Fig. S8B) and between quenching terms (Fig. S8C) include an explicit representation of radiative transfer (i.e., SCOPE, BETHY, and ORCHIDEE). CLM4.5 is the only model with a positive relationship between yields but not between quenching terms. SiB3 and SiB4 are the only models with a positive relationship between quenching terms but not between yields.
Finally, we clarify an important difference between observed and predicted estimates of canopy-average SIF. PhotoSpec scans direct emissions from sunlit and shaded leaves within the canopy, thus observing the total emission from leaves in the instrument FOV. We then average each of these leaf-level scans and report them as canopy averages. Model output, in contrast, is reported at the TOC, which represents the net emission from leaves after attenuation in the canopy (through canopy radiative transfer, the reabsorption of SIF, and shading). Assuming sunlit and shaded leaves within the canopy emit at the same rate as TOC leaves, attenuation will reduce the effective signal from leaf-level emissions within the canopy. As such, the average of leaf-level emissions (canopy average) is expected to be lower than the net emission of leaves reaching the top of the canopy.
This is important because CLM4.5 shows a strong attenuation of SIF from the leaf level to TOC, decreasing by a factor of 2–3 at midday (Fig. S7). The interpretation here is that the model bias in absolute SIF may actually be higher than reported here; however, we note that more quantitative information on the observed fraction of sunlit vs. shaded leaves and comparative top-of-canopy SIF values for the same canopy elements are needed (to account for off-nadir SIF viewing) for a more accurate determination of scaling between observed canopy and top-of-canopy SIF.
Within-model experiments
In most cases, within-model experiments produce improvements in some metrics and degradation across others (performance change is quantified by reporting correlation values in brackets). An important and unexpected result of this study is the impact of different levels of tuning to observations on our predictions. While this work represents a snapshot of the state of the art in site-level TBM–SIF modeling, and we have taken great care to control for environmental conditions (most important being illumination), an important overall takeaway is for future model comparisons to make additional efforts to control for initial conditions and vegetation state (i.e., model biophysical parameters).
The most basic example is the tuning of LAI in SiB3 and Vcmax in SCOPE. LAI, as prescribed by MODIS for SiB3-exp1 (∼ 1.5), is on the low end for a subalpine evergreen forest and consequently produces negative biases in APAR, GPP, SIF, and SIFyield. When prescribed according to tower observations in SiB3-exp2 (∼ 4.0), the biases become positive (albeit on the lower end of the model ensemble) but produce degraded variation at the synoptic scale for GPP (0.39 vs. 0.19), SIF (0.87 vs. 0.71), and SIFyield (0.09 vs. −0.32). The tuning of Vcmax in SCOPE improves the magnitude of GPP, with a minimal impact on variability at the diurnal to the synoptic scale.
Experiments in CLM4.5 comprise a higher level of hand tuning of vegetation structural and functional characteristics. Parameter tuning was imposed to match vegetation structure with site-level measurements, and consequently CLM4.5 produces overall low bias in yields. With respect to synoptic variation, NPQ experiments, tuned against the measured air temperature and a representative evergreen forest, produce improvements at the synoptic scale for GPP (−0.01 vs. 0.16), SIF (0.59 vs. 0.86), and GPPyield (0.05 vs. 0.63) but degradation in SIFyield (0.32 vs. −0.25). Likewise, NPQ experiments in BETHY based on species information (calibration of KN against PAM fluorescence in stressed vs. unstressed systems) shows improvement in the SIFyield–APAR relationship for drought-stressed models (BETHY-exp1 vs. BETHY-exp2 and BETHY-exp3).
Experiments with ORCHIDEE demonstrate that errors in model parameters (such as Vcmax, LAImax, leaf age, or SLA – specific leaf area) contribute to SIF and GPP uncertainty but can be alleviated by the assimilation of OCO-2 SIF retrievals (ORCHIDEE-exp1 and ORCHIDEE-exp2 vs. ORCHIDEE-exp3). The model optimization of parameters improves the functional link between SIF and GPP, thus reducing biases in APAR, GPP, and SIFyield and improving synoptic variation in SIFyield (−0.04 vs. 0.58).
This study represents a first attempt to evaluate a controlled ensemble of TBM–SIF models against canopy-integrated SIF observations to identify and attribute model-observation mismatches related to errors in canopy absorption of sunlight, photosynthesis, fluorescence, and the leaf-to-canopy radiative transfer of fluorescence.
Different models match some observed parameters better than others (with respect to APAR and yield), but no model gets both APAR and SIFyield magnitude and/or sensitivities close to the observations. For example, BEPS closely matches the magnitude of APAR (Fig. 2a), and BETHY captures the decline in SIFyield with APAR for NPQ quenching based on stressed species (Fig. 5e), but both models overestimate observed yield by a factor of 2; hence SIF is overestimated (Fig. 2). CLM4.5 correctly captures the diurnal SIFyield change but overestimates APAR; in this case, SIF and SIFyield are overestimated. Importantly, models diverge strongly from each other and from observations in the magnitude of SIFyield and its decline with APAR (Fig. 5e), partially reflecting model variability in ϕF (Fig. 5f), but in general they show a characteristic pattern of weak SIFyield decline with APAR. GPPyield shows higher agreement between models and with observations (Fig. 5b), despite divergent ϕP (Fig. 5c), which could be an indication that the primary uncertainty is due to the representation of fluorescence and not the photosynthesis model.
Consequently, we find a strong linear and positive relationship between observed SIFyield and GPPyield for absolute SIF, which is underestimated on average by models (Fig. S8a and b). In contrast, models show quite strong positive relationships between ϕF and ϕP (Fig. S8C). Our study highlights an apparent challenge for models in transferring leaf-level processes to the canopy scale and consequently linking the proper canopy mechanistic SIF–GPP relationship at the leaf level.
The mismatch between multimodel simulations and tower-based observations of SIF and GPP at hourly and daily scales can be summarized as symptoms of five main factors: (1) PhotoSpec scan strategy, (2) the radiative transfer of incoming PAR and the impact on APAR and the sunlit and shaded fraction, (3) the representation of photosynthesis and sensitivity to water limitation especially during afternoon conditions, (4) the representation of fluorescence and sensitivity to reversible NPQ response at Niwot Ridge, and (5) the radiative transfer of fluorescence from the leaf to the canopy. Several persistent biases falling under these broad categories are discussed below.
Apples-to-apples comparison
PhotoSpec is unique in its ability to scan entire canopies for signals that are largely hidden from nadir-oriented instruments. However, this creates unique challenges for the interpretation of data and comparison to models. For example, the diurnal cycle of observed SIF is highly sensitive to view angle. PhotoSpec was set up in 2017 to scan back and forth between northwest and northeast view angles, but the instrument was slightly biased to the northwest, causing a low phase angle in the morning (more aligned with rising sun) and an increased phase angle in the afternoon (more opposed to setting sun). As such, PhotoSpec observed predominantly illuminated canopies in the morning and shaded canopies in the afternoon (i.e., more shaded fraction), leading to the late-morning peak in reflected radiance (Fig. S3).
Moreover, PhotoSpec scans specific locations at the top of the canopy from near the nadir to view angles closer to the horizon (see Fig. S8 in Magney et al., 2019b), while models are currently configured to simulate top-of-canopy emission and simulated here as nadir viewing. The question becomes whether to retain nadir-only data and sacrifice the signal-to-noise ratio or to average over all elevation angles and risk aliasing view angle effects. This study, partly motivated by the high agreement of canopy-integrated SIF with spaceborne data from OCO-2 and TROPOMI (Tropospheric Monitoring Instrument; Magney et al., 2019b; Parazoo et al., 2019), has chosen the latter approach but with an attempt to minimize scan angle effects in SIFrel. However, it is worth noting that swath sensors such as GOME-2 (Global Ozone Monitoring Experiment) show a high sensitivity to view angle especially under increasing illumination angles (Kohler et al., 2018). View angle effects are likely to be especially acute for PhotoSpec in the morning and afternoon with increasing anisotropy and changes in the illuminated field of view with sun and view angle. Other tower SIF instruments with a wide FOV (i.e., FluoSpec2; Yang et al., 2018) may more appropriately represent the TOC SIF emission but also have difficulty disentangling the sunlit and shaded canopy components.
It is critical that model evaluation relative to measured SIF data and data assimilation studies properly account for the specificities of the instrument (viewing of the instrument, spectral band, and time of the overpass for spaceborne instruments), the representation of canopy emission, and correct observations for directional variations in SIF relative to observation geometry. Although normalizing SIF by reflected radiance partially alleviates scan angle effects, this highlights the need for models to get canopy structure, radiative transfer, and sunlit and shaded fraction correct, which feed all the way through to SIF and GPP. Further ground-based investigations of SIF anisotropy, sunlit and shaded fraction, and vertical distribution (within the canopy, canopy integrated, and top of the canopy) with PhotoSpec and SCOPE may help to inform models on the physical aspects of the signal. Despite the issues we highlight in comparing observations to models, the potentially more interesting and important story here is with respect to model–model comparisons, which reveals a wide divergence in response to light conditions and other factors, as discussed below.
TBM–SIF modeling is too sensitive to APAR
Our results indicate a wide range of SIF responses to APAR: TBM–SIF models and SCOPE are usually far too sensitive to APAR; observations of absolute SIF are less sensitive; and observations of relative SIF (SIFrel) are the least sensitive (Fig. 5d). We remind the reader that SIFrel is normalized by the amount of far-red light reflected from leaves in the FOV of PhotoSpec, and thus has reduced sensitivity to absorbed light compared to absolute SIF. The fact that SIFrel is the least sensitive to APAR means other processes are driving changes in SIF under increased light absorption. In this case, it reveals a strong SIF response to changes in photochemical quenching. SIF models appear especially sensitive to sunlit leaves. In CLM4.5, SIF emissions from the sunlit portion of the canopy are a factor of 5 higher than emissions from shaded leaves, despite there being half as many leaves in the sunlit canopy (Fig. S6c). In CLM4.5, the combination of higher-than-average ϕF (Fig. 5f) with higher fluorescence efficiency in the sunlit portion of the canopy produces an increase in the magnitude and sensitivity to sunlit fraction, thus contributing to the high bias (factor of 3 higher than observed) and strong diurnal cycle (2-fold increase from morning to midday).
Linearity of SIF and GPP yields
Observations show a positive but not significant linear relationship between SIFyield and GPPyield (Fig. S8a; r=0.40) at our study site. This is likely due to the short time period investigated here, where there is relatively little change in SIFyield and GPPyield during peak summer. Half of the models (four of eight) show a significant (r>0.35) linear and positive slope (r>0.35; SCOPE, ORCHIDEE-exp3, CLM4.5-exp3, and BETHY-exp3) between SIFyield and GPPyield, while six models (except CLM5.0) show a significant positive slope between quantum yields (ϕF and ϕP; Fig. S8c). These regression plots of quantum yields, in turn, help explain the observed linearity of SIFyield vs. GPPyield. At least in the case of Niwot Ridge, model (and presumably observed) ϕP stays within high-light “NPQ phase” conditions and generally does not exceed the range in which decoupling of ϕF and ϕP (ϕP>0.6) in low-light “PQ phase” conditions occurs (Porcar-Castell et al., 2014, cf. Fig. 9). SCOPE and BETHY-exp3, which best capture the observed relationship in the canopy between SIFyield and GPPyield, are also the only models that also show a decline in SIFyield with APAR, as discussed below. These results are likely to change when we expand the study to several years; however, the purpose of this study was to provide an initial investigation into the response of modeled SIF and GPP to light during peak summer.
Insufficient decline in SIFyield with APAR
In general, models show an insufficient decline in SIFyield with APAR when compared to observed SIFyield (Fig. 5e). All models except SiB3 and SiB4 show some decline, with BETHY showing the best agreement in slope magnitude. SCOPE and BETHY are the only models with full radiative transfer, but this does not appear to have a substantial impact on SIFyield, which has a similar (albeit suppressed) decline with APAR as ϕF (Fig. 5f). Within-model experiments show little-to-no sensitivity of SIFyield or ϕF decline with APAR to water stress (e.g., ORCHIDEE) or prescribed LAI (e.g., SiB3) but high sensitivity to the formulation of NPQ with respect to species calibration (e.g., BETHY) and reversibility (e.g., CLM4.5).
Three CLM4.5 experiments demonstrate sensitivity to the representation of NPQ variability at diurnal and seasonal scales. The first simulation using the default NPQ parameterization from SCOPE (CLM4.5-exp1; based on a two-parameter fit to drought-stressed Mediterranean species; Galmes et al., 2007) produces the strongest decline in SIFyield. The second simulation, which includes a site-specific NPQ formulation that accounts for kR and kS (CLM4.5-exp2), produces the weakest decline. The third simulation with seasonally varying kR produces a slightly stronger decline. An important point for this formulation is that kR is constrained by PAM fluorometry data at Hyytiälä (Scots pine) and does not account for high-light-saturation values and summer drought conditions that may be more typical of lower-latitude sites such as Niwot Ridge. This could indicate that parameterizing kR based upon similar PFTs may not be sufficient to properly characterize the NPQ response for lower-latitude sites such as Niwot Ridge.
Similar results are found in experiments with BETHY comparing stressed (drought) and unstressed (relative to water availability) NPQ models at NR1 but controlling for kR (constant in time in both cases; stronger negative SIFyield response to APAR in the stressed model). In the unstressed models of CLM4.5 and BETHY, the NPQ response to APAR becomes too low, causing an oversensitivity of SIF to APAR and thus high SIF bias. The strongly regulated NPQ response of the drought-based model enables more nonphotochemical quenching at high light levels in stressed ecosystems compared to typical unstressed plants. While this kNPQ model was developed using drought-stressed plants, similar upregulation of NPQ is expected to occur under any condition where photosynthesis is limited and available excitation energy is high (e.g., cold temperatures and high light; Sveshnikov et al., 2006). Our results thus emphasize the need for the careful implementation of NPQ dynamics for simulating and assimilating SIF in different light and stress environments (Raczka et al., 2019; Norton et al., 2019).
Data assimilation reduces high bias
The assimilation of OCO-2 SIF in ORCHIDEE brings the magnitude of both GPP and SIF in closer agreement with observations. This improvement is driven by decreases in leaf photosynthetic capacity (Vcmax, LAImax, leaf age, and SLA; Bacour et al., 2019), which decreases the magnitude (but not shape) of APAR closer to observed values (Fig. 2) and leads to improvements in GPPyield and SIFyield (Fig. 3). Nevertheless, after the assimilation there are still disagreements in SIFyield vs. GPPyield relative to the measured quantities (Fig. S8). For diurnal and synoptic cycles, the assimilation effectively acts to scale the magnitude of SIF, GPP, and APAR (and related yields), but it does little to alter variability. Although data assimilation (i.e., calibrating model parameters) is critical to improving modeled SIF and GPP, this should be done in conjunction with improvements in the model formulation (as summarized in Sect. 5), otherwise the estimated model parameters can be suboptimal to compensate for the lack of missing processes.
Our results reveal systematic biases across TBM–SIF models affecting leaf-to-canopy simulations of APAR, GPP, and SIF. This highlights key areas where observing strategies and model formulations can be improved:
-
Radiative transfer of incoming and absorbed PAR. The representation of incoming radiative transfer produces positive biases in APAR that leads to positive biases in GPP, both of which occur regardless of the time of day. This is influenced by the characterization of the canopy; leaf orientation and clumping; biochemical content; canopy layers; and leaf area, which dictates the sunlit and shaded fractions of the canopy. Furthermore, the combination of high APAR bias in models and high uncertainty in observed APAR highlights a need for more accurate and representative in situ measurements of APAR within the FOV of SIF observations and footprint of eddy covariance data. We recommend further site-level investigation of observed and simulated canopy light absorption, emphasizing the comparison of multilayer and multi-leaf radiation schemes accounting for sunlit and shaded leaf area.
-
Water stress impacts on photosynthesis. The underlying photosynthetic models fail to simulate the magnitude of the depression of observed GPP in the afternoon, regardless of how stomatal-conductance and water stress models and parameters are formulated. This likely results from the inability to account for afternoon water stress to properly restrict stomatal conductance and hence GPP and SIF. Additional effort is needed to characterize SIF and GPP sensitivity to increased atmospheric demand and/or reduced soil moisture across a range of managed and unmanaged systems. We also recommend more inclusion of stomatal-optimization models (e.g., Eller et al., 2020) as optional parameterizations for TBMs to better account for plant hydraulic functioning under water stress compared to the more widely used semi-empirical models.
-
Leaf mechanism for energy partitioning. We provide evidence that many models fail to capture the correct reversible NPQ response to light saturation, leading to biases in SIFyield during high-light conditions and especially with increasing moisture limitation at the end of summer. Further investigation using models such as BETHY and CLM is needed to better characterize the sensitivity of NPQ formulations to PFT and environmental conditions. We also emphasize a need for more simultaneous measurements of active and passive chlorophyll fluorescence to determine the temporal dynamics of competing pathways (PQ and NPQ) from a wider variety of plant species under ambient conditions and different levels of stress.
-
Radiative transfer of SIF. SIF is emitted from the leaf level and then is transferred to the top of the canopy as a function of canopy structure (leaf geometry, canopy layers, leaf area, and sunlit and shaded fraction). Despite the high disagreement of SCOPE and BETHY with respect to the simulation of APAR and SIF magnitude, we recommend site-level simulations using a similar framework where a radiative transfer model is run both offline and coupled to a terrestrial biosphere model for a more detailed investigation of sensitivity to canopy characteristics.
-
Observation strategy. The PhotoSpec scan strategy enables the direct measurement of SIF emission at the leaf to the canopy scale but requires off-nadir view angles that lead to changing fractions of sunlit and shaded canopies throughout the day as a function of sun angle. Further work could be done using tower-mounted instruments with a wider FOV that more accurately represent top-of-canopy emissions for comparison to model simulations and to classify emissions from shaded vs. sunlit canopies. More effort is also needed to better align models with observations, for example by leveraging three-dimensional capabilities in SCOPE (and other radiative transfer models) to directly account for multiple observation angles.
-
Finally, we note that our focus on a water-limited subalpine evergreen needleleaf forest represents a challenging case study for models and observations. In many cases, there is strong covariance between LAI, SIF, APAR, and GPP in cropping systems (Dechant et al., 2020), but because this study site experiences little change in canopy structure and APAR throughout the season (Magney et al., 2019b), our study sought to provide more explicit insight into the model sensitivity to photosynthesis and fluorescence. As such, it is possible that we would see more convergence of results and a reduction in confounding effects (e.g., decreased NPQ) in a well-watered high-LAI cropping system. We therefore recommend similar model-observation assessments across a wider range of biota and climates.
All observational data (APAR, SIF, GPP, and relative SIF) are provided as hourly time series. The data can be found at https://data.caltech.edu/records/1231. The data are saved as a .csv file.
The supplement related to this article is available online at: https://doi.org/10.5194/bg-17-3733-2020-supplement.
NP, TM, and IB designed the research. NP, TM, AN, BR, CB, FM, IB, YZ, BQ, MS, and DB performed the research. AN, BR, CB, FM, IB, YZ, BQ, MS, and NM contributed model simulations. TM, DB, SP, PB, JS, KG, and CF contributed observational data. NP, TM, AN, and BR analyzed data. NP, TM, AN, BR, CB, IB, YZ, NM, DB, and CF wrote the paper.
The authors declare that they have no conflict of interest.
The US-NR1 AmeriFlux site is supported by the US DOE Office of Science through the AmeriFlux Management Project (AMP) at Lawrence Berkeley National Laboratory (award no. 7094866). BMR was supported by the NASA CMS project (award no. NNX16AP33G) and the US Department of Energy's Office of Science Terrestrial Ecosystem Science program (award nos. DE-SC0010624 and DE-SC0010625). CESM (CLM4.5 and CLM5.0) is sponsored by the National Science Foundation and the US Department of Energy. ORCHIDEE is supported by CNES TOSCA under the FluOR and ECOFLUO projects. ITB was supported by NASA (contract no. 80NSSC18K1312). We would like to thank the W. M. Keck Institute for Space Studies and internal funds from the Jet Propulsion Laboratory for support of the field measurements at Niwot Ridge (https://www.kiss.caltech.edu/techdev/photosynthesis/photosynthesis.html, last access: 6 January 2020). A portion of this research was carried out through the OCO-2 project at the Jet Propulsion Laboratory, California Institute of Technology, under contract with NASA.
This research has been supported by the NASA (grant no. 18-TE18-0062).
This paper was edited by Christopher Still and reviewed by Christiaan van der Tol and Georg Wohlfahrt.
Aasen, H., Van Wittenberghe, S., Medina, N. S., Damm, A., Goulas, Y., Wieneke, S., Hueni, A., Malenovsky, Z., Alonso, L, Pacheco-Labrador, J., and Cendrero-Mateo, M. P.: Sun-induced chlorophyll fluorescence II: Review of passive measurement setups, protocols, and their application at the leaf to canopy level, Remote Sensing, 11, 927, https://doi.org/10.3390/rs11080927, 2019.
Anav, A., Friedlingstein, P., Beer, C., Ciais, P., Harper, A., Jones, C., Murray-Tortarola, G., Papale, D., Parazoo, N. C., Peylin, P., and Piao, S.: Spatiotemporal patterns of terrestrial gross primary production: A review, Rev. Geophys., 53, 785–818, https://doi.org/10.1002/2015RG000483, 2015.
Albert, L. P., Keenan, T. F., Burns, S. P., Huxman, T. E., and Monson, R. K.: Climate controls over ecosystem metabolism: insights from a fifteen-year inductive artificial neural network synthesis for a subalpine forest, Oecologia, 184, 25–41, https://doi.org/10.1007/s00442-017-3853-0, 2017.
Bacour, C., Maignan, F., MacBean, N., Porcar-Castell, A., Flexas, J., Frankenberg, C., Peylin, P., Chevallier, F., Vuichard, N., and Bastrikov, V.: Improving estimates of Gross Primary Productivity by assimilating solar-induced fluorescence satellite retrievals in a terrestrial biosphere model using a process-based SIF model, J. Geophys. Res.-Biogeo., 124, 3281–3306, 2019.
Badgley, G., Field, C. B., and Berry, J. A.: Canopy near-infrared reflectance and terrestrial photosynthesis, Sci. Adv., 3, 1–6, https://doi.org/10.1126/sciadv.1602244, 2017.
Baker, I. T., Denning, A. S., Hanan, N., Prihodko, L., Vidale, P.-L., Davis, K., and Bakwin, P.: Simulated and observed fluxes of sensible and latent heat and CO2 at the WLEF-TV Tower using SiB2.5, Glob. Change Biol., 9, 1262–1277, 2003.
Baker, I. T., Prihodko, L., Denning, A. S., Goulden, M., Milller, S., and da Rocha, H.: Seasonal Drought Stress in the Amazon: Reconciling Models and Observations, J. Geophys. Res., 113, G00B01, https://doi.org/10.1029/2007JG000644, 2008.
Ball, J. T., Woodrow, I. E., and Berry, J. A.: A model predicting stomatal conductance and its contribution to the control of photosynthesis under different environmental conditions, in: Progress in photosynthesis research, Springer, Providence, Rhode Island, USA, 221–224, 1987.
Burns, S. P., Blanken, P. D., Turnipseed, A. A., Hu, J., and Monson, R. K.: The influence of warm-season precipitation on the diel cycle of the surface energy balance and carbon dioxide at a Colorado subalpine forest site, Biogeosciences, 12, 7349–7377, https://doi.org/10.5194/bg-12-7349-2015, 2015.
Burns, S. P., Swenson, S. C., Wieder, W. R., Lawrence, D. M., Bonan, G. B., Knowles, J. F., and Blanken, P. D.: A comparison of the diel cycle of modeled and measured latent heat flux during the warm season in a Colorado subalpine forest, J. Adv. Model. Earth Sy., 10, 617–651, 2018.
Chen, J. M., Liu, J., Cihlar, J., and Goulden, M. L.: Daily canopy photosynthesis model through temporal and spatial scaling for remote sensing applications, Ecol. Model., 124, 99–119, 1999.
Cogliati, S., Rossini, M., Julitta, T., Meroni, M., Schickling, A., Burkart, A., Pinto, F., Rascher, U., and Colombo, R.: Continuous and long-term measurements of reflectance and sun-induced chlorophyll fluorescence by using novel automated field spectroscopy systems, Remote Sens. Environ., 164, 270–281, https://doi.org/10.1016/j.rse.2015.03.027, 2015.
Collatz, G., Ball, J., Grivet, C., and Berry, J. A.: Physiological and environmental regulation of stomatal conductance, photosynthesis and transpiration: a model that includes a laminar boundary layer, Agr. Forest Meteorol., 54, 107–136, https://doi.org/10.1016/0168-1923(91)90002-8, 1991.
Collatz, G. J., Ribas-Carbo, M., and Berry, J.: Coupled photosynthesis-stomatal conductance model for leaves of C4 plants, Funct. Plant Biol., 19, 519–538, 1992.
Daumard, F., Champagne, S., Fournier, A., Goulas, Y., Ounis, A., Hanocq, J. F., and Moya, I.: A field platform for continuous measurement of canopy fluorescence, IEEE T. Geosci. Remote Sens., 48, 3358–3368, https://doi.org/10.1109/TGRS.2010.2046420, 2010.
Dechant,B., Ryu, Y., Badgley, G., Zeng, Y., Berry, J. A., Zhang, Y., Goulas, Y., Li, Z., Zhang, Q., Kang, M., Li, J., and Moya, I.: Canopy structure explains the relationship between photosynthesis and sun-induced chlorophyll fluorescence in crops, Remote Sens. Environ., 241, 111733, https://doi.org/10.1016/j.rse.2020.111733, 2020.
Demmig-Adams, B. and Adams, W. W.: Photoprotection in an ecological context: The remarkable complexity of thermal energy dissipation, New Phytol., 172, 11–21, https://doi.org/10.1111/j.1469-8137.2006.01835.x, 2006.
Demmig-Adams, B., Cohu, C. M., Muller, O., and Adams, W. W.: Modulation of photosynthetic energy conversion efficiency in nature: from seconds to seasons, Photosynth. Res., 113, 75–88, https://doi.org/10.1007/s11120-012-9761-6, 2012.
Dufresne, J.-L., Foujols, M.-A., Denvil, S., Caubel, A., Marti, O., Aumont, O., Balkanski, Y., Bekki, S., Bellenger, H., Benshila, R., and Bony, S.: Climate change projections using the IPSL-CM5 Earth System Model: from CMIP3 to CMIP5, Clim. Dynam., 40, 2123–2165, 2013.
Eller, C. B., Rowland, L., Mencuccini, M., Rosas, T., Williams, K., Harper, A., Medlyn, B. E., Wagner, Y., Klein, T., Teodoro, G. S., and Oliveira, R. S.: Stomatal optimisation based on xylem hydraulics (SOX) improves land surface model simulation of vegetation responses to climate, New Phytol., 226, 1622–1637, 2020.
Farquhar, G. V., von Caemmerer, S. V., and Berry, J.: A biochemical model of photosynthetic CO2 assimilation in leaves of C3 species, Planta, 149, 78–90, 1980.
Flexas, J., Escalona, J. M., Evain, S., Gulías, J., Moya, I., Osmond, C. B., and Medrano, H.: Steady-state chlorophyll fluorescence (Fs) measurements as a tool to follow variations of net CO2 assimilation and stomatal conductance during water-stress in C3 plants, Physiol. Plantarum, 114, 231–240, https://doi.org/10.1034/j.1399-3054.2002.1140209.x, 2002.
Friedlingstein, P., Meinshausen, M., Arora, V. K., Jones, C. D., Anav, A., Liddicoat, S. K., and Knutti, R.: Uncertainties in CMIP5 climate projections due to carbon cycle feedbacks, J. Climate, 27, 511–526, 2014.
Galmés, J., Flexas, J., Savé, R., and Medrano, H.: Water relations and stomatal characteristics of Mediterranean plants with different growth forms and leaf habits: responses to water stress and recovery, Plant Soil, 290, 139–155, 2007.
Genty, B., Briantais, J.-M., and Baker, N. R.: The relationship between the quantum yield of photosynthetic electron transport and quenching of chlorophyll fluorescence, Biochimica et Biophysica Acta (BBA) - General Subjects, 990, 87–92, https://doi.org/10.1016/S0304-4165(89)80016-9, 1989.
Grossmann, K., Frankenberg, C., Magney, T. S., Hurlock, S. C., Seibt, U., and Stutz, J.: PhotoSpec: A new instrument to measure spatially distributed red and far-red Solar-Induced Chlorophyll Fluorescence, Remote Sens. Environ., 216, 311–327, https://doi.org/10.1016/j.rse.2018.07.002, 2018.
Gu, L., Han, J., Wood, J. D., Chang, C. Y., and Sun, Y.: Sun-induced Chl fluorescence and its importance for biophysical modeling of photosynthesis based on light reactions, New Phytol., 223, 1179–1191, https://doi.org/10.1111/nph.15796, 2019a.
Gu, L., Wood, J. D., Chang, C. Y. Y., Sun, Y., and Riggs, J. S.: Advancing Terrestrial Ecosystem Science With a Novel Automated Measurement System for Sun-Induced Chlorophyll Fluorescence for Integration With Eddy Covariance Flux Networks, J. Geophys. Res.-Biogeo., 124, 127–146, https://doi.org/10.1029/2018JG004742, 2019b.
Haynes, K., Baker, I. T., Denning, S., Stöckli, R., Schaefer, K., Lokupitiya, E. Y., and Haynes, J. M.: Representing grasslands using dynamic prognostic phenology based on biological growth stages: 1. Implementation in the Simple Biosphere Model (SiB4), J. Adv. Model. Earth Sy., 11, 4423–4439, https://doi.org/10.1029/2018MS001540, 2019a.
Haynes, K. D., Baker, I. T.,Denning, A. S., Wolf, S., Wohlfahrt, G., Kiely, G., Minaya, R. C., and Haynes, J. M.: Representing grasslands using dynamic prognostic phenology based on biological growth stages: 2. Carbon cycling, J. Adv. Model. Earth Sy., 11, 4440–4465, https://doi.org/10.1029/2018MS001541, 2019b.
Hu, J., Moore, D. J. P., Burns, S. P., and Monson, R. K.: Longer growing seasons lead to less carbon sequestration by a subalpine forest, Glob. Change Biol., 16, 771–783, doi:10.1111/j.1365-2486.2009.01967.x, 2010.
Julitta, T., Burkart, A., Colombo, R., Rossini, M., Schickling, A., Migliavacca, M., Cogliati, S., Wutzler, T., and Rascher, U.: Accurate measurements of fluorescence in the O2A and O2B band using the FloX spectroscopy system – results and prospects, in: Proc. Potsdam GHG Flux Workshop: From Photosystems to Ecosystems, 24–26 October 2017, Potsdam, Germany, https://www.potsdam-flux-workshop.eu/ (last access: 7 January 2019), 2017
Kaminski, T., Knorr, W., Schürmann, G., Scholze, M., Rayner, P. J., Zaehle, S., Blessing, S., Dorigo, W., Gayler, V., Giering, R., and Gobron, N.: The BETHY/JSBACH carbon cycle data assimilation system: Experiences and challenges, J. Geophys. Res.-Biogeo., 118, 1414–1426, 2013.
Kennedy, D., Swenson, S., Oleson, K. W., Lawrence, D. M., Fisher, R., Lola da Costa, A. C., and Gentine, P.: Implementing plant hydraulics in the community land model, version 5, J. Adv. Model. Earth Sy., 11, 485–513, 2019.
Koffi, E. N., Rayner, P. J., Scholze, M., and Beer, C.: Atmospheric constraints on gross primary productivity and net ecosystem productivity: Results from a carbon-cycle data assimilation system, Global Biogeochem. Cy., 26, https://doi.org/10.1029/2010GB003900, 2012.
Koffi, E. N., Rayner, P. J., Norton, A. J., Frankenberg, C., and Scholze, M.: Investigating the usefulness of satellite-derived fluorescence data in inferring gross primary productivity within the carbon cycle data assimilation system, Biogeosciences, 12, 4067–4084, https://doi.org/10.5194/bg-12-4067-2015, 2015.
Krinner, G., Viovy, N., de Noblet-Ducoudré, N., Ogée, J., Polcher, J., Friedlingstein, P., Ciais, P., Sitch, S., and Prentice, I. C.: A dynamic global vegetation model for studies of the coupled atmosphere-biosphere system, Global Biogeochem. Cy., 19, https://doi.org/10.1029/2003GB002199, 2005.
Köhler, P., Guanter, L., Kobayashi, H., Walther, S., and Yang, W.: Assessing the potential of sun-induced fluorescence and the canopy scattering coefficient to track large-scale vegetation dynamics in Amazon forests, Remote Sens. Environ., 204, 769–785, https://doi.org/10.1016/j.rse.2017.09.025, 2018.
Lasslop, G., Reichstein, M., Papale, D., Richardson, A., Arneth, A., Barr, A., Stoy, P., and Wohlfahrt, G.: Separation of net ecosystem exchange into assimilation and respiration using a light response curve approach: Critical issues and global evaluation, Glob. Change Biol., 16, 187–208, https://doi.org/10.1111/j.1365-2486.2009.02041.x, 2010.
Lawrence, D. M., Fisher, R. A., Koven, C. D., Oleson, K. W., Swenson, S. C., Bonan, G., Collier, N., Ghimire, B., van Kampenhout, L., Kennedy, D., and Kluzek, E.: The Community Land Model Version 5: Description of New Features, Benchmarking, and Impact of Forcing Uncertainty, J. Adv. Model. Earth Syst., 11, 4245–4287, https://doi.org/10.1029/2018MS001583, 2019.
Lee, J.-E., Berry, J. A., van der Tol, C., Yang, X., Guanter, L., Damm, A., Baker, I., and Frankenberg, C.: Simulations of chlorophyll fluorescence incorporated into the Community Land Model version 4, Glob. Change Biol., 21, 3469–3477, 2015.
Leuning R.: A critical appraisal of a combined stomatal-photosynthesis model for C3 plants, Plant Cell Environ., 18, 339–357, 1995.
Leuning, R., Francis, M., Kelliher, D. G., De Pury, G., and Schulze, E.-D.: Leaf nitrogen, photosynthesis, conductance and transpiration: scaling from leaves to canopies, Plant Cell Environ., 18, 1183–1200, 1995.
Li, Z., Zhang, Q., Li, J., Yang, X., Wu, Y., Zhang, Z., Wang, S., Wang, H., and Zhang, Y.: Solar-induced chlorophyll fluorescence and its link to canopy photosynthesis in maize from continuous ground measurements, Remote Sens. Environ., 236, 111420, https://doi.org/10.1016/j.rse.2019.111420, 2020.
Liu, J., Chen, J. M., and Cihlar, J.: Mapping evapotranspiration based on remote sensing: An application to Canada's landmass, Water Resour. Res., 39, https://doi.org/10.1029/2002WR001680, 2003.
Magney, T. S., Frankenberg, C., Fisher, J. B., Sun, Y., North, G. B., and Davis, T. S.: Connecting active to passive fluorescence with photosynthesis?: a method for evaluating remote sensing measurements of Chl fluorescence, New Phytol., 215, 1594–1608, https://doi.org/10.1111/nph.14662, 2017.
Magney, T. S., Frankenberg, C., Köhler, P., North, G., Davis, T. S., Dold, C., Dutta, D., Fisher, J. B., Grossmann, K., Harrington, A., and Hatfield, J.: Disentangling Changes in the Spectral Shape of Chlorophyll Fluorescence: Implications for Remote Sensing of Photosynthesis, J. Geophys. Res.-Biogeo., 124, 1491–1507, https://doi.org/10.1029/2019JG005029, 2019a.
Magney, T. S., Bowling, D. R., Logan, B., Grossmann, K., Stutz, J., and Blanken, P.: Mechanistic evidence for tracking the seasonality of photosynthesis with solar-induced fluorescence, P. Natl. Acad. Sci. USA, 116, 11640–11645, https://doi.org/10.1073/pnas.1900278116, 2019b.
Magney, T., Frankenberg, C., Grossmann, K., Bowling, D., Logan, B., Burns, S., and Stutz, J.: Canopy and needle scale fluorescence data from Niwot Ridge, Colorado 2017–2018 (Version 1.1) [Data set], CaltechDATA, CalTech, Pasadena, CA, USA, https://doi.org/10.22002/d1.1231, 2019c.
Medlyn, B. E., Duursma, R. A., Eamus, D., Ellsworth, D. S., Prentice, I. C., Barton, C. V. M., Crous, K. Y., De Angelis, P., Freeman, M., and Wingate, L.: Reconciling the optimal and empirical approaches to modelling stomatal conductance, Glob. Change Biol., 17, 2134–2144, https://doi.org/10.1111/j.1365-2486.2010.02375.x, 2011.
Miao, G., Guan, K., Yang, X., Bernacchi, C. J., Berry, J. A., DeLucia, E. H., Wu, J., Moore, C. E., Meacham, K., Cai, Y., and Peng, P.: Sun-Induced Chlorophyll Fluorescence, Photosynthesis, and Light Use Efficiency of a Soybean Field from Seasonally Continuous Measurements, J. Geophys. Res.-Biogeo., 123, 610–623, https://doi.org/10.1002/2017JG004180, 2018.
Miguez, F., Fernández-Marin, B., Becerril, J. M., and Garcia-Plazaola, J. I.: Activation of photoprotective winter photoinhibition in plants from different environments: a literature compilation and meta-analysis, Physiol. Plantarum, 155, 414–423, 2015.
Migliavacca, M., Perez-Priego, O., Rossini, M., El-Madany, T. S., Moreno, G., van der Tol, C., Rascher, U., Berninger, A., Bessenbacher, V., Burkart, A., and Carrara, A.: Plant functional traits and canopy structure control the relationship between photosynthetic CO2 uptake and far-red sun-induced fluorescence in a Mediterranean grassland under different nutrient availability, New Phytol., 214, 1078–1091, 2017.
Mohammed, G. H., Colombo, R., Middleton, E. M., Rascher, U., van der Tol, C., Nedbal, L., Goulan, Y., Perez-Priego, O., Damm, A., Meroni, M. and Joiner, J.: Remote sensing of solar-induced chlorophyll fluorescence (SIF) in vegetation: 50 years of progress, Remote Sens. Environ., 231, 111177, https://doi.org/10.1016/j.rse.2019.04.030, 2019.
Monson, R. K., Turnipseed, A. A., Sparks, J. P., Harley, P. C., Scott-Denton, L. E., Sparks, K., and Huxman, T. E.: Carbon sequestration in a high-elevation, subalpine forest, Glob. Change Biol., 8, 459–478, 2002.
Monteith, J. L.: Solar Radiation and Productivity in Tropical Ecosystems, J. Appl. Ecol., 9, 747–766, https://doi.org/10.2307/2401901, 1972.
Norton, A. J., Rayner, P. J., Koffi, E. N., and Scholze, M.: Assimilating solar-induced chlorophyll fluorescence into the terrestrial biosphere model BETHY-SCOPE v1.0: model description and information content, Geosci. Model Dev., 11, 1517–1536, https://doi.org/10.5194/gmd-11-1517-2018, 2018.
Norton, A. J., Rayner, P. J., Koffi, E. N., Scholze, M., Silver, J. D., and Wang, Y.-P.: Estimating global gross primary productivity using chlorophyll fluorescence and a data assimilation system with the BETHY-SCOPE model, Biogeosciences, 16, 3069–3093, https://doi.org/10.5194/bg-16-3069-2019, 2019.
Parazoo, N. C., Frankenberg, C., Köhler, P., Joiner, J., Yoshida, Y., Magney, T., Sun, Y., and Yadav, V.: Towards a Harmonized Long‐Term Spaceborne Record of Far‐Red Solar‐Induced Fluorescence, J. Geophys. Res.-Biogeo., 1–22, https://doi.org/10.1029/2019JG005289, 2019.
Porcar-Castell, A.: A high-resolution portrait of the annual dynamics of photochemical and non-photochemical quenching in needles of Pinus sylvestris, Physiol. Plantarum, 143, 139–153, https://doi.org/10.1111/j.1399-3054.2011.01488.x, 2011.
Porcar-Castell, A., Tyystjärvi, E., Atherton, J., Van Der Tol, C., Flexas, J., Pfündel, E. E., Moreno, J., Frankenberg, C., and Berry, J. A.: Linking chlorophyll a fluorescence to photosynthesis for remote sensing applications: Mechanisms and challenges, J. Exp. Bot., 65, 4065–4095, https://doi.org/10.1093/jxb/eru191, 2014.
Qiu, B., Chen, J. M., Ju, W., Zhang, Q., and Zhang, Y.: Simulating emission and scattering of solar-induced chlorophyll fluorescence at far-red band in global vegetation with different canopy structures, Remote Sens. Environ., 233, 111373, https://doi.org/10.1016/j.rse.2019.111373, 2019.
Raczka, B., Duarte, H. F., Koven, C. D., Ricciuto, D., Thornton, P. E., Lin, J. C., and Bowling, D. R.: An observational constraint on stomatal function in forests: evaluating coupled carbon and water vapor exchange with carbon isotopes in the Community Land Model (CLM4.5), Biogeosciences, 13, 5183–5204, https://doi.org/10.5194/bg-13-5183-2016, 2016.
Raczka, B., Porcar-Castell, A., Magney, T., Lee, J. E., Köhler, P., Frankenberg, C., Grossman, K., Logan, B. A., Stutz, J., Blanken, P. D., Burns, S. P., Duarte, H., Yang, X., Lin, J. C., and Bowling, D. R.: Sustained nonphotochemical quenching shapes the seasonal pattern of solar-induced fluorescence at a high-elevation evergreen forest, J. Geophys. Res.-Biogeo., 124, 2005–2020, https://doi.org/10.1029/2018JG004883, 2019.
Rayner, P. J., Scholze, M., Knorr, W., Kaminski, T., Giering, R., and Widmann, H.: Two decades of terrestrial carbon fluxes from a carbon cycle data assimilation system (CCDAS), Global Biogeochem. Cy., 19, https://doi.org/10.1029/2004GB002254, 2005.
Reichstein, M., Falge, E., Baldocchi, D., Papale, D., Aubinet, M., Berbigier, P., Bernhofer, C., Buchmann, N., Gilmanov, T., Granier, A., and Grunwald, T.: On the separation of net ecosystem exchange into assimilation and ecosystem respiration: Review and improved algorithm, Glob. Change Biol.,, 11, 1424–1439, https://doi.org/10.1111/j.1365-2486.2005.001002.x, 2005.
Schreiber, U., Schliwa, U., and Bilger, W.: Continuous recording of photochemical and non-photochemical chlorophyll fluorescence quenching with a new type of modulation fluorometer, Photosynth. Res., 10, 51–62, 1986.
Sellers, P. J., Randall, D. A., Collatz, G. J., Berry, J. A., Field, C. B., Dazlich, D. A., Zhang, C., Collelo, G. D., and Bounoua, L.: A revised land surface parameterization (SiB2) for atmospheric GCMs. Part I: Model formulation, J. Climate, 9, 676–70, 1996.
Shan, N., Ju, W., Migliavacca, M., Martini, D., Guanter, L., Chen, J., Goulas, Y., and Zhang, Y.: Modeling canopy conductance and transpiration from solar-induced chlorophyll fluorescence, Agr. Forest Meteorol., 268, 189–201, 2019.
Sun, Y., Frankenberg, C., Wood, J. D., Schimel, D. S., Jung, M., Guanter, L., Drewry, D. T., Verma, M., Porcar-Castell, A., Griffis, T. J., and Gu, L.: OCO-2 advances photosynthesis observation from space via solar-induced chlorophyll fluorescence, Science, 358, https://doi.org/10.1126/science.aam5747, 2017.
Sperry, J. S. and Love, D. M.: What plant hydraulics can tell us about responses to climate-change droughts, New Phytol., 207, 14–27, https://doi.org/10.1111/nph.13354, 2015.
Svishnikov, D., Ensminger, I., Ivanov, A. G., Campbell, D., Lloyd, J., Funk, C., Huner, N. P. A., and Oquist, G.: Excitation energy partitioning and quenching during cold acclimation in Scots pine, Tree Physiol., 26, 325–336, 2006.
Thum, T., Zaehle, S., Köhler, P., Aalto, T., Aurela, M., Guanter, L., Kolari, P., Laurila, T., Lohila, A., Magnani, F., Van Der Tol, C., and Markkanen, T.: Modelling sun-induced fluorescence and photosynthesis with a land surface model at local and regional scales in northern Europe, Biogeosciences, 14, 1969–1987, https://doi.org/10.5194/bg-14-1969-2017, 2017.
van der Tol, C., Verhoef, W., Timmermans, J., Verhoef, A., and Su, Z.: An integrated model of soil-canopy spectral radiances, photosynthesis, fluorescence, temperature and energy balance, Biogeosciences, 6, 3109–3129, https://doi.org/10.5194/bg-6-3109-2009, 2009.
van der Tol, C., Verhoef, W., and Rosema, A.: A model for chlorophyll fluorescence and photosynthesis at leaf scale, Agr. Forest Meteorol., 149, 96–105, https://doi.org/10.1016/j.agrformet.2008.07.007, 2009.
van der Tol, C., Berry, J. A., Campbell, P. K. E., and Rascher, U.: Models of fluorescence and photosynthesis for interpreting measurements of solar-induced chlorophyll fluorescence, J. Geophys. Res.-Biogeo., 119, 2312–2327, https://doi.org/10.1002/2014JG002713, 2014.
Wohlfahrt, G., Gerdel, K., Migliavacca, M., Rotenberg, E., Tatarinov, F., Müller, J., Hammerle, A., Julitta, T., Spielmann, F. M., and Yakir, D.: Sun-induced fluorescence and gross primary productivity during a heat wave, Sci. Rep.-UK, 8, 1–9, 2018.
Yang, P. and van der Tol, C.: Linking canopy scattering of far-red sun-induced chlorophyll fluorescence with reflectance, Remote Sens. Environ., 209, 456–467, https://doi.org/10.1016/j.rse.2018.02.029, 2018.
Yang, H., Yang, X., Zhang, Y., Heskel, M. A., Lu, X., Munger, J. W., Sun, S., and Tang, J.: Chlorophyll fluorescence tracks seasonal variations of photosynthesis from leaf to canopy in a temperate forest, Glob. Change Biol., 23, 2874–2886, https://doi.org/10.1111/gcb.13590, 2017.
Yang, X., Tang, J., Mustard, J. F., Lee, J.-E., Rossini, M., Joiner, J., Munger, J. W., Kornfeld, A., and Richardson, A. D.: Solar-induced chlorophyll fluorescence that correlates with canopy photosynthesis on diurnal and seasonal scales in a temperate deciduous forest, Geophys. Res. Lett., 42, 2977–2987, doi:10.1002/2015GL063201, 2015.
Yang, X., Shi, H., Stovall, A., Guan, K., Miao, G., Zhang, Y., Xiao, X., Ryu, Y., and Lee, J. E.: FluoSpec 2 – an automated field spectroscopy system to monitor canopy solar-induced fluorescence, Sensors (Switzerland), 18, https://doi.org/10.3390/s18072063, 2018.
Yin, X. and Struik, P. C.: C3 and C4 photosynthesis models: an overview from the perspective of crop modelling, NJAS-Wagen. J. Life Sc., 57, 27–38, 2009.
Zeng, Y., Badgley, G., Dechant, B., Ryu, Y., Chen, M., and Berry, J. A.: A practical approach for estimating the escape ratio of near-infrared solar-induced chlorophyll fluorescence, Remote Sens. Environ., 232, 111209, https://doi.org/10.1016/j.rse.2019.05.028, 2019.
Zhang, Y., Guanter, L., Berry, J. A., van der Tol, C., Yang, X., Tang, J., and Zhang, F.: Model-based analysis of the relationship between sun-induced chlorophyll fluorescence and gross primary production for remote sensing applications, Remote Sens. Environ., 187, 145–155, 2016.
Zhang, Q., Zhang, X., Li, Z., Wu, Y., and Zhang, Y: Comparison of Bi-Hemispherical and Hemispherical-Conical Configurations for in situ Measurements of Solar-Induced Chlorophyll Fluorescence, Remote Sensing, 11, 2642, 2019.