the Creative Commons Attribution 4.0 License.
the Creative Commons Attribution 4.0 License.
 | 25 Sep 2020
OH reactivity from the emissions of different tree species: investigating the missing reactivity in a boreal forest
Toni Tykkä
Simon Schallhart
Virpi Tarvainen
Jaana Bäck
Heidi Hellén
In forested area, a large fraction of total hydroxyl radical (OH) reactivity remains unaccounted for. Very few studies have looked at the variations in total OH reactivity from biogenic emissions. In the present study, we investigate the total OH reactivity from three common boreal tree species (Scots pine, Norway spruce, and downy birch) by comparing it with the calculated reactivity from the chemically identified emissions. Total OH reactivity was measured using the comparative reactivity method (CRM), and the chemical composition of the emissions was quantified with two gas chromatographs coupled with mass spectrometers (GC–MSs). Dynamic branch enclosures were used, and emissions from one branch of a tree at the time were measured by periodically rotating between them.
Results show that birch had the highest values of total OH reactivity of the emissions (TOHRE), while pine had the lowest. The main drivers for the known reactivity of pine and spruce were monoterpenes and sesquiterpenes. Birch emissions were dominated by sesquiterpenes, but monoterpenes and green leaf volatiles (GLVs) were present as well. However, calculated reactivity values remained low, leading to the highest missing fraction of reactivity (>96 %), while pine and spruce had similar missing reactivity fractions between 56 % and 82 % (higher in the spring and decreasing as the summer proceeded). The high average values were driven by low-reactivity periods, and the fraction of missing reactivity got smaller for pine and spruce when the TOHRE values increased. Important exceptions were identified for periods when the emission profiles changed from terpenes to GLVs, a family of compounds containing a backbone of six carbon atoms with various functionalities (e.g. alcohols, aldehydes, esters) that indicate that the plant is suffering from stress. Then, very high TOHRE values were measured, and the missing fraction remained high.
This study found a different trend in the missing OHRE fraction of the Norway spruce from spring to autumn compared to one previous study (Nölscher et al., 2013), which indicates that additional studies are required to fully understand the complexity of biogenic reactive emissions. Future studies of boreal trees in situ should be conducted to confirm the findings presented.
- Article
(12568 KB) - Full-text XML
- BibTeX
- EndNote


The boreal forest is the largest continuous terrestrial biome and represents a third of forested areas (Keenan et al., 2015). It is a large source of volatile organic compounds (VOCs), such as isoprene (C5H8), monoterpenes (C10H16), and sesquiterpenes (C15H24), as well as some oxidised compounds such as methanol, acetaldehyde, and acetone (e.g. Lindfors and Laurila, 2000; Rinne et al., 2009). These compounds are emitted by vegetation and are therefore referred to as biogenic VOCs (BVOCs). Once in the atmosphere, these emissions undergo oxidation reactions by hydroxyl radical (OH), ozone (O3), and nitrate radical (NO3), and therefore they influence the lifetime and concentrations of these oxidants. Moreover, the oxidation of VOCs in the atmosphere can lead to the formation of secondary aerosol formation and may play a role in photochemical air pollution by affecting levels of oxidants and pollutants.
OH is very reactive and, therefore, is difficult to measure as well as to model (e.g. Heard and Pilling, 2003; Lelieveld et al., 2016). Its lifetime varies spatially over time due to variations in OH sinks. When observed OH concentrations are lower than predicted by global models, it is an indication of missing OH sinks in the models. To estimate the magnitude of missing OH chemical sinks, Kovacs and Brune (2001) started measuring total OH loss rates to compare with model results. The total OH loss rate (also known as total OH reactivity) is defined as the inverse of the OH lifetime; high total OH reactivity values translate into large OH sinks and short atmospheric OH lifetimes. Total OH reactivity measurements are therefore viewed as a tool to assess the exhaustiveness of chemical composition measurements of the atmosphere. These kinds of measurements have since been performed in various environments (see the review by Yang et al., 2016), and Williams and Brune (2015) advocate for the widespread use of such measurements at monitoring stations. Based on these studies, Ferracci et al. (2018) modelled global OH reactivity to investigate the missing OH sinks.
By comparing the total OH reactivity with the reactivity derived from the known chemical composition of a sample, the gap in chemical composition knowledge can be identified. Particularly in forest environments where these measurements have been made, this gap was found to be large. Di Carlo et al. (2004) first observed this missing reactivity at the Harvard Forest station, and this was later seen in other forests as well. Measurements of the total OH reactivity using the comparative reactivity method (CRM; Sinha et al., 2008) in a boreal forest at the SMEAR II station in Hyytiälä, Finland, for instance, have shown that less than half of the OH reactivity can be explained by the measured VOCs (Sinha et al., 2010; Nölscher et al., 2012). The missing fraction at this site (up to 89 % for periods during which the forest experienced stressed conditions in Nölscher et al., 2012) is suspected to be the result of the incapacity to measure reactive compounds due to instrumental limitations. These compounds can be either VOCs directly emitted from the ecosystem (vegetation or soil) or oxidation compounds that are formed in the atmosphere through oxidation reactions of these emitted compounds. However, Praplan et al. (2019) recently demonstrated that including modelled oxidation products of VOCs that are not measured is not sufficient to explain the missing OH reactivity at SMEAR II.
Therefore, it becomes important to consider that the chemical composition of biogenic emissions has not been fully characterised. Applying total OH reactivity measurements to emissions allows for estimating its unknown fraction (in terms of reactivity) in a similar fashion. Previous measurements of the total OH reactivity of the emissions (TOHRE) were inconclusive. For instance, Kim et al. (2011) found that the TOHRE of four tree species matched the calculated OH reactivity of the emissions (COHRE, calculated from individually quantified compounds in the emissions). However, these measurements were performed for very short time periods (<24 h for each species). In contrast, Nölscher et al. (2013) found that, while the TOHRE from the Norway spruce could be almost fully explained in the spring (15 % missing reactivity), TOHRE values were much higher than COHRE in the summer (84 % missing reactivity) and in the autumn (70 % missing reactivity).
To further investigate the exhaustiveness of our knowledge of biogenic emissions and their specific influence on the observed missing OH reactivity, measurements were taken for the comprehensive, simultaneous VOC and OH reactivity of emissions from three common boreal tree species at a boreal forest station, the second Station for Measuring Ecosystem-Atmosphere Relations (SMEAR II) in Hyytiälä, Finland. The measurements alternated between seedlings of Scots pine (Pinus sylvestris), Norway spruce (Picea abies), and downy birch (Betula pubescens) trees and lasted from May to October 2017.
2.1 Measurement site
Measurements were conducted at SMEAR II in Hyytiälä, Finland, (61∘51′ N, 24∘17′ E, 181 m above sea level; see Hari and Kulmala, 2005), about 60 km northeast of the city of Tampere. The station is located in a ca. 60-year-old managed mixed conifer forest dominated by Scots pine (Pinus sylvestris) homogeneously for about 200 m in all directions from its mast, which carries instrumentation for various observations. These data and additional data acquired at the site are available via the Smart-SMEAR portal (https://avaa.tdata.fi/web/smart/smear/search, last access: 7 February 2020; Junninen et al., 2009).
For this study, the measurements were done at a container located next to an opening about 115 m south of the mast. The instrumentation to measure VOC emissions (Sect. 2.4) and TOHRE (Sect. 2.5.1) was located inside the container. The seedlings used in this study (Sect. 2.2) were located just outside of the container and received direct sunlight for most of the day. Branch enclosures (Sect. 2.3) were used to investigate their emissions.
2.2 Seedlings
Seedlings for each of the studied tree species – Scots pine (Pinus sylvestris), Norway spruce (Picea abies), and downy birch (Betula pubescens) – were brought from a commercial nursery (Harviala Oy, Harviala, Finland) to the site. The seedlings were 100–150 cm tall, and they were planted in 10 L plastic pots in a mixture of sand and peat and were watered regularly. The use of seedlings in pots was mostly practical as it was easier to bring them close to the instruments that characterise the emissions; moving the instruments' container closer to the trees of interest is not possible. Additionally, extremely long sampling lines and wall losses could be avoided. Emissions from the seedlings might not be representative per se. Nevertheless, put in perspective with results from other studies, they provide valuable information for any potential upscaling effort.
For each tree, the enclosure was moved to a different branch twice during the campaign. Each time this occurred and at the end of the last measurement period, the branch from which the emissions were measured last was cut in order to determine the dry weight of the needles' or leaves' biomass for three periods for each tree. To do so, the needles or leaves from the cut branches were dried at 80 ∘C overnight and subsequently weighed. Dry weights of the needles or leaves of the different branches can be found in Table B1 in Appendix B.
No correction for the growth of the biomass was applied during the growth period (May–June) as the cutting of the branches happened in general right after the measurement period, so it can be assumed that the changes in biomass remain small compared to other uncertainties of total OH reactivity measurements.
Bertin et al. (1997) showed that branch-to-branch variability (for sun-exposed branches) is of a similar magnitude as tree-to-tree variability (for the evergreen oak). However, a large difference (190 %) was observed between sun-exposed branches and shade-adapted branches. In our study, the branches are exposed to both sunlight and shade, depending on the time of the day. We assume that the variability from branch to branch to also be similar to that from tree to tree in the present study.
2.3 Dynamic branch enclosures
Hakola et al. (2006) describe the method used in detail. Briefly, the enclosure consists of a ca. 6 L cylinder made of transparent Teflon, which is attached to the branch on one side and to a Teflon frame equipped with inlet and outlet ports on the other side. VOC-free air provided by a generator (HPZA-7000, Parker Balston, Lancaster, NY, USA) flows through the enclosure at about 4 L min−1 (flow f). The relative humidity (RH) and the temperature in the enclosure were recorded with a thermistor (Philips KTY 80/110, Royal Philips Electronics, Amsterdam, Netherlands), and the photosynthetically active radiation (PAR) was measured with a quantum sensor (LI-190SZ, LI-COR, Biosciences, Lincoln, USA) placed on top of the enclosure frame.
In this study, three branch enclosures were used so that they could be set up 1 or 2 weeks before the measurements of the emissions in order to reduce the stress (and the association emissions) caused by handling the branches to a minimum. During that time, the enclosure was left open, and it was only when the measurement started that the enclosure was carefully closed with transparent Teflon film, which could nevertheless result in a low level of stress.
The temperature difference between ambient conditions and those inside the enclosure is presented in Appendix C (Fig. C1). For a large majority of the data (74 %), the difference lies within 3 ∘C. For another 22 % of the data, the difference is between 3 and 10 ∘C. The maximum temperature difference is 27.5 ∘C. Large temperature differences happened when prolonged direct sunlight heated up the enclosure.
2.4 In situ measurements of volatile organic compounds
Volatile organic compounds (VOCs) were measured with two in situ gas chromatographs coupled with mass spectrometers (GC–MSs), which have been previously described in more detail by Hellén et al. (2017, 2018). One GC–MS measured the concentrations of mono- and sesquiterpenes, isoprene, 2-methyl-3-butenol (MBO), and C5–10 aldehydes in the emissions. These compounds were collected for 30 min from a 40 mL min−1 subsample flow of the CRM instrument sampling flow in the cold trap (Carbopack B/Tenax TA) of the thermal desorption unit (TurboMatrix, 650, Perkin-Elmer) connected to the GC (Clarus 680, Perkin-Elmer) coupled with the MS (Clarus SQ 8 T, Perkin-Elmer). A HP-5 column (60 m, i.d. 0.25 mm, film thickness 1 µm) was used for separation. The instrument was calibrated for MBO, aldehydes, and mono- and sesquiterpenes using liquid standards in methanol solutions. Isoprene was calibrated using a gaseous standard (National Physical Laboratory, 32 VOC mix at the 4 ppbv level). Limits of detections for mono- and sesquiterpenes are between 0.5 and 4.7 pptv, and the uncertainty of the measurements lies at 17 %–20 % (Helin et al., 2020).
The other GC–MS measured the concentrations of alcohols and volatile organic acids (VOAs). Every other hour, a sample was taken for 60 min and analysed with a thermal desorption unit (Unity 2 + Air Server 2, Markes International Ltd, Llantrisant, UK) connected to the GC (Agilent 7890A, Agilent Technologies, Santa Clara, CA, USA) and the MS (Agilent 5975C, Agilent Technologies, Santa Clara, CA, USA). A polyethylene glycol column DB-WAXetr (30 m, i.d. 0.25 mm, film thickness 0.25 µm) was used for the separation. These compounds were calibrated as well with standards in methanol solutions. The detection limits are in the 1–130 pptv range, and the uncertainty is 32 %–76 % (Hellén et al., 2017).
For both instruments, measured compounds that had no standard available were quantified using calibrations of similar compounds. The uncertainty and the detection limits were estimated the same way.
2.5 OH reactivity
OH reactivity, ROH, can be calculated from the sum of the concentration of individually emitted compounds Xi, [Xi], multiplied by their respective reaction rate coefficient with OH ():
The experimental total OH reactivity, Rexp, can be measured with the comparative reactivity method (CRM; Sinha et al., 2008; Michoud et al., 2015). The specific instrument used for this study is described in Praplan et al. (2017, 2019), and the measurement principle is briefly explained in the following section together with the application of the method to measure the OH reactivity of emissions (OHRE).
2.5.1 Total OH reactivity measurements: the comparative reactivity method
The CRM is based on monitoring the signal change of pyrrole (C4H5N) exposed to OH in a reactor together with either clean (zero) air or air sampled from the branch enclosure. OH is produced by the photolysis of water (H2O) in a nitrogen flow (99.9999 % N2) using ultraviolet (UV) radiation and a gas chromatograph (GC, Syntech Spectras analyser GC955, Synspec BV, Groningen, the Netherlands) equipped with a photon ionisation detector (PID), measuring the pyrrole concentration in the CRM instrument reactor every 2 min. No other peak is observed at the retention time (RT) of pyrrole (ca. 65 s). The GC–PID measurement uncertainty is about 5 %, and its detection limit (2σ) is 1.7 ppbv. Based on pyrrole calibrations, a sensitivity of 1678 ppb measured on 11 May was used for data until 14 June; then, a sensitivity of 1833 measured on 15 June was used for data until 28 June. On 28 June, a lower sensitivity of 1193 was measured and used for the rest of the measurement periods.
During zero-air measurements, all OH is consumed by pyrrole (labelled C2 level). This zero air is produced by passing the sampled air through a platinum catalyst heated at ca. 450 ∘C to remove reactive species. When zero air is replaced with the sampled air, other reactive compounds compete for OH, leading to an increased pyrrole concentration (C3 level). The instrument alternates measurements of zero air and sampled air every 8 min. The conditions in the reactor after switching stabilise within 1 min, and therefore, the first pyrrole measurement after each switch is discarded. The amount of pyrrole in the reactor in the absence of OH with the UV light on (C1 level) is slightly lower than that introduced into the reactor in the dark (C0 level) due to the photolysis of pyrrole (5.6 %–9.3 %). C1 is measured by introducing a large concentration of a 0.6 % propane (C3H8) gas mixture in nitrogen (N2) to act as an OH scavenger (Zannoni et al., 2015). From the difference between C2 and C3 pyrrole levels and taking into account the amount of available pyrrole (C1), the total OH reactivity in the reactor Reqn can be derived from the following equation:
with kp being the reaction rate of pyrrole with OH ( cm3 s−1; Atkinson et al., 1985, similar to the newer study by Dillon et al., 2012). However, this equation has been derived under a pseudo first-order kinetics assumption (i.e. [C4H5N]≫[OH]), but the pyrrole–OH ratio (pyr : OH) varies between 1.0 and 3.5 in the present study.
Therefore, we apply a correction (described in detail in Praplan et al., 2019) for this deviation from pseudo first-order kinetics based on experimental reactivity calibrations with α-pinene. The reactivity in the reactor (RCRM) is derived according to the following equation:
with a (0.497) and b (0.449) being the coefficients of the linear regression between measured OH reactivity in the reactor (Reqn) and expected calculated reactivity for reactivity calibrations with α-pinene (Rtrue; see Sect. 2.5.3).
In addition, the background reactivity of the empty enclosure (Reqn,blank) is also taken into account. Reqn,blank was determined between 28 September and 4 October and is 2.3±2.7 s−1 (1σ, see Fig. C2 in Appendix C). This value is subtracted from Reqn before applying the correction for deviation from the pseudo first-order assumption.
Additionally, because of the dilution of the sampled air with humid nitrogen, the calculation of the total OH reactivity of the sampled air Rexp requires the use of the dilution factor D (ratio of sampling flow to total flow through the reactor, between 0.63 and 0.69):
As there can be a difference in relative humidity (RH) in the reactor between measurements of C2 and C3 levels of pyrrole (e.g. transpiration of the branch increasing RH in C3), a correction is needed to account for the difference (see Sect. 2.5.2). This is because OH levels in the reactor change with RH, and Eq. (2) requires that OH concentration is the same during C2 and C3 measurements.
Corrections due to the presence of ozone (O3) and nitrogen oxides (NOx) described elsewhere (e.g. Michoud et al., 2015; Fuchs et al., 2017; Praplan et al., 2017, 2019) are not required in the present study due to the use of zero air through the dynamic branch enclosure. O3 and NOx are assumed to be effectively removed by the commercial zero-air generator. Even though the specific mode of operation of the generator is not known, C2 and C3 levels are similar during periods of low emissions (e.g. at night) and during measurements of the blank chamber. If NOx and/or O3 would be present in the generated zero air, C3 would be lower than C2, which is why these corrections are needed for ambient air measurements. However, this is not what is observed in the data presented here, which confirms that these corrections are not needed in this particular case.
Finally, the total OH reactivity of emissions (TOHRE) measured using a dynamic branch enclosure can be derived from
where f is the total flow through the enclosure and mdw is the dry weight of the leaves or needles in the enclosure. In a similar way, the calculated OH reactivity of emissions (COHRE), based on the known air composition, can be calculated as
2.5.2 Correction due to the difference in RH
Equation (2) assumes that RH (i.e. OH levels) is identical in the reactor during C2 and C3 measurements. However, this is often not the case, and a correction is derived to take this effect into account. Figure 1 shows the pyrrole signal as a function of RH while measuring zero air. The applied correction is then
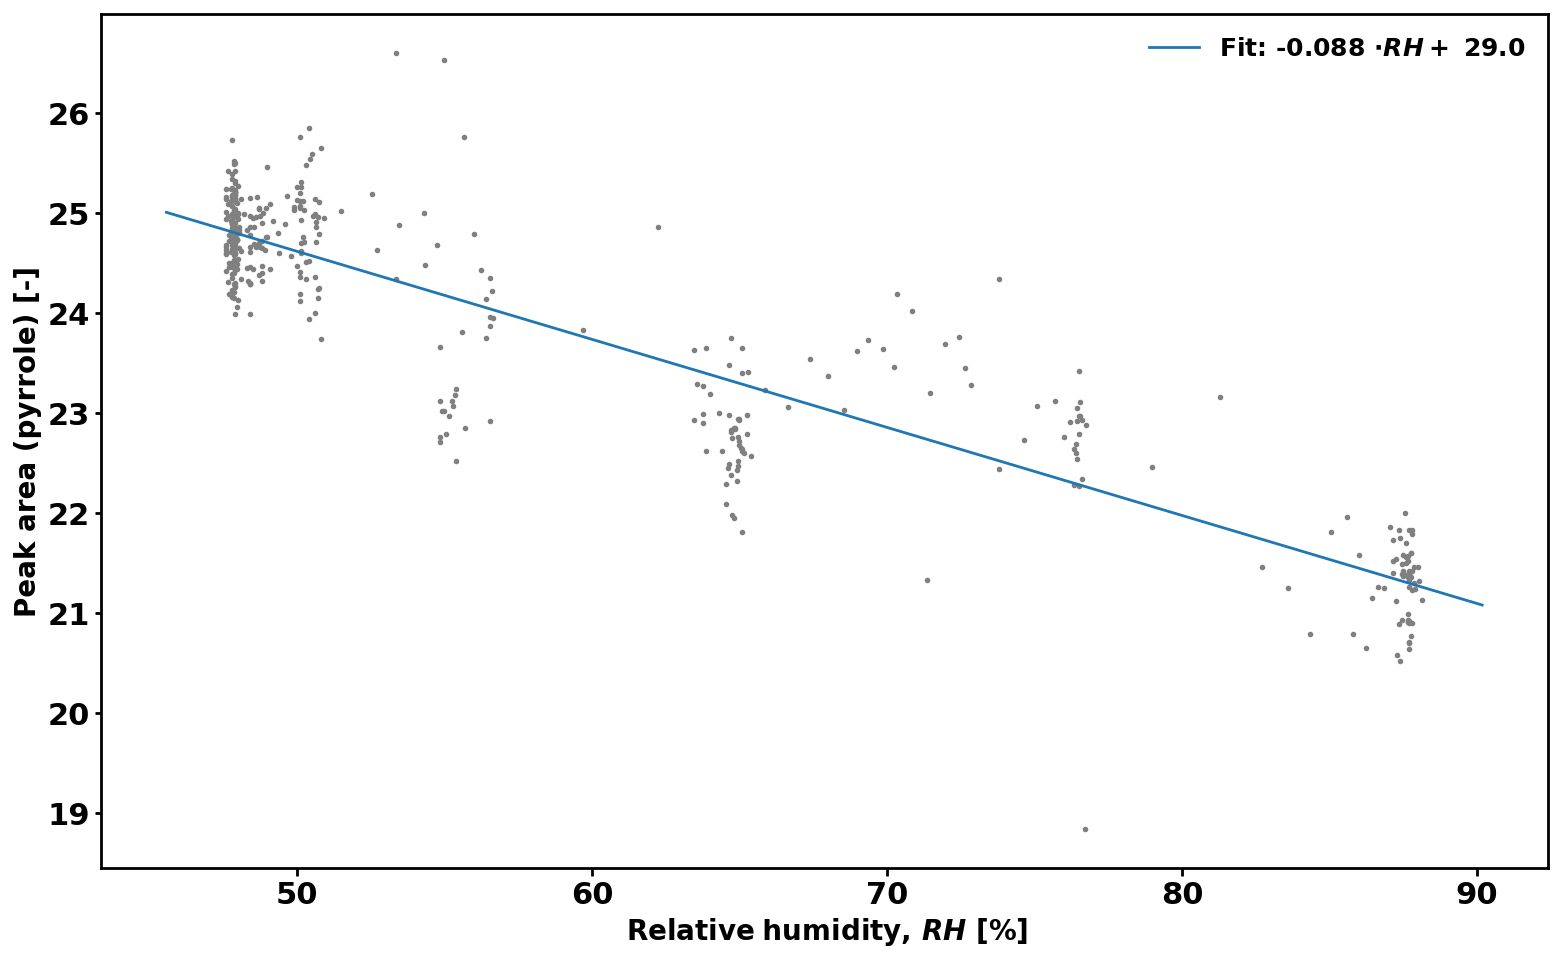
Figure 1Change in pyrrole level (C2) according to relative humidity (RH) in the CRM reactor.
2.5.3 Correction due to deviation from pseudo first-order kinetics
As mentioned previously, this correction is necessary as Eq. (2) is derived under the assumption of pseudo first-order kinetics ([C4H5N]≫[OH]), while the experimental pyrrole–OH ratio (pyr : OH) is between 1.0 and 3.5. Originally, Sinha et al. (2008) used a very simple two-equation model for this correction. Michoud et al. (2015) opted for an empirical approach based on experimental calibration using gas standards, as they demonstrated that the model was not accurately reproducing the observed response of pyrrole in the reactor, despite alterations to account for secondary OH chemistry. In the present study, we use the experimental results derived in Praplan et al. (2019) based on α-pinene calibrations, which show that the measured OH reactivity (Reqn) is roughly half the expected reactivity, so the exact relationship between the calculated reactivity in the reactor (Rtrue) and Reqn is the following:
with a and b values of 0.497 and 0.449, respectively. While considering α-pinene as a representative compound for the measured emissions, they often comprise a mixture of various compounds with various reaction rates with OH. Considering that the slope of the regression for reactivity calibration with propane from earlier work (Praplan et al., 2019) was 0.751, we can consider the lower uncertainty in this correction to be roughly 51 % at most. No reactivity calibration with sesquiterpenes could be performed, but based on the fact that the relative difference between the reaction rates with OH of α-pinene and β-caryophyllene is smaller than between the reaction rates with OH of propane and α-pinene, it is reasonable to consider the lower upper uncertainty to be smaller than 50 %.
2.6 Emission models
We used a typical model for VOC emissions (Guenther et al., 1993, 1995) to test the light and temperature dependence of TOHRE. The temperature-only dependence is the same dependence as for monoterpene emissions and is expressed with the following equation:
TOHRES is the TOHRE at standard temperature TS (303 K), and T is the leaf surface temperature. In the present study, we assume that the leaf surface temperature, which was not recorded, is roughly the same as the temperature inside the enclosure. Owen et al. (1997) mention that for a similar system as the one used in the present study, the leaf temperature is at most 2 K higher than in the enclosure. β describes the temperature dependence (so-called β-factor) and is estimated to be 0.09 K−1 for monoterpenes.
A hybrid algorithm based on both temperature and light can be used to model emissions that also follow in illumination (Guenther, 1997; Ghirardo et al., 2010). The dependence on light and temperature for TOHRE is then formulated as follows:
with TOHRE0,pool and TOHRE0,synth as the standard TOHRE pool emission potential (stored compounds, temperature dependent) and TOHRE synthesis emission potential (newly synthesised compounds, light- and temperature-dependent), respectively. Additionally, cL and cT are light and temperature activity coefficients, respectively, defined as
T and TS are the same as above, and Q is the PAR measured just above the enclosure. The empirical coefficients are α (0.0027), cL1 (1.066), cT1 (95 000 mol J−1), cT2 (230 000 mol J−1), and TM (314 K). Finally, R is the gas constant (8.314 J K−1 mol−1).
3.1 Overview
An overview of monthly averages for TOHRE and missing TOHRE (absolute and fraction) can be found in Table 1. The highest TOHRE monthly averages were found for birch in May and June (1.6–2.6 10−3 m3 s−2 g), which is mostly unaccounted for (missing OHRE fraction 96 %–99 %). The monthly TOHRE averages from spruce were high in July and August (1.1– m3 s−2 g), while the highest monthly average for TOHRE from pine was in July ( m3 s−2 g). A few compounds per class of biogenic VOCs were identified as the main drivers of the reactivity, which will be discussed in the following subsections for each tree individually.
In general, the missing OHRE fraction was higher in spring and decreased as the seasons proceeded (see Table 1). The missing OHRE fraction from birch remained high from May to July (99 %–84 %), making it the least understood reactivity. Pine and spruce had similar fractions of missing OHRE (59 %–78 % and 56 %–82 %, respectively), partly due to uncertainties on both the measured TOHRE and COHRE. For TOHRE, the correction for deviation from pseudo first-order kinetics applied to CRM data is based on calibration with α-pinene as a surrogate for biogenic emissions, but monoterpenes do not always represent the largest fraction of the emissions, which result in some uncertainty in TOHRE (roughly a factor of 1.5 at most). On the other hand, unidentified sesquiterpenes have been found in emissions from all three tree species (see Appendix D), their quantification was performed using surrogates, and their reaction rates were assumed to be average based on the reaction rates for other sesquiterpenes (10−10 cm3 s−1). COHRE is derived from up to 67 compounds. Considering the uncertainty from the GC–MS measurements and from the reaction rates used to derive COHRE for its contributing compounds (never all 67 compounds simultaneously), the estimated uncertainty of COHRE stays mostly around 25 %–50 %.
Table 1Monthly averages of temperature (Te) and relative humidity (RHe) in the branch enclosure, photosynthetically active radiation (PAR) measured just above the enclosure, and total OH reactivity of the emissions (TOHRE), as well as missing OHRE (absolute and relative). The number of observations, n, for missing OHRE is lower than for other parameters due to an incomplete overlap between calculated OHRE (VOC data) and TOHRE.
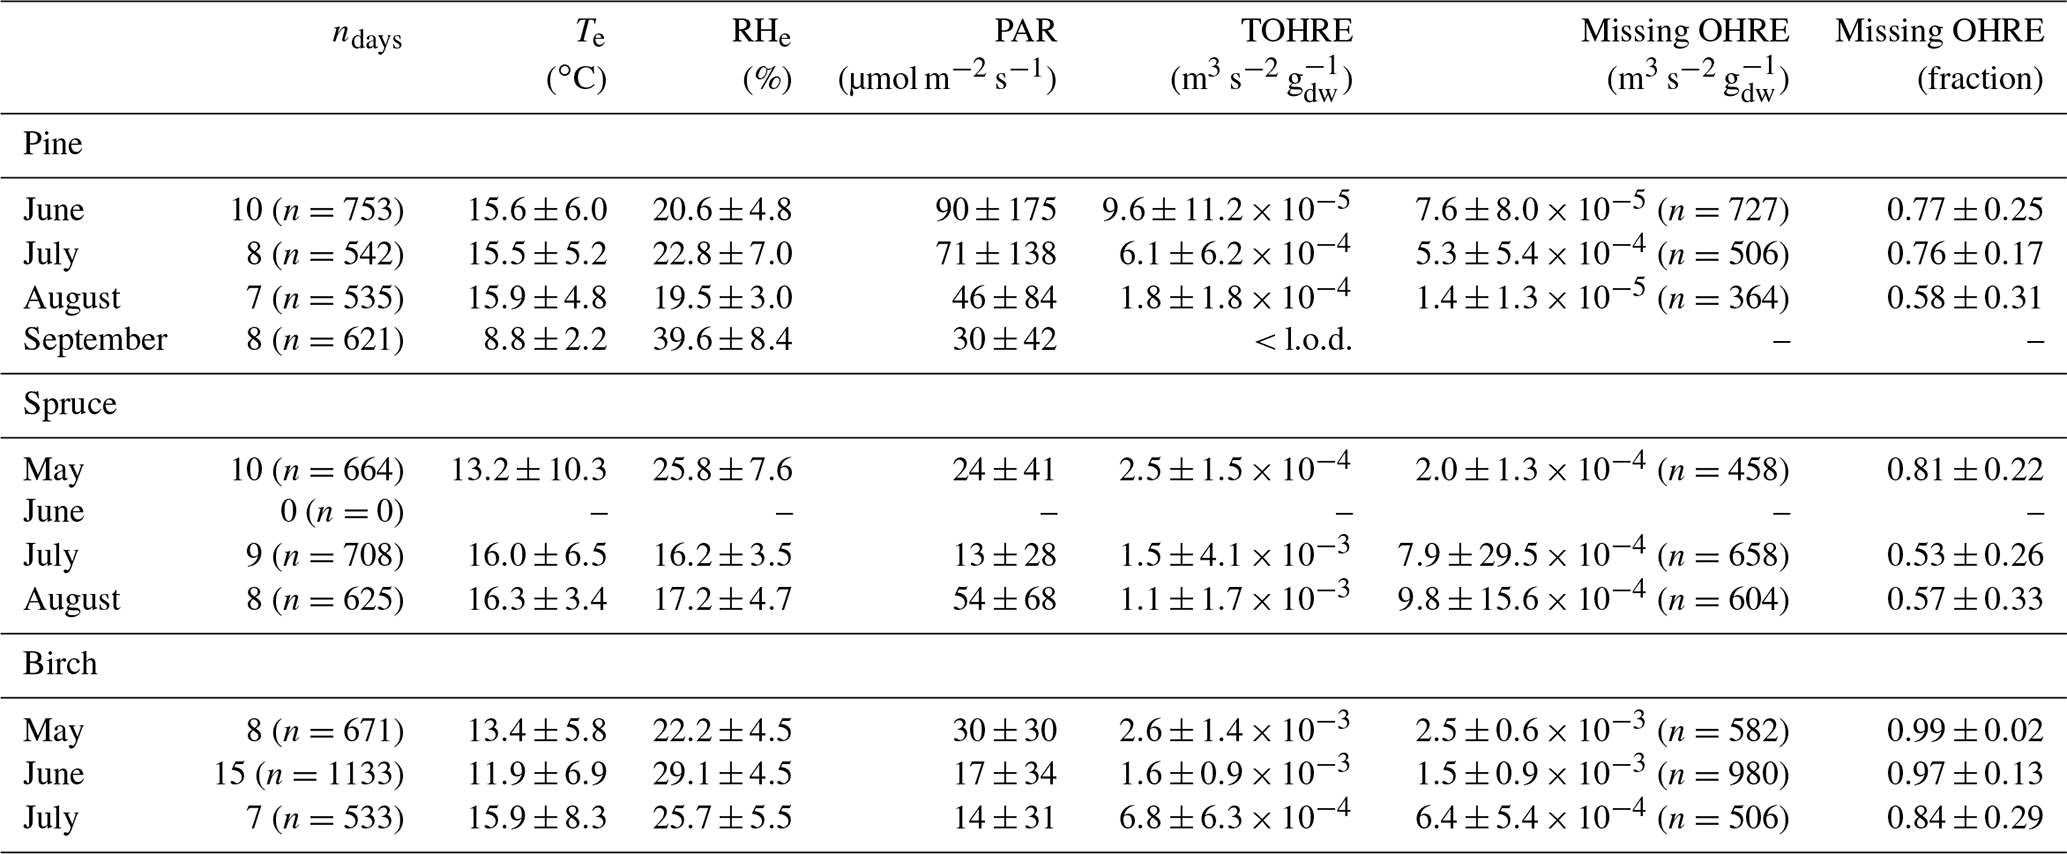
This also introduces some uncertainty. Notwithstanding these uncertainties, it will appear in the following discussion that the averages of high missing OHRE values are driven by low reactivity values and measurement scatter. When TOHRE is clearly above the background values, the missing fraction is reduced, which indicates a generally good understanding of emissions with the exception of periods dominated by green leaf volatiles (GLVs). GLVs form a family of C6 compounds, including aldehydes, alcohols, and esters, which are emitted rapidly and in large amounts during stress periods (e.g. Scala et al., 2013). Stress can have various abiotic and biotic causes (e.g. drought, attack by pathogens or herbivores). During these periods, TOHRE values were high, but the missing fraction also remained high, and this cannot be explained only by measurement and calculation uncertainties.
The results also illustrate how reactive biogenic emissions are influenced by time of the year and the tree species found in the forested areas. In addition, high measured TOHRE is related to a change in the emission profiles with a larger fraction of GLVs.
3.2 Pine
The data for pine are shown in Fig. 2, divided into periods labelled with “P” (for “pine”), a number (for each different branch measured), and possibly a letter to indicate various measurement periods of the same branch. Branches were cut on 15 June, 16 August, and 11 October. TOHRE, its 1 h average, and COHRE are displayed in the top row, the relative contribution of measured compounds to COHRE is shown in the middle row, and the missing OHRE fraction is shown in the bottom row.
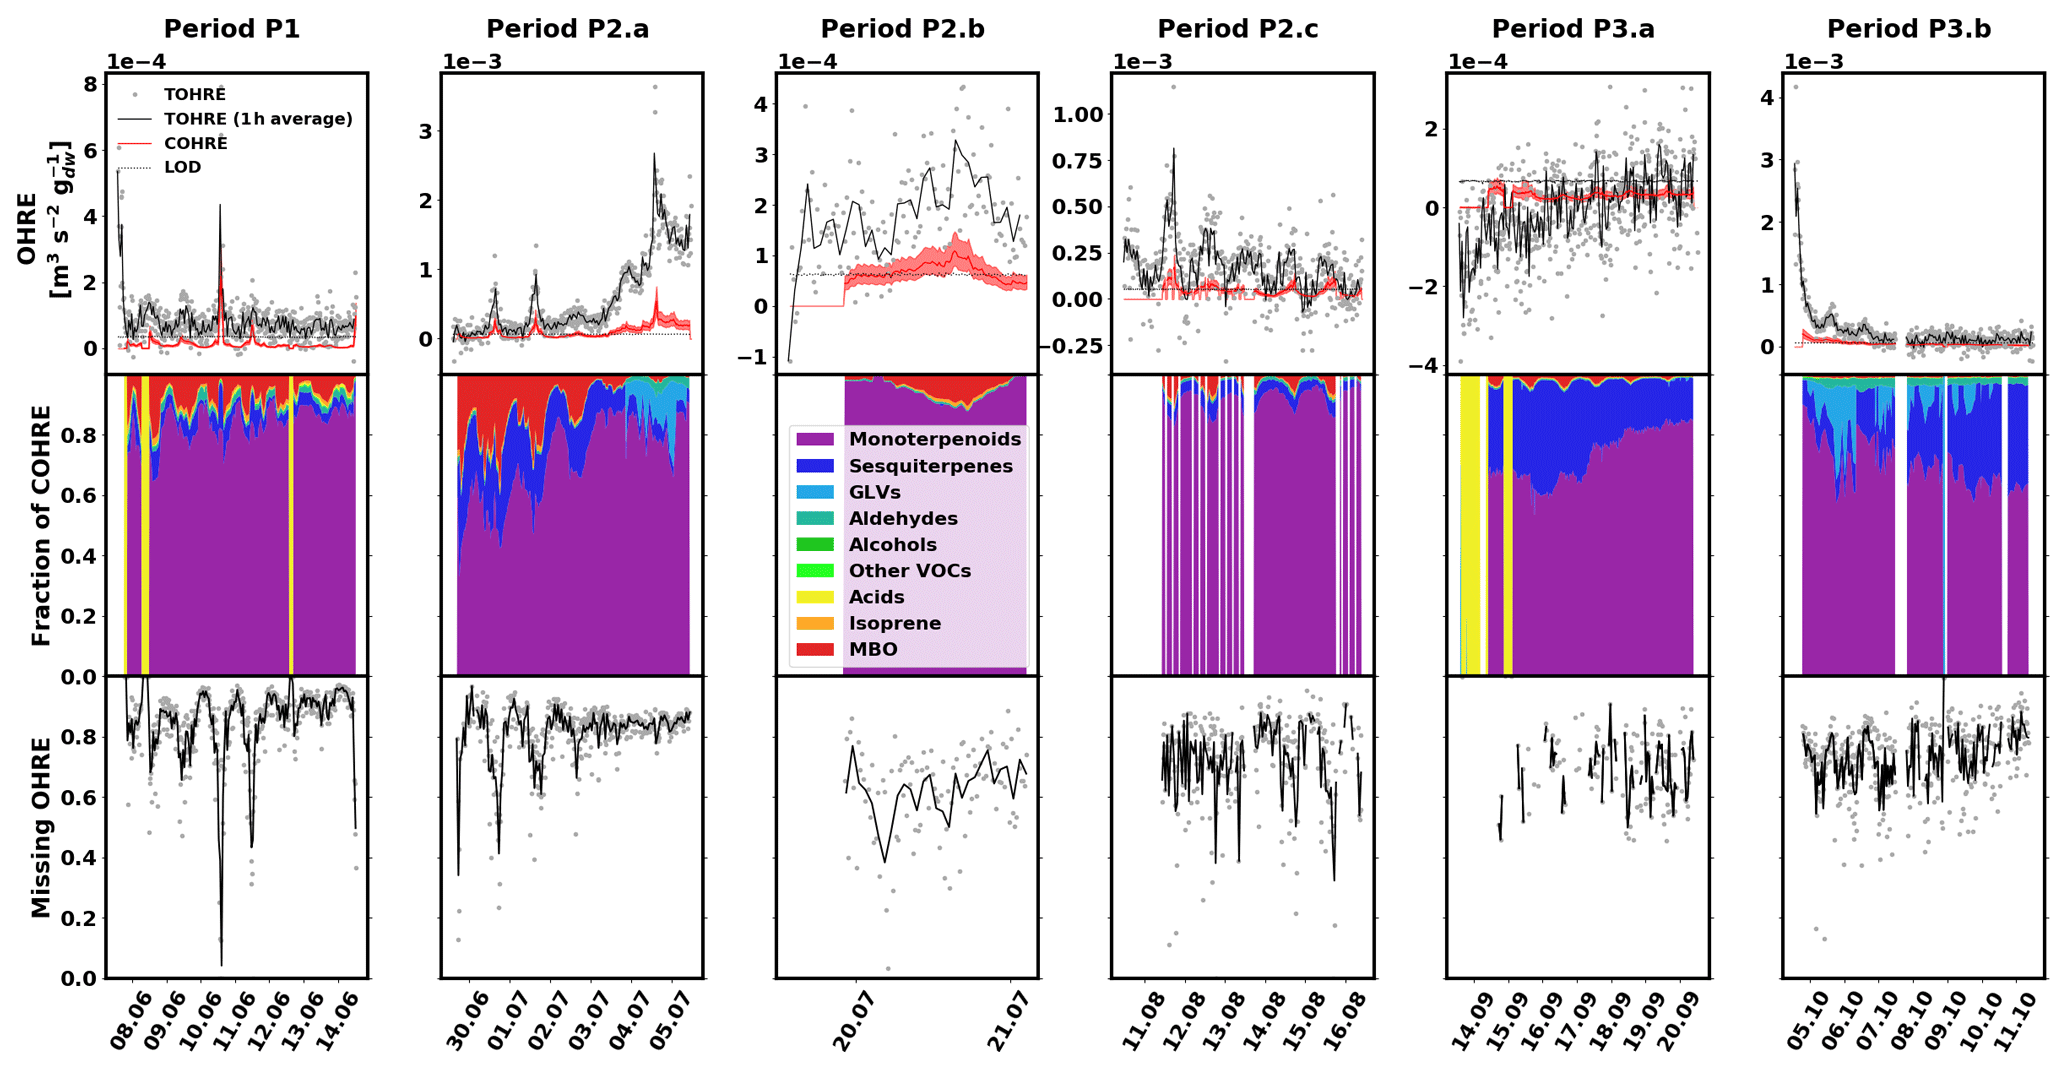
Figure 2Measured total OH reactivity of the emissions (TOHRE), its 1 h average values, and COHRE normalised to dry weight (top row) for pine. Fraction of the various contributions of chemical species to COHRE (middle row). Missing fraction of OHRE (bottom row). The periods are denoted “P” for “pine”, the number indicates which branch is being measured, and the letter indicates which period it is for the same branch.
The highest TOHRE values from pine were measured in early July and early October. These two periods, the end of period P2.a (3–5 July), and the beginning of period P3.b (4–11 October) are marked with a fraction of GLVs up to roughly 35 % (mostly due to cis-3-hexenol). At the same time, emissions from monoterpenes and terpinolene increase as well. Between 3 and 5 July, TOHRE increased and was high even at night, while it is usually close to zero at that time. Interestingly, 3 July marks the end of a warm and sunny period, with a maximum temperature in the branch enclosure of 30–40 ∘C for 5 d in a row and the beginning of a cooler and cloudier period with some precipitation. It is not clear, though, whether stress emissions are related to the change in environmental conditions or if they are a result of stress experienced during the previous days.
Despite these observations, and with TOHRE being usually higher than COHRE, both display a similar time evolution. The Pearson's correlation coefficient between the overlapping periods of TOHRE and COHRE r is 0.89 (p value < 0.01).
The known OH reactivity for pine emissions is dominated by monoterpenes with a small fraction of sesquiterpenes, as expected from earlier studies (Tarvainen et al., 2005; Hakola et al., 2006; Yassaa et al., 2012; Bäck et al., 2012; Faiola et al., 2018). The profiles of known emissions from all three branches of this same seedling are similar. Here, COHRE is mostly driven by α-pinene, limonene, and Δ3-carene. Sesquiterpenes (mostly α- and β-farnesene) contribute up to 15 % of the known OH reactivity, and MBO represents an important fraction, especially in June and July. In September, the missing fraction is lowest due to the low TOHRE values measured, which are in the same range as the COHRE values (only with a much larger scatter).
Nölscher et al. (2012) found higher missing reactivity for ambient measurements for stress periods (elevated temperature) at SMEAR II, a boreal site dominated by Scots pine. In our study, these stress periods for pine, identified with GLV emissions, are not related to elevated temperature (see Sect. 3.5). Missing OHRE was generally higher during these periods, but as terpenoids were monitored, they cannot explain the stress-related emissions of reactivity. Some oxidised volatile organic compounds were also measured, but not methanol, formaldehyde, and acetaldehyde, for instance, which could contribute – at least in part – to the missing OHRE. Paired sample t tests to compare monthly averages with each other show that the average missing OHRE values in June and July are not significantly different (p value 0.52), while it is significantly lower in August (p value < 0.05).
3.3 Spruce
The data for spruce are shown in Fig. 3, and similarly to the previous section, they are divided into periods labelled with “S” (for “spruce”), a number (for each different branch measured), and possibly a letter to indicate various measurement periods of the same branch. Branches were cut on 21 June, 9 August, and 5 November. TOHRE, its 1 h average, and COHRE are displayed in the top row, the relative contribution of measured compounds to COHRE is shown in the middle row, and the missing OHRE fraction is shown in the bottom row.
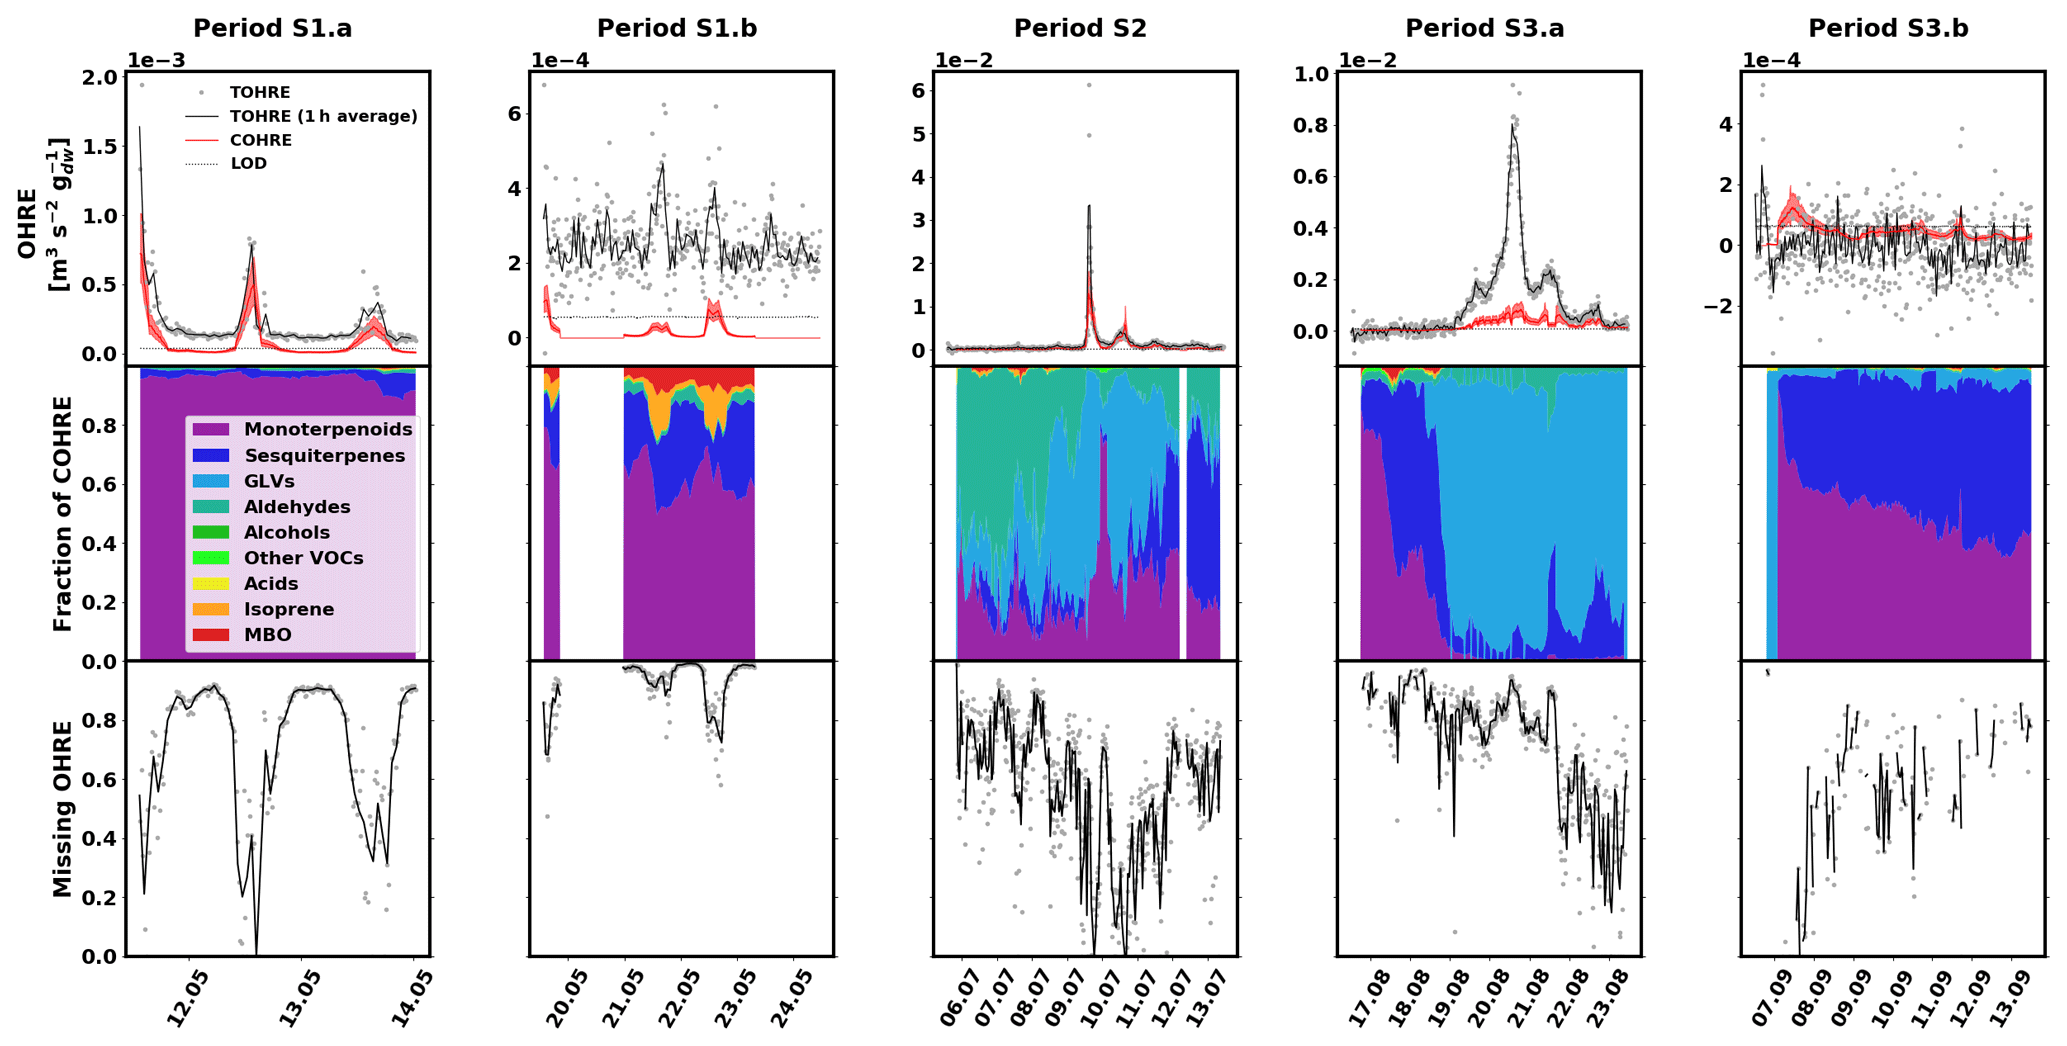
Figure 3Measured total OH reactivity of the emissions (TOHRE), its 1 h average values, and COHRE normalised to dry weight (top row) for spruce. Fraction of the various contributions of chemical species to COHRE (middle row). Missing fraction of OHRE (bottom row). The periods are denoted “S” for “spruce”, the number indicates which branch is being measured, and the letter indicates which period it is for the same branch.
For spruce, TOHRE follows the time evolution of COHRE, even though their absolute values do not match. The Pearson's correlation coefficient r for the TOHRE and COHRE overlapping periods is 0.78 (p value < 0.01). The highest TOHRE values are observed at the beginning of July (period S2), with one extremely high peak over 0.06 m3 s−2 g on 9 July and another TOHRE peak the next day. However, almost all reactivity can be explained by monoterpenes and GLVs during that period (mostly cis-3-hexen-1-ol and cis-3-hexenylacetate, as well as limonene). Hakola et al. (2017) found relatively high emissions of higher aldehydes, especially nonanal and decanal. In our study, these high emissions could not be observed, and their contribution to OHRE remained small.
It was dry and sunny on 9 and 10 July, with maximum temperatures in the branch enclosure close to 40 ∘C. After that, when the weather gets cooler and cloudier with some precipitation between 11 and 14 July, the GLV fraction decreases, and monoterpenes and sesquiterpenes account for most of the known reactivity. This is in stark contrast with the observed stress emissions from pine in this study, which increased during the colder period, after a warm spell.
The known reactivity of the emissions in May (periods S1.a and S1.b) is dominated by monoterpenes, which was expected from earlier studies (Yassaa et al., 2012; Hakola et al., 2017; Wang et al., 2017). The main drivers are limonene, β-pinene, and β-phellandrene. Between 19 and 23 August (period S3.a), high TOHRE values (up to 0.01 m3 s−2 g) were measured (including at night), similarly to the stress period observed for pine. It can be seen that, during these periods with a larger fraction of GLVs, some needles were drying and falling (Appendix A), which confirms that the tree suffered stress (most probably drought). Other environmental conditions did not change much during that period, which was relatively cool and cloudy.
In contrast to stress periods in pine, monoterpene emissions from spruce were low when the GLV fraction increased. During this period, cis-3-hexen-1-ol, cis-3-hexenylacetate, and trans-2-hexenal mostly contribute to COHRE. In September, this branch had low TOHRE, and the known reactivity of the emissions was caused by monoterpenes and sesquiterpenes, similarly to the period between 16 and 19 August, before the large stress episode. The biggest contributor to the sesquiterpene reactivity fraction was α-farnesene (here and for other periods as well). The increase of the sesquiterpene fraction in the emissions is in agreement with observations from Hakola et al. (2017) (up to 75 % of the emissions in late summer, mostly β-farnesene). In their study, they speculated on the possible defensive role of sesquiterpenes, but the lack of any visible infestations of feeding herbivores indicated a systemic defence mechanism rather than a direct one.
A direct comparison with the results for TOHRE and the missing OHRE of spruce from Nölscher et al. (2013) is difficult due to the many factors affecting the emissions. In addition, because of the different method used, Nölscher et al. (2013) report TOHRE with the units of m−3 s−2 g, while the present study reports TOHRE in m3 s−2 g. Nevertheless, knowing the volume of the enclosure used in Nölscher et al. (2013) (15 L; Bourtsoukidis et al., 2012), it is possible to convert the values for quantitative comparison. Nölscher et al. (2013) reported TOHRE values for spruce ranging from 0.1639 (early autumn) to 0.8260 m−3 s−2 g (later summer), corresponding to and m3 s−2 g, respectively. TOHRE measured in this study ranged from to m3 s−2 g, so clearly higher values. This reflects the variability of reactive emissions due to the age of the tree (seedlings in the present study) and the level of stress experienced by the tree. Moreover, they found that the missing OHRE fraction was lower in the spring and increased in the late summer and autumn to 70 %–84 %, while the present study suggests that the missing OHRE fraction decreases from May to August. Paired sample t tests show that the decrease is significant. All monthly averages are statistically different from each other (p values < 0.05). As discussed earlier, lots of high missing OHRE in the present study stems from low-reactivity periods with high scatter for TOHRE and values close to zero for COHRE. However, because Nölscher et al. (2013) assume a constant emission profile (measured in spring) throughout the year and otherwise rely on unspeciated data from a proton-transfer-reaction MS (PTR-MS), it is imaginable that the chemical compositions of the emissions changed with the season to more reactive monoterpenoids or sesquiterpenes, leading to an underestimation of the calculated OH reactivity.
3.4 Birch
The data for birch are shown in Fig. 4, and similarly to the previous sections, they are divided into periods labelled with “B” (for “birch”), a number (for each different branch measured), and possibly a letter to indicate various measurement periods of the same branch. Branches were cut on 21 June, 9 August, and 6 September. TOHRE, its 1 h average, and COHRE are displayed in the top row, the relative contribution of measured compounds to COHRE is shown in the middle row, and the missing OHRE fraction is shown in the bottom row.

Figure 4Measured total OH reactivity of the emissions (TOHRE), its 1 h average values, and COHRE normalised to dry weight (top row) for birch. (The dashed line, TOHRE*, designates the time when the dry weight of the leaves is significantly smaller than measured at the end of the period B1, leading to unreliable values of TOHRE.) Fraction of the various contributions of chemical species to COHRE (middle row). Missing fraction of OHRE (bottom row). The periods are denoted “B” for “birch”, the number indicates which branch is being measured, and the letter indicates which period it is for the same branch.
The observed TOHRE shows relatively high values (due to the low dry weight mass) with almost no diurnal pattern. In late June (period B2.a), a weak pattern can be observed, and in mid-July (period B2.b), a few reactivity peaks can be observed. It is possible that the constant blank value subtracted from the measurements sometimes underestimates the actual background of the measurements, leading to high missing reactivity values because of overestimated TOHRE values. For this reason, the missing OHRE values reported during periods when TOHRE is close to the detection limit or does not display diurnal variation should be considered with caution.
Here, the Pearson's correlation coefficient r between TOHRE and COHRE for the periods when both are available is very low (0.02, p value 0.4), and the missing fraction of OHRE is consistently high with a statistically significant decrease from May to July (p value from paired-sample t tests < 0.05) . This is partly due to the generally low values of COHRE, which are dominated by sesquiterpenes for the first two branches (periods B1, B2.a, and B2.b), with a significant amount of monoterpenes (up to 40 %). Instances when the known reactivity is dominated by organic acids are the result of missing terpene measurements. In May (period B1), β-caryophyllene, α-humulene, another unidentified sesquiterpene, and sometimes cis-3-hexenylacetate contribute most to the reactivity of the emissions. In June and July (periods B2.a and B2.b), the emission profile is slightly different with β-caryophyllene, α-farnesene, linalool, and sometimes cis-3-hexenylacetate and cis-3-hexen-1-ol (co-emitted) contributing most.
For the last branch measured in August (period B3), a significant fraction (up to 50 %) of the known reactivity comes from GLVs (again, cis-3-hexenylacetate and cis-3-hexen-1-ol), but the fraction of sesquiterpenes (mostly α-farnesene) is smaller, while monoterpenes (carene, α-pinene, and α-terpineol) contribute more. Pictures in Appendix A show how some leaves turned brown, possibly indicating the end of the growing season and the senescence of the leaves.
Haapanala et al. (2009) found a large fraction of α-farnesene in mountain birch emissions in a given year, but they stressed that there was an important inter-annual variation in the emission profile, with almost no α-farnesene detected the following year for the same branch.
3.5 Temperature and light dependence of TOHRE
To also study the dependence of TOHRE on temperature, TOHRE has been plotted against the temperature in the enclosure, and exponential regressions using Eq. (10) have been performed (Fig. 5 and Table 2). Excluding data when the temperature in the enclosure is higher than 30 ∘C leads to a change in β-factors within 15 % of the values reported here, except for the notable exception of the β-factor for spruce emissions in July, as discussed below. Similar figures for COHRE and missing OHRE can be found in Appendix E, showing similar findings to TOHRE dependence on temperature.
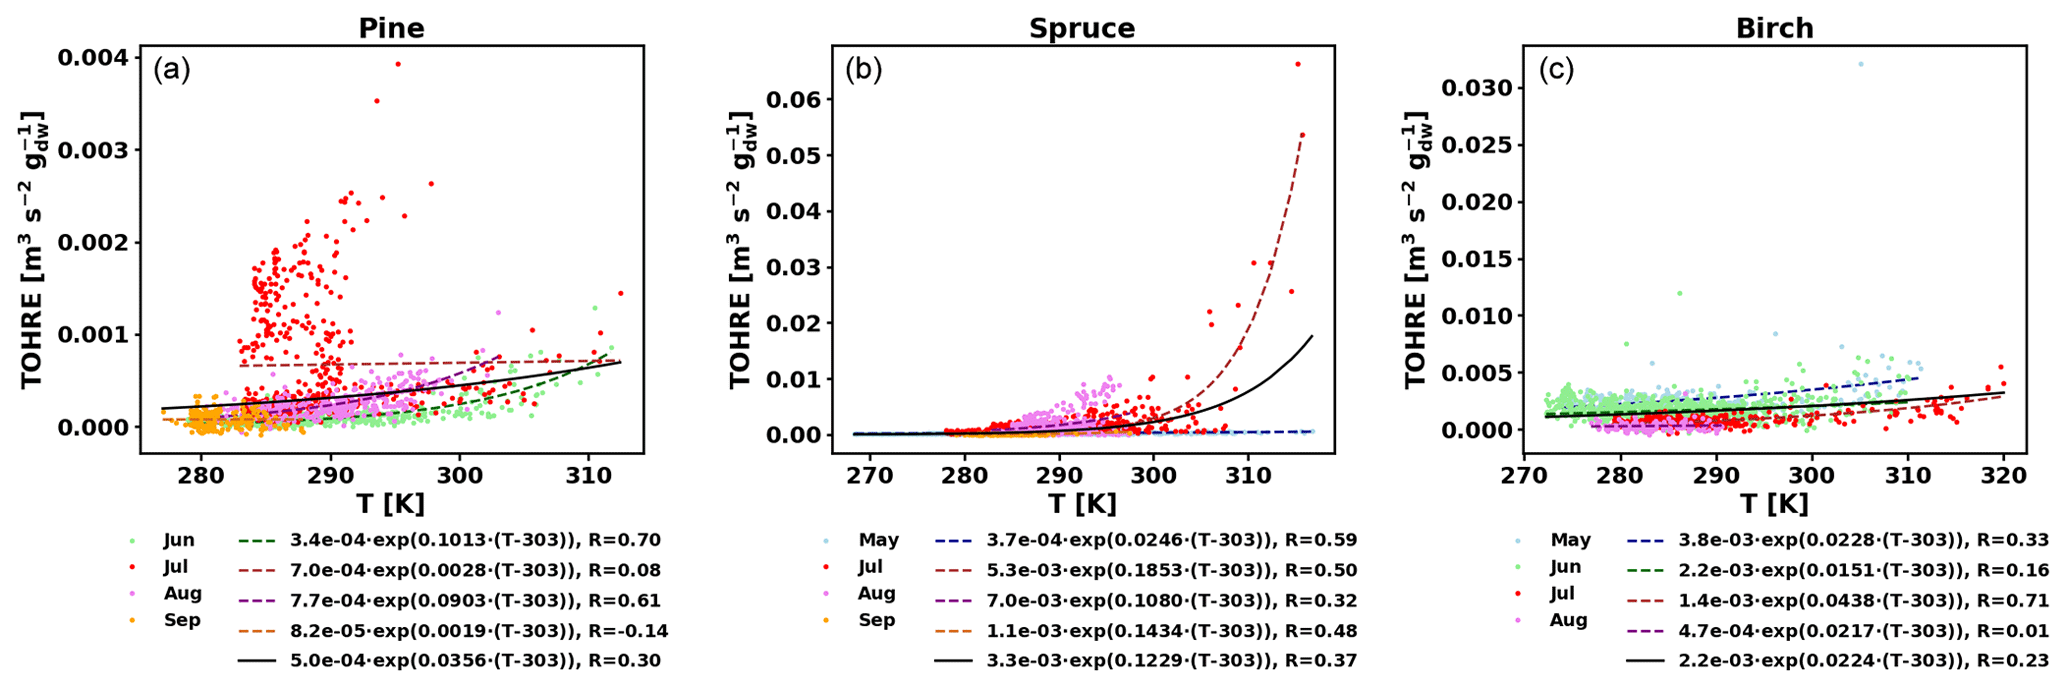
Figure 5TOHRE as a function of temperature in the branch enclosure for pine (a), spruce (b), and birch (c). Coloured dots and dashed lines are data separated by month (data and exponential regression), and the solid black line is the exponential regression for all data.
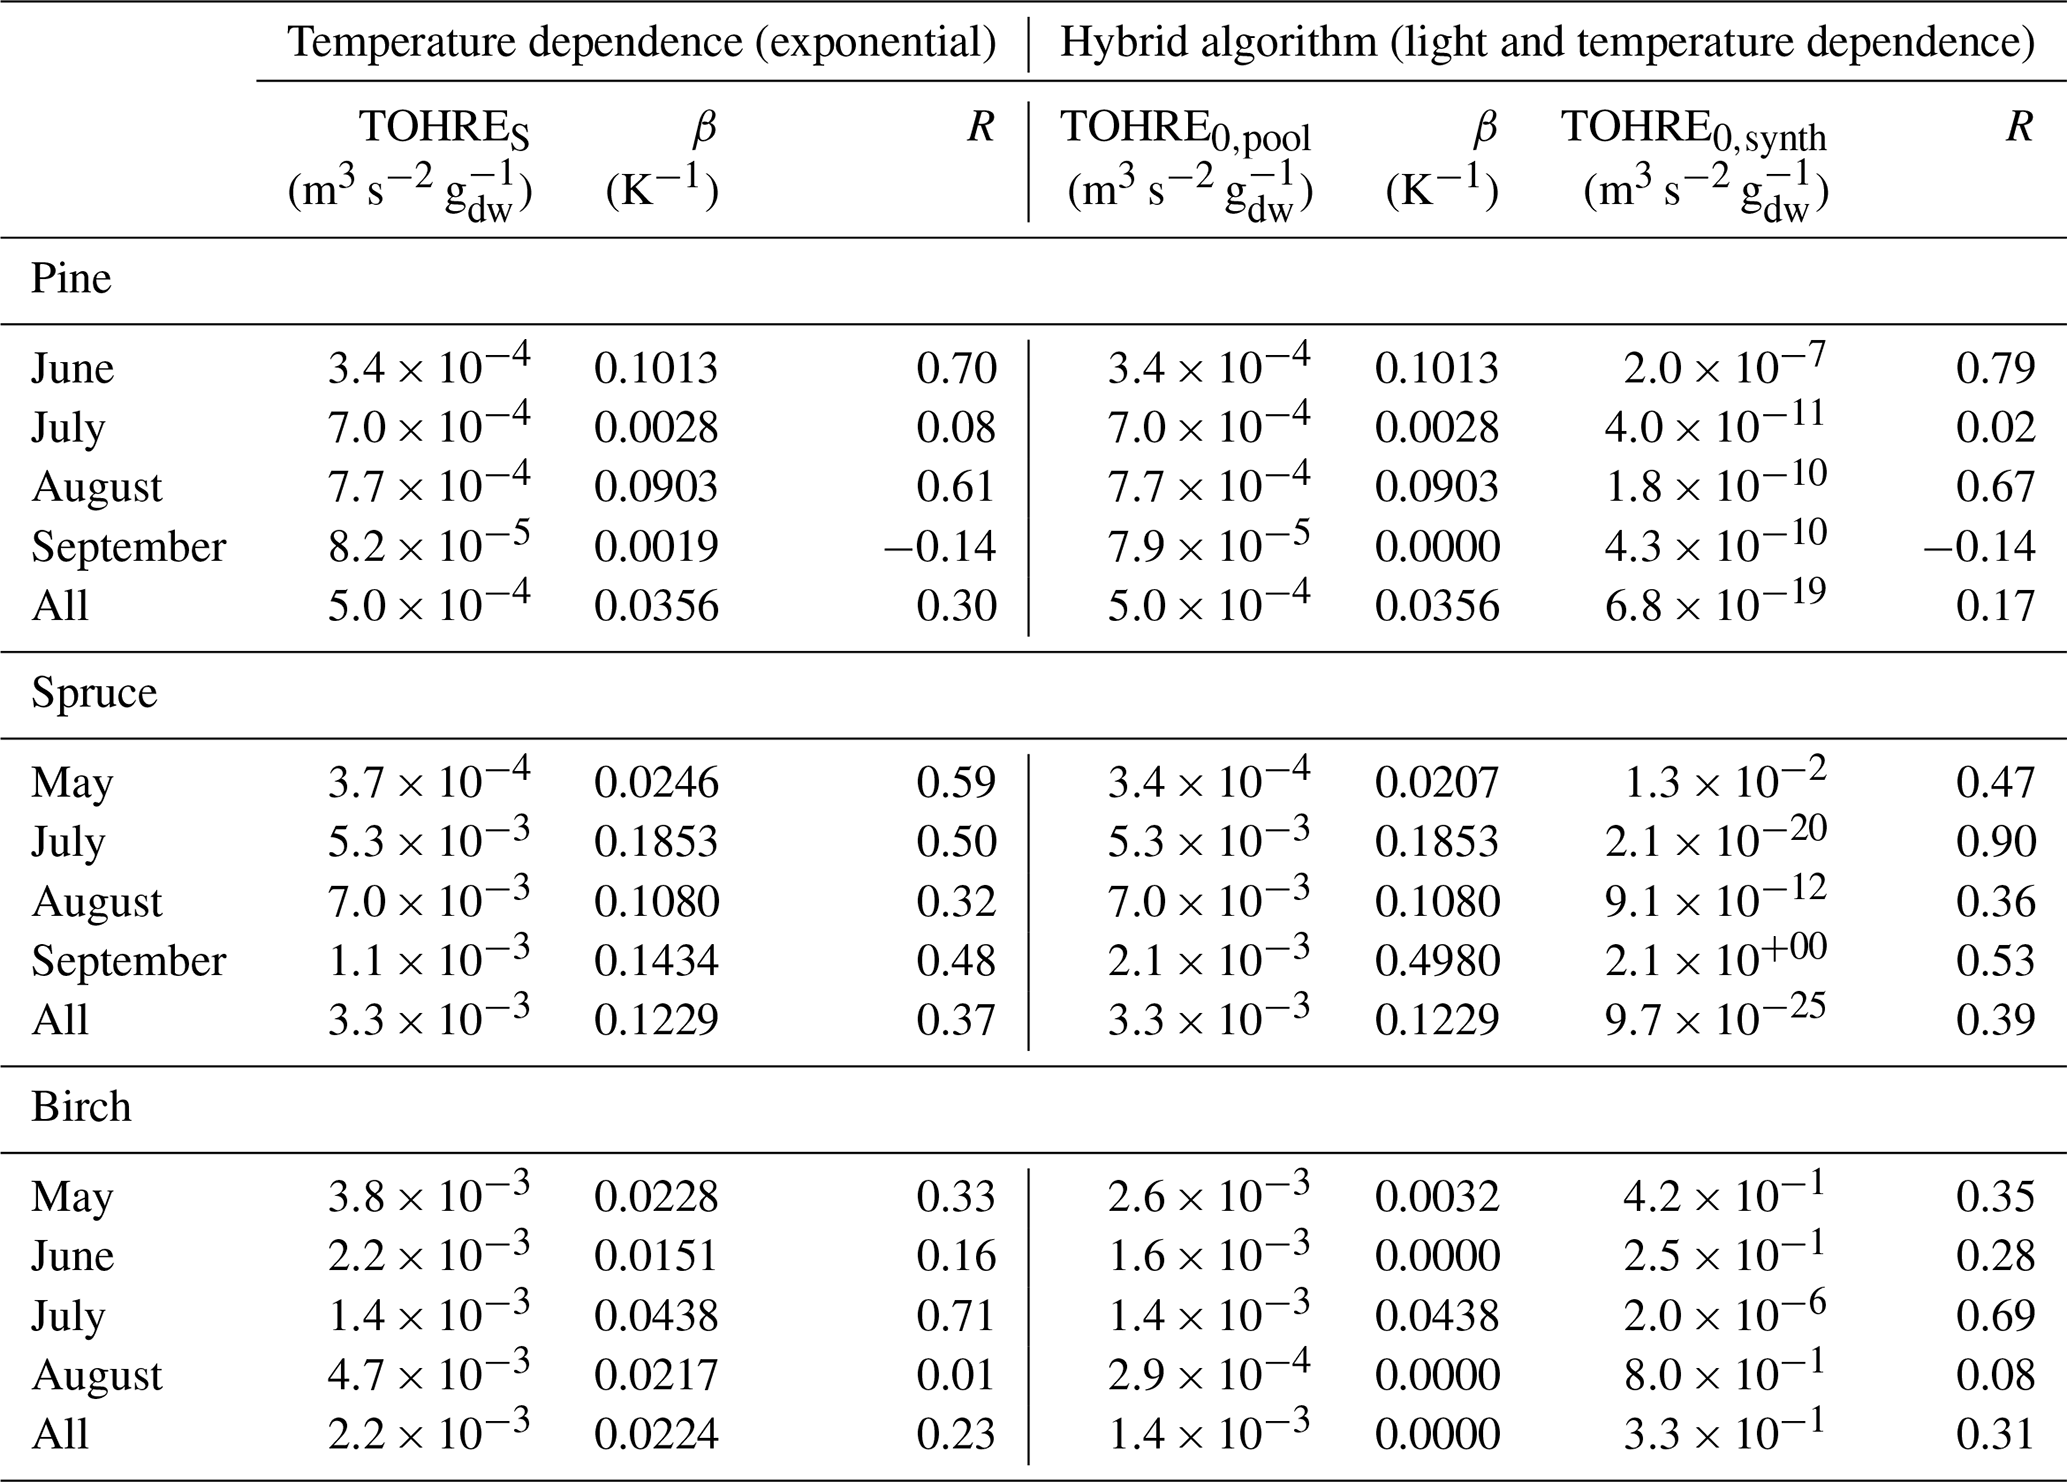
Table 2Regression coefficients (TOHRES and β) for the exponential regressions of TOHRE as a function of temperature and regression coefficients (TOHRE0,pool, β, and TOHRE0,synth) for its dependence on both temperature and light using the hybrid algorithm, as well as coefficients of correlation (R).
Good correlations with temperature are found for the TOHRE of pine in June and August (R=0.70 and 0.61, respectively), in May and July for spruce (R=0.59 and 0.50), and in July for birch (R=0.71). Periods with no correlation were connected to either abiotic stress events (particularly July for pine) increasing TOHRE at night, or low TOHRE values during the daytime (as in September for pine and spruce and May–June for birch), possibly due to cooler and cloudier weather. Because of this, averaging the whole data set leads to low coefficients of correlation (R=0.23–0.37).
Considering values of β-factors from monthly regressions with R>0.5, they range from 0.0246 to 0.1853 K−1. Guenther et al. (2012) recommended a value of 0.10 K−1 to model monoterpene emissions. For sesquiterpenes, average values of 0.14–0.22 have been reported (e.g. Tarvainen et al., 2005; Hakola et al., 2006; Duhl et al., 2008), even though values as low as 0.025, 0.05, and 0.056 were also found (Tarvainen et al., 2005; Helmig et al., 2007; Ruuskanen et al., 2007, respectively). For pine, which is dominated by monoterpene emissions, β-factors are about 0.09–0.10 K−1 except for stress periods, when the β-factor is smaller than 0.003. For spruce, β-factors increase from 0.02 to 0.19 K−1 between May and July, demonstrating a clear regime change in the temperature dependence of the emissions, with an increasing contribution of less-volatile compounds (sesquiterpenes and GLVs). However, leaving out values when the temperature is higher than 30 ∘C, the β-factor for spruce in July is 0.093, indicating that the highest temperatures (that are not ambient temperatures in the boreal forest) might trigger emissions of more reactive species, which is not the case for usual warm summer temperatures in this type of forest. These changes in emission profiles are possibly driven by the volatility of the compounds emitted. For birch, when a good correlation with temperature was found (R=0.71) in July, the β-factor remains low, even though emissions are dominated by sesquiterpenes. This might be an indication of emissions of non-terpenoid volatile compounds.
The results of using Eq. (11) to include the effect of light on TOHRE (Hybrid algorithm, Table 2) show that, in general, only small improvements (increases of R) are achieved. In a few cases, R was even slightly reduced. One notable exception is a large improvement of the coefficient of correlation R from 0.5 to 0.9 for spruce in July. The addition of a small TOHRE0,synth term seemed to be enough to capture the large peak that was reported as stress, indicating a radiation-induced stress in this case.
In general, β-factors are very similar to the results of the regression for the temperature-only dependence (when a good correlation was found in the first place). Note that in September (and to some extent in August), the temperature range remains small (about 10 K) and on the lower end, so that nothing conclusive can be inferred from these results. In summary, the effect of light on reactive remissions remains limited in the present study, but other factors such as abiotic stress can play a major role in the type and amount of reactive emissions.
This study presents the total OH reactivity of emissions (TOHRE) for three tree species from the boreal forest. The studied trees were seedlings (in pots) placed outside the measurement container at the SMEAR II station in Hyytiälä, Finland. Instruments to measure TOHRE with the comparative reactivity method (CRM) and the chemical composition of the emissions (two online GC–MS systems) were located inside the container. Three dynamic branch enclosures (one for each tree species) were set up, but VOC and TOHRE measurements were performed for one enclosure at a time for periods ranging from a few days to over a week.
The results show that the chemical composition of the emissions varies greatly between tree species but also for the same tree depending on environmental conditions. The seedlings' emissions were classified as induced by abiotic stress (most likely drought) on several occasions. During these periods, TOHRE increased greatly and did not return to values close to zero at night, and the emission profiles changed with an increased fraction of green leaf volatiles (GLVs) and different terpene emissions.
Pine emissions were dominated by monoterpenes for all measurement periods with varying fractions of MBO and sesquiterpenes mostly. GLVs were found to be up to almost 40 % of the known reactivity in July and October for two short stress periods. Spruce emissions were also dominated by monoterpenes, and from July onwards, sesquiterpenes contributed almost equally to TOHRE, as observed in an earlier study (Hakola et al., 2017), possibly related to a systemic defence mechanism. Exceptions are the two stress periods, where GLVs and aldehydes were the major compounds. Birch emissions were dominated by various fractions of monoterpenes and sesquiterpenes with GLVs also present, especially in mid-July and August.
In absolute terms, the highest TOHRE values were measured for birch. This is partly explained by total OH reactivity values measured close to the experimental background (independent of the tree species measured) and normalised by the smallest dry weight of the leaves or needles of all tree species. Compared to pine, higher TOHRE averages were found for spruce, indicating that knowledge of the tree composition of a forest is important in order to assess reactive emissions.
In general, the missing OHRE fractions remain high, but for pine and spruce, they were driven by low-reactivity periods (low COHRE and scatter of the TOHRE measurements), and the missing OHRE fraction was smaller for periods with higher TOHRE. However, for birch, we found consistently high missing fractions throughout the measurement periods, which emphasises the need to look for emitted compounds with different functionalities than the ones studied so far.
Moreover, TOHRE exhibited various degrees of temperature dependence. For spruce in particular, this temperature dependence had a strong seasonality: a high temperature dependence was found in July and August (when less-volatile compounds such as sesquiterpenes are emitted), but a low dependence was measured in May and September. For pine and birch, the temperature difference varied less with the seasons. Stress emissions for pine in July were not temperature dependent at all, and no correlation could be found. Accounting for photosynthetically active radiation (PAR) with a hybrid model did not significantly improve the correlations, with the notable exception of pine emissions in July (including a very large peak on 9 July).
Because this type of characterisation of TOHRE is rare, only a comparison with a study by Nölscher et al. (2013) is possible. They found that the missing OHRE fraction for spruce emissions was low in spring and increased as the seasons proceeded; in the present study, however, we found a larger missing OHRE fraction for spruce emissions in the spring compared to later in the year. This underscores how much is still unknown regarding biogenic emissions of reactive species but also the challenges of the methods used. For instance, Nölscher et al. (2013) did not have continuous GC–MS measurements throughout the year and relied on a constant chemical speciation derived in the spring, while our results demonstrate that emission profiles vary throughout the year and react to various environmental conditions, particularly stress episodes. Further understanding, characterisation, and quantification of such stress episodes (and their many causes) are necessary in order to better model reactive emissions from vegetation in global models as they can occur suddenly and with high intensity.
While it remains difficult to generalise from the particular data set presented in this study, clear future research directions are highlighted. In addition, direct in situ studies for various trees from the forest should be conducted to confirm the findings of the present work.

Figure A1Pictures of pine branches. Dates framed in green indicate that a new branch was placed in the enclosure.
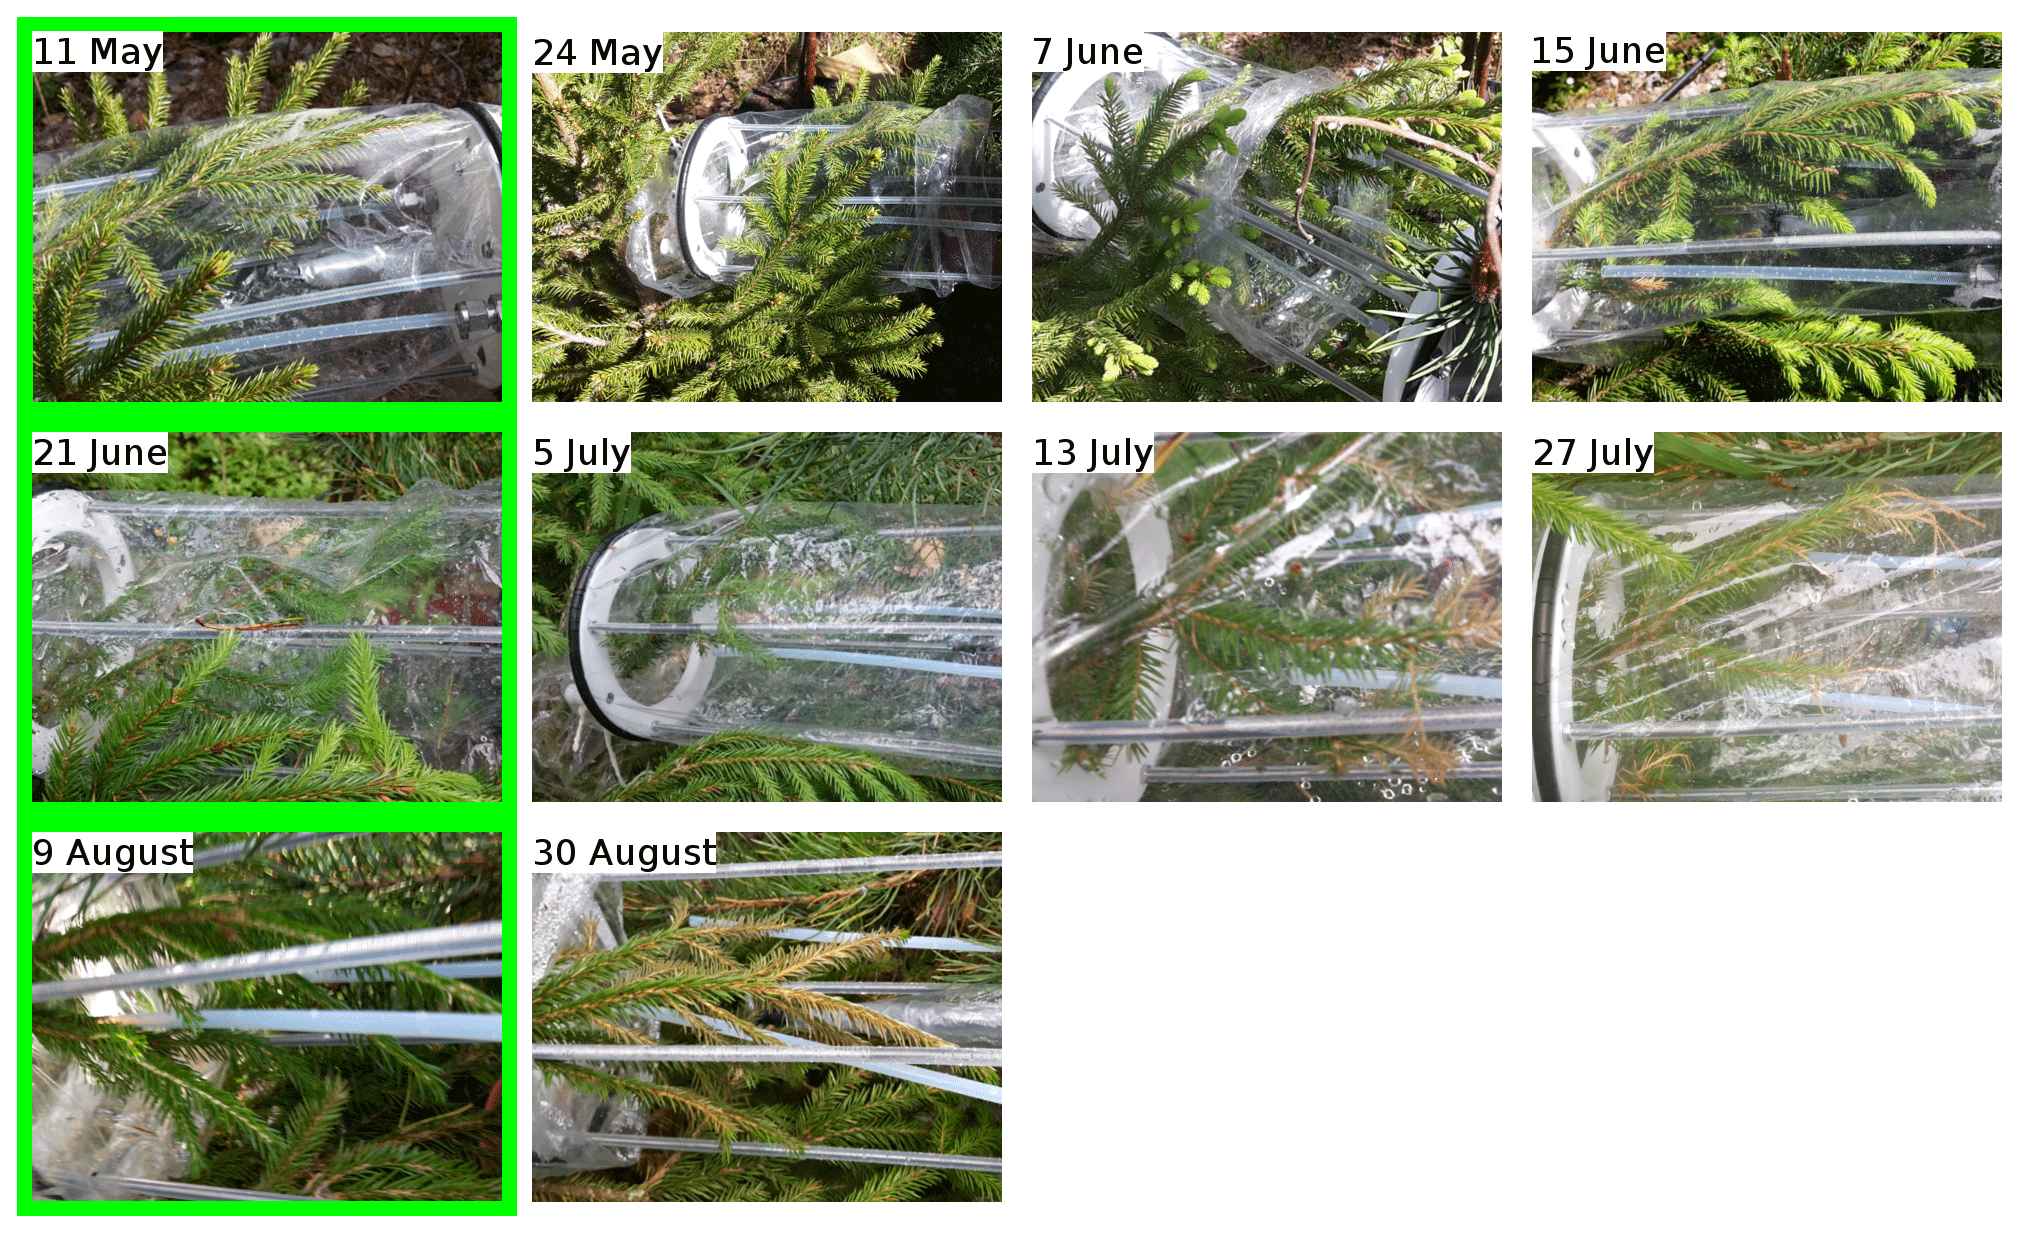
Figure A2Pictures of spruce branches. Dates framed in green indicate that a new branch was placed in the enclosure.
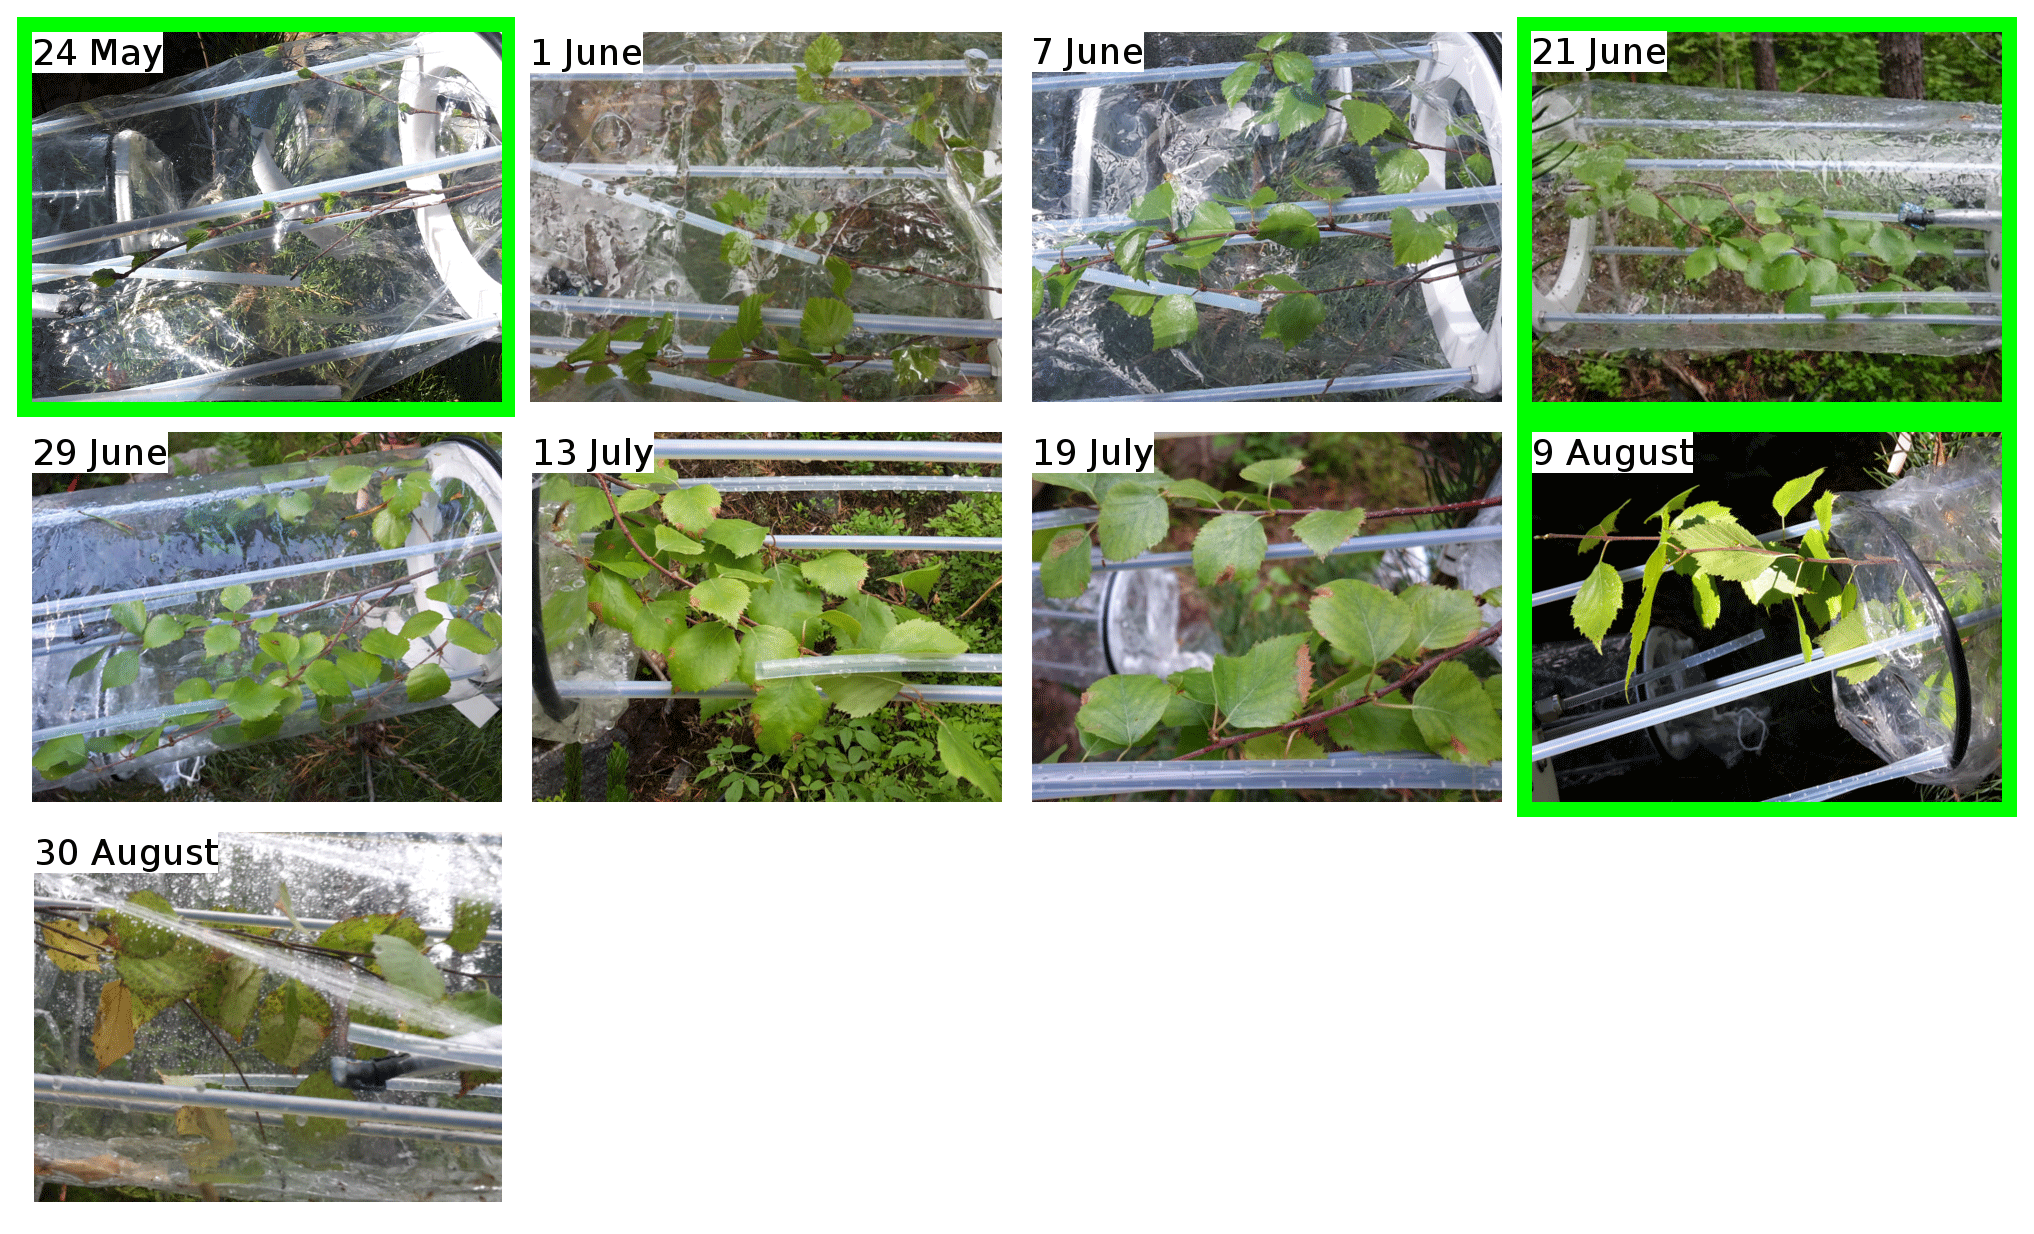
Figure A3Pictures of birch branches. Dates framed in green indicate that a new branch was placed in the enclosure.
Table B1Dry weight of the needles' or leaves' biomass on the dates the branches were cut.
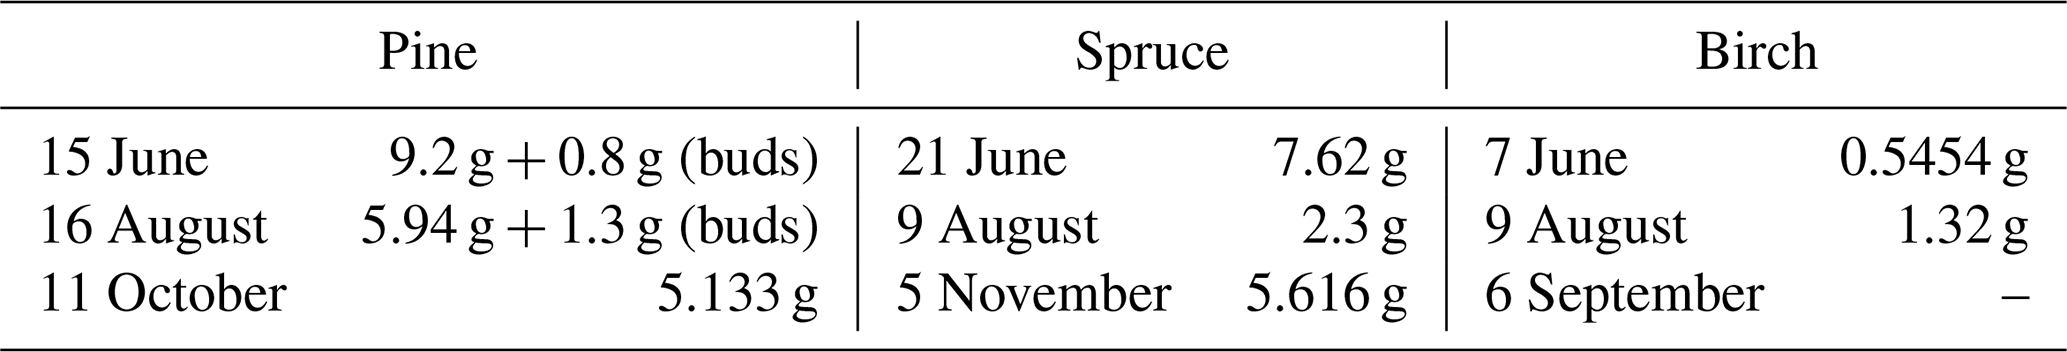
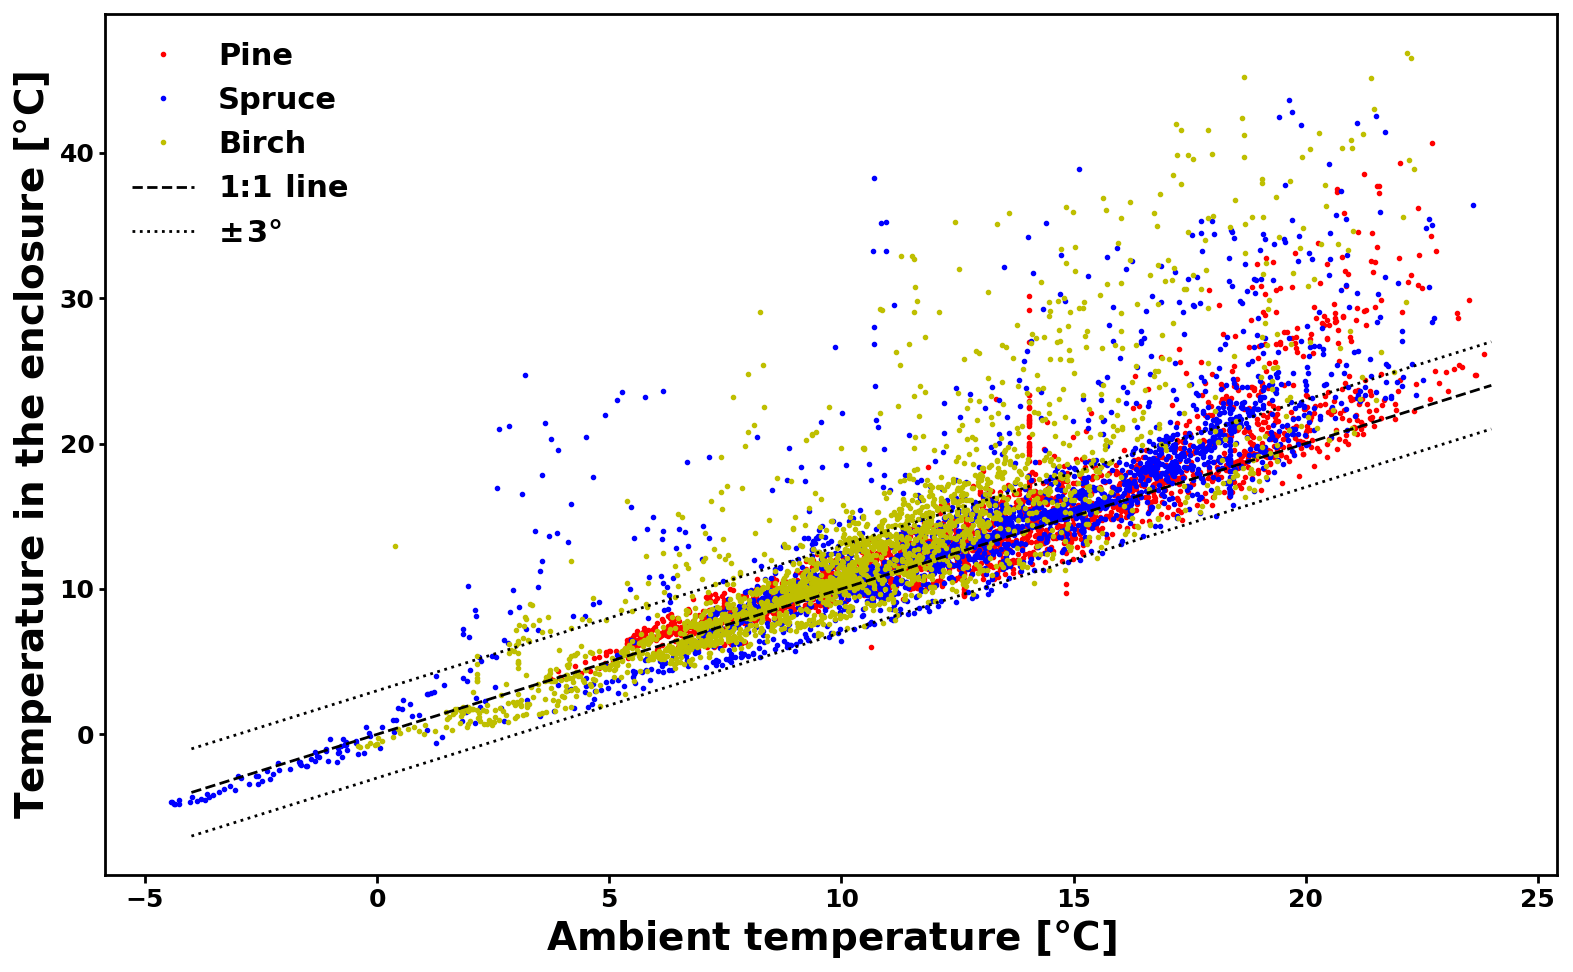
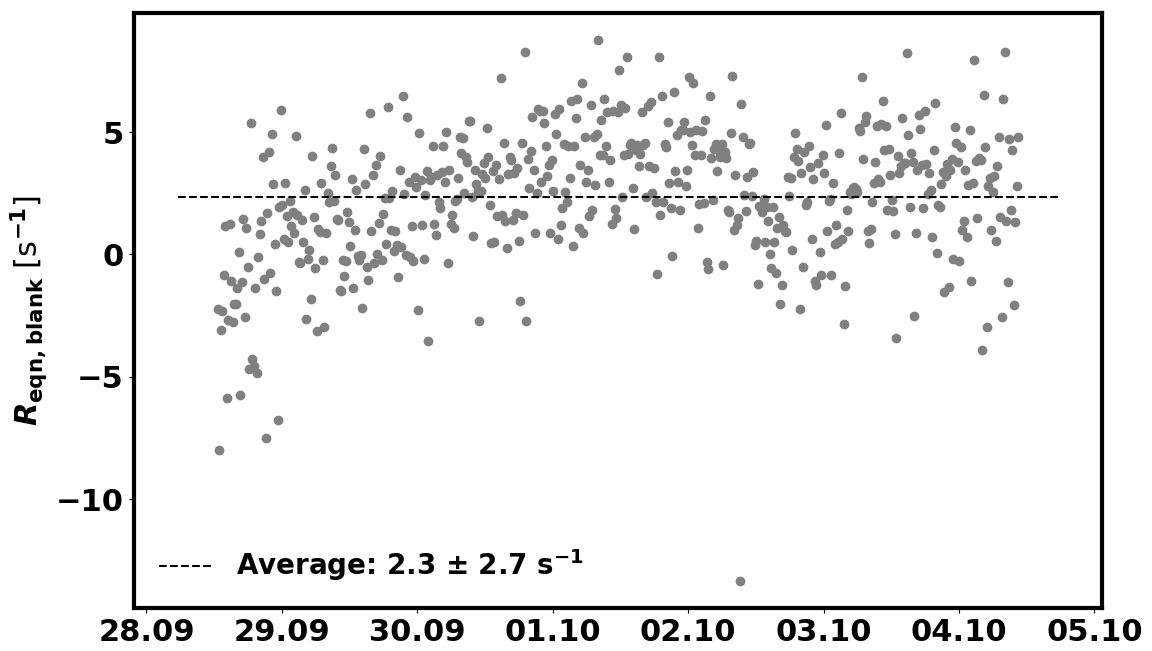
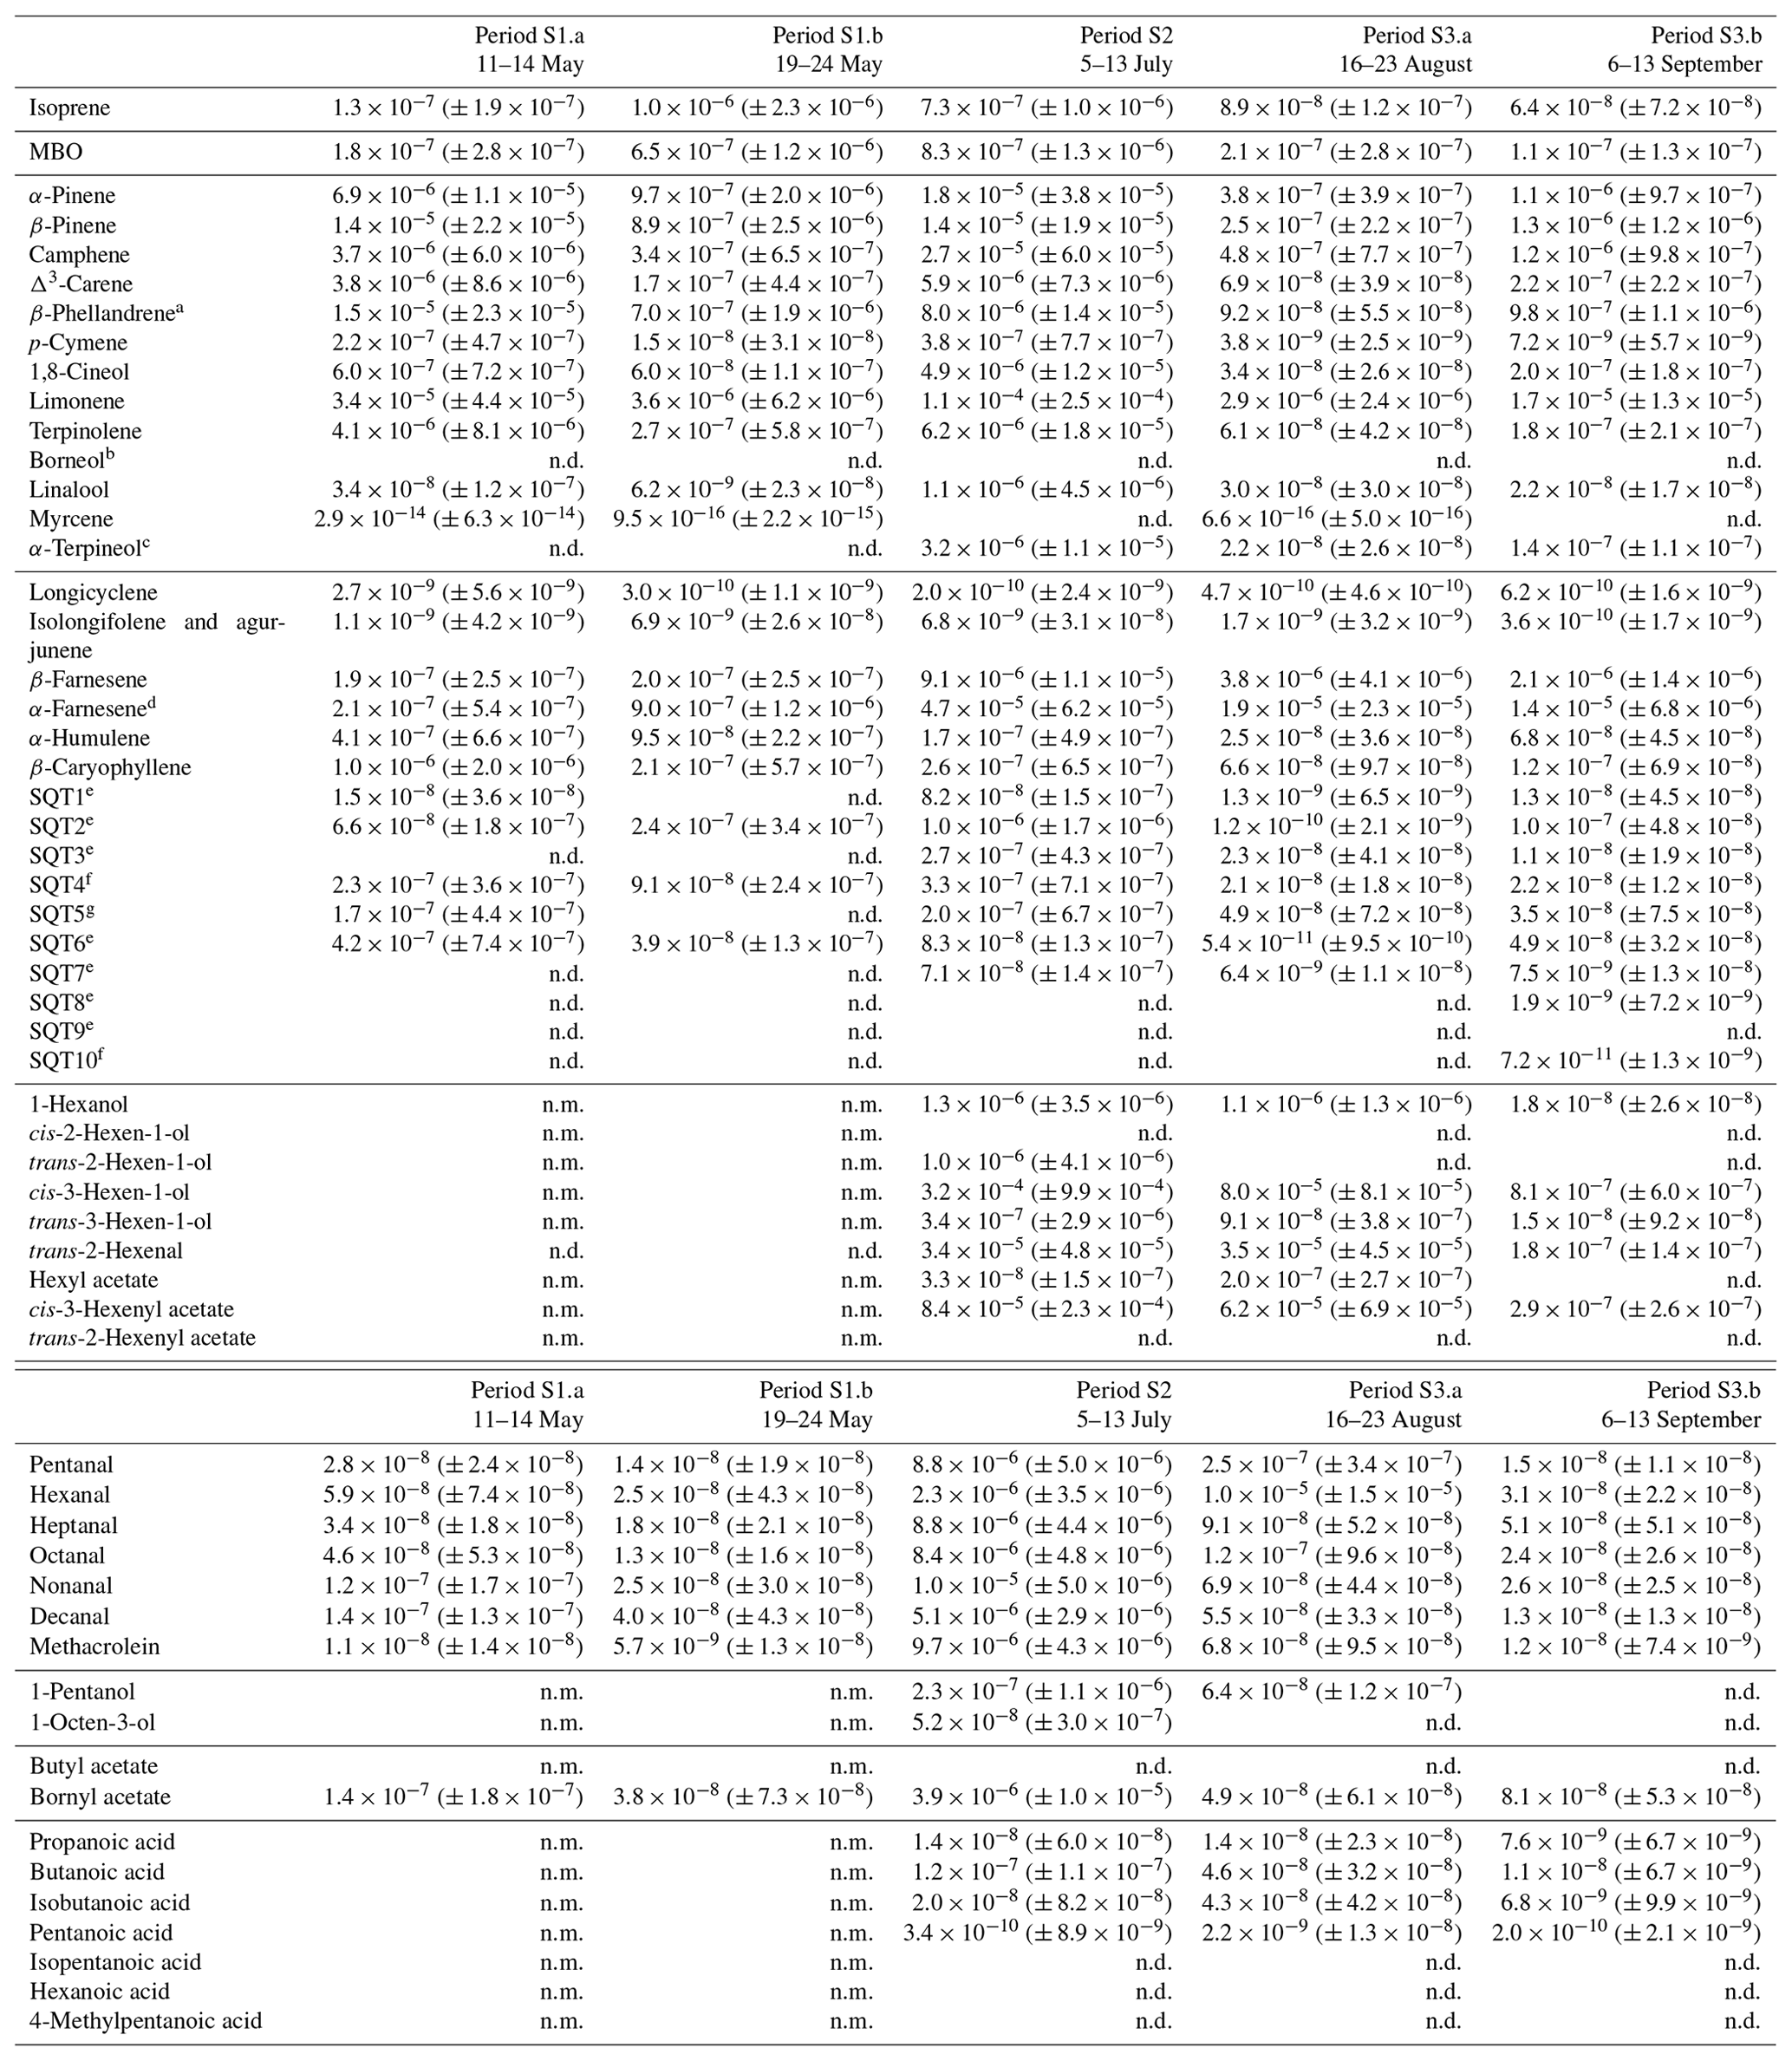
Table D1Averages of individual compounds' OH reactivity of the emissions, OHRE (m3 s−2 g), with standard deviations (in brackets) for the different measurement periods for pine; “n.d.” means “not detected”.
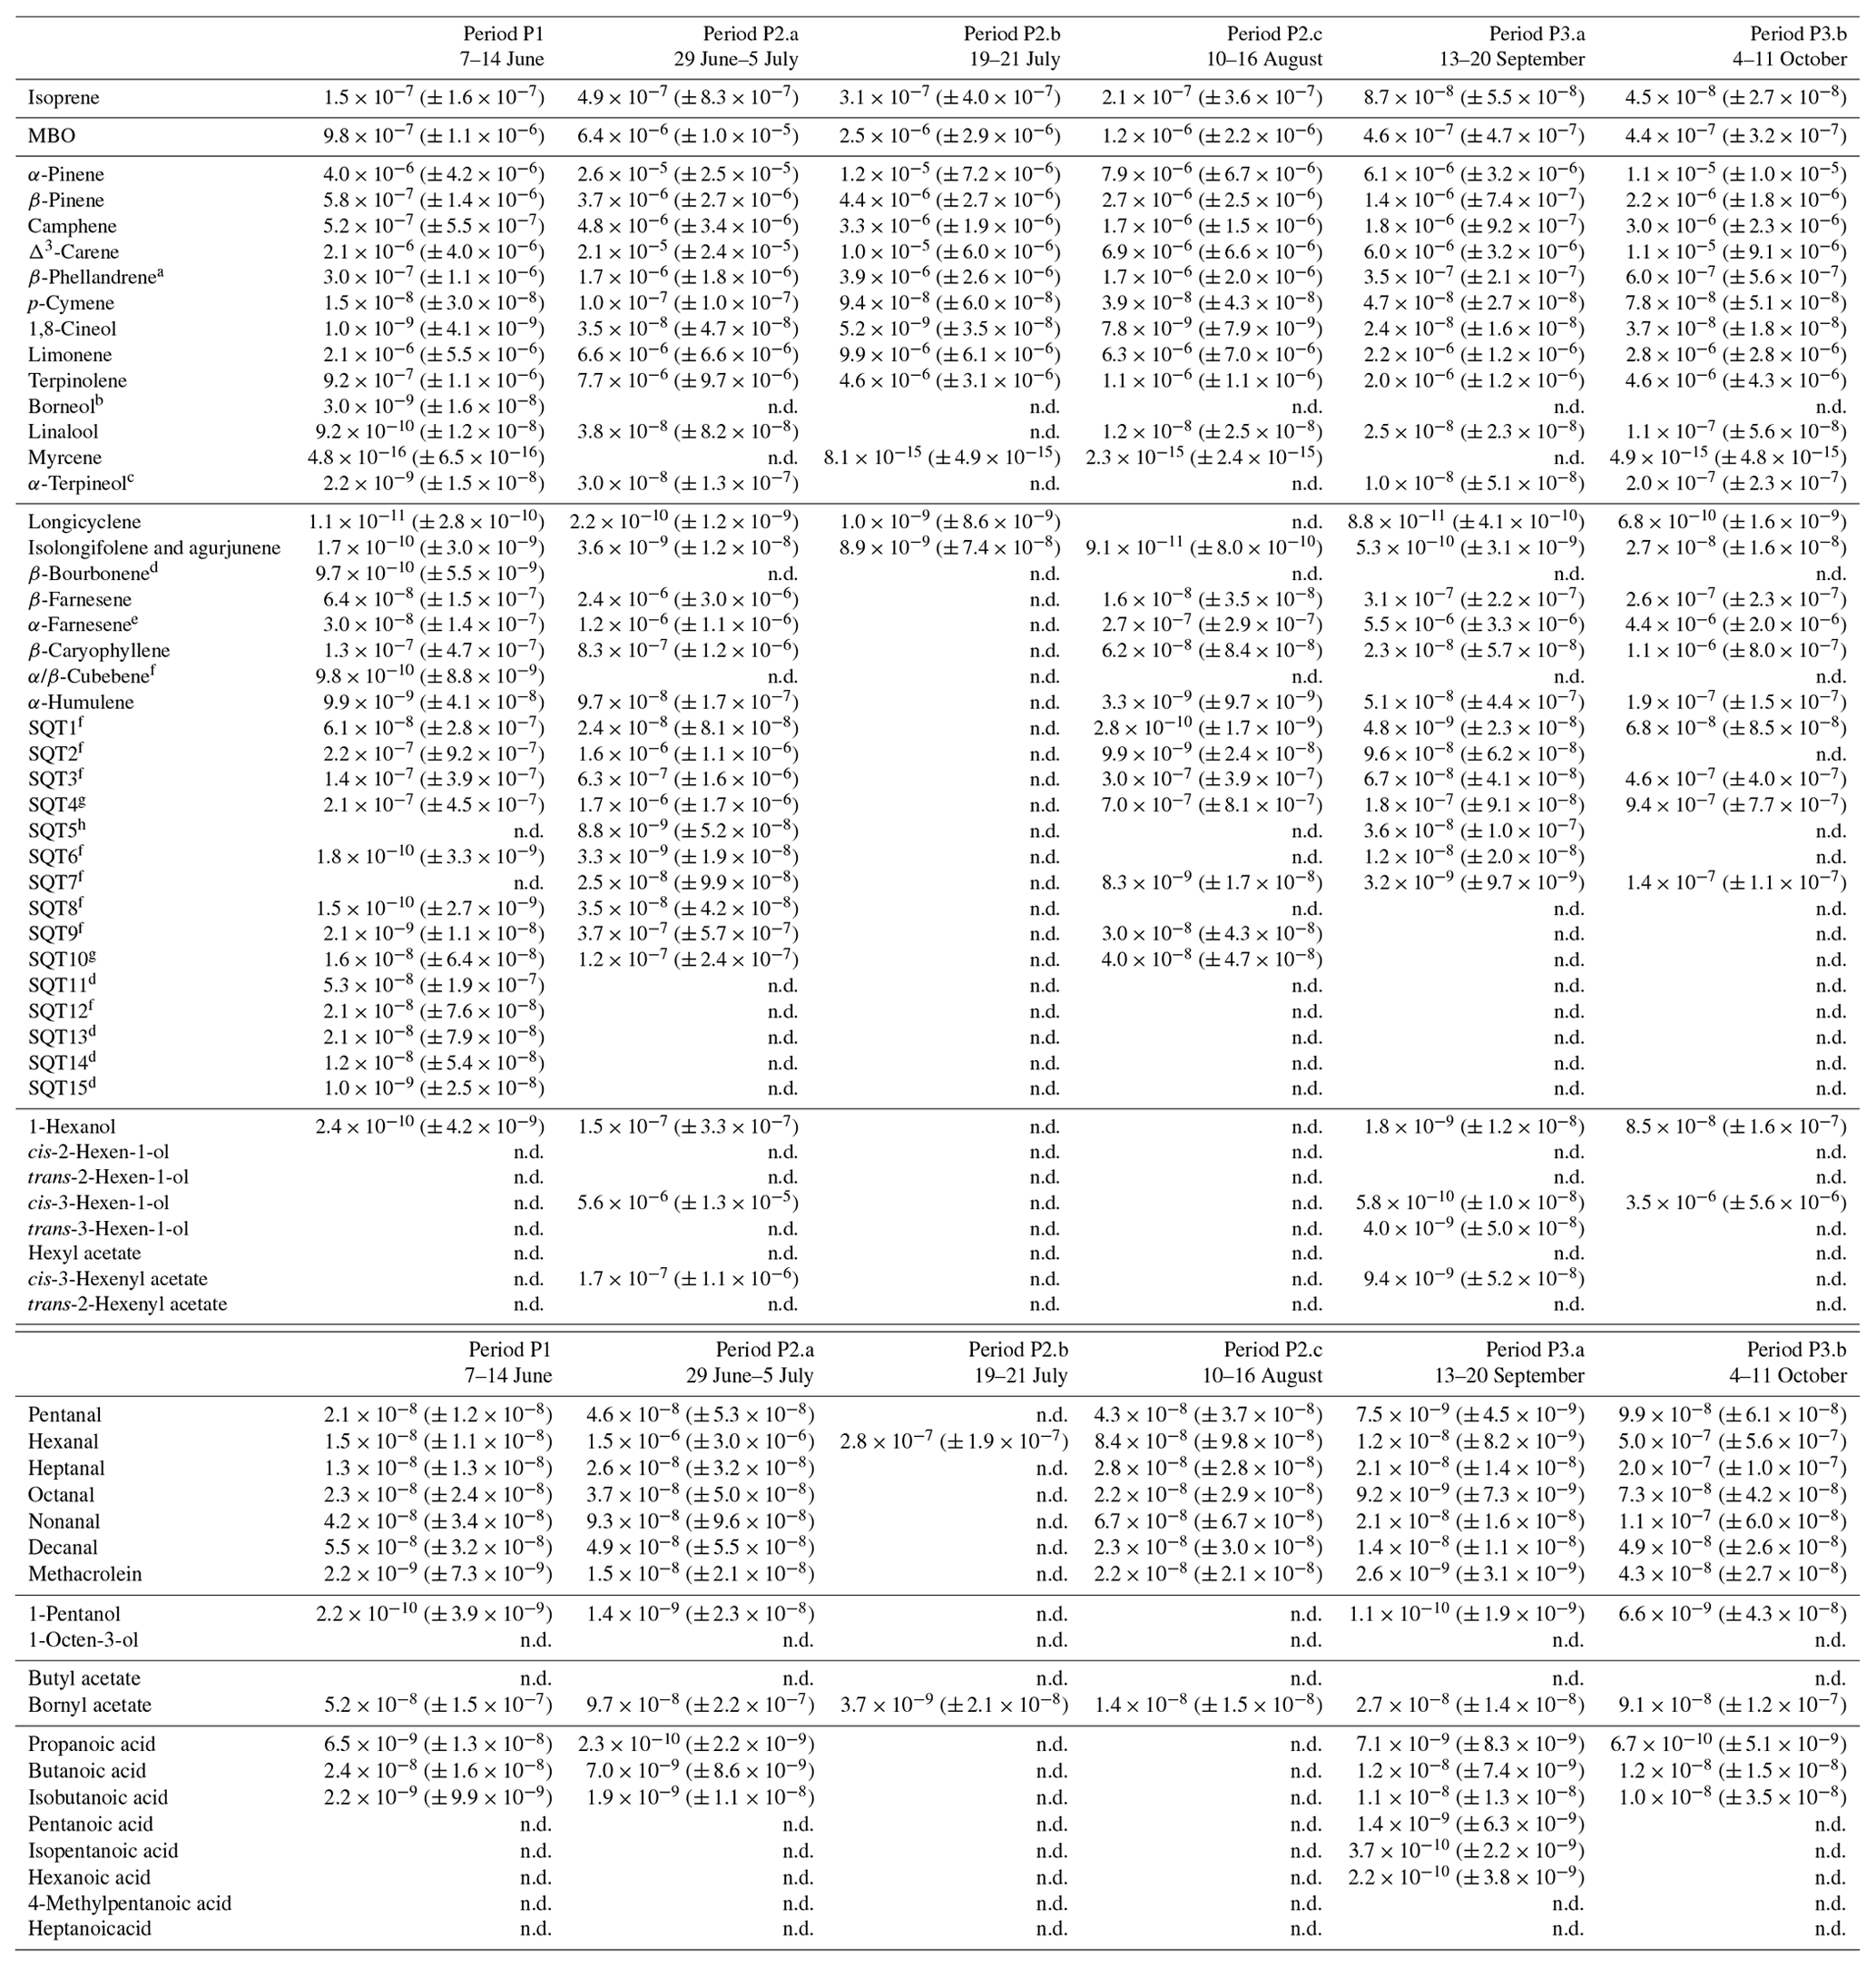
a Quantified as Δ3-carene. b Quantified as bornylacetate. c Quantified as terpinolene. d Quantified as isolongifolene. e Quantified as β-farnesene. f Quantified as β-caryophyllene. g Quantified as β-caryophyllene or isolongifolene. h Quantified as longicyclene.
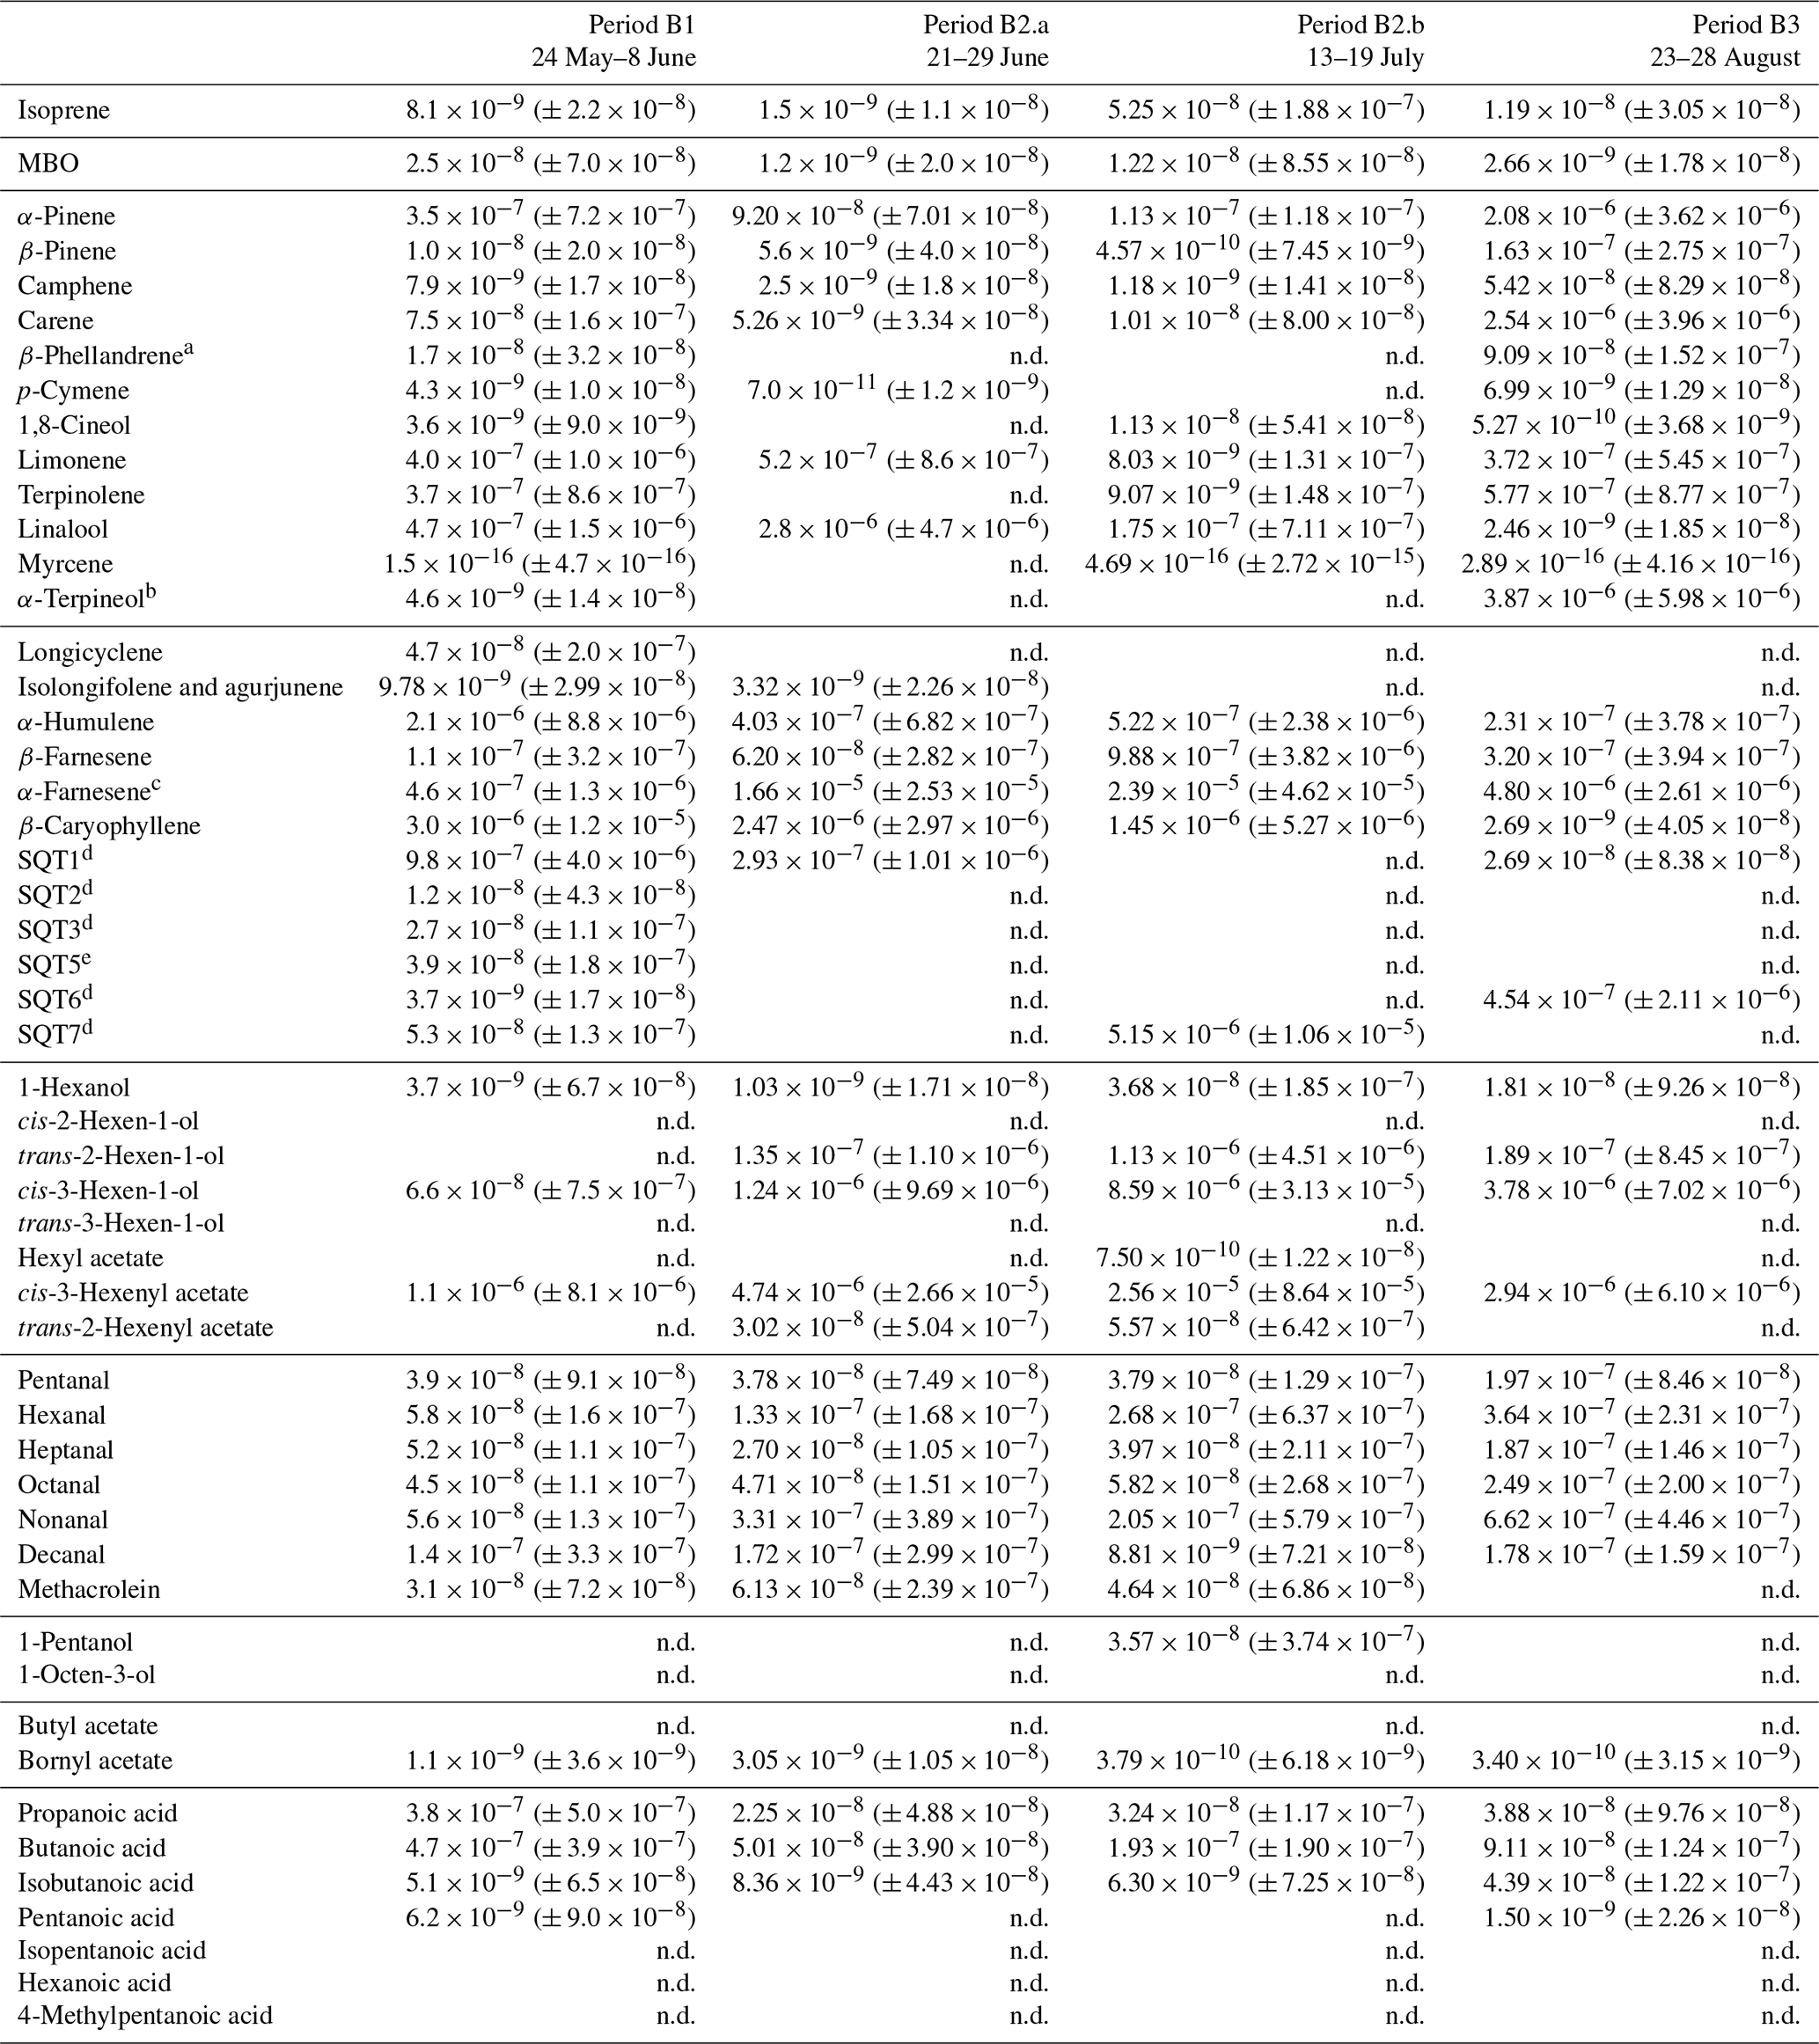
Table D2Averages of individual compounds' OH reactivity of the emissions, OHRE (m3 s−2 g), with standard deviations (in brackets) for the different measurement periods for spruce; “n.d.” means “not detected” and “n.m.” means “not measured”.
a Quantified as carene. b Quantified as bornylacetate. c Quantified as terpinolene. d Quantified as β-farnesene. e Quantified as β-caryophyllene. f Quantified as β-caryophyllene or isolongifolene. g Quantified as longicyclene.
Table D3Averages of individual compounds' OH reactivity of the emissions, OHRE (m3 s−2 g), with standard deviations (in brackets) for the different measurement periods for birch; “n.d.” means “not detected”.
a Quantified as carene. b Quantified as terpinolene. c Quantified as β-farnesene. d Quantified as β-caryophyllene. e Quantified as longicyclene.
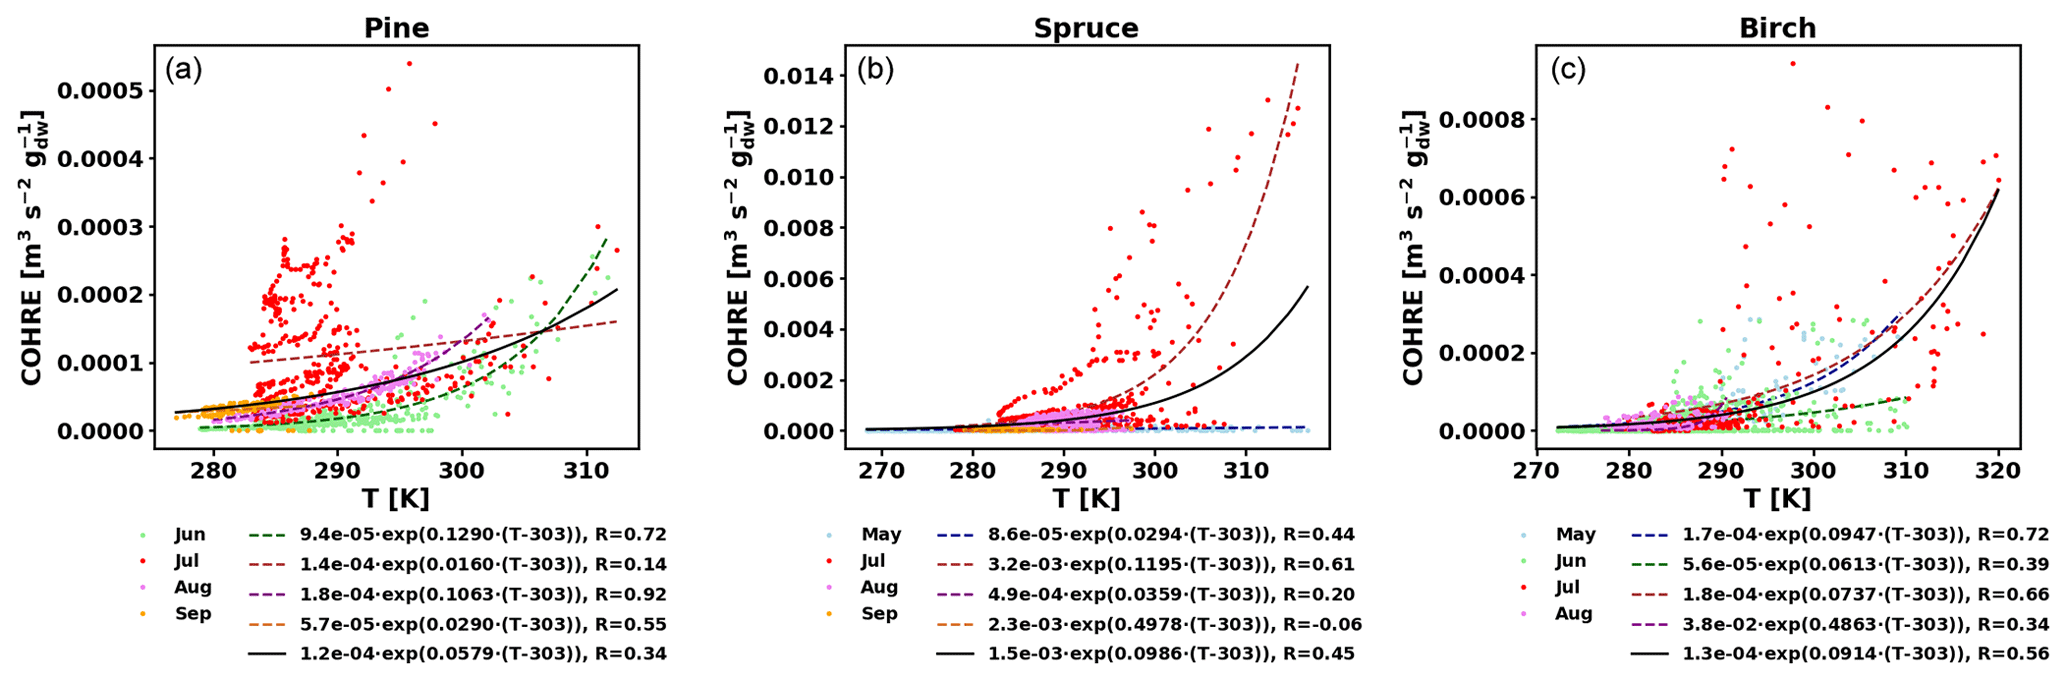
Figure E1COHRE temperature dependence by month (coloured dots and dotted line fits) and fit for all data combined (black solid line) for pine (a), spruce (b), and birch (c).
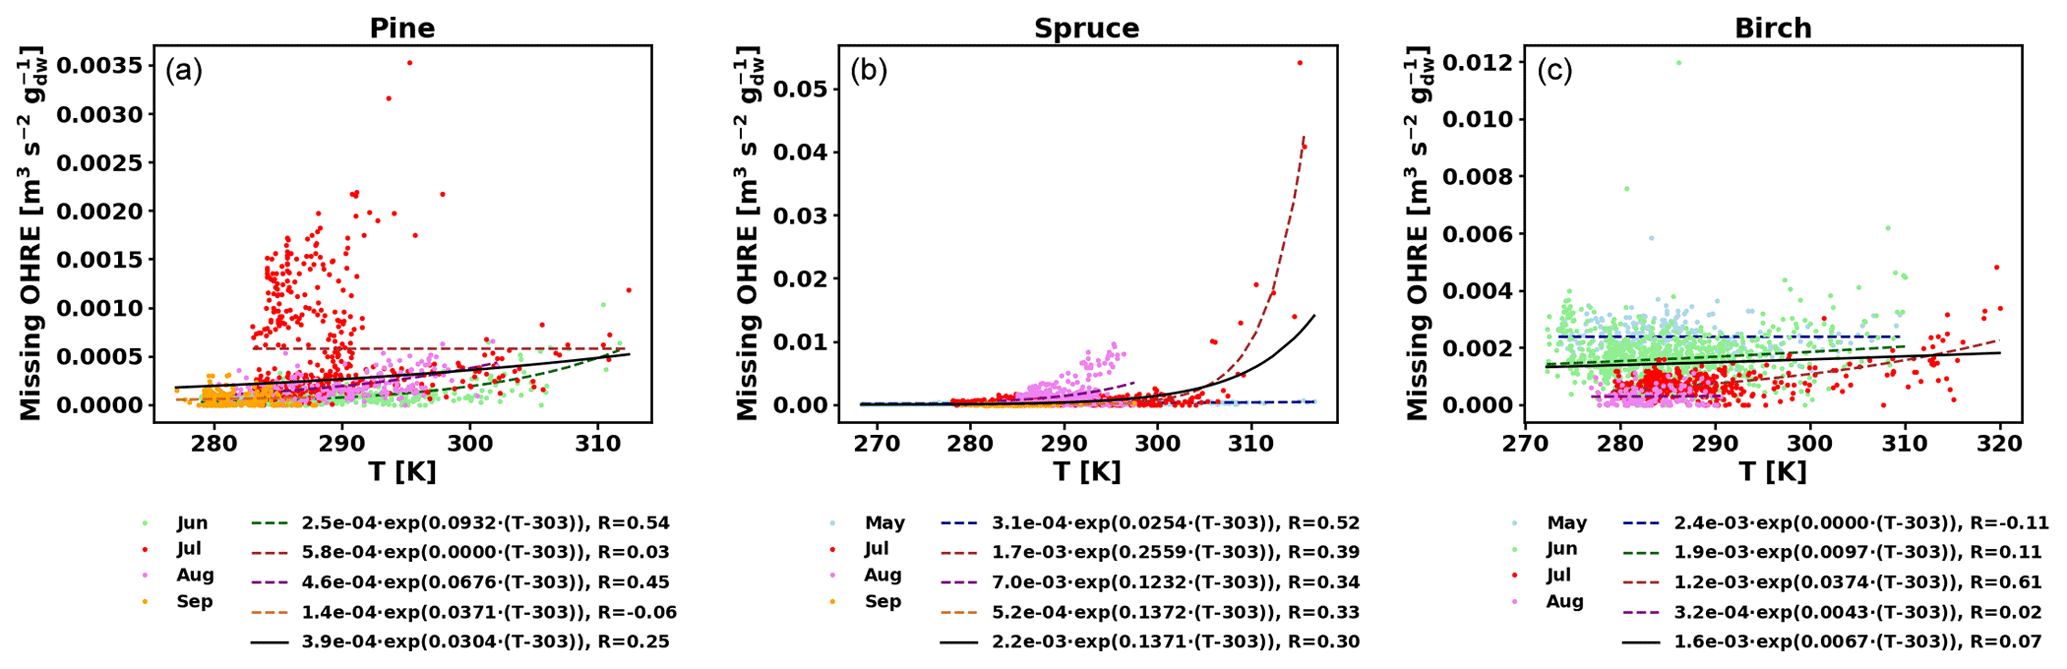
Figure E2Missing OHRE temperature dependence by month (coloured dots and dotted line fits) and fit for all data combined (black solid line) for pine (a), spruce (b), and birch (c).
Table E1Regression coefficients and coefficients of correlation (R) for temperature dependence of COHRE and for its dependence on both temperature and light using the hybrid algorithm.
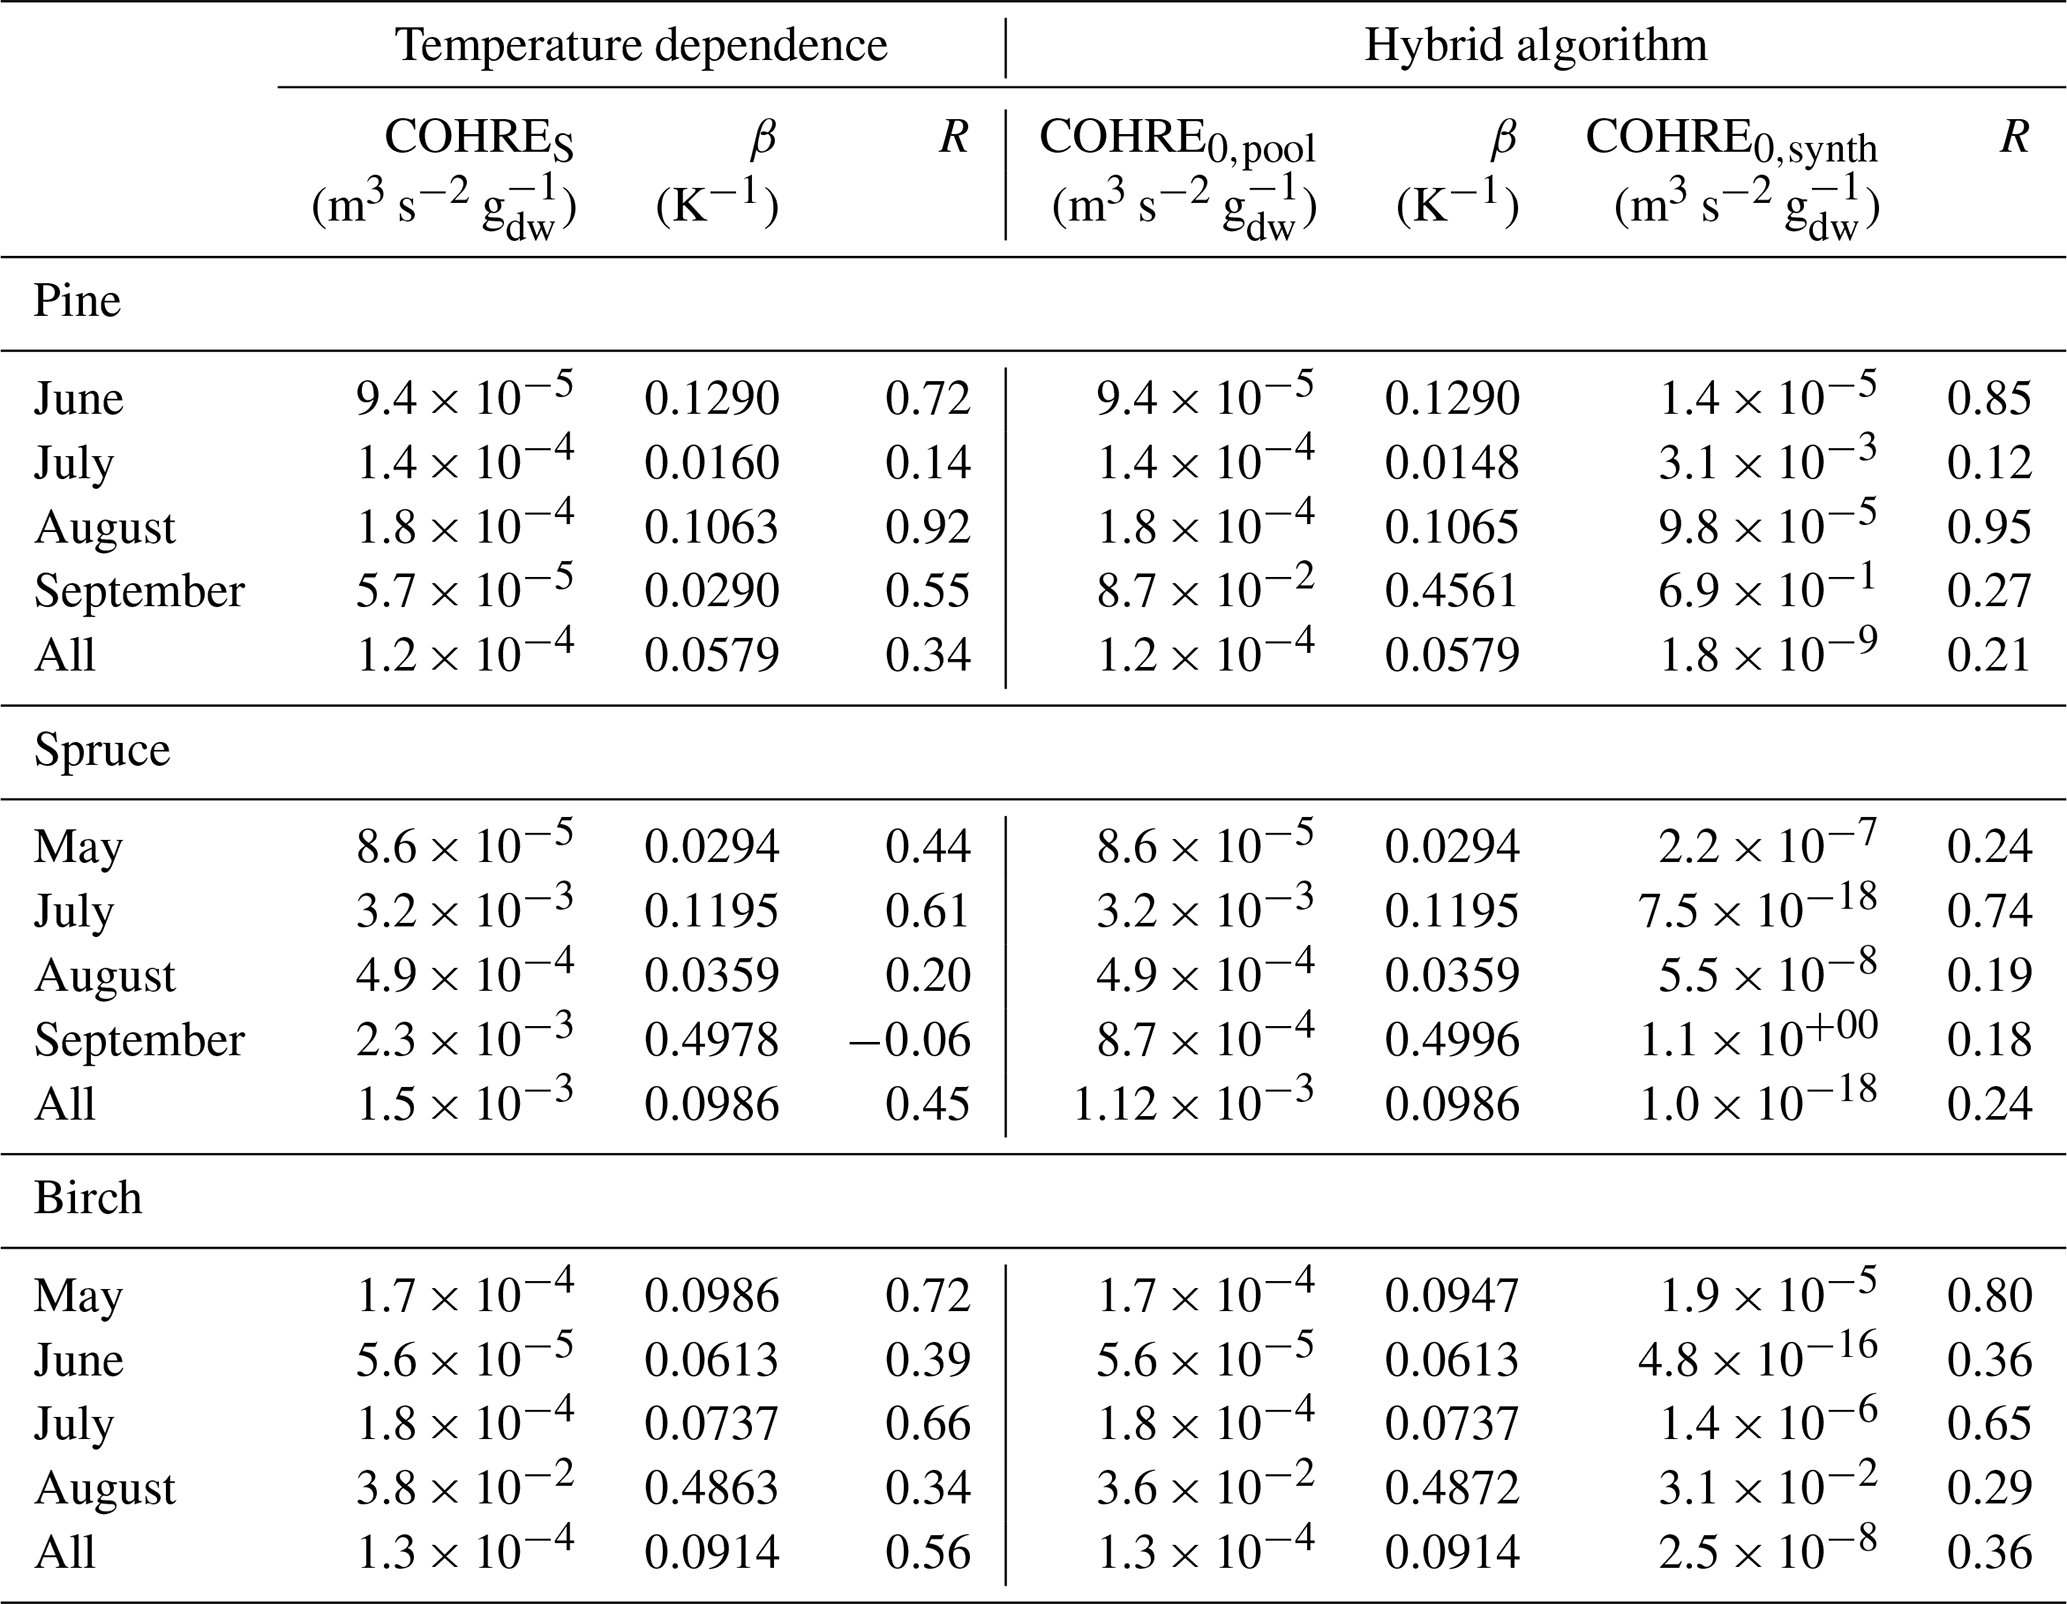
Table E2Regression coefficients and coefficients of correlation (R) for temperature dependence of missing OHRE (MOHRE) and for its dependence on both temperature and light using the hybrid algorithm.

All data used in this study are available from the authors upon request.
APP conducted total OH reactivity measurements, performed data analysis, and led the writing of the manuscript. TT operated the GC–MSs and analysed the data produced. SS participated in the data analysis and commented on the manuscript. JB assisted in the interpretation of the results and gave comments on the manuscript. HH designed the study, conducted measurements with the GC–MSs, analysed the data, and commented on the manuscript. VT contributed to statistical analysis and reviewed the manuscript.
The authors declare that they have no conflict of interest.
The authors thank Hannele Hakola for the continuous support. They also thank the staff at the SMEAR II station for their help and Jari Waldén for lending calibration standards.
This research has been supported by the Academy of Finland, Biotieteiden ja Ympäristön Tutkimuksen Toimikunta (grant no. 314099). The presented research has been funded by the Academy of Finland (Academy Research Fellowship, project nos. 307797, 275608, and 312502) as well as by the Centre of Excellence in Atmospheric Science (grant no. 272041).
This paper was edited by Dan Yakir and reviewed by two anonymous referees.
Atkinson, R., Aschmann, S. M., Winer, A. M., and Carter, W. P. L.: Rate constants for the gas-phase reactions of nitrate radicals with furan, thiophene, and pyrrole at 295±1 K and atmospheric pressure, Environ. Sci. Technol., 19, 87–90, https://doi.org/10.1021/es00131a010, 1985. a
Bäck, J., Aalto, J., Henriksson, M., Hakola, H., He, Q., and Boy, M.: Chemodiversity of a Scots pine stand and implications for terpene air concentrations, Biogeosciences, 9, 689–702, https://doi.org/10.5194/bg-9-689-2012, 2012. a
Bertin, N., Staudt, M., Hansen, U., Seufert, G., Ciccioli, P., Foster, P., Fugit, J. L., and Torres, L.: Diurnal and seasonal course of monoterpene emissions from Quercus ilex (L.) under natural conditions application of light and temperature algorithms, Atmos. Environ., 31, 135–144, https://doi.org/10.1016/S1352-2310(97)00080-0, 1997. a
Bourtsoukidis, E., Bonn, B., Dittmann, A., Hakola, H., Hellén, H., and Jacobi, S.: Ozone stress as a driving force of sesquiterpene emissions: a suggested parameterisation, Biogeosciences, 9, 4337–4352, https://doi.org/10.5194/bg-9-4337-2012, 2012. a
Di Carlo, P., Brune, W. H., Martinez, M., Harder, H., Lesher, R., Ren, X., Thornberry, T., Carroll, M. A., Young, V., Shepson, P. B., Riemer, D., Apel, E., and Campbell, C.: Missing OH Reactivity in a Forest: Evidence for Unknown Reactive Biogenic VOCs, Science, 304, 722–725, https://doi.org/10.1126/science.1094392, 2004. a
Dillon, T. J., Tucceri, M. E., Dulitz, K., Horowitz, A., Vereecken, L., and Crowley, J. N.: Reaction of Hydroxyl Radicals with C4H5N (Pyrrole): Temperature and Pressure Dependent Rate Coefficients, J. Phys. Chem. A, 116, 6051–6058, https://doi.org/10.1021/jp211241x, 2012. a
Duhl, T. R., Helmig, D., and Guenther, A.: Sesquiterpene emissions from vegetation: a review, Biogeosciences, 5, 761–777, https://doi.org/10.5194/bg-5-761-2008, 2008. a
Faiola, C. L., Buchholz, A., Kari, E., Yli-Pirilä, P., Holopainen, J. K., Kivimäenpää, M., Miettinen, P., Worsnop, D. R., Lehtinen, K. E. J., Guenther, A. B., and Virtanen, A.: Terpene Composition Complexity Controls Secondary Organic Aerosol Yields from Scots Pine Volatile Emissions, Sci. Rep.-UK, 8, 3053, https://doi.org/10.1038/s41598-018-21045-1, 2018. a
Ferracci, V., Heimann, I., Abraham, N. L., Pyle, J. A., and Archibald, A. T.: Global modelling of the total OH reactivity: investigations on the “missing” OH sink and its atmospheric implications, Atmos. Chem. Phys., 18, 7109–7129, https://doi.org/10.5194/acp-18-7109-2018, 2018. a
Fuchs, H., Novelli, A., Rolletter, M., Hofzumahaus, A., Pfannerstill, E. Y., Kessel, S., Edtbauer, A., Williams, J., Michoud, V., Dusanter, S., Locoge, N., Zannoni, N., Gros, V., Truong, F., Sarda-Esteve, R., Cryer, D. R., Brumby, C. A., Whalley, L. K., Stone, D., Seakins, P. W., Heard, D. E., Schoemaecker, C., Blocquet, M., Coudert, S., Batut, S., Fittschen, C., Thames, A. B., Brune, W. H., Ernest, C., Harder, H., Muller, J. B. A., Elste, T., Kubistin, D., Andres, S., Bohn, B., Hohaus, T., Holland, F., Li, X., Rohrer, F., Kiendler-Scharr, A., Tillmann, R., Wegener, R., Yu, Z., Zou, Q., and Wahner, A.: Comparison of OH reactivity measurements in the atmospheric simulation chamber SAPHIR, Atmos. Meas. Tech., 10, 4023–4053, https://doi.org/10.5194/amt-10-4023-2017, 2017. a
Ghirardo, A., Koch, K., Taipale, R., Zimmer, I., Schnitzler, J.-P., and Rinne, J.: Determination of de novo and pool emissions of terpenes from four common boreal/alpine trees by 13CO2 labelling and PTR-MS analysis, Plant Cell Environ., 33, 781–792, https://doi.org/10.1111/j.1365-3040.2009.02104.x, 2010. a
Guenther, A.: Seasonal and Spatial Variations in Natural Volatile Organic Compound Emissions, Ecol. Appl., 7, 34–45, https://doi.org/10.1890/1051-0761(1997)007[0034:SASVIN]2.0.CO;2, 1997. a
Guenther, A., Hewitt, C. N., Erickson, D., Fall, R., Geron, C., Graedel, T., Harley, P., Klinger, L., Lerdau, M., Mckay, W. A., Pierce, T., Scholes, B., Steinbrecher, R., Tallamraju, R., Taylor, J., and Zimmerman, P.: A global model of natural volatile organic compound emissions, J. Geophys. Res., 100, 8873–8892, https://doi.org/10.1029/94JD02950, 1995. a
Guenther, A. B., Zimmerman, P. R., Harley, P. C., Monson, R. K., and Fall, R.: Isoprene and monoterpene emission rate variability: Model evaluations and sensitivity analyses, J. Geophys. Res.-Atmos., 98, 12609–12617, https://doi.org/10.1029/93JD00527, 1993. a
Guenther, A. B., Jiang, X., Heald, C. L., Sakulyanontvittaya, T., Duhl, T., Emmons, L. K., and Wang, X.: The Model of Emissions of Gases and Aerosols from Nature version 2.1 (MEGAN2.1): an extended and updated framework for modeling biogenic emissions, Geosci. Model Dev., 5, 1471–1492, https://doi.org/10.5194/gmd-5-1471-2012, 2012. a
Haapanala, S., Ekberg, A., Hakola, H., Tarvainen, V., Rinne, J., Hellén, H., and Arneth, A.: Mountain birch – potentially large source of sesquiterpenes into high latitude atmosphere, Biogeosciences, 6, 2709–2718, https://doi.org/10.5194/bg-6-2709-2009, 2009. a
Hakola, H., Tarvainen, V., Bäck, J., Ranta, H., Bonn, B., Rinne, J., and Kulmala, M.: Seasonal variation of mono- and sesquiterpene emission rates of Scots pine, Biogeosciences, 3, 93–101, https://doi.org/10.5194/bg-3-93-2006, 2006. a, b, c
Hakola, H., Tarvainen, V., Praplan, A. P., Jaars, K., Hemmilä, M., Kulmala, M., Bäck, J., and Hellén, H.: Terpenoid and carbonyl emissions from Norway spruce in Finland during the growing season, Atmos. Chem. Phys., 17, 3357–3370, https://doi.org/10.5194/acp-17-3357-2017, 2017. a, b, c, d
Hari, P. and Kulmala, M.: Station for Measuring Ecosystem-Atmosphere Relations (SMEAR II), Boreal Environ. Res., 10, 315–322, 2005. a
Heard, D. E. and Pilling, M. J.: Measurement of OH and HO2 in the Troposphere, Chem. Rev., 103, 5163–5198, https://doi.org/10.1021/cr020522s, 2003. a
Helin, A., Hakola, H., and Hellén, H.: Optimisation of a thermal desorption–gas chromatography–mass spectrometry method for the analysis of monoterpenes, sesquiterpenes and diterpenes, Atmos. Meas. Tech., 13, 3543–3560, https://doi.org/10.5194/amt-13-3543-2020, 2020. a
Hellén, H., Schallhart, S., Praplan, A. P., Petäjä, T., and Hakola, H.: Using in situ GC-MS for analysis of C2–C7 volatile organic acids in ambient air of a boreal forest site, Atmos. Meas. Tech., 10, 281–289, https://doi.org/10.5194/amt-10-281-2017, 2017. a, b
Hellén, H., Praplan, A. P., Tykkä, T., Ylivinkka, I., Vakkari, V., Bäck, J., Petäjä, T., Kulmala, M., and Hakola, H.: Long-term measurements of volatile organic compounds highlight the importance of sesquiterpenes for the atmospheric chemistry of a boreal forest, Atmos. Chem. Phys., 18, 13839–13863, https://doi.org/10.5194/acp-18-13839-2018, 2018. a
Helmig, D., Ortega, J., Duhl, T., Tanner, D., Guenther, A., Harley, P., Wiedinmyer, C., Milford, J., and Sakulyanontvittaya, T.: Sesquiterpene Emissions from Pine Trees – Identifications, Emission Rates and Flux Estimates for the Contiguous United States, Environ. Sci. Technol., 41, 1545–1553, https://doi.org/10.1021/es0618907, 2007. a
Junninen, H., Lauri, A., Keronen, P., Aalto, P., Hiltunen, V., Hari, P., and Kulmala, M.: Smart-SMEAR: on-line data exploration and visualization tool for SMEAR stations, Boreal Environ. Res., 14, 447–457, 2009. a
Keenan, R. J., Reams, G. A., Achard, F., de Freitas, J. V., Grainger, A., and Lindquist, E.: Dynamics of global forest area: Results from the FAO Global Forest Resources Assessment 2015, Forest Ecol. Manage., 352, 9–20, https://doi.org/10.1016/j.foreco.2015.06.014, 2015. a
Kim, S., Guenther, A., Karl, T., and Greenberg, J.: Contributions of primary and secondary biogenic VOC tototal OH reactivity during the CABINEX (Community Atmosphere-Biosphere INteractions Experiments)-09 field campaign, Atmos. Chem. Phys., 11, 8613–8623, https://doi.org/10.5194/acp-11-8613-2011, 2011. a
Kovacs, T. A. and Brune, W. H.: Total OH Loss Rate Measurement, J. Atmos. Chem., 39, 105–122, https://doi.org/10.1023/A:1010614113786, 2001. a
Lelieveld, J., Gromov, S., Pozzer, A., and Taraborrelli, D.: Global tropospheric hydroxyl distribution, budget and reactivity, Atmos. Chem. Phys., 16, 12477–12493, https://doi.org/10.5194/acp-16-12477-2016, 2016. a
Lindfors, V. and Laurila, T.: Biogenic volatile organic compound (VOC) emissions from forests in Finland, Boreal Environ. Res., 5, 95–113, 2000. a
Michoud, V., Hansen, R. F., Locoge, N., Stevens, P. S., and Dusanter, S.: Detailed characterizations of the new Mines Douai comparative reactivity method instrument via laboratory experiments and modeling, Atmos. Meas. Tech., 8, 3537–3553, https://doi.org/10.5194/amt-8-3537-2015, 2015. a, b, c
Nölscher, A. C., Williams, J., Sinha, V., Custer, T., Song, W., Johnson, A. M., Axinte, R., Bozem, H., Fischer, H., Pouvesle, N., Phillips, G., Crowley, J. N., Rantala, P., Rinne, J., Kulmala, M., Gonzales, D., Valverde-Canossa, J., Vogel, A., Hoffmann, T., Ouwersloot, H. G., Vilà-Guerau de Arellano, J., and Lelieveld, J.: Summertime total OH reactivity measurements from boreal forest during HUMPPA-COPEC 2010, Atmos. Chem. Phys., 12, 8257–8270, https://doi.org/10.5194/acp-12-8257-2012, 2012. a, b, c
Nölscher, A. C., Bourtsoukidis, E., Bonn, B., Kesselmeier, J., Lelieveld, J., and Williams, J.: Seasonal measurements of total OH reactivity emission rates from Norway spruce in 2011, Biogeosciences, 10, 4241–4257, https://doi.org/10.5194/bg-10-4241-2013, 2013. a, b, c, d, e, f, g, h, i
Owen, S., Boissard, C., Street, R. A., Duckham, S. C., Csiky, O., and Hewitt, C. N.: Screening of 18 Mediterranean plant species for volatile organic compound emissions, Atmos. Environ., 31, 101–117, https://doi.org/10.1016/S1352-2310(97)00078-2, 1997. a
Praplan, A. P., Pfannerstill, E. Y., Williams, J., and Hellén, H.: OH reactivity of the urban air in Helsinki, Finland, during winter, Atmos. Environ., 169, 150–161, https://doi.org/10.1016/j.atmosenv.2017.09.013, 2017. a, b
Praplan, A. P., Tykkä, T., Chen, D., Boy, M., Taipale, D., Vakkari, V., Zhou, P., Petäjä, T., and Hellén, H.: Long-term total OH reactivity measurements in a boreal forest, Atmos. Chem. Phys., 19, 14431–14453, https://doi.org/10.5194/acp-19-14431-2019, 2019. a, b, c, d, e, f
Rinne, J., Bäck, J., and Hakola, H.: Biogenic volatile organic compound emissions from the Eurasian taiga: current knowledge and future directions, Boreal Environ. Res., 14, 807–826, 2009. a
Ruuskanen, T. M., Hakola, H., Kajos, M. K., Hellén, H., Tarvainen, V., and Rinne, J.: Volatile organic compound emissions from Siberian larch, Atmos. Environ., 41, 5807–5812, https://doi.org/10.1016/j.atmosenv.2007.05.036, 2007. a
Scala, A., Allmann, S., Mirabella, R., Haring, M. A., and Schuurink, R. C.: Green Leaf Volatiles: A Plant's Multifunctional Weapon against Herbivores and Pathogens, Int. J. Mol. Sci., 14, 17781–17811, https://doi.org/10.3390/ijms140917781, 2013. a
Sinha, V., Williams, J., Crowley, J. N., and Lelieveld, J.: The Comparative Reactivity Method – a new tool to measure total OH Reactivity in ambient air, Atmos. Chem. Phys., 8, 2213–2227, https://doi.org/10.5194/acp-8-2213-2008, 2008. a, b, c
Sinha, V., Williams, J., Lelieveld, J., Ruuskanen, T., Kajos, M., Patokoski, J., Hellen, H., Hakola, H., Mogensen, D., Boy, M., Rinne, J., and Kulmala, M.: OH Reactivity Measurements within a Boreal Forest: Evidence for Unknown Reactive Emissions, Environ. Sci. Technol., 44, 6614–6620, https://doi.org/10.1021/es101780b, 2010. a
Tarvainen, V., Hakola, H., Hellén, H., Bäck, J., Hari, P., and Kulmala, M.: Temperature and light dependence of the VOC emissions of Scots pine, Atmos. Chem. Phys., 5, 989–998, https://doi.org/10.5194/acp-5-989-2005, 2005. a, b, c
Wang, M., Schurgers, G., Arneth, A., Ekberg, A., and Holst, T.: Seasonal variation in biogenic volatile organic compound (BVOC) emissions from Norway spruce in a Swedish boreal forest, Boreal Environ. Res., 22, 353–367, 2017. a
Williams, J. and Brune, W.: A roadmap for OH reactivity research, Atmos. Environ., 106, 371–372, https://doi.org/10.1016/j.atmosenv.2015.02.017, 2015. a
Yang, Y., Shao, M., Wang, X., Nölscher, A. C., Kessel, S., Guenther, A., and Williams, J.: Towards a quantitative understanding of total OH reactivity: A review, Atmos. Environ., 134, 147–161, https://doi.org/10.1016/j.atmosenv.2016.03.010, 2016. a
Yassaa, N., Song, W., Lelieveld, J., Vanhatalo, A., Bäck, J., and Williams, J.: Diel cycles of isoprenoids in the emissions of Norway spruce, four Scots pine chemotypes, and in Boreal forest ambient air during HUMPPA-COPEC-2010, Atmos. Chem. Phys., 12, 7215–7229, https://doi.org/10.5194/acp-12-7215-2012, 2012. a, b
Zannoni, N., Dusanter, S., Gros, V., Sarda Esteve, R., Michoud, V., Sinha, V., Locoge, N., and Bonsang, B.: Intercomparison of two comparative reactivity method instruments inf the Mediterranean basin during summer 2013, Atmos. Meas. Tech., 8, 3851–3865, https://doi.org/10.5194/amt-8-3851-2015, 2015. a
- Abstract
- Introduction
- Methods
- Results and discussion
- Conclusions
- Appendix A: Pictures of the branches
- Appendix B: Dry weight of biomass
- Appendix C: Dynamic branch enclosure
- Appendix D: COHRE by compound
- Appendix E: COHRE and missing OHRE temperature dependence
- Data availability
- Author contributions
- Competing interests
- Acknowledgements
- Financial support
- Review statement
- References