the Creative Commons Attribution 4.0 License.
the Creative Commons Attribution 4.0 License.
 | 01 Oct 2020
Elevated sources of cobalt in the Arctic Ocean
Randelle M. Bundy
Alessandro Tagliabue
Nicholas J. Hawco
Peter L. Morton
Benjamin S. Twining
Mariko Hatta
Abigail E. Noble
Mattias R. Cape
Seth G. John
Jay T. Cullen
Cobalt (Co) is an important bioactive trace metal that is the metal cofactor in cobalamin (vitamin B12) which can limit or co-limit phytoplankton growth in many regions of the ocean. Total dissolved and labile Co measurements in the Canadian sector of the Arctic Ocean during the U.S. GEOTRACES Arctic expedition (GN01) and the Canadian International Polar Year GEOTRACES expedition (GIPY14) revealed a dynamic biogeochemical cycle for Co in this basin. The major sources of Co in the Arctic were from shelf regions and rivers, with only minimal contributions from other freshwater sources (sea ice, snow) and eolian deposition. The most striking feature was the extremely high concentrations of dissolved Co in the upper 100 m, with concentrations routinely exceeding 800 pmol L−1 over the shelf regions. This plume of high Co persisted throughout the Arctic basin and extended to the North Pole, where sources of Co shifted from primarily shelf-derived to riverine, as freshwater from Arctic rivers was entrained in the Transpolar Drift. Dissolved Co was also strongly organically complexed in the Arctic, ranging from 70 % to 100 % complexed in the surface and deep ocean, respectively. Deep-water concentrations of dissolved Co were remarkably consistent throughout the basin (∼55 pmol L−1), with concentrations reflecting those of deep Atlantic water and deep-ocean scavenging of dissolved Co. A biogeochemical model of Co cycling was used to support the hypothesis that the majority of the high surface Co in the Arctic was emanating from the shelf. The model showed that the high concentrations of Co observed were due to the large shelf area of the Arctic, as well as to dampened scavenging of Co by manganese-oxidizing (Mn-oxidizing) bacteria due to the lower temperatures. The majority of this scavenging appears to have occurred in the upper 200 m, with minimal additional scavenging below this depth. Evidence suggests that both dissolved Co (dCo) and labile Co (LCo) are increasing over time on the Arctic shelf, and these limited temporal results are consistent with other tracers in the Arctic. These elevated surface concentrations of Co likely lead to a net flux of Co out of the Arctic, with implications for downstream biological uptake of Co in the North Atlantic and elevated Co in North Atlantic Deep Water. Understanding the current distributions of Co in the Arctic will be important for constraining changes to Co inputs resulting from regional intensification of freshwater fluxes from ice and permafrost melt in response to ongoing climate change.
- Article
(7245 KB) - Full-text XML
- BibTeX
- EndNote


Cobalt (Co) is an essential micronutrient in the ocean. It is utilized by eukaryotic phytoplankton as a substitute for zinc (Zn) in the metalloenzyme carbonic anhydrase (Lane and Morel, 2000; Sunda and Huntsman, 1995; Yee and Morel, 1996), and cyanobacteria have an absolute requirement for Co (Hawco and Saito, 2018; Saito et al., 2002; Sunda and Huntsman, 1995). Co is also the metal center in the micronutrient cobalamin, or vitamin B12. In most ocean basins, dissolved Co (dCo; <0.2 µm) is extremely scarce in surface waters (<10 pmol L−1) and is strongly complexed by a pool of thus far uncharacterized organic Co-binding ligands (Saito et al., 2005; Saito and Moffett, 2001). Due to its low concentrations, strong organic complexation, and presence in cobalamin, dCo has been found to be a limiting or co-limiting nutrient for phytoplankton growth in several regions (Bertrand et al., 2007, 2015; Browning et al., 2017; Hawco et al., 2020; Martin et al., 1989; Moore et al., 2013; Panzeca et al., 2008; Saito et al., 2005). Growth limitation can be due to a lack of dCo, or cobalamin (Bertrand et al., 2012, 2007; Browning et al., 2017), as cobalamin is only synthesized by cyanobacteria and some archaea (Doxey et al., 2015). However, many phytoplankton utilize cobalamin for the synthesis of methionine (Yee and Morel, 1996; Zhang et al., 2009) and therefore must obtain it from the natural environment (Heal et al., 2017).
Co is taken up as a micronutrient by phytoplankton in surface waters and is regenerated from sinking organic matter at depth, but it is also prone to intense scavenging throughout the mesopelagic ocean (Dulaquais et al., 2014b; Hawco et al., 2018; Saito et al., 2017). The strongest removal mechanism for dissolved Co (dCo) is through co-precipitation of dCo with manganese (Mn) by Mn-oxidizing bacteria, due to their similar redox properties and ionic radii (Cowen and Bruland, 1985; Moffett and Ho, 1996; Sunda and Huntsman, 1988). Several sources of Co to the ocean have been identified, including rivers (Tovar-Sánchez et al., 2004; Zhang et al., 1990), coastal sediments (Dulaquais et al., 2014a, 2017; Hawco et al., 2016; Noble et al., 2012, 2017), and to a lesser extent hydrothermal and eolian inputs (Shelley et al., 2012; Thuróczy et al., 2010). The largest reservoirs of dCo thus far have been seen in oxygen-deficient zones, likely due to a combination of low oxygen concentrations at the sediment–water interface and advection from reducing sediments, as well as to enhanced regeneration in low-oxygen waters (Dulaquais et al., 2014b; Hawco et al., 2016; Noble et al., 2012, 2017). These oxygen minimum zone sources of dCo exert an important control on the inventory of dCo, which is likely sensitive to small perturbations in bottom-water oxygen concentrations (Hawco et al., 2018; Tagliabue et al., 2018).
It is important to understand the sources and sinks and internal cycling of dCo due to its key role as a micronutrient. However, Co has one of the most complex biogeochemical cycles of all of the trace metals. Thousands of measurements of both total dCo and weakly complexed and/or inorganic or “labile” Co (LCo) and particulate Co (pCo) now exist from the ocean, greatly improving our understanding of Co cycling, and have facilitated the representation of the biogeochemical model of Co to be included in global ocean models (Tagliabue et al., 2018). Several observational zonal transects have been generated by large-scale programs including the international GEOTRACES program, among others. Large datasets now exist in the North Atlantic (Baars and Croot, 2015; Dulaquais et al., 2014a, b; Noble et al., 2017), South Atlantic (Noble et al., 2012), South Pacific (Hawco et al., 2016), Southern Ocean (Bown et al., 2011; Saito et al., 2010), and Mediterranean Sea (Dulaquais et al., 2017).
Although the global coverage of Co measurements has greatly improved over the last decade, no published measurements to our knowledge have been made in the Arctic Ocean. The Arctic Ocean is arguably the most dynamic of the ocean basins and is changing rapidly due to warmer temperatures affecting the maximal sea ice extent (Screen and Simmonds, 2010; Stroeve et al., 2012), the melting of permafrost (Jorgenson et al., 2006), and additional inputs of meltwater and river water (Johannessen et al., 2004; Serreze and Barry, 2011). The Arctic Ocean is also likely distinct in terms of Co cycling compared to other ocean basins due to its large shelf area, restricted circulation, and potentially distinct Co sources including sea ice, snow, and highly seasonal riverine inputs. The Arctic Ocean is known to have high concentrations of dissolved organic matter (DOM), which could influence the organic complexation of Co in this ocean basin. This study examined dCo, LCo, and pCo in two different transects in the Canadian sector of the Arctic Ocean. We then used a Co biogeochemical model (Tagliabue et al., 2018) in order to evaluate hypotheses about the role of external sources and internal cycling in the observed Co distributions and the potential of the Arctic to be a net source of Co to the North Atlantic and to identify Co sources and sinks that may be sensitive to future changes in this rapidly changing ocean basin.
2.1 Sample collection and handling
2.1.1 Water column samples
Samples were collected on two expeditions in the Canadian section of the Arctic Ocean (Fig. 1). The first set of samples (n=107) were collected on board the CCGS Amundsen from 27 August to 12 September 2009 in the Beaufort Sea as part of the Canadian IPY-GEOTRACES program (ArcticNet 0903; GIPY14). The second set of samples (n=361) were collected on board the USCGC Healy (HLY1502) on the U.S. GEOTRACES Arctic expedition (GN01) from 9 August to 12 October 2015. The Canadian GEOTRACES expedition sampled along the shelf and slope in the Beaufort Sea. The U.S. GEOTRACES expedition sailed in and out of Dutch Harbor, Alaska, and traversed the Bering Shelf and Makarov Basin before reaching the North Pole on 5 September 2015 and returning south across the Canada Basin. Samples from the Canadian GEOTRACES expedition were collected using a trace metal rosette system fitted with 12×12 L GO-FLO bottles (General Oceanics), and only the dCo and LCo samples collected in the water column from this study are discussed here. All other metadata from this expedition can be found at http://www.bodc.ac.uk/geotraces/data/ (last access: 10 August 2020). Samples from the U.S. GEOTRACES expedition were collected using the U.S. GEOTRACES trace metal clean rosette outfitted with twenty-four 12 L GO-FLO bottles and a Vectran conducting hydrowire (Cutter and Bruland, 2012). Two GO-FLO bottles were triggered at each depth during the trace metal hydrocasts. One bottle was used for particulate trace metal sampling, and the other was used for all dissolved metal and macronutrient analyses. Upon recovery of the sampling system, the GO-FLO bottles were immediately brought inside a 20 ft (6.1 m) ISO container van. Sampling for bulk particulate trace metal samples has been described in detail elsewhere (Twining et al., 2015). The filters for particulate analyses were stored in trace metal clean centrifuge tubes and frozen at −20 ∘C until analysis (Twining et al., 2015). Dissolved trace metal and nutrient samples were filtered with a 0.2 µm capsule filter (AcroPak 200, VWR International) under pressurized filtered air (Cutter and Bruland, 2012). Samples for dCo and LCo from the Canadian GEOTRACES expedition were collected similarly but were unfiltered. Samples for dCo were placed in two separate 60 mL Citranox-soaked (1 %) and acid-cleaned low-density polyethylene (LDPE) bottles and were filled until there was no headspace (Noble et al., 2012, 2017). One sample was used for LCo analyses, and the other was used for total dCo analyses. Nutrient samples were analyzed immediately on board by the Oceanographic Data Facility at Scripps Institution of Oceanography.
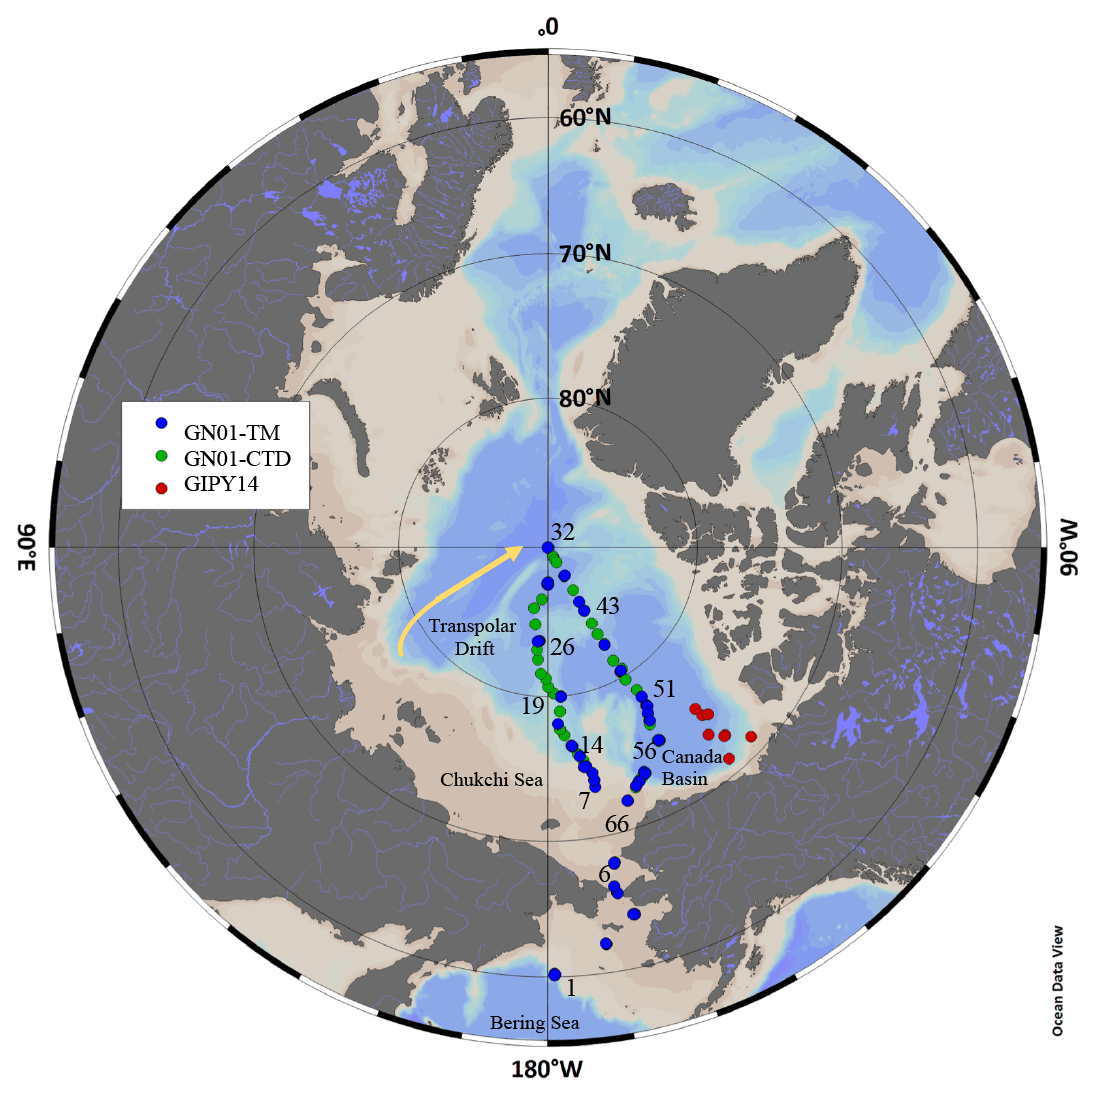
Figure 1Standard CTD sampling stations (green) and trace metal rosette (TM) sampling stations (blue) from the GN01 expedition in 2015, and trace metal sampling locations from the GIPY14 expedition in 2009 (red).
2.1.2 Ice hole samples
Ice hole samples were only analyzed from the U.S. GEOTRACES cruise (GN01). Seawater from ice holes for Co analyses was collected using Teflon-coated Tygon tubing and a rotary pump with plastic wetted parts (IWAKI magnetic drive pump, model WMD-30LFY-115) from a hole at the station's sea ice floe. The hole was made with an ice corer (Kovacs 9 cm diameter Mark II corer) and allowed to sit undisturbed for ∼1 h under a canvas tent prior to sampling. Samples were collected from 1, 5, or 20 m at several sites. Seawater was filtered in-line with a 0.2 µm filter (AcroPak 200 capsule filter) and dispensed into a carboy, where it was homogenized and brought back to the clean lab on board the ship. Subsamples were taken for dCo from this carboy and stored as described below for other water column dissolved samples. Additional details on ice hole samples can be found elsewhere (Marsay et al., 2018).
2.2 Sample storage
Total dCo and LCo samples were stored in two distinct ways. Oxygen concentrations have been found to have a significant effect on storage of dCo samples (Noble et al., 2017). Although the mechanism has not been fully explained, loss of some dCo species has been observed in the presence of oxygen in both acidified and nonacidified samples across regions with active biological gradients (Hawco et al., 2016; Noble et al., 2012, 2017, 2008). Since dCo and LCo analyses were not able to be performed at sea on either expedition, groups of six dCo samples from the US expedition from a single cast were double-bagged and stored in a gas-impermeable plastic bag (Ampac) along with three to four gas-absorbing satchels (Mitsubishi Gas Chemical, model RP-3K). This outer bag was heat-sealed, and samples were kept refrigerated (4 ∘C) and unacidified until analysis (Hawco et al., 2016, 2018; Noble et al., 2017). LCo samples were double-bagged and stored at 4 ∘C and unacidified until analysis. Samples were hand-carried at the termination of the GN01 expedition to Woods Hole Oceanographic Institution, and all samples were analyzed within 3 months. Samples from the Canadian GEOTRACES expedition (GIPY14) were initially collected as unfiltered samples prior to filtration and analysis and were not stored in gas-impermeable bags prior to analysis, as the effects of oxygen on dCo loss were not known at the time of the expedition. It is possible there could have been some loss of dCo during the time between sample collection and analyses (approximately 1 year), and thus these concentrations could be underestimated. Additional discussion on how storage may have impacted these results is discussed in Sect. 4.3.
2.3 Reagent preparation
All reagents were prepared in acid-cleaned plastic bottles and in large batches in order to have consistent reagent batches for all sample analyses. For dCo and LCo analyses, a 0.5 mol L−1 EPPS (N-(2-hydroxyethyl)piperazine-N-(3-propanesulfonic acid)) buffer and a 1.5 M NaNO2 solution were prepared in Milli-Q (18 MΩ) and chelexed (Chelex 100, Bio-Rad) to remove trace metal contaminants. Dimethylglyoxime (DMG) was prepared by first making a 10−3 mol L−1 EDTA solution in Milli-Q and adding 1.2 g of DMG. This solution was warmed by carefully microwaving at 50 % power to prevent boiling, until the DMG was fully dissolved. The solution was placed on ice and left at 4 ∘C to recrystallize overnight. The supernatant was decanted, and the remaining crystals were poured into an acid-cleaned plastic weigh boat, and the remaining liquid was left to evaporate overnight in a Class 100 clean hood. Once dry, the remaining DMG was added to an Optima methanol solution for a final concentration of 0.1 mol L−1 DMG. A 1.5 mol L−1 solution of sodium nitrite was prepared by placing sodium nitrite in Milli-Q and chelexing the solution before use to remove trace metal contaminants. A Co standard solution was prepared weekly by adding 29.5 µL of a 1 mg L−1 Co AA standard (SPEX CertiPrep) to 100 mL of Milli-Q in a volumetric flask. For each new Co standard that was prepared during sample runs, an approximately 1 mL aliquot was saved for later analyses to ensure no variation was seen between batches. More information on reagent preparations can be found at https://www.protocols.io/researchers/randie-bundy/publications (last access: 10 August 2020).
2.4 Dissolved and labile cobalt determinations
The dCo and LCo measurements were determined using a modified cathodic stripping voltammetry method (Saito and Moffett, 2001) for the GIPY14 samples and a fully automated method based on Hawco et al. (2016) for the GN01 samples. Measurements for both sample sets were performed using a Metrohm 663 VA stand connected to an Eco Chemie µAutolabIII system. Peak determinations for samples collected on GIPY14 were completed as described in Noble et al. (2012). Sample automation and data acquisition for samples from GN01 were completed using NOVA 1.8 software (Metrohm Autolab), and peak determination was completed using a custom MATLAB code (see Sect. 2.6).
The dCo samples were UV-irradiated for 1 h in a temperature-controlled UV system prior to analysis to remove any strong organic ligands that may prevent DMG from effectively binding the entire dCo pool. For the GIPY14 samples, a modified temperature-controlled UV system (Metrohm 705 Digester) was used (Hawco et al., 2016), while for GN01 samples an integrated temperature-controlled (18 ∘C) digestor was used (Metrohm 909 Digester). In both cases samples were placed in acid-cleaned and Milli-Q-conditioned 15 mL quartz tubes. After irradiation, 11 mL of each sample was placed into acid-cleaned and sample-rinsed 15 mL polypropylene tubes. For GIPY14 samples a final concentration of 353 µmol L−1 DMG and 3 mmol L−1 EPPS was added to each sample before analysis (Noble et al., 2017), and for GN01 samples a final concentration of 400 µmol L−1 DMG and 7.6 mmol L−1 EPPS was added to each sample before analysis. Samples were then inverted several times before either being analyzed individually or being placed on the autosampler (Metrohm 858 Sample Processor). For autosampler analyses, the system was flushed with Milli-Q, and 2 mL of sample was used to condition the tubing and the Teflon analysis cup. Then 8.5 mL of sample was dosed into the cup automatically by a 800 Dosino burette (Metrohm), along with a 1.5 mL addition of 1.5 M NaNO2 for a final analysis volume of 10 mL. Samples were purged for 180 s with N2 (high purity, >99.99 %) and conditioned at −0.6 V for 90 s. The inorganic Co in the sample that was complexed by DMG () forms a bis complex with Co2+ that absorbs to the hanging mercury drop electrode (Saito and Moffett, 2001). The Co2+ and the DMG are both reduced at the electrode surface using a fast linear sweep (from −0.6 to −1.4 V at 10 V s−1), and the height of the Co(DMG)2 reduction peak that appears at −1.15 V is proportional to the dCo concentration in the sample. The dCo was quantified by triplicate scans of the sample, followed by four standard additions of either 25 or 50 pmol L−1 per addition that were dosed directly into the Teflon analysis cup. The slope of the linear regression of these additions and triplicate “zero” scans were used to calculate the individual sample-specific sensitivity (nA pmol−1 L−1). The average of the three “zero addition” scans was then divided by the sensitivity and then corrected for the volume of the reagent and the blank (see Sect. 2.5). In between sample batches, or before analyzing LCo samples, the entire auto-sampling system was rinsed with 10 % HCl and then Milli-Q.
LCo measurements were made similarly to the dCo measurements, with the following amendments. LCo samples were not UV-irradiated, and 400 µmol L−1 DMG was added to 11 mL of sample and was equilibrated for at least 8 h (overnight) in conditioned 15 mL polypropylene tubes. Immediately prior to placement of the sample on the autosampler, EPPS was added, and the samples were analyzed as described above for dCo analyses. LCo measurements are thus operationally defined as the fraction of dCo that is labile to 400 µmol L−1 DMG over the equilibration period (Hawco et al., 2016; Noble et al., 2012).
2.5 Blanks and standards
The blank for GN01 samples was prepared by UV-irradiating low-dCo seawater for 1 h. After UV-irradiation, the seawater was passed slowly through a Chelex 100 column to remove any metals. The clean seawater was then UV-irradiated a second time before being analyzed. The blank used for GIPY14 samples was analyzed at the beginning and the end of the sample analyses to ensure the blank was consistent between runs. GEOTRACES consensus reference materials were also analyzed along with GIPY14 samples, the results of which are reported elsewhere (Noble et al., 2017).
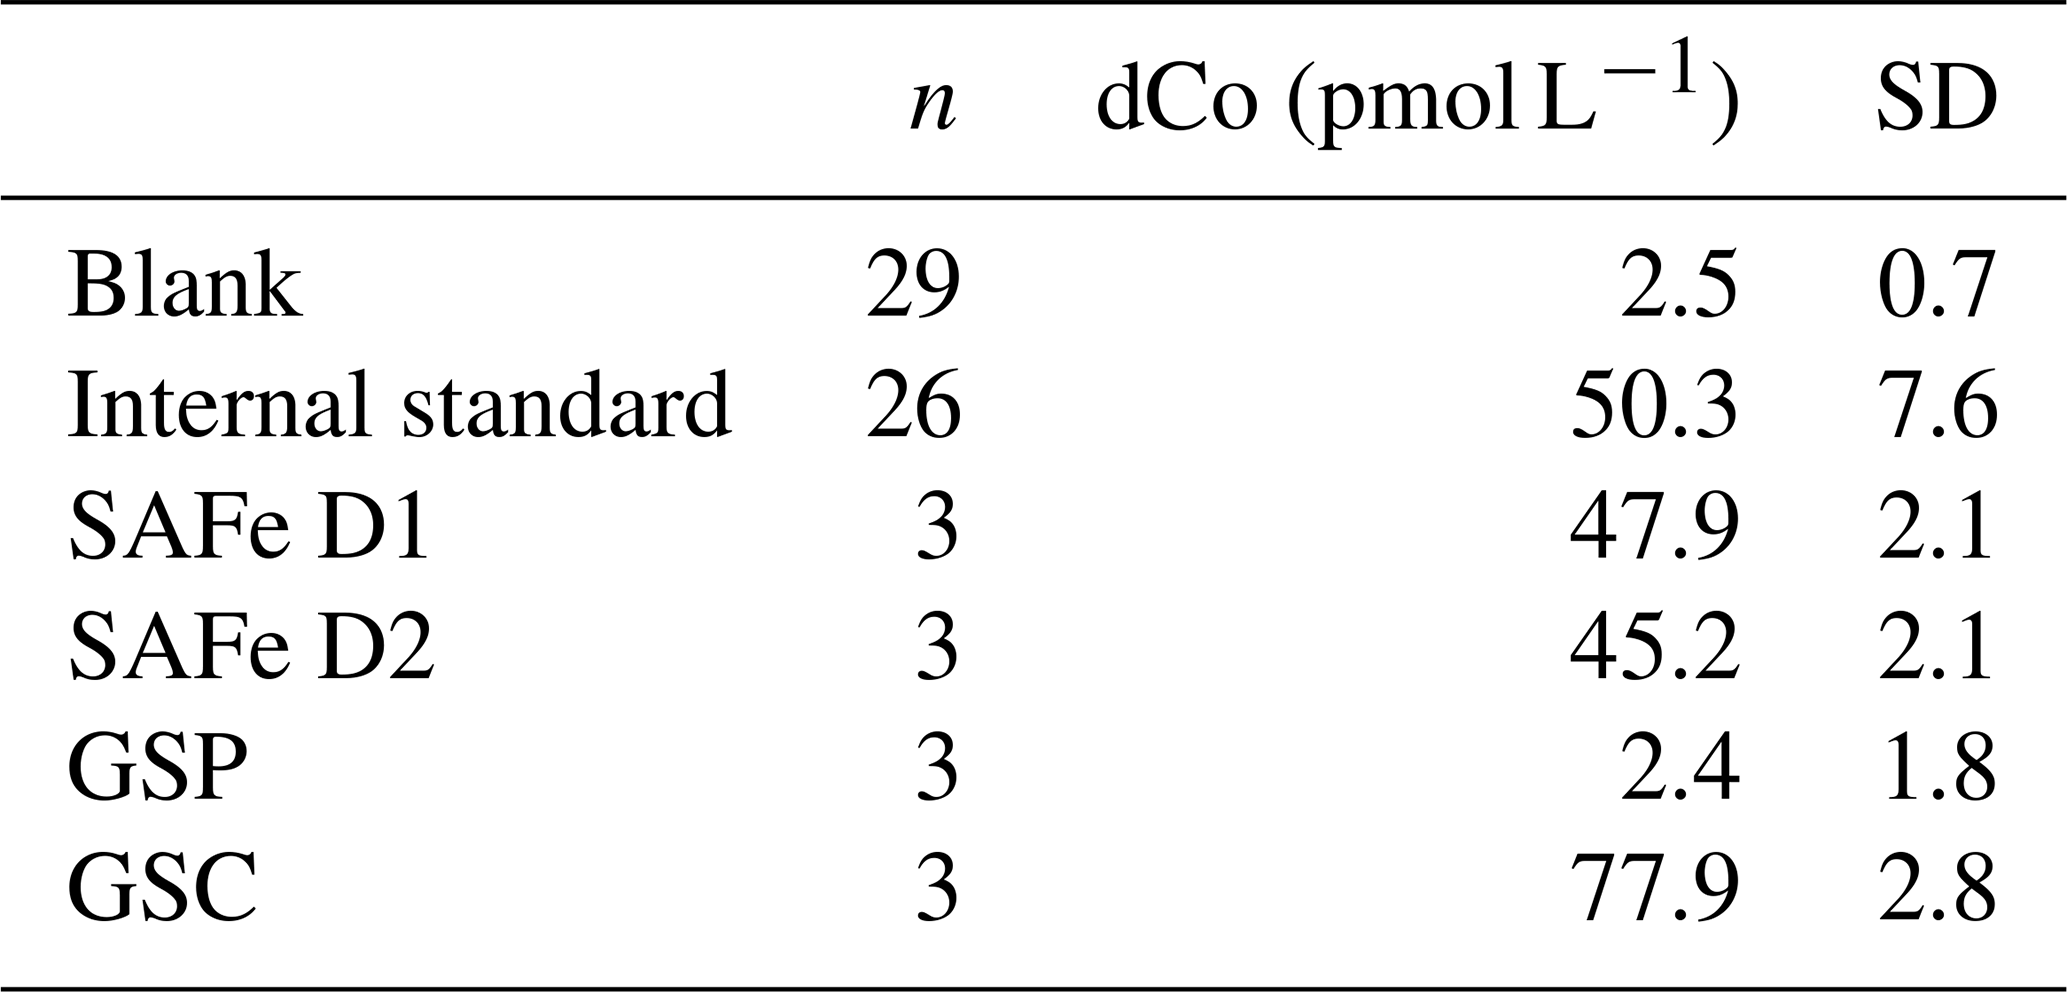
For the GN01 samples, enough seawater was prepared in order to use the same blank seawater for all of the subsequent sample analyses, and the blank was analyzed regularly with each batch of samples (every 10–20 samples). A combination of consensus reference materials and an in-house seawater consistency standard were used throughout the sample analyses (Table 1). SAFe and GEOTRACES standards were analyzed to ensure the accuracy of the sample measurements and were slowly neutralized dropwise with 1 N ammonium hydroxide (Optima, Fisher Scientific) until reaching a pH of approximately 8. Aliquots of the SAFe and GEOTRACES samples were then placed in conditioned quartz tubes and UV-irradiated for 1 h, before being analyzed as described above for dCo measurements. The consistency standard was prepared by UV-irradiating 2 L of Southern Ocean trace metal clean seawater as described above and was analyzed with each batch of samples to ensure consistency between sample runs.
Table 1Average dCo concentrations from blank, internal standard, and consensus standard runs.
2.6 Dissolved and labile cobalt data processing
Peak heights for the dCo and LCo samples for the GIPY14 dataset were determined with NOVA 1.8 software (Noble et al., 2017). All dCo and LCo peaks from the GN01 dataset were calculated using custom MATLAB code available on GitHub (https://github.com/rmbundy/voltammetry, last access: 15 July 2020). Text files of the data output from the NOVA 1.8 software were saved automatically from each scan and processed in MATLAB to determine the dCo and LCo peak heights. The signal was smoothed using the Savitzky–Golay smoothing function (span 5, degree 3), and the first derivative of the voltammetric signal between −1.4 and −1.1 V was calculated in order to find the start and end of the Co(DMG)2 peak. The baseline was drawn and linearly interpolated between the start and the end of the peak. The final peak height was determined by finding the maximum of the signal and subtracting it from the baseline. Peak heights from the “zero addition” scans were plotted along with the standard additions, and a linear regression was computed from all seven scans. Data were flagged if the r2 of the slope was <0.97, and samples were reanalyzed.
2.7 Dissolved and particulate manganese measurements
The 0.2 µm filtered seawater samples for dissolved manganese (dMn) were acidified to pH 2 using sub-boiling distilled HCl. The filtered subsamples were drawn into acid prewashed 125 mL polymethylpentene bottles after three sample rinses, and the sample bottles were stored in polyethylene bags in the dark at room temperature before analyses, which was usually within 24 h of collection. Prior to analysis, samples for manganese (dMn) were acidified by adding 125 µL of sub-boiling distilled 6 N HCl. Since the samples were used to determine dissolved iron (dFe) as well, the obtained samples were then microwaved in groups of four for 3 min in a 900 W microwave oven to achieve a temperature of 60±10 ∘C in an effort to release dFe from complexation in the samples. Samples were allowed to cool for at least 1 h prior to flow injection analysis. The dMn measurements were determined in the filtered, acidified, microwave-treated subsamples using a shipboard flow injection analysis (FIA) method (Resing and Mottl, 1992). Samples were analyzed in groups of eight, and the samples collected at each station were generally analyzed together during the same day. A 3 min preconcentration of sample (∼9 mL) onto an 8-hydroxyquinoline (8-HQ) resin column yielded a detection limit of 0.55 nmol L−1 and a precision of 1.16 % at 2.7 nmol L−1.
Particulate trace element concentrations were determined through a total digestion procedure as described in Ohnemus et al. (2014) and Twining et al. (2015). Briefly, approximately 7 L of contamination-free seawater was filtered directly from Teflon-coated GO-FLO sampling bottles over acid-washed 47 mm (shelf stations) or 25 mm (open basin stations) PES Supor filters. Filters were divided in half, and one-half was digested for 3 h at 100–120 ∘C in sealed Teflon vials containing 4 M HCl, 4 M HNO3, and 4 M HF (Fisher Optima), which digests the marine suspended particulate matter (SPM) but leaves the PES filter mostly intact. The PES filters were rinsed with ultrahigh-purity water (18.2 MΩ cm−1) and removed from the digestion vials, and 60 µL of sulfuric acid (Optima) and 20 µL of hydrogen peroxide (Fisher Optima) were added to the vials to digest any filter fragments. The digest solution was taken to dryness at ∼210 ∘C (8–24 h). The digest residue was redissolved in 4 mL of 0.32 M HNO3 before measuring the total particulate Co, Mn, and phosphorous (pCo, pMn, pP) concentrations by inductively coupled plasma mass spectrometry (ICP-MS; Thermo Element 2, National High Magnetic Field Laboratory, Tallahassee, Florida). Major and trace element concentrations were calibrated using an external multielement standard curve and corrected for instrument drift using a 10 ppb indium internal standard (Twining et al., 2019).
2.8 Biogeochemical modeling of Co in the Arctic
Modeling runs in the Arctic Ocean were completed using a previously published biogeochemical model for Co (Tagliabue et al., 2018). Briefly, the Co model is part of the PISCES-v2 model and has an additional six tracers for Co, including dCo, scavenged Co (associated with Mn oxides), Co within diatoms, Co in nanoplankton, small particulate organic Co, and large particulate organic Co (Tagliabue et al., 2018). Phytoplankton uptake of Co in the model allows for variable Co∕C ratios and is based on a maximum cellular quota. The PISCES model is an excellent platform for these studies as it has a detailed representation of ocean biogeochemical cycling and has been used for a range of different studies. Measured pCo is equal to the sum of all of the particulate Co tracers in the model (including living and nonliving pools). Excretion of Co is also simulated in a similar manner to Fe in PISCES-v2, with a fixed Co∕C ratio in both micro- and mesozooplankton that sets the excretion of dCo as a function of the Co content of their food (Tagliabue et al., 2018). The background biogeochemical model presented in Tagliabue et al. (2018) was modified slightly for this work, most notably with an improved particle flux scheme (Aumont et al., 2017), with the Co-specific parameterizations left unchanged. We used the model to assess the role of different processes by conducting sensitivity tests whereby the sedimentary Co source was eliminated, the riverine Co source was eliminated, the slowdown of Co scavenging at lower oxygen levels was removed (meaning oxygen did not affect Co scavenging), and the change in Co scavenging due to variations in bacterial biomass was instead set to a constant value. By comparing the results of these four sensitivity experiments to the control model, we were able to quantify the relative contributions of different external sources and internal cycling processes.
3.1 Oceanographic context
The Arctic Ocean is a unique ocean basin. The surface circulation in the Arctic is characterized by a clockwise current that entrains shelf water from the Chukchi and Eurasian shelves, before being swept across the North Pole by the Transpolar Drift (TPD; Fig. 1). This current is distinguished by its low salinity and elevated concentrations of dissolved organic carbon (DOC; Klunder et al., 2012; Wheeler et al., 1997). The Arctic Ocean is a highly stratified system, with little mixing between the main water masses (Steele et al., 2004). The major water masses that enter the Arctic through the Bering Strait are the upper modified Pacific water (mPW) and the Pacific halocline water (PHW). The mPW includes inputs from the Bering Shelf, as well as freshwater inputs from rivers, sea ice melt, and glacially modified waters. PHW includes some influences from Bering Sea water (BSW; including both summer and winter water; Steele et al., 2004). Atlantic water (AW) comprises the bulk of the intermediate and deep waters of the Arctic basin. These major water masses (mPW, PHW, AW) can be distinguished from the high-resolution nutrient, oxygen, and salinity data from the conventional CTD rosette stations in the sampling region (Fig. 2). The mPW is characteristic of low salinity () and nutrients (Fig. 2) and contains contributions from Alaska Coastal Water (Steele et al., 2004), as well as from other modified water masses from the shelf. The PHW can be clearly identified from the elevated macronutrient concentrations (Fig. 2d) and temperature maximum within the salinity range of 31–33 (Steele et al., 2004; Steele and Boyd, 1998; Fig. 2a, c). The AW comprises a relatively uniform deep layer throughout the entire Arctic basin. AW enters the Arctic through the Fram Strait and Barents Sea and cycles in a cyclonic direction around the Eurasian Basin and Canada Basin (Aagaard and Carmack, 1989; Carmack et al., 1995) and is characterized by higher salinities (>33), its temperature ( ∘C), and lower nutrient concentrations (silicate < 5 µmol L−1).

Figure 2In situ temperature (a), nitrate (b), salinity (c), phosphate (d), oxygen (e), and silicate (f) with neutral density anomaly contours from the northern and southern legs of the GN01 transect as shown in Fig. 1. Major water masses are labeled as modified Pacific water (mPW), Pacific halocline water (PHW), and Atlantic water (AW).
3.2 Dissolved cobalt distributions
3.2.1 Elevated dissolved cobalt in surface waters
Blank and consensus values for the GIPY14 dataset are reported elsewhere (Noble et al., 2017), and the dCo blanks and standards for the GN01 analyses are reported in Table 1. The dCo profiles in the Arctic resembled a “scavenged-like” profile throughout the majority of the transect and were distinct from recent U.S. GEOTRACES efforts in the North Atlantic (Noble et al., 2017) and eastern tropical South Pacific (Hawco et al., 2016; Fig. 3). When median dCo concentrations from this study are binned by depth, the upper 50 m in the Arctic contains a median dCo concentration approximately 10 times higher than that of surface waters in the North Atlantic or South Pacific (Dulaquais et al., 2014a; Hawco et al., 2016; Noble et al., 2017, 2012). Profiles in the Arctic also show no perceptible mid-depth maximum analogous to either the Atlantic or the Pacific (Fig. 3), and instead dCo concentrations rapidly decline until reaching values of approximately 50–60 pmol L−1. These concentrations in deep waters are slightly lower than those of the deep Atlantic and closer to background Pacific levels (∼ 30–40 pmol L−1).

Figure 3Median dCo concentrations at specific depth intervals from the Arctic Ocean (this study; red circles), Atlantic Ocean (blue triangles), and the Pacific Ocean (orange squares). Shaded regions indicate the upper and lower quartiles of the data in each dataset.
The dCo concentrations were highly elevated in surface waters (<100 m) in the shelf regions (Fig. 4a–c, p–r), and these high concentrations persisted into the basin in the vicinity of the North Pole (Fig. 4f–h). In the Bering Sea, dCo in surface waters ranged from 131 to 156 pmol L−1 in the upper 40 m, with an apparent surface or subsurface minimum associated with biological drawdown (Fig. 4a). Concentrations notably increased in stations near the Bering Strait (stations 2–6; Fig. 4b), where dCo reached up to 457 pmol L−1 in surface waters (Figs. 4b, 5), and was even higher in bottom waters, sometimes exceeding 1.5 nmol L−1 (Figs. 4b, 5). Surface enrichment of dCo was even more pronounced on the Chukchi Shelf, where concentrations consistently exceeded 800 pmol L−1 (Figs. 4q, 5). The dCo and LCo concentrations from the Canadian GEOTRACES expedition in 2009 also had near-surface maxima in dCo and LCo, with up to 300 pmol L−1 dCo (Fig. 4r). These concentrations were lower than those of nearby samples collected in 2015 (Fig. 4p, q), which contained up to 3 times more dCo in the upper 100 m.

Figure 4Dissolved cobalt (dCo; black circles) and labile cobalt (LCo; open circles) from all stations from the 2015 (a–q) and 2009 (r) studies.
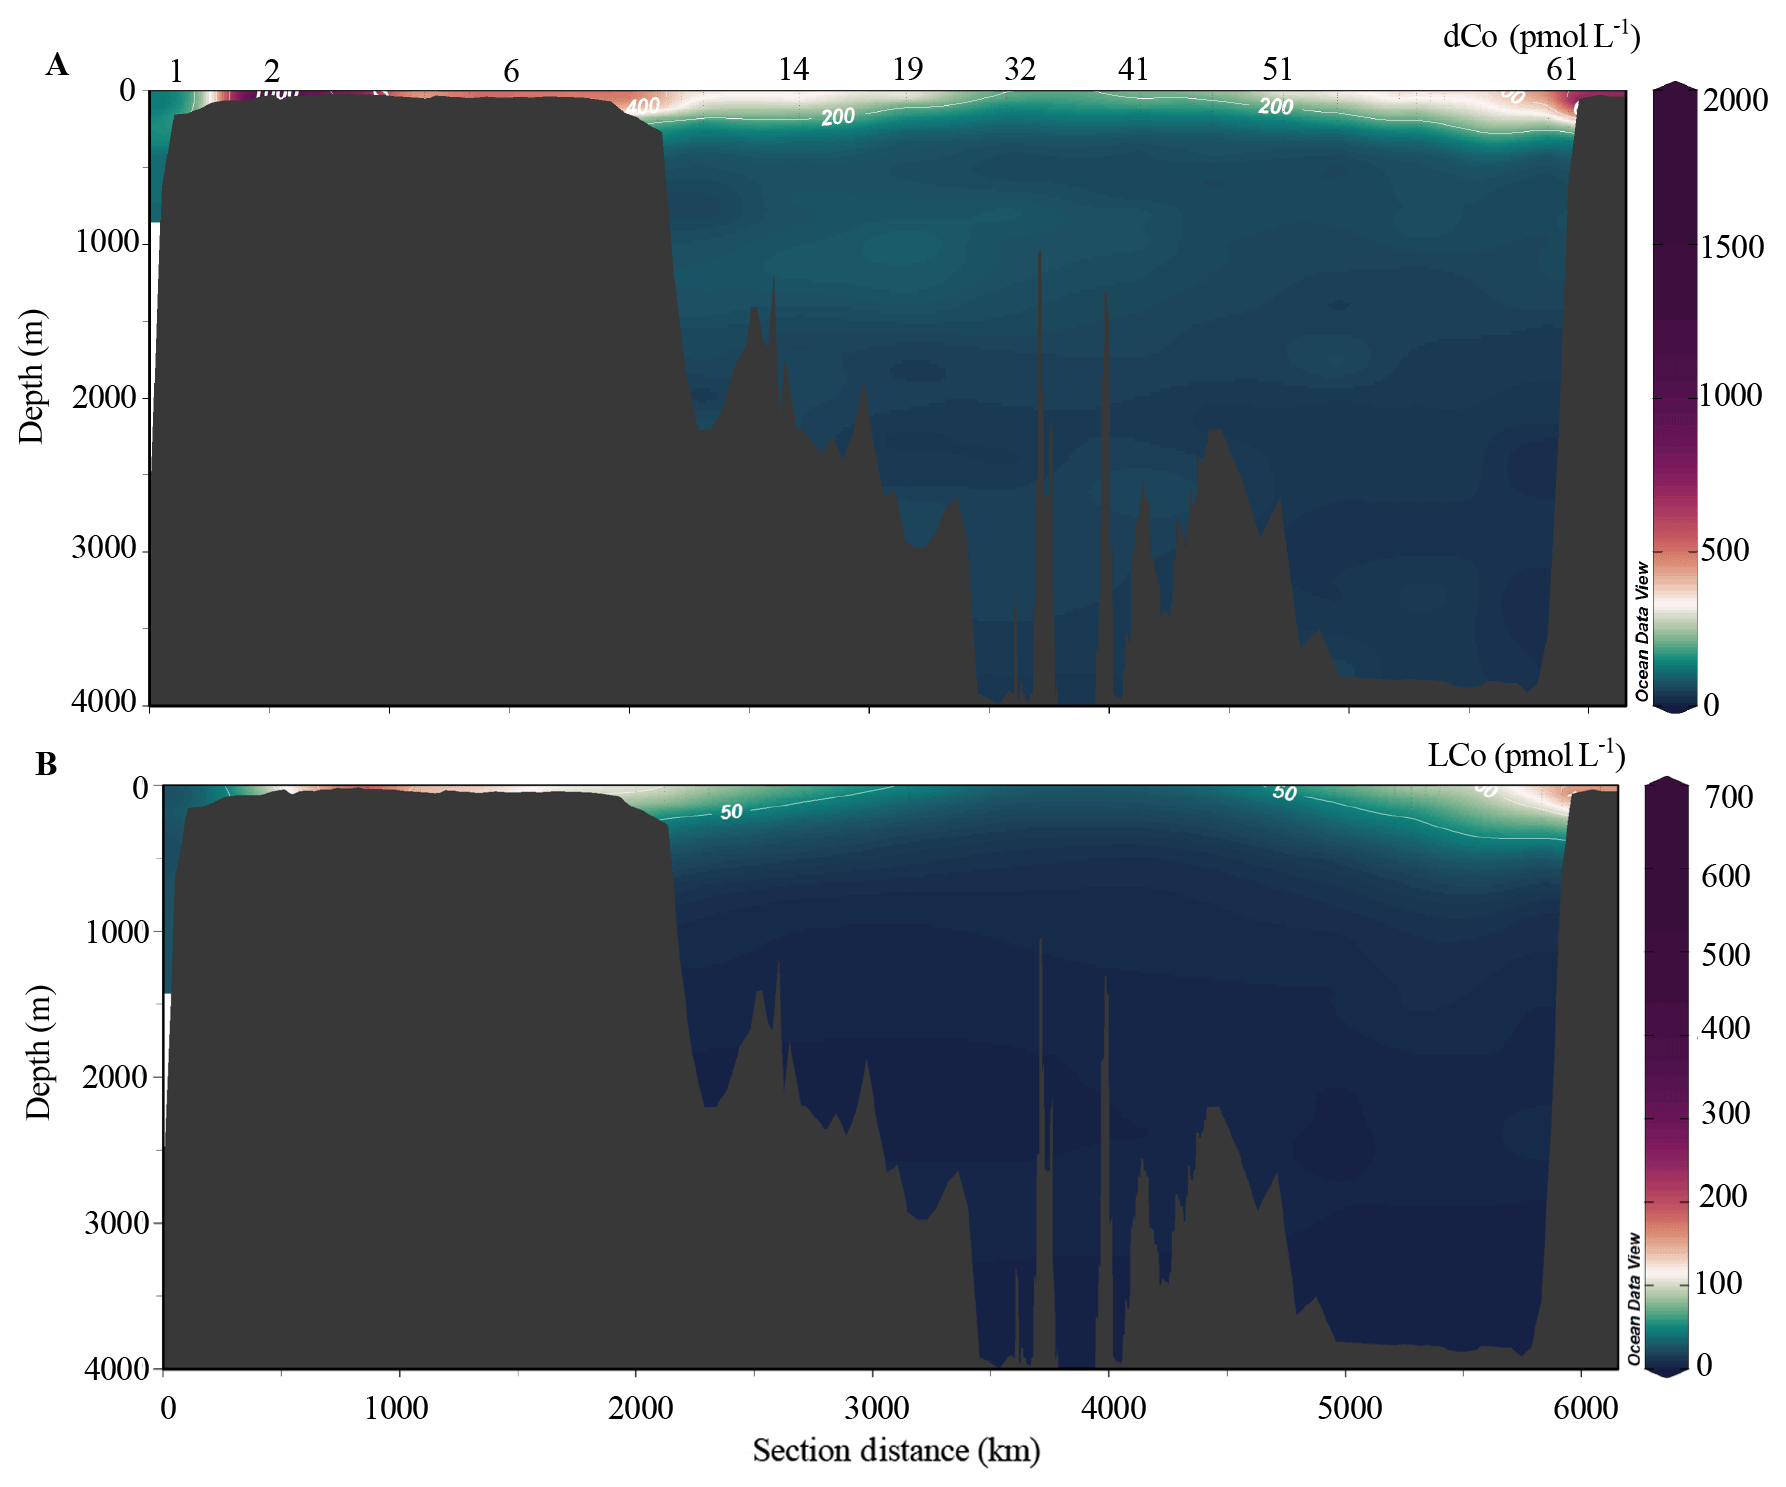
Figure 5(a) dCo concentrations and (b) LCo concentrations in the Arctic Ocean.
The elevated dCo concentrations on both shelves traversed by the US expedition persisted throughout the marginal ice zone (MIZ; stations 12–17, 51–54) and into the Canada Basin (stations 12–26), following similar patterns in dFe and dMn (Laramie Jensen and Mariko Hatta, personal communication, 2020). Water mass fractions and sea ice melt in the MIZ in this study were determined based on δ18O data (Newton et al., 2013). Some high concentrations of dCo were observed in the region of the MIZ and in samples with pronounced influence from meltwater (>1.5 % sea ice melt; Table 2) in the upper 30 m, with median dCo concentrations equal to 358 pmol L−1 in the MIZ, though with large variability (range 26–546 pmol L−1) likely due to surface drawdown and additional dCo sources. Surface concentrations in this region ranged from approximately 100 to 500 pmol L−1 (Fig. 4d–f, m–n). The dCo in surface waters decreased slightly in the Makarov Basin and reached some of the lowest observed concentrations at the North Pole (210 pmol L−1; Figs. 4h, 5), though concentrations were still slightly higher than at station 1, the only Pacific station (Fig. 4a). Although some elements such as dFe showed noticeable elevated concentrations in the vicinity of the North Pole in surface waters compared to surrounding waters (Laramie Jensen, personal communication, 2020), dCo remained lower than on the shelf and in the MIZ (Fig. 5). Surface dCo at the North Pole was approximately 250 pmol L−1, nearly half the concentrations observed in the Canada Basin (Fig. 4h).
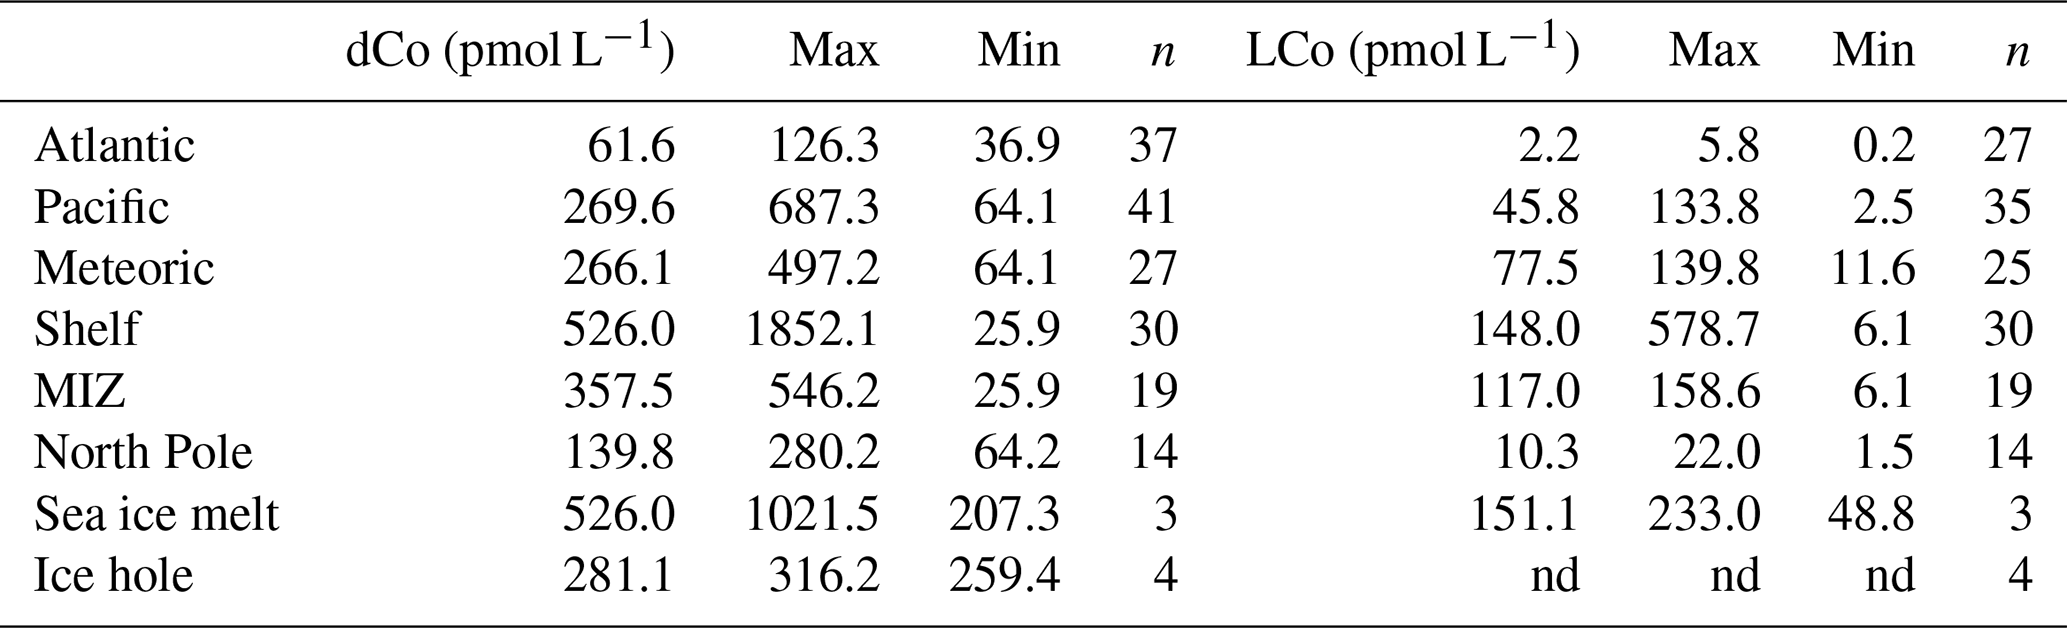
Table 2Median, maximum, and minimum concentrations of total dissolved cobalt (dCo) and labile cobalt (LCo) in samples with representative water masses and sources in the Arctic Ocean. Median concentrations were determined in each water mass type by using water masses that contained >95 % Atlantic water, >95 % Pacific water, >10 % meteoric water, and >1.5 % sea ice melt. Shelf stations were stations 2–10 and 60–66; MIZ stations were 10–17 and 51–57 (<30 m); and North Pole stations were 27–36 (<200 m). Ice hole samples were sampled from 1 and 5 m. The notation “nd” means not determined.
3.2.2 Dissolved cobalt in Pacific halocline and deep waters
While silicate (SiO3) and phosphate () concentrations were indicative of the advection of PHW (Fig. 2e, f), dCo did not show a prominent enhancement within this feature (Fig. 5a), likely due to the lower relative concentrations of dCo in Pacific waters compared to shelf waters (station 1; Fig. 4a). Median concentrations of dCo in waters dominated by Pacific water (>95 %) were 270 pmol L−1 (range 64–687 pmol L−1), while on the shelf they were 526 pmol L−1 (Table 2). Any elevated dCo concentrations observed within the PHW density layer (σθ = 26.2–27.2; Steele et al., 2004) were likely added along the flow path of Pacific water across the Bering Shelf (Fig. 4b). Thus, stronger relationships were observed with other elements which are also elevated on the shelf (e.g., dFe and dMn; Mariko Hatta, personal communication, 2020) than with SiO3 or other macronutrients (e.g., ).
The dCo was remarkably constant within the deep Arctic, reflective of both AW and deep Arctic bottom water (Fig. 5a; Swift et al., 1983). Concentrations in AW (>95 % AW and all depths >500 m) had a median value of 62 pmol L−1 (Table 2), in between the average deep-water dCo concentrations found in the Pacific and Atlantic (Fig. 3). The near-bottom sample from some profiles also showed slightly lower dCo (<5 pmol L−1) than the sample immediately above it (Fig. 4c, d, f), perhaps indicating some influence of the weak nepheloid layers on bottom-water scavenging of dCo in the Arctic (Noble et al., 2017).
3.3 Labile cobalt distributions
3.3.1 Labile cobalt in surface waters
LCo is the fraction of total dCo that is either not organically complexed or weakly bound by organic ligands and represents the labile fraction of the total dCo pool in terms of either biological uptake or scavenging (Saito et al., 2004; Saito and Moffett, 2001). LCo distributions looked remarkably similar to dCo distributions in the upper water column (Figs. 4, 5). Concentrations were lower than those of dCo, ranging from 0 (not detectable) to 600 pmol L−1 on the Canadian side of the Chukchi Shelf (station 61, 66). LCo comprised 20 %–35 % of the total dCo pool in the upper water column (Fig. 6), with the highest percentage of LCo found over the Chukchi Shelf and approximately 20 % LCo in Pacific waters (station 1; Fig. 6). LCo decreased more rapidly with respect to distance from the shelf than dCo in the Canada Basin and towards the North Pole, with the North Pole region containing significantly lower median concentrations of LCo (10 pmol L−1, p<0.05) than surrounding waters (148 and 117 pmol L−1 on the shelf and in the MIZ, respectively; Table 2). The majority of the LCo appeared to be removed via either scavenging or biological uptake in the upper water column in the Canada Basin and along the Lomonosov Ridge. Some of the highest median LCo concentrations were observed in the upper 30 m in the MIZ and in waters containing significant sea ice melt (>1.5 %, Table 2), with median concentrations rivaling those on the shelf (Table 2). The LCo in these samples had a large range in many cases (49 to 233 pmol L−1 in samples with >1.5 % sea ice melt), suggesting that sea ice may be a source of LCo and that it is taken up quickly in surface waters after input from meltwater.
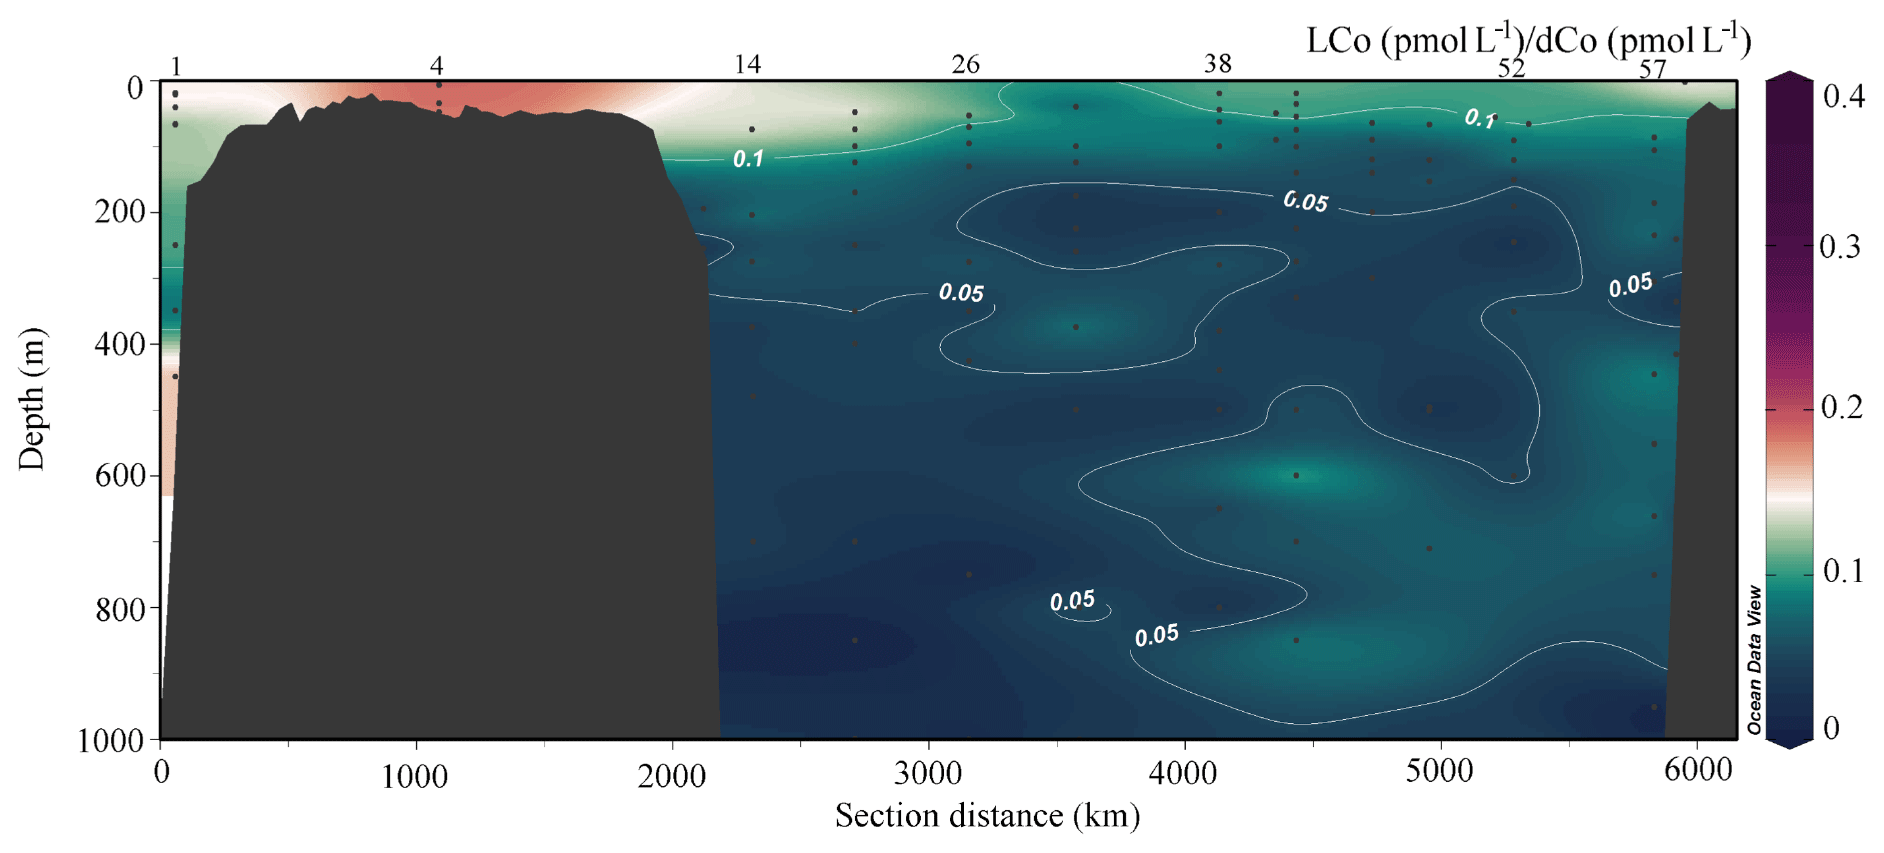
Figure 6The ratio of LCo (pmol L−1) to total dCo (pmol L−1) along the transect from south to north in the upper 1000 m.
3.3.2 Labile cobalt in Pacific halocline waters and deep waters
LCo was extremely low, and often undetectable, in the deep waters of the Arctic (Fig. 4). Any detectable LCo at these depths represented less than 10 % of total dCo (Fig. 6), and the majority of the dCo in the deep Arctic was strongly organically complexed. Similar to dCo, there was no observable enhancement of LCo in PHW, with LCo distributions closely following those of dCo and other shelf-enhanced trace metals such as dFe and dMn (Laramie Jensen, personal communication, 2020; Jensen et al., 2019; Tonnard et al., 2020). LCo decreased below the upper 250 m, and the median concentration of LCo in the Atlantic layer was 2 pmol L−1 (Table 2), virtually equal to the detection limit of the method, suggesting scavenging or uptake of LCo in the upper water column and little to no detectable LCo in deep waters of the Arctic.
3.4 Dissolved and particulate manganese and particulate cobalt distributions
DCo and dMn had very similar distributions across the transect. The pCo and pMn concentrations were slightly decoupled from the dissolved concentrations, with a subsurface peak in both (Fig. 7), as opposed to the surface peak observed in dCo and dMn. The maximum in pCo and pMn occurred at depths of approximately 200–300 m, corresponding to a region of significantly elevated concentrations of particulate Mn oxides (Phoebe Lam, personal communication, 2020). Overall, pCo and pMn concentrations were the highest on the shelf, with visible increases at the base of the profiles near the sediment–water interface (Fig. 7b, c). Concentrations of pCo and pMn declined by almost an order of magnitude from the shelves into the Arctic basin, with concentrations ranging from 20 to 40 pmol L−1 and 1 to 10 nmol L−1 for pCo and pMn, respectively. Deep-water (>1000 m) particulate concentrations for both metals were extremely consistent, with concentrations varying slightly over the entire Arctic basin (Fig. 7d, h). These deep-water pMn and pCo concentrations are notably higher than in other regions, such as deep Pacific waters (Lee et al., 2018).
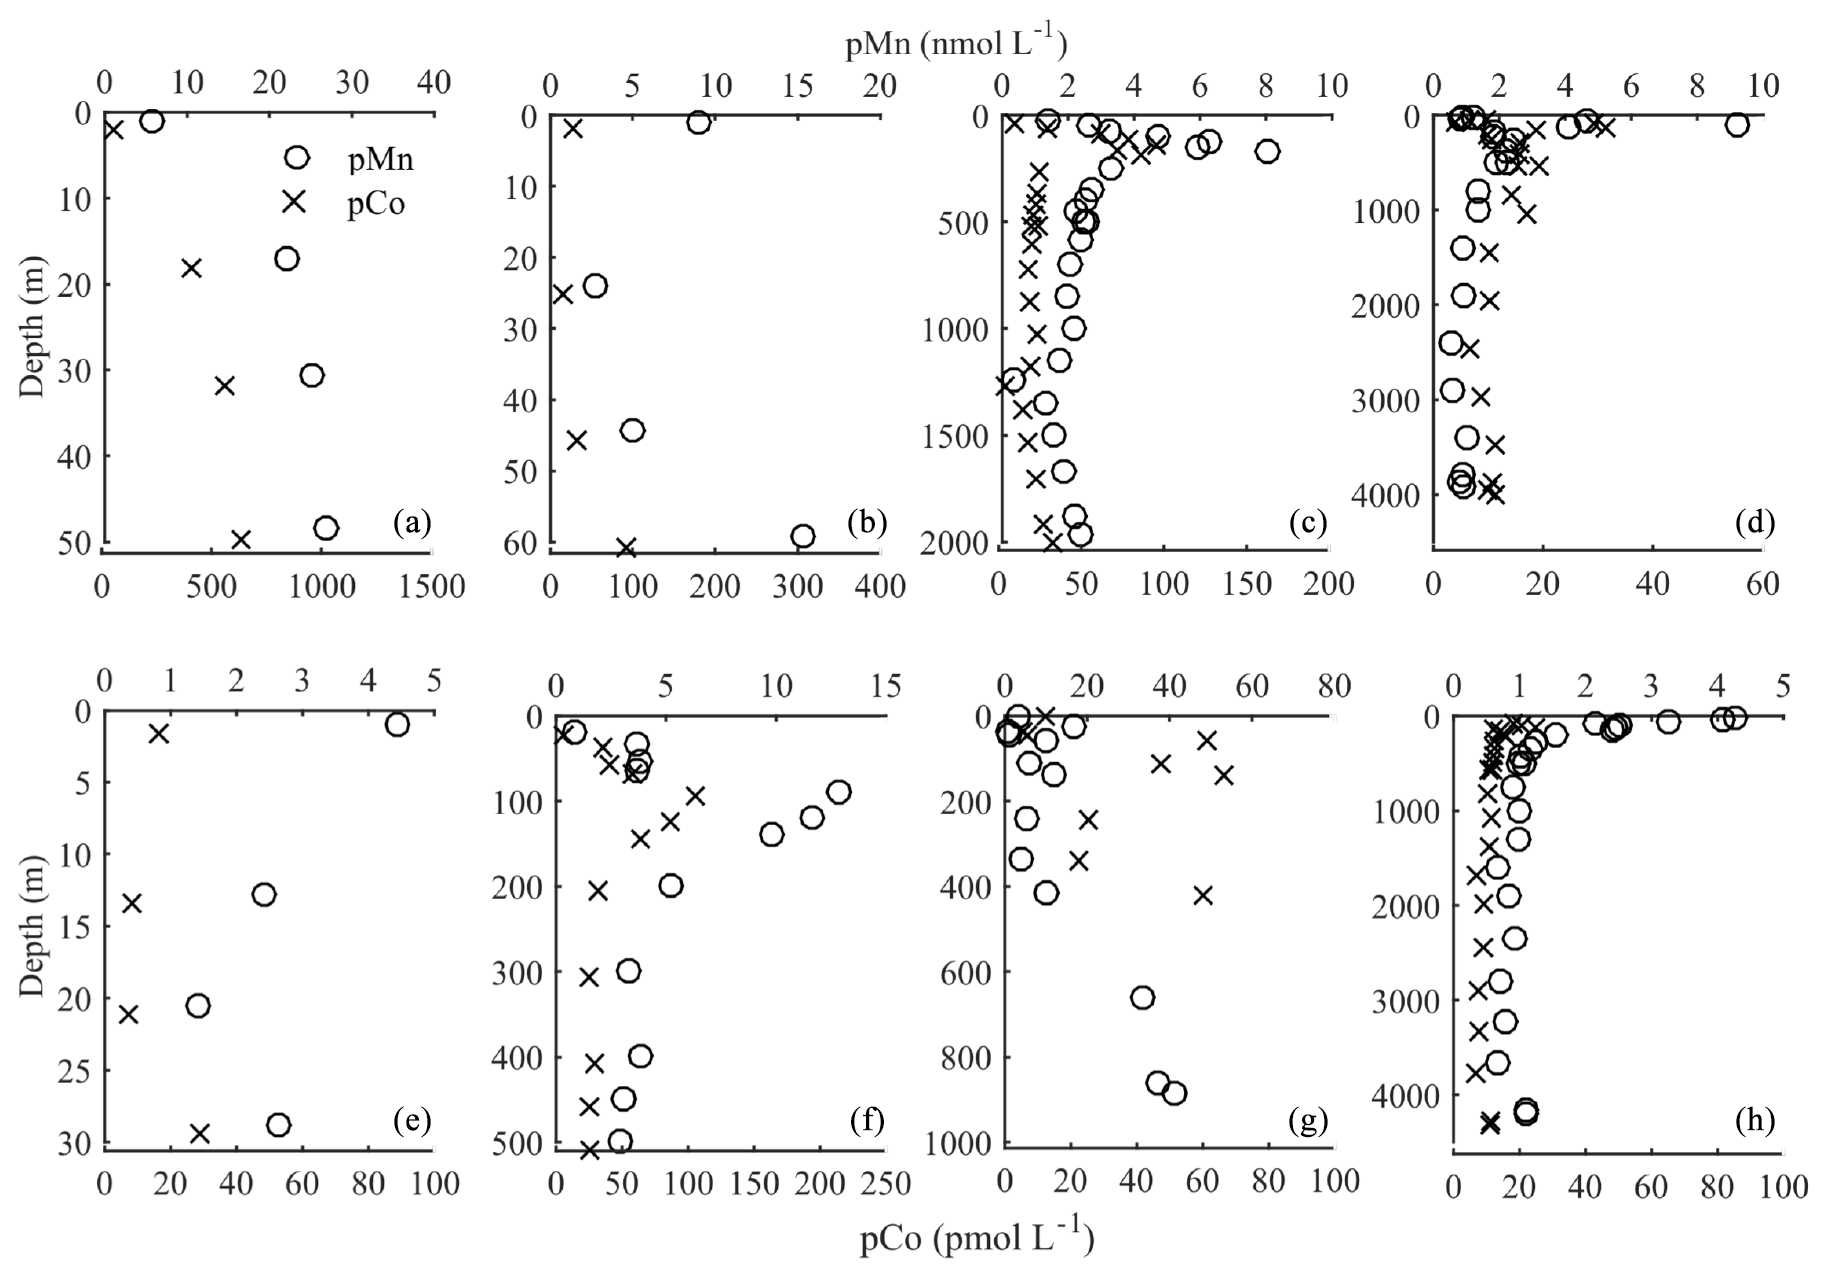
Figure 7Particulate manganese (pMn; open circles) and particulate cobalt (pCo; ×) from several stations along the northern (a–d) and southern (e–h) legs of the transect, with the same station designations as in Fig. 4.
3.5 Modeling sensitivity experiments
The control model run agreed well with the data over a number of different depth strata (Fig. 8). In the surface layer (0–50 m), the model output was most consistent with the observations (Fig. 8a), although in general, the model tends to produce maximum levels of dCo that underestimate the highest dCo concentrations observed. Part of this is likely due to the fact that the model is comparing an annual mean output against the synoptic scale of the in situ observations. However, the model may underestimate sources of dCo in the Arctic. Below 50 m, there is also good agreement with observations (Fig. 8b), with the model capturing the much lower dCo characteristic of these waters and in particular the contrast between our data in the Arctic and other data from the North Atlantic (Dulaquais et al., 2014a). In the deepest layers (Fig. 8c and d), the model again is able to reproduce the decline in dCo to ∼60 pmol L−1 and the consistency between the deep Arctic and North Atlantic.
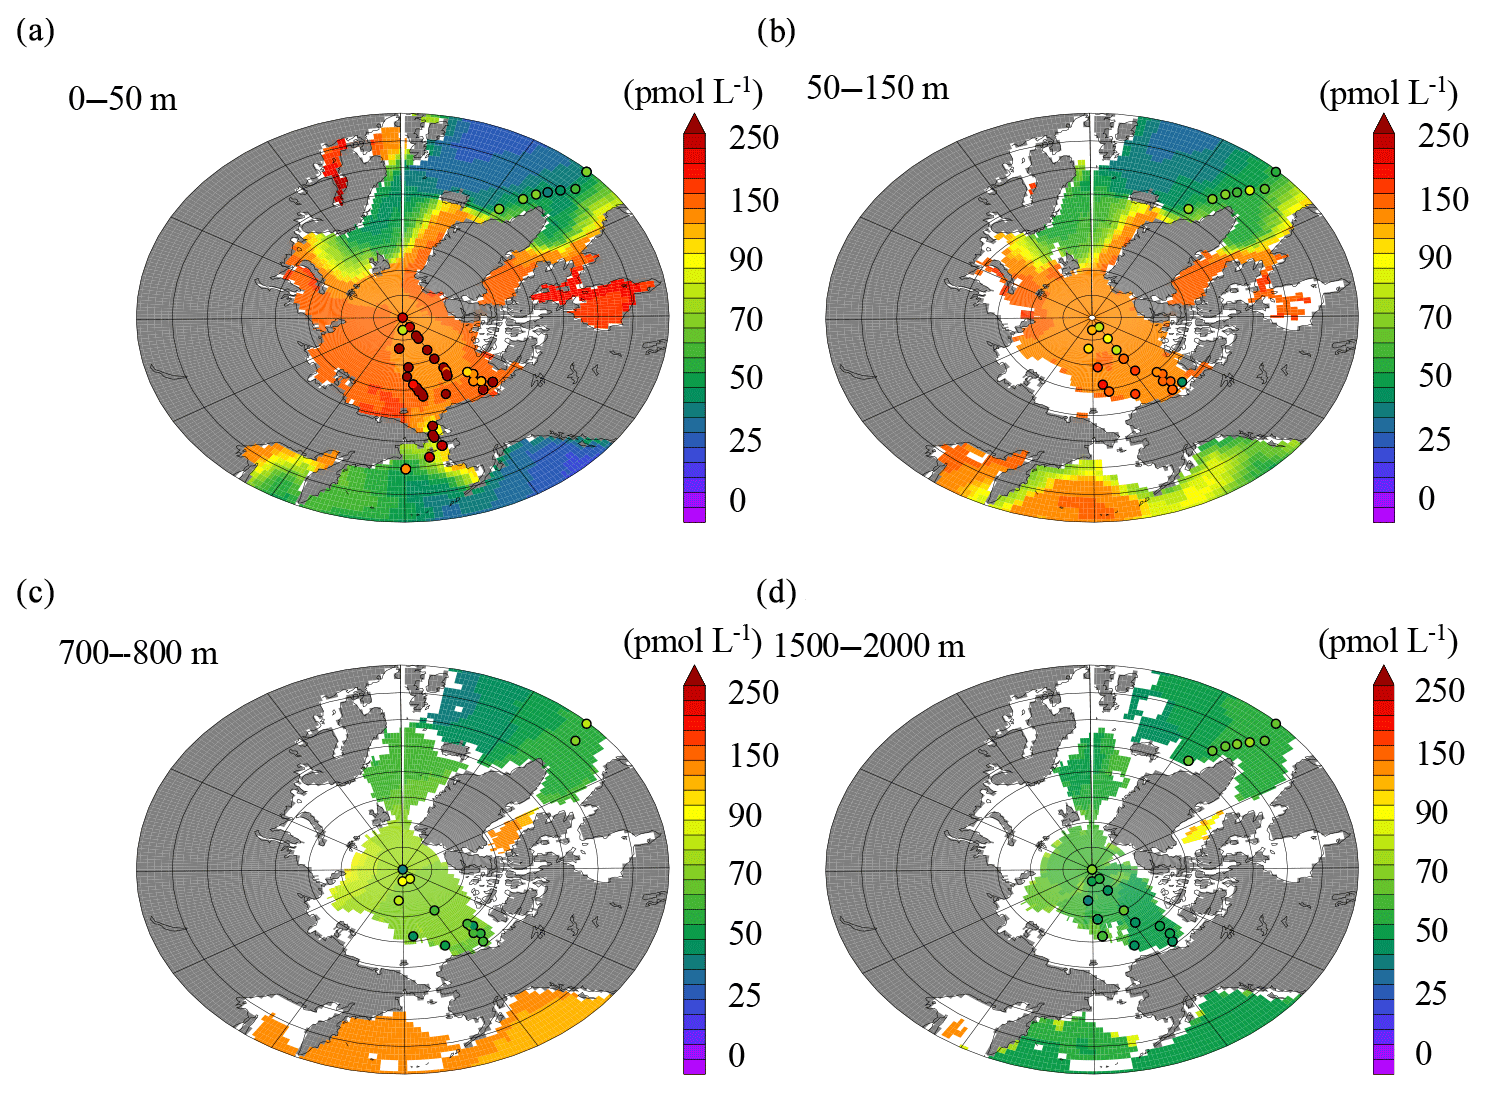
Figure 8Model output (colors) compared to observations (dots) from 0 to 50 m (a), 50 to 150 m (b), 700 to 800 m (c), and 1500 to 2000 m (d).
In order to explore the major processes contributing to the modeled dCo sources and sinks, the proportion of the dCo signal in two distinct depth horizons was further investigated using a set of sensitivity experiments. In the 0–50 m depth range (Fig. 9), rivers in the model were shown to have no large-scale impact on the Arctic-wide dCo signal (Fig. 9a), while removing sediment margin sources reduced dCo by over 80 % (Fig. 9b). Enhanced sediment Co supply under low oxygen also had no impact in this region. Similarly, modulating the effect of oxygen on Co scavenging had little impact in the Arctic (Fig. 9c). It was notable that in sensitivity experiments where bacteria scavenging due to Mn-oxide formation was kept constant (e.g., by eliminating the effect of bacterial biomass on scavenging), the dCo concentrations were reduced by over 60 % in surface waters in some regions, indicating that lower rates of scavenging were also contributing to the high concentrations of dCo in the surface ocean (Fig. 9d). Thus, our model experiments suggest that the high levels of dCo in the Arctic surface waters are due to high supply from sediments, combined with reduced scavenging rates due to lower metabolic activity of Mn-oxidizing bacteria due to the colder temperatures. In the 700–800 m depth horizon, we similarly found that changing sediment supply was more important than rivers (Fig. 10a and b) but that the effect of sediments was reduced at these depths compared to the surface. Equally, retardation of Co scavenging under low oxygen had a minor role in the ocean interior (Fig. 10c), with bacterial biomass again having a significant effect on the dCo signal (Fig. 10d). Thus, in contrast with the surface, we find that in the 700–800 m stratum there is a roughly equal role played by sediment Co supply and low rates of Co removal by Mn-oxidizing bacteria in maintaining the dCo concentrations.
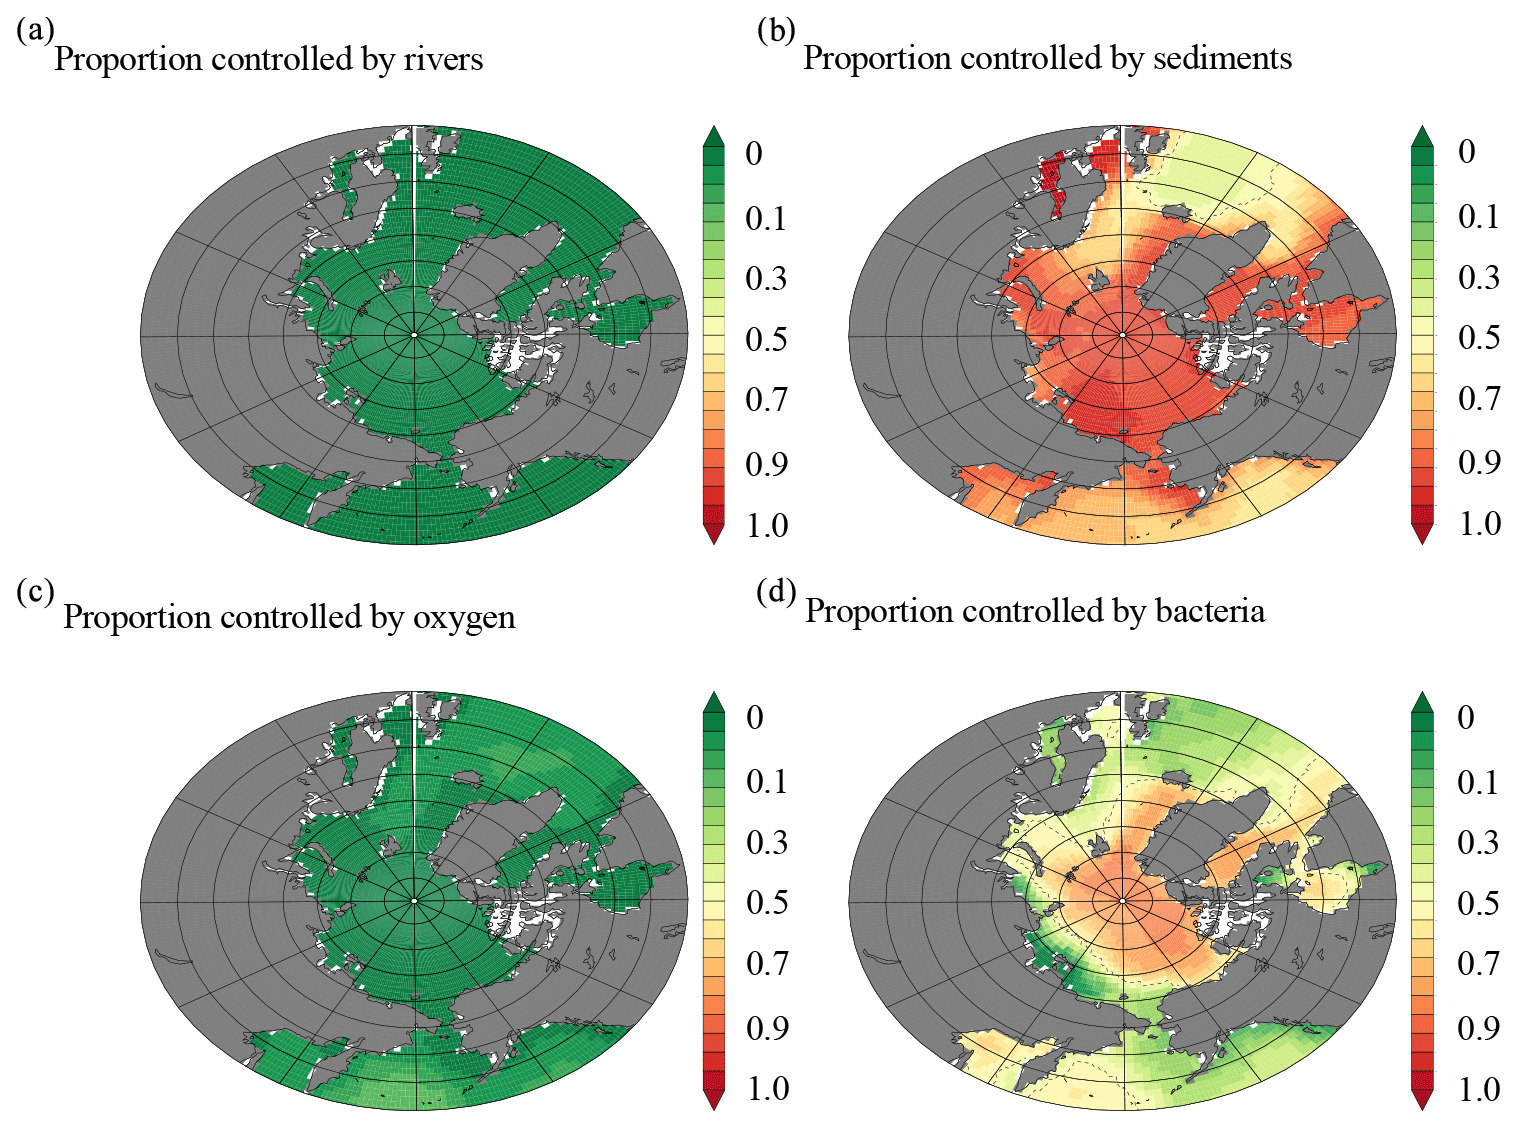
Figure 9(a) Model output of the proportion of the dCo signal from 0 to 50 m that is controlled by (a) rivers, (b) sediment input, (c) oxygen concentrations, and (d) removal by Mn oxidation from Mn-oxidizing bacteria.
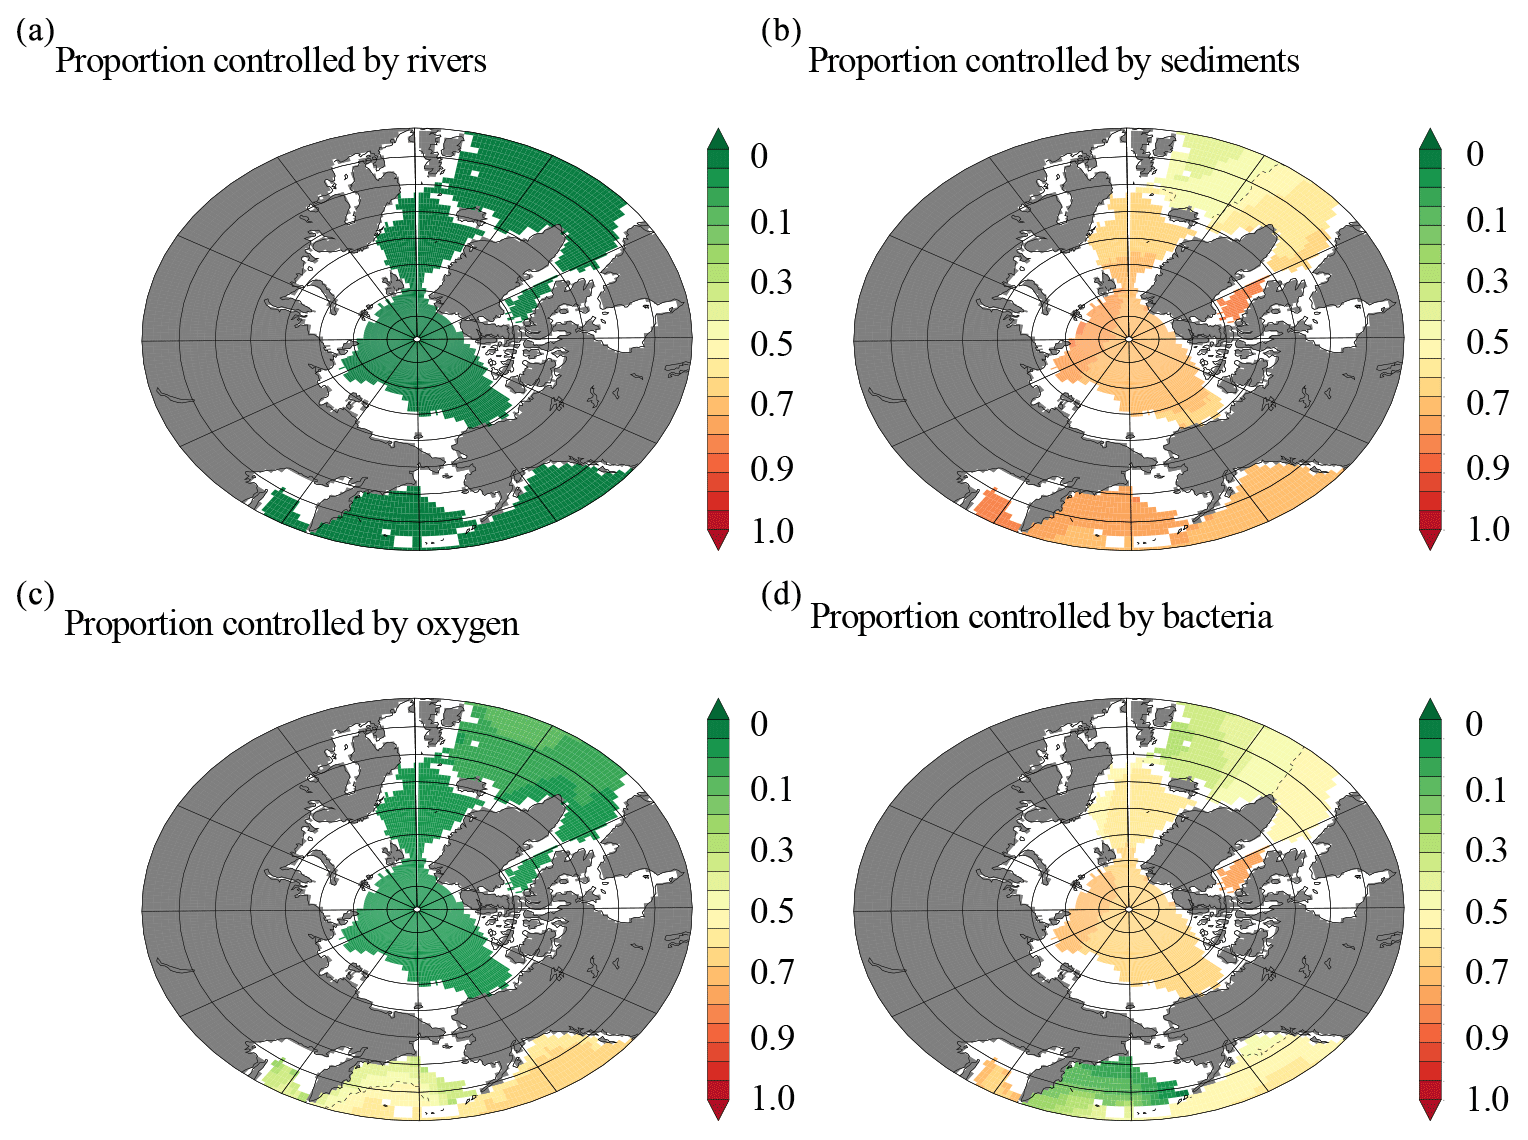
Figure 10(a) Model output of the proportion of the dCo signal from 700 to 800 m that is controlled by (a) rivers, (b) sediment input, (c) oxygen concentrations, and (d) removal by Mn oxidation from Mn-oxidizing bacteria.
4.1 Quantifying external sources of cobalt to the Arctic Ocean
The coherence of the dCo and LCo distributions with that of dMn, along with evidence from the model output, suggests that shelf sediments are one of the primary sources of Co in the Canadian sector of the Arctic Ocean (Figs. 5, 9). Mn is known to be an excellent tracer of sediment input due to the high solubility of reduced Mn from anoxic sediments (Johnson et al., 1992; März et al., 2011; McManus et al., 2012; Noble et al., 2012), though there was also a limited source of dMn from rivers in this region (Charette et al., 2020). By using the dMn concentrations as a tracer for shelf input, we can quantify the proportion of the variance in the dCo and LCo observations that are explained by this shelf proxy. Linear regressions between dCo or LCo distributions and dMn in the upper 200 m across all of the stations explained 67 % and 72 % of the variance in the dCo and LCo concentrations, respectively (Fig. 11a; p<0.05). This trend is driven primarily by the data in the upper 50 m. The variance explained decreases, however, if only the shelf stations (stations 2–10, 57–66) are included in the analysis (data not shown), suggesting that some process other than shelf inputs couples the dMn and Co distributions within the basin. The amount of the variance in the Co distributions that is explained by shelf inputs as indicated by dMn is slightly less than that observed in the model (Fig. 9b), though both agree that shelf inputs are the dominant source.
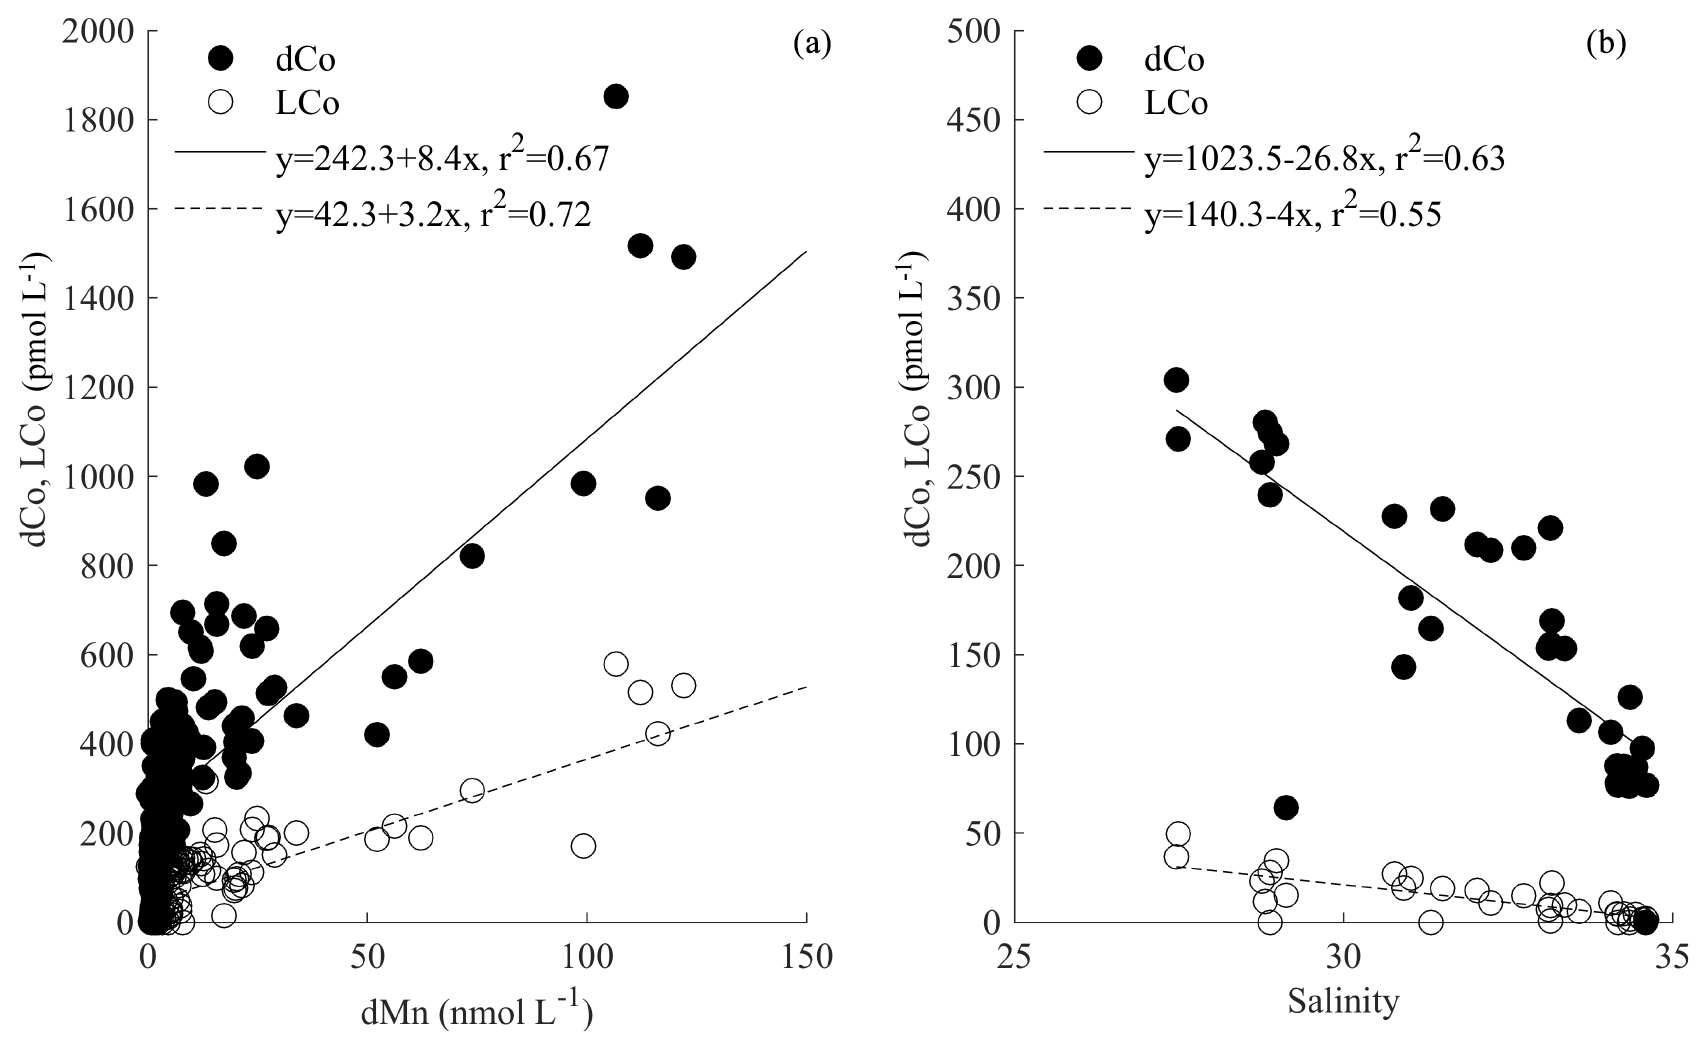
Figure 11dCo (closed circles) and LCo (open circles) in the upper 200 m plotted against (a) dMn in shelf stations only (stations 2–10, 57–66), as well as (b) salinity from only the stations influenced by the Transpolar Drift (stations 30–43).
The modeling results suggest that nearly all of the dCo in the upper 50 m can be accounted for by a combination of a sediment source and diminished scavenging in the Arctic relative to other ocean basins (Fig. 9b and d; Tagliabue et al., 2018). However, the observations suggest that 20 %–30 % of the variance cannot be explained by a shelf source alone. If the dCo and LCo is examined against salinity for all stations from GN01 in the upper 200 m, then salinity can explain 24 % and 28 % of the variance for dCo and LCo, respectively (data not shown). This relationship is improved if only the stations in the central Arctic basin are included (stations 30–43), and then salinity explains 47 % of the dCo and 57 % of the LCo distributions (Fig. 11b). The coherence of dCo and LCo with salinity across the dataset, and particularly in this region, appears to be due to a contribution of low-salinity water from rivers, rather than from sea ice melt (Fig. 12c), as no relationship was observed with the fraction of sea ice melt determined from δ18O isotopic measurements of seawater (Bauch et al., 2005; Cooper et al., 1997, 2005; Newton et al., 2013). Instead, the relationship with salinity is driven by freshwater inputs from rivers, as a strong relationship is observed with the fraction of meteoric water (Fig. 12d). These stations correspond to a region of anomalously high dFe and DOC concentrations (Charette et al., 2020), interpreted to be indicative of river inputs carried across the basin in the Transpolar Drift (TPD) (Gascard et al., 2008; Klunder et al., 2012; Middag et al., 2011; Wheeler et al., 1997). This is supported by measurements of 228Ra, which has been used as a tracer of shelf inputs throughout the Arctic (Kipp et al., 2018; van der Loeff et al., 2018). A similar relationship was also observed with salinity in the North Atlantic, supporting the role of rivers as a source of dCo (Dulaquais et al., 2014a; Noble et al., 2017; Saito and Moffett, 2001). In our model sensitivity experiments, we found a small effect of rivers on dCo (Figs. 9a, 10a), and the Co∕N river endmember in the model was similar to that measured by the Arctic Great Rivers Observatory (Holmes et al., 2018). It appears that the data suggest a larger role for rivers than what is captured by the model, which could imply that gross riverine fluxes are underestimated by our model. However it is difficult to disentangle riverine processes from other processes happening on the shelf like groundwater inputs (Charette et al., 2020). It is possible that there is some mixing of river and sediment dCo occurring in the coastal zone or that our global-scale model is not able to properly account for the physical transport of fluvial signals into the open basin.
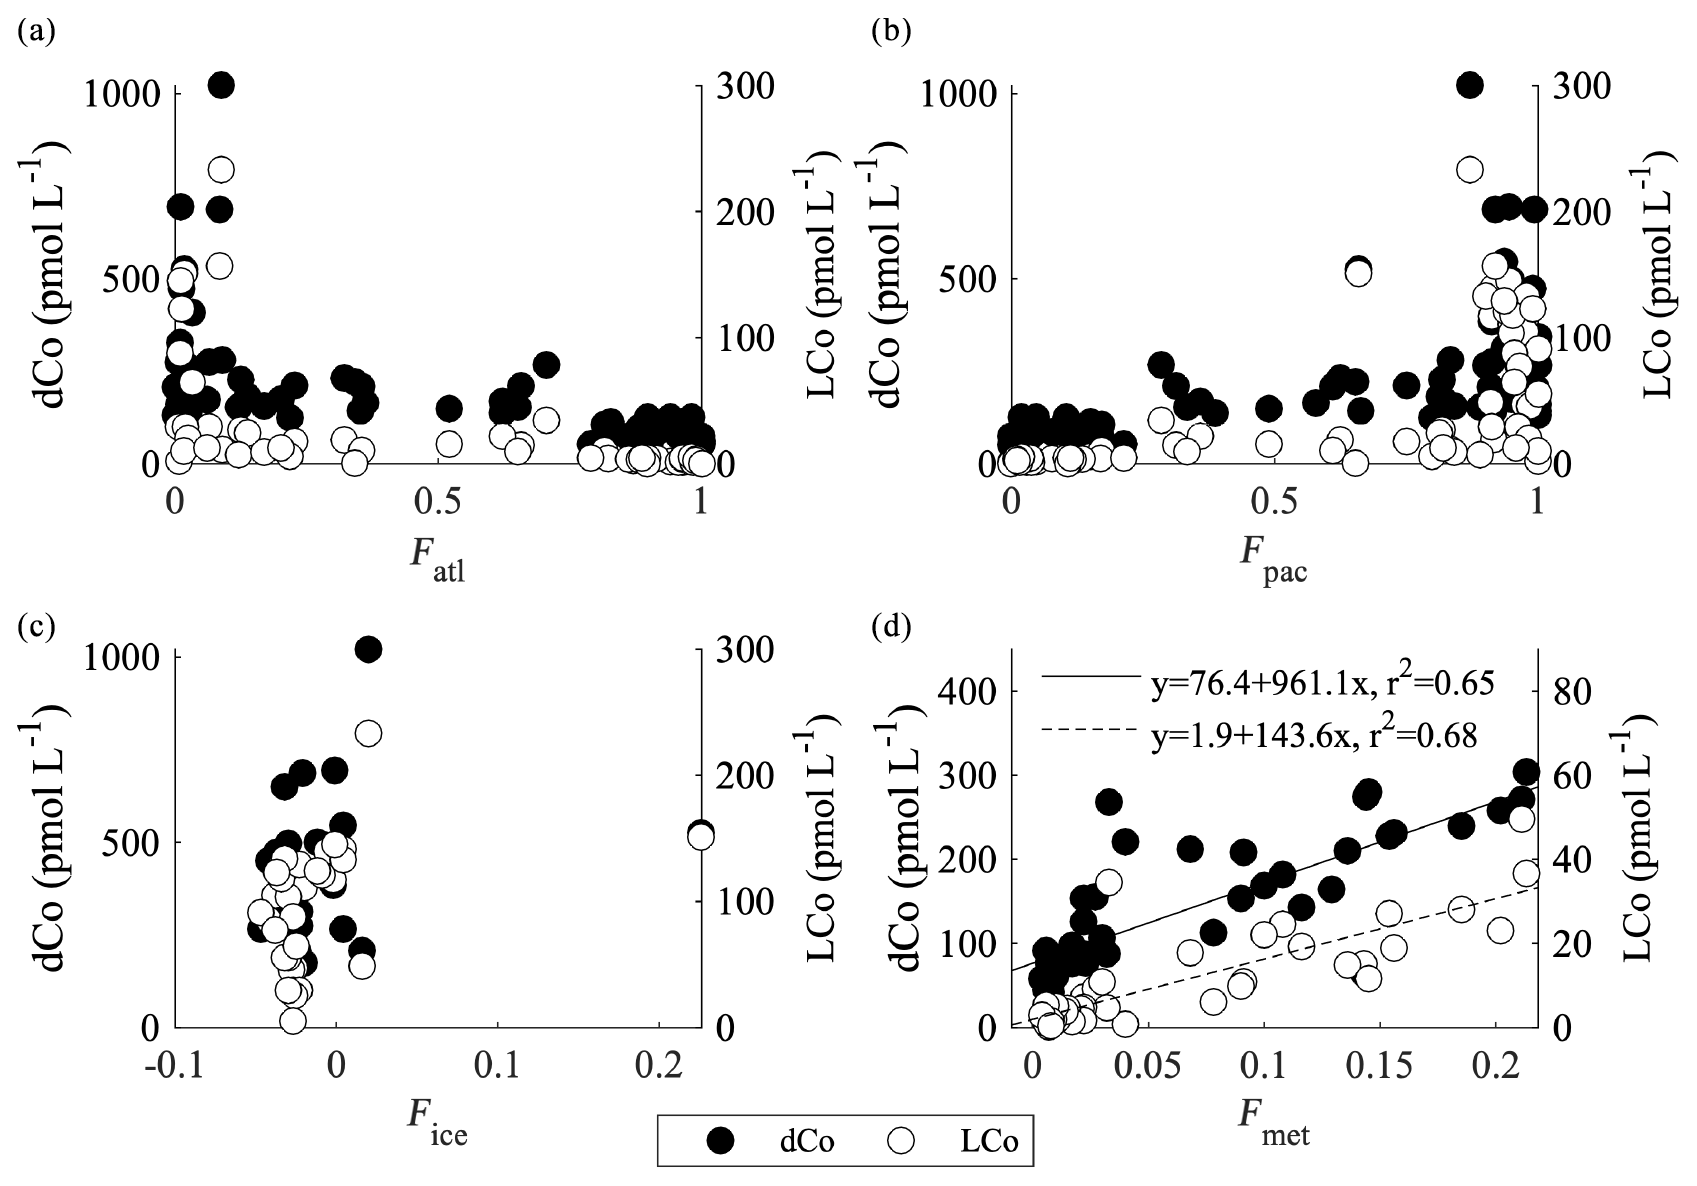
Figure 12dCo and LCo from select stations versus (a) the fraction of Atlantic water (Fatl; all stations <500 m), (b) the fraction of Pacific water (Fpac; all stations <500 m), (c) the fraction of sea ice melt (Fice; <100 m and south of 84∘ N), and (d) the fraction of meteoric water (Fmet; <500 m and north of 84∘ N).
The presence of such high concentrations of trace elements and isotopes at the North Pole was surprising, yet several tracers indicate that this is an area significantly influenced by river and shelf input from the surrounding continents (Charette et al., 2020; Colombo et al., 2020; Kipp et al., 2018; van der Loeff et al., 2018). The elevated concentrations of dCo at great distances from the continental shelf are also likely partially due to the enhanced organic complexation of dCo in TPD waters. Averaged over the entire dataset, dCo is 79±13 % organically complexed (21±13 % labile) in the upper 200 m of the water column. However, at TPD-influenced stations (stations 29–34; Charette et al., 2020), dCo is 92±6 % organically complexed, significantly higher than in the rest of the transect (paired-sample t test, p<0.05). This suggests that elevated concentrations of DOC from Arctic rivers entrained in the TPD or ligands produced in situ may play a role in stabilizing a portion of the dCo pool during transport towards the North Pole, as has been observed for other metals such as dFe (Slagter et al., 2017, 2019) and dissolved copper (Nixon et al., 2019). Although the exact character of the organic dCo-binding ligands in seawater is unknown, in the Arctic it is likely that humic-like substances contribute some portion of the organic complexation observed, due to the presence of elevated colored DOM (CDOM) in the TPD (Wheeler et al., 1997), consistent with the presence of humic substances (Del Vecchio and Blough, 2004). Despite the presence of humic substances, it seems somewhat unlikely that humics account for all of the ligands complexing dCo in this region. Our analytical method distinguishes organically bound Co as the fraction of total dCo that is more strongly complexed than our competing ligand (DMG). The complexation of humic and fulvic-like substances with Co has been shown to be much weaker than the Co(DMG)2 complex ( versus ; Yang and Van Den Berg, 2009). Ligands similar to those suspected to complex Co in open ocean waters of the Atlantic or Pacific could be responsible for Co stabilization in the TPD waters (Saito and Moffett, 2001). These ligands are presumed to have functional groups similar to cobalamin (vitamin B12), with a Co atom tightly bound inside a corrin ring. Cyanobacteria and some archaea are known cobalamin producers (Bertrand et al., 2007; Doxey et al., 2015; Heal, 2018; Heal et al., 2017; Lionheart, 2017), and both are found in the Arctic (archaea – Cottrell and Kirchman, 2009; cyanobacteria – Waleron et al., 2007; Zakhia et al., 2008), although in very low abundance. The nature of the organic molecules binding dCo in this region will be interesting to explore further in future studies.
Overall, both the modeling results and observations agree that the dominant source of Co in the Arctic is from the extensive shelf sediments surrounding the Arctic Ocean, with additional contributions from Arctic rivers. The observations, however, show that sources vary in importance in space, with sediment sources clearly dominating in stations close to the shelf and river sources dominating in the central Arctic basin through the influence of the TPD. The interaction between rivers and shelves requires further inquiry, as the shelf sediments might behave as a “capacitor” for dCo, accumulating Co from rivers and sinking organic matter and then releasing Co to the overlying water during reductive dissolution in the sediments (Bruland et al., 2001; Chase et al., 2007). Although the mechanism is uncertain, it is clear that the riverine source dominates the distribution observed near the North Pole where dCo and LCo concentrations remain high despite the distance from land and that organic complexation likely plays a role in the distal transport of this dCo (Charette et al., 2020).
4.2 Cobalt scavenging and internal cycling
A striking feature of the dCo and LCo dataset is the vertical transition in the water column from very high to low Co concentrations throughout the deep Arctic (Fig. 5). The question remains (1) whether or not this elevated dCo is scavenged at a shallow depth horizon, (2) if the high dCo concentrations in the surface layer (<200 m) are simply physically isolated from deeper water masses, or if a combination of (1) and (2) is the case. This would suggest that the Atlantic water characteristic of the deep Arctic does not mix with the modified surface Arctic water containing high concentrations of Co. We examined both hypotheses within a modeling framework and compared this to the observations. In the model, the dCo is scavenged primarily in the upper 50 m with almost no scavenging below 200 m (data not shown). The dCo scavenging in the model is primarily controlled by Mn-oxidizing bacteria, which have a strong temperature dependence in the model (Tebo et al., 2004). The cold temperatures in the majority of the Arctic prevent enhanced scavenging of dCo by this mechanism compared to in other basins (Hawco et al., 2018; Saito et al., 2017; Tagliabue et al., 2018). However, relatively warmer temperatures on the shallow shelves suggest that scavenging is enhanced in this region (Fig. 4), and the coherence of the pCo and pMn peaks in the upper 200–250 m (Fig. 7) support this mechanism of upper-ocean scavenging. Evidence from 234Th data shows very little particulate organic carbon (POC) flux in the upper water column along this transect; however strong lateral transport from the shelves to the basin was observed (Black, 2018). This lateral transport was observed both in the upper water column and at depth, suggesting fast-moving currents through the deep canyons may be significant in transporting material from the shelf into the basin (Black, 2018). It is possible that additional scavenging of Co may occur along this flow path. Some of the profiles observed in the deep basin also show evidence for bottom-water scavenging in the Atlantic water (e.g., Fig. 4e, h, p).
Additional insights on Co scavenging in this basin can be observed by exploring the dCo: phosphate (P) ratios (pmol L−1 : µmol L−1) along the transect (Fig. 13). The relationship between dCo and P in the Arctic water column yields insights into biological uptake and regeneration processes acting on the dCo inventory, as well as into scavenging. An analysis completed by Saito et al. (2017) showed that positive slopes in the dCo : P relationship were indicative of regeneration, while negative slopes were indicative of biological uptake or scavenging (Saito et al., 2017). The high dCo in the Arctic yields a unique dCo : P relationship compared to the North Atlantic (Fig. 13a; Saito et al., 2017). When dCo : P slopes (r2>0.6) are binned according to whether they are positive (Fig. 13b) or negative (Fig. 13c) and then plotted versus depth (Fig. 13d), a few patterns are apparent. Positive dCo : P slopes are observed largely within a confined depth layer in the PHW (Fig. 13d). This is not surprising, given that deep Pacific waters carry a strong regeneration signal. However, at most other depths the dCo : P slopes are negative, showing that scavenging is occurring to some extent throughout the water column (Fig. 13d). With one exception, the magnitudes of the negative dCo : P slopes are greater in the upper water column, supporting the model results and our interpretations of the pCo profiles that most of the scavenging occurs in the upper water column but also continues to occur throughout the deep Arctic. The negative slopes at the base of the profiles could also represent the dilution of dCo in the deep Arctic with lower-dCo Atlantic water, as noted in the western Atlantic Ocean (Dulaquais et al., 2014b). However, it is unlikely that dilution alone accounts for the negative slopes observed throughout the water column.
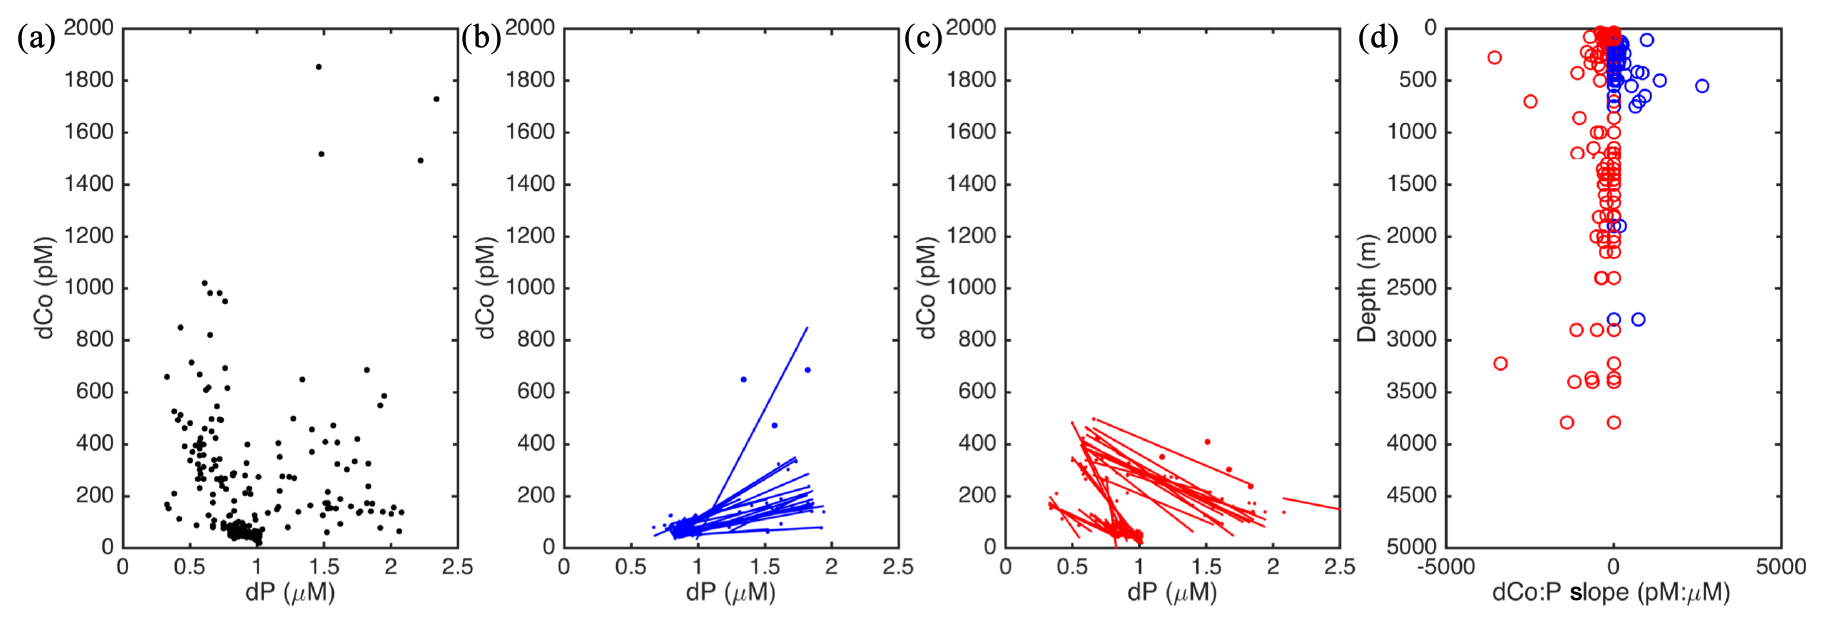
Figure 13(a) The dCo (pmol L−1) compared to phosphate (dP; µmol L−1) from the GN01 dataset. (b) five-point two-way linear regression of positive dCo : P slopes (r2>0.6). (c) five-point two-way linear regression of negative dCo : P slopes (). (d) Depths where either a positive (blue) or a negative (red) dCo : P slope was identified in the GN01 dataset. Additional details on the regression analysis can be found in Saito et al. (2017).
This evidence, combined with the coinciding maxima observed in pCo and pMn, suggests that scavenging occurs in the upper water column but that additional scavenging continues to occur in deeper waters. The elevated pCo concentrations in the deep Arctic compared to other regions (Lee et al., 2018) suggest that scavenging over long timescales continues to add to the pCo pool. The strong stratification in the Arctic likely prevents high concentrations of dCo from mixing between the modified surface waters, the PHW, and the deep Atlantic water (Steele et al., 2004). Thus, it is likely a combination of limited upper-ocean scavenging and strong stratification between water masses that keeps the elevated dCo and LCo confined to the surface waters in the Arctic, yielding the intense scavenged-like profile of Co in this region compared to other basins (Fig. 3).
4.3 Increases in Co inventories over time in the Canadian sector of the Arctic Ocean
Samples collected on the shelf in the Beaufort Sea in 2009 in proximity to the U.S. GEOTRACES transect in 2015 (Fig. 1) had significantly lower dCo (paired t test, p<0.05) than shelf samples from 2015 (Fig. 14). Shelf samples for dCo from 2015 were approximately 4 times higher than the dCo in 2009, and for LCo in 2015 they were approximately 8 times higher than the LCo in 2009 (Fig. 14c). The maximum dCo concentration measured in 2009 was 301 pmol L−1, while in 2015 it was 1852 pmol L−1. The dCo and LCo concentrations below 150 m agreed very well, however, between the 2 years (Fig. 14a, b). Several factors could account for the higher dCo and LCo observed in 2015 compared to 2009. The Co samples from 2009 were initially unfiltered and were not stored with gas-absorbing satchels like the samples from 2015. Recently, loss of dCo has been observed in the presence of oxygen during storage; however this loss was most pronounced for samples in low-oxygen regions (Noble, 2012). The mechanism of the dCo loss is unknown and is difficult to quantify from these samples; however the waters are well oxygenated in this region (Fig. 2b), and thus the loss due to storage was likely minimal. However, we cannot say for certain how much of the observed increase in dCo over time is due to a storage artifact. Previous work has shown a maximum loss of dCo of 40 % after 5 months of storage (Noble, 2012). If we consider that 40 % of the dCo could have been lost in the samples collected from 2009, the data from 2015 still show an increase in dCo of approximately 400 %. Some of the samples from 2009 were also collected over a narrower region of the shelf compared to those in 2015, so shelf width could also be an important factor in the observed increase in dCo. Thus, although we cannot quantify with certainty the percent increase in dCo over time in the Canadian sector of the Arctic, it is possible that an increase in dCo was observed.
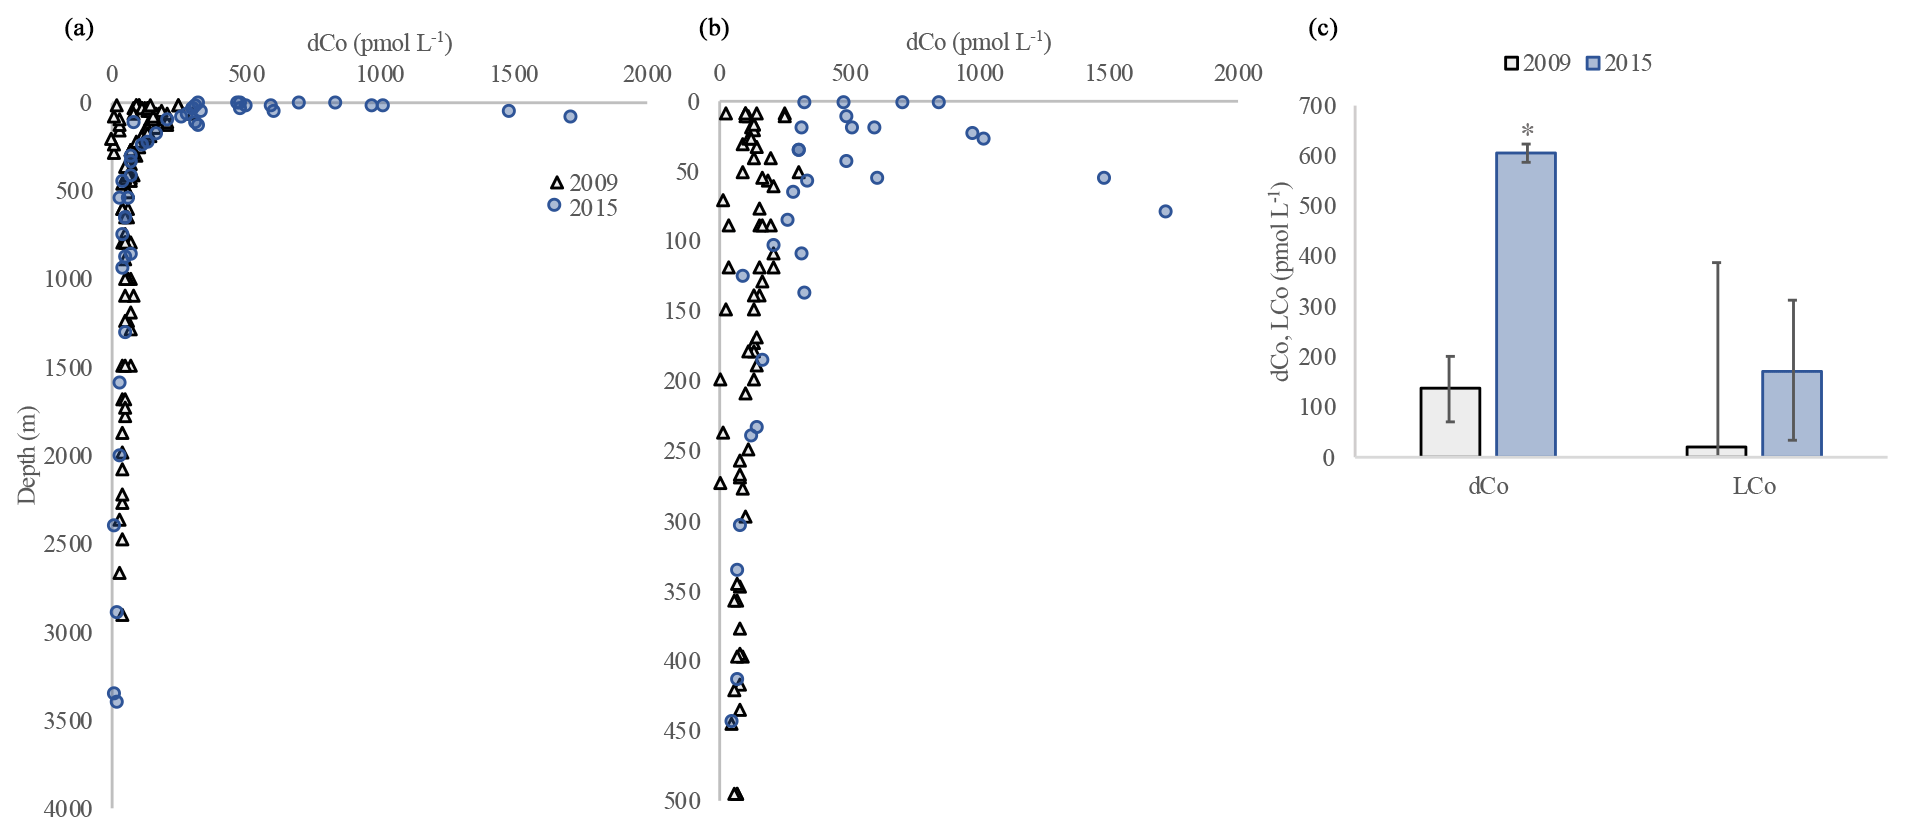
Figure 14The dCo on the shelf measured in 2009 (GIPY14; black triangles) and 2015 (GN01; blue circles) in the upper 3500 m (a) and upper 500 m (b). Average dCo and LCo in the upper 150 m from 2009 (grey) and 2015 (blue; c). Error bars represent the standard deviation, and * denotes a significant difference.
The increase in dCo over time in the Arctic is interesting and has been documented for other tracers in the Arctic. Kipp et al. (2018) and van der Loeff et al. (2018) noted that 228Ra has increased over time in the central Arctic. They suggest that increases in shelf and/or river inputs from thawing permafrost are the source of this elevated 228Ra (Kipp et al., 2018; van der Loeff et al., 2018). A similar mechanism is likely increasing metal inventories over time on Arctic shelves. The majority of the variance (∼70 %) in dCo in the upper 100 m on the U.S. GEOTRACES transect could be explained by a shelf source, and the remainder was likely associated with river inputs (Fig. 11). If these sources are similar to the sources of dCo in 2009, then an increase in either a shelf or river flux could be responsible for the dramatic increase in dCo over time. While there are not enough data to state whether the river dCo flux has in fact changed over time in the Arctic and the observed changes could be due to seasonal or interannual variability, several other studies have documented an increase in river discharge due to increases in permafrost melt over time (Doxaran et al., 2015; Drake et al., 2018; Kipp et al., 2018; van der Loeff et al., 2018; Tank et al., 2016; Toohey et al., 2016). The increase in river discharge has the potential to considerably increase trace metal inventories in the future Arctic Ocean, perhaps particularly for those metals that are strongly organically complexed, thus protecting against scavenging in the estuarine mixing zone (Bundy et al., 2015). We recognize these two Arctic dCo datasets are limited in temporal coverage and have methodological differences; however, we felt a responsibility to transparently present these observations of dCo increases in the Arctic Ocean to raise community awareness of this potential environmental change. These increases in metals over time may have implications for metal stoichiometries and phytoplankton growth in a changing Arctic Ocean.
4.4 Implications of the Arctic as a net source of Co to the North Atlantic Ocean
The concentrations of dCo and LCo in this region of the Arctic are some of the highest that have been observed thus far in the ocean. In some cases, the dCo was almost 10 times higher than in the low-oxygen region of the eastern Pacific (Hawco et al., 2016). Although the Arctic is considered to be a macronutrient-poor system, in contrast to other oligotrophic regions the Arctic is quite enriched in micronutrients (Charette et al., 2020; Colombo et al., 2020; Jensen et al., 2019; Marsay et al., 2018; Slagter et al., 2017). These distinct micronutrient ratios may have implications for Arctic phytoplankton communities, as well as for communities in the North Atlantic that are influenced by inputs from the Arctic.

Figure 15(a) The ratio of LCo to dCo (colors) from this study and the western portion of the GA03 North Atlantic transect (Noble et al., 2017) along with dCo concentrations (b) in temperature–salinity space, with Labrador Sea Water (LSW) source waters (solid black box) and signature in the Atlantic (dashed box) are highlighted. (c) Sampling region in this study and the stations used from Noble et al. (2017).
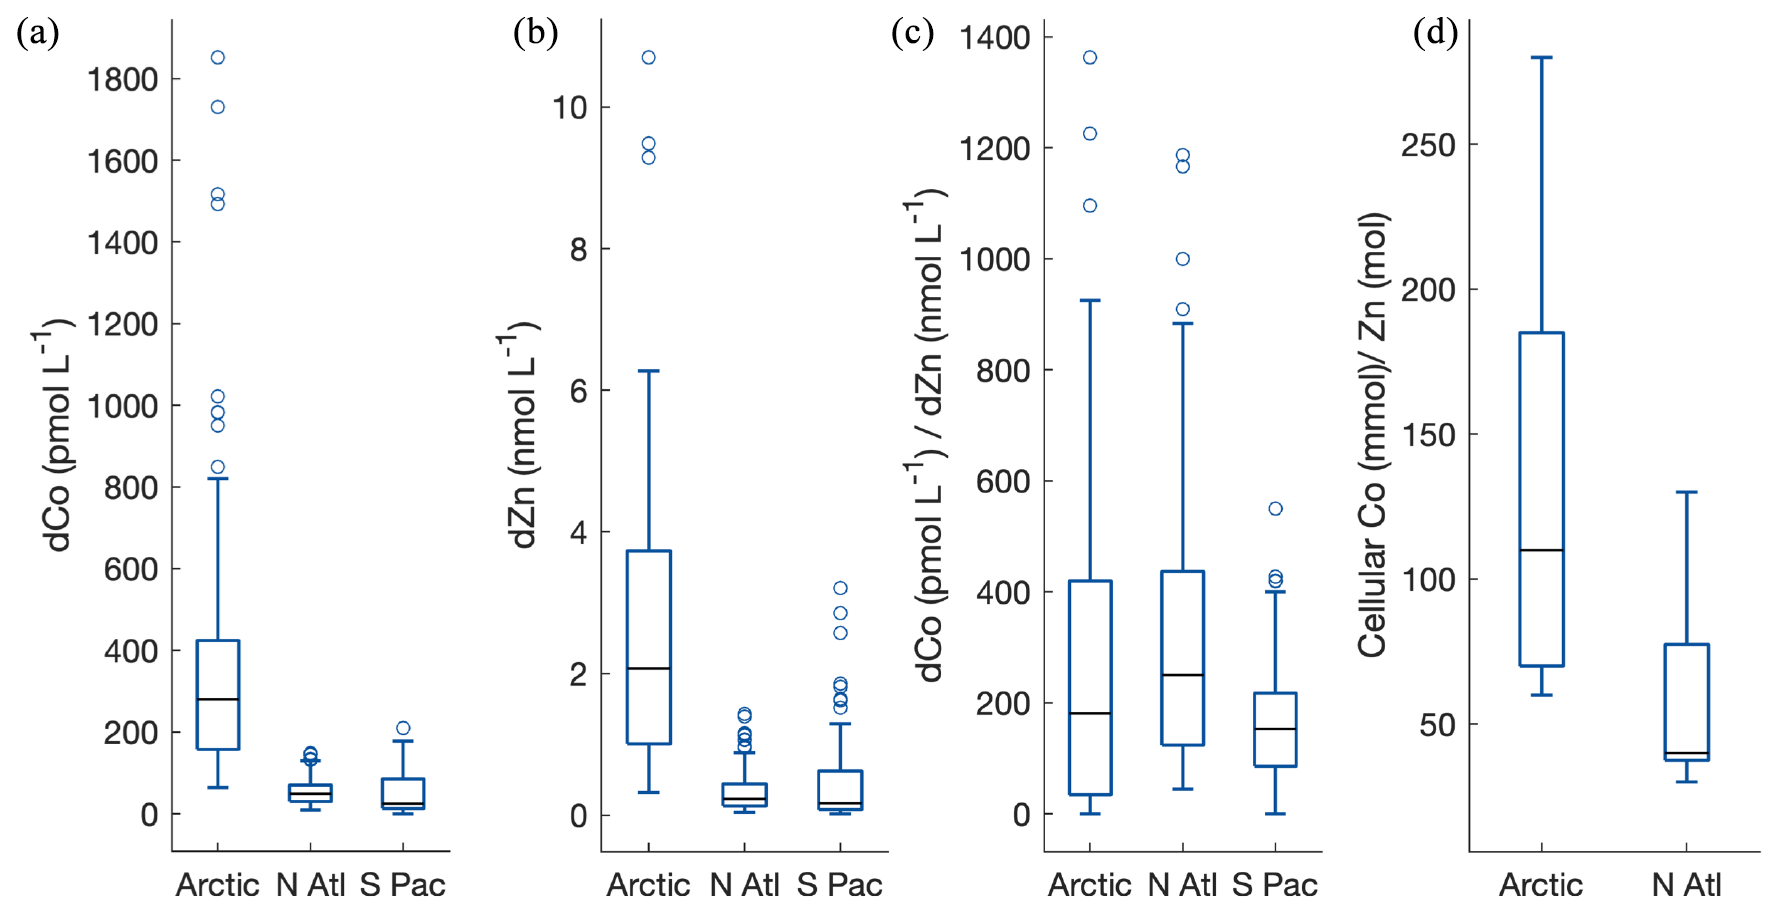
Figure 16Median dCo concentrations (a), dissolved Zn concentrations (b), and dCo∕dZn ratios (c) in the upper 200 m in the Arctic (this study), North Atlantic (Noble et al., 2017), and the southern eastern Pacific (Hawco et al., 2016). (d) Co∕Zn ratios in phytoplankton from the Arctic and North Atlantic. Whiskers represent the lower (25 %) and upper (75 %) quartiles.
Arctic waters are thought to primarily exit the basin and impact the North Atlantic via the Canadian archipelago and the Fram and Davis straits (Talley, 2008). The organic complexation and stabilization as well as the high concentrations of dCo suggest that some of this dCo might exit the Arctic and impact nutrient distributions in the North Atlantic. Noble et al. (2017) noted a plume of elevated dCo in the western portion of the U.S. GEOTRACES North Atlantic (GA03) transect that did not correspond with a signature from reducing sediments as on the North Atlantic eastern boundary. Noble et al. (2017) postulated that high dCo in Labrador Sea Water (LSW) was the source of this signal, due to the presence of a corresponding signature of low silica that is characteristic of this water mass. The authors noted this anomalously high dCo could be from elevated dCo in Arctic waters, or due to high dCo on the shelf that is picked up along the flow path of the LSW, or a combination of the two (Dulaquais et al., 2014a; Noble et al., 2017). This observation was also noted by Dulaquais et al. (2014b) in the GEOTRACES GA02 section (Dulaquais et al., 2014a, b). Our data suggest that a combination of the high dCo observed in this study and additional Co entrained on the shelf in the Labrador Sea likely contribute to that signal, and when observed in temperature and salinity space the data support this hypothesis (Fig. 15). The Arctic source waters that contribute to the formation of LSW have a low-salinity signature and are likely significantly modified as they exit the Canadian archipelago, Fram Strait, and Davis Straits (Myers, 2005). From these data we cannot quantitatively connect the elevated dCo and LCo observed in the Arctic source waters to the LSW seen in the western Atlantic (Dulaquais et al., 2014a; Noble et al., 2017), given the complex history (e.g., transformation, mixing) of source waters in the Labrador Sea region (Le Bras et al., 2017). However, it is apparent that the low-salinity Arctic waters contain high Co (Fig. 15), which given the advective pathways of these water masses from the Arctic, suggests that they may act as a source of Co to lower-latitude waters. Interestingly, the high dCo in the Arctic has a distinct LCo∕dCo signature compared to that observed in the western North Atlantic (Fig. 15a). Due to the significant impact that Arctic shelves and rivers have on the dCo signature observed in this study, it is likely that additional Co may be added to these waters as they pass through the Canadian archipelago. The fate of these waters and their Co as they exit via the Fram and Davis straits is unknown. Constraining these Arctic endmembers and how they contribute to dCo distributions in the North Atlantic deserves further attention, as it has interesting implications for nutrient resource ratios for North Atlantic phytoplankton communities.
The possibility that elevated micronutrient concentrations from the Arctic are being exported to the North Atlantic could have implications for phytoplankton nutrient utilization and community composition. The dCo and dZn for example, which can be interchanged within carbonic anhydrase in some eukaryotes (Lane and Morel, 2000; Sunda and Huntsman, 1995; Yee and Morel, 1996), are elevated in the Arctic (Jensen et al., 2019) compared to the North Atlantic and South Pacific (Fig. 16a, b; Schlitzer et al., 2018). The higher concentrations of both metals result in a dCo∕dZn ratio that is quite similar to that observed in the North Atlantic; however the range in this ratio is large (Fig. 16c). Small changes in the sources of each of these metals could manifest as big impacts on the ratio of these micronutrients in surface waters, which laboratory studies have shown to have significant effects on growth (Hawco and Saito, 2018; Kellogg et al., 2020; Sunda and Huntsman, 1995). The cellular Co∕Zn ratios are also slightly higher in the Arctic compared to the North Atlantic but span a similar range (Fig. 16d). However, if river inputs continue to increase with an increase in permafrost thawing in the warming Arctic (Jorgenson et al., 2006) and similar increases in dCo are observed over time as seen in this work, then the inventory of dCo in the Arctic may begin to influence the North Atlantic to a greater extent. These increases in metal sources may disproportionately affect Co compared to Zn, whose primary source was found to be from a regeneration signal on the shelf rather than from river input (Jensen et al., 2019), and the total Co inventory is small compared to Zn. For example, diatoms that have enhanced growth rates when metabolically substituting Co for Zn may be favored in surface waters with higher dCo∕dZn ratios (Kellogg et al., 2020), although there are no experimental data to our knowledge examining the influence of Zn and Co on Arctic phytoplankton. Understanding how future changes in metal sources in the Arctic may impact the North Atlantic or shifts in phytoplankton community structure will be important to constrain.
The unique dissolved and labile Co distributions observed in the Arctic compared to in other open ocean basins have potential implications for future changes in micronutrients in the warming Arctic Ocean. Sediment and river inputs to the Arctic appear to be the dominant mechanisms for the input of dCo to the Arctic, and these elevated signals persist over a broad area of the western Arctic far from their source regions. In part, this appears to be due to relatively slow scavenging of Co in the Arctic, highlighting the impact of lower temperatures and slower kinetics of Mn-oxide formation in this basin. The dCo in the Arctic is also strongly organically complexed, which may also prevent scavenging and lead to the persistently high concentrations observed in surface waters. Notably, Co was also suggested to be increasing over time on the shelf in the Canadian Arctic, likely due to increases in river inputs from thawing permafrost, consistent with other Arctic tracers. The increase in the inventory of dCo over time in the Arctic may have downstream impacts on dCo∕dZn ratios in North Atlantic waters, as the dCo inventory will be disproportionately magnified relative to dZn with additional future increases from Arctic rivers. Higher dCo∕dZn ratios in the Arctic and North Atlantic may also favor organisms that have elevated growth rates if Co is metabolically substituted for Zn. These ecological impacts are likely to become increasingly important in the future, with increased warming and changes to Co sources in the Arctic basin.
The metadata for this paper are available through the BCO-DMO for GN01 (https://www.bco-dmo.org/project/638812; Landing et al., 2019) and through the BODC for GIPY14 (https://www.bodc.ac.uk/geotraces/data/inventories/0903/; Adjou, 2020). The dissolved and labile cobalt data for GN01 specifically are available at https://www.bco-dmo.org/dataset/722472 (Saito and Rauch, 2020).
RMB analyzed the samples and wrote the manuscript. MRC developed the data-processing code and helped write the manuscript. MAS designed the study and helped write the manuscript. AT, NJH, PLM, BST, MH, AEN, SGJ, and JTC contributed data and helped write the manuscript.
The authors declare that they have no conflict of interest.
We would like to thank the captain and crew of the USGC Healy; Gabi Weiss and Simone Moos for sampling; Dawn Moran, Noelle Held, and Matt McIlvin for help with sample preparations and analyses; Ana Aguilar-Islas and Robert Rember for small-boat and sea ice hole operations; the Oceanographic Data Facility at Scripps Institution of Oceanography for macronutrient, oxygen, and salinity measurements; Sara Rauschenberg for sample collection; and Peter Schlosser, Robert Newton, Tobias Koffman, and Angelica Pasqualini for water mass fraction data.
This work was supported by National Science Foundation Ocean Sciences (NSF OCE) grants (grant nos. 1435056, 1736599, and 1924554) to Mak A. Saito, as well as by a Woods Hole Oceanographic Institution Postdoctoral Scholar grant to Randelle M. Bundy and Mattias R. Cape. Mariko Hatta was supported by NSF OCE grant no. 1439253. Alessandro Tagliabue was supported by the European Research Council (ERC) under the European Union's Horizon 2020 research and innovation program (BYONIC, grant no. 724289). Benjamin S. Twining was supported by NSF OCE grant no. 1435862. Peter L. Morton was supported by NSF OCE grant no. 1436019, and a portion of the work was completed at the NHMFL, which is supported by the National Science Foundation through DMR-1644779 and the State of Florida. Jay T. Cullen was supported by the Natural Sciences and Engineering Research Council (NSERC) of Canada and an International Polar Year (IPY) Canada grant.
This paper was edited by Peter Landschützer and reviewed by three anonymous referees.
Aagaard, K. and Carmack, E. C.: The role of sea ice and other fresh water in the Arctic circulation, J. Geophys. Res.-Oceans, 94, 14485–14498, 1989.
Adjou, M.: Data inventory for cruise CCGS Amundsen 0903 (ArcticNet, GIPY14), available at: https://www.bodc.ac.uk/geotraces/data/inventories/0903/, last access: 10 August 2020.
Aumont, O., van Hulten, M., Roy-Barman, M., Dutay, J.-C., Éthé, C., and Gehlen, M.: Variable reactivity of particulate organic matter in a global ocean biogeochemical model, Biogeosciences, 14, 2321–2341, https://doi.org/10.5194/bg-14-2321-2017, 2017.
Baars, O. and Croot, P. L.: Dissolved cobalt speciation and reactivity in the eastern tropical North Atlantic, Mar. Chem., 173, 310–319, https://doi.org/10.1016/j.marchem.2014.10.006, 2015.
Bauch, D., Erlenkeuser, H., and Andersen, N.: Water mass processes on Arctic shelves as revealed from δ18O of H2O, Global Planet. Change, 48, 165–174, 2005.
Bertrand, E. M., Saito, M. A., Rose, J. M., Riesselman, C. R., Lohan, M. C., Noble, A. E., Lee, P. A., and DiTullio, G. R.: Vitamin B12 and iron colimitation of phytoplankton growth in the Ross Sea, Limnol. Oceanogr., 52, 1079–1093, https://doi.org/10.4319/lo.2007.52.3.1079, 2007.
Bertrand, E. M., Allen, A. E., Dupont, C. L., Norden-Krichmar, T. M., Bai, J., Valas, R. E., and Saito, M. A.: Influence of cobalamin scarcity on diatom molecular physiology and identification of a cobalamin acquisition protein, P. Natl. Acad. Sci. USA, 109, E1762–E1771, https://doi.org/10.1073/pnas.1201731109, 2012.
Bertrand, E. M., McCrow, J. P., Moustafa, A., Zheng, H., McQuaid, J. B., Delmont, T. O., Post, A. F., Sipler, R. E., Spackeen, J. L., and Xu, K.: Phytoplankton–bacterial interactions mediate micronutrient colimitation at the coastal Antarctic sea ice edge, P. Natl. Acad. Sci. USA, 112, 9938–9943, 2015.
Black, E. E.: An investigation of basin-scale controls on upper ocean export and remineralization, Doctoral dissertation, Massachusetts Institute of Technology, 2018.
Bown, J., Boye, M., Baker, A., Duvieilbourg, E., Lacan, F., Le Moigne, F., Planchon, F., Speich, S., and Nelson, D. M.: The biogeochemical cycle of dissolved cobalt in the Atlantic and the Southern Ocean south off the coast of South Africa, Mar. Chem., 126, 193–206, 2011.
Browning, T. J., Achterberg, E. P., Rapp, I., Engel, A., Bertrand, E. M., Tagliabue, A., and Moore, C. M.: Nutrient co-limitation at the boundary of an oceanic gyre, Nature, 551, 242–246, https://doi.org/10.1038/nature24063, 2017.
Bruland, K. W., Rue, E. L., and Smith, G. J.: Iron and macronutrients in California coastal upwelling regimes: Implications for diatom blooms, Limnol. Oceanogr., 46, 1661–1674, https://doi.org/10.4319/lo.2001.46.7.1661, 2001.
Bundy, R. M., Abdulla, H. A. N. N., Hatcher, P. G., Biller, D. V., Buck, K. N., and Barbeau, K. A.: Iron-binding ligands and humic substances in the San Francisco Bay estuary and estuarine-influenced shelf regions of coastal California, Mar. Chem., 173, 183–194, https://doi.org/10.1016/j.marchem.2014.11.005, 2015.
Carmack, E. C., Macdonald, R. W., Perkin, R. G., McLaughlin, F. A., and Pearson, R. J.: Evidence for warming of Atlantic water in the southern Canadian Basin of the Arctic Ocean: Results from the Larsen-93 expedition, Geophys. Res. Lett., 22, 1061–1064, 1995.
Charette, M. A., Kipp, L. E., Jensen, L. T., Dabrowski, J. S., Whitmore, L. M., Fitzsimmons, J. N., Williford, T., Ulfsbo, A., Jones, E., Bundy, R. M., and Vivancos, S. M.: The Transpolar Drift as a Source of Riverine and Shelf‐Derived Trace Elements to the Central Arctic Ocean, J. Geophys. Res.-Oceans, 125, e2019JC015920, https://doi.org/10.1029/2019JC015920, 2020.
Chase, Z., Strutton, P. G., and Hales, B.: Iron links river runoff and shelf width to phytoplankton biomass along the US West Coast, Geophys. Res. Lett., 34, L04607, https://doi.org/10.1029/2006GL028069, 2007.
Colombo, M., Jackson, S. L., Cullen, J. T., and Orians, K. J.: Dissolved iron and manganese in the Canadian Arctic Ocean: On the biogeochemical processes controlling their distributions, Geochim. Cosmochim. Ac., 277, 150–174, 2020.
Cooper, L. W., Whitledge, T. E., Grebmeier, J. M., and Weingartner, T.: The nutrient, salinity, and stable oxygen isotope composition of Bering and Chukchi Seas waters in and near the Bering Strait, J. Geophys. Res.-Oceans, 102, 12563–12573, 1997.
Cooper, L. W., Benner, R., McClelland, J. W., Peterson, B. J., Holmes, R. M., Raymond, P. A., Hansell, D. A., Grebmeier, J. M., and Codispoti, L. A.: Linkages among runoff, dissolved organic carbon, and the stable oxygen isotope composition of seawater and other water mass indicators in the Arctic Ocean, J. Geophys. Res.-Biogeo., 110, G02013, https://doi.org/10.1029/2005JG000031, 2005.
Cottrell, M. T. and Kirchman, D. L.: Photoheterotrophic microbes in the Arctic Ocean in summer and winter, Appl. Environ. Microb., 75, 4958–4966, 2009.
Cowen, J. P. and Bruland, K. W.: Metal deposits associated with bacteria: implications for Fe and Mn marine biogeochemistry, Deep-Sea Res. Pt. A, 32, 253–272, 1985.
Cutter, G. A. and Bruland, K. W.: Rapid and noncontaminating sampling system for trace elements in global ocean surveys, Limnol. Oceanogr.-Meth., 10, 425–436, https://doi.org/10.4319/lom.2012.10.425, 2012.
Del Vecchio, R. and Blough, N. V: On the origin of the optical properties of humic substances, Environ. Sci. Technol., 38, 3885–3891, 2004.
Doxaran, D., Devred, E., and Babin, M.: A 50 % increase in the mass of terrestrial particles delivered by the Mackenzie River into the Beaufort Sea (Canadian Arctic Ocean) over the last 10 years, Biogeosciences, 12, 3551–3565, https://doi.org/10.5194/bg-12-3551-2015, 2015.
Doxey, A. C., Kurtz, D. A., Lynch, M. D. J., Sauder, L. A., and Neufeld, J. D.: Aquatic metagenomes implicate Thaumarchaeota in global cobalamin production, ISME J., 9, 461–471, https://doi.org/10.1038/ismej.2014.142, 2015.
Drake, T. W., Tank, S. E., Zhulidov, A. V, Holmes, R. M., Gurtovaya, T., and Spencer, R. G. M.: Increasing alkalinity export from large Russian Arctic rivers, Environ. Sci. Technol., 52, 8302–8308, 2018.
Dulaquais, G., Boye, M., Middag, R., Owens, S., Puigcorbé, V., Buesseler, K. O., Masqué, P., de Baar, H. J. W., and Carton, X.: Contrasting biochemical cycles of cobalt in the surface western Atlantic ocean, Global Biogeochem. Cy., 28, 1387–1412, https://doi.org/10.1002/2014GB004903, 2014a.
Dulaquais, G., Boye, M., Rijkenberg, M. J. A., and Carton, X.: Physical and remineralization processes govern the cobalt distribution in the deep western Atlantic Ocean, Biogeosciences, 11, 1561–1580, https://doi.org/10.5194/bg-11-1561-2014, 2014b.
Dulaquais, G., Planquette, H., L'Helguen, S., Rijkenberg, M. J. A., and Boye, M.: The biogeochemistry of cobalt in the Mediterranean Sea, Global Biogeochem. Cy., 31, 377–399, https://doi.org/10.1002/2016GB005478, 2017.
Gascard, J., Festy, J., le Goff, H., Weber, M., Bruemmer, B., Offermann, M., Doble, M., Wadhams, P., Forsberg, R., and Hanson, S.: Exploring Arctic transpolar drift during dramatic sea ice retreat, EOS T. Am. Geophys. Un., 89, 21–22, 2008.
Hawco, N. J. and Saito, M. A.: Competitive inhibition of cobalt uptake by zinc and manganese in a pacific Prochlorococcus strain: Insights into metal homeostasis in a streamlined oligotrophic cyanobacterium, Limnol. Oceanogr., 63, 2229–2249, 2018.
Hawco, N. J., Ohnemus, D. C., Resing, J. A., Twining, B. S., and Saito, M. A.: A dissolved cobalt plume in the oxygen minimum zone of the eastern tropical South Pacific, Biogeosciences, 13, 5697–5717, https://doi.org/10.5194/bg-13-5697-2016, 2016.
Hawco, N. J., Lam, P. J., Lee, J. M., Ohnemus, D. C., Noble, A. E., Wyatt, N. J., Lohan, M. C., and Saito, M. A.: Cobalt scavenging in the mesopelagic ocean and its influence on global mass balance: Synthesizing water column and sedimentary fluxes, Mar. Chem., 201, 151–166, https://doi.org/10.1016/j.marchem.2017.09.001, 2018.
Hawco, N. J., McIlvin, M. M., Bundy, R. M., Tagliabue, A., Goepfert, T. J., Moran, D. M., Valentin-Alvarado, L., DiTullio, G. R., and Saito, M. A.: Minimal cobalt metabolism in the marine cyanobacterium Prochlorococcus, P. Natl. Acad. Sci., 117, 15740–15747, https://doi.org/10.1073/pnas.2001393117, 2020.
Heal, K.: The Power and Promise of Direct Measurements of Metabolites in Marine Systems, Doctoral dissertation, University of Washington, Seattle, WA, 2018.
Heal, K. R., Qin, W., Ribalet, F., Bertagnolli, A. D., Coyote-Maestas, W., Hmelo, L. R., Moffett, J. W., Devol, A. H., Armbrust, E. V., and Stahl, D. A.: Two distinct pools of B12 analogs reveal community interdependencies in the ocean, P. Natl. Acad. Sci. USA, 114, 364–369, 2017.
Holmes, R. M., McClelland, J. W., Tank, S. E., Spencer, R. G., and Shiklomanov, A. I.: Arctic Great Rivers Observatory Water Quality Dataset, available at: https://www.arcticgreatrivers.org/data (last access: 30 June 2020), 2018.
Jensen, L., Wyatt, N., Twining, B., Rauschenberg, S., Landing, W., Sherrell, R., and Fitzsimmons, J.: Biogeochemical cycling of dissolved zinc in the Western Arctic (Arctic GEOTRACES GN01), Global Biogeochem. Cy., 33, 343–369, 2019.
Johannessen, O. M., Bengtsson, L., Miles, M. W., Kuzmina, S. I., Semenov, V. A., Alekseev, G. V, Nagurnyi, A. P., Zakharov, V. F., Bobylev, L. P., and Pettersson, L. H.: Arctic climate change: observed and modelled temperature and sea-ice variability, Tellus A, 56, 328–341, 2004.
Johnson, K. S., Berelson, W. M., Coale, K. H., Coley, T. L., Elrod, V. A., Fairey, W. R., Iams, H. D., Kilgore, T. E., and Nowicki, J. L.: Mangense flux from continental-margin sediments in a transect through the oxygen minimum, Science, 257, 1242–1245, https://doi.org/10.1126/science.257.5074.1242, 1992.
Jorgenson, M. T., Shur, Y. L., and Pullman, E. R.: Abrupt increase in permafrost degradation in Arctic Alaska, Geophys. Res. Lett., 33, L02503, https://doi.org/10.1029/2005GL024960, 2006.
Kellogg, M. M., McIlvin, M. R., Vedamati, J., Twining, B. S., Moffett, J. W., Marchetti, A., Moran, D. M., and Saito, M. A.: Efficient zinc/cobalt inter-replacement in northeast Pacific diatoms and relationship to high surface dissolved Co : Zn ratios, Limnol. Oceanogr., https://doi.org/10.1002/lno.11471, online first, 2020.
Kipp, L. E., Charette, M. A., Moore, W. S., Henderson, P. B., and Rigor, I. G.: Increased fluxes of shelf-derived materials to the central Arctic Ocean, Sci. Adv., 4, eaao1302, https://doi.org/10.1126/sciadv.aao1302, 2018.
Klunder, M. B., Bauch, D., Laan, P., de Baar, H. J. W., van Heuven, S., and Ober, S.: Dissolved iron in the Arctic shelf seas and surface waters of the central Arctic Ocean: Impact of Arctic river water and ice-melt, J. Geophys. Res., 117, C01027, https://doi.org/10.1029/2011jc007133, 2012.
Landing, W. M., Cutter, G., and Kadko, D. C.: Bottle data from the GEOTRACES Clean Carousel sampling system (GTC) on the Arctic Section cruise (HLY1502) from August to October 2015 (US GEOTRACES Arctic project), Biological and Chemical Oceanography Data Management Office (BCO-DMO), available at: https://www.bco-dmo.org/project/638812 (last access: 27 September 2020), 2019.
Lane, T. W. and Morel, F. M. M.: Regulation of carbonic anhydrase expression by zinc, cobalt, and carbon dioxide in the marine diatom Thalassiosira weissflogii, Plant Physiol., 123, 345–352, 2000.
Le Bras, I. A., Yashayaev, I., and Toole, J. M.: Tracking Labrador Sea water property signals along the deep western boundary current, J. Geophys. Res.-Oceans, 122, 5348–5366, 2017.
Lee, J.-M., Heller, M. I., and Lam, P. J.: Size distribution of particulate trace elements in the US GEOTRACES Eastern Pacific Zonal Transect (GP16), Mar. Chem., 201, 108–123, 2018.
Lionheart, R.: Exploring the ocean microbiome: quantified cobalamin production in pelagic bacteria using liquid chromatography and mass spectrometry, Doctoral dissertation, University of Washington, Seattle, WA, 2017.
Marsay, C. M., Aguilar-Islas, A., Fitzsimmons, J. N., Hatta, M., Jensen, L. T., John, S. G., Kadko, D., Landing, W. M., Lanning, N. T., Morton, P. L., Pasqualini, A., Rauschenberg, S., Sherrell, R. M., Shiller, A. M., Twining, B. S., Whitmore, L. M., Zhang, R., and Buck, C. S.: Dissolved and particulate trace elements in late summer Arctic melt ponds, Mar. Chem., 204, 70–85, https://doi.org/10.1016/j.marchem.2018.06.002, 2018.
Martin, J. H., Gordon, R. M., Fitzwater, S., and Broenkow, W. W.: VERTEX: phytoplankton/iron studies in the Gulf of Alaska, Deep-Sea Res. Pt. A, 36, 649–680, 1989.
März, C., Stratmann, A., Matthiessen, J., Meinhardt, A. K., Eckert, S., Schnetger, B., Vogt, C., Stein, R., and Brumsack, H. J.: Manganese-rich brown layers in Arctic Ocean sediments: Composition, formation mechanisms, and diagenetic overprint, Geochim. Cosmochim. Ac., 75, 7668–7687, https://doi.org/10.1016/j.gca.2011.09.046, 2011.
McManus, J., Berelson, W. M., Severmann, S., Johnson, K. S., Hammond, D. E., Roy, M., and Coale, K. H.: Benthic manganese fluxes along the Oregon-California continental shelf and slope, Cont. Shelf Res., 43, 71–85, https://doi.org/10.1016/j.csr.2012.04.016, 2012.
Middag, R., De Baar, H. J. W., Laan, P., and Klunder, M. B.: Fluvial and hydrothermal input of manganese into the Arctic Ocean, Geochim. Cosmochim. Ac., 75, 2393–2408, 2011.
Moffett, J. W. and Ho, J.: Oxidation of cobalt and manganese in seawater via a common microbially catalyzed pathway, Geochim. Cosmochim. Ac., 60, 3415–3424, https://doi.org/10.1016/0016-7037(96)00176-7, 1996.
Moore, C. M., Mills, M. M., Arrigo, K. R., Berman-Frank, I., Bopp, L., Boyd, P. W., Galbraith, E. D., Geider, R. J., Guieu, C., Jaccard, S. L., Jickells, T. D., La Roche, J., Lenton, T. M., Mahowald, N. M., Marañón, E., Marinov, I., Moore, J. K., Nakatsuka, T., Oschlies, A., Saito, M. A., Thingstad, T. F., Tsuda, A., Ulloa, O., Maranon, E., Marinov, I., Moore, J. K., Nakatsuka, T., Oschlies, A., Saito, M. A., Thingstad, T. F., Tsuda, A., and Ulloa, O.: Processes and patterns of oceanic nutrient limitation, Nat. Geosci., 6, 701–710, https://doi.org/10.1038/ngeo1765, 2013.
Myers, P. G.: Impact of freshwater from the Canadian Arctic Archipelago on Labrador Sea Water formation, Geophys. Res. Lett., 32, L06605, https://doi.org/10.1029/2004GL022082, 2005.
Newton, R., Schlosser, P., Mortlock, R., Swift, J., and MacDonald, R.: Canadian Basin freshwater sources and changes: Results from the 2005 Arctic Ocean Section, J. Geophys. Res.-Oceans, 118, 2133–2154, 2013.
Nixon, R. L., Jackson, S. L., Cullen, J. T., and Ross, A. R. S.: Distribution of copper-complexing ligands in Canadian Arctic waters as determined by immobilized copper (II)-ion affinity chromatography, Mar. Chem., 215, 103673, https://doi.org/10.1016/j.marchem.2019.103673, 2019.
Noble, A. E.: Influences on the oceanic biogeochemical cycling of the hybrid-type metals, cobalt, iron, and manganese, Doctoral dissertation, Massachusetts Institute of Technology, 296 pp., 2012.
Noble, A. E., Saito, M. A., Maiti, K., and Benitez-Nelson, C. R.: Cobalt, manganese, and iron near the Hawaiian Islands: A potential concentrating mechanism for cobalt within a cyclonic eddy and implications for the hybrid-type trace metals, Deep-Sea Res. Pt. II, 55, 1473–1490, 2008.
Noble, A. E., Lamborg, C. H., Ohnemus, D. C., Lam, P. J., Goepfert, T. J., Measures, C. I., Frame, C. H., Casciotti, K. L., DiTullio, G. R., Jennings, J., and Saito, M. A.: Basin-scale inputs of cobalt, iron, and manganese from the Benguela-Angola front to the South Atlantic Ocean, Limnol. Oceanogr., 57, 989–1010, https://doi.org/10.4319/lo.2012.57.4.0989, 2012.
Noble, A. E., Ohnemus, D. C., Hawco, N. J., Lam, P. J., and Saito, M. A.: Coastal sources, sinks and strong organic complexation of dissolved cobalt within the US North Atlantic GEOTRACES transect GA03, Biogeosciences, 14, 2715–2739, https://doi.org/10.5194/bg-14-2715-2017, 2017.
Ohnemus, D. C., Auro, M. E., Sherrell, R. M., Lagerström, M., Morton, P. L., Twining, B. S., Rauschenberg, S., and Lam, P. J.: Laboratory intercomparison of marine particulate digestions including Piranha: a novel chemical method for dissolution of polyethersulfone filters, Limnol. Oceanogr.-Meth., 12, 530–547, 2014.
Panzeca, C., Beck, A. J., Leblanc, K., Taylor, G. T., Hutchins, D. A., and Sanudo-Wilhelmy, S. A.: Potential cobalt limitation of vitamin B12 synthesis in the North Atlantic Ocean, Global Biogeochem. Cy., 22, GB2029, https://doi.org/10.1029/2007GB003124, 2008.
Resing, J. A. and Mottl, M. J.: Determination of manganese in seawater using flow injection analysis with on-line preconcentration and spectrophotometric detection, Anal. Chem., 64, 2682–2687, 1992.
Saito, M. A. and Moffett, J. W.: Complexation of cobalt by natural organic ligands in the Sargasso Sea as determined by a new high-sensitivity electrochemical cobalt speciation method suitable for open ocean work, Mar. Chem., 75, 49–68, https://doi.org/10.1016/s0304-4203(01)00025-1, 2001.
Saito, M. A. and Rauch, S.: Dataset: GN01 Dissolved and Labile Cobalt, available at: https://www.bco-dmo.org/dataset/722472, last access: 25 August 2020.
Saito, M. A., Moffett, J. W., Chisholm, S. W., and Waterbury, J. B.: Cobalt limitation and uptake in Prochlorococcus, Limnol. Oceanogr., 47, 1629–1636, 2002.
Saito, M. A., Moffett, J. W., and DiTullio, G. R.: Cobalt and nickel in the Peru upwelling region: A major flux of labile cobalt utilized as a micronutrient, Global Biogeochem. Cy., 18, 1–14, https://doi.org/10.1029/2003GB002216, 2004.
Saito, M. A., Rocap, G., and Moffett, J. W.: Production of cobalt binding ligands in a Synechococcus feature at the Costa Rica upwelling dome, Limnol. Oceanogr., 50, 279–290, 2005.
Saito, M. A., Goepfert, T. J., Noble, A. E., Bertrand, E. M., Sedwick, P. N., and DiTullio, G. R.: A seasonal study of dissolved cobalt in the Ross Sea, Antarctica: micronutrient behavior, absence of scavenging, and relationships with Zn, Cd, and P, Biogeosciences, 7, 4059–4082, https://doi.org/10.5194/bg-7-4059-2010, 2010.
Saito, M. A., Noble, A. E., Hawco, N., Twining, B. S., Ohnemus, D. C., John, S. G., Lam, P., Conway, T. M., Johnson, R., Moran, D., and McIlvin, M.: The acceleration of dissolved cobalt's ecological stoichiometry due to biological uptake, remineralization, and scavenging in the Atlantic Ocean, Biogeosciences, 14, 4637–4662, https://doi.org/10.5194/bg-14-4637-2017, 2017.
Schlitzer, R., Anderson, R. F., Dodas, E. M., Lohan, M., Geibert, W., Tagliabue, A., Bowie, A., Jeandel, C., Maldonado, M. T., Landing, W. M., and others: The GEOTRACES intermediate data product 2017, Chem. Geol., 493, 210–223, 2018.
Screen, J. A. and Simmonds, I.: The central role of diminishing sea ice in recent Arctic temperature amplification, Nature, 464, 1334, 2010.
Serreze, M. C. and Barry, R. G.: Processes and impacts of Arctic amplification: A research synthesis, Global Planet. Change, 77, 85–96, 2011.
Shelley, R. U., Sedwick, P. N., Bibby, T. S., Cabedo-Sanz, P., Church, T. M., Johnson, R. J., Macey, A. I., Marsay, C. M., Sholkovitz, E. R., and Ussher, S. J.: Controls on dissolved cobalt in surface waters of the Sargasso Sea: Comparisons with iron and aluminum, Global Biogeochem. Cy., 26, GB2020, https://doi.org/10.1029/2011GB004155, 2012.
Slagter, H. A., Reader, H. E., Rijkenberg, M. J. A., van der Loeff, M. R., de Baar, H. J. W., and Gerringa, L. J. A.: Organic Fe speciation in the Eurasian Basins of the Arctic Ocean and its relation to terrestrial DOM, Mar. Chem., 197, 11–25, https://doi.org/10.1016/j.marchem.2017.10.005, 2017.
Slagter, H. A., Laglera, L. M., Sukekava, C., and Gerringa, L. J. A.: Fe-binding organic ligands in the humic-rich TransPolar Drift in the surface Arctic Ocean using multiple voltammetric methods, J. Geophys. Res.-Oceans, 124, 1491–1508, 2019.
Steele, M. and Boyd, T.: Retreat of the cold halocline layer in the Arctic Ocean, J. Geophys. Res.-Oceans, 103, 10419–10435, 1998.
Steele, M., Morison, J., Ermold, W., Rigor, I., Ortmeyer, M., and Shimada, K.: Circulation of summer Pacific halocline water in the Arctic Ocean, J. Geophys. Res.-Oceans, 109, C02027, https://doi.org/10.1029/2003JC002009, 2004.
Stroeve, J. C., Serreze, M. C., Holland, M. M., Kay, J. E., Malanik, J., and Barrett, A. P.: The Arctic's rapidly shrinking sea ice cover: a research synthesis, Climatic Change, 110, 1005–1027, 2012.
Sunda, W. G. and Huntsman, S. A.: Effect of sunlight on redox cycles of manganese in the southwestern Sargasso Sea, Deep-Sea Res. Pt. A., 35, 1297–1317, 1988.
Sunda, W. G. and Huntsman, S. A.: Cobalt and zinc interreplacement in marine phytoplankton: biological and geochemical implications, Limnol. Oceanogr., 40, 1404–1417, 1995.
Swift, J. H., Takahashi, T., and Livingston, H. D.: The contribution of the Greenland and Barents seas to the deep water of the Arctic Ocean, J. Geophys. Res.-Oceans, 88, 5981–5986, 1983.
Talley, L. D.: Freshwater transport estimates and the global overturning circulation: Shallow, deep and throughflow components, Prog. Oceanogr., 78, 257–303, 2008.
Tagliabue, A., Hawco, N. J., Bundy, R. M., Landing, W. M., Milne, A., Morton, P. L., and Saito, M. A.: The role of external inputs and internal cycling in shaping the global ocean cobalt distribution: insights from the first cobalt biogeochemical model, Global Biogeochem. Cy., 32, 1–23, https://doi.org/10.1002/2017GB005830, 2018.
Tank, S. E., Striegl, R. G., McClelland, J. W., and Kokelj, S. V: Multi-decadal increases in dissolved organic carbon and alkalinity flux from the Mackenzie drainage basin to the Arctic Ocean, Environ. Res. Lett., 11, 54015, https://doi.org/10.1088/1748-9326/11/5/054015, 2016.
Tebo, B. M., Bargar, J. R., Clement, B. G., Dick, G. J., Murray, K. J., Parker, D., Verity, R., and Webb, S. M.: Biogenic manganese oxides: properties and mechanisms of formation, Annu. Rev. Earth Planet. Sc., 32, 287–328, 2004.
Thuróczy, C.-E., Boye, M., and Losno, R.: Dissolution of cobalt and zinc from natural and anthropogenic dusts in seawater, Biogeosciences, 7, 1927–1936, https://doi.org/10.5194/bg-7-1927-2010, 2010.
Tonnard, M., Planquette, H., Bowie, A. R., van der Merwe, P., Gallinari, M., Desprez de Gésincourt, F., Germain, Y., Gourain, A., Benetti, M., Reverdin, G., Tréguer, P., Boutorh, J., Cheize, M., Lacan, F., Menzel Barraqueta, J.-L., Pereira-Contreira, L., Shelley, R., Lherminier, P., and Sarthou, G.: Dissolved iron in the North Atlantic Ocean and Labrador Sea along the GEOVIDE section (GEOTRACES section GA01), Biogeosciences, 17, 917–943, https://doi.org/10.5194/bg-17-917-2020, 2020.
Toohey, R. C., Herman-Mercer, N. M., Schuster, P. F., Mutter, E. A., and Koch, J. C.: Multidecadal increases in the Yukon River Basin of chemical fluxes as indicators of changing flowpaths, groundwater, and permafrost, Geophys. Res. Lett., 43, 12–120, 2016.
Tovar-Sánchez, A., Sañudo-Wilhelmy, S. A., and Flegal, A. R.: Temporal and spatial variations in the biogeochemical cycling of cobalt in two urban estuaries: Hudson River Estuary and San Francisco Bay, Estuar. Coast. Shelf Sci., 60, 717–728, 2004.
Twining, B. S., Rauschenberg, S., Morton, P. L., Ohnemus, D. C., and Lam, P. J.: Comparison of particulate trace element concentrations in the North Atlantic Ocean as determined with discrete bottle sampling and in situ pumping, Deep-Sea Res. Pt. II, 116, 273–282, https://doi.org/10.1016/j.dsr2.2014.11.005, 2015.
Twining, B. S., Morton, P. L., and Salters, V. J.: Trace element concentrations (labile and total measurements) in particles collected with GO-Flo bottles and analyzed with ICP-MS from the US GEOTRACES Arctic cruise (HLY1502; GNo1) from August to October 2015, Biol. Chem. Oceanogr. Data Manag. Off., https://doi.org/10.1575/1912/bco-dmo.771474.2, 2019.
van der Loeff, M., Kipp, L., Charette, M. A., Moore, W. S., Black, E., Stimac, I., Charkin, A., Bauch, D., Valk, O., Karcher, M., Krumpen, T., Casacuberta, N., Smethie, W., and Rember, R.: Radium isotopes across the Arctic Ocean show time scales of water mass ventilation and increasing shelf inputs, J. Geophys. Res.-Oceans, 123, 4853–4873, 2018.
Waleron, M., Waleron, K., Vincent, W. F., and Wilmotte, A.: Allochthonous inputs of riverine picocyanobacteria to coastal waters in the Arctic Ocean, FEMS Microbiol. Ecol., 59, 356–365, 2007.
Wheeler, P. A., Watkins, J. M., and Hansing, R. L.: Nutrients, organic carbon and organic nitrogen in the upper water column of the Arctic Ocean: implications for the sources of dissolved organic carbon, Deep-Sea Res. Pt. II, 44, 1571–1592, 1997.
Yang, R. J. and Van Den Berg, C. M. G.: Metal Complexation by Humic Substances in Seawater, Environ. Sci. Technol., 43, 7192–7197, https://doi.org/10.1021/es900173w, 2009.
Yee, D. and Morel, F. M. M.: In vivo substitution of zinc by cobalt in carbonic anhydrase of a marine diatom, Limnol. Oceanogr., 41, 573–577, 1996.
Zakhia, F., Jungblut, A.-D., Taton, A., Vincent, W. F., and Wilmotte, A.: Cyanobacteria in cold ecosystems, in: Psychrophiles: from biodiversity to biotechnology, edited by: Margesin, R., Schinner, F., Marx, J. C., and Gerday, C., 121–135, Springer, Berlin, Heidelberg, https://doi.org/10.1007/978-3-540-74335-4_8, 2008.
Zhang, H., Van Den Berg, C. M. G., and Wollast, R.: The determination of interactions of cobalt (II) with organic compounds in seawater using cathodic stripping voltammetry, Mar. Chem., 28, 285–300, 1990.
Zhang, Y., Rodionov, D. A., Gelfand, M. S., and Gladyshev, V. N.: Comparative genomic analyses of nickel, cobalt and vitamin B12 utilization, BMC Genomics, 10, 78, https://doi.org/10.1186/1471-2164-10-78, 2009.