the Creative Commons Attribution 4.0 License.
the Creative Commons Attribution 4.0 License.
 | 08 Dec 2020
Uncovering chemical signatures of salinity gradients through compositional analysis of protein sequences
Miao Yu
Jingqiang Tan
Prediction of the direction of change of a system under specified environmental conditions is one reason for the widespread utility of thermodynamic models in geochemistry. However, thermodynamic influences on the chemical compositions of proteins in nature have remained enigmatic despite much work that demonstrates the impact of environmental conditions on amino acid frequencies. Here, we present evidence that the dehydrating effect of salinity is detectable as chemical differences in protein sequences inferred from (1) metagenomes and metatranscriptomes in regional salinity gradients and (2) differential gene and protein expression in microbial cells under hyperosmotic stress. The stoichiometric hydration state (), derived from the number of water molecules in theoretical reactions to form proteins from a particular set of basis species (glutamine, glutamic acid, cysteine, O2, H2O), decreases along salinity gradients, including the Baltic Sea and Amazon River and ocean plume, and decreases in particle-associated compared to free-living fractions. However, the proposed metric does not respond as expected for hypersaline environments. Analysis of data compiled for hyperosmotic stress experiments under controlled laboratory conditions shows that differentially expressed proteins are on average shifted toward lower . Notably, the dehydration effect is stronger for most organic solutes compared to NaCl. This new method of compositional analysis can be used to identify possible thermodynamic effects in the distribution of proteins along chemical gradients at a range of scales from microbial mats to oceans.
- Article
(2284 KB) - Full-text XML
-
Supplement
(258 KB) - BibTeX
- EndNote


How microbial populations adapt to environmental gradients is a major challenge at the intersection of geochemistry, microbiology, and biochemistry. Patterns of amino acid usage in proteins are important indicators of microbial adaptation, and amino acid composition at the genome level is well known to depend on growth temperature (Zeldovich et al., 2007). Furthermore, measures of evolutionary distance and community composition based on protein sequences predicted from metagenomic sequencing are strongly associated with environmental temperature and pH (Alsop et al., 2014). It is widely acknowledged that the effect of amino acid substitutions on the structural stability of proteins is a major factor affecting amino acid usage in thermophiles (Sterner and Liebl, 2001; Zeldovich et al., 2007). Similarly, a large body of work has demonstrated amino acid signatures associated with proteins from halophilic organisms (Kunin et al., 2008; Paul et al., 2008; Oren, 2013; Boyd et al., 2014). The most common interpretation of these trends is that particular amino acid substitutions are selected through evolution to increase the stability and solubility of the folded conformation and enhance other structural properties such as flexibility (Paul et al., 2008).
An interrelated approach to interpreting patterns of amino acid composition is based on the energetics of amino acid synthesis. Energetic costs in terms of ATP (adenosine triphosphate) requirements have been used to model protein expression levels in bacterial and yeast cells (Akashi and Gojobori, 2002; Wagner, 2005). Although ATP demands depend on environmental conditions (Akashi and Gojobori, 2002), a limitation of ATP-based models is that they are derived for specific biosynthetic pathways, such as whether cells are grown in respiratory or fermentative (i.e., aerobic or anaerobic) conditions (Wagner, 2005). A different class of models, based on thermodynamic analysis of the overall Gibbs energy of reactions to synthesize metabolites from inorganic precursors, quantifies the energetics of the reactions in terms of temperature, pressure, and chemical activities of all the species in the reactions, including those that define pH and oxidation–reduction potential (Shock et al., 2010). Notably, the overall Gibbs energies for amino acid synthesis become more favorable but to a different extent for each amino acid, between cold, oxidizing seawater and hot, reducing hydrothermal solution (Amend and Shock, 1998). A recent systems biology study demonstrates trade-offs between Gibbs energy of alternative pathways for amino acid synthesis and cofactor use efficiency (which affects ATP costs) in the model organism Escherichia coli and suggests that pathway thermodynamics play a role in thermophilic adaptation (Du et al., 2018). The oxidation state of proteins as well as lipids has been shown to be associated with oxidation–reduction (redox) gradients in a hot spring (Dick and Shock, 2011; Boyer et al., 2020), but so far energetic models have not been broadly adopted as a tool for relating metagenomic and geochemical data. This may be because few studies have asked whether specific changes in the chemical composition of biomolecules reflect specific environmental conditions.
To help close this gap, here we use compositional analysis of protein sequences to identify chemical signatures of two types of environmental conditions: redox and salinity gradients. In a previous study (Dick et al., 2019), we compared one broad class of geochemical conditions (redox gradients) with one compositional metric for proteins (carbon oxidation state). Here, we expand the geobiochemical framework to two dimensions by considering another set of environments (salinity gradients) and another compositional metric (stoichiometric hydration state). Thermodynamic considerations predict that redox gradients supply a driving force for changes in the oxidation state of biomolecules (similar reasoning applies to the oxygen content of proteins; Acquisti et al., 2007), while salinity gradients, through the dehydrating potential associated with osmotic effects, exert a force that selectively alters the hydration state of biomolecules.
To test these predictions, we used two compositional metrics: the carbon oxidation state (ZC) and stoichiometric hydration state (). ZC is computed from the chemical formulas of organic molecules and takes values between the extremes of −4 for CH4 and +4 for CO2, although the range for particular classes of biomolecules is much smaller (Amend et al., 2013). is derived from the number of water molecules in theoretical formation reactions of proteins from basis species (Dick, 2016, 2017). Through the compositional analysis of representative metagenomic and metatranscriptomic datasets, we show that ZC and are most closely aligned with environmental redox and salinity gradients, respectively. These findings apply to freshwater and marine environments, but trends for hypersaline environments deviate from the thermodynamic predictions, most likely due to evolutionary optimizations of hydrophobicity and isoelectric point to stabilize the structures of proteins in halophilic organisms.
In this study we use compositional analysis to uncover environmental imprints in protein sequences. Analysis of compositional data is used by geochemists to study processes such as water–rock interaction and ore deposition and is often one of the first steps in constructing thermodynamic models, but its application to living systems is relatively uncommon. Therefore, it is important to describe the conceptual basis for our methods. To do this, we identified six areas of concern summarized as (1) intracellular or environmental conditions, (2) amino acids or atoms, (3) condensation or theoretical formation reactions, (4) chemical composition or conformational stability, (5) oxidation and hydration state or temperature and pH, and (6) mathematical or biosynthetic models.
A first concern is that intracellular conditions are maintained within physiological ranges, so the influence of external conditions on the composition of microbial biomolecules may be limited. However, cell membranes are permeable to uncharged species such as hydrogen (Slonczewski et al., 2009), supporting the argument that the oxidation state of the cytoplasm and therefore the energetics of metabolic reactions are influenced by the external environment (Poudel et al., 2018; Canovas and Shock, 2020). Likewise, oxygen diffuses rapidly through lipid membranes, depending on their composition and structure, and rates of diffusion increase with temperature (Möller et al., 2016). Cell membranes are also permeable to water (Record et al., 1998). For E. coli, which grows most rapidly at about 0.3 Osm L−1 (osmolarity), increasing the extracellular osmotic strength from 0.1 to 1.0 Osm L−1 (approximately the osmotic concentration of seawater; BioNumbers BNID 100802 (Milo et al., 2010)) reduces the amount of free cytoplasmic water by more than half (Record et al., 1998). Halophiles, which thrive at even higher salinities, accumulate inorganic salts or organic solutes to maintain osmotic balance with the environment (Garner and Burg, 1994; Oren, 2013). The result is that, with few exceptions, intracellular conditions must be isosmotic with the environment, or somewhat higher, to maintain turgor pressure (Gunde-Cimerman et al., 2018). Water activity is lower in more concentrated solutions, and intracellular water activity estimated from freezing point and cell composition data closely follows that of the growth medium but is often offset to lower values (Chirife et al., 1981), perhaps due to macromolecular crowding effects (Garner and Burg, 1994). To summarize, high osmotic strength causes a decrease in hydration potential, measured as water activity, both outside and inside cells.
This brief review suggests that oxidation and hydration potentials in cell interiors, at least under experimental conditions, are influenced by (but not equal to) environmental conditions. Ideally, we would like to compare the compositions of biomolecules to conditions actually measured inside cells or in the immediate surroundings of cells, but these measurements are generally not available for microbial communities in their natural environments; thus, we make comparisons with large-scale geochemical gradients, except for different layers of the Guerrero Negro microbial mat, where metagenomic and chemical data are available on the scale of millimeters.
Second, previous authors have emphasized the importance of changes in elemental stoichiometry – that is, atomic composition – and not only amino acid composition in the molecular evolution of proteins (Baudouin-Cornu et al., 2001). Although stoichiometric predictions are amenable to experimental tests, such as the long-term evolution of E. coli in the laboratory (Turner et al., 2017), the omission of a major bioelement, hydrogen, and the oxidation state of organic matter from most stoichiometric models (Karl and Grabowski, 2017) means that there are also significant opportunities for theory development. Because redox reactions are inherent in many aspects of metabolism, while hydration and dehydration reactions are essential for the synthesis of biomacromolecules (Braakman and Smith, 2013), our approach is shaped by the assumption that O2 and H2O are two primary components that link environmental conditions to the energetics of biomolecular synthesis.
The third point follows from the previous one. The polymerization of amino acids is a condensation reaction that releases one H2O per bond formed, independent of the particular amino acids that are involved. By contrast, our analysis depends crucially on the concept of a “formation reaction”, which in the thermodynamic literature represents the composition of a chemical species, either in terms of elements (Warn and Peters, 1996) or in terms of other species (May and Rowland, 2018). When these other species are restricted in number to the minimum needed to represent the composition of all possible species in the system, they constitute a set of “basis species”, which can be thought of as the building blocks of the system, similar to the concept of thermodynamic components (Anderson, 2005). Therefore, a formation reaction from basis species is a mass-balanced (but nonunique) stoichiometric representation of the chemical composition of the protein. This type of reaction in general does not correspond to amino acid biosynthesis or polymerization, so to avoid confusion, we refer to these formation reactions as “theoretical formation reactions”; the number of water molecules in the theoretical formation reactions, normalized by the protein length, is the “stoichiometric hydration state”.
From a mechanistic standpoint, an analysis using any set of basis species is inadequate, since the number of basis species (five, corresponding to the elements C, H, N, O, and S) is smaller than the number of biochemical precursors and inorganic species that are actually involved in amino acid synthesis (Du et al., 2018). The use of O2, H2O, and other basis species to represent the composition of proteins reflects the hypothesis that they are conjugate to thermodynamically meaningful descriptive variables (specifically, chemical potentials) even if they are not directly involved in the biosynthetic mechanisms for amino acids. The projection of amino acid composition (20-D) into the compositional space represented by basis species (5-D) is a type of dimensionality reduction, but the variables are chosen based on a physicochemical hypothesis, unlike principal components analysis (PCA) or other unsupervised methods, where the projection is determined by the data.
A fourth concern is that this analysis is based on the hypothesis that thermodynamic forces affect the chemical compositions of proteins over evolutionary time, which is different from the more common hypothesis of optimization of structural stability. Thermodynamic models define the “cost” of a protein as a function of not only amino acid composition but also environmental conditions. Conceptually, this follows from Le Chatelier's principle, in that increasing the chemical activity of a reactant (on the left-hand side of a reaction) drives the reaction toward the products. Stated in more general terms, the overall Gibbs energy of a reaction depends on the activities of species in the reaction (Shock et al., 2010; Amend and LaRowe, 2019). Consider two proteins with different amino acid compositions and therefore also different chemical compositions and theoretical formation reactions, which should be normalized by the number of residues in order to compare proteins of different length. The formation of the protein with more water as a reactant is theoretically favored by increasing the water activity, whereas the formation of the protein with more oxygen as a reactant is favored by increasing the oxygen activity. The water and oxygen activity are thermodynamic measures of hydration and oxidation potential and can be converted to other scales, such as oxidation–reduction potential (ORP).
This reasoning provides the theoretical justification for using chemical composition as an indicator of molecular adaptation to specific environmental conditions but does not replace interpretations based on structural considerations. Halophilic organisms exhibit well documented patterns of amino acid usage, including lower hydrophobicity and higher abundance of acidic residues that impart greater stability, solubility, and flexibility of proteins (Paul et al., 2008). These adaptations are reflected in lower values of the GRAVY hydrophobicity scale (Paul et al., 2008; Boyd et al., 2014) and/or isoelectric point of proteins (pI) (Oren, 2013). In Sect. 4.3 and 4.4, we compare the compositional metrics with GRAVY and pI for the same datasets.
Fifth, temperature, pH, and other environmental parameters besides redox and salinity might influence the oxidation and hydration state of proteins. For instance, the redox gradients in hydrothermal systems are also temperature gradients, due to the mixing of seawater and hydrothermal fluid, and we have not attempted to disentangle the effects of temperature and redox conditions. However, our previous analysis of other redox gradients, including stratified hypersaline lakes, indicates that the carbon oxidation state of biomolecules can vary even in systems where temperature changes are much smaller (Dick et al., 2019). It is an axiomatic statement that changes in oxidation state can be associated with one thermodynamic component of a system; our objective in the present study is to explore the differences between this and one other component, represented by hydration state. Future work should also account for the effects of pH and temperature, which is possible using thermodynamic models for proteins (Dick and Shock, 2011).
Finally, it should be noted that the basis species used in the stoichiometric analysis are chosen primarily for mathematical convenience and not because of evolutionary or biosynthetic requirements. The main criterion we consider for the choice of basis species is to reduce the covariation between the metrics for oxidation and hydration state, which arises as a mathematical consequence of projecting the atomic formulas of proteins into a particular compositional space, and may not reflect meaningful differences of chemical composition. Additional considerations are described in Sect. 3.2.
3.1 Carbon oxidation state
The most common metric used in geochemistry for the oxidation state of organic molecules is the average oxidation state of carbon (ZC), which also goes by other names such as nominal oxidation state of carbon (NOSC) (LaRowe and Van Cappellen, 2011). This quantity measures the average degree of oxidation of carbon atoms in organic molecules. For a protein for which the primary sequence has the chemical formula CcHhNnOoSs, the value of ZC can be calculated from the following (Dick and Shock, 2011; Dick, 2014):
The derivation of Eq. (1) is based on the relative electronegativities of the elements, expressed as oxidation numbers (e.g., Kauffman, 1986; Minkiewicz et al., 2018). When bonded to carbon, H is assigned an oxidation number of +1, and N, O, and S have oxidation numbers of −3, −2, and −2. Equation (1) gives the remaining charge that must be present on each C atom, on average, to satisfy overall neutrality. Because of the relatively simple structures of amino acids and the primary structure of proteins, in which N, O, and S are bonded to only H and C, it is possible to calculate the average oxidation state of carbon using Eq. (1). However, this equation is not necessarily valid for other classes of organic molecules or some types of post-translational modifications of proteins, including the formation of disulfide bonds. An important relation inherent in Eq. (1) is the redox neutrality of hydration and dehydration reactions; any pair of hypothetical (or real) proteins whose formulas differ only by some amount of H2O have equal carbon oxidation states.
3.2 Choice of basis species: theoretical considerations
A major premise of this study is that oxidation state and hydration state are two primary variables in geobiochemical systems. Accordingly, when choosing the basis species that can be combined to make the proteins, O2 and H2O are the only fixed requirements. This leaves three basis species that when combined with each other and with O2 and H2O must be able to give any possible formula written as CcHhNnOoSs. We reiterate that this analysis refers to the chemical formulas of polypeptide sequences, that is, the primary structure of proteins, not post-translational modifications or H2O molecules in the hydration shell of folded proteins.
Equation (1) is derived from electronegativity relations and therefore allows for the calculation of the carbon oxidation state from a given chemical formula, independent of any chemical reactions. In contrast, there is no way to count the number of H2O molecules in a chemical formula; H2O appears only in chemical reactions. But it is important to note that any particular reaction that involves only H2O is redox neutral. Conversely, the coefficient of O2 in redox reactions is closely related to the number of electrons transferred. Let us consider the 20 protein-forming amino acids as a baseline for compositional analysis; the numbers of H2O and O2 in the formation reactions of the amino acids from a particular set of basis species are denoted by and . The choice of basis species in our study is guided by the dual objectives that (1) of amino acids should have very little correlation with ZC and (2) of amino acids should be strongly correlated with ZC. It should be emphasized that these are not criteria for “correctness”, since basis species, like thermodynamic components, only have to be the minimum number needed to represent the chemical composition of all the species that can be formed from them (Anderson, 2005). Instead, basis species selected using these conditions yield a convenient mathematical projection of elemental composition; that is, nearly horizontal or vertical trends on –ZC scatterplots for proteins specifically reflect changes in oxidation state or hydration state, respectively.
An additional consideration is that a biologically meaningful set of basis species is likely to comprise metabolites that have high network connectivity, that is, are involved in reactions with many other metabolites. Reactions involving glutamine and glutamic acid (or its ionized form glutamate) are major steps of nitrogen metabolism (Morowitz, 1999; DeBerardinis and Cheng, 2010), and these amino acids have been characterized as “nodal point” metabolites (Walsh et al., 2018). Either methionine or cysteine would provide the sulfur required for the system, but cysteine is relevant as a constituent of the glutathione molecule, which has important roles in cellular redox chemistry (Walsh et al., 2018). These considerations support the proposal of the amino acids glutamine, glutamic acid, and cysteine (collectively abbreviated QEC) together with O2 and H2O as a biologically relevant set of basis species for describing the chemical compositions of proteins (Dick, 2016). These three amino acids are among the top eight amino acids ranked by number of reactions in a metabolic model for E. coli (Feist et al., 2007) (E: 52, S: 25, D: 23, Q: 18, A: 15, G: 15, M: 15, C: 13).
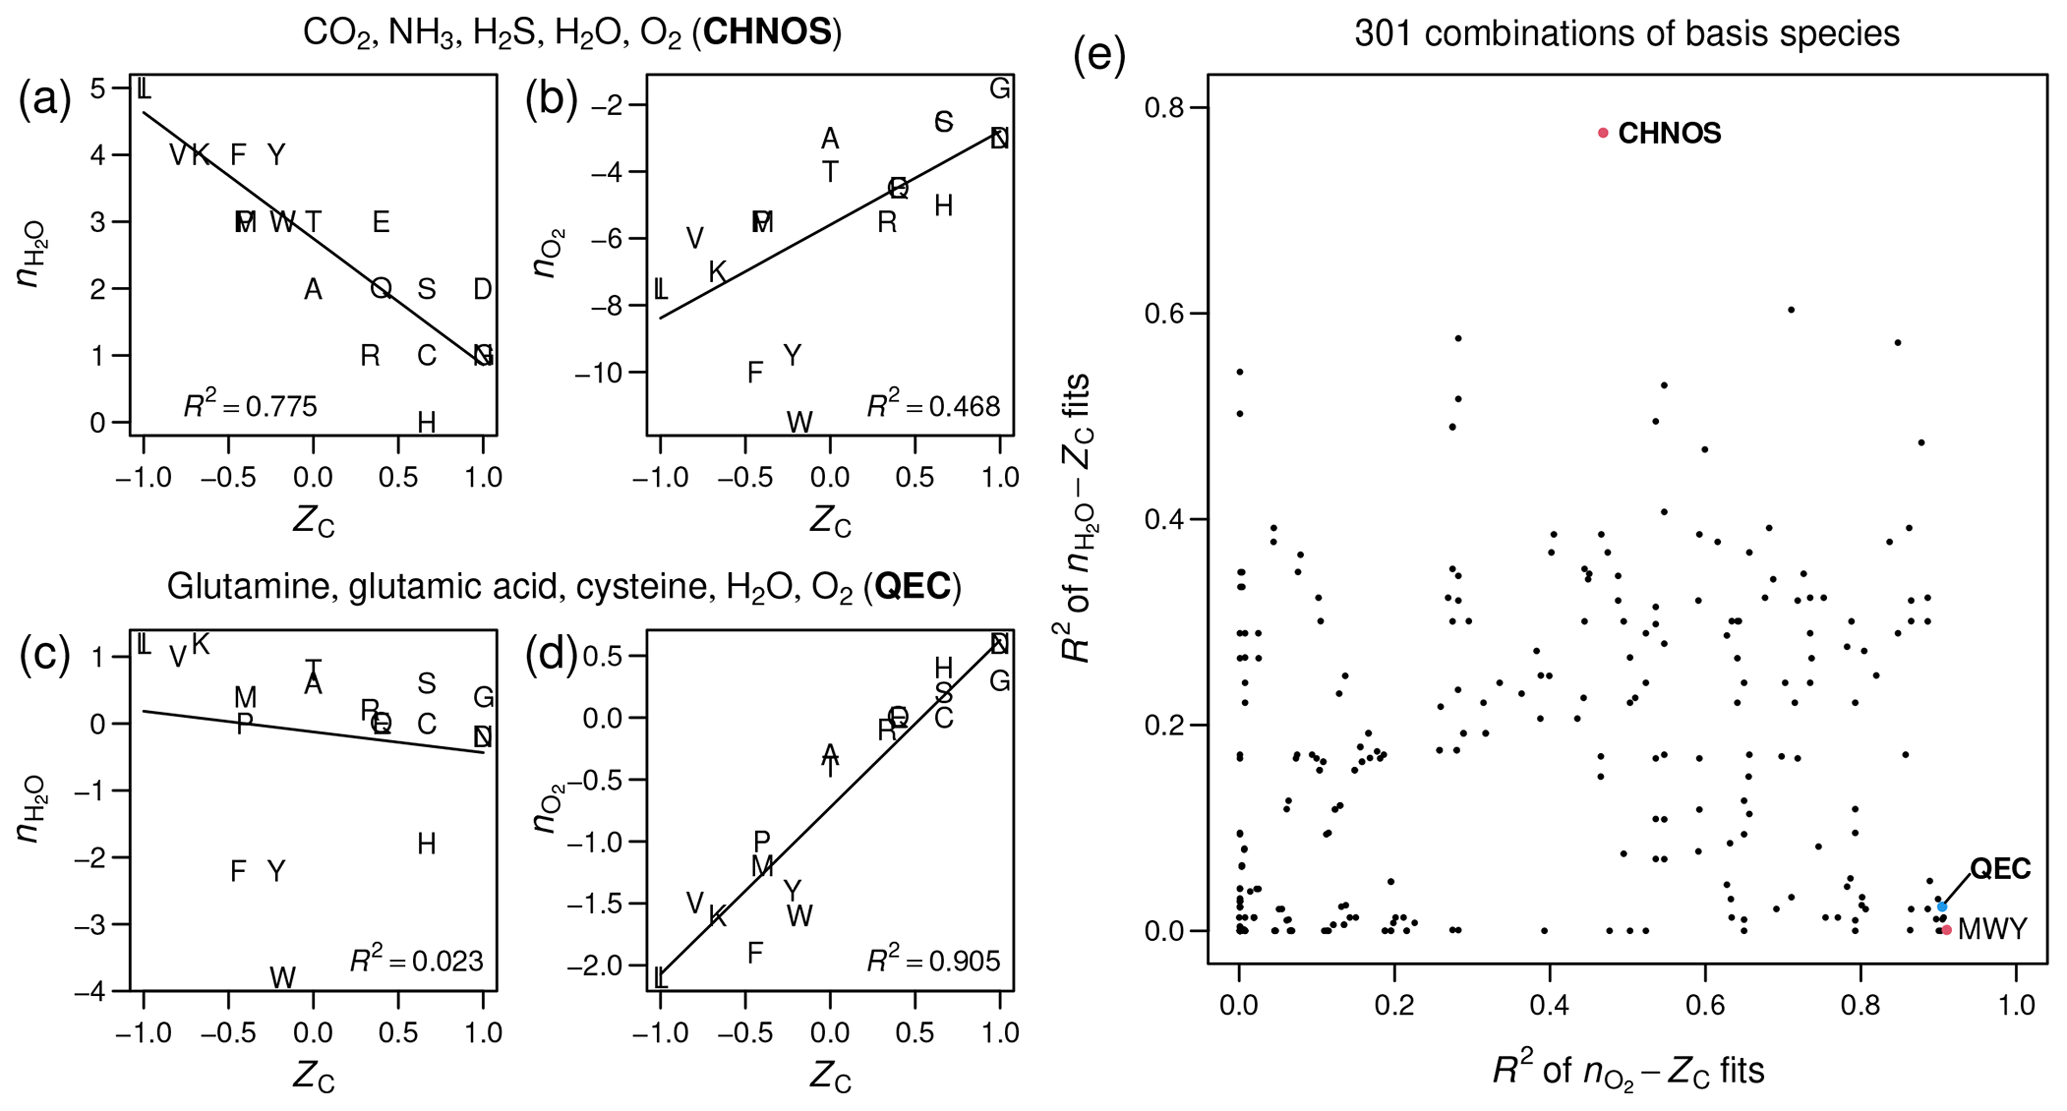
Figure 1Stoichiometric numbers of H2O
and O2 for theoretical formation reactions
of amino acids computed with different sets of basis species, plotted
against carbon oxidation state (ZC),
which is computed from the elemental formula and does not depend on
the choice of basis species. Linear regressions and R2
values were calculated using the lm function in R (R Core Team, 2020).
(a–b) CO2, NH3,
H2S, H2O, O2
(CHNOS). (c–d) Glutamine, glutamic acid, cysteine, H2O,
O2 (QEC). (e) Scatterplot of R2
values for –ZC
fits against R2 values for –ZC
fits for all combinations of basis species consisting of H2O,
O2, and three amino acids (including the points
labeled QEC and MWY (methionine, tryptophan, tyrosine)) or CO2,
NH3, H2S, H2O,
and O2 (CHNOS).
3.3 Choice of basis species: stoichiometric analysis
Here we compute the stoichiometric hydration state by analyzing the compositions of the 20 proteinogenic amino acids in detail. We start with a “default” set of basis species chosen for their common occurrence in overall catabolic reactions (Amend and LaRowe, 2019): CO2, NH3, H2S, H2O, and O2. Using these basis species (designated CHNOS), the theoretical formation reaction of alanine (C3H7NO2) is
and the oxygen and water content of the amino acid (i.e., and ) are the opposite of the coefficients on O2 and H2O in the reaction. Analogous reactions for the other amino acids were used to make Fig. 1a–b. Using glutamine (C5H10N2O3), glutamic acid (C5H9NO4), cysteine (C3H7NO2S), H2O, and O2 (the QEC basis species), the theoretical formation reaction of alanine is
showing that the oxygen and water content are and . Calculations for all the amino acids using the QEC basis were used to make Fig. 1c–d.
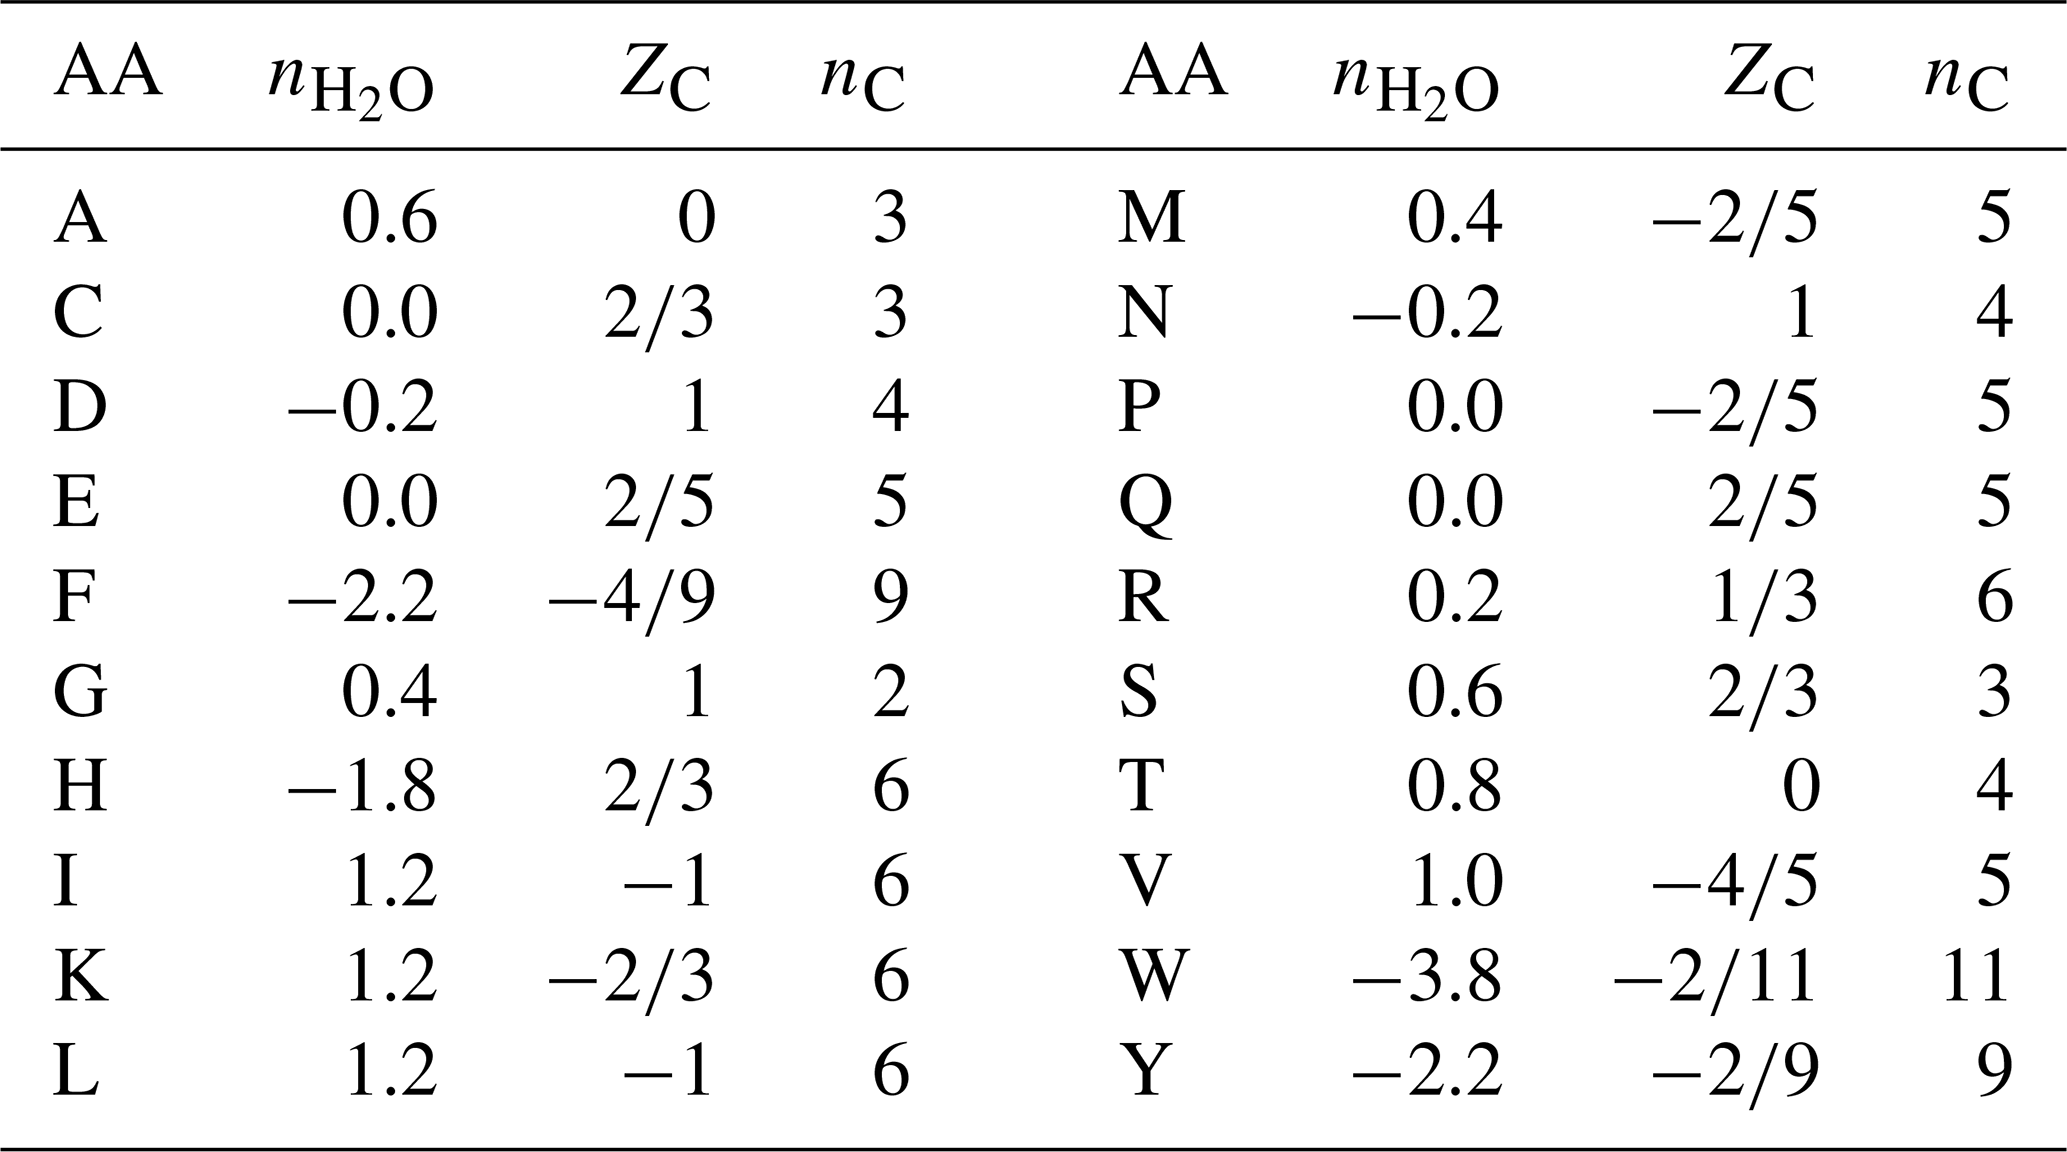
Table 1Values of stoichiometric hydration state () of amino acids calculated with the QEC basis species (glutamine, glutamic acid, cysteine, H2O, O2), average oxidation state of carbon (ZC), and number of carbon atoms (nC). Standard one-letter abbreviations for the amino acids (denoted AA) are used.
As measured by R2 in linear regressions, the CHNOS basis yields a strong negative correlation between ZC and for the amino acids (Fig. 1a) but a relatively weak correlation between ZC and (Fig. 1b). The QEC basis provides a stronger association between ZC and and reduces the correlation between ZC and (Fig. 1c–d). However, there is still a small negative correlation for amino acids (Fig. 1c). A plot with the R2 values for all possible combinations of H2O, O2, and three amino acids indicates that QEC has relatively low R2 of –ZC and high R2 of –ZC (Fig. 1e). Therefore, it is a suitable candidate to meet the objectives described above. Although another combination of amino acids – methionine, tryptophan, and tyrosine (MWY) – has even lower R2 for the –ZC fit (Fig. 1e), tryptophan and tyrosine are not highly connected metabolites and therefore are less preferable as basis species.
By strengthening the association between ZC and , which represent alternative metrics for oxidation state, and by reducing the correlation between ZC and , the QEC basis species provides a more convenient projection of elemental composition than a default choice of inorganic species, such as CO2, NH3, H2S, H2O, and O2, which commonly appear in overall catabolic reactions (Amend and LaRowe, 2019). The selection of basis species is an evolving method, and further analysis with other metabolites may lead to a more convenient set of basis species to project the elemental composition of proteins into chemical variables.
3.4 Compositional metrics for proteins and metagenomes
For a given protein, the stoichiometric hydration state was calculated from
where ni is the frequency of the ith amino acid (i=1 to 20) in the protein and is the stoichiometric hydration state of that amino acid (Table 1). The “−1” in the numerator accounts for the loss of H2O in the polymerization of amino acids, and the “+1” after the summation accounts for the N-terminal H and C-terminal OH of the polypeptide.
Unlike , ZC for proteins must be weighted by the number of carbon atoms in each amino acid, i.e.,
where nC,i and ZC,i are the number of carbon atoms and carbon oxidation state of the ith amino acid (see Table 1). For example, ZC of the dipeptide Ala-Gly can be calculated as , where 3 and 2 are the numbers of carbon atoms and 0 and 1 are the ZC of Ala and Gly, respectively. The result, 0.4, can be checked by applying Eq. (1) to the chemical formula of alanylglycine (C5H10N2O3). The methods for calculating and ZC from elemental composition and amino acid composition are shown schematically in Fig. 2.
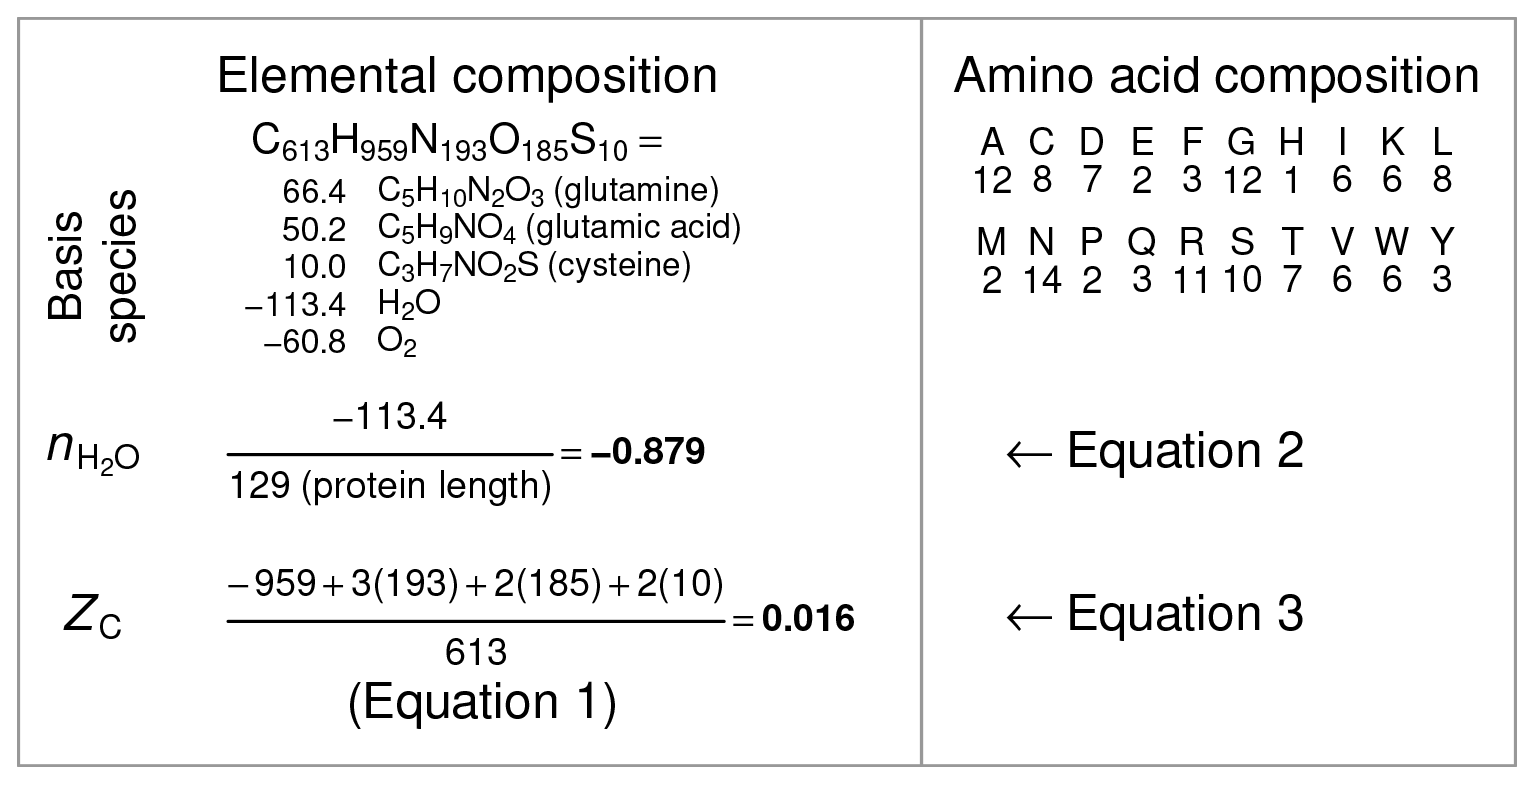
Figure 2Schematic of calculations of and ZC for a single protein. The selected protein is chicken egg white lysozyme (UniProt ID: LYSC_CHICK), which is historically an extensively characterized protein in the laboratory. The protein sequence was used to tabulate the amino acid composition (right column), which in turn was used to generate the elemental composition (left column). The coefficients on the basis species are determined from the elemental composition by mass-balance constraints. Dividing the number of H2O in the basis species by the protein length gives the stoichiometric hydration state (). Independent of the basis species, the elemental composition yields the average oxidation state of carbon (ZC) according to Eq. (1). To reduce computing steps, in this study the amino acid compositions of proteins (obtained, for example, from metagenomic sequences) were used to calculate and ZC with Eqs. (2) and (3) and the values for amino acids in Table 1.
3.5 Amino acid composition of proteomes of nif-bearing organisms
In a separate study, Poudel et al. (2018) used carbon oxidation state as a metric for comparing proteomes of organisms containing the nitrogenase gene (nif). The evolution of these organisms is associated with rising atmospheric oxygen through geological history. In order to approximately replicate their results, amino acid compositions of all proteins for each bacterial, archaeal, and viral taxon in the NCBI Reference Sequence (RefSeq) database (O'Leary et al., 2016) were compiled from RefSeq release 201 (July 2020). Scripts to do this and the resulting data file of amino acid compositions of 42 787 taxa are available in the JMDplots R package (see “Code and data availability” section). Names of organisms containing different nitrogenase (nif) homologs were extracted from Supplement Table S1A of Poudel et al. (2018). These names were matched to the closest organism name in RefSeq. Duplicated species (represented by different strains) were removed, as were matching organisms with fewer than 1000 RefSeq protein sequences. As a result, the numbers of organisms included in the present calculations (Nif-A: 155, Nif-B: 68, Nif-C: 14, Nif-D: 7) are less than those identified in Poudel et al. (2018). Note that values of ZC calculated here (Fig. 3a) are lower than those shown in Fig. 5 of Poudel et al. (2018). This difference is associated with the weighting by carbon number (described above), which was not performed by Poudel et al. (2018).
3.6 GRAVY and pI
The grand average of hydropathicity (GRAVY) was calculated using published hydropathy values for amino acids (Kyte and Doolittle, 1982). The isoelectric point (pI) was calculated using published pKa values for terminal groups (Bjellqvist et al., 1993) and side chains (Bjellqvist et al., 1994); however, the calculation does not implement position-specific adjustments (Bjellqvist et al., 1994). The pKa values used for calculating pI (Bjellqvist et al., 1993, 1994) and transfer free energies used in the derivation of the GRAVY scale (Kyte and Doolittle, 1982) correspond to 25 ∘C and 1 bar, and no attempt was made here to account for the temperature effects on these properties. The charge for each ionizable group was precalculated from pH 0 to 14 at intervals of 0.01, and the isoelectric point was computed as the pH where the sum of charges of all groups in the protein is closest to zero. These calculations were implemented as new functions in the canprot R package (Dick, 2017) (see “Code and data availability” section). Comparisons for selected proteins (UniProt IDs: LYSC_CHICK, RNAS1_BOVIN, AMYA_PYRFU) show that the calculated values of GRAVY and pI are equal to those obtained with the ProtParam tool (Gasteiger et al., 2005).
3.7 Prediction of protein sequences
Protein sequences were predicted from metagenomic reads using a previously described workflow (Dick et al., 2019). Briefly, reads were trimmed, filtered, and dereplicated using scripts adapted from the MG-RAST pipeline (Keegan et al., 2016). For metatranscriptomic datasets, ribosomal RNA sequences were removed using SortMeRNA (Kopylova et al., 2012). Protein-coding sequences were identified using FragGeneScan (Rho et al., 2010), and the amino acid sequences of the predicted proteins were used in further calculations. For large datasets, only a portion of the available reads were processed (at least 500 000 reads; see Supplement Tables S1 and S2). This reduces the computational requirements without noticeably affecting the calculated average compositions (Dick et al., 2019).
Means and standard deviations of ZC, , GRAVY, and pI were calculated for 100 random subsamples of protein sequences from each metagenomic or metatranscriptomic dataset. The number of sequences included in each subsample was chosen to give a total length closest to 50 000 amino acids on average. The subsample density (or number of sequences included in each sample) depends on the average length of the metagenomic or metatranscriptomic sequences and is listed in Tables S1 and S2. This number ranges from 251 for the dataset with the highest mean protein fragment length (199.1; metagenome of hot-spring source of Bison Pool) to 1696 for the dataset with the lowest mean protein fragment length (29.5; metatranscriptome of site GS684 in the Baltic Sea).
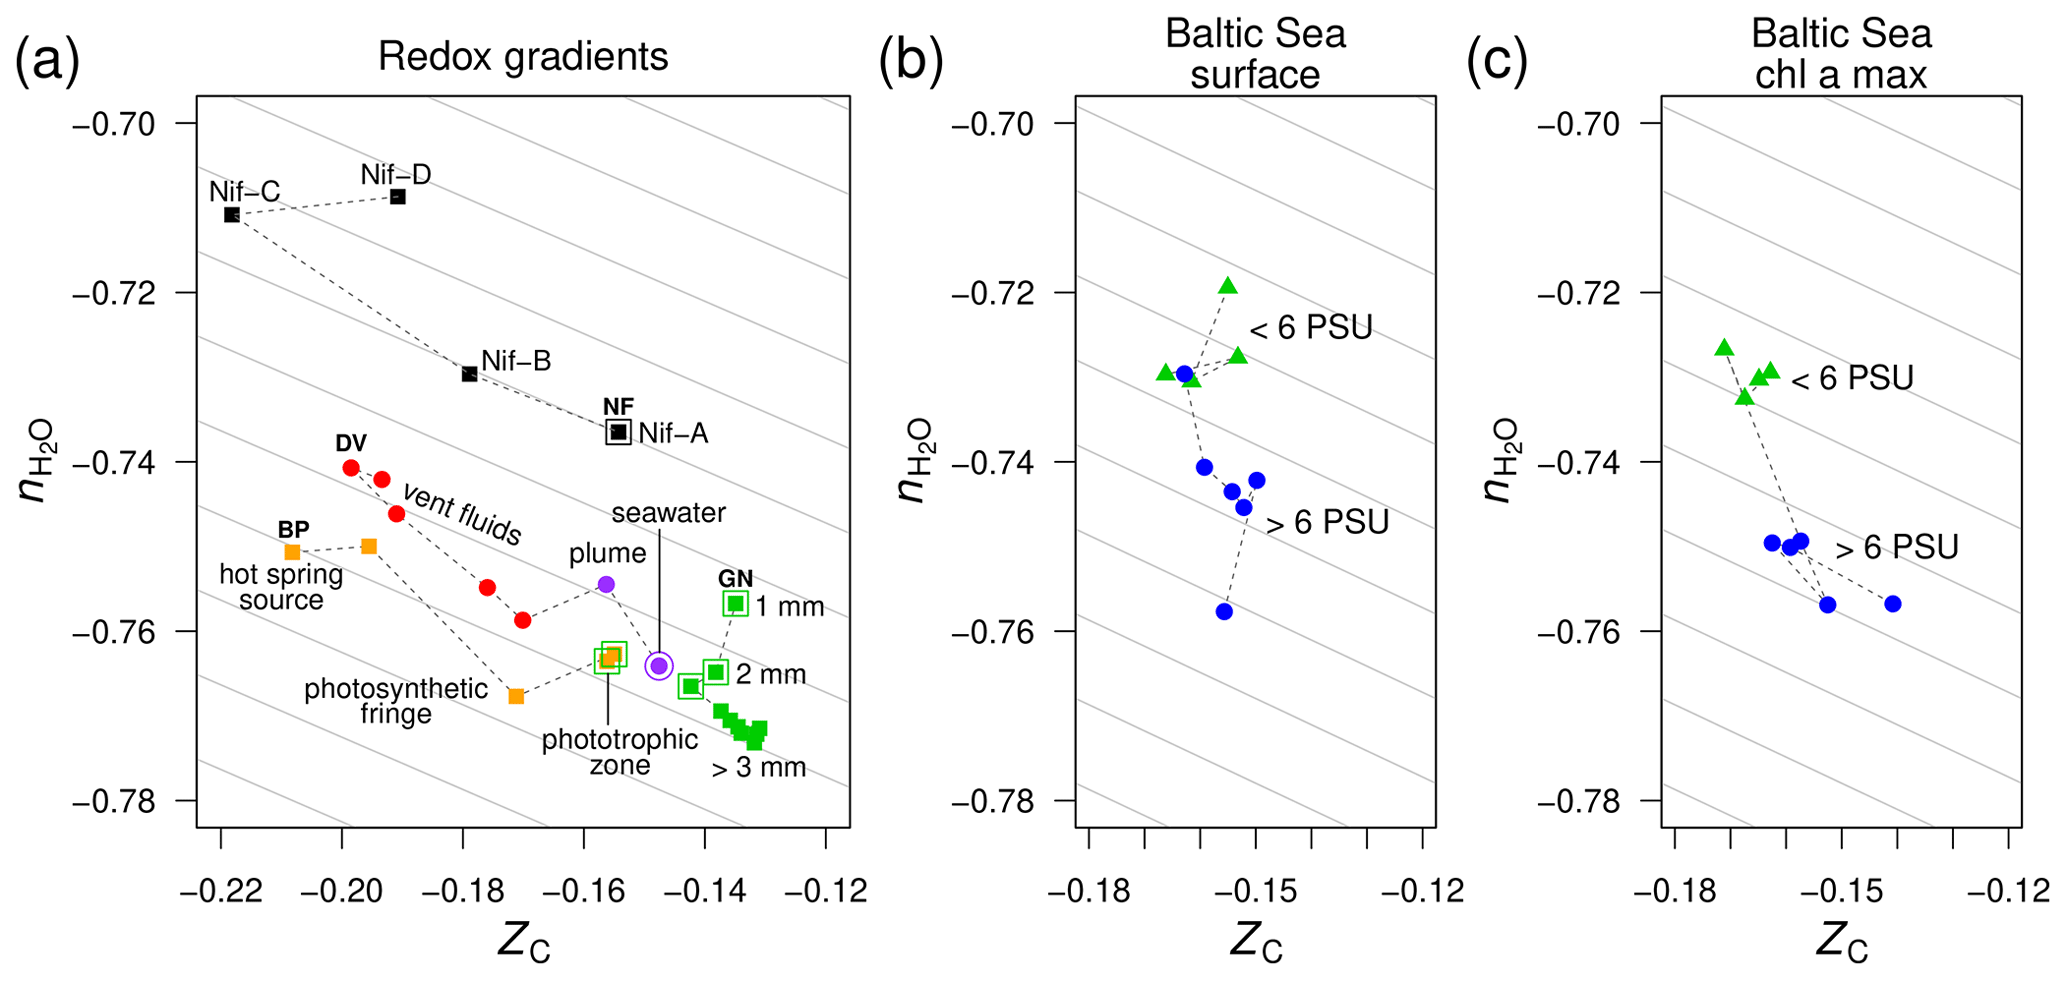
Figure 3Compositional analysis of proteins in redox gradients and the Baltic Sea salinity gradient. (a) Redox gradients. Abbreviations and data sources: BP (Bison Pool hot spring; Havig et al., 2011; Swingley et al., 2012), DV (diffuse submarine vents; Reveillaud et al., 2016; Fortunato et al., 2018), GN (Guerrero Negro microbial mat; Kunin et al., 2008), and NF (nitrogenase-bearing organisms; Poudel et al., 2018). The NF data are based on reference proteomes (see Methods section); all others are for protein sequences predicted from metagenomic data. Outlined symbols indicate samples from relatively oxidizing conditions. (b) Surface and (c) deeper samples (Chl a max: chlorophyll a maximum, 9–30 m deep) from the Baltic Sea transect. Metagenomes as described in Dupont et al. (2014) were downloaded from iMicrobe (Youens-Clark et al., 2019); the plots show data for the 0.1–0.8 µm size fraction collected from stations along the transect at low salinity (< 6 PSU) and high salinity (> 6 PSU). Background guidelines have slopes equal to that of the –ZC linear regression for amino acids in Fig. 1c.
4.1 Comparison of redox and salinity gradients
To search for the hypothesized dehydration signal in metagenomic data, we began with redox gradients as a negative control. Submarine hydrothermal vents are zones of complex interactions between reduced endmember fluids and relatively oxidized seawater (Reeves et al., 2014; Ooka et al., 2019). Terrestrial hydrothermal systems, such as the hot springs in Yellowstone National Park, USA, provide a source of reduced fluids that are oxidized by degassing and mixing with air and surface groundwater as well as biological activity including sulfide oxidation (Lindsay et al., 2018). Redox gradients can also develop over smaller length scales. The surface of the Guerrero Negro microbial mat (Baja California Sur, Mexico) is exposed to ca. 1 m deep hypersaline, oxygenated water (approximately 200 µM O2), but in the mat, oxygen rises during the daytime and is depleted within a few millimeters, giving way to anoxic and then sulfidic conditions (Ley et al., 2006).
Using metagenomic data for these redox gradients (Kunin et al., 2008; Havig et al., 2011; Swingley et al., 2012; Reveillaud et al., 2016; Fortunato et al., 2018), Dick et al. (2019) showed that the carbon oxidation states of DNA, messenger RNA, and proteins increase down the outflow channel of Bison Pool and between fluids from diffuse hydrothermal vents and relatively oxidizing seawater. Moreover, intact polar lipids extracted from the microbial communities of Bison Pool and other alkaline hot springs also exhibit downstream increases in carbon oxidation state (Boyer et al., 2020), revealing that parallel compositional trends characterize many major types of biomacromolecules in these hot springs. The ZC of proteins increases more subtly toward the surface in the upper few millimeters of the Guerrero Negro microbial mat; it also increases at greater depths, perhaps due to heterotrophic degradation and/or horizontal gene transfer (Dick et al., 2019). Furthermore, an evolutionary trajectory associated with the occurrence of different homologs of nitrogenase (nif) in anaerobic and aerobic organisms is characterized by increasing ZC of the proteomes of these organisms (Poudel et al., 2018).
The trends of carbon oxidation state described above are visible in the scatter plot in Fig. 3a, with an added dimension: stoichiometric hydration state. The guidelines in this plot are parallel to the –ZC trend for amino acids (Fig. 1c); their slope represents the background correlation between and ZC that is associated with the choice of basis species. Sample data for Bison Pool and the submarine vents are distributed parallel to these guidelines. Therefore, the decrease of along these redox gradients can be attributed to the background correlation in the stoichiometric analysis, and the differences between samples within each dataset are specifically associated with changes in carbon oxidation state and not stoichiometric hydration state. This is an expected outcome, as the redox gradients considered here do not have large changes in salinity. In particular, concentrations of Cl−, a conservative ion, increase by less than 10 % (6.1 to 6.6 mM) in the outflow of Bison Pool due to evaporation (Swingley et al., 2012). The diffuse vents considered here have concentrations of Cl− between 515 and 624 mM, not greatly different from bottom seawater at 545 mM (Dataset S1 of Reeves et al., 2014).
As a well known example of a regional salinity gradient, the Baltic Sea exhibits a freshwater to marine transition over 1800 km, but dissolved oxygen at the surface is at or near saturation with air (Dupont et al., 2014), so this transect does not represent a redox gradient. For protein sequences derived from metagenomes in the 0.1–0.8 µm size fraction, there are large changes in stoichiometric hydration state along the Baltic Sea transect but relatively small differences in the carbon oxidation state (Fig. 3b). This pattern holds for samples from both the surface and chlorophyll a maximum (9–30 m deep; Fig. 3c).
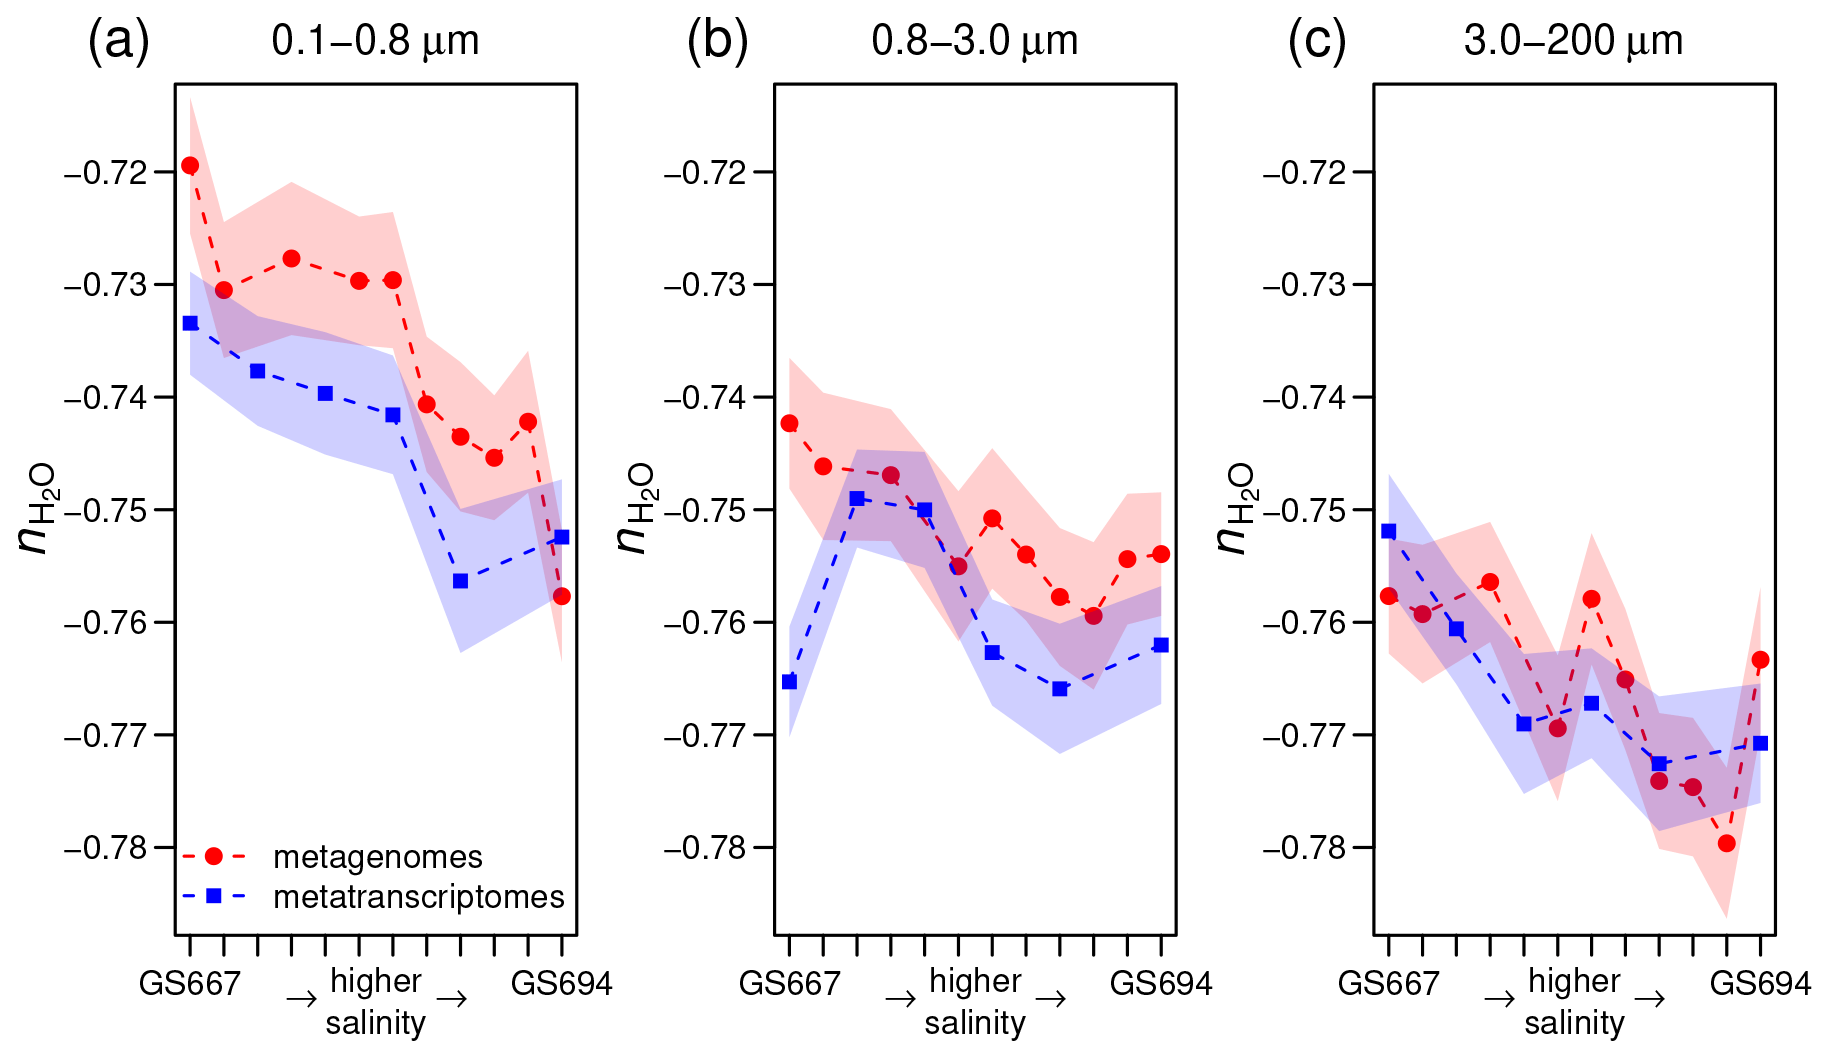
Figure 4Stoichiometric hydration state of proteins in metagenomes (Dupont et al., 2014) and metatranscriptomes (Asplund-Samuelsson et al., 2016) of surface water samples in the Baltic Sea with increasing particle size: (a) 0.1–0.8, (b) 0.8–3.0, and (c) 3.0–200 µm. From left to right, the samples on the horizontal axis (some IDs omitted for clarity) are arranged from freshwater to marine conditions in the Sorcerer II Global Ocean Sampling Expedition (Dupont et al., 2014); all sample IDs are GS667, GS665, GS669, GS673, GS675, GS659, GS679, GS681, GS683, GS685, GS687, and GS694. Width of shading represents ± 1 standard deviation in subsampled sequences (see Methods section).
4.2 Multifactorial hydration effects
The stoichiometric hydration state of proteins can be influenced by factors other than just salinity. Previous authors have observed large differences in microbial community composition between free-living and particle-associated fractions, which may be due in part to anoxic conditions arising from limited diffusion in particles (Simon et al., 2014). As described below, we found a trend of relatively low in particles compared to free-living fractions in both the Baltic Sea and Amazon River. This effect is probably associated with phylogenetic differences among the size fractions, but reduced accessibility to bulk water may be a contributing factor. Further support for the possible influence of physical accessibility is the reduced in the interior compared to upper layers of the Guerrero Negro microbial mat.
For the Baltic Sea metagenomes and metatranscriptomes, the 0.1–0.8 and 0.8–3.0 µm size fractions of particles that do not pass through the filter, which are used for subsequent DNA extraction and sequencing, represent free-living bacteria, while the 3.0–200 µm fraction contains particle-associated bacteria with average larger genome sizes and greater inferred metabolic and regulatory capacity (Dupont et al., 2014). Figure 4a–c shows that proteins inferred from metagenomes for larger particles have lower than those for the smallest size fraction. The Guerrero Negro microbial mat offers another opportunity to compare exposed and interior environments. Unlike ZC, which reaches a minimum a few millimeters into the mat, decreases throughout the mat, but the changes are most pronounced in the upper few millimeters (Fig. 3a).
One hypothesis that could explain these findings is that the interiors of particles and the mat are sequestered to some extent from the surrounding aqueous environment. If limited accessibility to the aqueous phase were manifested as lower water activity, perhaps due to surface effects associated with geological nanomaterials (Wang et al., 2003) and/or higher concentrations of solutes, it would provide a thermodynamic drive that favors lower of proteins. However, it should be noted that particles are also suitable habitats for multicellular and eukaryotic populations (Simon et al., 2014). Therefore, the trends in stoichiometric hydration state may require an explanation in terms of both physical and phylogenetic differences, which should be explored in future studies.
An important evolutionary transition is the emergence of heterotrophic metabolism, which is a later innovation than autotrophic core metabolism (Morowitz, 1999; Braakman and Smith, 2013). It is notable that the deeper layers of the Guerrero Negro mat show greater evidence for heterotrophic metabolism (Kunin et al., 2008); likewise, heterotrophs in the “photosynthetic fringe” in Bison Pool may outcompete the autotrophs that dominate at higher and lower temperatures (Swingley et al., 2012). These putative heterotroph-rich zones show locally lower values of (Fig. 3a). If decreasing stoichiometric hydration state is a common theme across some evolutionary transitions, then the relatively high in the proteomes of organisms carrying the ancestral nitrogenase Nif-D (Fig. 3a) is not unexpected. A better understanding of these trends would require more extensive phylogenetically resolved comparisons of the compositional differences as well as quantitative analyses of water fluxes in different metabolic pathways.
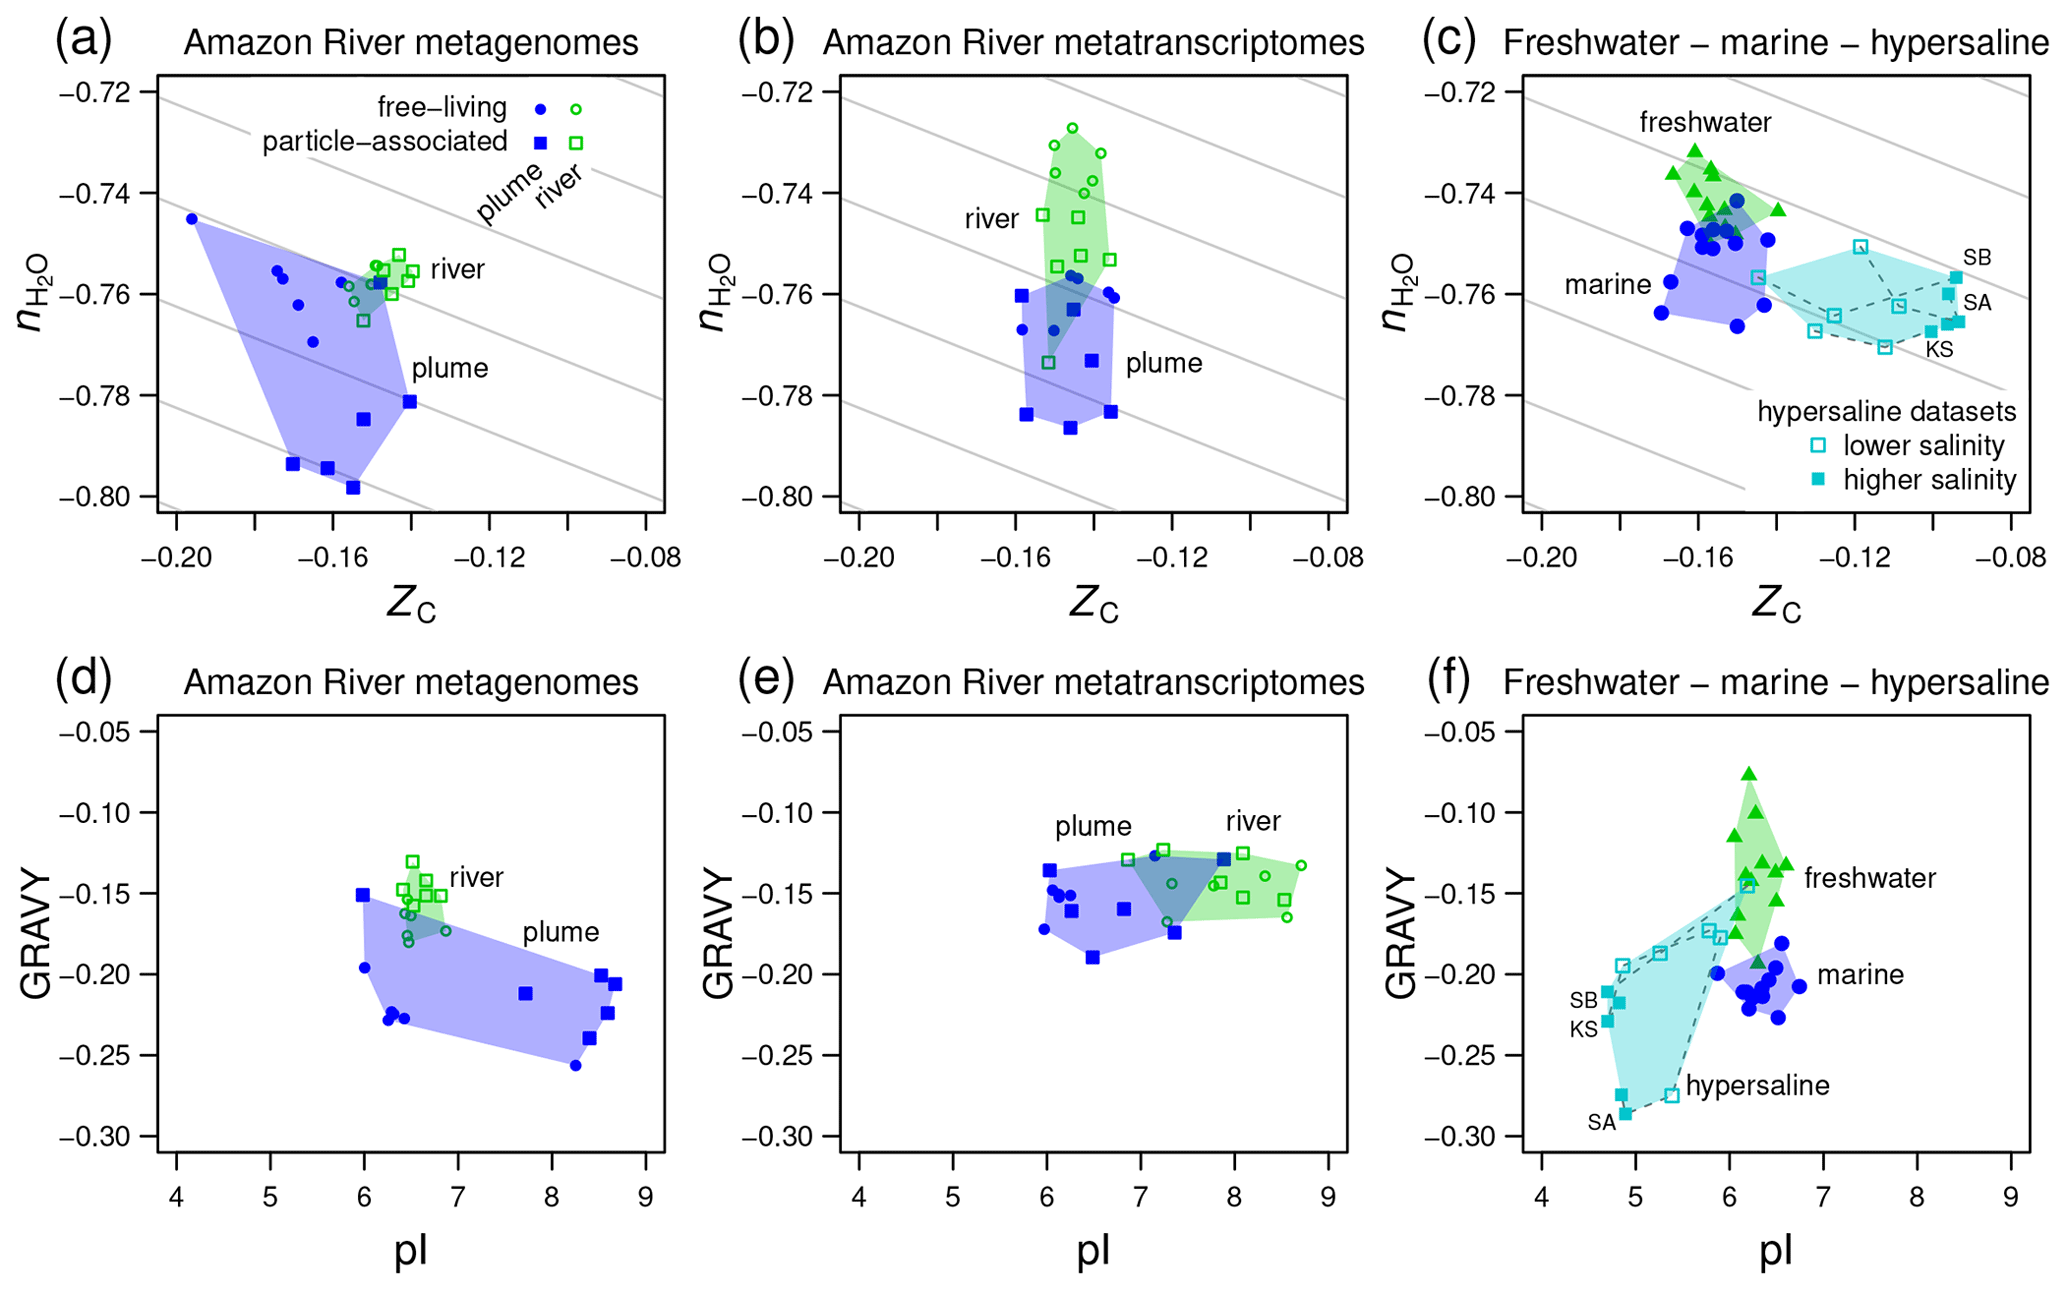
Figure 5Compositional analysis and hydropathicity and isoelectric point calculations for proteins from the Amazon River and plume and other metagenomes. Samples representing freshwater, marine, and hypersaline environments are indicated by the colored convex hulls. (a) Metagenomic and (b) metatranscriptomic data for particle-associated and free-living fractions from the lower Amazon River (Satinsky et al., 2015) and plume in the Atlantic Ocean (Satinsky et al., 2014). (c) Freshwater (lakes in Sweden and USA) and marine metagenomes considered in a previous comparative study (Eiler et al., 2014) and metagenomes from hypersaline environments including Kulunda Steppe soda lakes in Siberia, Russia (Vavourakis et al., 2016) (KS), Santa Pola salterns in Spain (Ghai et al., 2011; Fernandez et al., 2013) (SA), and salterns in the South Bay of San Francisco, CA, USA (Kimbrel et al., 2018) (SB). Plots (d–f) show values of average hydropathicity (GRAVY) and isoelectric point (pI) of proteins for the same datasets. Background guidelines have slopes equal to that of the –ZC linear regression for amino acids in Fig. 1c.
4.3 Compositional trends in rivers, lakes, and hypersaline environments
The Amazon River and ocean plume provide another example of a freshwater to marine transition, with salinities that range from below the scale of practical salinity units (PSU) in the river to 23–36 PSU in the plume (Satinsky et al., 2014, 2015). We used published metagenomic and metatranscriptomic data for filtered samples classified as free-living (0.2 to 2.0 µm) and particle-associated samples (2.0 to 156 µm) (Satinsky et al., 2014, 2015). River samples form a tight cluster on a plot of stoichiometric hydration state against carbon oxidation state of proteins, and the plume samples are scattered over lower ZC and low values of , particularly for the particle-associated fraction (Fig. 5a). For metatranscriptomes, there is a noticeable decrease of from the river to the ocean plume but little difference in carbon oxidation state (Fig. 5b), and the particle-associated samples again exhibit a generally lower than the free-living samples. Together with the lower for proteins inferred from metagenomes and metatranscriptomes in the larger size fractions from Baltic Sea samples, this could reflect a lower availability of H2O to organisms living near the particle surface due to physical separation from the bulk aqueous phase and associated diffusion limitation or lower water activity (Wang et al., 2003).
We also considered data used in a previous comparative study and data for hypersaline environments including evaporation ponds (salterns) and lakes in desert areas. Eiler et al. (2014) characterized microbial communities using metagenomic data for various freshwater samples (lakes in the USA and Sweden) and marine locations. For hypersaline settings, we used metagenomic data from the Santa Pola salterns in Spain (Ghai et al., 2011; Fernandez et al., 2013), natural soda lakes of the Kulunda Steppe in Serbia (Vavourakis et al., 2016), and South Bay salterns in California, USA (Kimbrel et al., 2018). The compositional analysis reveals a relatively low of proteins inferred from the marine metagenomes compared to freshwater samples in the Eiler et al. (2014) dataset (Fig. 5c). Surprisingly, hypersaline metagenomes have ranges of of proteins that are similar to marine environments but considerably higher ZC (Fig. 5c). To interpret these results, we considered other factors that are known to influence the amino acid compositions of proteins in halophiles.
“Salt-in” halophilic organisms have proteins with relatively low isoelectric point that remain soluble at high salt concentrations (Ghai et al., 2011). It should be noted that proteins with a lower pI also tend to have relatively high ZC due to higher abundances of aspartic acid and glutamic acid, which are relatively oxidized (see Amend and Shock, 1998; Dick, 2014; and Fig. 1). Consequently, the lower pI characteristic of salt-in organisms is also associated with an increase of carbon oxidation state. Because of the large pI differences (Fig. 5f), the increase of ZC in hypersaline environments can not be interpreted as an indicator of an environmental redox gradient. Some halophilic organisms are also known to have proteins that are less hydrophobic, with lower values of GRAVY (Paul et al., 2008; Boyd et al., 2014). Because hydrophobic amino acids have relatively low values of ZC (Dick, 2014), a negative correlation between GRAVY and ZC is also expected.
Consistent with these well known features of halophilic adaptation, marine metagenomes exhibit lower hydrophobicity than most of the freshwater samples, and hypersaline metagenomes are shifted to both lower GRAVY and pI (Fig. 5f). However, there are irregular trends in the Amazon River data. Compared to the river, the proteins in plume metagenomes exhibit lower GRAVY and either higher or lower pI (Fig. 5d). Similarly, other authors have reported that although lower pI is a signature of many hypersaline environments, it does not clearly distinguish marine from lower-salinity environments (Rhodes et al., 2010). In contrast, the plume metatranscriptomes do show decreased pI but no major difference in GRAVY compared to river samples (Fig. 5e).
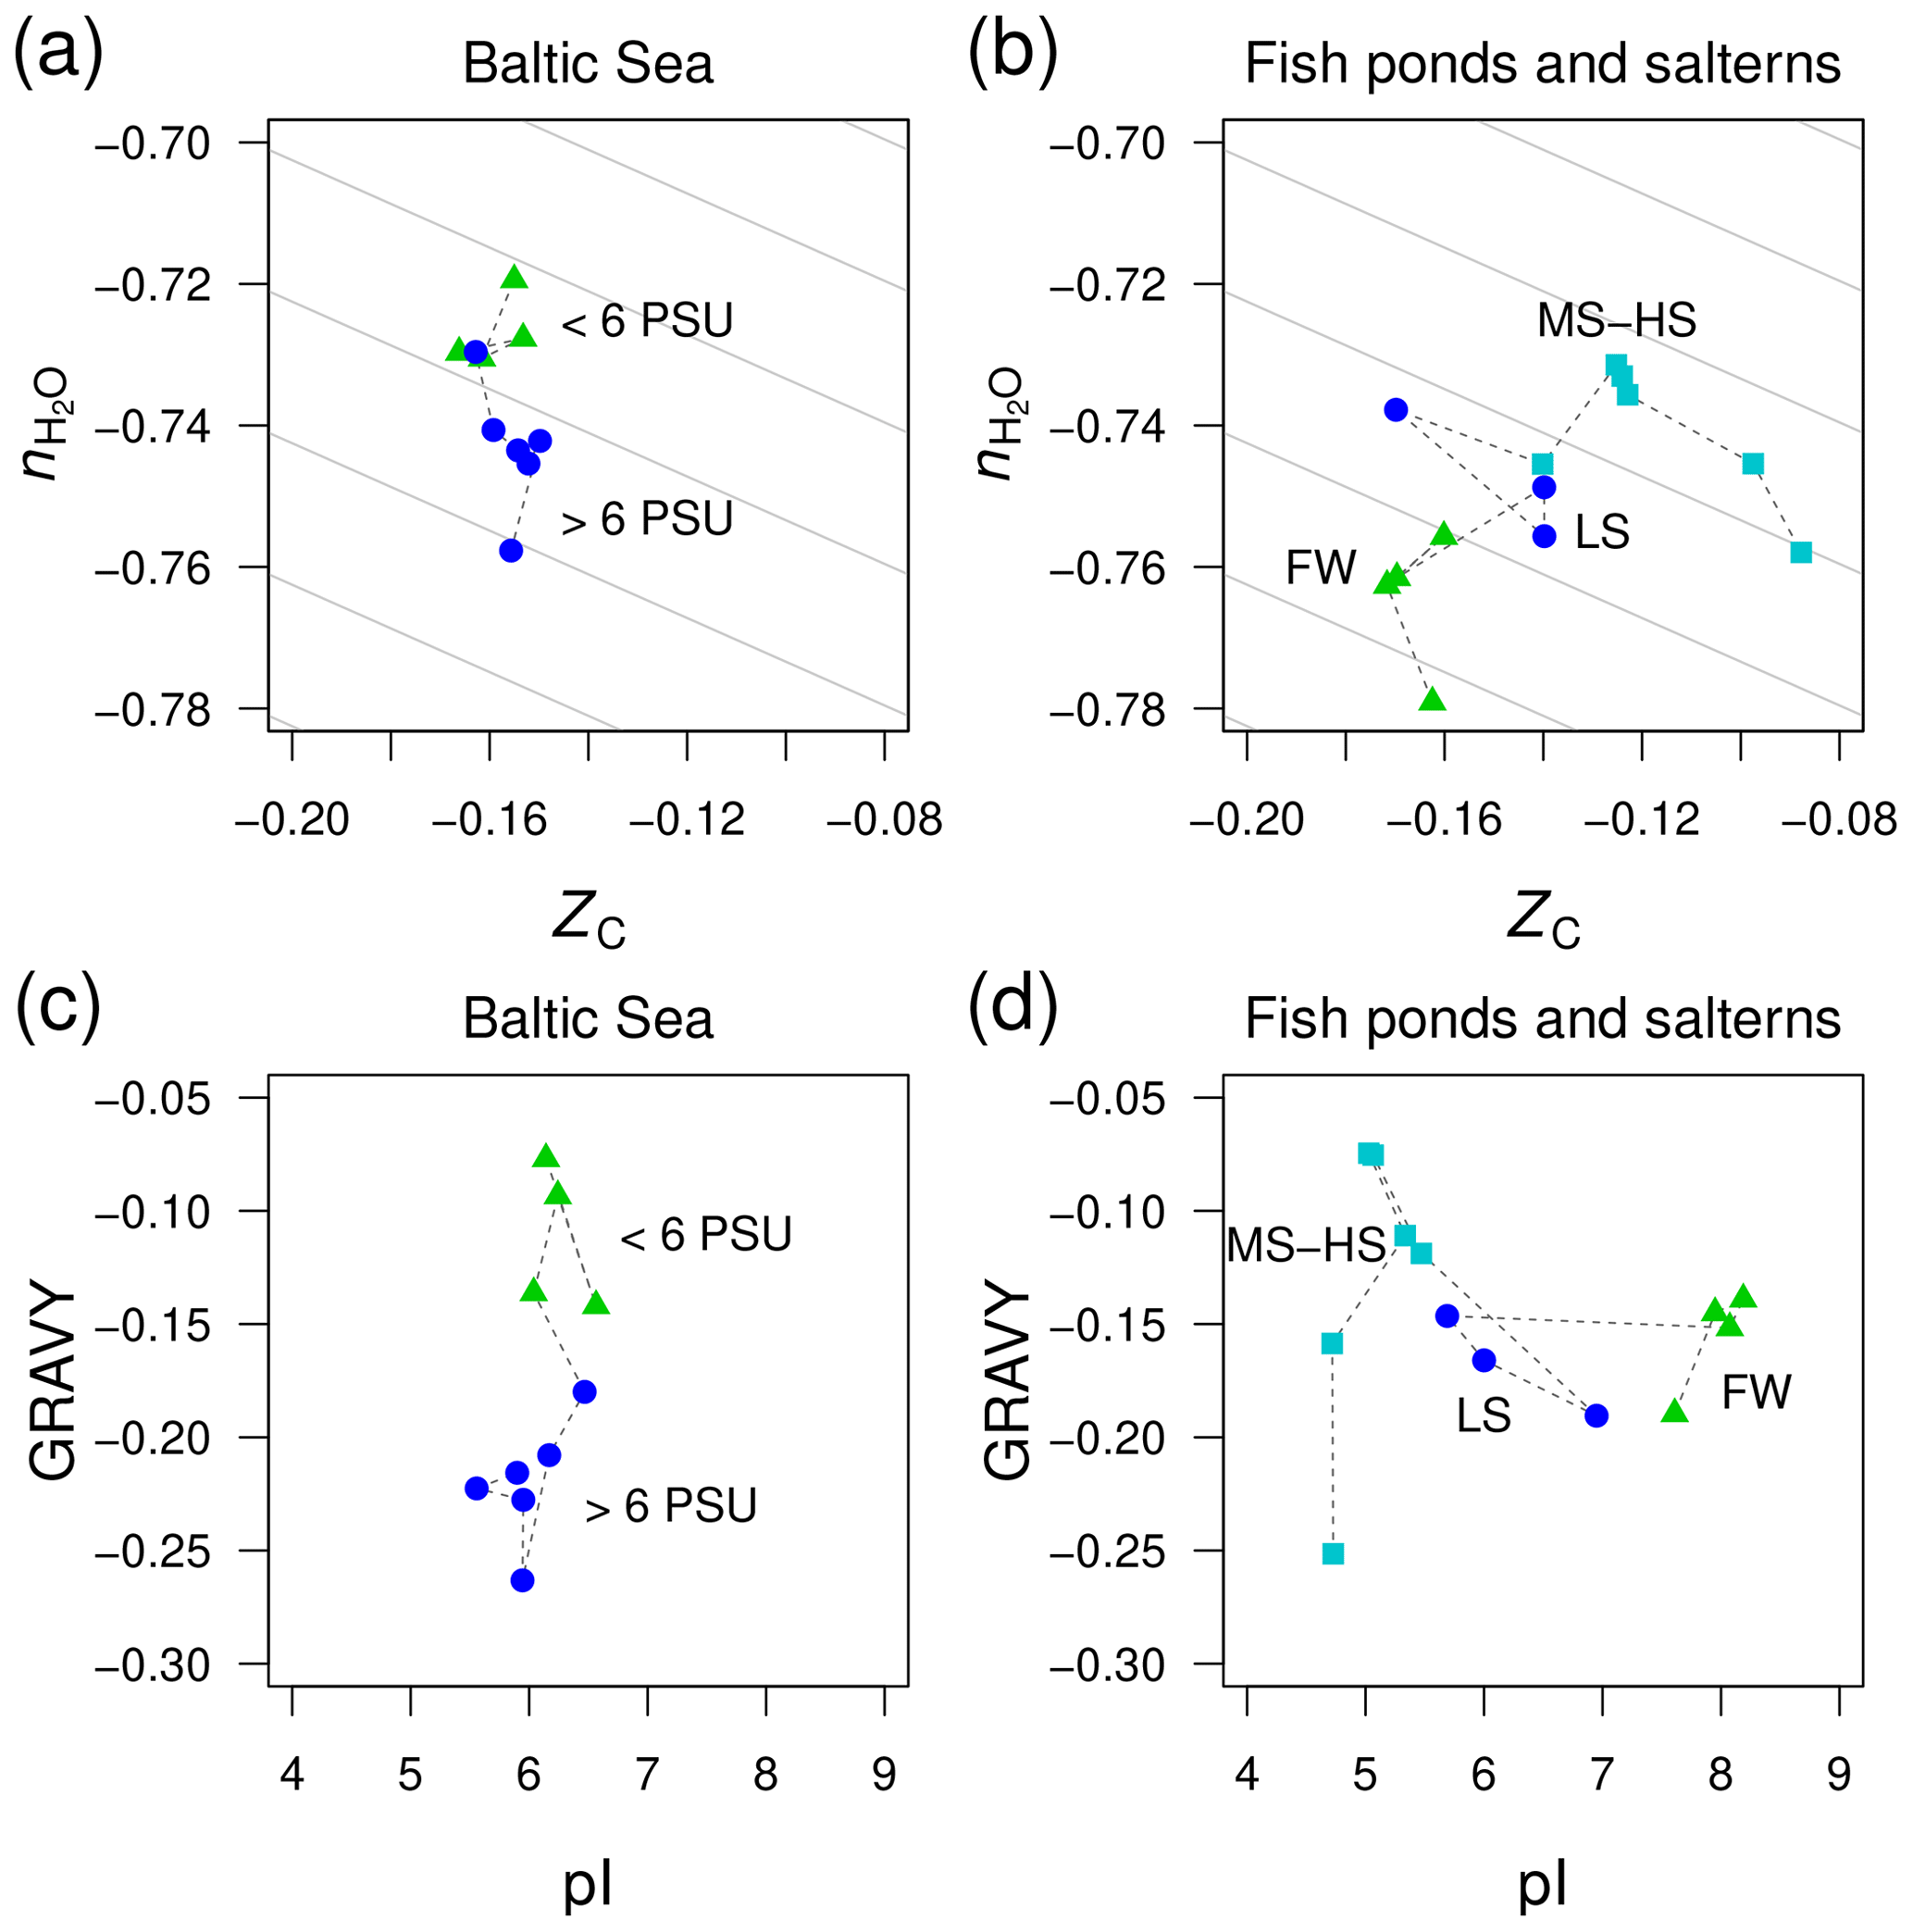
Figure 6Divergent trends of and ZC of proteins from metagenomes for (a) the Baltic Sea and (b) freshwater and higher-salinity samples from southern California (Rodriguez-Brito et al., 2010). The datasets from Rodriguez-Brito et al. (2010) are classified according to salinity: freshwater (FW; three samples at different times from the tilapia channel and one sample from the prebead pond), low salinity (LS; three samples at different times from the low salinity saltern), and hypersaline (MS–HS; four samples from a medium salinity and two from a high salinity saltern). Plots (c) and (d) show GRAVY and pI computed for the same datasets. Background guidelines have slopes equal to that of the –ZC linear regression for amino acids in Fig. 1c.
There is not enough space here to comprehensively examine all the available metagenomic data for environmental salinity gradients. However, we have identified one dataset that gives a contradictory result and therefore offers more perspective on the compositional relationships of proteins coded by metagenomes in salinity gradients. This dataset was generated in a time series study of microbial and viral community dynamics in a freshwater aquaculture facility (“tilapia channel” and “prebead bond”) and low-, medium-, and high-salinity salterns in southern California (Rodriguez-Brito et al., 2010). Here, we have used only the reported microbial sequences (not the viral dataset) and considered all time points together. Contrary to our starting hypothesis, the stoichiometric hydration state of proteins is lowest in the freshwater samples, which is the reverse of the trend from the Baltic Sea (Fig. 6a–b). A side-by-side comparison of the Baltic Sea and the datasets by Rodriguez-Brito et al. (2010) shows large changes of GRAVY in the former but pI in the latter (Fig. 6c–d), which is another indication that these variables are responsive only in certain ranges of salinity.
This counterexample demonstrates that the sign of differences of is not predictable in all environments; however, the large negative offset in the freshwater samples may be a signal of some other influence, perhaps related to the human control of these ponds, which are used as fish nurseries. Specifically, the microbial communities in the aquaculture ponds may not be responding as they would in a typical natural system that is less nutrient rich. As noted above for putative heterotroph-rich zones in other systems, the lower stoichiometric hydration state could be associated with the enrichment of heterotrophic taxa, in this case due to the addition of organic compounds to the aquaculture ponds.
Considering all the datasets shown in Figs. 5 and 6, there appears to be no globally consistent metric for environmental salinity gradients that can be derived from amino acid composition. If we exclude the Rodriguez-Brito et al. (2010) dataset, then exhibits a consistent decreasing trend in marine compared to freshwater samples. However, this trend does not continue into hypersaline environments.
4.4 Compositional analysis of differentially expressed proteins
While biomolecular data for environmental salinity gradients reflect both ecological and evolutionary differences, laboratory experiments provide information on the physiological effects of osmotic conditions on protein expression in particular organisms. It is also important to recognize that osmotic stress can be imposed by solutes other than NaCl; the effects of organic solutes differ in relation to their ability to permeate or depolarize cell membranes and to be sensed by cellular osmoregulatory systems (Kanesaki et al., 2002; Shabala et al., 2009; Withman et al., 2013). Because microbial acclimation to changes in osmotic conditions is a dynamic process, it is helpful to look at gene and protein expression data for a range of times and conditions that can be controlled in the lab.
We searched the literature to compile data for differential gene and protein expression in non-halophilic bacteria in NaCl or other osmotic stress conditions. As a general rule, we only included datasets with a minimum of 20 down-regulated and 20 up-regulated genes or proteins; however, smaller datasets were included if they are part of a study with larger datasets. This compilation consists of 49 transcriptomics and 30 proteomics datasets from 36 studies (note that different time points and treatments are considered separate datasets); descriptions and references for all datasets are given in Figures S1 and S2. In addition, four datasets for differential expression of proteins in halophilic archaea in hyperosmotic stress were located (Leuko et al., 2009; Zhang et al., 2016; Lin et al., 2017; Jevtić et al., 2019) (see Fig. S3). This is a major update to an earlier compilation of data for hyperosmotic stress experiments (Dick, 2017), but we have limited the present compilation to data for bacteria or archaea; data for osmotic stress induced by NaCl or glucose in eukaryotic cells are considered in a separate paper (Dick, 2020a).
We assembled the lists of up- and down-regulated proteins in each dataset or, for gene expression studies, the proteins corresponding to the up- and down-regulated genes and converted gene names or accession numbers to UniProt accessions using the UniProt mapping tool (Huang et al., 2011). The compiled data are available as CSV files in R packages (see the “Code and data availability” section). After removing genes or proteins with unavailable or duplicated UniProt IDs and those with ambiguous differences (appearing in both the down- and up-regulated groups), the amino acid compositions computed for protein sequences downloaded from UniProt (The UniProt Consortium, 2019) were used for the compositional analysis of carbon oxidation state and stoichiometric hydration state. Median differences (i.e., and ΔZC) were calculated as the median value for all up-regulated proteins minus the median value for all down-regulated proteins in each dataset.

Figure 7Compositional analysis of proteins in hyperosmotic stress experiments for non-halophilic bacteria and halophilic archaea. (a) Time-course experiments for bacteria; black circles represent datasets for proteins coded by differentially expressed genes (transcriptomics experiments) and blue squares represent datasets for differentially expressed proteins (proteomics experiments). Lettered symbols represent the progression in each experiment: (a–c) (30, 80, 310 min; Kocharunchitt et al., 2014) (transcriptomes and proteomes), (d–f) (5, 30, 60 min; Solheim et al., 2014), (g–i) (1, 6, 24 h; Finn et al., 2015), (j–k) (45 min, 14 h; Han et al., 2017), and (l–n) (24, 48, 72 h; Qiao et al., 2013) (transcriptomes and proteomes; no proteomic data available at 72 h). (b) Pairs of experiments for bacteria under hyperosmotic stress imposed by NaCl or organic solutes. The sources of data are (A–B) (sorbitol; Kanesaki et al., 2002), (C–D) (sorbitol; Han et al., 2005), (E–F) (sucrose; Kohler et al., 2015) (transcriptomes and proteomes), (G–H) (glycerol at 1 h; Finn et al., 2015), (I–J) (glycerol at 6 h; Finn et al., 2015), (K–L) (sucrose; Shabala et al., 2009), (M–N) (urea; Withman et al., 2013), and (O–P) (glucose; Schmidt et al., 2016) (only proteomes). (c–f) Plots of median differences of and ZC or GRAVY and pI for all compiled transcriptomic and proteomic data for hyperosmotic stress, including datasets shown in (a) and (b) together with data for other experiments. In each panel, open symbols represent individual datasets and filled symbols represent the mean for all datasets. The axis labels include the p values for the mean difference for all datasets in each plot; p values less than 0.05 are shown in bold. References for all datasets are in Fig. S1 (transcriptomics for non-halophilic bacteria), Fig. S2 (proteomics for non-halophilic bacteria), and Fig. S3 (proteomics for halophilic archaea).
Figure 7a shows results for time-course experiments for hyperosmotic stress. Note that all values are differences calculated relative to the same control (initial time point) in a given study. In transcriptomic experiments for a commensal species (Enterococcus faecalis), a soil bacterium (Methylocystis sp. strain SC2), and two pathogens (E. coli O157:H7 and Salmonella enterica serovar Typhimurium) (Solheim et al., 2014; Han et al., 2017; Kocharunchitt et al., 2014; Finn et al., 2015), there is a marked progression toward lower of the associated proteins with time. In a transcriptomic experiment for salt stress in Synechocystis sp. PCC 6803 (Qiao et al., 2013), is shifted negatively between 24 and 48 h but rises to a slightly positive value at 72 h. Proteomic data are available from two of these studies, indicating that the differentially expressed proteins in E. coli (Kocharunchitt et al., 2014) also show decreasing with time, but in the proteomic experiment for Synechocystis sp. PCC 6803 (Qiao et al., 2013), changes sign from negative to positive between 24 and 48 h (Fig. 7a).
Perhaps the most striking result to emerge from this analysis is the strong dehydrating signal associated with osmotic stress imposed by organic solutes. We compared pairs of datasets from the same study for NaCl and another solute at concentrations that give similar total osmolalities. Transcriptomic data for sorbitol (Kanesaki et al., 2002; Han et al., 2005), sucrose (Kohler et al., 2015), and glycerol (Finn et al., 2015) compared to controls all show a lower of the associated proteins than for NaCl compared to controls (Fig. 7b). Data from the study of Finn et al. (2015) are plotted at 1 and 6 h in the experiment, indicating a time-dependent decrease of under both NaCl and glycerol treatment as well as more negative values for glycerol than NaCl. Experiments with different strains of E. coli show a slightly more positive value for sucrose than NaCl (Shabala et al., 2009) and a much larger positive difference for urea compared to NaCl (Withman et al., 2013). The available proteomic data also show lower for sucrose (Kohler et al., 2015) and glucose (Schmidt et al., 2016) compared to NaCl (Fig. 7b). Note that the latter dataset is actually a comparison between growth on glucose and glucose with NaCl; growth on glucose alone produces a lower of the differentially expressed proteins.
The marked decrease of induced by solutes such as sorbitol, which does not permeate the plasma membrane, could result from a higher effective osmotic pressure compared to NaCl (Kanesaki et al., 2002). Because it permeates cells, solutions of urea are not considered hypertonic (Burg et al., 2007), which may be one reason for the higher for urea compared to NaCl. Sucrose, which permeates but unlike NaCl does not depolarize the plasma membrane (Shabala et al., 2009), produces a slightly higher than NaCl in one transcriptomics dataset for E. coli (Shabala et al., 2009) but has a more marked dehydrating effect in both transcriptomics and proteomics datasets for Caulobacter crescentus (Kohler et al., 2015). The negative shift of associated with most organic solutes compared to NaCl lends support to the notion that high organic loading could contribute to the relatively low of protein sequences from metagenomes of freshwater aquaculture systems (Fig. 6b).
Considering all transcriptomic datasets together (see Fig. S1 for references), the proteins coded by differentially expressed genes in non-halophilic bacteria under hyperosmotic stress do not show significant differences in ZC, , pI, or GRAVY (Fig. 7c–d). However, the average difference of would become more negative if the early time points in individual time-course experiments were excluded from the average (see Fig. 7a). Unlike the results for transcriptomes, the average value of GRAVY for all proteomics datasets (see Figs. S2 and S3 for references) increases significantly (Fig. 7f; p=0.011). The proteomic data also exhibit a small decrease of pI (p=0.083), which is expected for halophiles, but the increase of GRAVY – that is, higher hydrophobicity – is the opposite of the evolutionary trend for proteomes of halophilic organisms (Paul et al., 2008) and the metagenomic comparisons described above. Overall, the proteomic experiments record a significant decrease of in hyperosmotic stress (Fig. 7e; p=0.016). We therefore conclude that is a metric with consistent behavior for field and laboratory datasets, since it records decreasing hydration state of proteins with increasing salinity in the Baltic Sea and Amazon River and plume and of differentially expressed proteins in microbial cells grown under hyperosmotic stress.
This study was focused on describing the chemical compositions of proteins in a geochemical context. The theoretical novelty of this study is the derivation of a compositional metric for stoichiometric hydration state () that is largely decoupled from changes in oxidation state (ZC) of proteins. Therefore, based on mass-action effects in thermodynamics, is predicted to decrease toward higher salinity but be mostly insensitive to redox gradients. We found that protein sequences inferred from metagenomes in regional salinity gradients, including the Baltic Sea freshwater-marine transect and Amazon River and plume, are characterized by changes of in the predicted direction. Although this trend does not continue into hypersaline environments, the applicability of the compositional analysis to microbial cells is supported by compilations of transcriptomic and proteomic data, which indicate decreasing on average for the differentially expressed proteins in hyperosmotic stress experiments. The dehydration signal becomes larger during many time-course experiments and is stronger for most organic solutes than for NaCl.
The central message of this study is that geochemical and laboratory conditions can influence, but naturally do not completely determine, the chemical compositions of proteins. As a step toward constructing multidimensional chemical thermodynamic models of microbial communities, the present results provide evidence that different compositional metrics, representing the oxidation state and hydration state of molecules, can be associated specifically with redox and salinity gradients, respectively. The findings of this study underscore an opportunity for the integration of hydration state into evolutionary models that already consider changes in oxidation state or oxygen content of proteins (Acquisti et al., 2007; Poudel et al., 2018).
All metagenomic and metatranscriptomic data analyzed here were obtained
from public databases using the accession numbers listed in Supplement
Table S1 for salinity gradients and Table S2 for redox gradients.
The amino acid compositions of subsampled sequences from the metagenomic
and metatranscriptomic data are available in the JMDplots R package,
version 1.2.4 (https://github.com/jedick/JMDplots),
which is archived on Zenodo (Dick, 2020b). Specifically,
the data are contained in the file inst/extdata/gradH2O/MGP.rds,
which can be read using the R function readRDS (minimum R version:
2.3.0).
The compilation of differential gene expression data is available
in the JMDplots package as xz-compressed CSV files in the directory
inst/extdata/expression/osmotic/. The compilation of differential
protein expression data is in the corresponding directory of the canprot
R package, version 1.1.0 (https://cran.r-project.org/package=canprot),
which is also archived on Zenodo (Dick, 2020c). The results
of the compositional analysis of differential expression data, which
are used for Fig. 7, are in the inst/vignettes/
directories of the JMDplots and canprot packages.
The code used to make all of the figures and perform statistical testing
is in the JMDplots package. The gradH2O.Rmd vignette in the
package demonstrates the functions used to make the figures.
The supplement related to this article is available online at: https://doi.org/10.5194/bg-17-6145-2020-supplement.
JMD designed and carried out the analysis. JMD, MY, and JT interpreted the results. JMD wrote the article with editing input from MY and JT.
The authors declare that they have no conflict of interest.
We are grateful to Saroj Poudel for commenting on an earlier version of the manuscript.
This research has been supported by the State Key Laboratory of Organic Geochemistry (grant no. SKLOG-201928).
This paper was edited by Jack Middelburg and reviewed by two anonymous referees.
Acquisti, C., Kleffe, J., and Collins, S.: Oxygen content of transmembrane proteins over macroevolutionary time scales, Nature, 445, 47–52, https://doi.org/10.1038/nature05450, 2007. a, b
Akashi, H. and Gojobori, T.: Metabolic efficiency and amino acid composition in the proteomes of Escherichia coli and Bacillus subtilis, P. Natl. Acad. Sci., 99, 3695–3700, https://doi.org/10.1073/pnas.062526999, 2002. a, b
Alsop, E. B., Boyd, E. S., and Raymond, J.: Merging metagenomics and geochemistry reveals environmental controls on biological diversity and evolution, BMC Ecol., 14, 16, https://doi.org/10.1186/1472-6785-14-16, 2014. a
Amend, J. P. and LaRowe, D. E.: Mini-review: Demystifying microbial reaction energetics, Environ. Microbiol., 21, 3539–3547, https://doi.org/10.1111/1462-2920.14778, 2019. a, b, c
Amend, J. P. and Shock, E. L.: Energetics of amino acid synthesis in hydrothermal ecosystems, Science, 281, 1659–1662, https://doi.org/10.1126/science.281.5383.1659, 1998. a, b
Amend, J. P., LaRowe, D. E., McCollom, T. M., and Shock, E. L.: The energetics of organic synthesis inside and outside the cell, Philos. T. R. Soc. B, 368, 20120255, https://doi.org/10.1098/rstb.2012.0255, 2013. a
Anderson, G. M.: Thermodynamics of Natural Systems, Cambridge University Press, Cambridge, 2nd Edn., https://doi.org/10.1017/CBO9780511840258, 2005. a, b
Asplund-Samuelsson, J., Sundh, J., Dupont, C. L., Allen, A. E., McCrow, J. P., Celepli, N. A., Bergman, B., Ininbergs, K., and Ekman, M.: Diversity and expression of bacterial metacaspases in an aquatic ecosystem, Front. Microbiol., 7, 1043, https://doi.org/10.3389/fmicb.2016.01043, 2016. a
Baudouin-Cornu, P., Surdin-Kerjan, Y., Marlière, P., and Thomas, D.: Molecular evolution of protein atomic composition, Science, 293, 297–300, https://doi.org/10.1126/science.1061052, 2001. a
Bjellqvist, B., Hughes, G. J., Pasquali, C., Paquet, N., Ravier, F., Sanchez, J.-C., Frutiger, S., and Hochstrasser, D.: The focusing positions of polypeptides in immobilized pH gradients can be predicted from their amino acid sequences, Electrophoresis, 14, 1023–1031, https://doi.org/10.1002/elps.11501401163, 1993. a, b
Bjellqvist, B., Basse, B., Olsen, E., and Celis, J. E.: Reference points for comparisons of two-dimensional maps of proteins from different human cell types defined in a pH scale where isoelectric points correlate with polypeptide compositions, Electrophoresis, 15, 529–539, https://doi.org/10.1002/elps.1150150171, 1994. a, b, c
Boyd, E. S., Hamilton, T. L., Swanson, K. D., Howells, A. E., Baxter, B. K., Meuser, J. E., Posewitz, M. C., and Peters, J. W.: [FeFe]-hydrogenase abundance and diversity along a vertical redox gradient in Great Salt Lake, USA, Int. J. Mol. Sci., 15, 21947–21966, https://doi.org/10.3390/ijms151221947, 2014. a, b, c
Boyer, G. M., Schubotz, F., Summons, R. E., Woods, J., and Shock, E. L.: Carbon oxidation state in microbial polar lipids suggests adaptation to hot spring temperature and redox gradients, Front. Microbiol., 11, 229, https://doi.org/10.3389/fmicb.2020.00229, 2020. a, b
Braakman, R. and Smith, E.: The compositional and evolutionary logic of metabolism, Phys. Biol., 10, 011001, https://doi.org/10.1088/1478-3975/10/1/011001, 2013. a, b
Burg, M. B., Ferraris, J. D., and Dmitrieva, N. I.: Cellular response to hyperosmotic stresses, Physiol. Rev., 87, 1441–1474, https://doi.org/10.1152/physrev.00056.2006, 2007. a
Canovas III, P. A. and Shock, E. L.: Energetics of the citric acid cycle in the deep biosphere, in: Carbon in Earth's Interior, edited by: Manning, C. E., Lin, J.-F., and Mao, W. L., chap. 25, American Geophysical Union, 303–327, https://doi.org/10.1002/9781119508229.ch25, 2020. a
Chirife, J., Fontan, C. F., and Scorza, O. C.: The intracellular water activity of bacteria in relation to the water activity of the growth medium, J. Appl. Bacteriol., 50, 475–479, https://doi.org/10.1111/j.1365-2672.1981.tb04250.x, 1981. a
DeBerardinis, R. J. and Cheng, T.: Q's next: The diverse functions of glutamine in metabolism, cell biology and cancer, Oncogene, 29, 313–324, https://doi.org/10.1038/onc.2009.358, 2010. a
Dick, J. M.: Average oxidation state of carbon in proteins, J. Roy. Soc. Int., 11, 20131095, https://doi.org/10.1098/rsif.2013.1095, 2014. a, b, c
Dick, J. M.: Proteomic indicators of oxidation and hydration state in colorectal cancer, PeerJ, 4, e2238, https://doi.org/10.7717/peerj.2238, 2016. a, b
Dick, J. M.: Chemical composition and the potential for proteomic transformation in cancer, hypoxia, and hyperosmotic stress, PeerJ, 5, e3421, https://doi.org/10.7717/peerj.3421, 2017. a, b, c
Dick, J. M.: Water as a reactant in the differential expression of proteins in cancer, bioRxiv, https://doi.org/10.1101/2020.04.09.035022, 2020a. a
Dick, J. M.: JMDplots 1.2.4, Zenodo, https://doi.org/10.5281/zenodo.4111016, 2020b. a
Dick, J. M.: canprot 1.1.0, Zenodo, https://doi.org/10.5281/zenodo.4105653, 2020c. a
Dick, J. M. and Shock, E. L.: Calculation of the relative chemical stabilities of proteins as a function of temperature and redox chemistry in a hot spring, PLOS One, 6, e22782, https://doi.org/10.1371/journal.pone.0022782, 2011. a, b, c
Dick, J. M., Yu, M., Tan, J., and Lu, A.: Changes in carbon oxidation state of metagenomes along geochemical redox gradients, Front. Microbiol., 10, 120, https://doi.org/10.3389/fmicb.2019.00120, 2019. a, b, c, d, e, f
Du, B., Zielinski, D. C., Monk, J. M., and Palsson, B. O.: Thermodynamic favorability and pathway yield as evolutionary tradeoffs in biosynthetic pathway choice, P. Natl. Acad. Sci., 115, 11339–11344, https://doi.org/10.1073/pnas.1805367115, 2018. a, b
Dupont, C. L., Larsson, J., Yooseph, S., Ininbergs, K., Goll, J., Asplund-Samuelsson, J., McCrow, J. P., Celepli, N., Allen, L. Z., Ekman, M., Lucas, A. J., Hagström, Å., Thiagarajan, M., Brindefalk, B., Richter, A. R., Andersson, A. F., Tenney, A., Lundin, D., Tovchigrechko, A., Nylander, J. A. A., Brami, D., Badger, J. H., Allen, A. E., Rusch, D. B., Hoffman, J., Norrby, E., Friedman, R., Pinhassi, J., Venter, J. C., and Bergman, B.: Functional tradeoffs underpin salinity-driven divergence in microbial community composition, PLOS One, 9, e89549, https://doi.org/10.1371/journal.pone.0089549, 2014. a, b, c, d, e
Eiler, A., Zaremba-Niedzwiedzka, K., Martínez-García, M., McMahon, K. D., Stepanauskas, R., Andersson, S. G. E., and Bertilsson, S.: Productivity and salinity structuring of the microplankton revealed by comparative freshwater metagenomics, Environ. Microbiol., 16, 2682–2698, https://doi.org/10.1111/1462-2920.12301, 2014. a, b
Feist, A. M., Henry, C. S., Reed, J. L., Krummenacker, M., Joyce, A. R., Karp, P. D., Broadbelt, L. J., Hatzimanikatis, V., and Palsson, B. Ø.: A genome-scale metabolic reconstruction for Escherichia coli K-12 MG1655 that accounts for 1260 ORFs and thermodynamic information, Mol. Syst. Biol., 3, 121, https://doi.org/10.1038/msb4100155, 2007. a
Fernandez, A. B., Ghai, R., Martin-Cuadrado, A. B., Sanchez-Porro, C., Rodriguez-Valera, F., and Ventosa, A.: Metagenome sequencing of prokaryotic microbiota from two hypersaline ponds of a marine saltern in Santa Pola, Spain, Genome Announcements, 1, e00933-13, https://doi.org/10.1128/genomea.00933-13, 2013. a, b
Finn, S., Rogers, L., Händler, K., McClure, P., Amézquita, A., Hinton, J. C. D., and Fanning, S.: Exposure of Salmonella enterica serovar Typhimurium to three humectants used in the food industry induces different osmoadaptation systems, Appl. Environ. Microbiol., 81, 6800–6811, https://doi.org/10.1128/AEM.01379-15, 2015. a, b, c, d, e, f
Fortunato, C. S., Larson, B., Butterfield, D. A., and Huber, J. A.: Spatially distinct, temporally stable microbial populations mediate biogeochemical cycling at and below the seafloor in hydrothermal vent fluids, Environ. Microbiol., 20, 769–784, https://doi.org/10.1111/1462-2920.14011, 2018. a, b
Garner, M. M. and Burg, M. B.: Macromolecular crowding and confinement in cells exposed to hypertonicity, Am. J. Physiol., 266, C877–C892, https://doi.org/10.1152/ajpcell.1994.266.4.C877, 1994. a, b
Gasteiger, E., Hoogland, C., Gattiker, A., Duvaud, S., Wilkins, M. R., Appel, R. D., and Bairoch, A.: Protein identification and analysis tools on the ExPASy server, in: The Proteomics Protocols Handbook, edited by: Walker, J. M., Humana Press, Totowa, NJ, 571–607, https://doi.org/10.1385/1-59259-890-0:571, 2005. a
Ghai, R., Pašić, L., Fernández, A. B., Martin-Cuadrado, A.-B., Mizuno, C. M., McMahon, K. D., Papke, R. T., Stepanauskas, R., Rodriguez-Brito, B., Rohwer, F., Sánchez-Porro, C., Ventosa, A., and Rodríguez-Valera, F.: New abundant microbial groups in aquatic hypersaline environments, Sci. Rep., 1, 135, https://doi.org/10.1038/srep00135, 2011. a, b, c
Gunde-Cimerman, N., Plemenitaš, A., and Oren, A.: Strategies of adaptation of microorganisms of the three domains of life to high salt concentrations, FEMS Microbiol. Rev., 42, 353–375, https://doi.org/10.1093/femsre/fuy009, 2018. a
Han, D., Link, H., and Liesack, W.: Response of Methylocystis sp. strain SC2 to salt stress: Physiology, global transcriptome, and amino acid profiles, Appl. Environ. Microbiol., 83, e00866, https://doi.org/10.1128/AEM.00866-17, 2017. a, b
Han, Y., Zhou, D., Pang, X., Zhang, L., Song, Y., Tong, Z., Bao, J., Dai, E., Wang, J., Guo, Z., Zhai, J., Du, Z., Wang, X., Wang, J., Huang, P., and Yang, R.: Comparative transcriptome analysis of Yersinia pestis in response to hyperosmotic and high-salinity stress, Res. Microbiol., 156, 403–415, https://doi.org/10.1016/j.resmic.2004.10.004, 2005. a, b
Havig, J. R., Raymond, J., Meyer-Dombard, D. R., Zolotova, N., and Shock, E. L.: Merging isotopes and community genomics in a siliceous sinter-depositing hot spring, J. Geophys. Res., 116, G01005, https://doi.org/10.1029/2010JG001415, 2011. a, b
Huang, H., McGarvey, P. B., Suzek, B. E., Mazumder, R., Zhang, J., Chen, Y., and Wu, C. H.: A comprehensive protein-centric ID mapping service for molecular data integration, Bioinformatics, 27, 1190–1191, https://doi.org/10.1093/bioinformatics/btr101, 2011. a
Jevtić, v., Stoll, B., Pfeiffer, F., Sharma, K., Urlaub, H., Marchfelder, A., and Lenz, C.: The response of Haloferax volcanii to salt and temperature stress: A proteome study by label-free mass spectrometry, Proteomics, 19, 1800491, https://doi.org/10.1002/pmic.201800491, 2019. a
Kanesaki, Y., Suzuki, I., Allakhverdiev, S. I., Mikami, K., and Murata, N.: Salt stress and hyperosmotic stress regulate the expression of different sets of genes in Synechocystis sp. PCC 6803, Biochem. Biophys. Res. Commun., 290, 339–348, https://doi.org/10.1006/bbrc.2001.6201, 2002. a, b, c, d
Karl, D. M. and Grabowski, E.: The importance of H in particulate organic matter stoichiometry, export and energy flow, Front. Microbiol., 8, 826, https://doi.org/10.3389/fmicb.2017.00826, 2017. a
Kauffman, J. M.: Simple method for determination of oxidation numbers of atoms in compounds, J. Chem. Educat., 63, 474–475, https://doi.org/10.1021/ed063p474, 1986. a
Keegan, K. P., Glass, E. M., and Meyer, F.: MG-RAST, a metagenomics service for analysis of microbial community structure and function, in: Microbial Environmental Genomics (MEG), edited by: Martin, F. and Uroz, S., Springer, New York, 207–233, https://doi.org/10.1007/978-1-4939-3369-3_13, 2016. a
Kimbrel, J. A., Ballor, N., Wu, Y.-W., David, M. M., Hazen, T. C., Simmons, B. A., Singer, S. W., and Jansson, J. K.: Microbial community structure and functional potential along a hypersaline gradient, Front. Microbiol., 9, 1492, https://doi.org/10.3389/fmicb.2018.01492, 2018. a, b
Kocharunchitt, C., King, T., Gobius, K., Bowman, J. P., and Ross, T.: Global genome response of Escherichia coli O157:H7 Sakai during dynamic changes in growth kinetics induced by an abrupt downshift in water activity, PLOS One, 9, e90422, https://doi.org/10.1371/journal.pone.0090422, 2014. a, b, c
Kohler, C., Lourenço, R. F., Bernhardt, J., Albrecht, D., Schüler, J., Hecker, M., and Gomes, S. L.: A comprehensive genomic, transcriptomic and proteomic analysis of a hyperosmotic stress sensitive α-proteobacterium, BMC Microbiol., 15, 71, https://doi.org/10.1186/s12866-015-0404-x, 2015. a, b, c, d
Kopylova, E., Noé, L., and Touzet, H.: SortMeRNA: Fast and accurate filtering of ribosomal RNAs in metatranscriptomic data, Bioinformatics, 28, 3211–3217, https://doi.org/10.1093/bioinformatics/bts611, 2012. a
Kunin, V., Raes, J., Harris, J. K., Spear, J. R., Walker, J. J., Ivanova, N., von Mering, C., Bebout, B. M., Pace, N. R., Bork, P., and Hugenholtz, P.: Millimeter-scale genetic gradients and community-level molecular convergence in a hypersaline microbial mat, Mol. Syst. Biol., 4, 198, https://doi.org/10.1038/msb.2008.35, 2008. a, b, c, d
Kyte, J. and Doolittle, R. F.: A simple method for displaying the hydropathic character of a protein, J. Mol. Biol., 157, 105–132, https://doi.org/10.1016/0022-2836(82)90515-0, 1982. a, b
LaRowe, D. E. and Van Cappellen, P.: Degradation of natural organic matter: A thermodynamic analysis, Geochim. Cosmochim. Ac., 75, 2030–2042, https://doi.org/10.1016/j.gca.2011.01.020, 2011. a
Leuko, S., Raftery, M. J., Burns, B. P., Walter, M. R., and Neilan, B. A.: Global protein-level responses of Halobacterium salinarum NRC-1 to prolonged changes in external sodium chloride concentrations, J. Proteome Res., 8, 2218–2225, https://doi.org/10.1021/pr800663c, 2009. a
Ley, R. E., Harris, J. K., Wilcox, J., Spear, J. R., Miller, S. R., Bebout, B. M., Maresca, J. A., Bryant, D. A., Sogin, M. L., and Pace, N. R.: Unexpected diversity and complexity of the Guerrero Negro hypersaline microbial mat, Appl. Environ. Microbiol., 72, 3685–3695, https://doi.org/10.1128/AEM.72.5.3685-3695.2006, 2006. a
Lin, J., Liang, H., Yan, J., and Luo, L.: The molecular mechanism and post-transcriptional regulation characteristic of Tetragenococcus halophilus acclimation to osmotic stress revealed by quantitative proteomics, J. Proteomics, 168, 1–14, https://doi.org/10.1016/j.jprot.2017.08.014, 2017. a
Lindsay, M. R., Amenabar, M. J., Fecteau, K. M., Debes II, R. V., Fernandes Martins, M. C., Fristad, K. E., Xu, H., Hoehler, T. M., Shock, E. L., and Boyd, E. S.: Subsurface processes influence oxidant availability and chemoautotrophic hydrogen metabolism in Yellowstone hot springs, Geobiology, 16, 674–692, https://doi.org/10.1111/gbi.12308, 2018. a
May, P. M. and Rowland, D.: JESS, a Joint Expert Speciation System – VI: thermodynamically-consistent standard Gibbs energies of reaction for aqueous solutions, New J. Chem., 42, 7617–7629, https://doi.org/10.1039/C7NJ03597G, 2018. a
Milo, R., Jorgensen, P., Moran, U., Weber, G., and Springer, M.: BioNumbers—the database of key numbers in molecular and cell biology, Nucl. Acid. Res., 38, D750–D753, https://doi.org/10.1093/nar/gkp889, 2010. a
Minkiewicz, P., Darewicz, M., and Iwaniak, A.: Introducing a simple equation to express oxidation states as an alternative to using rules associated with words alone, J. Chem. Educat., 95, 340–342, https://doi.org/10.1021/acs.jchemed.7b00322, 2018. a
Morowitz, H. J.: A theory of biochemical organization, metabolic pathways, and evolution, Complexity, 4, 39–53, https://doi.org/10.1002/(SICI)1099-0526(199907/08)4:6<39::AID-CPLX8>3.0.CO;2-2, 1999. a, b
Möller, M. N., Li, Q., Chinnaraj, M., Cheung, H. C., Lancaster, J. R., and Denicola, A.: Solubility and diffusion of oxygen in phospholipid membranes, Biochim. Biophys. Ac., 1858, 2923–2930, https://doi.org/10.1016/j.bbamem.2016.09.003, 2016. a
O'Leary, N. A., Wright, M. W., Brister, J. R., Ciufo, S., Haddad, D., McVeigh, R., Rajput, B., Robbertse, B., Smith-White, B., Ako-Adjei, D., Astashyn, A., Badretdin, A., Bao, Y., Blinkova, O., Brover, V., Chetvernin, V., Choi, J., Cox, E., Ermolaeva, O., Farrell, C. M., Goldfarb, T., Gupta, T., Haft, D., Hatcher, E., Hlavina, W., Joardar, V. S., Kodali, V. K., Li, W., Maglott, D., Masterson, P., McGarvey, K. M., Murphy, M. R., O'Neill, K., Pujar, S., Rangwala, S. H., Rausch, D., Riddick, L. D., Schoch, C., Shkeda, A., Storz, S. S., Sun, H., Thibaud-Nissen, F., Tolstoy, I., Tully, R. E., Vatsan, A. R., Wallin, C., Webb, D., Wu, W., Landrum, M. J., Kimchi, A., Tatusova, T., DiCuccio, M., Kitts, P., Murphy, T. D., and Pruitt, K. D.: Reference sequence (RefSeq) database at NCBI: current status, taxonomic expansion, and functional annotation, Nucl. Acid. Res., 44, D733–D745, https://doi.org/10.1093/nar/gkv1189, 2016. a
Ooka, H., McGlynn, S. E., and Nakamura, R.: Electrochemistry at deep-sea hydrothermal vents: Utilization of the thermodynamic driving force towards the autotrophic origin of life, ChemElectroChem, 6, 1316–1323, https://doi.org/10.1002/celc.201801432, 2019. a
Oren, A.: Life at high salt concentrations, intracellular KCl concentrations, and acidic proteomes, Front. Microbiol., 4, 315, https://doi.org/10.3389/fmicb.2013.00315, 2013. a, b, c
Paul, S., Bag, S. K., Das, S., Harvill, E. T., and Dutta, C.: Molecular signature of hypersaline adaptation: insights from genome and proteome composition of halophilic prokaryotes, Genome Biol., 9, R70, https://doi.org/10.1186/gb-2008-9-4-r70, 2008. a, b, c, d, e, f
Poudel, S., Colman, D. R., Fixen, K. R., Ledbetter, R. N., Zheng, Y., Pence, N., Seefeldt, L. C., Peters, J. W., Harwood, C. S., and Boyd, E. S.: Electron transfer to nitrogenase in different genomic and metabolic backgrounds, J. Bacteriol., 200, e00757, https://doi.org/10.1128/JB.00757-17, 2018. a, b, c, d, e, f, g, h, i
Qiao, J., Huang, S., Te, R., Wang, J., Chen, L., and Zhang, W.: Integrated proteomic and transcriptomic analysis reveals novel genes and regulatory mechanisms involved in salt stress responses in Synechocystis sp. PCC 6803, Appl. Microbiol. Biotechnol., 97, 8253–8264, https://doi.org/10.1007/s00253-013-5139-8, 2013. a, b, c
R Core Team: R: A Language and Environment for Statistical Computing, R Foundation for Statistical Computing, Vienna, Austria, https://www.R-project.org, last access: 21 October 2020. a
Record, Jr., M. T., Courtenay, E. S., Cayley, D. S., and Guttman, H. J.: Responses of E. coli to osmotic stress: Large changes in amounts of cytoplasmic solutes and water, Trend. Biochem. Sci., 23, 143–148, https://doi.org/10.1016/S0968-0004(98)01196-7, 1998. a, b
Reeves, E. P., McDermott, J. M., and Seewald, J. S.: The origin of methanethiol in midocean ridge hydrothermal fluids, P. Natl. Acad. Sci., 111, 5474–5479, https://doi.org/10.1073/pnas.1400643111, 2014. a, b
Reveillaud, J., Reddington, E., McDermott, J., Algar, C., Meyer, J. L., Sylva, S., Seewald, J., German, C. R., and Huber, J. A.: Subseafloor microbial communities in hydrogen-rich vent fluids from hydrothermal systems along the Mid-Cayman Rise, Environ. Microbiol., 18, 1970–1987, https://doi.org/10.1111/1462-2920.13173, 2016. a, b
Rho, M., Tang, H., and Ye, Y.: FragGeneScan: Predicting genes in short and error-prone reads, Nucl. Acid. Res., 38, e191, https://doi.org/10.1093/nar/gkq747, 2010. a
Rhodes, M. E., Fitz-Gibbon, S. T., Oren, A., and House, C. H.: Amino acid signatures of salinity on an environmental scale with a focus on the Dead Sea, Environ. Microbiol., 12, 2613–2623, https://doi.org/10.1111/j.1462-2920.2010.02232.x, 2010. a
Rodriguez-Brito, B., Li, L., Wegley, L., Furlan, M., Angly, F., Breitbart, M., Buchanan, J., Desnues, C., Dinsdale, E., Edwards, R., Felts, B., Haynes, M., Liu, H., Lipson, D., Mahaffy, J., Martin-Cuadrado, A. B., Mira, A., Nulton, J., Pašić, L., Rayhawk, S., Rodriguez-Mueller, J., Rodriguez-Valera, F., Salamon, P., Srinagesh, S., Thingstad, T. F., Tran, T., Thurber, R. V., Willner, D., Youle, M., and Rohwer, F.: Viral and microbial community dynamics in four aquatic environments, ISME J., 4, 739–751, https://doi.org/10.1038/ismej.2010.1, 2010. a, b, c, d
Satinsky, B. M., Zielinski, B. L., Doherty, M., Smith, C. B., Sharma, S., Paul, J. H., Crump, B. C., and Moran, M. A.: The Amazon continuum dataset: quantitative metagenomic and metatranscriptomic inventories of the Amazon River plume, June 2010, Microbiome, 2, 17, https://doi.org/10.1186/2049-2618-2-17, 2014. a, b, c
Satinsky, B. M., Fortunato, C. S., Doherty, M., Smith, C. B., Sharma, S., Ward, N. D., Krusche, A. V., Yager, P. L., Richey, J. E., Moran, M. A., and Crump, B. C.: Metagenomic and metatranscriptomic inventories of the lower Amazon River, May 2011, Microbiome, 3, 39, https://doi.org/10.1186/s40168-015-0099-0, 2015. a, b, c
Schmidt, A., Kochanowski, K., Vedelaar, S., Ahrné, E., Volkmer, B., Callipo, L., Knoops, K., Bauer, M., Aebersold, R., and Heinemann, M.: The quantitative and condition-dependent Escherichia coli proteome, Nat. Biotechnol., 34, 104–110, https://doi.org/10.1038/nbt.3418, 2016. a, b
Shabala, L., Bowman, J., Brown, J., Ross, T., McMeekin, T., and Shabala, S.: Ion transport and osmotic adjustment in Escherichia coli in response to ionic and non-ionic osmotica, Environ. Microbiol., 11, 137–148, https://doi.org/10.1111/j.1462-2920.2008.01748.x, 2009. a, b, c, d, e
Shock, E. L., Holland, M., Meyer-Dombard, D. R., Amend, J. P., Osburn, G. R., and Fischer, T. P.: Quantifying inorganic sources of geochemical energy in hydrothermal ecosystems, Yellowstone National Park, USA, Geochim. Cosmochim. Ac., 74, 4005–4043, https://doi.org/10.1016/j.gca.2009.08.036, 2010. a, b
Simon, H. M., Smith, M. W., and Herfort, L.: Metagenomic insights into particles and their associated microbiota in a coastal margin ecosystem, Front. Microbiol., 5, 466, https://doi.org/10.3389/fmicb.2014.00466, 2014. a, b
Slonczewski, J. L., Fujisawa, M., Dopson, M., and Krulwich, T. A.: Cytoplasmic pH measurement and homeostasis in bacteria and archaea, in: Advances in Microbial Physiology, edited by: Poole, R. K., Vol. 55, Academic Press, New York, 1–79, https://doi.org/10.1016/S0065-2911(09)05501-5, 2009. a
Solheim, M., La Rosa, S. L., Mathisen, T., Snipen, L. G., Nes, I. F., and Brede, D. A.: Transcriptomic and functional analysis of NaCl-induced stress in Enterococcus faecalis, PLOS One, 9, e94571, https://doi.org/10.1371/journal.pone.0094571, 2014. a, b
Sterner, R. and Liebl, W.: Thermophilic adaptation of proteins, Crit. Rev. Biochem. Mol., 36, 39–106, https://doi.org/10.1080/20014091074174, 2001. a
Swingley, W. D., Meyer-Dombard, D. R., Shock, E. L., Alsop, E. B., Falenski, H. D., Havig, J. R., and Raymond, J.: Coordinating environmental genomics and geochemistry reveals metabolic transitions in a hot spring ecosystem, PLOS One, 7, e38108, https://doi.org/10.1371/journal.pone.0038108, 2012. a, b, c, d
The UniProt Consortium: UniProt: A worldwide hub of protein knowledge, Nucl. Acid. Res., 47, D506–D515, https://doi.org/10.1093/nar/gky1049, 2019. a
Turner, C. B., Wade, B. D., Meyer, J. R., Sommerfeld, B. A., and Lenski, R. E.: Evolution of organismal stoichiometry in a long-term experiment with Escherichia coli, Roy. Soc. Open Sci., 4, 170497, https://doi.org/10.1098/rsos.170497, 2017. a
Vavourakis, C. D., Ghai, R., Rodriguez-Valera, F., Sorokin, D. Y., Tringe, S. G., Hugenholtz, P., and Muyzer, G.: Metagenomic insights into the uncultured diversity and physiology of microbes in four hypersaline soda lake brines, Front. Microbiol., 7, 211, https://doi.org/10.3389/fmicb.2016.00211, 2016. a, b
Wagner, A.: Energy constraints on the evolution of gene expression, Mol. Biol. Evol., 22, 1365–1374, https://doi.org/10.1093/molbev/msi126, 2005. a, b
Walsh, C. T., Tu, B. P., and Tang, Y.: Eight kinetically stable but thermodynamically activated molecules that power cell metabolism, Chem. Rev., 118, 1460–1494, https://doi.org/10.1021/acs.chemrev.7b00510, 2018. a, b
Wang, Y., Bryan, C., Xu, H., and Gao, H.: Nanogeochemistry: Geochemical reactions and mass transfers in nanopores, Geology, 31, 387–390, https://doi.org/10.1130/0091-7613(2003)031<0387:NGRAMT>2.0.CO;2, 2003. a, b
Warn, J. R. W. and Peters, A. P. H.: Concise Chemical Thermodynamics, CRC Press, 2nd Edn., 1996. a
Withman, B., Gunasekera, T. S., Beesetty, P., Agans, R., and Paliy, O.: Transcriptional responses of uropathogenic Escherichia coli to increased environmental osmolality caused by salt or urea, Infect. Immun., 81, 80–89, https://doi.org/10.1128/IAI.01049-12, 2013. a, b, c
Youens-Clark, K., Bomhoff, M., Ponsero, A. J., Wood-Charlson, E. M., Lynch, J., Choi, I., Hartman, J. H., and Hurwitz, B. L.: iMicrobe: Tools and data-driven discovery platform for the microbiome sciences, GigaScience, 8, giz083, https://doi.org/10.1093/gigascience/giz083, 2019. a
Zeldovich, K. B., Berezovsky, I. N., and Shakhnovich, E. I.: Protein and DNA sequence determinants of thermophilic adaptation, PLOS Comput. Biol., 3, e5, https://doi.org/10.1371/journal.pcbi.0030005, 2007. a, b
Zhang, Y., Li, Y., Zhang, Y., Wang, Z., Zhao, M., Su, N., Zhang, T., Chen, L., Wei, W., Luo, J., Zhou, Y., Xu, Y., Xu, P., Li, W., and Tao, Y.: Quantitative proteomics reveals membrane protein-mediated hypersaline sensitivity and adaptation in halophilic Nocardiopsis xinjiangensis, J. Proteome Res., 15, 68–85, https://doi.org/10.1021/acs.jproteome.5b00526, 2016. a