the Creative Commons Attribution 4.0 License.
the Creative Commons Attribution 4.0 License.
 | 09 Dec 2020
Spatial variations in terrestrial net ecosystem productivity and its local indicators
Erqian Cui
Chenyu Bian
Shuli Niu
Yingping Wang
Jianyang Xia
Multiple lines of evidence have demonstrated the persistence of global land carbon (C) sink during the past several decades. However, both annual net ecosystem productivity (NEP) and its inter-annual variation (IAVNEP) keep varying over space. Thus, identifying local indicators for the spatially varying NEP and IAVNEP is critical for locating the major and sustainable C sinks on land. Here, based on daily NEP observations from FLUXNET sites and large-scale estimates from an atmospheric-inversion product, we found a robust logarithmic correlation between annual NEP and seasonal carbon uptake–release ratio (i.e. U ∕ R). The cross-site variation in mean annual NEP could be logarithmically indicated by U ∕ R, while the spatial distribution of IAVNEP was associated with the slope (i.e. β) of the logarithmic correlation between annual NEP and U ∕ R. Among biomes, for example, forests and croplands had the largest U ∕ R ratio (1.06 ± 0.83) and β (473 ± 112 g C m−2 yr−1), indicating the highest NEP and IAVNEP in forests and croplands, respectively. We further showed that these two simple indicators could directly infer the spatial variations in NEP and IAVNEP in global gridded NEP products. Overall, this study provides two simple local indicators for the intricate spatial variations in the strength and stability of land C sinks. These indicators could be helpful for locating the persistent terrestrial C sinks and provide valuable constraints for improving the simulation of land–atmospheric C exchanges.
- Article
(2235 KB) - Full-text XML
-
Supplement
(616 KB) - BibTeX
- EndNote


Terrestrial ecosystems reabsorb about one-quarter of anthropogenic CO2 emission (Ciais et al., 2019) and are primarily responsible for the recent temporal fluctuations in the measured atmospheric-CO2 growth rate (Randerson, 2013; Le Quéré et al., 2018). In addition, evidence based on eddy-flux measurements (Baldocchi et al., 2018; Rödenbeck et al., 2018), aircraft atmospheric budgets (Peylin et al., 2013) and process-based model simulations (Poulter et al., 2014; Ahlström et al., 2015) has shown a large spatial variability in net ecosystem productivity (NEP) on land. The elusive variation in terrestrial NEP over space refers to both of the substantial varying mean annual NEP and the divergent inter-annual variability (IAV) in NEP (i.e. IAVNEP; usually quantified as the standard deviation of annual NEP) across space (Baldocchi et al., 2018; Marcolla et al., 2017). The mean annual NEP is related to the strength of carbon exchange of a specific ecosystem (Randerson et al., 2002; Luo and Weng, 2011; Jung et al., 2017), while IAVNEP characterizes the stability of such a carbon exchange (Musavi et al., 2017). Thus, whether and how NEP and IAVNEP change over space is important for predicting the future locations of carbon sinks on land (Yu et al., 2014; Niu et al., 2017).
Large spatial difference in terrestrial NEP has been reported from eddy-flux measurements, model outputs and atmospheric-inversion products. In addition, the global average IAV of NEP is large relative to global annual mean NEP (Baldocchi et al., 2018). More importantly, the spatial variations in NEP and IAVNEP have been typically underestimated by the global flux-tower-based product and the process-based global models (Jung et al., 2020; Fu et al., 2019). These discrepancies have further revealed the necessity of identifying local indicators for the spatially varying NEP and IAVNEP separately. The NEP in terrestrial ecosystems is determined by two components, including vegetation photosynthesis and ecosystem respiration (Reichstein et al., 2005), and their relative difference could determine the spatial variation in NEP (Baldocchi et al., 2015; Biederman et al., 2016). Many previous analyses have attributed the IAVNEP at the site level to the different sensitivities of ecosystem photosynthesis and respiration to environmental drivers (Gilmanov et al., 2005; Reichstein et al., 2005) and biotic controls (Besnard et al., 2018; Musavi et al., 2017). For example, some studies have reported that IAVNEP is more associated with variations in photosynthesis than carbon release (Ahlström et al., 2015; Novick et al., 2015; Li et al., 2017), whereas others have indicated that respiration is more sensitive to anomalous climate variability (Valentini et al., 2000; von Buttlar et al., 2018). However, despite previous efforts in a predictive understanding of the land–atmospheric C exchanges, the multi-model spread has not reduced over time (Arora et al., 2020). Therefore, it is imperative to explore the potential indicators for the spatially varying NEP, which could help attribute the spatial variation in NEP and IAVNEP into different processes and provide valuable constraints for the global C cycle. Alternatively, the annual NEP of a given ecosystem can be also directly decomposed into net CO2 uptake flux and CO2 release flux (Gray et al., 2014), which are more direct components for NEP (Fu et al., 2019). It is still unclear how the ecosystem net CO2 uptake and release fluxes would control the spatially varying NEP.
Conceptually, the total net CO2 uptake flux (U) is determined by the length of the CO2 uptake period (CUP) and the CO2 uptake rate, while the total net CO2 release flux (R) depends on the length of the CO2 release period (CRP) and the CO2 release rate (Fig. 1b). The variations in NEP thus could be attributed to these decomposed components. A strong spatial correlation between mean annual NEP and length of the CO2 uptake period has been reported in evergreen needle- and broad-leaved forests (Churkina et al., 2005; Richardson et al., 2013; Keenan et al., 2014), whereas atmospheric-inversion data and vegetation photosynthesis models indicated a dominant role of the maximal carbon uptake rate (Fu et al., 2017; Zhou et al., 2017). However, the relative importance of these phenological and physiological indicators for the spatially varying NEP remains unclear.
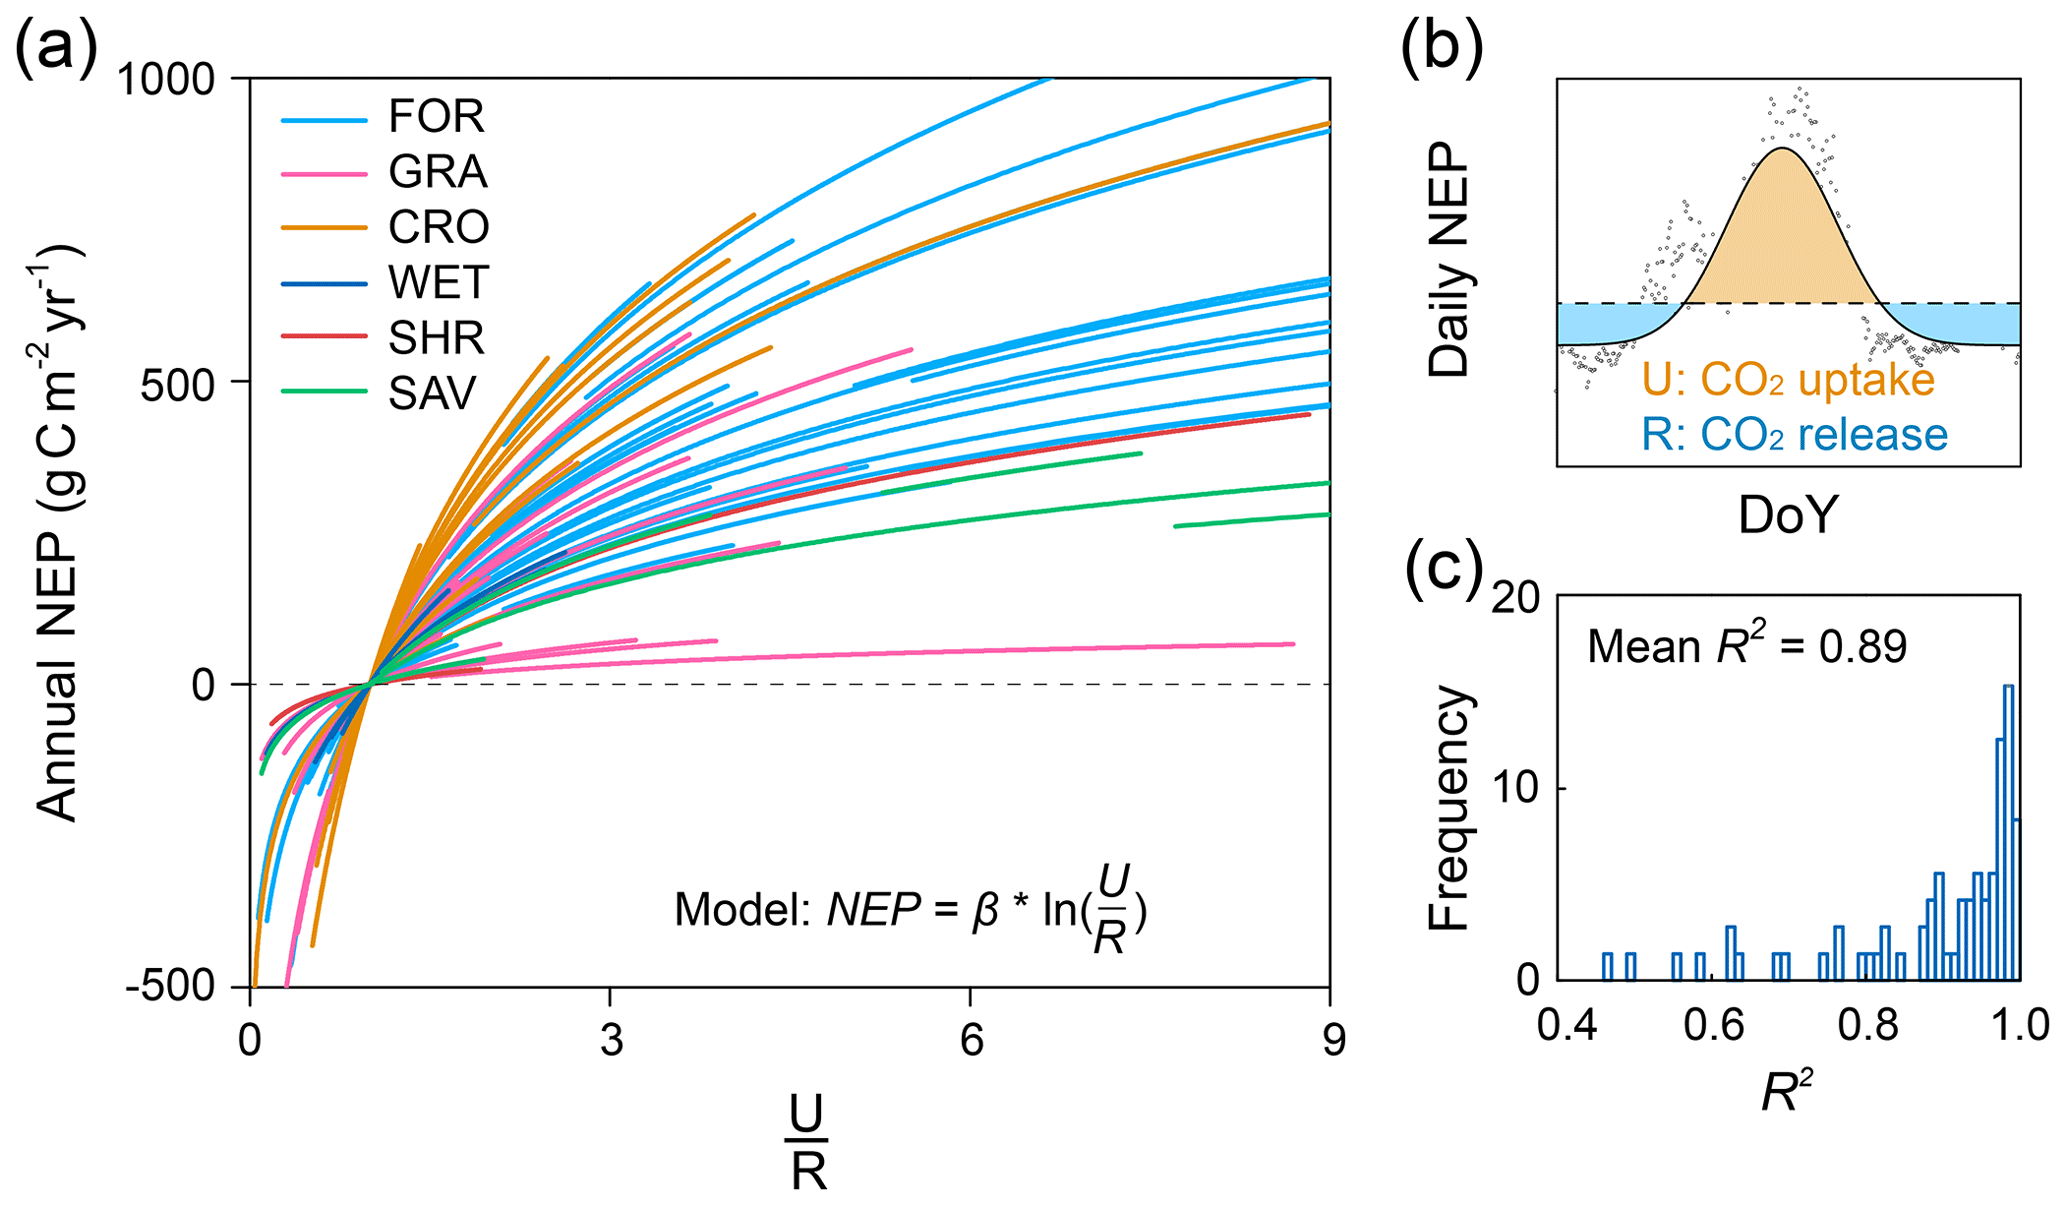
Figure 1Relationship between annual NEP and U ∕ R for 72 FLUXNET sites (of the form ). (a) Dependence of annual NEP on the ratio between total CO2 exchanges during net uptake (U) and release (R) periods (i.e. U ∕ R). Each line represents one flux site with at least 5 years of observations. (b) Conceptual figure for the decomposition framework introduced in this study. Annual NEP can be quantitatively decomposed into the following indicators: . (c) Distribution of the explanation of U ∕ R on temporal variability in NEP (R2) for FLUXNET sites.
In this study, we decomposed annual NEP into U and R and explored the local indicators for spatially varying NEP. Based on the eddy-covariance fluxes from the FLUXNET2015 dataset (Pastorello et al., 2017) and the atmospheric-inversion product (Rödenbeck et al., 2018), we examined the relationship between NEP and its direct components. In addition, we used the observations to evaluate the spatial variations in NEP and IAVNEP in the FLUXCOM product and a process-based model (CLM4.5; Oleson et al., 2013). The major aim of this study is to explore whether there are useful local indicators for the spatially varying NEP and IAVNEP in terrestrial ecosystems.
2.1 Datasets
Daily NEP observations of eddy-covariance sites are obtained from the FLUXNET2015 Tier 1 dataset. The FLUXNET2015 dataset provides half-hourly data of carbon, water and energy fluxes at over 210 sites that are standardized and gap-filled (Pastorello et al., 2017). However, time series of most sites are still too short for the analysis of inter-annual variation in NEP. So only the sites that provided the availability of eddy-covariance flux measurements for at least 5 years are selected. This leads to a global dataset of 72 sites with different biomes across different climatic regions. Based on the biome classification from the International Geosphere–Biosphere Programme (IGBP) provided for the FLUXNET2015 sites, the selected sites include 35 forests (FORs), 15 grasslands (GRAs), 11 croplands (CROs), 4 wetlands (WETs), 2 shrublands (SHR) and 5 savannas (SAVs; Fig. S1 and Table S1 in the Supplement).
The Jena CarboScope inversion product combines high-precision measurements of atmospheric-CO2 concentration with simulated atmospheric transport to infer the net CO2 exchanges between land, ocean and atmosphere at large scales (Rödenbeck et al., 2018). Here, we used the daily land–atmosphere CO2 fluxes from the s85_v4.1 version at a spatial resolution of . Considering the relatively low spatial resolution of the Jena CarboScope inversion product, the daily fluxes were only used to calculate the local indicators for the spatially varying NEP at the global scale.
Daily NEP simulations from the Community Land Model version 4.5 (CLM4.5) were also used to calculate the local indicators for the spatially varying NEP at the corresponding flux tower sites. We ran the CLM4.5 model from 1985 to 2010 at a spatial resolution of 1∘ with meteorological forcing from the Climate Research Unit and National Centers for Environmental Prediction (CRUNCEP). Here, NEP was derived as the difference between gross primary productivity (GPP) and total ecosystem respiration (TER), and TER was calculated as the sum of simulated autotrophic and heterotrophic respiration. The daily outputs from CLM4.5 were used to calculate the local indicators for the spatially varying NEP at both the global scale and the FLUXNET site level.
The FLUXCOM product presents an upscaling of carbon flux estimates from 224 flux tower sites based on multiple machine-learning algorithms and meteorological drivers (Jung et al., 2017). To be consistent with the meteorological forcing of the Jena CarboScope inversion product and the CLM4.5 model, we used the FLUXCOM CRUNCEPv6 products. In addition, in order to reduce the uncertainty caused by machine-learning methods, we averaged all the FLUXCOM CRUNCEPv6 products with different machine-learning methods. It should be noted that the inter-annual variability in the FLUXCOM product is driven by meteorological measurements and satellite data, which partially include information on vegetation state and other land surface properties. Daily outputs from FLUXCOM for the period 1985–2010 at 0.5∘ spatial resolution were used to calculate the local indicators for the spatially varying NEP at both the global scale and the FLUXNET site level.
2.2 Decomposition of NEP and the calculations for its local indicators
The annual NEP of a given ecosystem can be defined numerically as the difference between the net CO2 uptake and release (Fig. 1b). These components of NEP contain both photosynthesis and respiration flux, which directly indicate the net CO2 exchange of an ecosystem. The total net CO2 uptake flux (U) and the total net CO2 release flux (R) can be further decomposed as
where CUP (d yr−1) is the length of the CO2 uptake period, and CRP (d yr−1) is the length of the CO2 release period; (g C m−2 d−1) is the mean daily net CO2 uptake over CUP, and (g C m−2 d−1) represents the mean daily net CO2 release over CRP. Many studies have reported that the vegetation net CO2 uptake during the growing season and the non-growing season soil net CO2 release are tightly correlated (Luo and Zhou, 2006; Zhao et al., 2016). Therefore, we further tested the relationship between annual NEP and U ∕ R (i.e. , which reflects the seasonal carbon uptake–release ratio. Consequently, NEP in any given ecosystem can be expressed as (Fig. S2)
where the parameter β represents the slope of the linear relationship of , indicating the site-level carbon uptake sensitivity. Based on the definitions of U and R, the ratio U ∕ R can be further written as
The ratio of reflects the relative physiological difference between ecosystem CO2 uptake and release strength, while the ratio of is an indicator of net ecosystem CO2 exchange phenology. Environmental changes may regulate these ecological processes and ultimately affect the ecosystem NEP. The slope β indicates the response sensitivity of NEP to the changes in phenology and physiological processes. All of β, and were then calculated from the selected eddy-covariance sites and the corresponding pixels of these sites in models. These derived indicators from eddy-covariance sites were then used to benchmark the results extracted from the same locations in models.
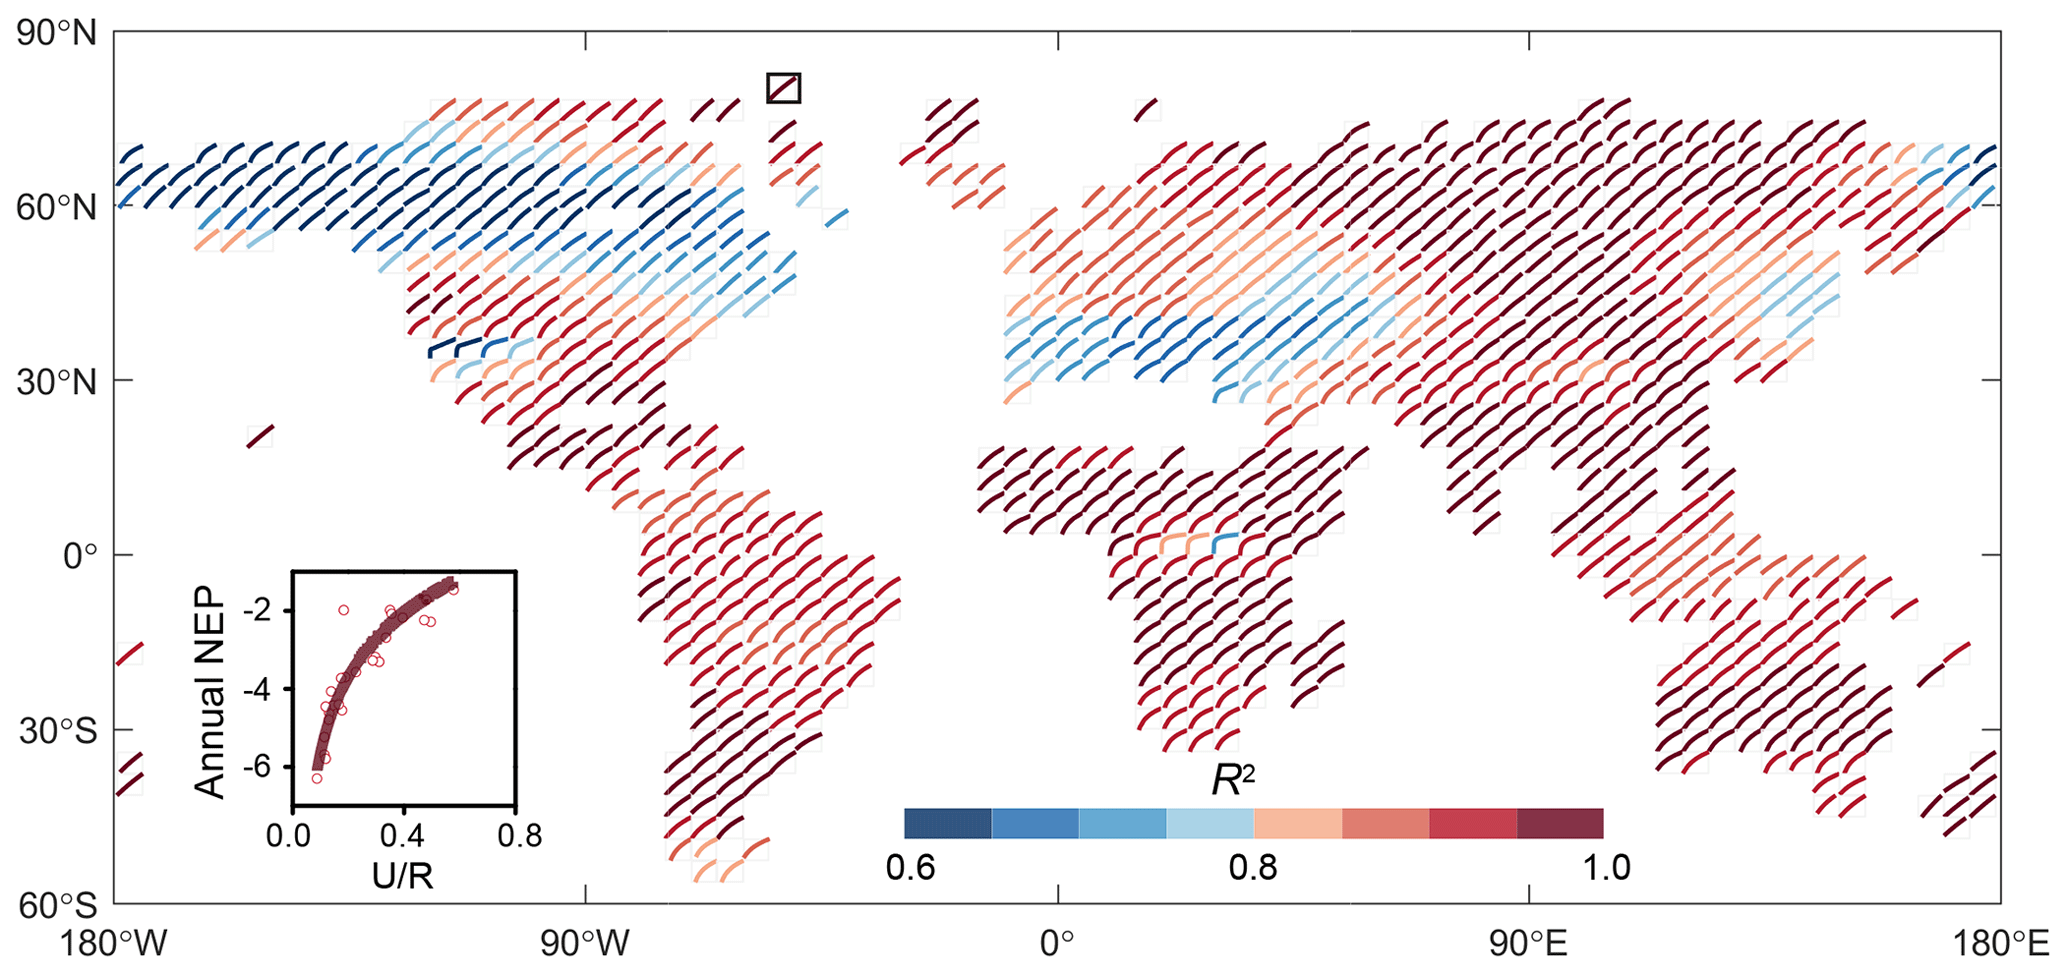
Figure 2Relationship between annual NEP and U ∕ R for the Jena CarboScope inversion product (of the form ). The black box indicates the location of the sample.
2.3 Calculation of the relative contributions
We further quantified the relative contributions of and in driving the spatial variations in NEP:
For each eddy-covariance site, the parameter β was constant. Then, we used a relative-importance analysis method to quantify the relative contributions of these two ratios to the spatial variations in NEP. The algorithm was performed with the “relaimpo” package in R (R Development Core Team, 2011). The relaimpo package is based on variance decomposition for multiple-linear-regression models. We chose the most commonly used method named “Lindeman–Merenda–Gold” (LMG; Grömping, 2007) from the methods provided by the relaimpo package. This method allows us to quantify the contributions of explanatory variables in a multiple-linear-regression model. Across the 72 FLUXNET sites, we quantified the relative importance of and to cross-site changes in NEP.
3.1 The relationship between NEP and its direct components
To find local indicators for the spatially varying NEP in terrestrial ecosystems, we tested the relationship between NEP and its direct components (U and R) across the 72 flux tower sites. The results showed that annual NEP was closely related to the ratio U ∕ R (Fig. S2). The logarithmic correlations between annual NEP and U ∕ R were significant at all sites (Fig. 1a), and ∼90 % of R2 values fall within a range of 0.7 to 1 (Fig. 1c).
In addition, the relationship between NEP and U ∕ R was also confirmed by the atmospheric-inversion product (i.e. Jena CarboScope inversion). The control of U ∕ R on annual NEP was robust in most global grid cells (i.e. ). The coefficient of determination for this relationship was higher in 80 % of the regions but lower in North America (Fig. 2). These two datasets both showed that the indicator U ∕ R could successfully capture the variability in annual NEP.
3.2 Local indicators for spatially varying NEP
Across the 72 flux tower sites, the across-site variation in mean annual NEP was significantly correlated to mean annual of each site (R2=0.65, P<0.01; Fig. 3a). In this network, the mean annual ratio was a good indicator for cross-site variation in NEP. By contrast, the spatial variation in IAVNEP was moderately explained by the slope (i.e. β) of the temporal correlation between NEP and at each site (R2=0.39, P<0.01; Fig. 3b) rather than (Fig. S3). The wide range of the ratio β reveals a large divergence in NEP sensitivity across biomes, ranging from 121 ± 118 g C m−2 yr−1 in shrubland to 473 ± 112 g C m−2 yr−1 in cropland.

Figure 3Contributions of the two indicators in explaining the spatial patterns of mean annual NEP and IAVNEP. (a) The relationship between annual mean NEP and across FLUXNET sites (R2=0.65, P<0.01). The insets show the magnitude of for different terrestrial biomes. (b) The explanation of β in IAVNEP (R2=0.39, P<0.01). The insets show the distribution of parameter β for different terrestrial biomes. The number of years at each site is indicated with the size of the point.
The decomposition of indicator U ∕ R into and allowed us to quantify the relative importance of these two ratios in driving NEP variability. The linear regression and relative-importance analysis showed a more important role of (58 %) than (42 %) in explaining the cross-site variation in NEP (Fig. 4). Therefore, the spatial distribution of mean annual NEP was more strongly driven by the phenological changes.
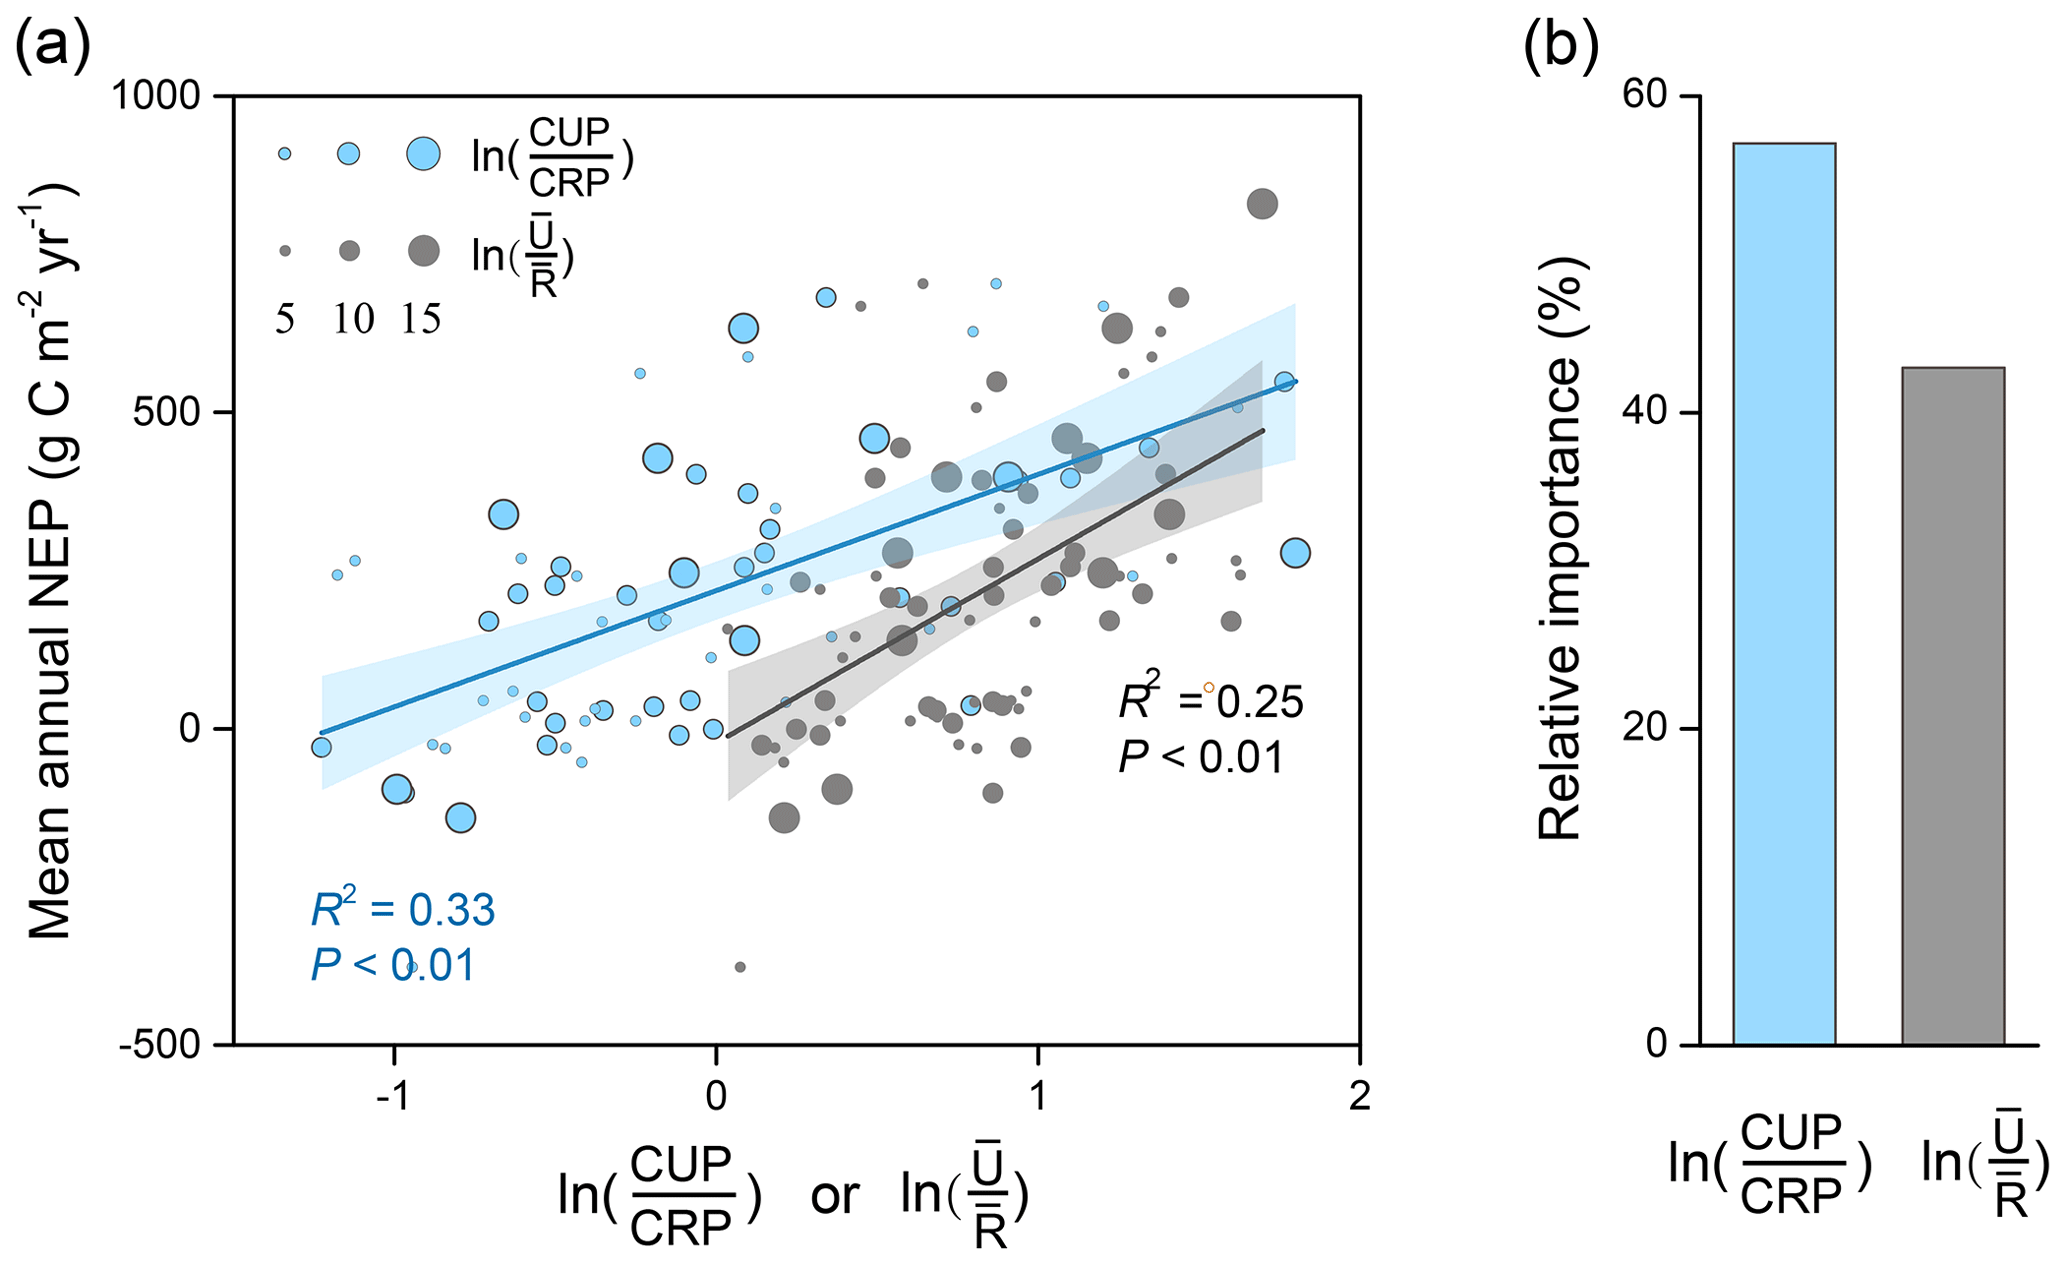
Figure 4The relative contributions of the local indicators in explaining the spatial patterns of mean annual NEP. (a) The linear regression between mean annual NEP with (R2=0.33, P<0.01) and (R2=0.25, P<0.01) across sites. (b) The relative contributions of each indicator to the spatial variation in mean annual NEP. The number of years at each site is indicated with the size of the point.
3.3 Simulated spatial variations in NEP by models
We further used these two simple indicators (i.e. and β) to evaluate the simulated spatial variations in NEP by the global flux-tower-based product (i.e. FLUXCOM) and a widely used process-based model at the FLUXNET site level (i.e. CLM4.5). We found that the low spatial variation in mean annual NEP in FLUXCOM and CLM4.5 could be inferred from their more converging than flux tower measurements (Fig. 5). The underestimated variation in IAVNEP in these modelling results was also clearly shown by the smaller β values (268.22, 126.00 and 145.08 for FLUXNET, FLUXCOM and CLM4.5, respectively; Fig. 5b).
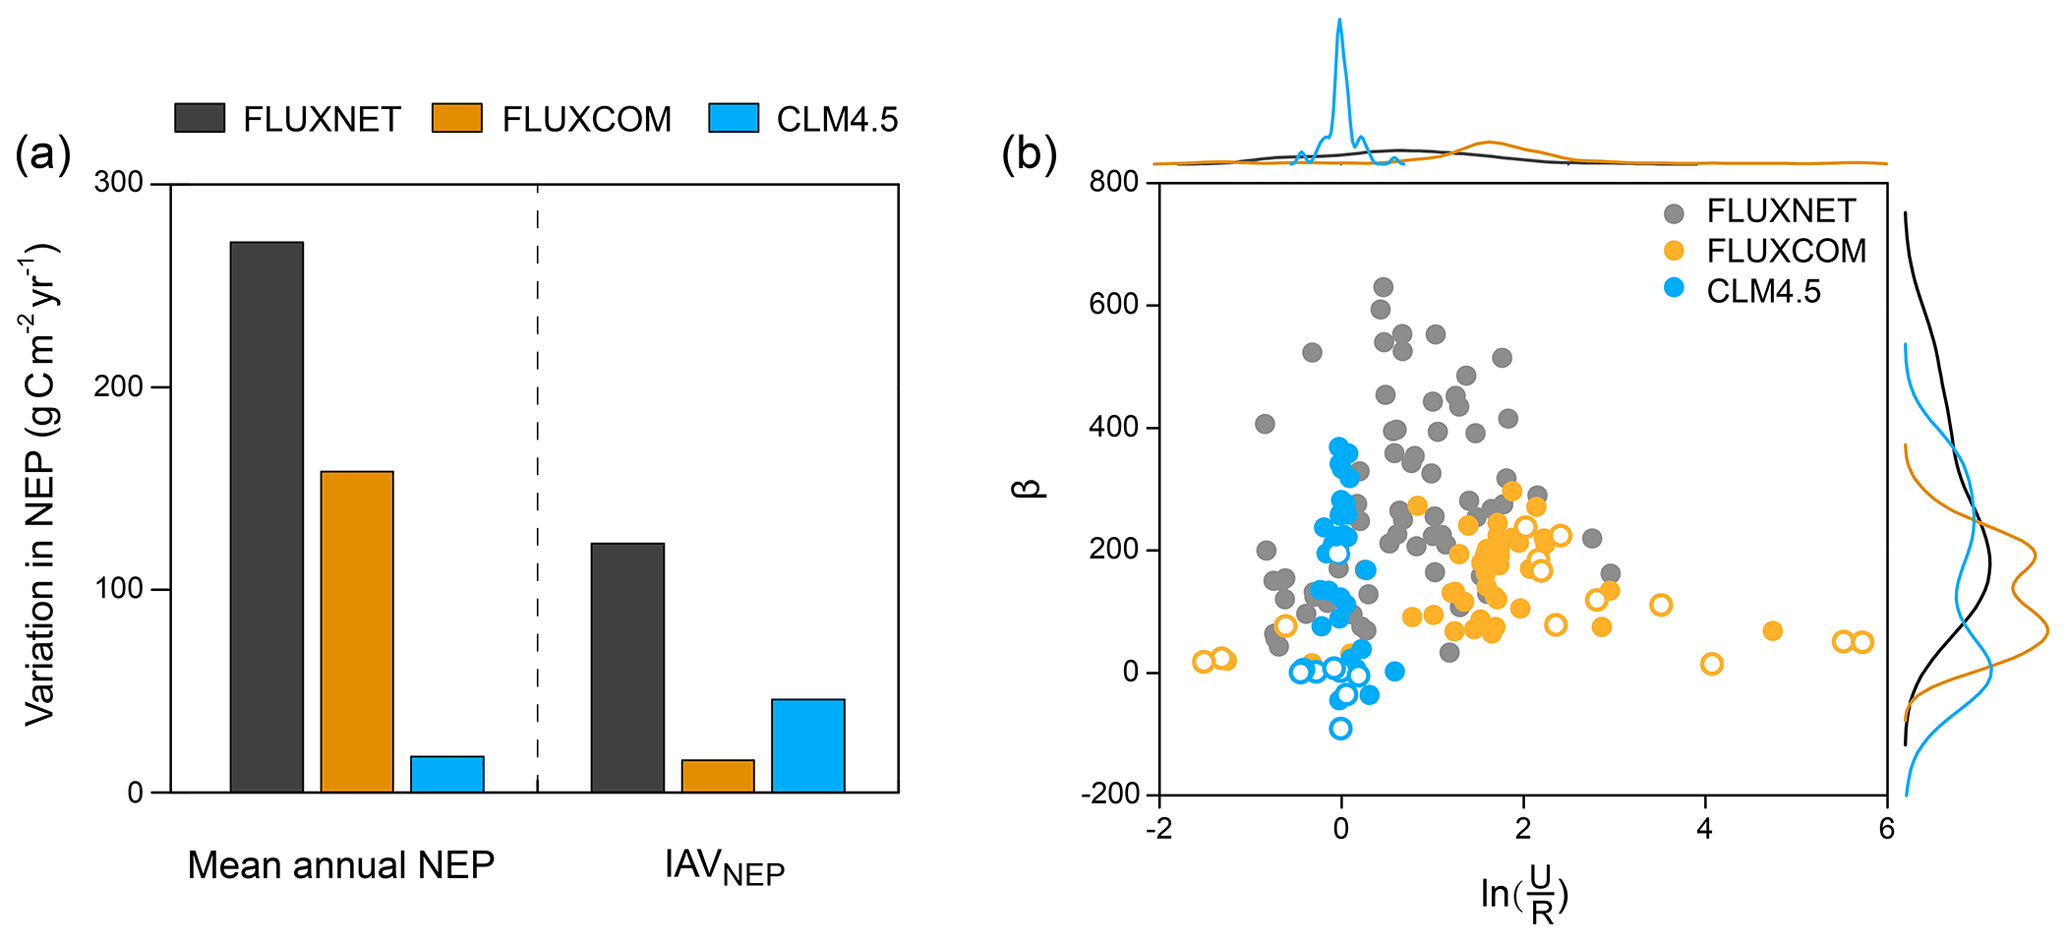
Figure 5Representations of the spatially varying NEP and its local indicators in the FLUXCOM product and the Community Land Model (CLM4.5) at the FLUXNET site level. (a) The variation in mean annual NEP and IAVNEP is derived from FLUXNET, FLUXCOM and CLM4.5. Variation in mean annual NEP: the standard deviation of mean annual NEP across sites; variation in IAVNEP: the standard deviation of IAVNEP across sites. (b) Representations of the local indicators for NEP in FLUXNET, FLUXCOM and CLM4.5. The corresponding distributions of and β are shown at the top and right. Significance of the relationship between annual NEP and for each site is indicated by the circles. Closed circles: P<0.05; open circles: P>0.05. Note that the modelled results are from the pixels extracted from the same locations of the flux tower sites.
In addition, the spatial variations in NEP and IAVNEP were associated with the spatial resolution of the product (Marcolla et al., 2017). Considering the scale mismatch between FLUXNET sites and the gridded product, we run the same analysis at the global scale based on the Jena CarboScope inversion product. At the global scale, the spatial variation in mean annual NEP can also be well indicated by (Fig. 6). The larger net C uptake in FLUXCOM resulted from its higher simulations for . Furthermore, the larger spatial variation in IAVNEP in CLM4.5 could be inferred from the indicator β.
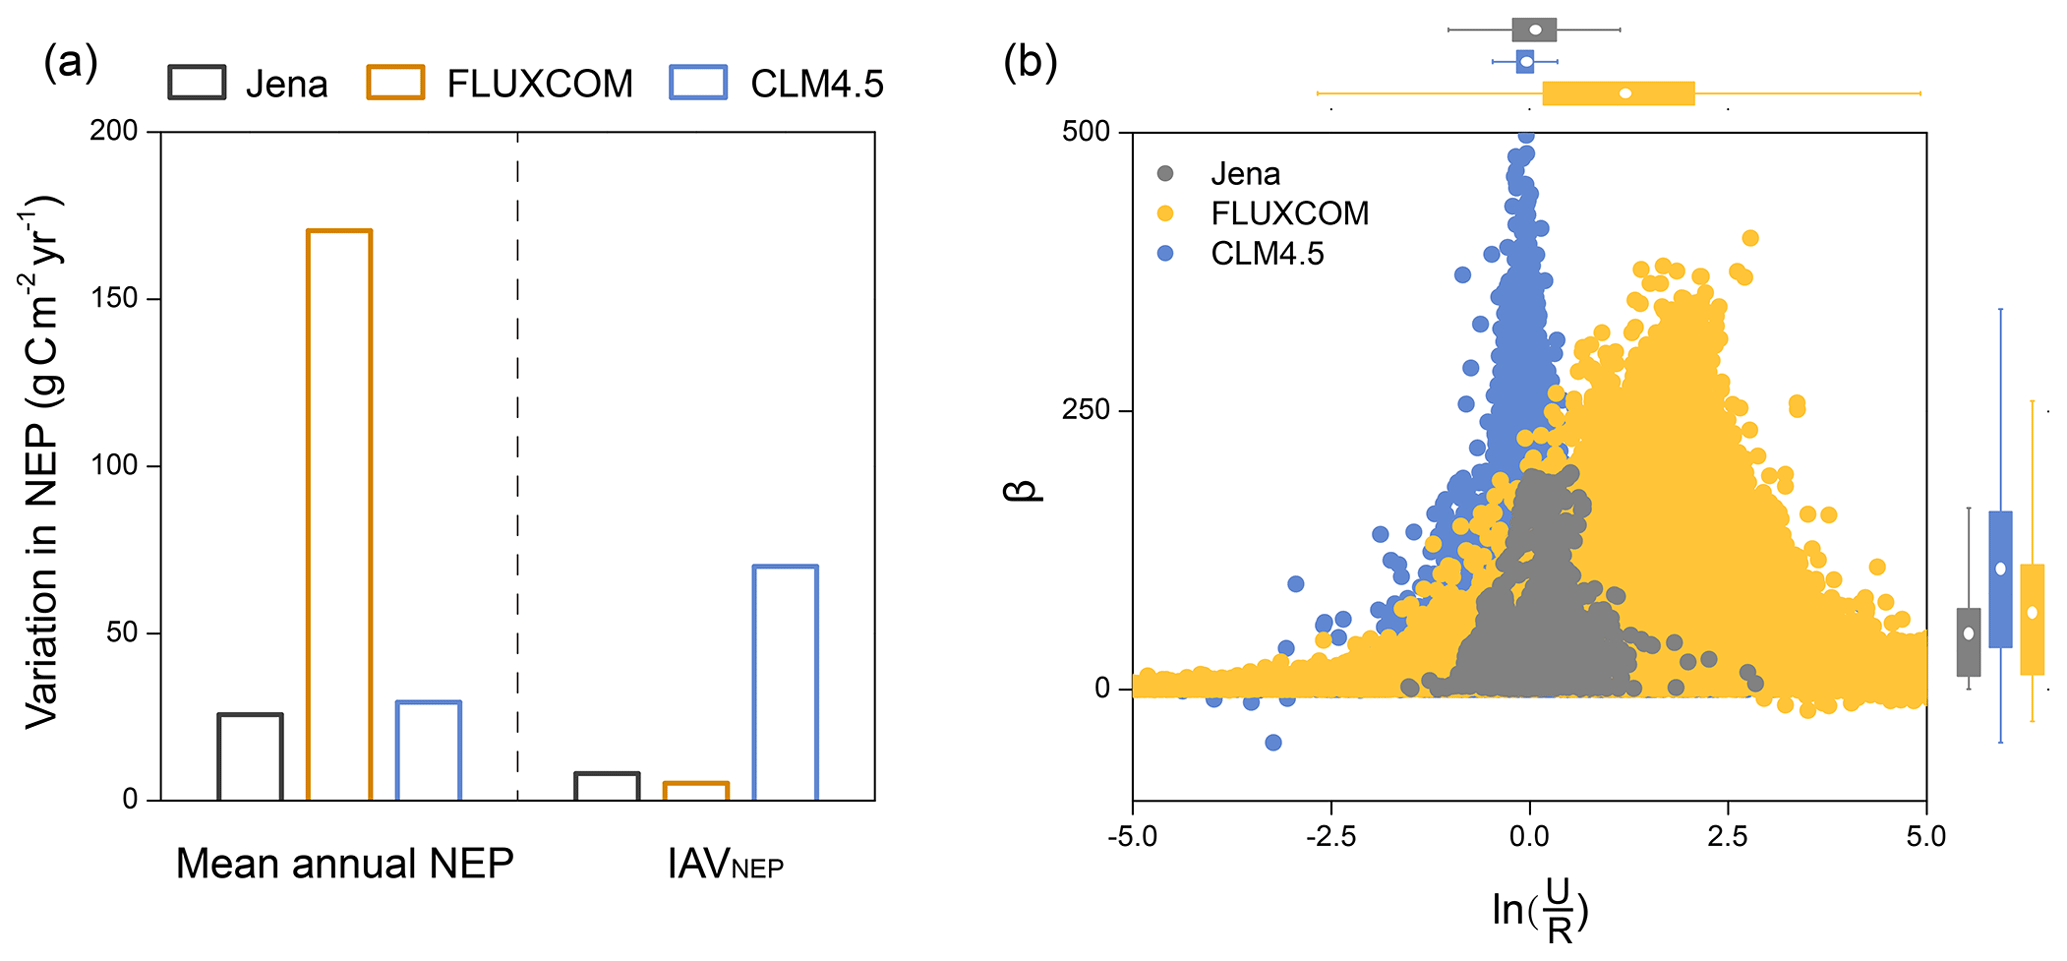
Figure 6Representations of the spatially varying NEP and its local indicators in the FLUXCOM product and the Community Land Model (CLM4.5) at the global scale. (a) The variation in mean annual NEP and IAVNEP is derived from Jena CarboScope inversion, FLUXCOM and CLM4.5. Variation in mean annual NEP: the spatial variation in mean annual NEP; variation in IAVNEP: the spatial variation in standard deviation in IAVNEP. (b) Representations of the local indicators for NEP in Jena CarboScope inversion, FLUXCOM and CLM4.5.
4.1 New perspective for locating the major and sustainable land C sinks
Large spatial differences in mean annual NEP and IAVNEP have been well documented in previous studies (Jung et al., 2017; Marcolla et al., 2017; Fu et al., 2019). Here we provide a new perspective for quantifying the spatially varying NEP by tracing annual NEP into several local indicators. Therefore, these traceable indicators could provide useful constraints for predicting annual NEP, especially in areas without eddy-covariance towers.
Typically, the C sink capacity and its stability in a specific ecosystem are characterized separately (Keenan et al., 2014; Ahlström et al., 2015; Jung et al., 2017). Here we integrated NEP into two simple indicators that could directly locate the major and sustainable land C sink. Among biomes, forests and croplands had the largest and β, indicating the strongest and the most unstable C sink in forests and croplands, respectively. However, the relatively lower β in shrublands and savannas should be interpreted cautiously. There are very few semi-arid ecosystems in the FLUXNET sites, while they represent a large portion of land at the global scale and have been shown to substantially control the inter-annual variability in NEP (Ahlström et al., 2015). The highest β implies that the land covered by cropland has the largest IAVNEP. Therefore, the reported rapid global expansion of cropland may enlarge the fluctuations in land–atmosphere CO2 exchange. In fact, the cropland expansion has been confirmed as one important driver of the recent increasing global vegetation growth peak (Huang et al., 2018) and atmospheric-CO2 seasonal amplitude (Gray et al., 2014; Zeng et al., 2014).
4.2 Joint control of plant phenology and physiology on mean annual NEP
Recent studies have demonstrated that the spatio-temporal variations in terrestrial gross primary productivity are jointly controlled by plant phenology and physiology (Xia et al., 2015; Zhou et al., 2017). Here we demonstrated that the spatial difference in mean annual NEP was determined by both the phenology indicator (58 %) and the physiological indicator (42 %). In addition, the lower contribution of the physiological indicator could partly be attributed to the convergence of across FLUXNET sites (Fig. S4).
The convergent across sites was first discovered by Churkina et al. (2005) as 2.73 ± 1.08 across 28 sites, which included deciduous broadleaf forest (DBF), evergreen broadleaf forest (EBF), and cropland and grassland. In this study, we found that the across the 72 sites is 2.71 ± 1.61, which confirms the findings of Churkina et al. (2005). This spatial convergence of at the site level provides important constraints for global models that simulate large spatial variation in physiological processes (Peng et al., 2015; Xia et al., 2017). These findings imply that the phenology changes will greatly affect the locations of the terrestrial carbon sink by modifying the length of the carbon uptake period (Richardson et al., 2013; Keenan et al., 2014).
4.3 The simulated local indicators from gridded products
This study showed that the considerable spatial variations in mean annual NEP and IAVNEP from global gridded products could also be inferred from their local indicators. The low variations in the U ∕ R ratio in CLM4.5 could be largely due to their simple representations of the diverse terrestrial plant communities in a few functional plant types with parameterized properties (Cui et al., 2019; Sakschewski et al., 2015). In addition, the higher U ∕ R ratio from the FLUXCOM product indicated its widely reported larger net C uptake (Fig. 6; Jung et al., 2020). Meanwhile, the ignorance of fire, land-use change and other disturbances could lead to the smaller β by allowing for only limited variations in phenological and physiological dynamics (Reichstein et al., 2014; Kunstler et al., 2016). Although the magnitude of IAVNEP depends on the spatial resolution (Marcolla et al., 2017), we recommend that future model-benchmarking analyses use not only the global product compiled from the machine-learning method (Bonan et al., 2018) but also the site-level measurements or indicators (Xia et al., 2020).
4.4 Conclusions and further implications
In summary, this study highlights the changes in NEP and IAVNEP over space on land and provides the U ∕ R ratio and β as two simple local indicators for their spatial variations. These indicators could be helpful for locating the persistent terrestrial C sinks where the ratio is high but the β is low. Their estimates based on observations are also valuable for benchmarking and improving the simulation of land–atmospheric C exchanges in Earth system models. The findings in this study have some important implications for understanding the variation in NEP on land. First, forest ecosystems have the largest annual NEP due to the largest , while croplands show the highest IAVNEP because of the highest β. Second, the spatial convergence of suggests a tight linkage between plant growth and soil microbial activities in the non-growing season (Xia et al., 2014; Zhao et al., 2016). However, it remains unclear whether the inter-biome variation in is due to different plant–microbe interactions between biomes. Third, the within-site convergent but spatially varying β needs better understanding. Previous studies have shown that a rising standard deviation of ecosystem functions could indicate an impending ecological state transition (Carpenter and Brock, 2006; Scheffer et al., 2009). Thus, a sudden shift in the β value may be an important early-warning signal for the critical transition of carbon uptake sensitivity of an ecosystem. In this study, the atmospheric-inversion product shows low correlation between NEP and in some boreal ecosystems, which might be due to the fact that the terrestrial NEP is not well constrained for these regions or because these boreal ecosystems are experiencing state transition. Therefore, the robustness in the relationship between annual NEP and depends on the temporal stability of carbon uptake sensitivity for an ecosystem. In addition, the spatial variation in β reveals the differences in carbon uptake sensitivity across ecosystems. Furthermore, considering the limited eddy-covariance sites with long-term observations, these findings need further validation once the longer time series of measurements from more sites and vegetation types become available.
The FLUXNET2015 dataset is available online at https://fluxnet.fluxdata.org/data/fluxnet2015-dataset/ (Lawrence Berkeley National Laboratory, 2019), and the data supporting the findings of this study are available within the article and the Supplement. The FLUXCOM NEP product can be downloaded from the data portal of the Max Planck Institute for Biochemistry (https://www.bgc-jena.mpg.de/geodb/projects/Home.php; Jung et al., 2017). The Jena CarboScope inversion product is available at http://www.bgc-jena.mpg.de/CarboScope/?ID=s (Rödenbeck et al., 2018).
The supplement related to this article is available online at: https://doi.org/10.5194/bg-17-6237-2020-supplement.
EC and JX devised and conducted the analysis. YL, SN, YW and CB provided critical feedback on the method and results. All authors contributed to discussion of results and writing the paper.
The authors declare that they have no conflict of interest.
This work used eddy-covariance datasets acquired and shared by the FLUXNET community, including these networks: AmeriFlux, AfriFlux, AsiaFlux, CarboAfrica, CarboEuropeIP, CarboItaly, CarboMont, ChinaFlux, Fluxnet-Canada, GreenGrass, ICOS, KoFlux, LBA, NECC, OzFlux-TERN, TCOS-Siberia and USCCC. The ERA-Interim reanalysis data are provided by ECMWF and processed by LSCE. The FLUXNET eddy-covariance data processing and harmonization were carried out by the European Fluxes Database Cluster, AmeriFlux Management Project and Fluxdata project of FLUXNET with the support of the CDIAC and ICOS Ecosystem Thematic Center as well as the OzFlux, ChinaFlux and AsiaFlux offices.
This research has been supported by the National Key R&D Program of China (grant no. 2017YFA0604600), the National Natural Science Foundation of China (grant no. 31722009), National 1000 Young Talents Program of China, Shanghai Key Lab for Urban Ecological Processes and Eco-Restoration (grant no. SHUES2020B01), and the Fundamental Research Funds for the Central Universities.
This paper was edited by Sönke Zaehle and reviewed by three anonymous referees.
Ahlström, A., Raupach, M. R., Schurgers, G., Smith, B., Arneth, A., Jung, M., Reichstein, M., Canadell, J. G., Friedlingstein, P., Jain, A. K., Kato, E., Poulter, B., Sitch, S., Stocker, B. D., Viovy, N., Wang, Y., Wiltshire, A., Zaehle, S., and Zeng, N.: The dominant role of semi-arid ecosystems in the trend and variability of the land CO2 sink, Science, 348, 895–899, 2015.
Arora, V. K., Katavouta, A., Williams, R. G., Jones, C. D., Brovkin, V., Friedlingstein, P., Schwinger, J., Bopp, L., Boucher, O., Cadule, P., Chamberlain, M. A., Christian, J. R., Delire, C., Fisher, R. A., Hajima, T., Ilyina, T., Joetzjer, E., Kawamiya, M., Koven, C. D., Krasting, J. P., Law, R. M., Lawrence, D. M., Lenton, A., Lindsay, K., Pongratz, J., Raddatz, T., Séférian, R., Tachiiri, K., Tjiputra, J. F., Wiltshire, A., Wu, T., and Ziehn, T.: Carbon–concentration and carbon–climate feedbacks in CMIP6 models and their comparison to CMIP5 models, Biogeosciences, 17, 4173–4222, https://doi.org/10.5194/bg-17-4173-2020, 2020.
Baldocchi, D., Chu, H., and Reichstein, M.: Inter-annual variability of net and gross ecosystem carbon fluxes: A review, Agr. For. Meteorol., 249, 520–533, 2018.
Baldocchi, D., Sturtevant, C., and FLUXNET Contributors: Does day and night sampling reduce spurious correlation between canopy photosynthesis and ecosystem respiration?, Agr. Forest Meteorol., 207, 117–126, 2015.
Besnard, S., Carvalhais, N., Arain, A., Black, A., de Bruin, S., Buchmann, N., Cescatti, A., Chen, J., JClevers, J. G. P. W., Desai, A. R., Gough, C. M., Havrankova, K., Herold, M., Hörtnagl, L., Jung, M., Knohl, A., Kruijt, B., Krupkova, L., Law, B. E., Lindroth, A., Noormets, A., Roupsard, O., Steinbrecher, R., Varlagin, A., Vincke, C., and Reichstein, M.: Quantifying the effect of forest age in annual net forest carbon balance, Environ. Res. Lett., 13, 124018, https://doi.org/10.1088/1748-9326/aaeaeb, 2018.
Biederman, J. A., Scott, R. L., Goulden, M. L., Vargas, R., Litvak, M. E., Kolb, T. E., Yepez, E. A., Oechel, W. C., Blanken, P. D., Bell, T. W., Garatuza-Payan, J., Maurer, E., Dore, S., and Burns, S. P.: Terrestrial carbon balance in a drier world: the effects of water availability in southwestern North America, Global Change Biol., 22, 1867–1879, 2016.
Bonan, G. B., Patton, E. G., Harman, I. N., Oleson, K. W., Finnigan, J. J., Lu, Y., and Burakowski, E. A.: Modeling canopy-induced turbulence in the Earth system: a unified parameterization of turbulent exchange within plant canopies and the roughness sublayer (CLM-ml v0), Geosci. Model Dev., 11, 1467–1496, https://doi.org/10.5194/gmd-11-1467-2018, 2018.
Carpenter, S. R. and Brock, W. A.: Rising variance: a leading indicator of ecological transition, Ecol. Lett., 9, 311–318, 2006.
Churkina, G., Schimel, D., Braswell, B. H., and Xiao, X.: Spatial analysis of growing season length control over net ecosystem exchange, Global Change Biol., 11, 1777–1787, 2005.
Ciais, P., Tan, J., Wang, X., Roedenbeck, C., Chevallier, F., Piao, S. L., Moriarty, R., Broquet, G., Le Quéré, C., Canadell, J. G., Peng, S., Poulter, B., Liu Z., and Tans, P.: Five decades of northern land carbon uptake revealed by the interhemispheric CO2 gradient, Nature, 568, 221–225, 2019.
Cui, E., Huang, K., Arain, M. A., Fisher, J. B., Huntzinger, D. N., Ito, A., Luo, Y., Jain, A. K., Mao, J., Michalak, A. M., Niu, S., Parazoo, N. C., Peng, C., Peng, S., Poulter, B., Ricciuto, D. M., Schaefer, K. M., Schwalm, C. R., Shi, X., Tian, H., Wang, W., Wang, J., Wei, Y., Yan, E., Yan, L., Zeng, N., Zhu, Q., and Xia, J.: Vegetation functional properties determine uncertainty of simulated ecosystem productivity: A traceability analysis in the East Asian monsoon region, Global Biogeochem. Cy., 33, 668–689, 2019.
Fu, Z., Dong, J., Zhou, Y., Stoy, P. C., and Niu, S.: Long term trend and interannual variability of land carbon uptake-the attribution and processes, Environ. Res. Lett., 12, 014018, https://doi.org/10.1088/1748-9326/aa5685, 2017.
Fu, Z., Stoy, P. C., Poulter, B., Gerken, T., Zhang, Z., Wakbulcho, G., and Niu, S.: Maximum carbon uptake rate dominates the interannual variability of global net ecosystem exchange, Global Change Biol., 25, 3381–3394, 2019.
Gilmanov, T. G., Tieszen, L. L., Wylie, B. K., Flanagan, L. B., Frank, A. B., Haferkamp, M. R., Meyers, T. P., and Morgan, J. A.: Integration of CO2 flux and remotely-sensed data for primary production and ecosystem respiration analyses in the Northern Great Plains: Potential for quantitative spatial extrapolation, Global Ecol. Biogeogr., 14, 271–292, 2005.
Gray, J. M., Frolking, S., Kort, E. A., Ray, D. K., Kucharik, C. J., Ramankutty, N., and Friedl, M. A.: Direct human influence on atmospheric CO2 seasonality from increased cropland productivity, Nature, 515, 398–401, 2014.
Grömping, U.: Estimators of relative importance in linear regression based on variance decomposition, Am. Stat., 61, 139–147, 2007.
Huang, K., Xia, J., Wang, Y., Ahlström, A., Chen, J., Cook, R. B., Cui, E., Fang, Y., Fisher, J. B., Huntzinger, D. N., Li, Z., Michalak, A. M., Qiao, Y., Schaefer, K., Schwalm, C., Wang, J., Wei, Y., Xu, X., Yan, L., Bian C., and Luo, Y.: Enhanced peak growth of global vegetation and its key mechanisms, Nat. Ecol. Evol., 2, 1897–1905, 2018.
Jung, M., Reichstein, M., Schwalm, C. R., Huntingford, C., Sitch, S., Ahlström, A., Arneth, A., Camps-Valls, G., Ciais, P., Friedlingstein, P., Gans, F., Ichii, K., Jain, A. K., Kato, E., Papale, D., Poulter, B., Raduly, B., Rödenbeck, C., Tramontana, G., Viovy, N., Wang, Y., Weber, U., Zaehle S., and Zeng, N.: Compensatory water effects link yearly global land CO2 sink changes to temperature, Nature, 541, 516–520, https://doi.org/10.1038/nature20780, 2017 (data available at: https://www.bgc-jena.mpg.de/geodb/projects/Home.php, last access: 20 January 2020).
Jung, M., Schwalm, C., Migliavacca, M., Walther, S., Camps-Valls, G., Koirala, S., Anthoni, P., Besnard, S., Bodesheim, P., Carvalhais, N., Chevallier, F., Gans, F., Goll, D. S., Haverd, V., Köhler, P., Ichii, K., Jain, A. K., Liu, J., Lombardozzi, D., Nabel, J. E. M. S., Nelson, J. A., O'Sullivan, M., Pallandt, M., Papale, D., Peters, W., Pongratz, J., Rödenbeck, C., Sitch, S., Tramontana, G., Walker, A., Weber, U., and Reichstein, M.: Scaling carbon fluxes from eddy covariance sites to globe: synthesis and evaluation of the FLUXCOM approach, Biogeosciences, 17, 1343–1365, https://doi.org/10.5194/bg-17-1343-2020, 2020.
Keenan, T. F., Gray, J., Friedl, M. A., Toomey, M., Bohrer, G., Hollinger, D. Y., Munger, J. W., O'Keefe, J., Schmid, H. P., Wing, I. S., Yang, B., and Richardson, A. D.: Net carbon uptake has increased through warming-induced changes in temperate forest phenology, Nat. Clim. Change, 4, 598–604, 2014.
Kunstler, G., Falster, D., Coomes, D. A., Hui, F., Kooyman, R. M., Laughlin, D. C., Poorter, L., Vanderwel, M., Vieilledent, G., Wright, S. J., Aiba, M., Baraloto, C., Caspersen, J., Cornelissen, J. H. C., Gourlet-Fleury, S., Hanewinkel, M., Herault, B., Kattge, J., Kurokawa, H., Onoda, Y., Peñuelas, J., Poorter, H., Uriarte, M., Richardson, S., Ruiz-Benito, P., Sun, I., Ståhl, G., Swenson, N. G., Thompson, J., Westerlund, B., Wirth, C., Zavala, M. A., Zeng, H., Zimmerman, J. K., Zimmermann N. E., and Westoby, M.: Plant functional traits have globally consistent effects on competition, Nature, 529, 204–207, 2016.
Lawrence Berkeley National Laboratory: FLUXNET2015 dataset, available at: https://fluxnet.fluxdata.org/data/fluxnet2015-dataset/, last access: February 2019.
Le Quéré, C., Andrew, R. M., Friedlingstein, P., Sitch, S., Hauck, J., Pongratz, J., Pickers, P. A., Korsbakken, J. I., Peters, G. P., Canadell, J. G., Arneth, A., Arora, V. K., Barbero, L., Bastos, A., Bopp, L., Chevallier, F., Chini, L. P., Ciais, P., Doney, S. C., Gkritzalis, T., Goll, D. S., Harris, I., Haverd, V., Hoffman, F. M., Hoppema, M., Houghton, R. A., Hurtt, G., Ilyina, T., Jain, A. K., Johannessen, T., Jones, C. D., Kato, E., Keeling, R. F., Goldewijk, K. K., Landschützer, P., Lefèvre, N., Lienert, S., Liu, Z., Lombardozzi, D., Metzl, N., Munro, D. R., Nabel, J. E. M. S., Nakaoka, S., Neill, C., Olsen, A., Ono, T., Patra, P., Peregon, A., Peters, W., Peylin, P., Pfeil, B., Pierrot, D., Poulter, B., Rehder, G., Resplandy, L., Robertson, E., Rocher, M., Rödenbeck, C., Schuster, U., Schwinger, J., Séférian, R., Skjelvan, I., Steinhoff, T., Sutton, A., Tans, P. P., Tian, H., Tilbrook, B., Tubiello, F. N., van der Laan-Luijkx, I. T., van der Werf, G. R., Viovy, N., Walker, A. P., Wiltshire, A. J., Wright, R., Zaehle, S., and Zheng, B.: Global Carbon Budget 2018, Earth Syst. Sci. Data, 10, 2141–2194, https://doi.org/10.5194/essd-10-2141-2018, 2018.
Li, G., Han, H., Du, Y., Hui, D., Xia, J., Niu, S., Li, X., and Wan, S.: Effects of warming and increased precipitation on net ecosystem productivity: a long-term manipulative experiment in a semiarid grassland, Agr. Forest Meteorol., 232, 359–366, 2017.
Luo, Y. and Weng, E.: Dynamic disequilibrium of the terrestrial carbon cycle under global change, Trends Ecol. Evol., 26, 96–104, 2011.
Luo, Y. and Zhou, X.: Soil respiration and the environment, Academic Press, Burlington, VA, 320 pp., 2006.
Marcolla, B., Rödenbeck, C., and Cescatti, A.: Patterns and controls of inter-annual variability in the terrestrial carbon budget, Biogeosciences, 14, 3815–3829, https://doi.org/10.5194/bg-14-3815-2017, 2017.
Musavi, T., Migliavacca, M., Reichstein, M., Kattge, J., Wirth, C., Black, T. A., Janssens, I., Knohl, A., Loustau, D., Roupsard, O., Varlagin, A., Rambal, S., Cescatti, A., Gianelle, D., Kondo, H., Tamrakar, R., and Mahecha, M. D.: Stand age and species richness dampen interannual variation of ecosystem-level photosynthetic capacity, Nat. Ecol. Evol., 1, 0048, https://doi.org/10.1038/s41559-016-0048, 2017.
Niu, S., Fu, Z., Luo, Y., Stoy, P. C., Keenan, T. F., Poulter, B., Zhang, L., Piao, S., Zhou, X., Zheng, H., Han, J., Wang, Q., and Yu, G.: Interannual variability of ecosystem carbon exchange: From observation to prediction, Global Ecol. Biogeogr., 26, 1225–1237, 2017.
Novick, K. A., Oishi, A. C., Ward, E. J., Siqueira, M. B., Juang, J. Y., and Stoy, P. C.: On the difference in the net ecosystem exchange of CO2 between deciduous and evergreen forests in the southeastern United States, Glob. Change Biol., 21, 827–842, 2015.
Oleson, K. W., Lawrence, D. M., Bonan, G. B., Drewniak, B., Huang, M., Koven, C. D., Levis, S., Li, F., Riley, W. J., Subin, Z. M., Swenson, S. C., Thornton, P. E., Bozbiyik, A., Fisher, R., Heald, C. L., Kluzek, E., Lamarque, J.-F., Lawrence, P. J., Leung, L. R., Lipscomb, W., Muszala, S., Ricciuto, D. M., Sacks, W., Sun, Y., Tang, J., and Yang, Z.-L.: Technical description of version 4.5 of the Community Land Model (CLM), NCAR Earth System Laboratory-Climate and Global Dynamics Division, Boulder, Colorado, USA, Tech. Rep. TN-503+STR, available at: http://www.cesm.ucar.edu/models/cesm1.2/clm/CLM45_Tech_Note.pdf (last access: 27 September 2017), 2013.
Pastorello, G., Papale, D., Chu, H., Trotta, C., Agarwal, D., Canfora, E., Baldocchi, D., and Torn, M.: A new data set to keep a sharper eye on land-air exchanges, Eos, 98, https://doi.org/10.1029/2017EO071597, 2017.
Peng, S., Ciais, P., Chevallier, F., Peylin, P., Cadule, P., Sitch, S., Piao, S., Ahlström, A., Huntingford, C., Levy, P., Li, X., Liu, Y., Lomas, M., Poulter, B., Viovy, N., Wang, T., Wang, X., Zaehle, S., Zeng, N., Zhao, F., and Zhao, H.: Benchmarking the seasonal cycle of CO2 fluxes simulated by terrestrial ecosystem models, Global Biogeochem. Cy., 29, 46–64, 2015.
Peylin, P., Law, R. M., Gurney, K. R., Chevallier, F., Jacobson, A. R., Maki, T., Niwa, Y., Patra, P. K., Peters, W., Rayner, P. J., Rödenbeck, C., van der Laan-Luijkx, I. T., and Zhang, X.: Global atmospheric carbon budget: results from an ensemble of atmospheric CO2 inversions, Biogeosciences, 10, 6699–6720, https://doi.org/10.5194/bg-10-6699-2013, 2013.
Poulter, B., Frank, D., Ciais, P., Myneni, R. B., Andela, N., Bi, J., Broquet, G., Canadell, J. G., Chevallier, F., Liu, Y. Y., Running, S. W., Sitch, S., and van der Werf, G. R.: Contribution of semi-arid ecosystems to interannual variability of the global carbon cycle, Nature, 509, 600–603, 2014.
Randerson, J. T.: Climate science: Global warming and tropical carbon, Nature, 494, 319–320, 2013.
Randerson, J. T., Chapin III, F. S., Harden, J. W., Neff, J. C., and Harmon, M. E.: Net ecosystem production: a comprehensive measure of net carbon accumulation by ecosystems, Ecol. Appl., 12, 937–947, 2002.
R Development Core Team.: R: A Language and Environment for Statistical Computing 3-900051-07-0, R Foundation for Statistical Computing, Vienna, Austria, 2011.
Reichstein, M., Bahn, M., Mahecha, M. D., Kattge, J., and Baldocchi, D. D.: Linking plant and ecosystem functional biogeography, P. Natl Acad. Sci. USA, 111, 13697–13702, 2014.
Reichstein, M., Falge, E., Baldocchi, D., Papale, D., Aubinet, M., Berbigier, P., Bernhofer, C., Buchmann, N., Gilmanov, T., Granier, A., Grünwald, T., Havránková, K., Ilvesniemi, H., Janous, D., Knohl, A., Laurila, T., Lohila, A., Loustau, D., Matteucci, G., Meyers, T., Miglietta, F., Ourcival, J., Pumpanen J., Rambal, S., Rotenberg, E., Sanz, M., Tenhunen, J., Seufert, G., Vaccari, F., Vesala, T., Yakir, D., and Valentini, R.: On the separation of net ecosystem exchange into assimilation and ecosystem respiration: review and improved algorithm, Glob. Change Biol., 11, 1424–1439, 2005.
Richardson, A. D., Keenan, T. F., Migliavacca, M., Ryu, Y., Sonnentag, O., and Toomey, M.: Climate change, phenology, and phenological control of vegetation feedbacks to the climate system, Agr. For. Meteorol., 169, 156–173, 2013.
Rödenbeck, C., Zaehle, S., Keeling, R., and Heimann, M.: How does the terrestrial carbon exchange respond to inter-annual climatic variations? A quantification based on atmospheric CO2 data, Biogeosciences, 15, 2481–2498, https://doi.org/10.5194/bg-15-2481-2018, 2018 (data available at: http://www.bgc-jena.mpg.de/CarboScope/?ID=s, last access: 6 August 2020).
Sakschewski, B., von Bloh, W., Boit, A., Rammig, A., Kattge, J., Poorter, L., Peñuelas, J., and Thonicke, K.: Leaf and stem economics spectra drive diversity of functional plant traits in a dynamic global vegetation model, Glob. Change Biol., 21, 2711–2725, 2015.
Scheffer, M., Bascompte, J., Brock, W. A., Brovkin, V., Carpenter, S. R., Dakos, V., Held, H., van Nes, E. H., Rietkerk, M., and Sugihara, G.: Early-warning signals for critical transitions, Nature, 461, 53–59, 2009.
Valentini, R., Matteucci, G., Dolman, A. J., Schulze, E. D., Rebmann, C. J. M. E. A. G., Moors, E. J., Granier, A., Gross, P., Jensen, N. O., Pilegaard, K., Lindroth, A., Grelle, A., Bernhofer, C., Grünwald, T., Aubinet, M., Ceulemans, R., Kowalski, A. S., Vesala, T., Rannik, Ü., Berbigier, P., Loustau, D., Guðmundsson, J., Thorgeirsson, H., Ibrom, A., Morgenstern, K., Clement, R., Moncrieff, J., Montagnani, L., Minerbi S., and Jarvis, P. G.: Respiration as the main determinant of carbon balance in European forests, Nature, 404, 861–865, 2000.
von Buttlar, J., Zscheischler, J., Rammig, A., Sippel, S., Reichstein, M., Knohl, A., Jung, M., Menzer, O., Arain, M. A., Buchmann, N., Cescatti, A., Gianelle, D., Kiely, G., Law, B. E., Magliulo, V., Margolis, H., McCaughey, H., Merbold, L., Migliavacca, M., Montagnani, L., Oechel, W., Pavelka, M., Peichl, M., Rambal, S., Raschi, A., Scott, R. L., Vaccari, F. P., van Gorsel, E., Varlagin, A., Wohlfahrt, G., and Mahecha, M. D.: Impacts of droughts and extreme-temperature events on gross primary production and ecosystem respiration: a systematic assessment across ecosystems and climate zones, Biogeosciences, 15, 1293–1318, https://doi.org/10.5194/bg-15-1293-2018, 2018.
Xia, J., Chen, J., Piao, S., Ciais, P., Luo, Y., and Wan, S.: Terrestrial carbon cycle affected by non-uniform climate warming, Nat. Geosci., 7, 173–180, 2014.
Xia, J., McGuire, A. D., Lawrence, D., Burke, E., Chen, G., Chen, X., Delire, C., Koven, C., MacDougall, A., Peng, S., Rinke, A., Saito, K., Zhang, W., Alkama, R., Bohn, T. J., Ciais, P., Decharme, B., Gouttevin, I., Hajima, T., Hayes, D. J., Huang, K., Ji, D., Krinner, G., Lettenmaier, D. P., Miller, P. A., Moore, J. C., Smith, B., Sueyoshi, T., Shi, Z., Yan, L., Liang, J., Jiang, L., Zhang, Q., and Luo, Y.: Terrestrial ecosystem model performance in simulating productivity and its vulnerability to climate change in the northern permafrost region, J. Geophys. Res.-Biogeo., 122, 430–446, 2017.
Xia, J., Niu, S., Ciais, P., Janssens, I. A., Chen, J., Ammann, C., Arain, A., Blanken, P. D., Cescatti, A., Bonal, D., Buchmann, N., Curtis, P. S., Chen, S., Dong, J., Flanagan, L. B., Frankenberg, C., Georgiadis, T., Gough, C. M., Hui, D., Kiely, G., Li, J., Lund, M., Magliulo, V., Marcolla, B., Merbold, L., Montagnani, L., Moors, E. J., Olesen, J. E., Piao, S., Raschi, A., Roupsard, O., Suyker, A. E., Urbaniak, M., Vaccari, F. P., Varlagin, A., Vesala, T., Wilkinson, M., Weng, E., Wohlfahrt, G., Yan, L., and Luo, Y.: Joint control of terrestrial gross primary productivity by plant phenology and physiology, P. Natl. Acad. Sci. USA, 112, 2788–2793, 2015.
Xia, J., Wang, J., and Niu, S.: Research challenges and opportunities for using big data in global change biology, Glob. Change Biol., 26, 6040–6061, https://doi.org/10.1111/gcb.15317, 2020.
Yu, G., Chen, Z., Piao, S., Peng, C., Ciais, P., Wang, Q., Li, X., and Zhu, X.: High carbon dioxide uptake by subtropical forest ecosystems in the East Asian monsoon region, P. Natl Acad. Sci. USA, 111, 4910–4915, 2014.
Zeng, N., Zhao, F., Collatz, G. J., Kalnay, E., Salawitch, R. J., West, T. O., and Guanter, L.: Agricultural Green Revolution as a driver of increasing atmospheric CO2 seasonal amplitude, Nature, 515, 394–397, 2014.
Zhao, J., Peichl, M., Öquist, M., and Nilsson, M. B.: Gross primary production controls the subsequent winter CO2 exchange in a boreal peatland, Glob. Change Biol., 22, 4028–4037, 2016.
Zhou, S., Zhang, Y., Ciais, P., Xiao, X., Luo, Y., Caylor, K. K., Huang, Y., and Wang, G.: Dominant role of plant physiology in trend and variability of gross primary productivity in North America, Sci. Rep.-UK, 7, 41366, https://doi.org/10.1038/srep41366, 2017.