the Creative Commons Attribution 4.0 License.
the Creative Commons Attribution 4.0 License.
 | 16 Feb 2021
Denitrification in soil as a function of oxygen availability at the microscale
Bernd Apelt
Hans-Jörg Vogel
Reinhard Well
Gi-Mick Wu
Steffen Schlüter
The prediction of nitrous oxide (N2O) and of dinitrogen (N2) emissions formed by biotic denitrification in soil is notoriously difficult due to challenges in capturing co-occurring processes at microscopic scales. N2O production and reduction depend on the spatial extent of anoxic conditions in soil, which in turn are a function of oxygen (O2) supply through diffusion and O2 demand by respiration in the presence of an alternative electron acceptor (e.g. nitrate).
This study aimed to explore controlling factors of complete denitrification in terms of N2O and (N2O + N2) fluxes in repacked soils by taking micro-environmental conditions directly into account. This was achieved by measuring microscale oxygen saturation and estimating the anaerobic soil volume fraction (ansvf) based on internal air distribution measured with X-ray computed tomography (X-ray CT). O2 supply and demand were explored systemically in a full factorial design with soil organic matter (SOM; 1.2 % and 4.5 %), aggregate size (2–4 and 4–8 mm), and water saturation (70 %, 83 %, and 95 % water-holding capacity, WHC) as factors. CO2 and N2O emissions were monitored with gas chromatography. The 15N gas flux method was used to estimate the N2O reduction to N2.
N gas emissions could only be predicted well when explanatory variables for O2 demand and O2 supply were considered jointly. Combining CO2 emission and ansvf as proxies for O2 demand and supply resulted in 83 % explained variability in (N2O + N2) emissions and together with the denitrification product ratio [N2O (N2O + N2)] (pr) 81 % in N2O emissions. O2 concentration measured by microsensors was a poor predictor due to the variability in O2 over small distances combined with the small measurement volume of the microsensors. The substitution of predictors by independent, readily available proxies for O2 demand (SOM) and O2 supply (diffusivity) reduced the predictive power considerably (60 % and 66 % for N2O and (N2O+N2) fluxes, respectively).
The new approach of using X-ray CT imaging analysis to directly quantify soil structure in terms of ansvf in combination with N2O and (N2O + N2) flux measurements opens up new perspectives to estimate complete denitrification in soil. This will also contribute to improving N2O flux models and can help to develop mitigation strategies for N2O fluxes and improve N use efficiency.
- Article
(2733 KB) - Full-text XML
-
Supplement
(1282 KB) - BibTeX
- EndNote


Predicting emissions of the greenhouse gas nitrous oxide (N2O) is important in order to develop mitigation strategies. Agriculture accounts for approximately 60 % of anthropogenic N2O emissions, most likely because high numbers of substrates for N2O-producing processes result from nitrogen (N) fertilization on agricultural fields (Syakila and Kroeze, 2011; Thompson et al., 2019; Tian et al., 2020). The required process understanding is hindered since various microbial species are capable of N2O production via several pathways, and these may co-exist due to different micro-environmental conditions within short distances in soil (Hayatsu et al., 2008; Braker and Conrad, 2011). Denitrification is one of the major biological pathways for N2O production, which describes the reduction in nitrate (NO) as the alternative electron acceptor into the trace gas nitrous oxide (N2O) as an intermediate and molecular nitrogen (N2) as the final product (Knowles, 1982; Philippot et al., 2007). Although it is well known that not all microbial species are capable of performing a denitrification pathway, it is particularly widespread among bacteria, but also several fungi and even archaea can denitrify (Shoun et al., 1992; Cabello et al., 2004).
N2O emissions from soils are often considered to be erratic in nature due to their high variability in space and time (Butterbach-Bahl et al., 2013). The low predictability is caused by the mechanisms that regulate microbial denitrification at the pore scale, which are concealed from measurement techniques that average across larger soil volumes. This experimental study is designed to reveal the drivers of oxygen (O2) supply and demand at the microscale that govern microbial denitrification at the macroscale.
In general, there are several controlling factors for microbial denitrification in soil. Proximal factors, such as N and carbon (C), are needed to ensure the presence of electron acceptors and electron supply. In addition, the absence of oxygen is required to express the enzymes for the reduction in reactive nitrogen. Distal factors, i.e. physical and biological factors like soil structure, soil texture, pH, or microbial community, on the other hand affect the proximal factors (Groffman and Tiedje, 1988; Tiedje, 1988). The main physical controlling factors that regulate O2 supply are water saturation and soil structure because they determine the pathways through which gaseous and dissolved oxygen but also NO and dissolved organic matter may diffuse towards the location of their consumption. Likewise they determine the pathways through which denitrification products may diffuse away from these locations. In addition, both saturation and soil structure contribute to the regulation of O2 demand through their impact on substrate accessibility and thus microbial activity (Keiluweit et al., 2016). Studies have shown microbial activity, described by microbial respiration, to increase with increasing water saturation, but it also decreased when water saturation exceeded a certain optimal value under intermediate conditions (Davidson et al., 2000; Reichstein and Beer, 2008; Moyano et al., 2012). Low water saturation causes C substrate limitations, whereas high water saturation causes limited oxygen diffusion (Davidson et al., 2000). This observation goes along with an increase in anaerobic respiration in microbial hot spots when O2 demand exceeded O2 supply, and denitrification is favoured (Balaine et al., 2015).
These physical processes that govern denitrification at the microscale have to be effectively described by macroscopic bulk soil properties in order to improve the predictability of denitrification activity at larger scales. It has been shown repeatedly that soil diffusivity can be used to predict the impact of O2 supply on N2O and N2 emissions (Andersen and Petersen, 2009; Balaine et al., 2016). First N2O emissions increase with decreasing diffusivity, but then they dramatically decrease due to N2 production, when diffusivity is extremely low.
Diffusivity is not routinely measured in denitrification studies as it is more difficult to measure than air content or water saturation, but there are many empirical models to estimate diffusivity based on air-filled pore volume (Millington and Quirk, 1960, 1961; Moldrup et al., 1999; Deepagoda et al., 2011). All of these metrics are only indirect metrics of the anaerobic soil volume fraction (ansvf) as direct measurements are difficult to obtain. It is measured either locally via oxygen sensors with needle-type microsensors (Sexstone et al., 1985; Højberg et al., 1994; Elberling et al., 2011) or with foils (Elberling et al., 2011; Keiluweit et al., 2018), which require averaging or extrapolating measured O2 saturation for the entire soil volume. Or it is estimated for the entire sample volume from pore distances in X-ray computed tomography (X-ray CT) images of soil structure assuming that there is a direct relationship between pore distances and anaerobiosis (Rabot et al., 2015; Kravchenko et al., 2018).
Completeness of denitrification is another important controlling factor that modulates the relationship between O2 availability and N2O emissions (Morley et al., 2014), which has previously been neglected in similar incubation studies (Rabot et al., 2015; Porre et al., 2016; Kravchenko et al., 2018). Since the N2 background of air (78 %) is very high, direct N2 measurement from denitrification in soil is very challenging (Groffman et al., 2006; Mathieu et al., 2006). The 15N-labelling technique is a method successfully applied to determine N2O and also N2 production from denitrification from 15N-amended electron acceptors (NO) (Mathieu et al., 2006; Scheer et al., 2020). Complete denitrification generates N2 as the final product, although it is assumed that 30 % of denitrifying organisms lack the N2O reductase (Zumft, 1997; Jones et al., 2008; Braker and Conrad, 2011). Thus the denitrification product ratio [N2O (N2O + N2)] (pr) was found to be very variable in soil studies covering the whole range between 0 and 1 (Senbayram et al., 2012; Buchen et al., 2016). Decreasing pr, i.e. relative increasing N2 fraction compared to that of N2O, was found with lower oxygen availability as a consequence of higher water saturations and denitrification activities in soil (van Cleemput, 1998).
In this paper, we reconcile all these metrics, i.e. soil structure, bulk respiration, diffusivity, O2 distribution, ansvf, and pr, to assess their suitability to predict denitrification activity. This requires well-defined laboratory experiments that either control or directly measure important distal controlling factors of denitrification activity like microbial activity, anaerobic soil volume, and denitrification completeness.
To this end the current study presents a comprehensive experimental set-up with well-defined experimental conditions but also microscale measurements of oxygen concentrations, soil structure, and the air and water distribution at the pore scale. The 15N tracer application was used to estimate the N2O reduction to N2 and the N2O fraction originating from denitrification. To our knowledge this is the first experimental set-up analysing N2O and (N2O + N2) fluxes in combination with X-ray-CT-derived structure. Other important factors controlling denitrification like temperature, pH, nitrate limitation, saturation changes, microbial community structure, or plant–soil interactions were either controlled or excluded in this study.
The general objective of the present study is to systematically explore bulk respiration and denitrification as a function of O2 supply and demand in repacked soils under static hydraulic conditions. O2 demand was controlled by incubating soils with different soil organic matter (SOM) content. O2 supply was controlled by different water saturations and different aggregate sizes. A novel approach is explored to assess microscopic O2 supply directly from ansvf estimates based on the distribution and continuity of air-filled pores within the wet soil matrix.
We hypothesize that the combination of at least one proxy for O2 supply (e.g. ansvf, diffusivity, air content) and one for O2 demand (CO2 production) is required to predict complete denitrification (N2O + N2), whereas pr as a proxy for denitrification completeness is required in addition to predict a single component (N2O). The specific aims of our study were (a) to investigate the potential of microscopic metrics for O2 supply, such as ansvf to predict complete denitrification activity, and (b) to explore the extent to which a substitution of these predictors by classical, averaged soil properties required for larger-scale denitrification models is acceptable.
2.1 Incubation
Fine-textured topsoil material was collected from two different agricultural sites in Germany (from a depth of 10–20 cm in Rotthalmünster (RM) and 3–15 cm in Gießen (GI) as representatives for agricultural mid-European soils; Table 1). To our knowledge, N2O field measurements only exist for GI soil, which amounted to N2O emissions up to approximately 160 µg N2O–N m−2 h−1 after fertilization (Müller et al., 2004; Kammann et al., 2008; Regan et al., 2011). Denitrification potential, however, exists in both soils, as recently investigated by Malique et al. (2019) in a laboratory experiment with both soils. Higher denitrification activity with GI soil was found compared to that of RM soil (Malique et al., 2019). According to this, these soils were chosen for the contrast in properties potentially affecting denitrification and respiration (SOM contents, pH, texture, bulk density), which induces a large difference in microbial respiration and hence O2 demand under identical incubation settings. The rationale was that soil texture and bulk density should mainly govern air content and thus O2 supply at a certain water saturation, whereas SOM content should mainly govern microbial activity and thus O2 demand. The soils were sieved (10 mm), air-dried, and stored at 6 ∘C for several months before sieving into two different aggregate size fractions in order to induce variations in O2 supply: small (2–4 mm) and large (4–8 mm). Care was taken to remove free particulate organic matter (POM) like plant residues and root fragments during sieving. Other aggregate size classes were not considered as sieving yielded too low an amount of larger aggregates that contained too much irremovable POM, whereas smaller aggregate classes resulted in too fragmented a pore space at the chosen scan settings.
Table 1Basic description of soil materials used for incubation (SOM: soil organic matter; WRB: World Reference Base for the classification of soil).
The soil material was pre-incubated at 50 % water-holding capacity (WHC) for 2 weeks to induce microbial activity after the long dry spell and let the flush in carbon mineralization pass that occurs after rewetting the soil. Three different saturation treatments were prepared for subsequent incubation experiments (70 %, 83 %, and 95 % WHC) to control the O2 supply and thus provoke differences in denitrification activity. A 15N solution was prepared by mixing 99 at. % 15N–KNO3 (Cambridge Isotope Laboratories, Inc., Andover, MA, USA) and unlabelled KNO3 (Merck, Darmstadt, Germany) to reach 50 mg N kg−1 soil with 60 at. % 15N–KNO3 in each water saturation treatment. Hence, for the two higher water saturations the stock solution was more diluted in order to reach the same target concentration in the soil. In a first step the soil was adjusted to 70 % WHC before packing.
This 15N-labelled soil was filled in 2 cm intervals into cylindrical PVC columns (9.4 cm inner diameter × 10 cm height) (Fig. 1) and compacted to a target bulk density that corresponded to site-specific topsoil bulk densities (Jäger et al., 2003; John et al., 2005). Packing in five vertical intervals achieved a uniform porosity across the column. However, there were inevitable porosity gradients within intervals (Fig. S4 in the Supplement) that affected the air and water distribution and thus air continuity at high water saturations. This packing resulted in 902 and 694 g dry weight of RM and GI soil, respectively. For the latter two saturation levels, the rest of the NO solution was sprayed sequentially onto each layer after packing. The incubation of such repacked soils instead of intact soil columns was chosen to (i) systematically investigate the effect of aggregate size and to (ii) guarantee thorough mixing of the 15N tracer with the soil.
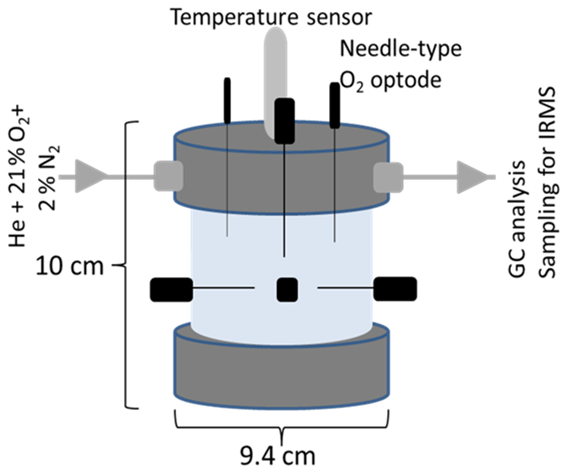
Figure 1Schematic of the column for repacked soil showing the dimensions (10 × 9.4 cm), the lid with inlet and outlet for technical gas (21 % O2 and 2 % N2 in helium), O2 microsensors (in black), and the temperature sensor (in grey) located in soil core. The outlet of the lid was directly connected to a gas chromatograph and allowed sampling for isotope ratio mass spectrometry (IRMS).
In this way, a full factorial design with 12 treatments and three factors (soil: RM, GI; aggregate size: large, small; saturation: 70 %, 83 %, 95 % WHC) was prepared in triplicates for incubation. WHC was additionally measured for both soil materials in parallel soil cores. For a better comparability with previous studies, the results are presented in terms of water-filled pore space (WFPS), which is derived from the known mass of soil and water and their respective densities. A detailed description of the experimental set-up can be found in the Supplement.
The columns containing the packed soil aggregates were closed tightly and were equipped with an inlet and outlet in the headspace (Fig. 1). To analyse O2 saturation, needle-type (40×0.8 mm) oxygen microsensors with <140 µm flat-broken sensor tips (NFSG-PSt1, PreSens Precision Sensing GmbH, Regensburg, Germany) were pinched through sealed holes in the lid and PVC column at seven well-defined positions. Three sensors were located at the top by inserting vertically into the soil through the lid and headspace down to approximately 20 mm depth, whereas four sensors were inserted laterally at the centre of the column at about 36 mm depth with angular intervals of 90∘. The microsensors were coupled to a multi-channel oxygen meter (OXY-10 micro, PreSens Precision Sensing GmbH, Regensburg, Germany), and O2 measurements were stored in 15 min intervals. The O2 data were aggregated to 6 h means for further analysis. The columns were placed in a darkened, temperature-controlled 20 ∘C water bath (JULABO GmbH, Seelbach, Germany). Two flow controllers (G040, Brooks® Instrument, Dresden, Germany) served to flush the columns with technical gas (21 % O2 and 2 % N2 in helium; Praxair, Düsseldorf, Germany) through the inlet of the columns at a rate of 5 mL min−1. This artificial atmosphere with low-N2 background concentration was used to increase sensitivity for N2 fluxes (Lewicka-Szczebak et al., 2017). Initially, the headspace was flushed with technical gas for approximately 3 to 5 h under six cycles of mild vacuum (max. 300 mbar) to bring down the N2 concentration within the soil column approximately to that of the technical gas (2 %) and to ensure comparable initial conditions for incubation. Incubation time was 192 h. Additional information of a parallel incubation where atmospheric conditions were switched from oxic to anoxic conditions to calculate the anaerobic soil volume fraction (ansvfcal) can be found in the Supplement.
2.2 Gas analysis
2.2.1 Gas chromatography (GC)
The column outlet was directly connected to a gas chromatograph (Shimadzu 14B) equipped with an electron capture detector (ECD) to analyse N2O and two flame ionization detectors (FIDs) to analyse methane (not reported) and CO2. GC measurements were taken online every 6.5 min using GC Solution software (Shimadzu, GCSolution 2.40). The detection limit was 0.25 ppm N2O and 261.90 ppm CO2, with a precision of at least 2 % and 1 %, respectively. The N2O and CO2 data were aggregated to 6 h means for further analysis in order to eliminate the high-frequency noise from the otherwise gradually changing gas concentrations under static incubation conditions. The measurements during an equilibration phase of 24 h were excluded. N2O fluxes derived from GC analysis may include N2O from processes other than denitrification and are thus referred as the total net N2O fluxes (N2O_total).
2.2.2 Isotopic analysis
Samples for isotopic analysis of 15N in N2O and N2 were taken manually after 1, 2, 4, and 8 d of incubation in 12 mL Exetainers® (Labco Limited, Ceredigion, UK). To elute residual air from the 12 mL Exetainer it was flushed 3 times with helium (helium 6.0, Praxair, Düsseldorf, Germany) prior to evacuating the air to 180 mbar. The Exetainers were flushed with headspace gas for 15 min, which amounts to a sixfold gas exchange of the Exetainer volume. At the end of the incubation, technical gas was also sampled to analyse the isotopic signature of the carrier gas.
These gas samples were analysed using an automated gas preparation and introduction system (GasBench II, Thermo Fisher Scientific, Bremen, Germany; modified according to Lewicka-Szczebak et al., 2013) coupled to an isotope ratio mass spectrometer (MAT 253, Thermo Fisher Scientific, Bremen, Germany) that measured 28 (14N14N), 29 (14N15N), and 30 (15N15N) of N2 and simultaneously isotope ratios of 29R (29N2 28N2) and 30R (30N2 28N2). All three gas species (N2O, (N2O + N2), and N2) were analysed as N2 gas after N2O reduction in a Cu oven. Details of measurement and calculations for fractions of different pools (i.e. N in N2O (fp_N2O) or N2 (fp_N2) originating from 15N-labelled NO pool) are described elsewhere and are provided in the Supplement (Fig. S3) (Spott et al., 2006; Lewicka-Szczebak et al., 2013; Buchen et al., 2016).
The product ratio (pr) [N2O (N2O + N2)] was calculated for each sample:
The calculated average pr [N2O (N2O + N2)] of each treatment was also used to calculate the average total denitrification fluxes (N2O + N2 fluxes) during the incubation:
2.3 Microstructure analysis
Due to the experimental set-up, it was only possible to scan the soil cores with X-ray CT (X-tek XTH 225, Nikon Metrology) once directly after the incubation experiment. The temperature sensor was removed, but the oxygen micro-sensors remained in place during scanning. The scan settings (190 kV, 330 µA, 708 ms exposure time, 1.5 mm Cu filter, 2800 projections, two frames per projection) were kept constant for all soils and saturations. The projections were reconstructed into a 3D tomogram with 8 bit precision and a spatial resolution of 60 µm using the filtered back projection algorithm in X-tek CT-Pro. Only macropores twice this nominal resolution were clearly detectable in the soil core images. Hence, at the lowest water saturation, not all air-filled pores can be resolved, which is discussed below. The 3D images were processed with the Fiji bundle for ImageJ (Schindelin et al., 2012) and associated plugins. The raw data were filtered with a 2D non-local means filter for noise removal. A radial and vertical drift in grayscale intensities had to be removed (Iassonov and Tuller, 2010; Schlüter et al., 2016) before these corrected greyscale images (Fig. 2a) were segmented into multiple material classes using the histogram-based thresholding methods (Schlüter et al., 2014). The number of materials varied between two (air-filled pores, soil matrix) and four (air-filled pores, water-filled pores, soil matrix, mineral grains), depending on saturation and soil material. By means of connected-component labelling implemented in the MorpholibJ plugin (Legland et al., 2016), the air-filled pore space was further segmented into isolated and connected-air-filled porosity, depending on whether there was a continuous path to the headspace (Fig. 2b). Average oxygen supply in the core was estimated by three metrics: (1) visible-air-filled porosity (εvis) and connected-air content (εcon) determined by voxel counting (Fig. 2b), (2) average air distance derived from the histogram of the Euclidean distances between all non-air voxels and their closest connected-air voxel (Fig. 2c, d) (Schlüter et al., 2019), and (3) the ansvf which corresponds to the volume fraction of air distance larger than a certain threshold. Therefore, in a sensitivity test, air distance thresholds of 0.6, 1.3, 2.5, 3.8, and 5.0 mm were used to estimate the ansvf and to find the best correlation between ansvf and N2O as well as (N2O + N2) fluxes. This was found with an ansvf at a critical air distance of 5 mm when pooling GI and RM soils (Fig. 2c, d).

Figure 2A 2D slice of one soil core packed with large aggregates (4–8 mm) from Gießen soil (GI) incubated at 75 % WFPS to illustrate grey value contrast between materials. (a) One oxygen microsensor is shown on the left (white needle) and the hole of the temperature sensor at the top (black) within the soil matrix (grey), stones (white), and pores that are filled either with air (black) or water (light grey). (b) Material classes after segmentation including soil matrix (grey), water (blue), mineral grains (light grey), connected air (red), and isolated air (rose). The green circle around the light-grey sensor tip depicts the diameter of 7.2 mm that is used to characterize its environment. (c) The 3D Euclidean distance to the closest connected-air voxel (mineral grains are excluded) in each soil matrix or water voxel. The closest air voxel might be outside of the 2D plane. The green line depicts the connected-air distance threshold of 5 mm that differentiates between an anaerobic soil volume fraction (light colours) and aerated volume (dark colours). (d) Relative frequency of soil volume as a function of distance to closest connected air [mm] divided into aerobic (red) and anaerobic (green) soil volume.
In summary, the εcon is a proxy for the supply with gaseous oxygen coming from the headspace, whereas the connected-air distance and ansvf are proxies for the supply limitation of dissolved oxygen by diffusive flux through the wet soil matrix. In addition to these averages for entire soil cores, both εcon and average air distance were also computed locally in the vicinity of oxygen sensor tips (Fig. 2b–c) to compare these metrics with measured oxygen concentrations. Spherical regions of interest (ROIs) with different diameters from 3.6 to 10.8 mm were tested with respect to the highest correlation of εcon and average air distance with average oxygen concentration of individual sensors. This was found to occur at a diameter of 7.2 mm when centred on the sensor tip.
In addition to scans of the entire core, four individual aggregates (4–8 mm) of each soil were also scanned with X-ray CT (80 kv, 75 µA, 1 s exposure time, no filter, 2400 projections, two frames per projection), reconstructed in 8 bit at a voxel resolution of 5 µm, filtered with a 2D non-local means filter, and segmented into pores and background with the Otsu thresholding method (Otsu, 1975). The largest cuboid fully inscribed in an aggregate was cut and used for subsequent diffusion modelling as described below.
2.4 Diffusivity simulations
Diffusivity was simulated for individual aggregates as well as for the entire soil core (bulk diffusivity) directly on segmented X-ray CT data by solving the Laplace equation with the DiffuDict module in the GeoDict 2019 software (Math2Market GmbH, Kaiserslautern, Germany). A hierarchical approach was used to (1) estimate the effective diffusivity of the wet soil matrix by simulating Laplace diffusion on individual soil aggregates with the explicit-jump solver (Wiegmann and Bube, 2000; Wiegmann and Zemitis, 2006) and (2) model diffusivity (Dsim) with the explicit-jump solver on the entire soil core (1550 × 1550 × [1500–1600] voxels). The latter was based on the visible 3D pore space and using the effective diffusion coefficient of the soil matrix as obtained from the simulation of soil aggregates. We assumed an impermeable exterior, impermeable mineral grains (GI only), and the diffusion coefficient of oxygen in air and water (≥75 % WFPS only) in the respective material classes (see detailed information in the Supplement).
2.5 Statistical analysis
Statistical analysis was conducted with R (R Core Team, 2018). Figures were produced with the package ggplot2 (Wickham, 2016). In order to estimate the correlation between various variables that do not exhibit a normal distribution (average values of N2O fluxes, (N2O + N2) fluxes, CO2 fluxes, O2 saturation, Dsim, εcon, ansvf, and pr), Spearman's rank correlations with pairwise deletion of missing values were performed, pooling data for GI and RM soils. The p values were corrected for multiple comparison according to Benjamini and Hochberg (1995) and adjusted p values ≤ 0.05 were considered to be significant.
As described before, there were four missing values for pr due to limitation of the isotopic measurement at the lowest saturation. For further statistical analysis of the data set, any missing pr values were imputed using the chained random forest using more than 100 regression trees in terms of overall variable pattern as this method can handle nonlinear relationships between variables (Breiman, 2001; Nengsih et al., 2019). It was also required to standardize the data of very different value ranges for further analysis. Since N2O and/or (N2O + N2) were not detectable for a few samples at the lowest saturation, a constant of 1 was added to N2O and (N2O + N2) fluxes prior to transformation. This changes the mean value but not the variance of data. In order to get normal distributions and linear relationships, a logarithmic transformation was applied to metric data (CO2, N2O and (N2O + N2) fluxes, Dsim), whereas a logistic transform was applied to dimensionless ratios between 0 and 1 (ansvf).
Since there was a high collinearity among most variables, a partial least square regression (PLSR) with leave-one-out cross-validated R2 was the best method to identify the most important independent explanatory variables (six predictors: CO2 fluxes, O2 saturation, Dsim, εcon, ansvf, and pr) to predict the response variables N2O or (N2O + N2) fluxes. It has to be emphasized that N2O fluxes and pr were measured independently of each other using different measuring methods (gas chromatography and isotopic analysis), which justifies pr as a predictor variable for N2O fluxes. In contrast to this, (N2O + N2) fluxes were calculated from pr, and therefore pr was not included in PLSR for the response variable (N2O + N2) fluxes (resulting in five explanatory variables). Bootstrapping was used to provide confidence intervals that are robust against deviations from normality (R package boot v. 1.3-24) (Davison and Hinkley, 1997; Canty and Ripley, 2019). Given the relatively small sample size (36 incubations in total), the smoothed bootstrap was used by resampling from multivariate kernel density (R package kernelboot v. 0.1.7) (Wolodzko, 2020). The BCa bootstrap confidence interval of 95 % of R2 was a measure to explain the variability in each response variable (Efron, 1987). Components that best explained N2O and (N2O + N2) fluxes were identified by permutation testing.
To address the second research question of this study concerning substitutions of predictors by classical, averaged soil properties, additional and simplified models with the PLSR approach described above were performed using various variables to substitute the most important predictors for N2O or (N2O + N2) fluxes. A detailed description of the substitution is provided in Sect. 3.4 and Sect. 4.2.
3.1 Bulk respiration
Time series of CO2 and N2O fluxes (Fig. S1) show aggregated values for 6 h steps over the complete incubation time of approximately 192 h, ignoring the first 24 h due to initial equilibration of the system (i.e. redistribution of water, expression of all denitrification enzymes, fast mineralization of labile carbon). Averages for the whole incubation are reported in Fig. 3a, c and in Tables S1 and S4 in the Supplement. The 3.7 times higher SOM content in GI soil than in RM soil resulted in higher microbial activity so that CO2 fluxes were approximately 3 times higher for all saturations. The variability in CO2 fluxes between replicates is much higher than the temporal variability during incubation. This is probably explained by small differences in the packing of the columns that can have large consequences for soil aeration. CO2 production in both soils was lowest with the highest water saturation but was quite similar for both treatments with saturations <80 % WFPS (Fig. 3a). Aggregate size had a negligible effect on CO2 production.
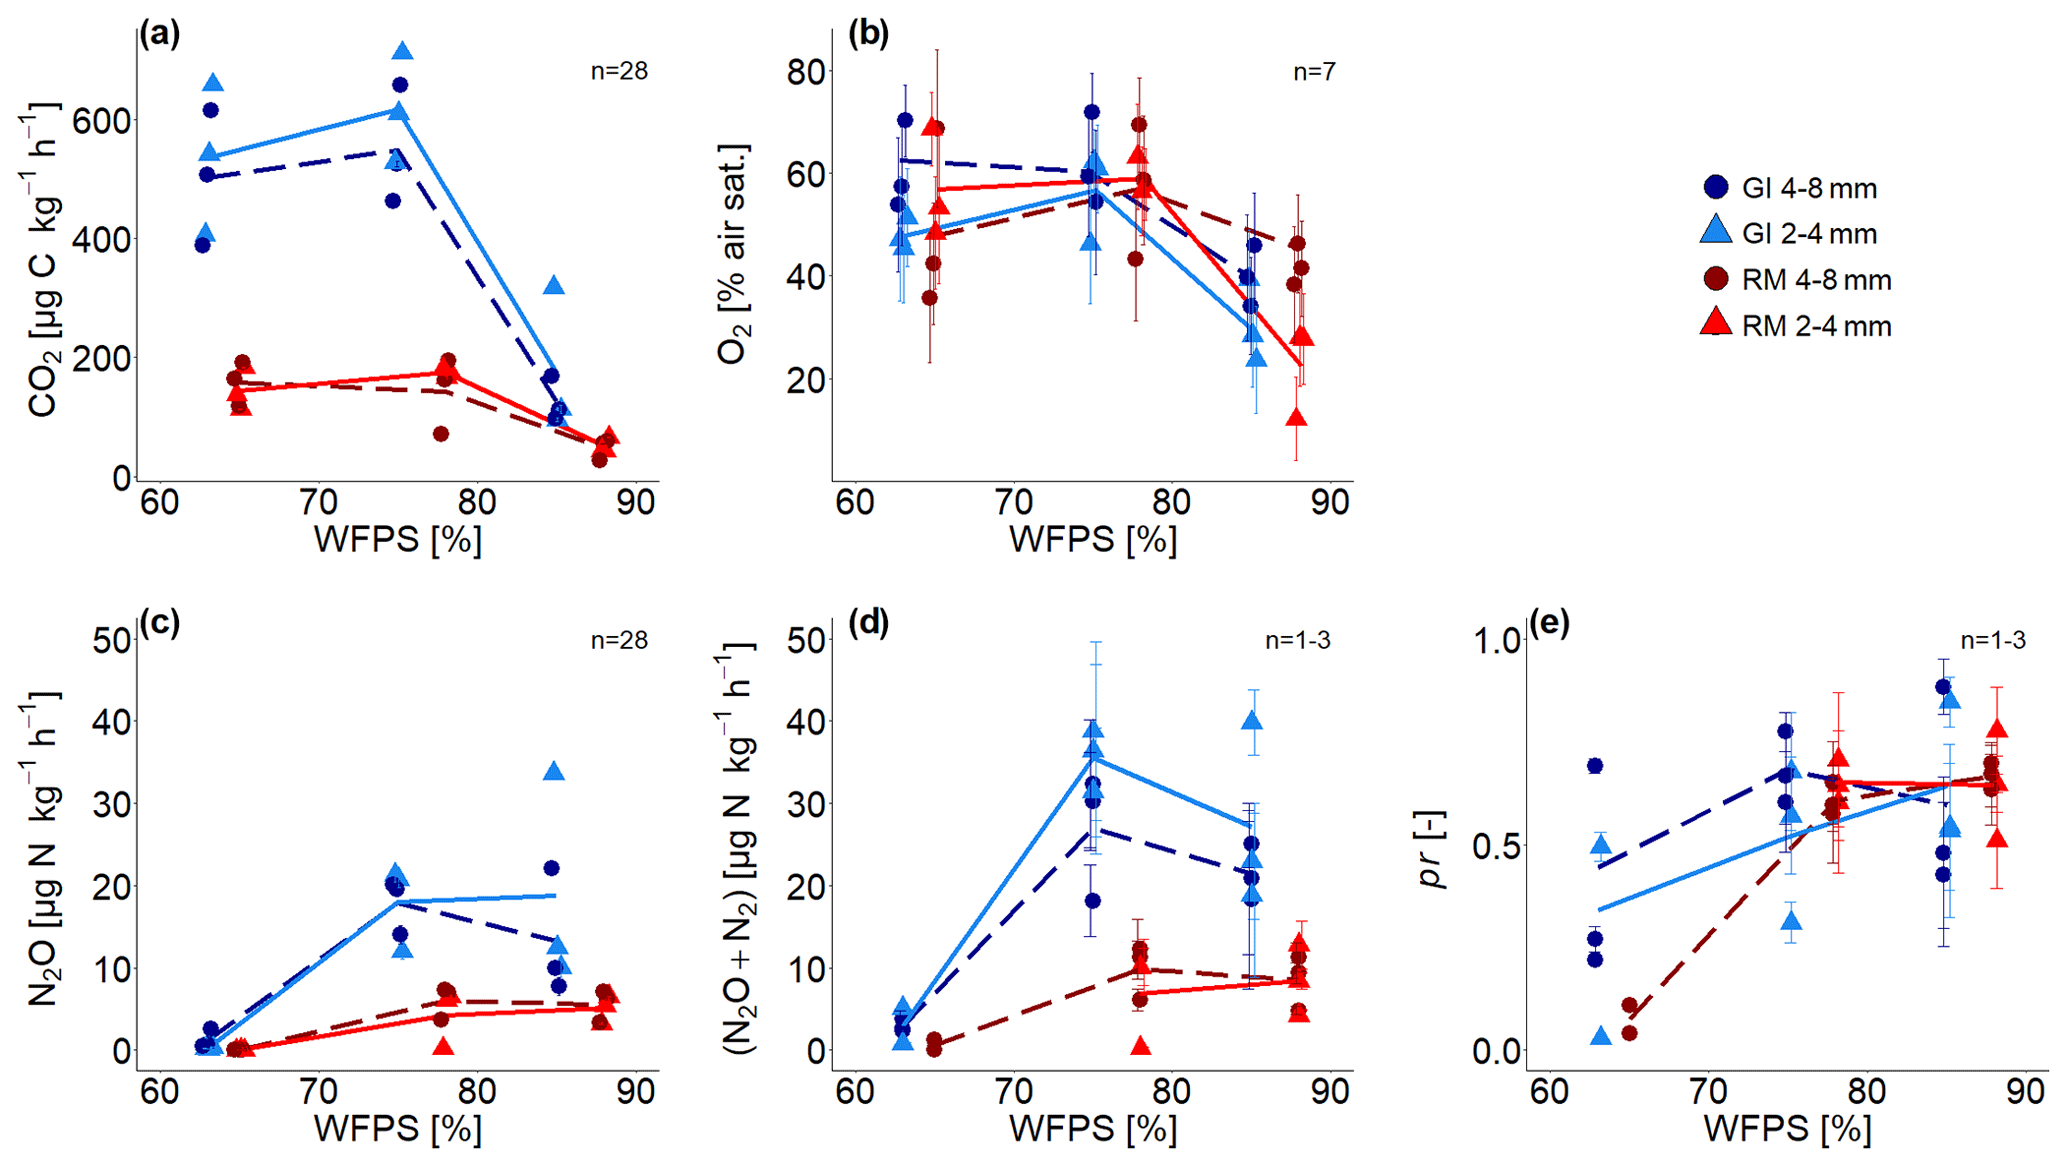
Figure 3(a) Average CO2 fluxes, (b) average O2 saturation, (c) average N2O and (d) (N2O + N2) fluxes, and (e) average product ratio (pr) [N2O (N2O + N2)] as a function of water-filled pore space (WFPS) for two repacked aggregate sizes (2–4 and 4–8 mm) from Rotthalmünster (RM) and Gießen (GI) soil. Symbols depict the average values for each of the three individual replicates, with error bars showing the standard error in the mean; standard error in (a) and (c) are of fluxes measured during incubation, in (b) the standard error from measurements of seven sensors located within the soil core, and in (d) and (e) of three measurements during incubation time (after 2, 4, and 8 d with detectable R29 and R30; n=3 for two highest WFPSs). The number of measurements (n) considered for averaging is displayed in each subfigure. The lines (dashed and solid) connect the average value of three replicates at each saturation (large and small aggregates, respectively).
Substantial N2O and (N2O+N2) emissions were detected for saturations ≥75 % WFPS and were again approximately 3 times higher in SOM-rich GI soil than in RM soil (Fig. 3c, d). The variability between replicates is again higher than the temporal variability (e.g. in Fig. 3d and time series in Fig. S1), and the effect of aggregate size is inconsistent due to the large variability among replicates. Mineral N was not analysed after the incubation, and therefore cumulative (N2O + N2) fluxes were used to estimate the N loss after 192 h of incubation. Considering the N addition of 50 mg N kg−1 as NO and an average natural NO background of 34 mg kg−1, substantial N loss was observed for both soils at ≥75 % WFPS. The N converted to N2O or N2 represents a proportion equal to ≤2.6 % with RM soil and ≤8.0 % with GI soil for both aggregate sizes and saturations.
Average O2 saturation was lowest with the highest water saturation and roughly the same for saturations <80 % WFPS (Fig. 3b). Some sensors showed a gradual decline in O2 concentration, whereas some showed a drastic reduction or increase in a short period of time, probably due to water redistribution (Fig. S2). The average of the final 24 h was taken for all subsequent analysis as this probably best reflects the water distribution scanned with X-ray CT. Standard errors among the seven O2 microsensors were high in each treatment due to very local measurement of O2 that probed very different locations in the heterogeneous pore structure.
The pr, i.e. the N2O (N2O + N2) as a measure of denitrification completeness, showed a similar behaviour as a function of water saturation as N2O release, with a plateau for saturations ≥75 % WFPS at 0.6 and a lower but somewhat more erratic pr for the lowest saturation due to a generally low 15N gas release (Fig. 3e). Thus, the (N2O + N2) fluxes at ≤65 % WFPS could only be calculated for a small number of samples due to lacking data of pr (Tables S1, S4). SOM content and aggregate size had no effect on pr. Time series of pr showed a gradual reduction for all treatments as the N2 emissions grew faster than the N2O emissions (Fig. S5). With water saturations >75 % WFPS, the pr decreased with time and was in most cases <0.5 at the end of incubation (Fig. S5). In summary, for each soil all samples with saturation ≥75 % WFPS showed similar pr (Fig. 3e) and N2O release (Fig. 3c). This agreed well with subsequent X-ray CT estimates of air connectivity as shown below.
3.2 Pore system of soil cores
Due to lower target bulk density in GI soil (1.0 g cm−3) compared to that of RM soil (1.3 g cm−3), visible-air content (εvis; depicted in red and pink in Fig. 2c) was higher independent of aggregate size (Fig. 4a). The εvis decreased with increasing water saturation but not linearly, as would be expected. The air contents in the very wet range are in fact higher (16 %–17 %) than the target air saturation of approximately 11 % or 15 % for RM and GI soil, respectively. It was not possible to remove air more efficiently during packing, and some ponding water might have accidentally been removed with vacuum application during purging at the beginning of incubation. Additionally, the GI soil was rich in vermiculite and swelled upon wetting. This increase in soil volume at the end of incubation resulted in a relative decline in water content. For increasing water content the air content that is connected to the headspace (εcon; depicted in red in Fig. 2b) was reduced much more strongly as compared to the total εvis. This was observed for both soils and aggregate sizes and indicates that a substantial amount of air is trapped (Fig. 4b). According to this observation, average distance to visible air was very small (Fig. 4c) and remained below 1.5 mm even for the highest water saturation, with generally smaller distances for smaller aggregates. Yet, the average distance to the pore system connected with headspace escalates in the wet range (Fig. 4d). The huge variability among replicates comes from the fact that trapping by complete water blockage typically occurs in the slightly compacted upper part of a packing interval, but the specific interval where this happens varies among samples (Fig. S4). The different aggregate sizes did not affect the distance to connected air as the long-range continuity of air is controlled by bottlenecks in the pore space and not by aggregate size.

Figure 4(a) Visible-air content (εvis), (b) connected-air content (εcon), (c) average distance to visible air, (d) average distance to connected visible air, (e) simulated diffusivity (Dsim), and (f) anaerobic soil volume fraction (ansvf) as a function of water-filled pore space (WFPS) for two repacked aggregate sizes (2–4 and 4–8 mm) from Rotthalmünster (RM) and Gießen (GI) soil and three replicates each depicted by symbols. The lines (dashed and solid) connect the average value of three replicates (large and small aggregates, respectively). The horizontal grey lines in (e) reflect material properties. The experiment was performed at 20 ∘C and according to that diffusivity was calculated at 20 ∘C.
Water saturation had a dramatic impact on Dsim (Fig. 4e), leading to a reduction by 5 orders of magnitude in a rather small saturation range. At high saturations it fell below the oxygen diffusion coefficient in pure water due to the tortuosity of the pore system. The ansvf (Fig. 4f) is directly linked to connected-air distance and shows the same escalating behaviour at the highest saturation up to a volume fraction of 50 %–90 %. The ansvf is highly correlated with CO2 emissions (Spearman's and p=0.04), which exhibit the same tipping point behaviour, yet with very different slopes in the regression for the different soils due to different microbial activity (Fig. S6). The correlation of ansvf is weaker with N2O (Spearman's , p<0.1) and negligible with (N2O + N2) (p>0.2), suggesting that denitrification is more complexly controlled. The full regression analysis of ansvf with different gases and for different soils and aggregate sizes is presented in the Supplement (Fig. S6).
3.3 Microscopic oxygen distribution
The local measurements of O2 using microsensors are demonstrated as an example for two selected sensors from the same soil column (GI soil incubated at 75 % WFPS). They are located at the same depth with a separation distance of <2 cm. Sensor 1 detected low O2 concentrations (18 % air saturation) because it was located in a compact area with low εcon (4 %) and a rather large distance to the closest air-filled pore (1.6 mm) (Fig. 5a, b, d). Sensor 2 detected fairly high O2 concentrations (76 % air saturation) as it happened to pinch into a macropore with a high εcon (15 %) and a short distance to connected air (0.8 mm) in its vicinity (Fig. 5a–c). The green or violet circle with a diameter of 7.2 mm depicts the spherical averaging volume for εcon and distance to connected air that correlated best with the average O2 concentrations when lumped over all soils and saturations (Fig. 5b–d).

Figure 5Local oxygen distribution in one soil core packed with small aggregates (2–4 mm) from Gießen soil (GI) incubated at 75 % water-filled pore space (WFPS) to illustrate as an example the very local measurement of O2. Shown here are (a) O2 saturations measured by two microsensors as a function of incubation time; (b) a 3D subvolume shown from the top, with connected air depicted in red and both sensors depicted with their respective spherical support volume in colours corresponding to (a); and 2D greyscale slices through the sensor tip depicting soil matrix in light grey, water in dark grey, and air in black for (c) the sensor measuring high and for (d) the sensor measuring low O2 saturations. The violet and green circles depict the proximity of the sensor tip (7.2 mm diameter) used to calculate the averaged local metrics.
The treatment-specific correlations between distance to connected air and average O2 concentrations are shown in Fig. 6. At the lowest saturation level there is no correlation at all (Spearman's R and p≥0.38; Fig. 6a, d) because some unresolved pores (<120 µm) within the aggregates are air-filled so that oxygen availability is not limited by visible air. At the intermediate saturation level the correlations were best (Spearman's and p≤0.02) because all unresolved pores are water-filled (Fig. 6b, e). At the highest water saturation the correlation was highest for large aggregates (Spearman's and p=0.08) because the local effect of soil structure might become stronger relative to the non-local effect of air entrapment. With the other three treatments the correlations were worse again (Spearman's R between −0.01 and −0.3 and p≥0.58; Fig. 6c, f) because distance to connected air ignores all trapped air, which may still contribute a lot to oxygen supply.
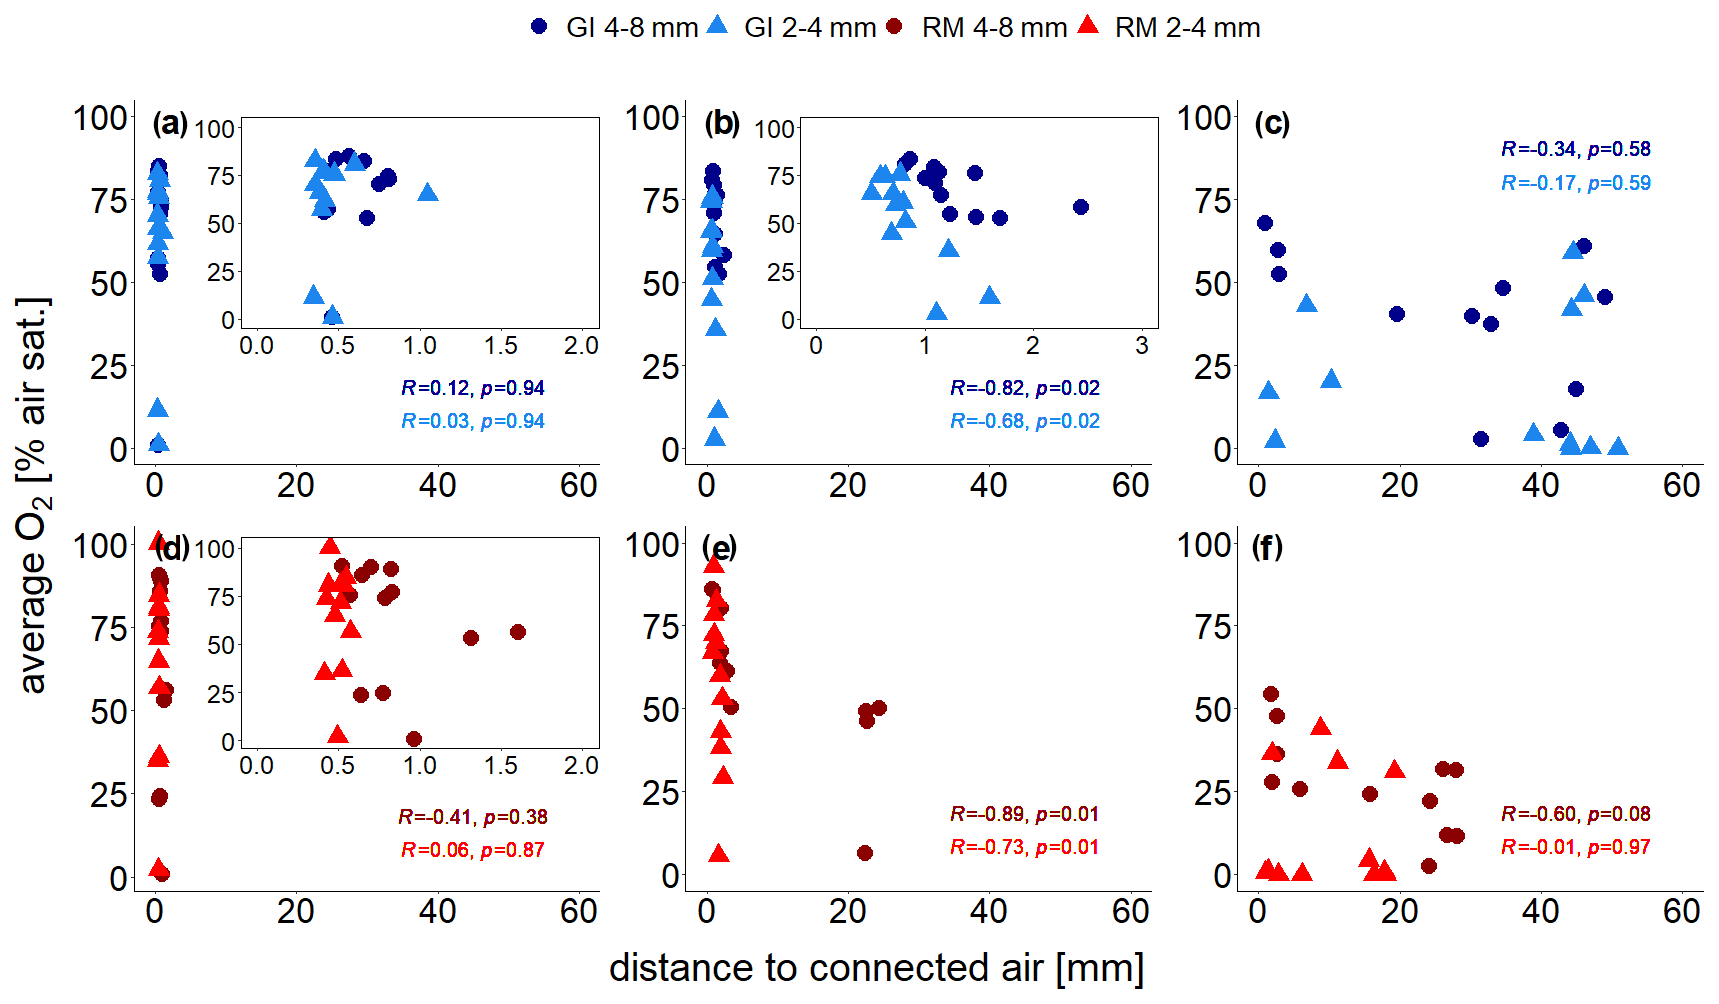
Figure 6Average O2 saturation (at the end of incubation experiment) measured with four sensors, each located at the centre of the soil core, as a function of distance to visible connected air for two repacked aggregate sizes (2–4 and 4–8 mm) from Gießen (GI; a–c; blue) and Rotthalmünster (RM; d–f; red) soil. Panels (a) and (d) show results for the lowest (63 % or 65 % WFPS with GI and RM soil, respectively), (b, e) for medium (75 % or 78 % WFPS with GI and RM soil, respectively), and (c, f) for the highest (85 % or 88 % WFPS with GI and RM soil, respectively) water saturation. The insets in (a), (b), and (d) show a reduced distance range. The distance to visible connected air is averaged in a spherical region around the sensor tip (7.2 mm diameter). The Spearman's rank correlation coefficient (R) indicates the extent of monotonic relation between the ranks of both variables. The associated p values (p) were corrected for multiple comparison according to Benjamini and Hochberg (1995).
3.4 Explanatory variables for denitrification
So far the correlations among different explanatory variables and between explanatory variables and N gas release have been shown for individual treatments, i.e. separately for each combination of soil and aggregate size, in order to focus on the effect of water saturation. However, the true potential of explanatory variables to predict denitrification can only be explored with the entire pooled data set so that the variability in denitrification is captured more representatively.
The PLSR identified two principal components that best explained N2O and (N2O + N2) fluxes, while most variables contributed to the first component (Comp1), and almost exclusively CO2 release contributed to the second component (Comp2) (see Fig. S8 in the Supplement). These principal components revealed a vastly different ability of individual explanatory variables to explain the observed variability in N2O and (N2O + N2) release. The importance of explanatory variables to predict N2O and (N2O + N2) fluxes varied as follows: CO2 > (pr) > ansvf > Dsim > εcon > O2 (see Fig. S8). Hereinafter pr shown in brackets illustrates its contribution to PLSR analysis for N2O fluxes only. The explanatory variability, expressed in the text as R2⋅100 [%], was 82 % for N2O fluxes and 78 % for (N2O + N2) fluxes when considering the complex model with all explanatory variables (CO2 flux, O2 saturation, εcon, Dsim, ansvf (and pr)) (Fig. 7). The resulting regression equations can be found in the Supplement (Eqs. S7–S8).
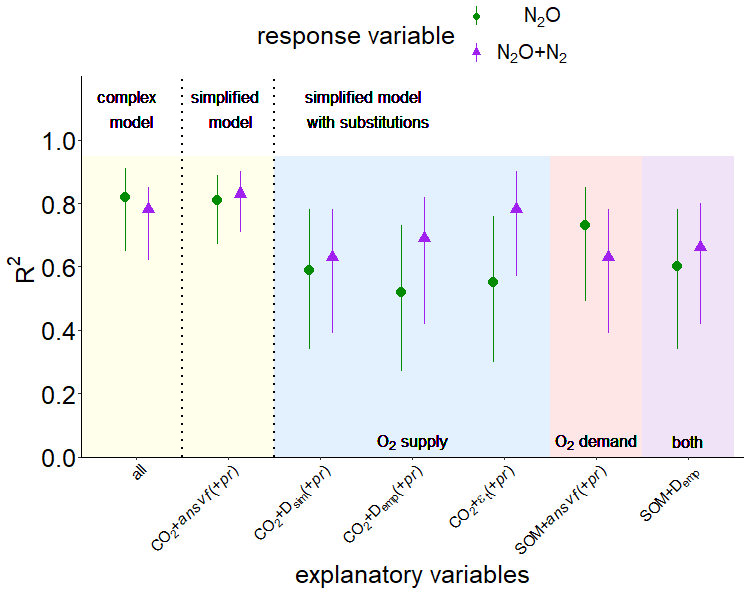
Figure 7Explained variability expressed as R2 with a confidence interval of 95 % resulting from partial least square regression (PLSR) with leave-one-out cross-validation and bootstrapping for response variables N2O (green symbols) or (N2O + N2) fluxes (violet symbols) for pooled data of both soils (from Rotthalmünster (RM) and Gießen (GI)), WFPS treatments, and aggregate sizes (n=36). The yellow area shows a complex model including all explanatory variables of the present study (CO2, O2, connected-air content (εcon), diffusivity (Dsim), anaerobic soil volume fraction (ansvf), and product ratio (pr) [N2O (N2O + N2)]) (all) and a simplified model including only the most important predictors (CO2 + ansvf (+ pr); predictor (+ pr) was only used for N2O emissions). The blue area shows additional simplified models with substitutions of the most important predictor for O2 supply (ansvf) by Dsim or diffusivity calculated from an empirical model (Demp) (Deepagoda et al., 2011) or theoretical air content (εt). The red area shows a simplified model with substitutions of the most important predictor for O2 demand (CO2) by soil organic matter (SOM; measured in bulk soil). Substitution of the two most important predictors (CO2 and ansvf) by SOM and Demp is shown in the violet area.
Starting from this complex model, a series of simplifications and substitutions of explanatory variables were conducted to assess the extent to which the resulting loss in predictive power is acceptable. Reducing the number of explanatory variables to the most important variables resulted in CO2 and ansvf for (N2O + N2) release (83 % explained variability, simplified model in Fig. 7). In other words, the combination of these two predictors (ansvf and CO2) is crucial as CO2 release explains the different denitrification rates between the two soils, whereas ansvf explains the differences within a soil due to different saturations. To predict N2O emissions, the simplified model with the most important explanatory variables CO2, ansvf, and pr as a third predictor resulted in 81 % of explained variability (Fig. 7). Average O2 saturation could be omitted for its small correlation with N2O or (N2O + N2) release in general, whereas εcon and Dsim could be omitted because of the high correlation with ansvf (Fig. S7).

Figure 8Conceptual scheme of oxygen (O2) supply and demand and its effect on denitrification. Material classes include soil matrix (grey area), water (blue), mineral grains (light grey), connected air (red), and isolated air (rose). The black line divides between aerobic (light-grey area) and anaerobic (dark-grey area) conditions. O2 supply and demand regulate the formation of anaerobic soil volume fraction (ansvf) as an imprint of the spatial distribution of connected air (item number 1), respiration (item number 2) that would move the boundary between oxic and anoxic zones in the soil matrix closer towards the pore when soil respiration is high (and vice versa), and N2O reduction to N2 (expressed by the product ratio (pr); item number 3). The numbered items show how the explanatory variables that best describe N2O release affect denitrification.
The regression equations with R2 values and a confidence interval of 95 % in square brackets resulting from PLSR, with CO2 and ansvf (and pr) identified as the most important explanatory variables to predict N2O or (N2O + N2) fluxes of the present study for data after log or logit transformation:
Various variables were used to substitute best predictors (CO2 or ansvf) (Fig. 7) in PLSR. The substitution of CO2 by SOM or ansvf by εt,Dsim, or empirical diffusivity (Demp) based on total porosity and air content (Deepagoda et al., 2011) is explained in Sect. 4.2.
4.1 Which processes govern denitrification in soil?
The onset and magnitude of denitrification are controlled by O2 supply and O2 consumption, which in turn depend on processes in soil occurring at microscopic scales. This study was designed to examine different levels of O2 consumption by comparing soils with different SOM contents and different levels of O2 supply by comparing different aggregate sizes and different water saturations. Other factors that would have affected O2 demand and energy sources for denitrifiers (quality of organic matter, temperature, pH, plant–soil interactions), O2 supply (oxygen concentration in the headspace, temperature), or other drivers of denitrification (NO concentration, pH, denitrifier community structure) were either controlled or excluded in this study.
N2O release from soil can be low because denitrification does not occur under sufficient oxygen supply, because it is formed in wet soil but reduced to N2 before it can escape to the atmosphere, or because it is trapped in isolated air pockets (Braker and Conrad, 2011). Trapped N2O is thought to likely be reduced to N2 eventually if gaseous N2O is not released after a saturation change, which would open up a continuous path to the headspace. This is shown in the schematic on the balance between O2 supply and demand and its effect on denitrification (Fig. 8).
To our knowledge, the experimental set-up of the present study combined for the first time microstructure analysis of soil (X-ray CT) with measurements of N2O and (N2O + N2) fluxes to explore controlling factors of the complete denitrification process including N2 formation. The explanatory variables that contributed the highest predictive power with (N2O + N2) release were ansvf and CO2 release (Fig. 8). The estimated ansvf (item 1) is a sole function of the spatial distribution of connected air in soil and therefore only reflects soil structural properties related to O2 supply. The dependence of denitrification on diffusion constraints was demonstrated by several models that were developed to predict the formation of anoxic centres within soil aggregates (Greenwood, 1961; Arah and Smith, 1989; Arah and Vinten, 1995; Kremen et al., 2005). The distance threshold for anoxic conditions to emerge was set on an ad hoc basis at 5 mm from connected air at the end of incubation but is likely to vary with O2 demand by local microbial activity (CO2 release represented by the green fringe area, item 2) during the incubation (Kremen et al., 2005; Rabot et al., 2015; Ebrahimi and Or, 2018; Keiluweit et al., 2018; Kravchenko et al., 2018; Schlüter et al., 2019). Because we could only conduct X-ray CT scans at the end of incubation, redistribution of water during the incubation time cannot be ruled out. This could have changed ansvf and thus might explain some of the temporal variability in gaseous fluxes. In repacked soils it might be distributed rather uniformly and therefore be correlated with bulk CO2 release (Aon et al., 2001; Ryan and Law, 2005; Herbst et al., 2016). The fact that aggregate size had no effect on denitrification indicates that critical distances were larger than the aggregate radii and rather controlled by air distribution in the macropore system. When air content was high, all visible macropores were air-filled so that this critical air distance was hardly exceeded anywhere. When air content was low (close to full water saturation), the patchy distribution of air and water in the macropore system was governed by subtle layering in the pore structure and not by aggregate size. This means that both aggregate sizes used in the present study might have been too small to provoke differences in O2 availability and thus in CO2, N2O, and (N2O + N2) fluxes. The large distance found here is in contrast to the very short critical distances of 180 µm for sufficient soil aeration estimated by Kravchenko et al. (2018) and Kravchenko et al. (2019) for intact soil cores containing crop residues for which soil respiration was not determined but is likely to be much higher.
A somewhat surprising result is that oxygen concentration measurements did not have an added value for predicting either N2O release or total denitrification. The best correlation of local O2 concentration with εcon was with a radial extent of 3.6 mm used for averaging around the microsensor (Fig. 6). Thus, with seven microsensors per column we only probed 0.2 % of the total soil volume. This is too small to capture aerobic and anaerobic conditions representatively, especially since they may switch within short distances (Fig. 5). More sensors or sensors with larger support volume could be a means to improve the predictive power of local oxygen measurements. However, there is always a trade-off between retrieving more information and disturbing the soil as little as possible.
If only N2O release is concerned, pr as an independent proxy for N2O consumption (Fig. 8, item 3) was beneficial to predict N2O emissions together with CO2 and ansvf (Fig. 7). The N2O reduction to N2 and thus the pr are complexly controlled, where besides physical factors microbial (the structure of the denitrifier community) and chemical properties (pH, N oxides, SOM, temperature, salinity) are relevant (Smith et al., 2003; Clough et al., 2005; Müller and Clough, 2014). With respect to physical factors, decreasing diffusivity enhances N2O residence time and N2O concentration in the pore space, thus favouring N2O reduction. According to this, Bocking and Blyth (2018) assumed a very small pr in wet soils because N2O may be trapped in the soil or completely reduced to N2. This assumption may also support results of the present study, where the average (N2O + N2) fluxes peaked at the medium water saturation (particularly with GI soil), while Dsim decreased with increasing water saturations (Fig. 4), which may indicate an entrapment of (N2O + N2) in isolated soil pores (Clough et al., 2005; Harter et al., 2016). However, N2 release increased more strongly with time than the N2O release, resulting in decreasing pr with time (Fig. S5). The chance of N2O to be released before it is reduced to N2 depends on the diffusion distance of dissolved (and gaseous) N2O between its formation sites and the atmosphere. Although diffusion pathways for O2 and N2O are similar, just in the opposite direction, ansvf and pr might be a good combination of proxies to predict N2O emissions to capture physical and microbial properties.
4.2 How to substitute microscale information by bulk properties
The aims of this study were to find a minimum set of variables that explain the regulation of microbial denitrification at microscopic scales in a simplified experimental set-up and to explore the extent to which this microscopic information can be substituted by readily available bulk properties that are feasible to measure in a field campaign. The interplay of O2 supply and O2 demand resulted in CO2 emissions and CT-derived ansvf being the most important predictors for (N2O + N2) fluxes, while for N2O fluxes pr was also important (Figs. 7, S8). Simplified models with the most important predictors only (CO2 + ansvf (+ pr)) were sufficient to achieve similar explained variabilities (81 % and 83 % for N2O and (N2O + N2) fluxes, respectively) compared to the complex models. The downside of using CO2 and CT-derived ansvf as predictors for denitrification is that these proxies are often unavailable, and reasonable substitutions by easily available variables would be desirable.
The ansvf could have been replaced with alternative proxies for O2 supply like Dsim,Demp, and εt, which would have led to a reduction in explained variability in (N2O + N2) fluxes to 52 %–78 % and an even larger drop for N2O fluxes to 46 %–59 % (Table S2). The substitution of ansvf by Dsim would avoid the requirement for an ad hoc definition of a critical pore distance threshold, but it is gained with the caveat of very time-consuming 3D simulations or laborious measurements. Therefore, the substitution of ansvf with diffusivity estimated by empirical models (Demp) seems more viable. Diffusivity is mainly controlled by soil bulk density and water saturation (Balaine et al., 2013; Klefoth et al., 2014). These empirical models predict diffusivity based on empirical relationships with total porosity (Φ) and air-filled porosity (ε) (Millington and Quirk, 1961; Moldrup et al., 2000; Resurreccion et al., 2010; Deepagoda et al., 2011, 2019). As expected the discrepancy between calculated Demp and simulated Dsim was highest at water saturation >75 % WFPS, where discontinuity due to packing procedure took full effect as described earlier (Figs. S9, S4). The substitution of CT-derived ansvf by Demp derived from empirical models (Fig. 7, Table S2) is perhaps unacceptable for a genuine understanding of N2O or (N2O + N2) emissions from individual samples since estimated diffusivity ignores the actual tortuosity and continuity of the air-filled pore space. However, it may be a promising approach to reasonably predict average N2O or (N2O + N2) fluxes under natural conditions with readily available soil characteristics (Fig. 7, Table S2). In this particular study, Dsim could even be replaced with the theoretical air content (εt) adjusted during packing (together with CO2 (+ pr)) without a reduction in explained variability in N2O and (N2O + N2) fluxes (Fig. 7, Table S2) due to the very strong log-linear relationship between the εt and Dsim (Fig. 4e). However, totally neglecting any proxy for O2 supply (i.e. CO2 only to predict N2O fluxes) was insufficient to predict N2O fluxes (Table S2).
A different strategy to estimate ansvf from bulk measurements is to switch from oxic to anoxic incubation by replacing the carrier gas under otherwise constant conditions. The smaller the ansvf during oxic incubation, the larger the difference in (N2O + N2) release between the two stages. Details about the calculation of this ansvfcal can be found in the Supplement. The ansvfcal assumes that actual denitrification is linearly related to ansvf and that the specific anoxic denitrification rate is homogenous, i.e. would be identical at any location within the soil. Deviations from this assumption could arise from heterogeneity in the distribution of substrates and microbial communities. However, the actual soil volume where denitrification may occur, described by the distance to aerated pores, does not depend only on O2 diffusion but also on respiration (O2 consumption). Therefore, it could be expected that ansvf derived from X-ray CT imaging analysis compared to ansvfcal was overestimated with RM soil or underestimated with GI soil due to the differences in carbon sources and related O2 consumption. The average ansvfcal was similar (0.24) to the ansvf (0.21) for RM soil (Table S3). With GI soil, however, the ansvfcal was larger (0.45) than the image-derived ansvf (0.13). This difference may indeed result from an underestimation of ansvf of GI soil due to the higher SOM content and respiration rates. In future experiments it might be recommendable to integrate the O2 consumption into ansvf estimation. The appeal of this two-stage incubation is that it can be conducted with larger soil columns as there is no size restriction as with the application of X-ray CT. Evidently, this two-stage incubation approach is not feasible for field campaigns, for which we would recommend to resort to estimated diffusivities instead. However, both approaches are complementary since both are associated with different assumptions and thus uncertainties. Therefore, using them both improves the assessment of ansvf.
The use of CO2 production as a proxy for O2 demand to predict N2O and (N2O + N2) release is limited as it is not fully independent of denitrification since anaerobic respiration contributes to total respiration. Therefore, it is appealing to replace it with estimates of microbial activity based on empirical relationships with temperature, SOM, clay, and water content (Smith et al., 2003) as these properties are routinely measured. When including the SOM measured before the experiment for the bulk soil (Table 1) to explore N2O or (N2O + N2) emissions, predictive power for (N2O + N2) decreased (63 % compared to 83 % with CO2 instead of SOM together with ansvf), just like it was reduced for predicting N2O emissions (73 % compared to 81 % with CO2 instead of SOM together with ansvf and pr). The combination of proxies for O2 supply and demand, SOM and Demp only, to predict N2O and (N2O + N2) fluxes did not reduce the explained variability too much beyond that of individual substitutions (60 % and 66 %, respectively). An improvement might be achieved by accounting for different quality in SOM, e.g. mineral-associated organic matter, fresh particulate organic matter, microbial pool, all of which will lead to different mineralization rates and hence propensity to run into local anoxia (Beauchamp et al., 1989; Kuzyakov, 2015; Surey et al., 2020) due to the fact that SOM favours denitrification in several ways (Beauchamp et al., 1989; Ussiri and Lal, 2013), i.e. by supplying energy, leading to the consumption of O2 via respiration and the supply of mineral N from mineralization.
4.3 Future directions and implications for modelling
In large-scale effective N-cycling models, the ansvf is typically linked to the partial pressure of oxygen in soil and conveys no explicit spatial information. In the long run these models like DNDC (DeNitrification and DeComposition), CoupModel (coupled heat and mass transfer), and MicNiT (microbial carbon and nitrogen turnover) (Li et al., 1992; Jansson and Karlberg, 2011; Blagodatsky et al., 2011) might benefit tremendously from incorporating a spatially explicit ansvf as a state variable to predict denitrification. The estimation of ansvf can be improved by taking O2 consumption into account. Knowledge of the spatial distribution of respiration in combination with pore-scale modelling would further improve ansvf estimations and could be used to validate our approach with oxic and anoxic incubation. However, the empirical functions to estimate this ansvf from readily available properties similar to empirical diffusivity models have yet to be developed and validated against a whole suite of intact soil cores with different soil types and vegetation for which oxic and anoxic incubation and X-ray CT analysis are carried out jointly.
Using intact instead of repacked soils in future experiments will represent more natural conditions, e.g. larger tortuosity and thus lower diffusivity in undisturbed compared to sieved soil (Moldrup et al., 2001). However, in undisturbed soils, diffusivity and soil structure may also vary locally and as a consequence of this varying O2 supply and demand affect denitrification. Under field conditions this impact on denitrification is additionally altered by saturation changes, temperature variations, atmospheric gas concentrations, microbial community structure, and plant growth. It would thus be very interesting to also include different soil types and land use types from various climate zones in future studies, e.g. paddy soils having high water saturation and that are known to show high denitrification activity, with N2 emissions exceeding those of N2O emissions.
To our knowledge this is the first experimental set-up combining X-ray-CT-derived imaging and flux measurements of complete denitrification (i.e. N2O and (N2O + N2) fluxes) to explore the microscopic drivers of denitrification in repacked soil. We could show that changes in denitrification within different saturations could be predicted well with the anaerobic soil volume fraction (ansvf) estimated from image-derived soil structural properties. The differences in denitrification (i.e. N2O and (N2O + N2) fluxes) between two investigated soils were triggered by different respiration rates due to different SOM content. A combination of CT-derived ansvf and CO2 emission as proxies for oxygen supply and demand, respectively, is best in predicting (N2O + N2) emission (83 % explained variability) across a large saturation range and two different soils. The product ratio (pr), in addition to ansvf and CO2 emissions, was also an important predictor for emissions of only the greenhouse gas N2O (81 % explained variability).
The ansvf can also be replaced by simulated diffusivity (Dsim) (time-consuming) or by diffusivity from empirical models (Demp) but not without losing predictive power. A replacement of CO2 fluxes by SOM also resulted in lower predictive power but is recommended for large-scale applications since SOM is an independent proxy for microbial activity. The full substitution of laborious predictors (ansvf, pr, CO2) by readily available alternatives (SOM, Demp) reduced the explained variability to 60 % and 66 % for N2O and (N2O + N2) fluxes, respectively.
The high explanatory power of image-derived ansvf opens up new perspectives to make predictions (e.g. by modelling approaches or in pedotransfer functions) from independent measurements of soil structure using new techniques (e.g. X-ray CT analysis) available today in combination with biotic properties, e.g. quantity or quality of SOM. This paves the way for explicitly accounting for changes in soil structure (e.g. tillage, plants) and climatic conditions (e.g. temperature, moisture) in denitrification.
CT data and gas emission data are available from the authors on request.
The supplement related to this article is available online at: https://doi.org/10.5194/bg-18-1185-2021-supplement.
HJV, RW, and SS designed the experiment. SS, BA, and LR carried out the experiment. GMW developed the statistical analysis. SS and LR prepared the manuscript with contributions from all co-authors.
The authors declare that they have no conflict of interest.
We thank Jürgen Böttcher from the Institute of Soil Science, Leibniz University in Hanover, for measurements of soil materials used for incubation and Anette Giesemann and Martina Heuer from the Thünen Institute for Climate-Smart Agriculture in Braunschweig, Germany, for isotopic analysis. Our thanks go to Ines Backwinkel und Jan-Reent Köster from the Thünen Institute for Climate-Smart Agriculture in Braunschweig, Germany, for conducting parallel incubations under oxic and anoxic conditions.
This research has been supported by the Deutsche Forschungsgemeinschaft through the research unit DFG-FOR 2337: Denitrification in Agricultural Soils: Integrated Control and Modelling at Various Scales (DASIM) (project nos. 270261188 and 290269257).
The article processing charges for this open-access
publication were covered by a Research
Centre of the Helmholtz Association.
This paper was edited by Zhongjun Jia and reviewed by three anonymous referees.
Andersen, A. J. and Petersen, S. O.: Effects of C and N availability and soil-water potential interactions on N2O evolution and PLFA composition, Soil Biol. Biochem., 41, 1726–1733, https://doi.org/10.1016/j.soilbio.2009.06.001, 2009.
Aon, M. A., Sarena, D. E., Burgos, J. L., and Cortassa, S.: Interaction between gas exchange rates, physical and microbiological properties in soils recently subjected to agriculture, Soil Tillage Res., 60, 163–171, https://doi.org/10.1016/S0167-1987(01)00191-X, 2001.
Arah, J. R. M. and Smith, K. A.: Steady-state denitrification in aggregated soil – A mathematical approach, J. Soil Sci., 40, 139–149, https://doi.org/10.1111/j.1365-2389.1989.tb01262.x, 1989.
Arah, J. R. M. and Vinten, A. J. A.: Simplified models of anoxia and denitrification in aggregated and simple-structured soils, Eur. J. Soil Sci., 46, 507–517, https://doi.org/10.1111/j.1365-2389.1995.tb01347.x, 1995.
Balaine, N., Clough, T. J., Beare, M. H., Thomas, S. M., Meenken, E. D., and Ross, J. G.: Changes in relative gas diffusivity explain soil nitrous oxide flux dynamics, Soil Sci. Soc. Am. J., 77, 1496–1505, https://doi.org/10.2136/sssaj2013.04.0141, 2013.
Balaine, N., Clough, T. J., Kelliher, F. M., and van Koten, C.: Soil aeration affects the degradation rate of the nitrification inhibitor dicyandiamide, Soil Res., 53, 137–143, https://doi.org/10.1071/SR14162, 2015.
Balaine, N., Clough, T. J., Beare, M. H., Thomas, S. M., and Meenken, E. D.: Soil gas diffusivity controls N2O and N2 emissions and their ratio, Soil Sc. Soc. Am. J., 80, 529–540, https://doi.org/10.2136/sssaj2015.09.0350, 2016.
Beauchamp, E. G., Trevors, J. T., and Paul, J. W.: Carbon sources for bacterial denitrification, in: Advances in Soil Science, Volume 10, edited by: Stewart, B. A., Springer New York, New York, NY, 113–142, 1989.
Benjamini, Y. and Hochberg, Y.: Controlling the false discovery rate: a practical and powerful approach to multiple testing, J. Roy. Stat. Soc. B Met., 57, 289–300, 1995.
Blagodatsky, S., Grote, R., Kiese, R., Werner, C., and Butterbach-Bahl, K.: Modelling of microbial carbon and nitrogen turnover in soil with special emphasis on N-trace gases emission, Plant Soil, 346, 297–330, https://doi.org/10.1007/s11104-011-0821-z, 2011.
Bocking, C. R. and Blyth, M. G.: Oxygen uptake and denitrification in soil aggregates, Acta Mech., 229, 595–612, https://doi.org/10.1007/s00707-017-2042-x, 2018.
Braker, G. and Conrad, R.: Diversity, structure, and size of N2O-producing microbial communities in soils-What matters for their functioning?, Adv. Appl. Microbiol., 75, 33–70, 2011.
Breiman, L.: Random forests, Mach. Learn., 45, 5–32, https://doi.org/10.1023/A:1010933404324, 2001.
Buchen, C., Lewicka-Szczebak, D., Fuß, R., Helfrich, M., Flessa, H., and Well, R.: Fluxes of N2 and N2O and contributing processes in summer after grassland renewal and grassland conversion to maize cropping on a Plaggic Anthrosol and a Histic Gleysol, Soil Biol. Biochem., 101, 6–19, https://doi.org/10.1016/j.soilbio.2016.06.028, 2016.
Butterbach-Bahl, K., Baggs, E. M., Dannenmann, M., Kiese, R., and Zechmeister-Boltenstern, S.: Nitrous oxide emissions from soils: how well do we understand the processes and their controls?, Philos. T. Roy. Soc. B, 368, 20130122, https://doi.org/10.1098/rstb.2013.0122, 2013.
Cabello, P., Roldán, M. D., and Moreno-Vivián, C.: Nitrate reduction and the nitrogen cycle in archaea, Microbiology, 150, 3527–3546, https://doi.org/10.1099/mic.0.27303-0, 2004.
Canty, A. and Ripley, B.: boot: Bootstrap R (S-Plus) Functions, R package version 1.3-24, R Foundation for Statistical Computing, Vienna, Austria, available at: https://CRAN.R-project.org/package=boot (last access: 7 November 2020), 2019.
Clough, T. J., Sherlock, R. R., and Rolston, D. E.: A review of the movement and fate of N2O in the subsoil, Nutr. Cycl. Agroecosys., 72, 3–11, https://doi.org/10.1007/s10705-004-7349-z, 2005.
Davidson, E. A., Verchot, L. V., Cattânio, J. H., Ackerman, I. L., and Carvalho, J. E. M.: Effects of soil water content on soil respiration in forests and cattle pastures of eastern amazonia, Biogeochemistry, 48, 53–69, https://doi.org/10.1023/A:1006204113917, 2000.
Davison, A. C. and Hinkley, D. V.: Bootstrap methods and their application, Cambridge Series in Statistical and Probabilistic Mathematics, Cambridge University Press, Cambridge, 1997.
Deepagoda, T., Moldrup, P., Schjonning, P., de Jonge, L. W., Kawamoto, K., and Komatsu, T.: Density-corrected models for gas diffusivity and air permeability in unsaturated soil, Vadose Zone J., 10, 226–238, https://doi.org/10.2136/vzj2009.0137, 2011.
Deepagoda, T., Jayarathne, J., Clough, T. J., Thomas, S., and Elberling, B.: Soil-gas diffusivity and soil-moisture effects on N2O emissions from intact pasture soils, Soil Sc. Soc. Am. J., 83, 1032–1043, https://doi.org/10.2136/sssaj2018.10.0405, 2019.
Ebrahimi, A. and Or, D.: Dynamics of soil biogeochemical gas emissions shaped by remolded aggregate sizes and carbon configurations under hydration cycles, Glob. Change Biol., 24, e378–e392, https://doi.org/10.1111/gcb.13938, 2018.
Efron, B.: Better bootstrap confidence intervals, J. Am. Stat. Ass., 82, 171–185, https://doi.org/10.2307/2289144, 1987.
Elberling, B., Askaer, L., Jørgensen, C. J., Joensen, H. P., Kühl, M., Glud, R. N., and Lauritsen, F. R.: Linking soil O2, CO2, and CH4 concentrations in a wetland soil: implications for CO2 and CH4 fluxes, Environ. Sci. Technol., 45, 3393–3399, https://doi.org/10.1021/es103540k, 2011.
Greenwood, D. J.: The effect of oxygen concentration on the decomposition of organic materials in soil, Plant Soil, 14, 360–376, https://doi.org/10.1007/BF01666294, 1961.
Groffman, P. M. and Tiedje, J. M.: Denitrification hysteresis during wetting and drying cycles in soil, Soil Sci. Soc. Am. J., 52, 1626–1629, https://doi.org/10.2136/sssaj1988.03615995005200060022x, 1988.
Groffman, P. M., Altabet, M. A., Bohlke, J. K., Butterbach-Bahl, K., David, M. B., Firestone, M. K., Giblin, A. E., Kana, T. M., Nielsen, L. P., and Voytek, M. A.: Methods for measuring denitrification: Diverse approaches to a difficult problem, Ecol. Appl., 16, 2091–2122, 2006.
Harter, J., Guzman-Bustamante, I., Kuehfuss, S., Ruser, R., Well, R., Spott, O., Kappler, A., and Behrens, S.: Gas entrapment and microbial N2O reduction reduce N2O emissions from a biochar-amended sandy clay loam soil, Sci. Rep.-UK, 6, 39574, https://doi.org/10.1038/srep39574, 2016.
Hayatsu, M., Tago, K., and Saito, M.: Various players in the nitrogen cycle: Diversity and functions of the microorganisms involved in nitrification and denitrification, Soil Sci. Plant Nutr., 54, 33–45, https://doi.org/10.1111/j.1747-0765.2007.00195.x, 2008.
Herbst, M., Tappe, W., Kummer, S., and Vereecken, H.: The impact of sieving on heterotrophic respiration response to water content in loamy and sandy topsoils, Geoderma, 272, 73–82, https://doi.org/10.1016/j.geoderma.2016.03.002, 2016.
Højberg, O., Revsbech, N. P., and Tiedje, J. M.: Denitrification in soil aggregates analyzed with microsensors for nitrous oxide and oxygen, Soil Sc. Soc. Am. J., 58, 1691–1698, https://doi.org/10.2136/sssaj1994.03615995005800060016x, 1994.
Iassonov, P. and Tuller, M.: Application of segmentation for correction of intensity bias in X-ray computed tomography images, Vadose Zone J., 9, 187–191, 2010.
Jäger, H. J., Schmidt, S. W., Kammann, C., Grunhage, L., Muller, C., and Hanewald, K.: The University of Giessen Free-Air Carbon dioxide Enrichment study: Description of the experimental site and of a new enrichment system, J. Appl. Bot.-Angew. Bot., 77, 117–127, 2003.
Jansson, P.-E. and Karlberg, L.: COUP Manual: Coupled heat and mass transfer model for soil-plant-atmosphere systems, available at: https://www.coupmodel.com/documentation (last access: 20 March 2020), 2011.
John, B., Yamashita, T., Ludwig, B., and Flessa, H.: Storage of organic carbon in aggregate and density fractions of silty soils under different types of land use, Geoderma, 128, 63–79, https://doi.org/10.1016/j.geoderma.2004.12.013, 2005.
Jones, C. M., Stres, B., Rosenquist, M., and Hallin, S.: Phylogenetic analysis of nitrite, nitric oxide, and nitrous oxide respiratory enzymes reveal a complex evolutionary history for denitrification, Mol. Biol. Evol., 25, 1955–1966, https://doi.org/10.1093/molbev/msn146, 2008.
Kammann, C., Müller, C., Grünhage, L., and Jäger, H.-J.: Elevated CO2 stimulates N2O emissions in permanent grassland, Soil Biol. Biochem., 40, 2194–2205, https://doi.org/10.1016/j.soilbio.2008.04.012, 2008.
Keiluweit, M., Nico, P. S., Kleber, M., and Fendorf, S.: Are oxygen limitations under recognized regulators of organic carbon turnover in upland soils?, Biogeochemistry, 127, 157–171, https://doi.org/10.1007/s10533-015-0180-6, 2016.
Keiluweit, M., Gee, K., Denney, A., and Fendorf, S.: Anoxic microsites in upland soils dominantly controlled by clay content, Soil Biol. Biochem., 118, 42–50, https://doi.org/10.1016/j.soilbio.2017.12.002, 2018.
Klefoth, R. R., Clough, T. J., Oenema, O., and Van Groenigen, J. W.: Soil Bulk Density and Moisture Content Influence Relative Gas Diffusivity and the Reduction of Nitrogen-15 Nitrous Oxide, Vadose Zone J., 13, 8, https://doi.org/10.2136/vzj2014.07.0089, 2014.
Knowles, R.: Denitrification, Microbiol. Rev., 46, 43–70, 1982.
Kravchenko, A. N., Guber, A. K., Quigley, M. Y., Koestel, J., Gandhi, H., and Ostrom, N. E.: X-ray computed tomography to predict soil N2O production via bacterial denitrification and N2O emission in contrasting bioenergy cropping systems, GCB Bioenergy, 10, 894–909, https://doi.org/10.1111/gcbb.12552, 2018.
Kravchenko, A. N., Guber, A. K., Razavi, B. S., Koestel, J., Quigley, M. Y., Robertson, G. P., and Kuzyakov, Y.: Microbial spatial footprint as a driver of soil carbon stabilization, Nat. Commun., 10, 3121, https://doi.org/10.1038/s41467-019-11057-4, 2019.
Kremen, A., Bear, J., Shavit, U., and Shaviv, A.: Model demonstrating the potential for coupled nitrification denitrification in soil aggregates, Environ. Sci. Technol., 39, 4180–4188, https://doi.org/10.1021/es048304z, 2005.
Kuzyakov, Y.: Microbial hotspots and hot moments in soil: Concept & review, Soil Biol. Biochem., 83, 184–199, https://doi.org/10.1016/j.soilbio.2015.01.025, 2015.
Legland, D., Arganda-Carreras, I., and Andrey, P.: MorphoLibJ: integrated library and plugins for mathematical morphology with ImageJ, Bioinformatics, 32, 3532–3534, 2016.
Lewicka-Szczebak, D., Well, R., Giesemann, A., Rohe, L., and Wolf, U.: An enhanced technique for automated determination of 15N signatures of N2, (N2+N2O) and N2O in gas samples, Rapid Commun. Mass Sp., 27, 1548–1558, https://doi.org/10.1002/rcm.6605, 2013.
Lewicka-Szczebak, D., Augustin, J., Giesemann, A., and Well, R.: Quantifying N2O reduction to N2 based on N2O isotopocules – validation with independent methods (helium incubation and 15N gas flux method), Biogeosciences, 14, 711–732, https://doi.org/10.5194/bg-14-711-2017, 2017.
Li, C. S., Frolking, S., and Frolking, T. A.: A model of nitrous oxide evolution from soil driven by rainfall events: 1. Model structure and sensitivity, J. Geophys. Res.-Atmos., 97, 9759–9776, https://doi.org/10.1029/92jd00509, 1992.
Malique, F., Ke, P., Boettcher, J., Dannenmann, M., and Butterbach-Bahl, K.: Plant and soil effects on denitrification potential in agricultural soils, Plant Soil, 439, 459–474, https://doi.org/10.1007/s11104-019-04038-5, 2019.
Mathieu, O., Lévêque, J., Hénault, C., Milloux, M. J., Bizouard, F., and Andreux, F.: Emissions and spatial variability of N2O, N2 and nitrous oxide mole fraction at the field scale, revealed with 15N isotopic techniques, Soil Biol. Biochem., 38, 941–951, https://doi.org/10.1016/j.soilbio.2005.08.010, 2006.
Millington, R. and Quirk, J. P.: Permeability of porous solids, T. Faraday Soc., 57, 1200–1207, https://doi.org/10.1039/tf9615701200, 1961.
Millington, R. J. and Quirk, J. M.: Transport in porous media, in: 7th Trans. Int. Congr. Soil Sci., Madison, WI, 14–21 August 1960, Elsevier, Amsterdam, 97–106, 1960.
Moldrup, P., Olesen, T., Yamaguchi, T., Schjønning, P., and Rolston, D. E.: Modeling diffusion and reaction in soils: IX. The Buckingham-Burdine-Campbell equation for gas diffusivity in undisturbed soil, Soil Science, 164, 542–551, 1999.
Moldrup, P., Olesen, T., Gamst, J., Schjonning, P., Yamaguchi, T., and Rolston, D. E.: Predicting the gas diffusion coefficient in repacked soil: Water-induced linear reduction model, Soil Sc. Soc. Am. J., 64, 1588–1594, https://doi.org/10.2136/sssaj2000.6451588x, 2000.
Moldrup, P., Olesen, T., Komatsu, T., Schjønning, P., and Rolston, D. E.: Tortuosity, diffusivity, and permeability in the soil liquid and gaseous phases, Soil Sc. Soc. Am. J., 65, 613–623, https://doi.org/10.2136/sssaj2001.653613x, 2001.
Morley, N. J., Richardson, D. J., and Baggs, E. M.: Substrate induced denitrification over or under estimates shifts in soil N2 N2O ratios, Plos One, 9, 6, https://doi.org/10.1371/journal.pone.0108144, 2014.
Moyano, F. E., Vasilyeva, N., Bouckaert, L., Cook, F., Craine, J., Curiel Yuste, J., Don, A., Epron, D., Formanek, P., Franzluebbers, A., Ilstedt, U., Kätterer, T., Orchard, V., Reichstein, M., Rey, A., Ruamps, L., Subke, J.-A., Thomsen, I. K., and Chenu, C.: The moisture response of soil heterotrophic respiration: interaction with soil properties, Biogeosciences, 9, 1173–1182, https://doi.org/10.5194/bg-9-1173-2012, 2012.
Müller, C., Stevens, R. J., Laughlin, R. J., and Jäger, H. J.: Microbial processes and the site of N2O production in a temperate grassland soil, Soil Biol. Biochem., 36, 453–461, https://doi.org/10.1016/j.soilbio.2003.08.027, 2004.
Müller, C. and Clough, T. J.: Advances in understanding nitrogen flows and transformations: gaps and research pathways, J. Agric. Sci., 152, S34–S44, https://doi.org/10.1017/s0021859613000610, 2014.
Nengsih, T. A., Bertrand, F., Maumy-Bertrand, M., and Meyer, N.: Determining the number of components in PLS regression on incomplete data set, Stat. Appl. Genet. Mol. Biol., 18, 28, https://doi.org/10.1515/sagmb-2018-0059, 2019.
Otsu, N.: A threshold selection method from gray-level histograms, Automatica, 11, 23–27, 1975.
Philippot, L., Hallin, S., and Schloter, M.: Ecology of denitrifying prokaryotes in agricultural soil, Adv. Agronomy, 96, 249–305, https://doi.org/10.1016/S0065-2113(07)96003-4, 2007.
Porre, R. J., van Groenigen, J. W., De Deyn, G. B., de Goede, R. G. M., and Lubbers, I. M.: Exploring the relationship between soil mesofauna, soil structure and N2O emissions, Soil Biol. Biochem., 96, 55–64, https://doi.org/10.1016/j.soilbio.2016.01.018, 2016.
R Core Team: R: A language and environment for statistical computing. R Foundation for Statistical Computing, Vienna, Austria, available at: https://www.R-project.org/ (last access: 27 November 2020), 2018.
Rabot, E., Lacoste, M., Henault, C., and Cousin, I.: Using X-ray computed tomography to describe the dynamics of nitrous oxide emissions during soil drying, Vadose Zone J., 14, 10, https://doi.org/10.2136/vzj2014.12.0177, 2015.
Regan, K., Kammann, C., Hartung, K., Lenhart, K., Müller, C., Philippot, L., Kandeler, E., and Marhan, S.: Can differences in microbial abundances help explain enhanced N2O emissions in a permanent grassland under elevated atmospheric CO2?, Glob. Change Biol., 17, 3176–3186, https://doi.org/10.1111/j.1365-2486.2011.02470.x, 2011.
Reichstein, M. and Beer, C.: Soil respiration across scales: The importance of a model-data integration framework for data interpretation, J. Plant Nutr. Soil Sci., 171, 344–354, https://doi.org/10.1002/jpln.200700075, 2008.
Resurreccion, A. C., Moldrup, P., Kawamoto, K., Hamamoto, S., Rolston, D. E., and Komatsu, T.: Hierarchical, bimodal model for gas diffusivity in aggregated, unsaturated soils, Soil Sc. Soc. Am. J., 74, 481–491, https://doi.org/10.2136/sssaj2009.0055, 2010.
Ryan, M. G. and Law, B. E.: Interpreting, measuring, and modeling soil respiration, Biogeochemistry, 73, 3–27, https://doi.org/10.1007/s10533-004-5167-7, 2005.
Scheer, C., Fuchs, K., Pelster, D. E., and Butterbach-Bahl, K.: Estimating global terrestrial denitrification from measured N2O : (N2O+N2) product ratios, Curr. Opin. Env. Sust., 47, 72–80, https://doi.org/10.1016/j.cosust.2020.07.005, 2020.
Schindelin, J., Arganda-Carreras, I., Frise, E., Kaynig, V., Longair, M., Pietzsch, T., Preibisch, S., Rueden, C., Saalfeld, S., and Schmid, B.: Fiji: an open-source platform for biological-image analysis, Nat. Methods, 9, 676–682, 2012.
Schlüter, S., Sheppard, A., Brown, K., and Wildenschild, D.: Image processing of multiphase images obtained via X-ray microtomography: A review, Water Resour. Res., 50, 3615–3639, https://doi.org/10.1002/2014wr015256, 2014.
Schlüter, S., Leuther, F., Vogler, S., and Vogel, H.-J.: X-ray microtomography analysis of soil structure deformation caused by centrifugation, Solid Earth, 7, 129–140, https://doi.org/10.5194/se-7-129-2016, 2016.
Schlüter, S., Zawallich, J., Vogel, H.-J., and Dörsch, P.: Physical constraints for respiration in microbial hotspots in soil and their importance for denitrification, Biogeosciences, 16, 3665–3678, https://doi.org/10.5194/bg-16-3665-2019, 2019.
Senbayram, M., Chen, R., Budai, A., Bakken, L., and Dittert, K.: N2O emission and the N2O/(N2O+N2) product ratio of denitrification as controlled by available carbon substrates and nitrate concentrations, Agr. Ecosys. Env., 147, 4–12, https://doi.org/10.1016/j.agee.2011.06.022, 2012.
Sexstone, A. J., Revsbech, N. P., Parkin, T. B., and Tiedje, J. M.: Direct measurement of oxygen profiles and denitrification rates in soil aggregates, Soil Sc. Soc. Am. J., 49, 645–651, 1985.
Shoun, H., Kim, D.-H., Uchiyama, H., and Sugiyama, J.: Denitrification by fungi, FEMS Microbiol. Lett., 94, 277–281, 1992.
Smith, K. A., Ball, T., Conen, F., Dobbie, K. E., Massheder, J., and Rey, A.: Exchange of greenhouse gases between soil and atmosphere: interactions of soil physical factors and biological processes, Eur. J. Soil Sci., 54, 779–791, https://doi.org/10.1046/j.1351-0754.2003.0567.x, 2003.
Spott, O., Russow, R., Apelt, B., and Stange, C. F.: A 15N-aided artificial atmosphere gas flow technique for online determination of soil N2 release using the zeolite Köstrolith SX6®, Rapid Commun. Mass Sp., 20, 3267–3274, https://doi.org/10.1002/rcm.2722, 2006.
Surey, R., Lippold, E., Heilek, S., Sauheitl, L., Henjes, S., Horn, M. A., Mueller, C. W., Merbach, I., Kaiser, K., Böttcher, J., and Mikutta, R.: Differences in labile soil organic matter explain potential denitrification and denitrifying communities in a long-term fertilization experiment, Appl. Soil. Ecol., 153, 103630, https://doi.org/10.1016/j.apsoil.2020.103630, 2020.
Syakila, A. and Kroeze, C.: The global nitrous oxide budget revisited, Greenhouse Gas Measurement and Management, 1, 17–26, https://doi.org/10.3763/ghgmm.2010.0007, 2011.
Thompson, R. L., Lassaletta, L., Patra, P. K., Wilson, C., Wells, K. C., Gressent, A., Koffi, E. N., Chipperfield, M. P., Winiwarter, W., Davidson, E. A., Tian, H., and Canadell, J. G.: Acceleration of global N2O emissions seen from two decades of atmospheric inversion, Nat. Clim. Change, 9, 993–998, https://doi.org/10.1038/s41558-019-0613-7, 2019.
Tian, H., Xu, R., Canadell, J. G., Thompson, R. L., Winiwarter, W., Suntharalingam, P., Davidson, E. A., Ciais, P., Jackson, R. B., Janssens-Maenhout, G., Prather, M. J., Regnier, P., Pan, N., Pan, S., Peters, G. P., Shi, H., Tubiello, F. N., Zaehle, S., Zhou, F., Arneth, A., Battaglia, G., Berthet, S., Bopp, L., Bouwman, A. F., Buitenhuis, E. T., Chang, J., Chipperfield, M. P., Dangal, S. R. S., Dlugokencky, E., Elkins, J. W., Eyre, B. D., Fu, B., Hall, B., Ito, A., Joos, F., Krummel, P. B., Landolfi, A., Laruelle, G. G., Lauerwald, R., Li, W., Lienert, S., Maavara, T., MacLeod, M., Millet, D. B., Olin, S., Patra, P. K., Prinn, R. G., Raymond, P. A., Ruiz, D. J., van der Werf, G. R., Vuichard, N., Wang, J., Weiss, R. F., Wells, K. C., Wilson, C., Yang, J., and Yao, Y.: A comprehensive quantification of global nitrous oxide sources and sinks, Nature, 586, 248–256, https://doi.org/10.1038/s41586-020-2780-0, 2020.
Tiedje, J. M.: Ecology of denitrification and dissimilatory nitrate reduction to ammonium, in: Environmental Microbiology of Anaerobes, edited by: Zehnder, A. J. B., John Wiley and Sons, N.Y., 179–244, 1988.
Ussiri, D. and Lal, R.: Soil emission of nitrous oxide and its mitigation, Springer, the Netherlands, 2013.
van Cleemput, O.: Subsoils: chemo- and biological denitrification, N2O and N2 emissions, Nutr. Cycl. Agroecosys., 52, 187–194, https://doi.org/10.1023/a:1009728125678, 1998.
Wickham, H.: ggplot2: Elegant Graphics for Data Analysis, Springer-Verlag New York, 2016.
Wiegmann, A. and Bube, K. P.: The explicit-jump immersed interface method: Finite difference methods for PDEs with piecewise smooth solutions, SIAM J. Num. Anal., 37, 827–862, https://doi.org/10.1137/S0036142997328664, 2000.
Wiegmann, A. and Zemitis, A.: EJ-HEAT: A fast explicit jump harmonic averaging solver for the effective heat conductivity of composite materials, Berichte des Fraunhofer ITWM, Technical report 94, 1–21, 2006.
Wolodzko, T.: Kernelboot: Smoothed bootstrap and random generation from kernel densities, available at: https://CRAN.R-project.org/package=kernelboot, last access: 7 November 2020.
Zumft, W. G.: Cell biology and molecular basis of denitrification, Microbiol. Mol. Biol. Rev., 61, 533–616, 1997.