the Creative Commons Attribution 4.0 License.
the Creative Commons Attribution 4.0 License.
 | 14 Jan 2021
Fire and vegetation dynamics in northwest Siberia during the last 60 years based on high-resolution remote sensing
Oleg Sizov
Ekaterina Ezhova
Petr Tsymbarovich
Andrey Soromotin
Nikolay Prihod'ko
Tuukka Petäjä
Sergej Zilitinkevich
Markku Kulmala
Jaana Bäck
Kajar Köster
The rapidly warming Arctic undergoes transitions that can influence global carbon balance. One of the key processes is the shift towards vegetation types with higher biomass underlining a stronger carbon sink. The shift is predicted by bioclimatic models based on abiotic climatic factors, but it is not always confirmed with observations. Recent studies highlight the role of disturbances in the shift. Here we use high-resolution remote sensing to study the process of transition from tundra to forest and its connection to wildfires in the 20 000 km2 area in northwest Siberia. Overall, 40 % of the study area was burned during a 60-year period. Three-quarters of the burned areas were dry tundra. About 10 % of the study area experienced two–three fires with an interval of 15–60 years suggesting a shorter fire return interval than that reported earlier for the northern areas of central Siberia (130–350 years). Based on our results, the shift in vegetation (within the 60-year period) occurred in 40 %–85 % of the burned territories. All fire-affected territories were flat; therefore no effect of topography was detected. Oppositely, in the undisturbed areas, a transition of vegetation was observed only in 6 %–15 % of the territories, characterized by steeper topographic slopes. Our results suggest a strong role of disturbances in the tree advance in northwest Siberia.
- Article
(27741 KB) - Full-text XML
-
Supplement
(1381 KB) - BibTeX
- EndNote


Northwest Siberia is a region subject to a strong warming trend in summer as compared to the Arctic average. The annual warming trend reported for the entire Arctic (1971–2017) is 0.6 ∘C per decade, resulting from the cold season trend of 0.7 ∘C per decade and the warm season (June–September) trend of 0.4 ∘C per decade (Box et al., 2019). According to the second assessment report on climate change in the Russian territory (Katsov et al., 2014), the winter warming trend in northwest Siberia (1972–2012) is 0.4–0.7 ∘C per decade, which is comparable to the trends reported for the entire Arctic. However, the summer trend is 0.8–1.0 ∘C per decade, double that reported for the entire Arctic. At the same time, meteorological observations indicate that snow cover thickness has increased at a rate of 2–10 cm per decade but the number of snow cover days decreased at a rate of up to 8 d per decade (Katsov et al., 2014). An increase in warm degree days favors a shift in vegetation type towards more southern species, i.e., transformation of tundra environment into shrubs and forest vegetation. Shrubs and trees decrease surface albedo and have a warming effect, especially in winter, but the higher amount of biomass will increase the terrestrial carbon sink. Forest ecosystems can additionally enhance carbon uptake via complex atmosphere–biosphere feedback mechanisms (Kulmala et al., 2013, 2020; Kalliokoski et al., 2019).
Shrubification of tundra has been reported in many recent studies (Myers-Smith and Hik, 2018; Maliniemi et al., 2018; Bjorkman et al., 2020), and it has been associated with Arctic greening (Myers-Smith et al., 2020). However, there is no general agreement regarding tree propagation. Modeling studies predict treeline advance to the north based on abiotic factors (Tchebakova et al., 2010; Kaplan and New, 2006; Aakala et al., 2014). Nevertheless, this advance has been only partially confirmed by observations (Harsch and Bader, 2011) and the observed rates are extremely low as compared to the theoretical predictions (Van Bogaert et al., 2011). On the contrary, a study based on the forest inventories from the eastern United States shows that forested areas shrink rather than expand on most plots at their range limits (Zhu et al., 2012). These discrepancies suggest that there exist other factors than climatic ones influencing the transition. First, Frost and Epstein (2014) found it to be dependent on another abiotic factor: the topographic slope. Different topographic slopes result in different insolation, moisture regimes and permafrost states. Second, it was hypothesized that biotic factors interact with abiotic climatic factors (Woodward et al., 2004). Availability of seeds, germination success and presence of dominant species competing with newly establishing plants can all influence propagation of the treeline. A recent study suggests that the shift of biomes occurs episodically and requires a disturbance (Renwick and Rocca, 2015). In northern latitudes (boreal, subarctic and arctic areas), wildfires and grazing by reindeer are the two main disturbances that influence vegetation structure and dynamics (Köster et al., 2013; Narita et al., 2015), which in turn induce shifts in ecosystem processes, e.g., nutrient cycles and ecological interactions.
The reindeer regulate the abundance of species and community composition via grazing. Both observations and field experiments in tundra show different responses to warming with and without large herbivores (Post and Pedersen, 2008; Olofsson et al., 2009), manifested by an enhanced growth of deciduous shrubs on sites not affected by grazing. However, evergreen shrubs and trees demonstrate an opposite trend towards an increased growth on sites exposed to grazing (Bernes et al., 2015). The effect of wildfires on the vegetation shift in tundra is less studied. Fire has been found to reduce the cover of lichens and bryophytes (Joly et al., 2009) but enhance the growth of grasses and shrubs (Barrett et al., 2012; Narita et al., 2015). Landhausser and Wein (1993) observed that forests in Canada's Northwest Territories advance in the forest–tundra ecotone after a strong wildfire. Long before that, Sannikov (1970) noted that seedlings' survival is highest on bare mineral soils and that high-intensity and high-severity wildfires, which remove the organic material and expose mineral soil, can favor tree survival.
Here we study the shift in vegetation based on high-resolution remote sensing data, in areas including southern tundra, the forest–tundra ecotone and northern taiga in the Nadym–Pur district of northwest Siberia. In contrast to the northerly located Yamal and Gydan peninsulas and westerly located Priuralsky District, these areas have not yet suffered from reindeer pasture overuse (Matveev and Musaev, 2013). Therefore, grazing could be of secondary importance for the ecosystem changes in these areas. We hypothesize, based on the study of Landhausser and Wein (1993), that forest expansion occurs mainly in the areas affected by relatively recent wildfires, while other areas (non-disturbed areas) demonstrate only a minor change in vegetation. Thus, we focus on the effect of wildfires on the vegetation, specifically on tundra–forest and tundra–woodlands transition. The main objectives of this study are
- a.
to assess the dynamics of regional climatic factors and the possibility of vegetation shifts due to climate change, in particular tundra–forest transition;
- b.
to quantify burned surface areas and calculate frequency of wildfires;
- c.
to study the link between wildfires and dry tundra transition to woodlands and forest.
Finally, we take into account physiographic characteristics of the landscape and study the link between the transition and the topographic slope.
(Ilyina et al., 1985)Table 1Description of the study areas. Classification of the study areas according to vegetation types.
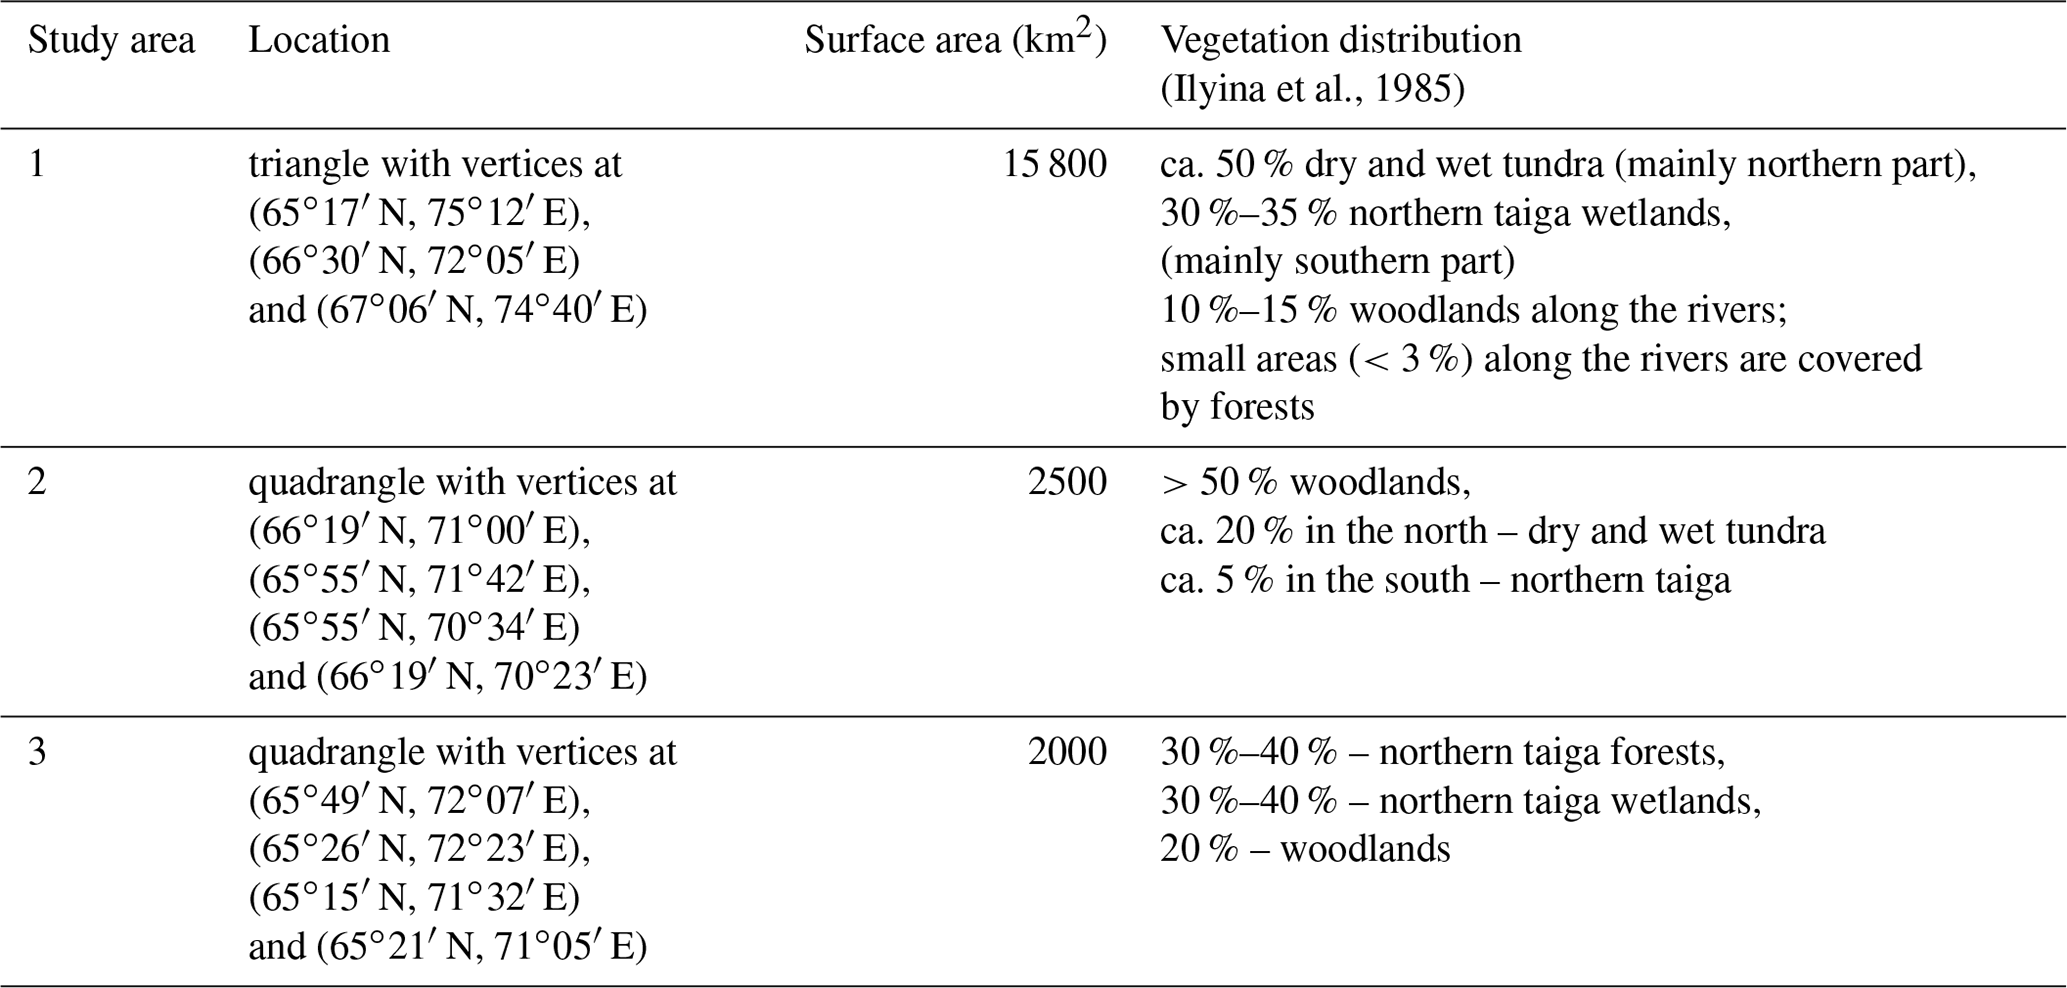
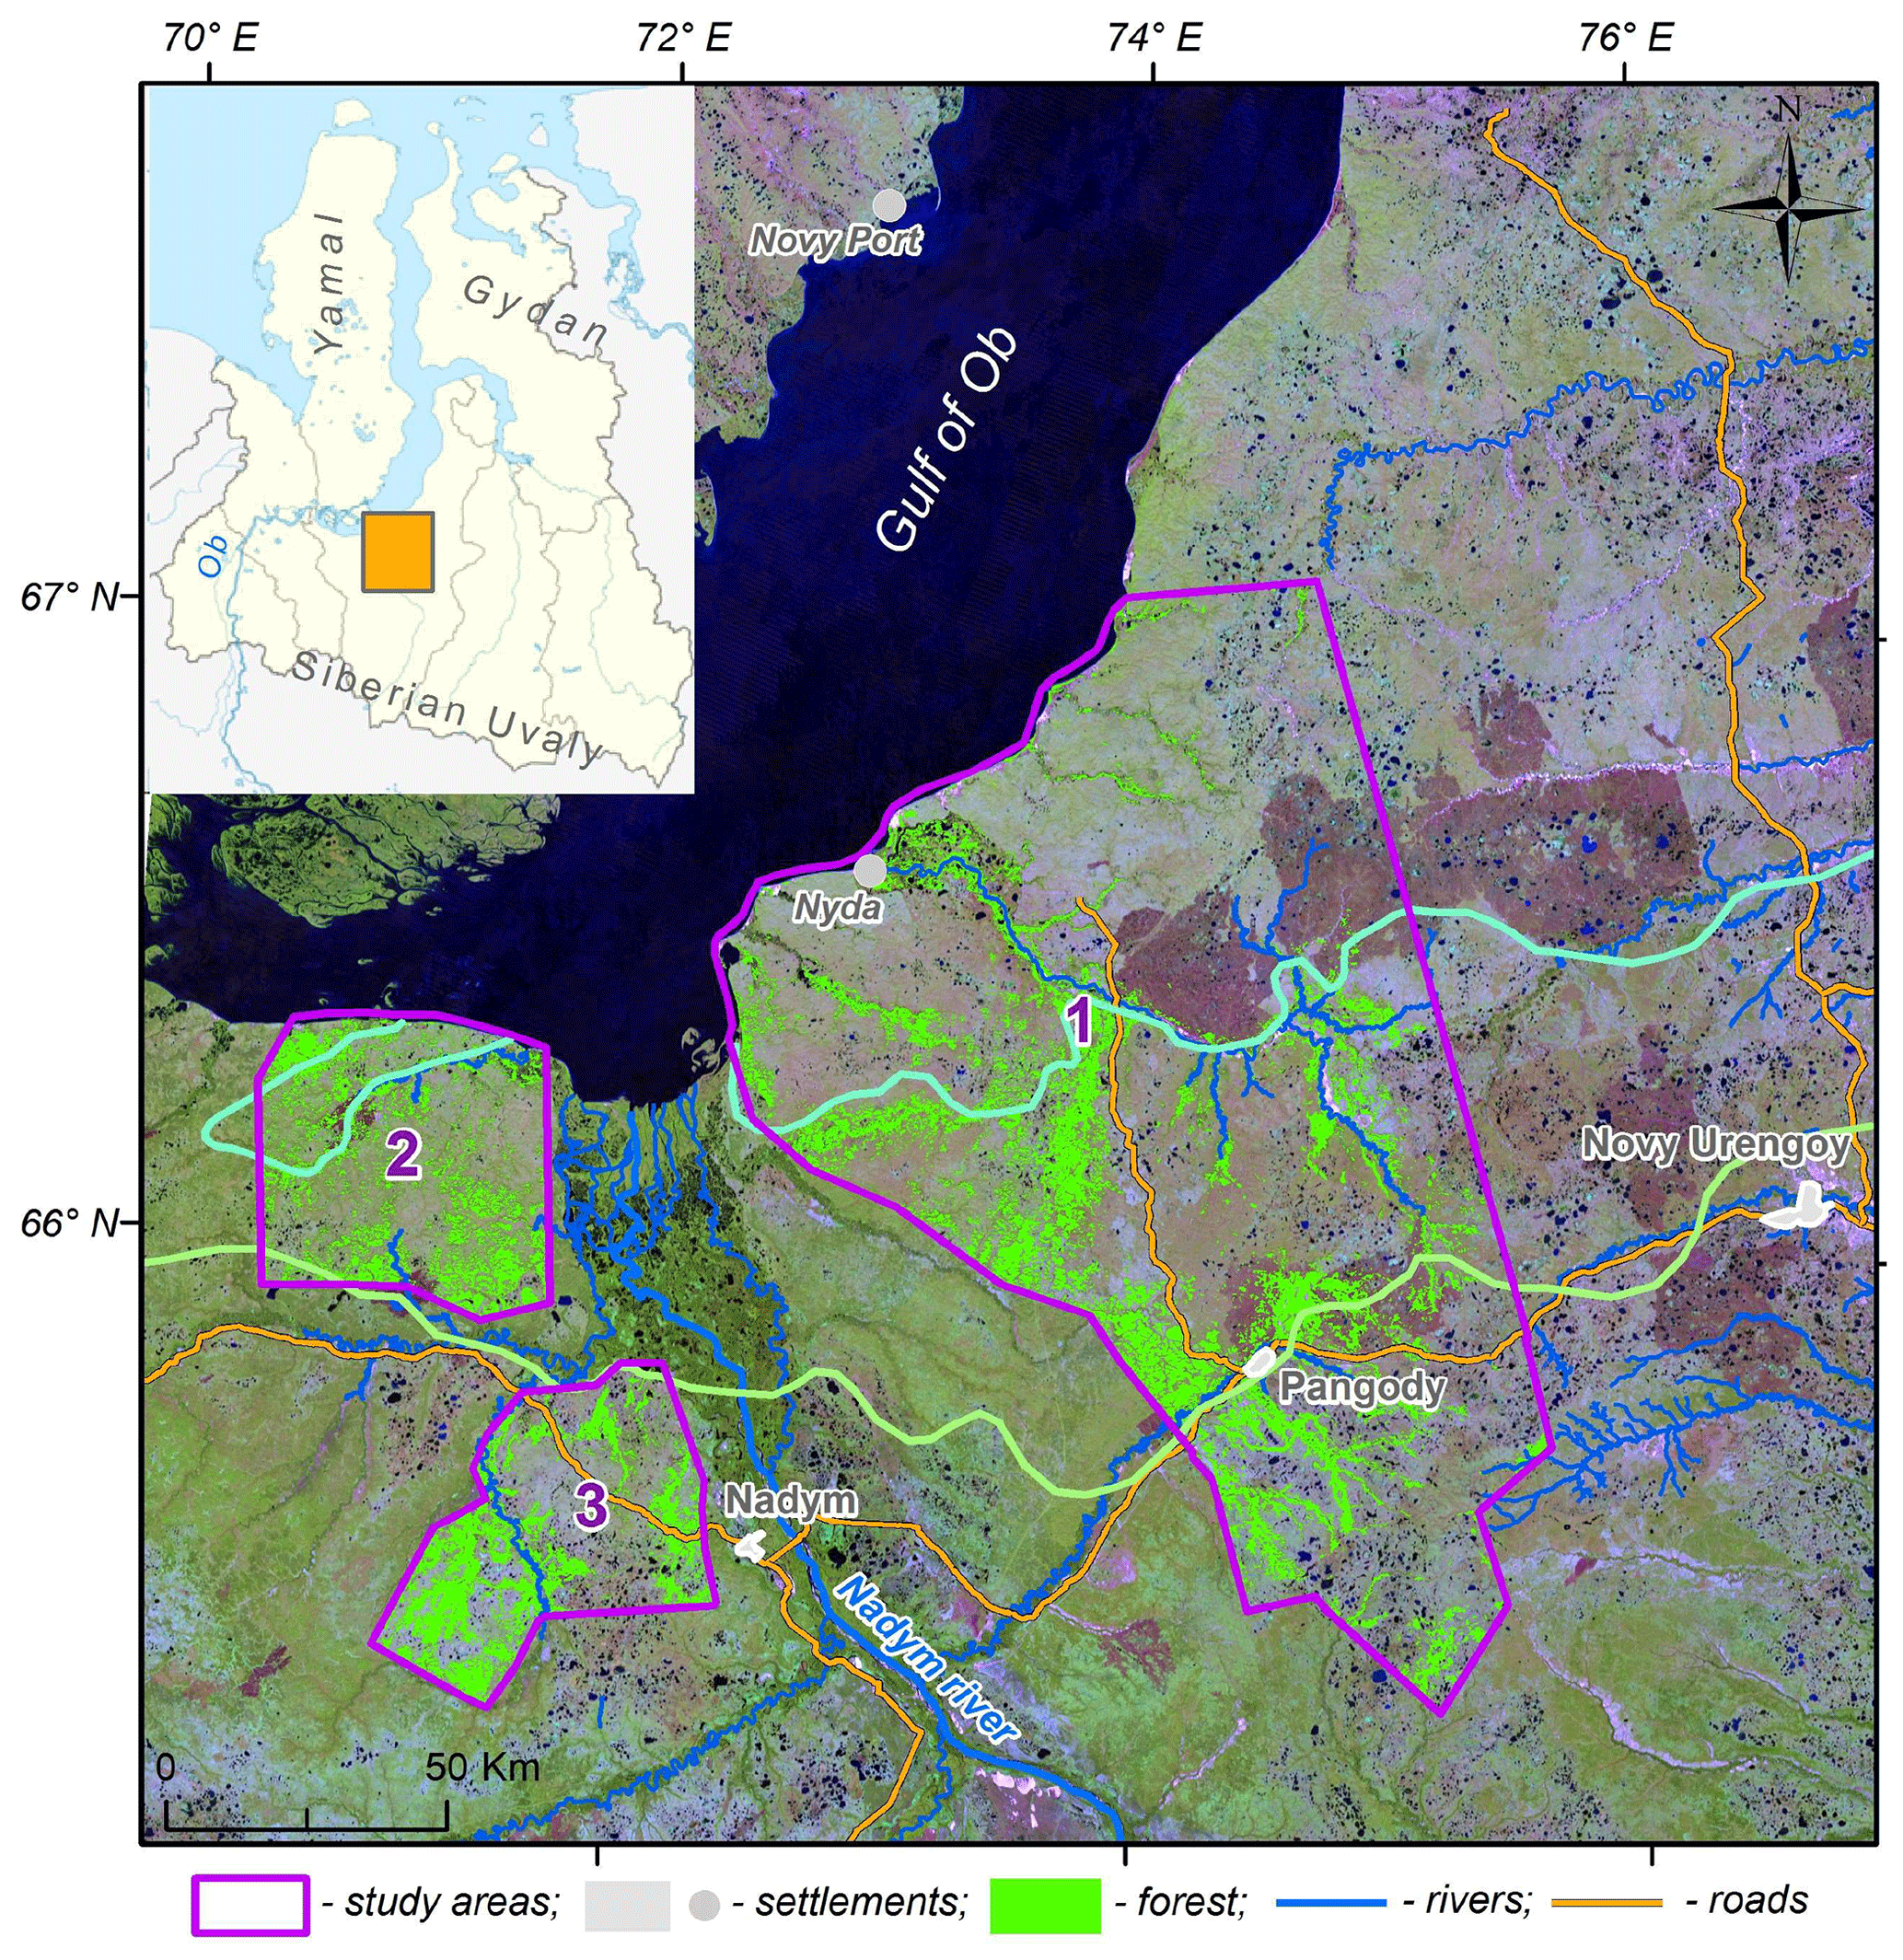
Figure 1Study areas 1, 2 and 3 are shown in the Landsat 8 mosaic (2018). Green areas display the forest mask obtained from the topographic map (Ilyina et al., 1985). Cyan curve is the boundary between southern tundra and tundra–forest ecotone; light green curve is the boundary between forest–tundra ecotone and northern taiga (Ilyina et al., 1985). Inset: orange rectangular region marks the location of the study sites on the map of Yamalo-Nenets Autonomous Okrug.
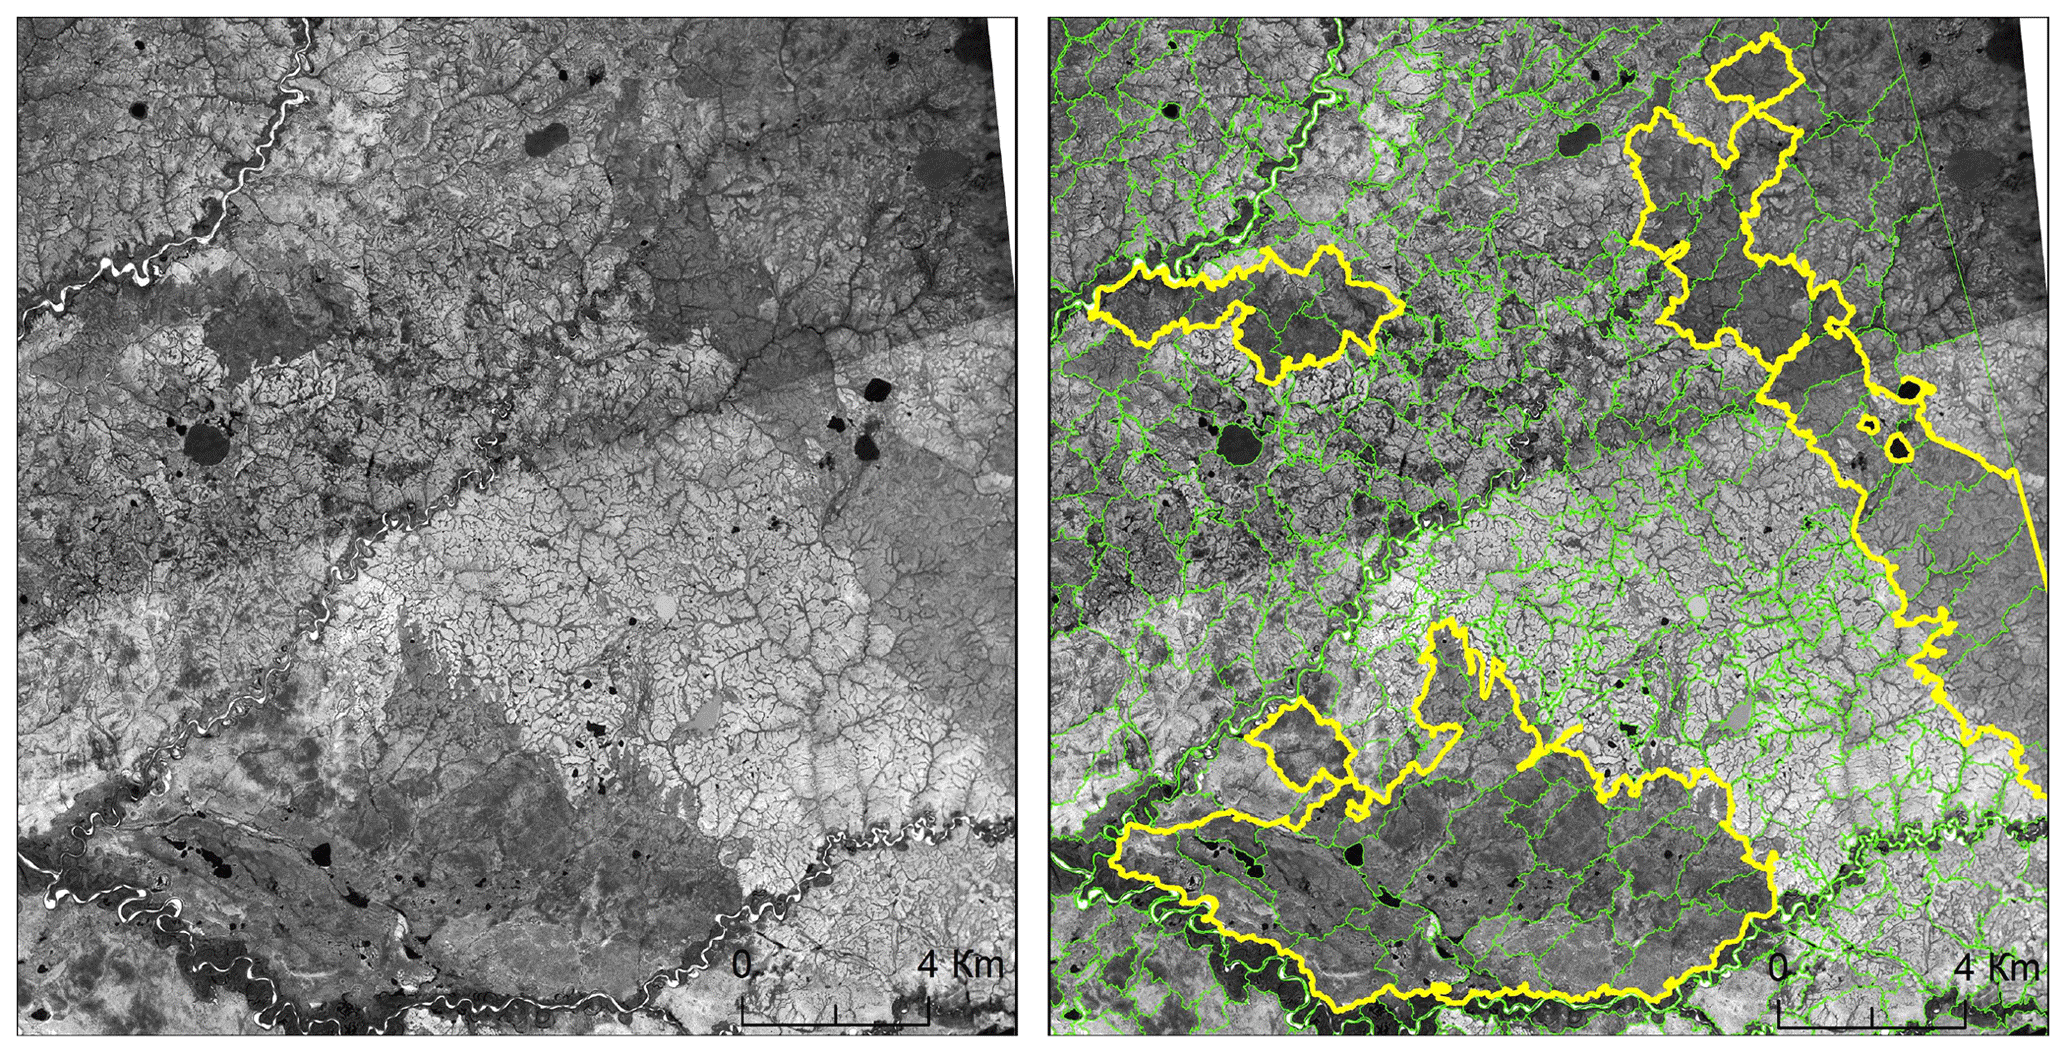
Figure 2An example of segmentation and classification of burned areas in Corona mosaic. Left panel: original mosaic. Right panel: mosaic after segmentation and classification. Green curves – boundaries of segments, yellow curves – boundaries of identified burned areas.
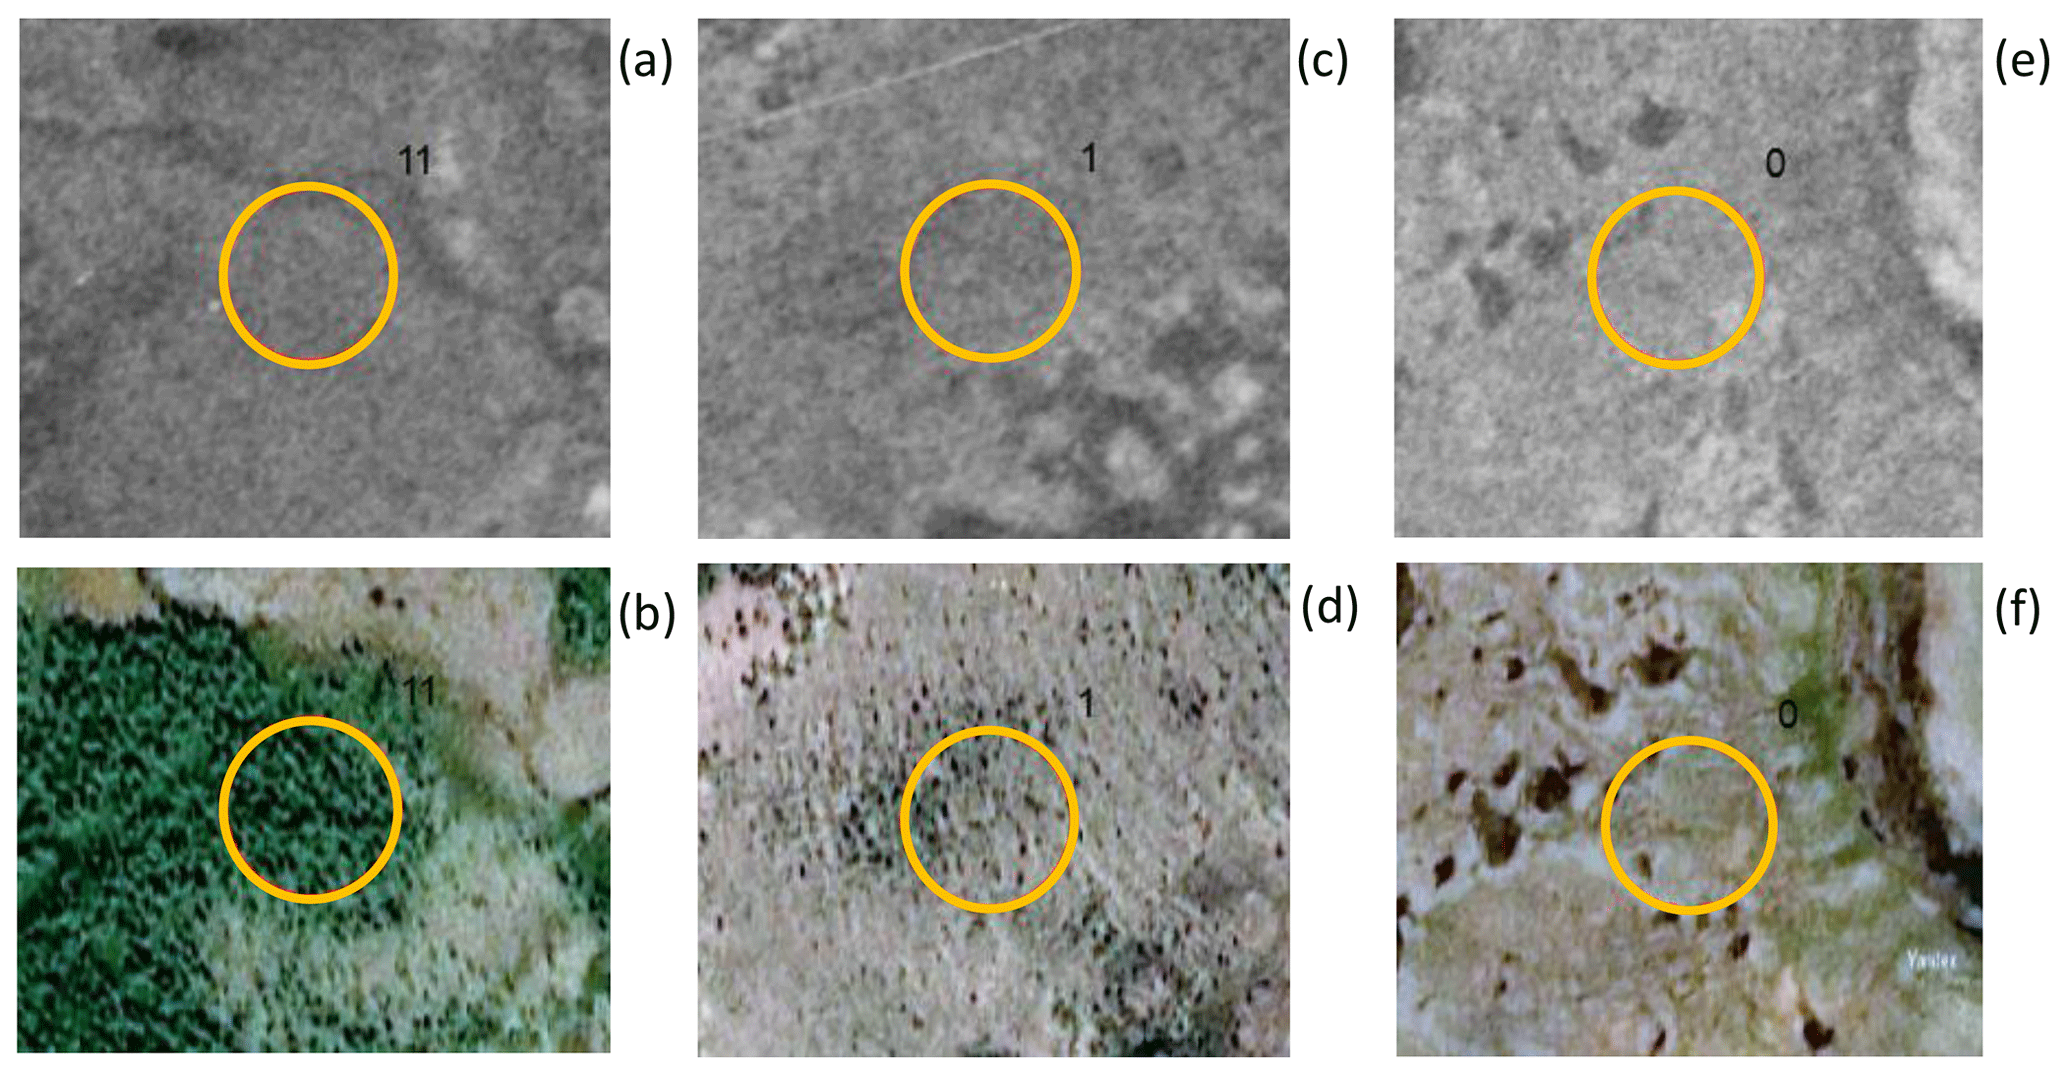
Figure 3Examples of samples used for the visual analysis of vegetation dynamics. Diameter of each sample is 100 m. The images are taken from Corona and SPOT-6 and SPOT-7 mosaic (©Yandex.Maps). (a, b) shift to forest, (c, d) shift to woodlands, (e, f) no shift.
Table 2Classification of vegetation classes based on growing degree days (GDD5) and dryness index (DI) (Tchebakova et al., 1994).
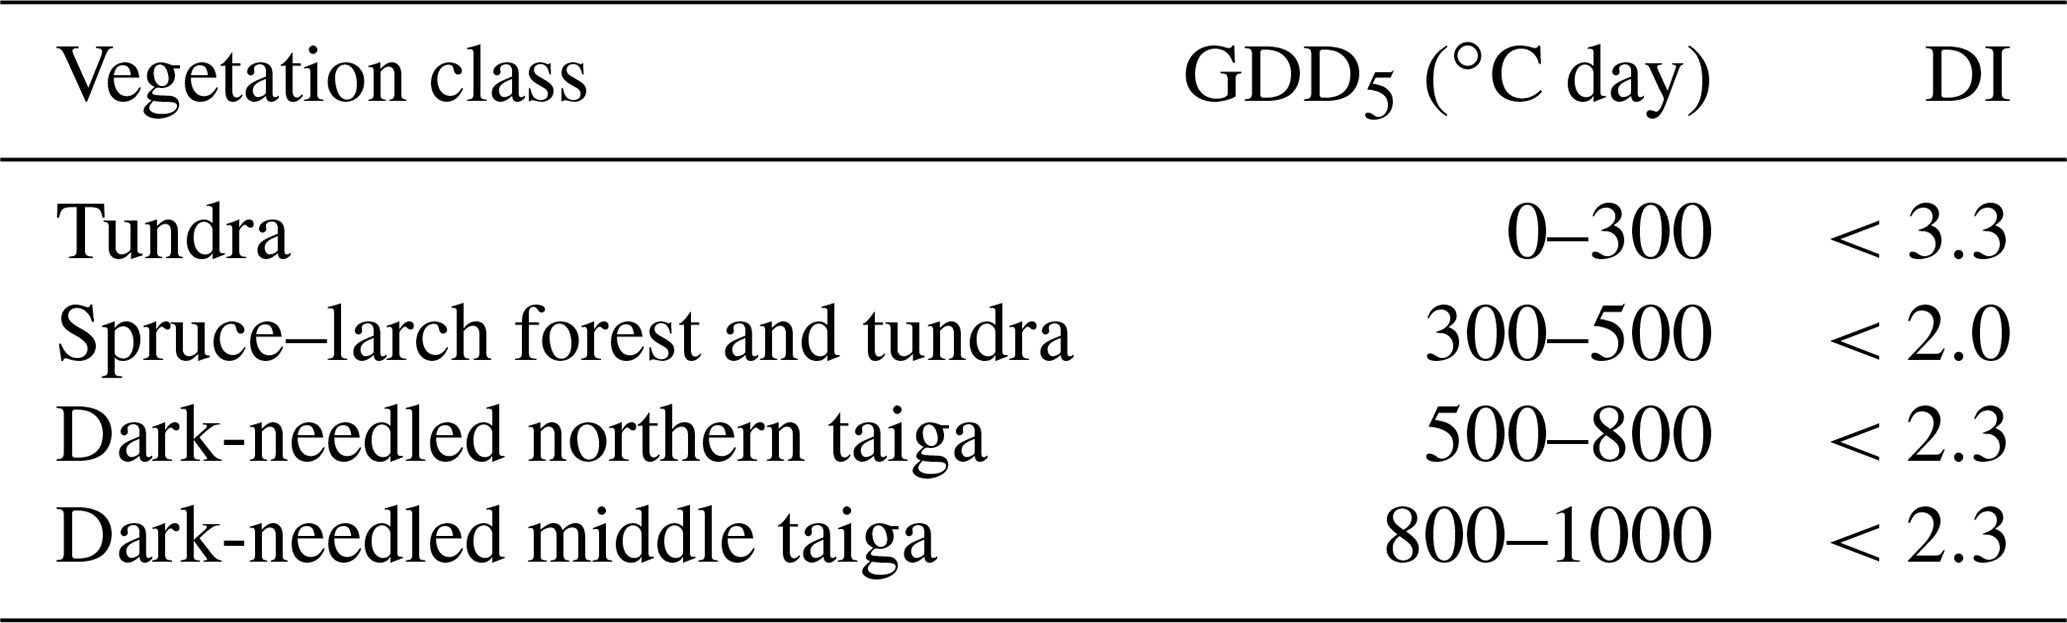
Table 3Data sets used for fire analysis.
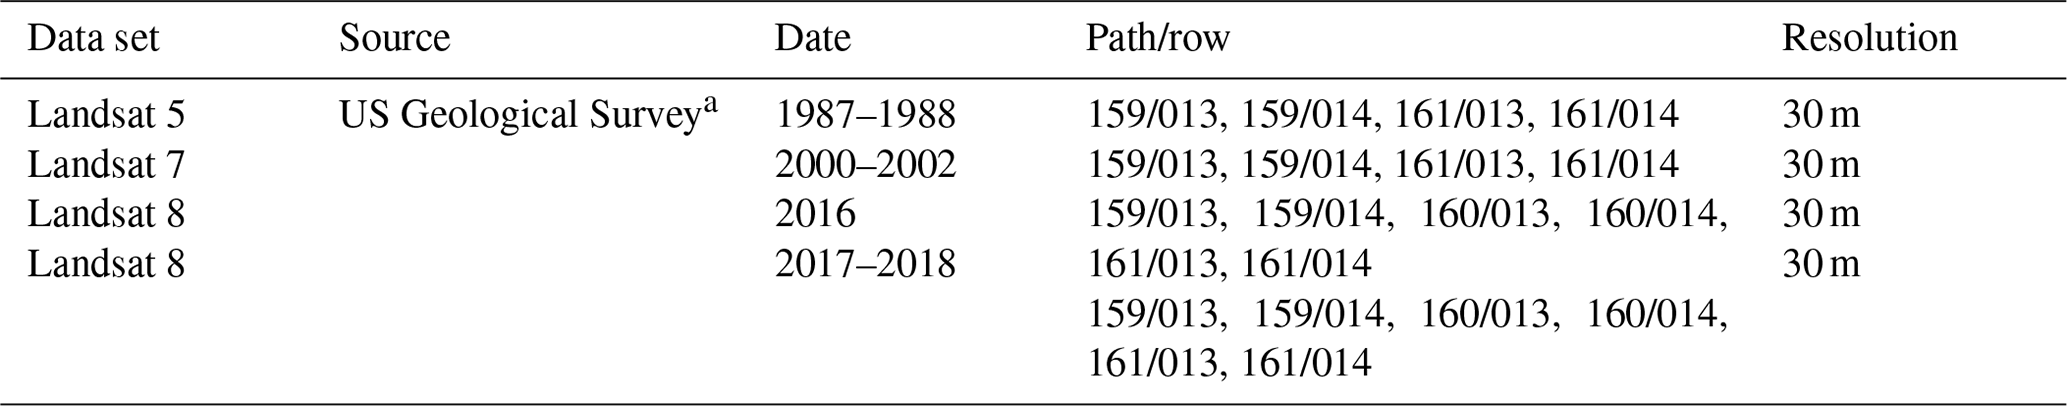
a https://earthexplorer.usgs.gov, last access: 2 August 2020.
Table 4Relations between Landsat mosaic years and the years of major fires.
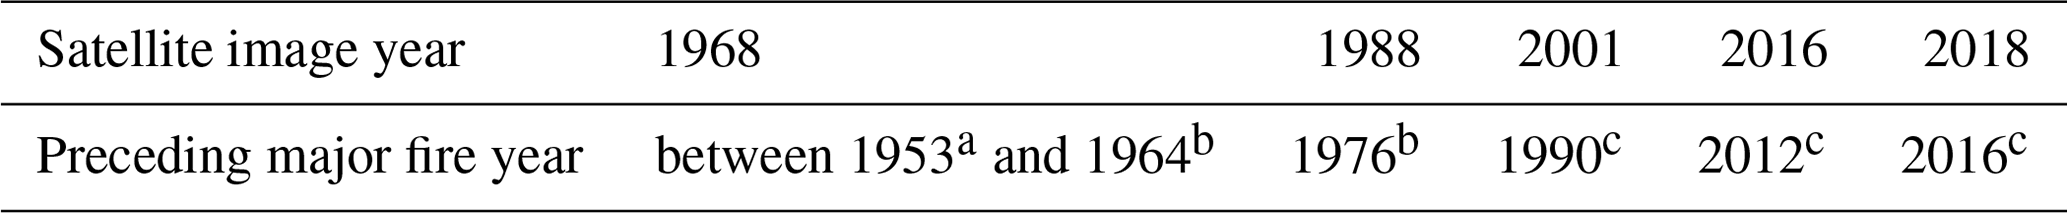
a Chekunova (1954).
b Corona images, https://earthexplorer.usgs.gov, last access: 19 April 2019.
c Landsat images, https://earthexplorer.usgs.gov, last access: 2 August 2020.
Table 5Data sets used for the analysis of vegetation dynamics.
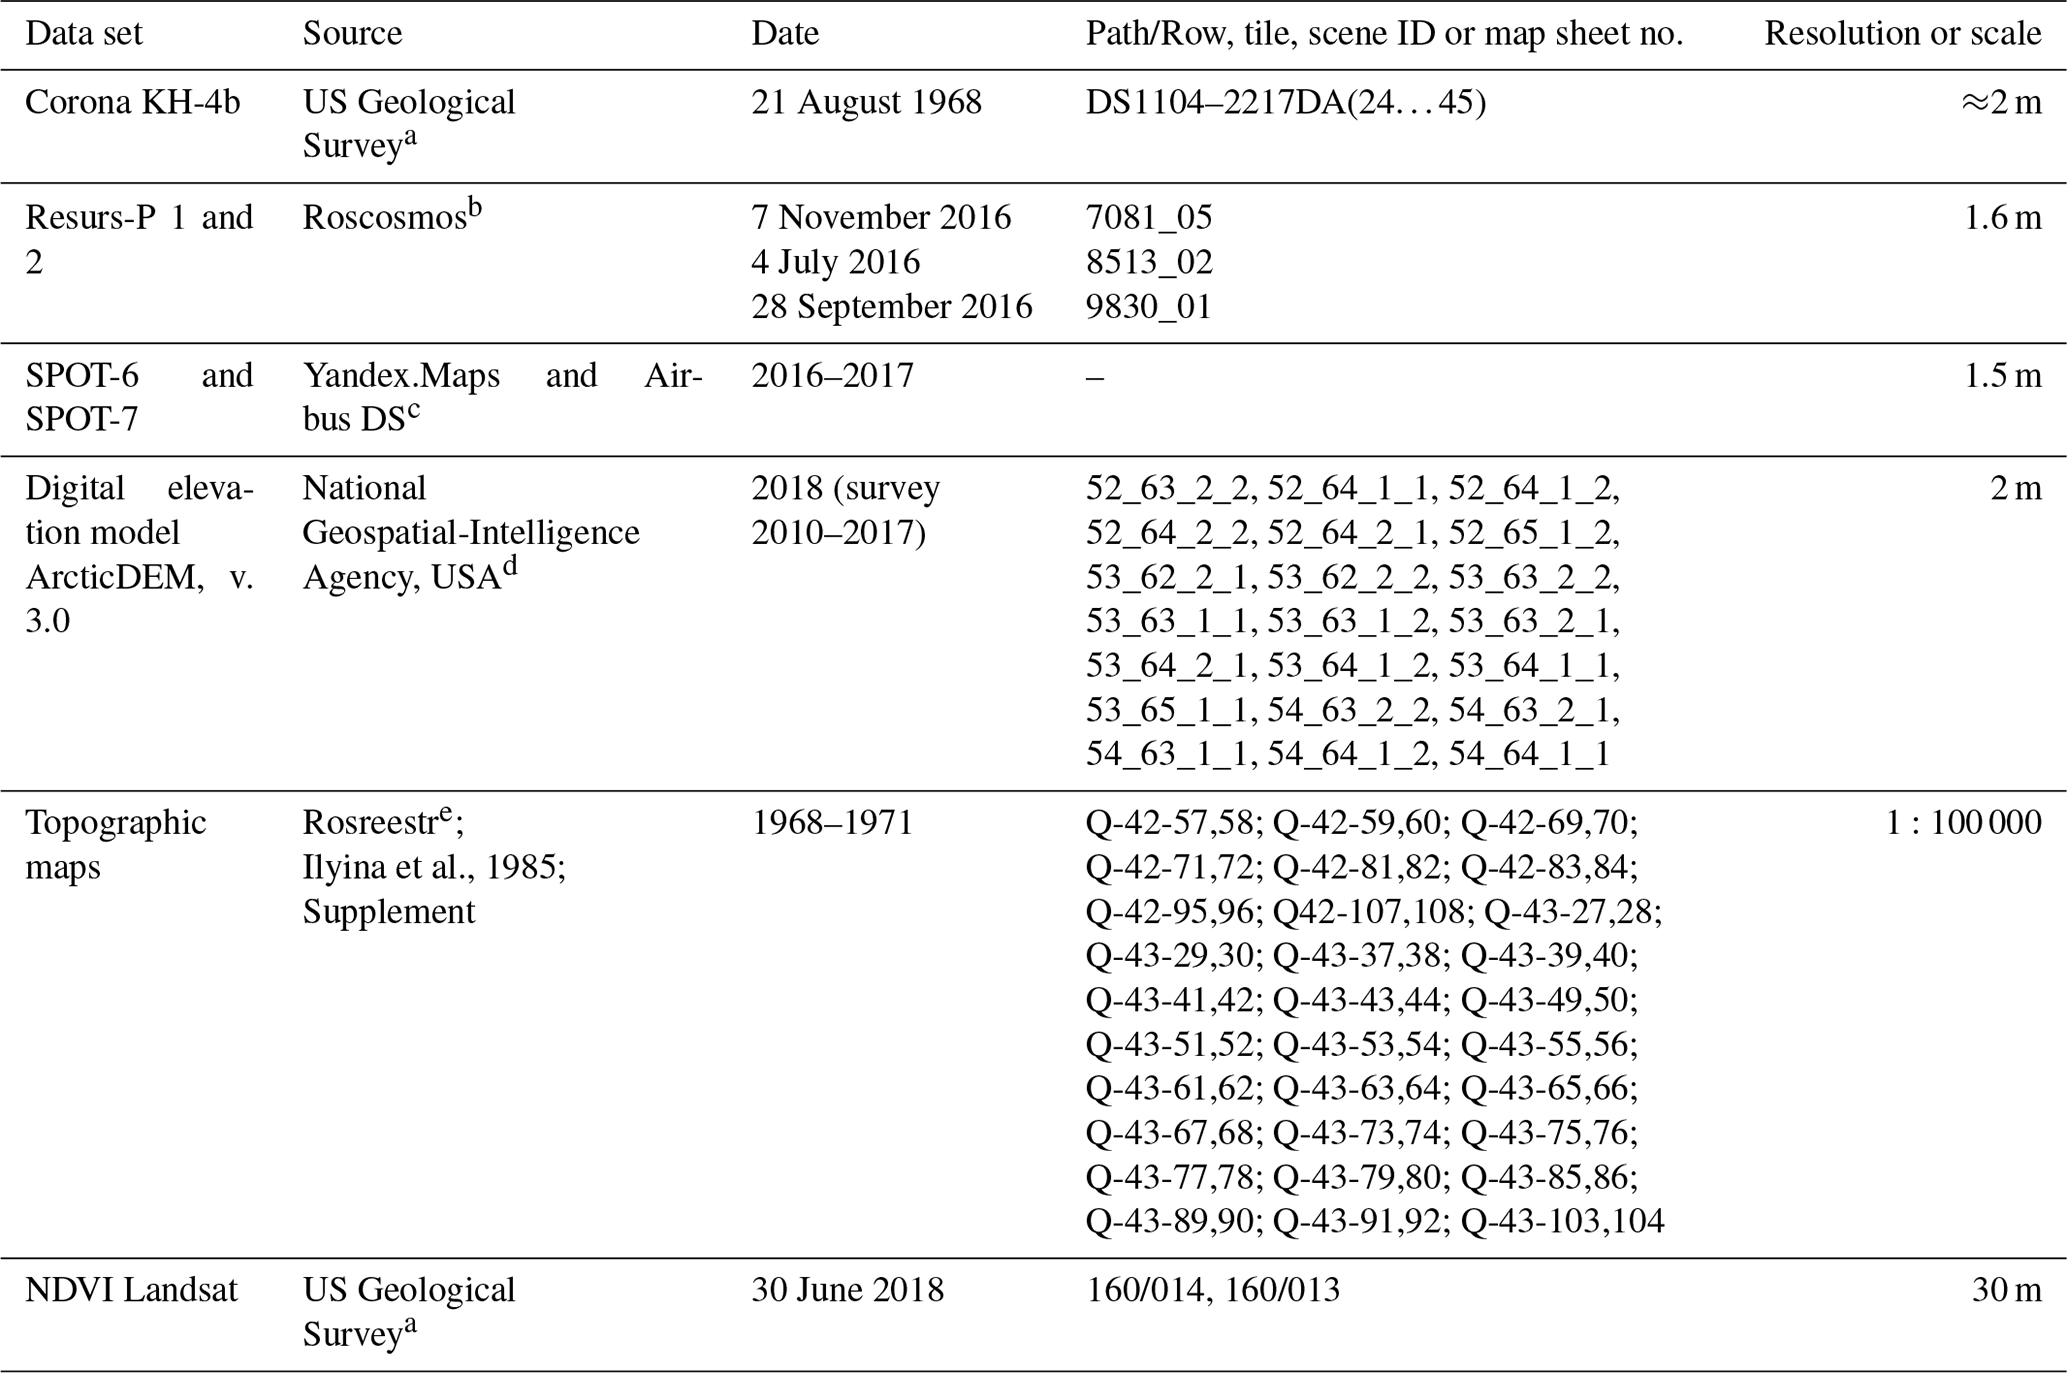
a https://earthexplorer.usgs.gov, last access: 19 April 2019.
b https://gptl.ru, last access: 2 June 2019.
c https://yandex.ru/maps, last access: 9 May 2020.
d https://arctic-nga.opendata.arcgis.com, last access: 25 January 2020.
e https://www.marshruty.ru/Maps/Maps.aspx, last access: 10 January 2020.
Table 6Change in vegetation class at meteorological stations in accordance with Table 2 (after Tchebakova et al., 1994).

a Vegetation classes defined according to the topographic maps (Ilyina et al., 1985) are added for comparison.
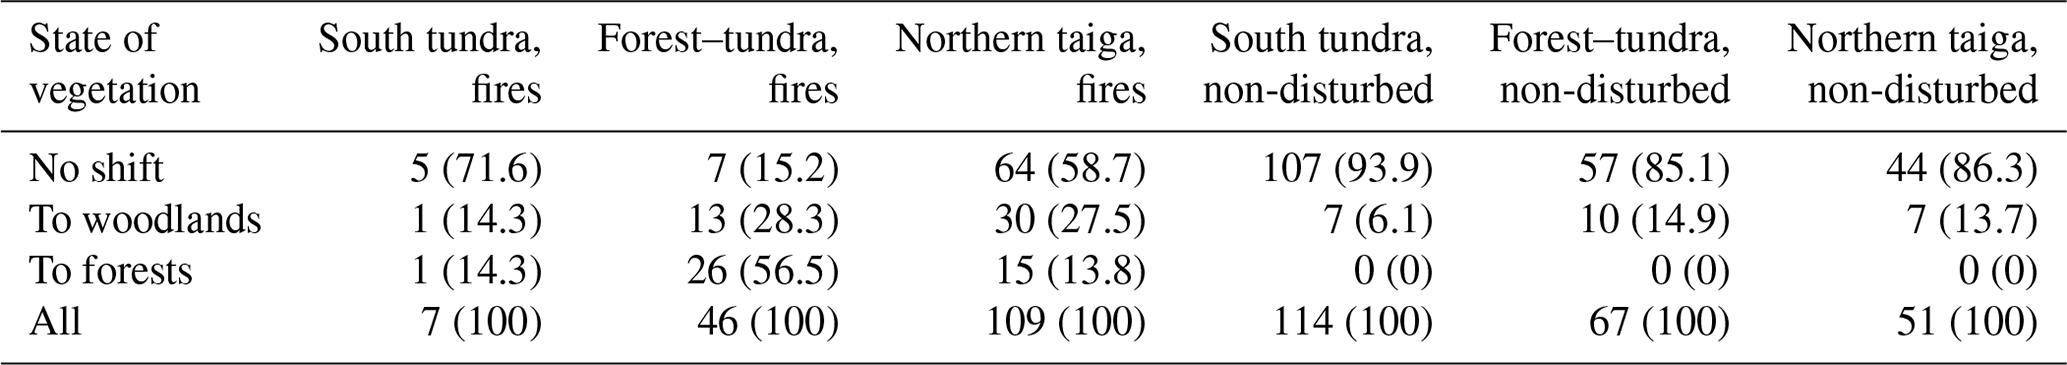
Table 7Number of checkpoints (percentage of all checkpoints within a vegetation class, %) corresponding to vegetation shift in fire-affected and non-disturbed dry tundra.
2.1 Field sites
In order to study tundra–forest transition, we selected the monitoring sites satisfying two predefined criteria:
- a.
The sites are covered by historical high-resolution satellite imagery – Corona archive (Ruffner, 1995).
- b.
The sites have forest cover of less than 10 % according to the Landsat forest mask (Hansen et al., 2013).
Based on these criteria, we identified three main study areas (Table 1, Fig. 1). Area 1 (the largest area) is located on the east coast of the river Nadym; area 2 is between the south coast of the Gulf of Ob and the river Yarudey, and area 3 is to the west of the city of Nadym (Fig. 1). Detailed maps of the study sites can be found on the geoportal “Nadym. Changes in 50 years (1968–2018) (NC50)” (https://ageoportal.ipos-tmn.ru/nadym/, last access: 3 May 2020). A description of the geoportal is given in Appendix A.
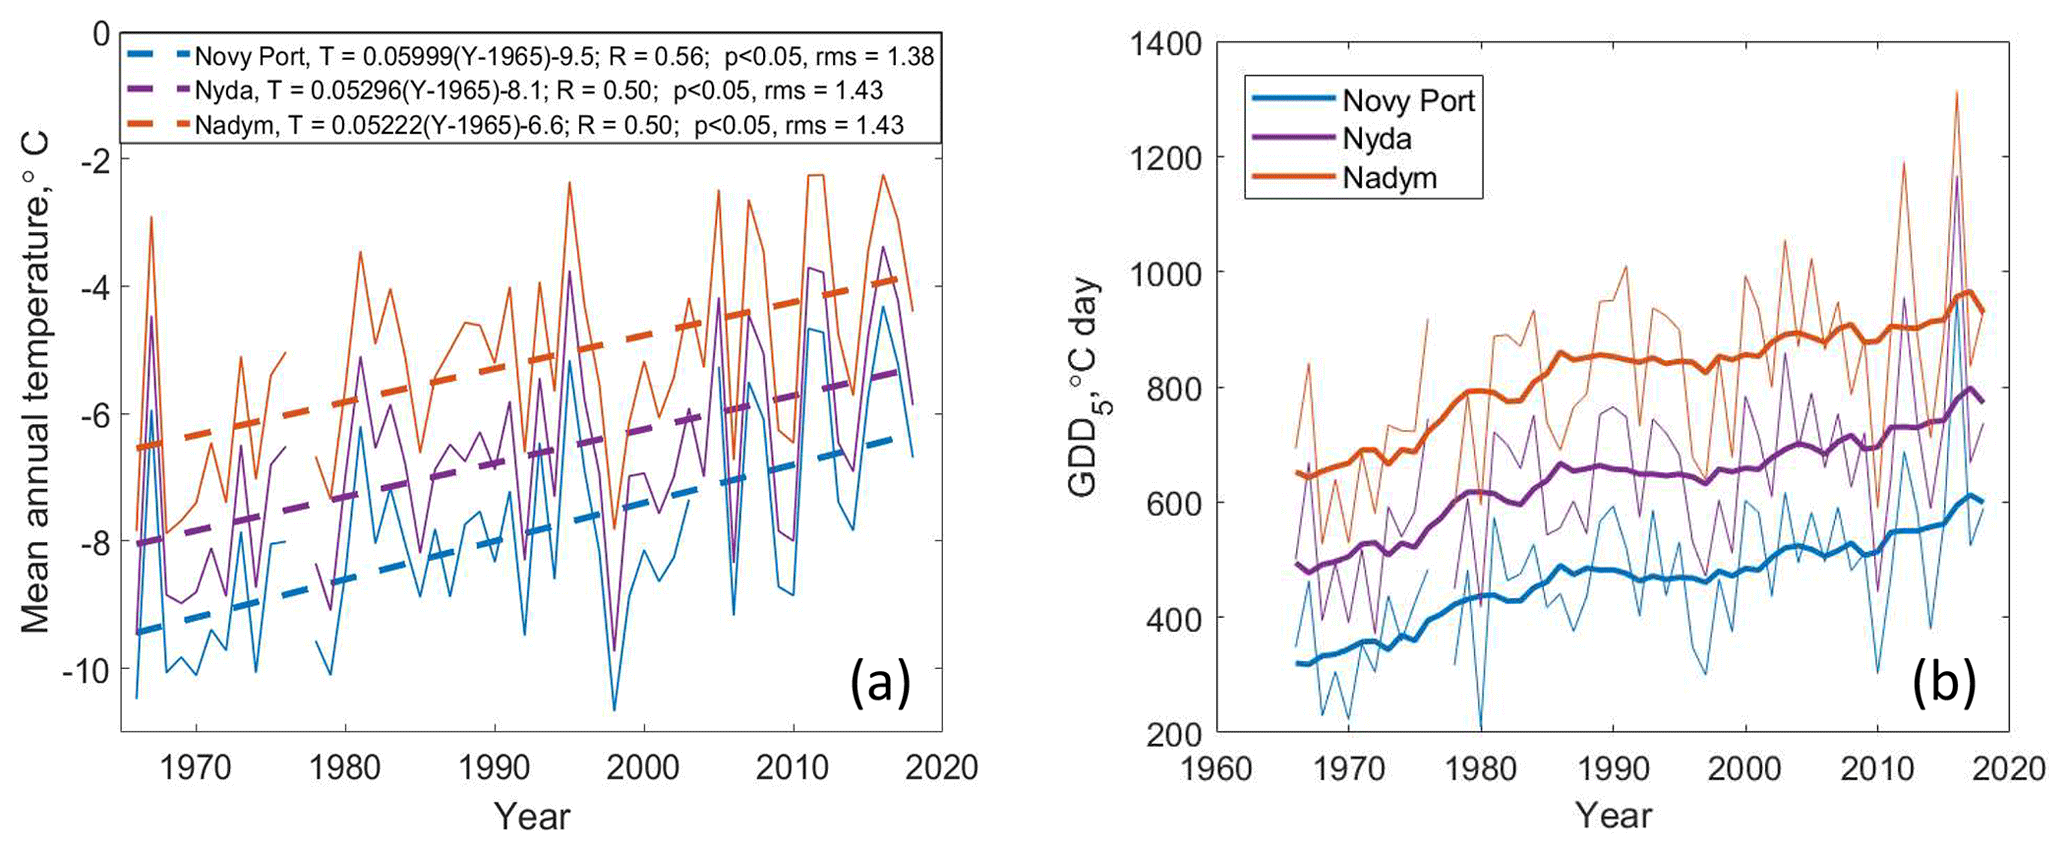
Figure 4(a) Time series of mean annual temperature (solid) and corresponding linear fits (dashed). In the legend, T is the mean annual temperature and Y is the year. (b) Time series of growing degree days (thin solid curves) and 10-year running average (thick solid curves).
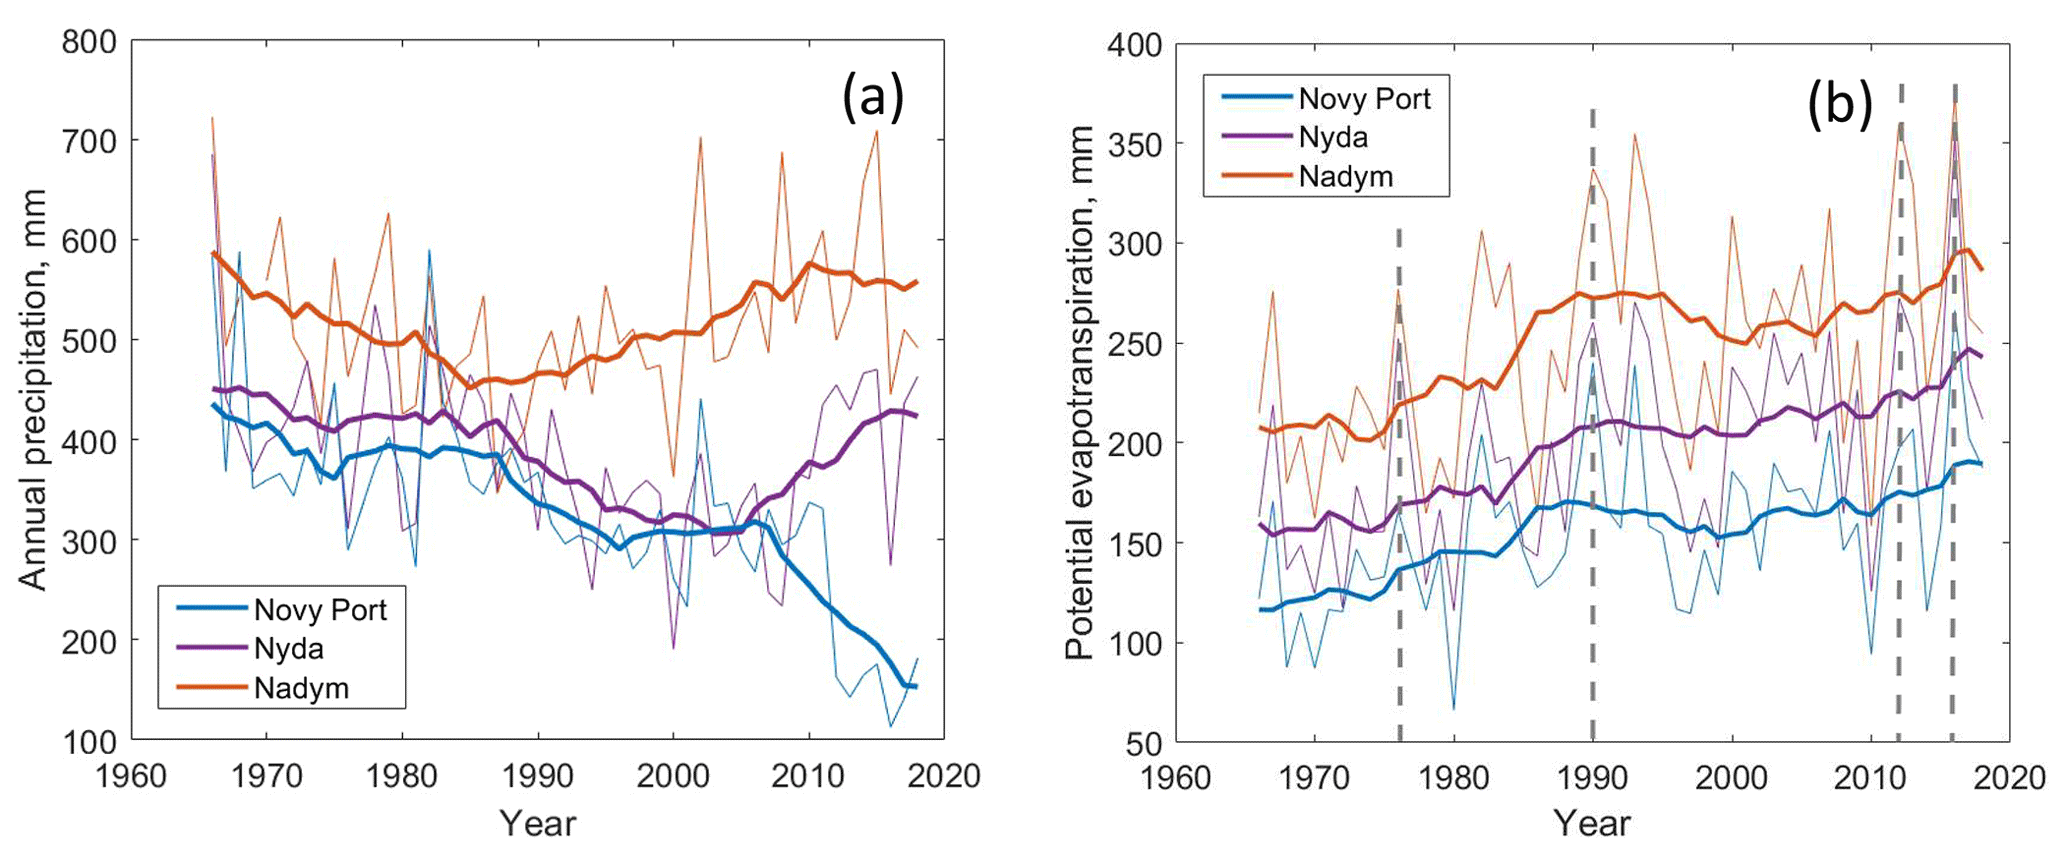
Figure 5(a) Time series of annual precipitation and (b) potential evapotranspiration. Thick curves correspond to 10-year running average. Dashed lines in panel (b) mark the years of major fires.
The northern part of study area 1 is in the continuous permafrost zone, while its southern part and study areas 2 and 3 are in the discontinuous permafrost zone (Trofimova and Balybina, 2015). The vegetation zones include southern tundra, the forest–tundra ecotone and northern taiga (Ilyina et al., 1985), with the treeline crossing the study sites (Walker et al., 2005; MacDonald et al., 2008). The southern tundra zone is represented by dwarf-shrub, moss and lichen tundra; polygonal peatlands; and dwarf-shrub, lichen woodlands. The vegetation community of the forest–tundra consists of larch and spruce–larch, dwarf-shrub moss woodlands, and dwarf-shrub lichen tundra. The northern taiga is represented by larch and spruce–larch dwarf-shrub and moss–lichen forests and shrub–moss–lichen wetlands in flat or hilly terrain. The boundaries of these vegetation zones in the study areas, according to Ilyina et al. (1985), are shown in Fig. 1. Further on, we use the definition and boundaries of vegetation zones following topographic maps. A description of plant species and the permafrost state at several sites obtained during the field campaign in 2019 is provided in Appendix B.
In addition, Fig. 1 shows the forest mask derived from the topographic maps by Ilyina et al. (1985). Forested areas include dense forests, shrubs in the floodplains and river deltas, and sprout forest. Overall, 3570 km2 or 17.5 % of the total study area was covered by forests, out of which 15.5 % was dense forest, 1.2 % was sprout forest and less than 1 % was shrubs. Dry tundra (“moss and lichen tundra” in the topographic maps) covered 11 370 km2 or 55.7 % of the total study area.
Anthropogenic activity in the study areas includes oil and gas mining (fields Medvezhye and Yarudeyskoe, major gas pipelines Yamburg-Tula, Yamburg-Yelets, SRTO-Ural, Urengoy-Center, Urengoy–Uzhgorod). The first geological surveys started in the 1950s, and industrial exploration of the areas started in 1967. A new railway road, the Northern Latitudinal Railway (Salekhard–Novy Urengoy), is currently under construction within study area 1. Environmental impact due to anthropogenic activities and climate change has been monitored since the 1970s (Matyshak et al., 2017a, b; Sizov and Lobotrosova, 2016; Kukkonen et al., 2020).
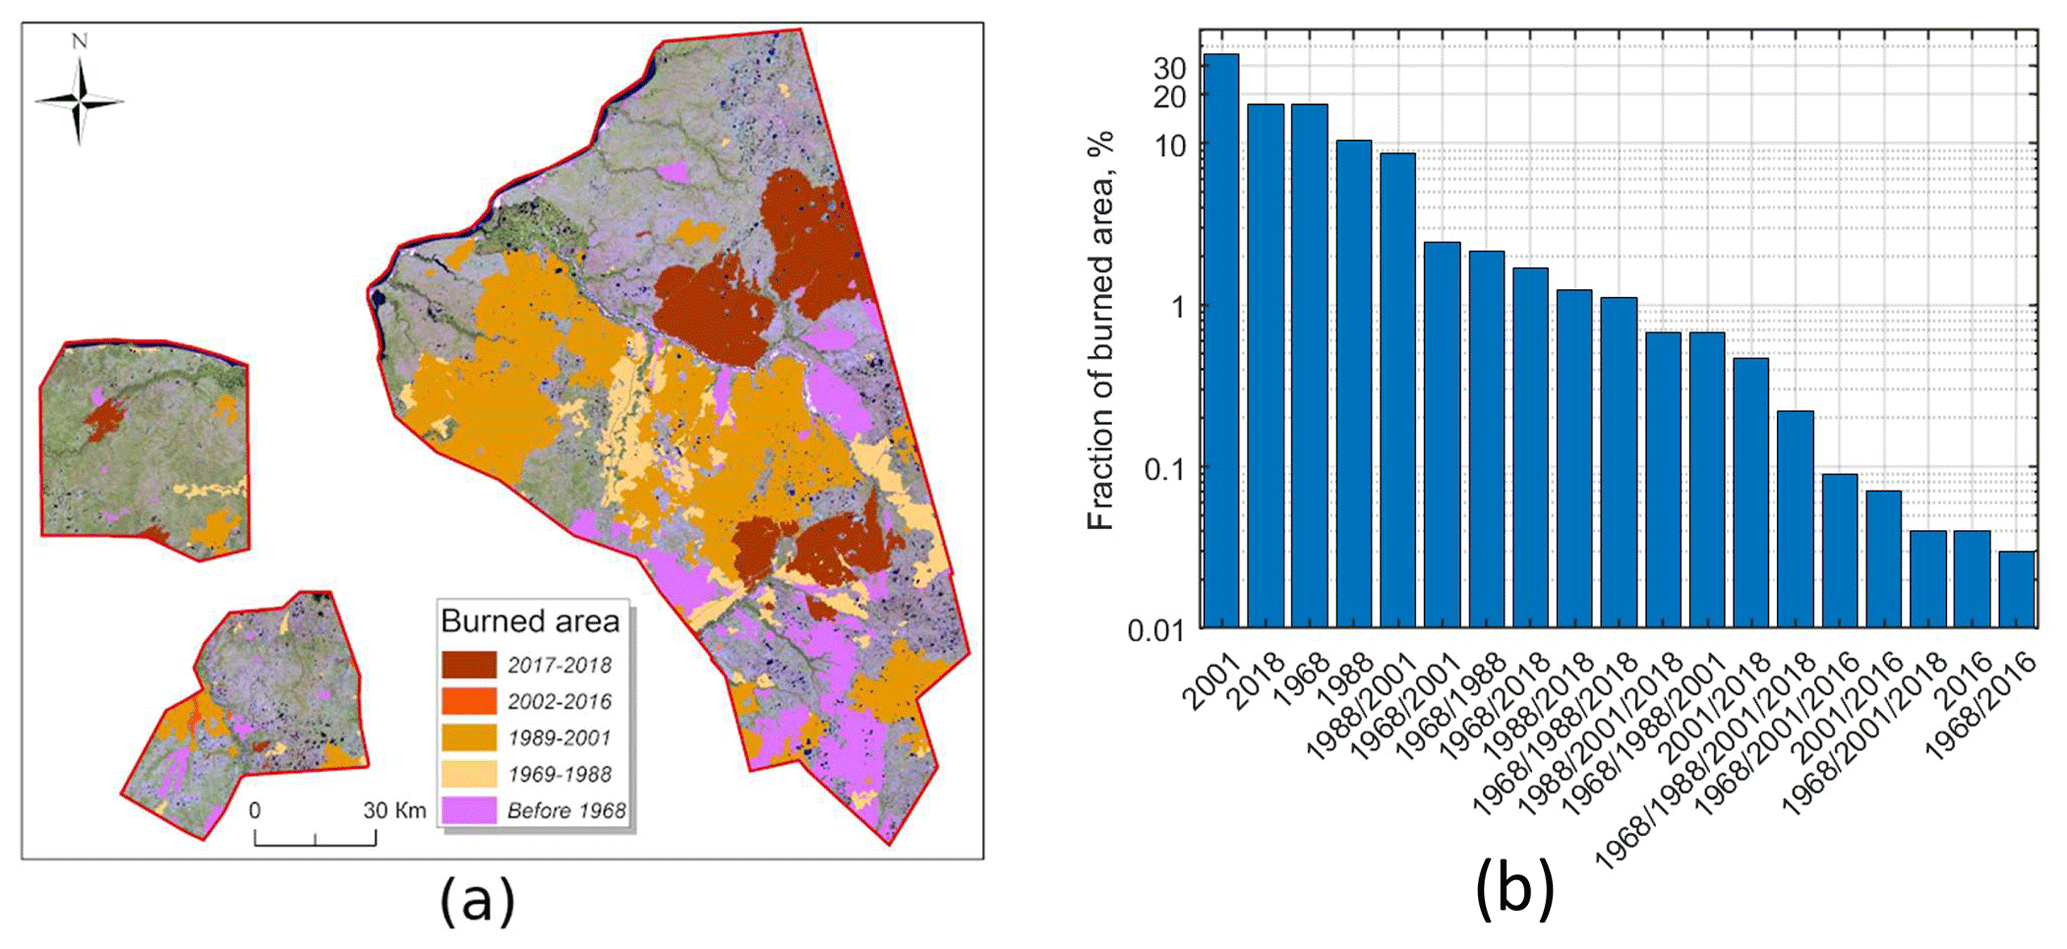
Figure 6(a) Burned territories within study areas 1, 2 and 3 shown in Landsat 8 mosaic (2018). Dates in the legend correspond to different fire periods or different major fires. (b) The fraction of burned area defined as the burned area in the mosaic from a particular year or years divided by the total burned area during the whole study period. Each year marks the end of the corresponding period mentioned in Fig. 6a. Multiple years on the x axis correspond to multiple fires at the same site.
2.2 Calculation of climatic indices
In order to assess the climatic conditions in the region, we used meteorological data (http://meteo.ru, last access: 10 July 2019) from three stations, Novy Port, Nyda and Nadym (Supplement), located along a 200 km latitudinal transect from the north (Novy Port) to the south (Nadym). Novy Port station (67∘41′ N, 72∘52′ E; 12 ) is located to the north of the study areas. This is the closest station to the northern boundaries of the study areas. Nyda station (66∘37′ N, 72∘57′ E; 10 ) is located within study area 1. Nadym station (65∘32′ N, 72∘32′ E; 7 ) is located near the southern borders of the study areas (50 km from study area 3). The data set contained 52 years of quality-checked meteorological observations (from 1966 to 2018), including air temperature (time resolution 3 h), precipitation (time resolution 12 h), and cloudiness 0 to 10 (time resolution 3 h). Based on this data set, we calculated the mean monthly temperatures (the sum of daily mean temperatures divided by the number of days in a month), monthly cumulative precipitation (the sum of daily precipitation measurements for a given month), the daily minimum and maximum temperatures for all the years, and the mean annual temperature and annual precipitation.
In order to assess climatic factors influencing vegetation dynamics, we studied the length and mean temperature of the growing season, which we define as the period with daily mean temperatures above +5 ∘C (Tchebakova et al., 1994). We calculated growing degree days following Tchebakova et al. (1994):
where is the daily mean temperature [∘C]. Another important abiotic factor for vegetation is humidity. We calculated potential evapotranspiration (PET) from the temperature and cloudiness measurements using Bonan's modification (Bonan, 1989) of the Taylor–Priestley model (Priestley and Taylor, 1972). We used PET and precipitation to calculate a dryness index (DI) (Tchebakova et al., 1994), i.e., the ratio between annual PET and precipitation (P):
Based on GDD5 and DI, we classified the vegetation zones in Novy Port, Nyda and Nadym using the thresholds introduced in the bioclimatic model SiBCliM (see Table 2 based on the data from Tchebakova et al., 1994). Due to the fact that the stations are located along the latitudinal transect close to the study sites, they should be representative of sites' vegetation state.

Figure 7(a) The distribution of NDVI over study area 1 on 30 June 2018. Segments with boundaries of different color are non-disturbed dry tundra sites and burned dry tundra sites detected in Corona and Landsat mosaics from different years (see legend). Burned areas in the mosaics from 1968 and 1988 are mainly due to fires from >42 years ago, in 2001 they are due to fires from 28 years ago; in 2018 they are due to fires from 2 years ago. (b) Distributions of NDVI based on the data from marked non-disturbed sites and sites burned in different years. In the legend, numbers in parentheses indicate years after the last major fire.
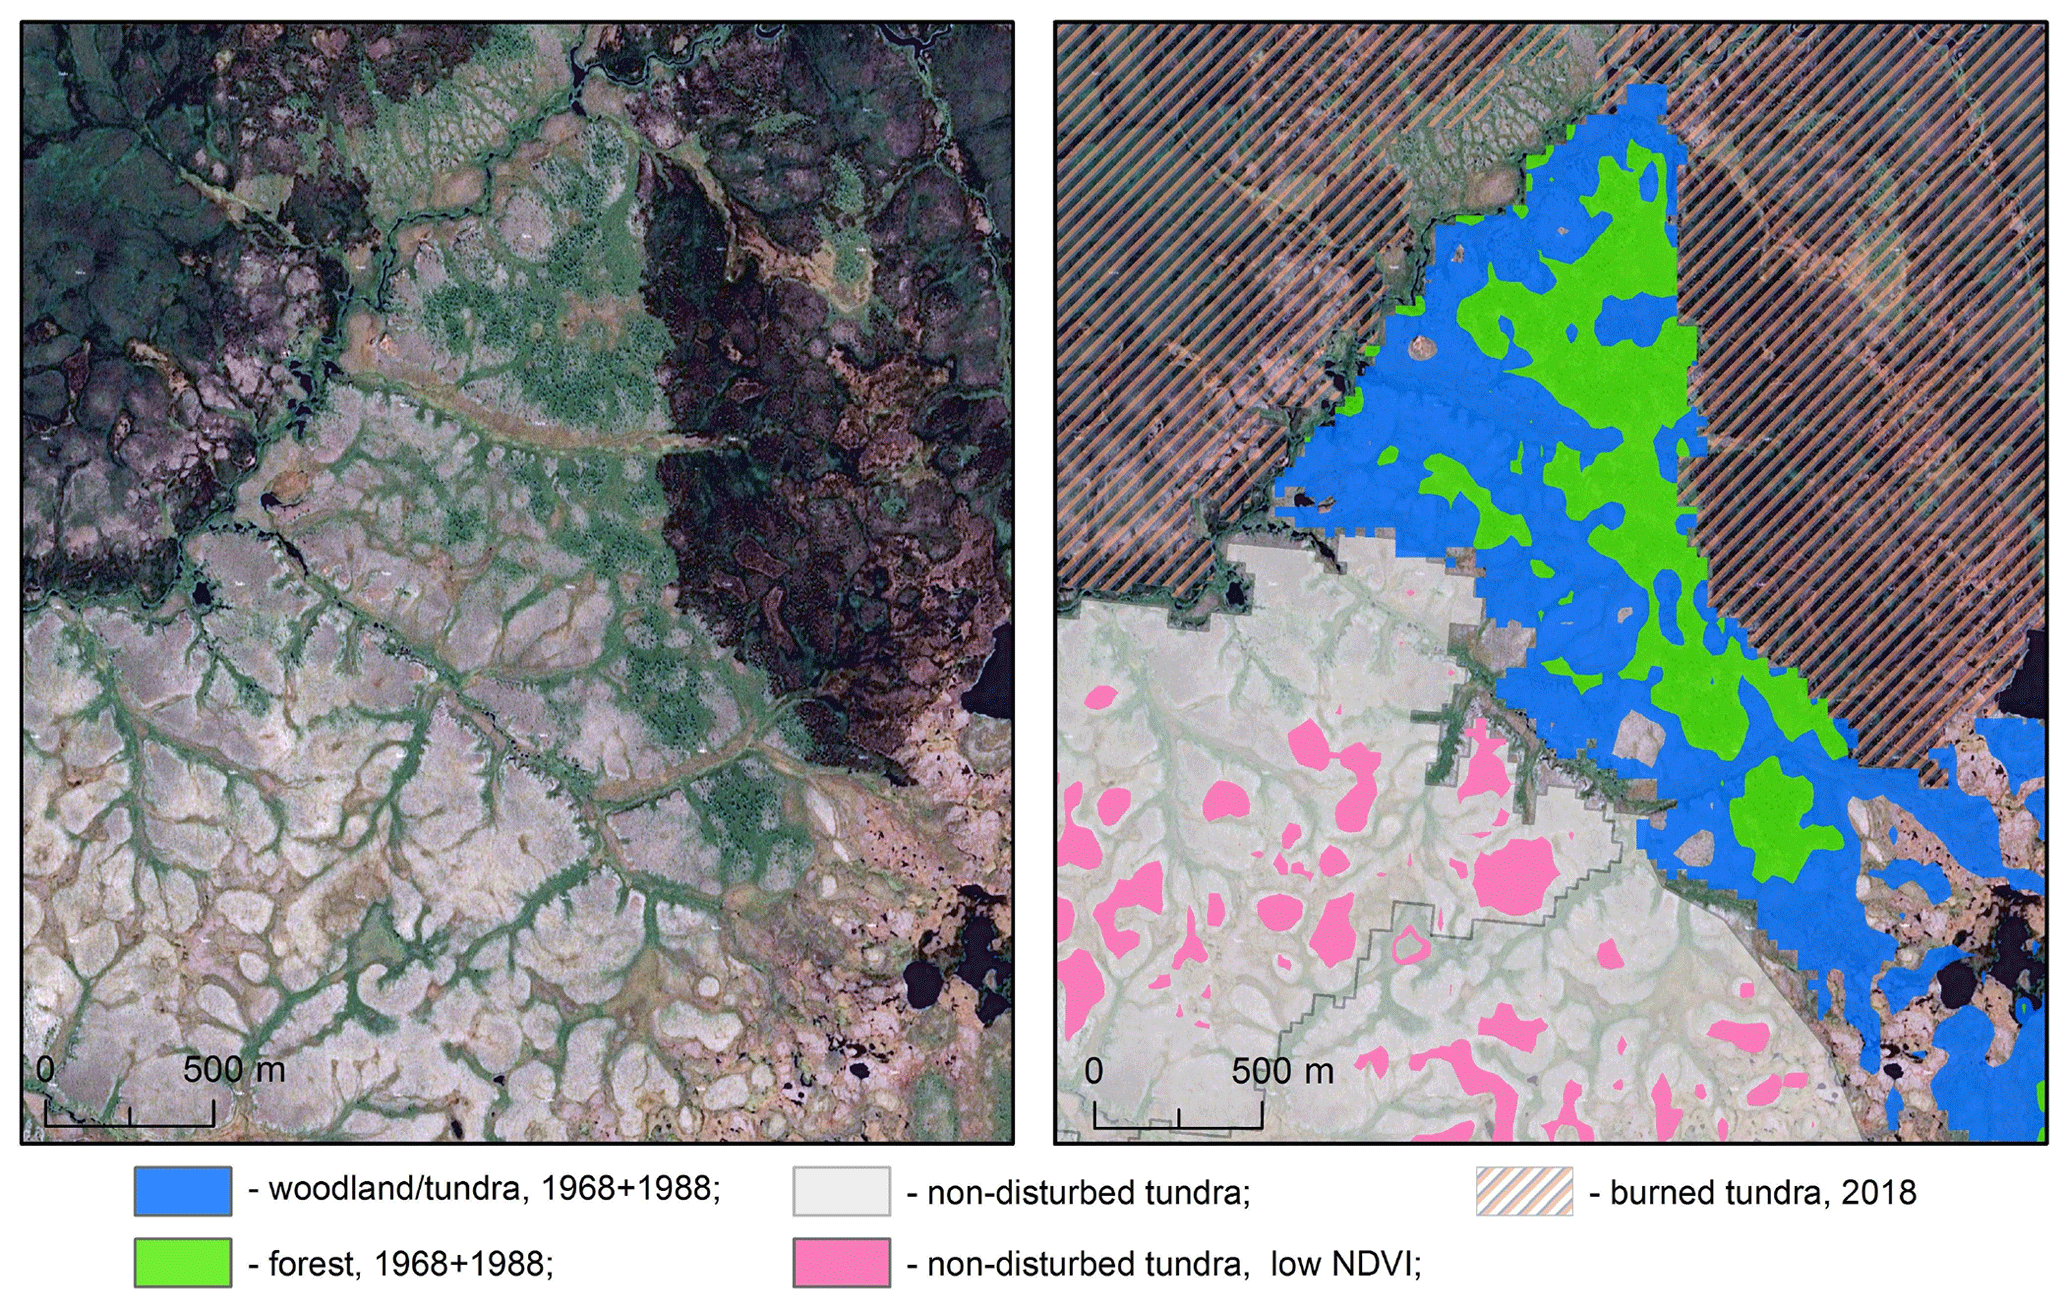
Figure 8Representative types of vegetation associated with different states of the sites and NDVI. Left panel: an image without mask, right panel: the same image colored according to the state of the site (burned in mosaics from 1968 + 1988 or 2018, non-disturbed) and to the NDVI. Right panel: green color corresponds to the upper peak, and blue color corresponds to the lower peak in the bimodal distribution from the sites burned before 1968 and 1988 (Fig. 7b). Pink color marks areas with NDVI lower than 0.52 in the non-disturbed site.
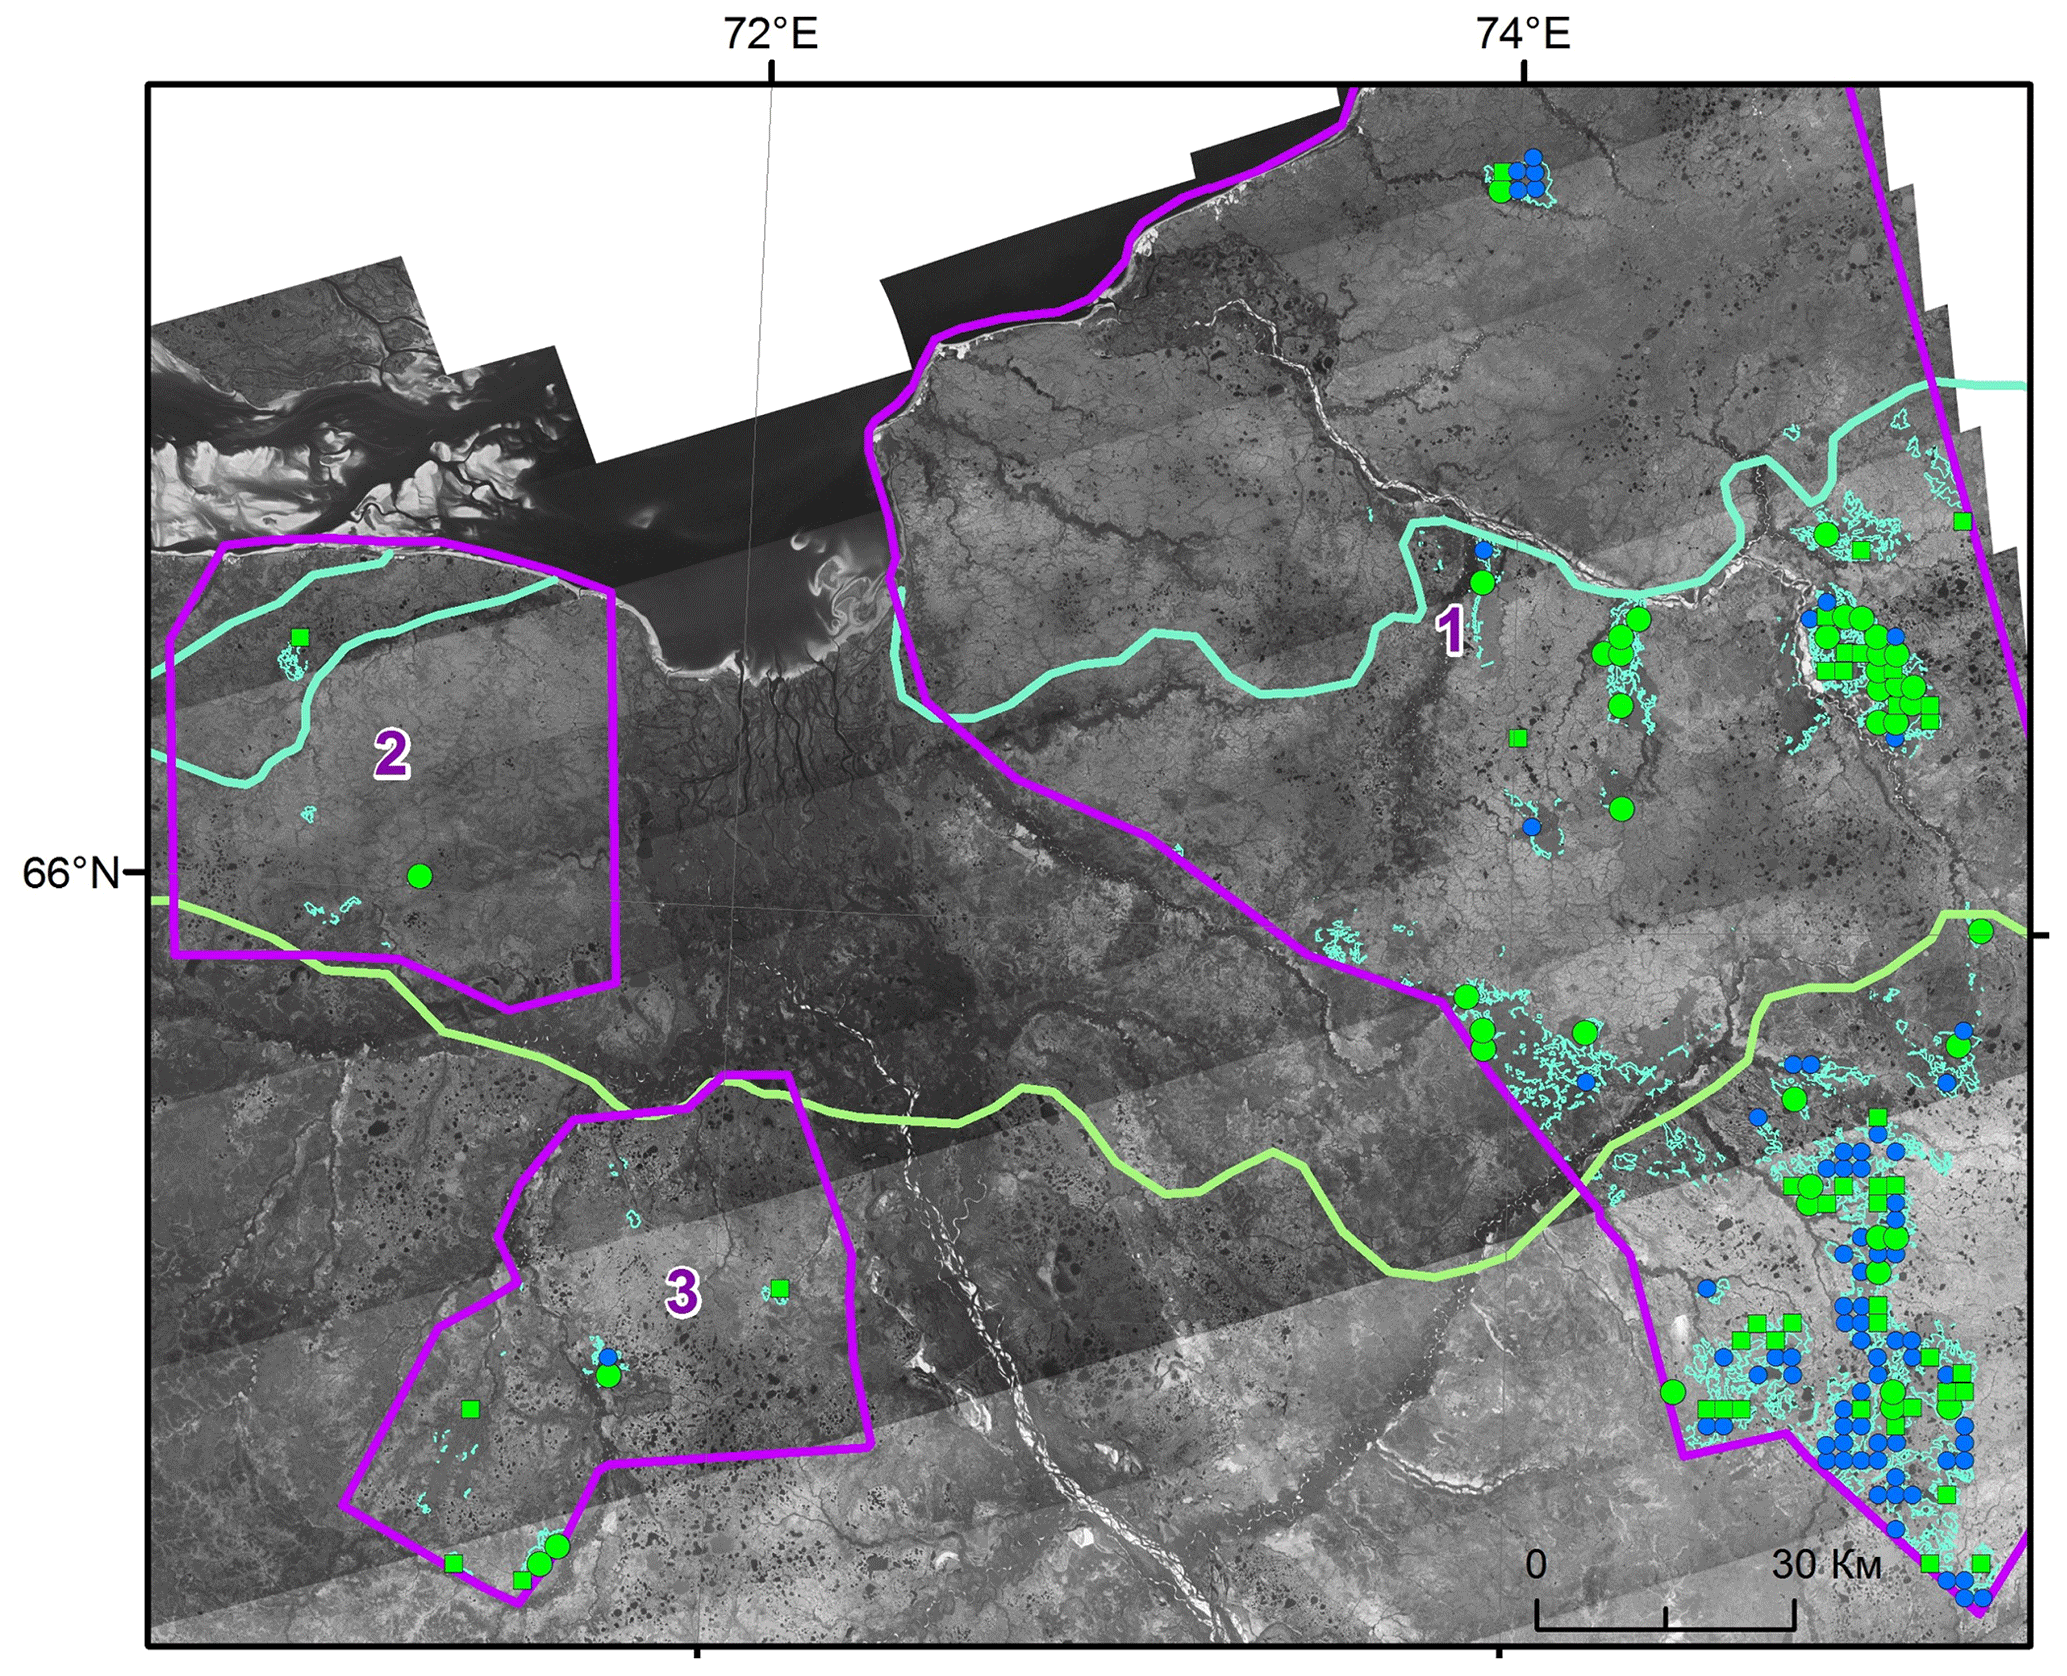
Figure 9Illustration of the vegetation shift in dry tundra after the fire (time interval ca. 60 years). Blue circles – no shift, green squares – shift to woodlands, green circles – shift to forest. Cyan curve is the boundary between southern tundra and forest–tundra; green curve is the boundary between forest–tundra and northern taiga (source: topographic maps).

Figure 10Number of checkpoints corresponding to different classes of vegetation type change for three vegetation zones: (a) non-disturbed territories, (b) fire-affected territories. Change classes: no change means that tundra was both in the old and modern images; to woodland means that tundra turned to woodland, and to forest means that tundra turned to forest. Vegetation zones (southern tundra, forest–tundra and northern taiga) are based on topographic maps (Fig. 9). The time interval is ca. 60 years.
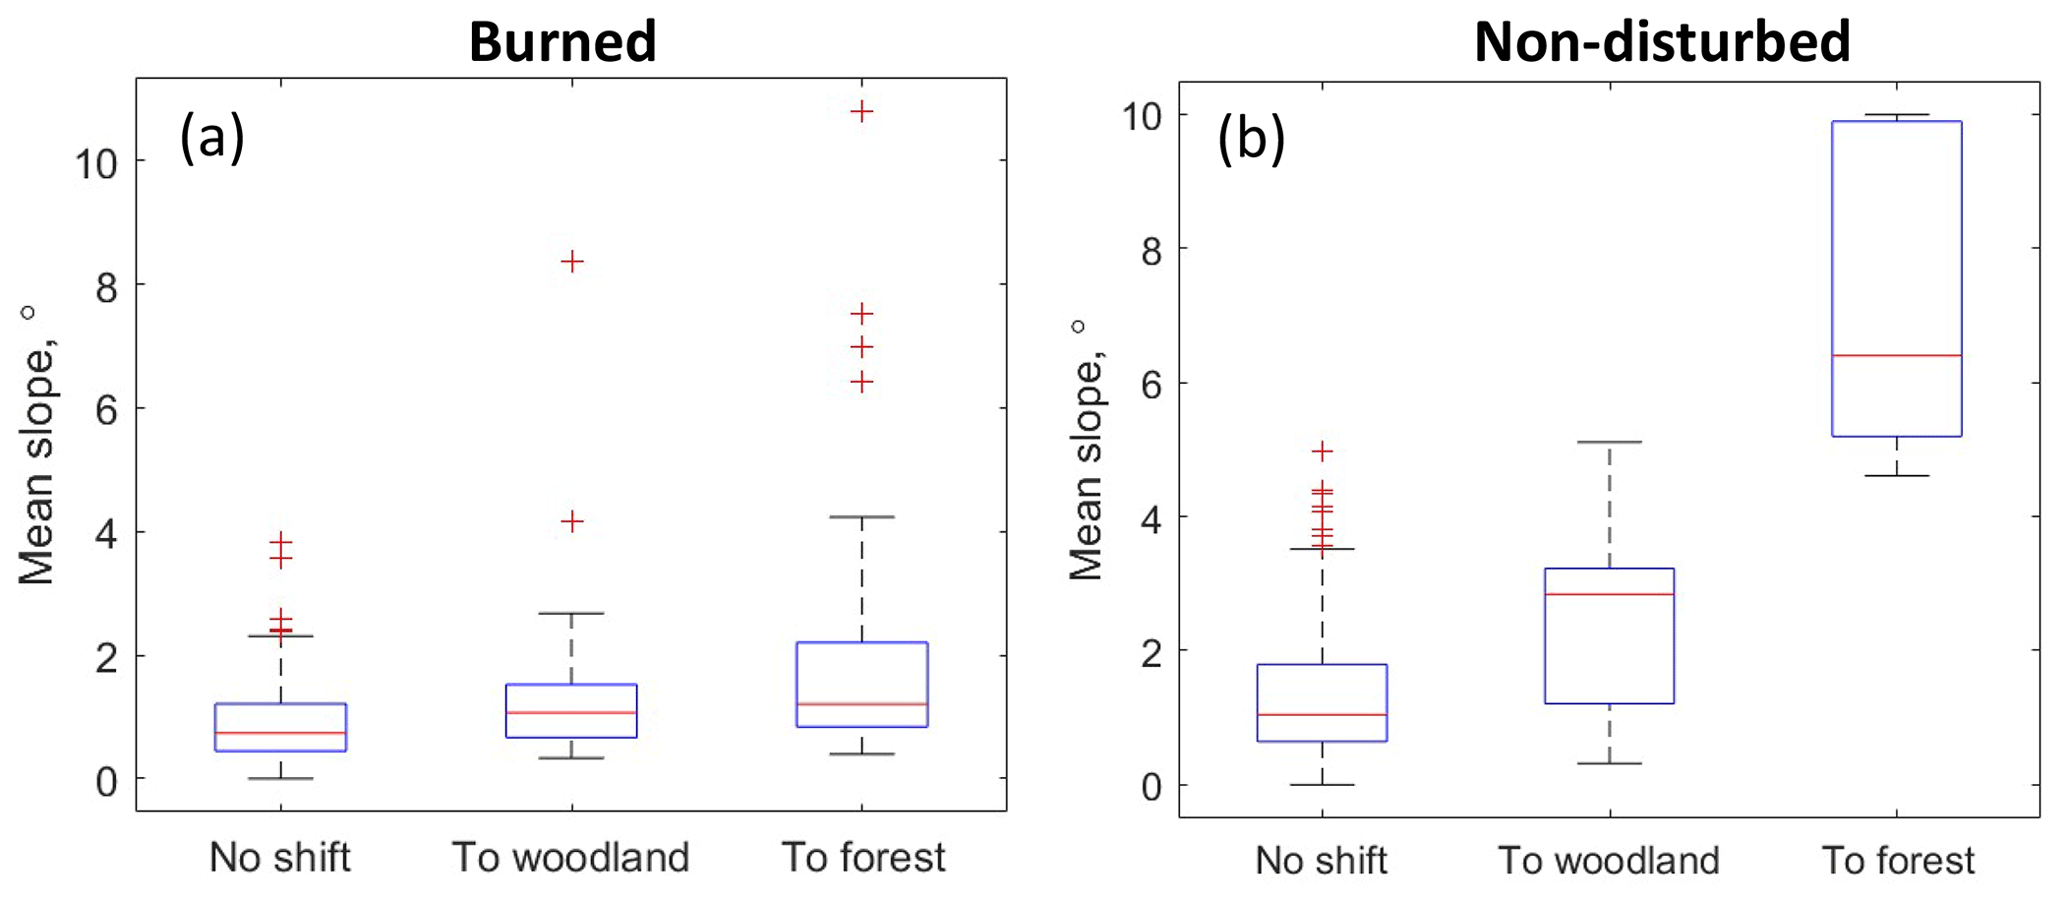
Figure 11Median boxplots of the mean topographic slopes within the sample circles. Red line – median values, bottom and top edges of boxes – 25th and 75th percentiles, whiskers – 5th and 95th percentiles, and red crosses – outliers.
2.3 Wildfires
The initial state of the study areas was assessed using Corona imagery. Corona is a US program running from 1958 to 1972, which used satellite surveillance systems to obtain high-resolution photographic coverage from USSR–China and some other territories (Ruffner, 1995). The ground resolution of the imagery for subsequent KH-1 to KH-4 missions was continuously improved from 12 m (KH-1, 1960) to 2 m (KH-4, 1967). We identified 21 KH-4b frames under clear-sky conditions from 21 August 1968. Each frame consisted of four scanned fragments. The cropped fragments without color correction were georeferenced to the chosen orthomosaic (SPOT layer, Sect. 2.4) using a third-degree polynomial method in software ArcGIS (v. 10.4.1). The RMSE in georegistration estimated using control points did not exceed 10–12 m. Then the fragments were organized into separate paths, and finally a mosaic was formed using the mosaic operator Last in ArcGIS. This mosaic characterized the state of study areas at the start of the active industrial exploration of the region (1967).
Further, we used Landsat Level-1 data to quantify burned areas for particular years within 1968–2018 (Wulder et al., 2019). The data providing the best coverage of the study areas were available from the following years: 1988, 2001, 2016 and 2018 (Table 3). The images were synthesized using near- and mid-infrared channels (Landsat 5 and 7 – 0.63–0.69, 0.76–0.90 and 1.55–1.75 µm; Landsat 8 – 0.64–0.67, 0.85–0.88 and 1.57–1.65 µm) as burned areas are identifiable in the infrared range of wavelengths. Landsat mosaics for all years were formed after color correction using the mosaic operator Blend in ArcGIS.
Mapping and quantification of the burned areas were performed by means of an object-based image analysis, successfully used for studies of landscape dynamics (Blaschke, 2010). In the first stage, we performed segmentation of mosaics using the algorithm “Multiresolution Segmentation” in eCognition software (v. 9.0). The segmentation was performed using parameters 40 for scale and 0.5 for color. The second stage, classification, was different for Corona and Landsat mosaics. In Corona mosaics, the spectral information was missing and we had to rely on the contrast of colors between non-disturbed tundra and burned areas. For visual classification we applied two criteria. First, non-disturbed tundra is lighter due to the presence of lichen in the vegetation community, whereas recently burned areas are dark. Second, burned areas are characterized by well-defined boundaries often coinciding with river coastlines. An example illustrating segmentation and the visual choice of burned areas is shown in Fig. 2. For Landsat mosaics, we used an unsupervised classification iterative self-organizing data analysis technique (ISODATA) (15 classes, a change threshold of 5 %). Further, we identified visually one or two classes corresponding to burned areas. The segments containing more than 90 % of pixels within these classes were identified as burned areas. The segments with 40 %–90 % of pixels within these classes, located at the periphery of large fires, were added to burned areas based on visual imagery check. Calculation of the areas of segments classified as burned areas was performed using the standard instrument Calculate Geometry in ArcGIS.
We studied the percentage and distribution of the burned sites and calculated the frequency of fire return. Corona and Landsat images showed that some years were characterized by particularly large-scale fires in the study areas (see an example for 1990 in the Supplement, Fig. S1). These years are referred to as the years of major fires. The burned areas can be detected in the satellite images for a few years after the fire. Burned areas in the Corona mosaic from 1968 were partially dated back to the fires in the period 1953–1964 based on geological surveys and early Corona images (the sources are listed below Table 4). Landsat mosaics from 1988, 2001, 2016 and 2018 largely reflect the state of the study areas after the major fire years 1976, 1990, 2012 and 2016 (Table 4). For a given territory, the fire interval was calculated as the difference in years between the major fires.
2.4 Vegetation dynamics
We have studied the vegetation dynamics using two methods. First, we used normalized difference vegetation index (NDVI) distributions to assess the state of vegetation in the sites burned at different times. Second, we studied the tundra–forest shift of dry tundra during the period of ca. 60 years visually comparing historical imagery to modern satellite data of high spatial resolution. A similar visual method was used by, e.g., Frost and Epstein (2014) to study transition from grassland to shrubs in northern Eurasia.
Below we describe the method based on the NDVI. This index reflects the state of biomass, i.e., vegetation greenness, density and development (Walker et al., 2003; Johansen and Tømmervik, 2014; Miles and Esau, 2016). The NDVI was calculated from the red (R) and near-infrared (NIR) radiation reflected by vegetation:
We chose two scenes from one path of Landsat 8 from 30 June 2018 (Table 5). We used Level-2 data (Committee on Earth Observation Satellites – CEOS) after atmospheric correction by the standard Landsat 8 Operational Land Imager (OLI) atmospheric correction algorithm (Vermote et al., 2016). The NDVI was calculated in ArcGIS using standard tools.
We analyzed NDVI distributions for study area 1, separately for dry tundra burned in different years (as detected in satellite imagery mosaics from 1968, 1988, 2001, 2018) and for non-disturbed dry tundra. We considered the territories covered by one satellite overpass. Moreover, analysis of burned tundra included only the sites burned once within 60 years. In order to make the study areas more balanced by size, we merged the data sets from the burned territories detected in 1968 and 1988, for which we might expect that vegetation had recovered after the fires, and omitted 2016 due to insufficient size of the fire-affected territory. As a result, all study areas were larger than 600 km2 (1968 + 1988 – 600 (405 + 195), 2001 – 1565, 2018 – 867 km2, non-disturbed – 937 km2). Using the dates of major fires (Table 4) and the date of the Landsat mosaic (2018), we can assume that the NDVI within burned tundra sites detected in 1968 and 1988 reflects the state of vegetation after fires more than 42 years ago, that in 2001 reflects the state of vegetation after fires 28 years ago, and that in 2018 reflects the state of vegetation after fires 2 years ago. The NDVI in non-disturbed tundra refers to tundra not affected by fires during the whole study period.
The visual method can be described as follows. The data sets used in the analysis of vegetation dynamics are summarized in Table 5. The initial state of vegetation was assessed using the Corona mosaic (Sect. 2.3) and topographic maps. The topographic maps were used to develop forest and dry tundra masks using automatic tracing in Easy Trace software (v. 8.7). The resulting vector layer was checked and corrected using the Corona mosaic.
Assessment of the current state of vegetation was based on SPOT and Resurs-P data (Table 5). The study areas were almost fully covered by the mosaic of SPOT-6 and SPOT-7 imagery. Ca. 10 % of the study areas were covered by three paths of Resurs-P (product level 1C; channels blue, green, red and NIR). Resurs-P data were co-registered to the SPOT mosaic in ArcGIS. The data were synthesized in the visible-radiation range without color adjustment. The SPOT mosaic was used as a pluggable web map layer without additional processing.
Firstly, based on the topographic map and Corona mosaic, we identified two types of dry tundra sites: those burned before 1968 (Sect. 2.3) and those not affected by fires during the whole study period. The area of burned tundra was 1090 km2, and the area of non-disturbed tundra was 5300 km2. Then we introduced random sample circles with 100 m diameters into the subsets. The samples were spaced at intervals of 2 km within burned tundra (157 samples) and at intervals of 5 km within non-disturbed tundra (231 samples). We included only the circles for which we could confidently state that there were no trees in 1968. In the modern imagery, we distinguished between the following types of vegetation: tundra (no trees), woodland (trees covered less than 50 % of the area inside the circle) and forest (trees covered more than 50 % of the area inside the circle). We visually compared the areas inside the circles in the historical and modern images (see examples in Fig. 3). We introduced three change classes: “no change”, when tundra was identified in both the old and the modern images; “to woodlands”, when tundra turned to woodlands; and “to forest”, when tundra turned to forest.
2.5 Topographic slopes
To quantify the topographic slopes, we used a digital elevation model ArcticDEM (Table 5). The model is a mosaic with a high spatial resolution (2 m). The stereo couples for this version of the model were prepared in 2010–2017. It is currently the most detailed source of information on the relief. Co-registration of the mosaic elements, calculation of slopes and preparation of the raster layer for the geoportal NC50 (Appendix A) was carried out in ArcGIS.
We calculated topographic slopes within the circles where we visually assessed the vegetation shift. For calculation, we used circles with a 50 m diameter located in the centers of larger sample circles (Sect. 2.4). For each circle, we calculated the mean slope. We separated data corresponding to burned tundra and non-disturbed tundra and further stratified them by vegetation shift (no shift, to woodlands, to forest), thus splitting the data set into six classes. Finally, we calculated the median values as well as the 25th and 75th percentiles of mean slopes for each class.
3.1 Temperature, precipitation and climatic indices
During the last 50 years, the mean annual temperature at the meteorological stations has increased by 2.6–3.0 ∘C (Fig. 4): from −9.5 to −6.5 ∘C in the north and from −6.5 to −4 ∘C in the south. In addition, the daily minimum temperature has increased by 4–5 ∘C (from −44 or −45 to −40 ∘C, in the Supplement, Figs. S2–S4).
The growing season typically lasts 3 months in the north and 3–4 months in the south (in the Supplement, Figs. S2–S4). The length of the growing season has increased by 24 d (in the Supplement, Figs. S1–S3): from 72 to 97 d in the north (Novy Port) and from 97 to 121 d in the south (Nadym). The mean temperature of the growing season has increased by 1.0–1.4 ∘C. In general, both the length and the mean temperature of the growing season exhibit great variability particularly during recent years (in the Supplement, Figs. S2–S4). Following the mean temperature and the length of the growing season, the growing degree days, GDD5, have increased over the last 50 years (Fig. 4). The strongest increase in GDD5 (ca. 200 degree days) was observed during the 20 years from 1966 to 1985, after which GDD5 leveled off. The period from 1980 to 1995 seemed to be the most favorable period for new-forest establishment due to the relative stability of mean temperature and GDD5. On the contrary, the last decade was characterized by a strong variability in both mean annual temperature (the peak-to-peak value was ca. 3 ∘C) and GDD5 (the peak-to-peak value was larger than 400 degree days), which could make seedlings' survival less probable.
Mean annual precipitation increases from the north to the south: from 330–340 mm in Novy Port to 510 mm in Nadym (in the Supplement, Fig. S5). Precipitation in the northern part (Fig. 5) is characteristic of the arctic regime with the annual value below 400 mm, whereas precipitation in the southern part (Fig. 5) is characteristic of the temperate continental regime (Chorley, 1971). Monthly variability in precipitation follows a well-pronounced seasonal cycle (in the Supplement, Fig. S5) with a maximum in August (July–August in the south). While the seasonal cycle of precipitation was similar in three stations, the inter-annual variability was not. Precipitation time series in Nyda and Novy Port closely followed each other between 1965 and 2005 (Fig. 5). Since 2005, the annual precipitation has drastically decreased in Novy Port and it has increased in Nyda. Potential evapotranspiration increased at all three sites. Accordingly, the dryness index (DI) increased from 0.4 to 0.5–0.6 everywhere (in the Supplement, Fig. S6). During a few recent years, the DI in Novy Port exceeded unity several times.
Based on the observed growing degree days and DI, we assessed the change in the vegetation class at three stations (Table 6). The vegetation class has changed at two sites (Nadym and Novy Port). This is a result of an increase in GDD5, while the DI was not a limiting factor for the vegetation class at any of the three stations. Due to the fact that GDD5 is a function of air temperature and the latter depends mainly on latitude, GDD5 from the three stations should be representative of our study areas. Therefore, we can conclude that (1) our study sites should have experienced vegetation change during 60 years, specifically from tundra to forest in the north, and (2) temperature and moisture regimes throughout our study areas are theoretically suitable for forests.
3.2 Dynamics of fires
Weather conditions in northern Siberia can support large-scale wildfires during summertime. The fires occur mainly in July (Ponomarev et al., 2016). Burned areas after five major fire events (Table 4) are shown in Fig. 6a. The burned areas in Fig. 6a can overlap if the same site experienced more than one fire. Separate maps of the burned sites for each of the five cases (Table 4) are available on the geoportal NC50 (Appendix A).
The overall area of burned sites was ca. 8300 km2, constituting more than 40 % of the total study area. Figure 6b shows the distribution of the fraction of burned area over years. The largest fires, contributing more than 30 % to the total burned area, occurred between 1989 and 2001 (mainly in 1990, Fig. S1). The fires in each of the periods 1953–1968, 1968–1988 and 2016–2018 contributed 10 %–20 % of the total burned area (Fig. 6b). In addition, ca. 10 % of that area was recognized in both 1988 and 2001 imagery. According to Fig. 6b, ca. 80 % of the burned area experienced fire once and 20 % experienced fires more than once during 60 years. Approximately 17 % of the fire-affected territory (1400 km2) burned twice; 2.5 % of the territory (200 km2) burned three times, and 0.2 % (20 km2) burned four times. These sites were characterized by a remarkably small period between consequent fires, which was estimated as 15–60 years if only major fires were taken into account (Table 4).
3.3 Vegetation dynamics and its link to fires and topography
3.3.1 Assessment of vegetation recovery after fire using normalized difference vegetation index (NDVI)
Figure 7a shows study area 1 where we marked dry tundra burned in different time periods and non-disturbed dry tundra. Figure 7b shows the corresponding distributions of NDVI. As discussed in “Materials and methods” (Sect. 2.4), 1968 + 1988 data reflect the state of vegetation in the site burned more than 42 years ago, 2001 data reflect the same 28 years ago, 2018 data reflect the same 2 years ago and non-disturbed data refer to tundra not affected by fires during the whole study period.
In Fig. 7b, the NDVI distributions from the non-disturbed tundra and recently burned sites are close to Gaussian ones. Interestingly, the distributions from the sites burned 28 and >42 years ago are bimodal and they have higher NDVI values as compared to the non-disturbed and recently burned sites. We fitted the distributions by the sums of two Gaussian functions (the fits are shown in Fig. 7b) and determined mean values and standard deviations for all the peaks (Table S1). The positions of the lower peaks of the bimodal distributions differ only slightly, whereas the position of the upper peak is a bit lower, and the peak is less pronounced for the distribution from the site burned 28 years ago.
Further, we used the mean values and standard deviations of the fitted Gaussian functions to identify vegetation associated with the peaks of the distributions. For illustration, we chose an image containing all representative examples of vegetation (Fig. 8). The green color in Fig. 8, right panel, indicates the sites with an NDVI in the interval (; ) corresponding to the upper peak of the distribution based on the data from 1968 + 1988. Comparing the left panel and right panel of Fig. 8, one can conclude that this peak is mainly associated with forest. The lower peak (the areas in a blue color in Fig. 8, right panel) corresponds to woodlands and tundra. This lower peak has a large intersection with the peak in the unimodal distribution from the non-disturbed site. However, interestingly, there is a significant decrease in the areas with an NDVI below ca. 0.52 in the bimodal distributions. These areas are marked in pink in Fig. 8, right panel. They correspond to the tundra sites lightest in color due to the presence of lichen in the vegetation community.
Finally, from the bimodal distributions we estimated the fraction of area occupied by forest. Using standard deviations of the two peaks, the boundary separating the forest peak from the tundra peak is NDVI=0.72. We assumed that areas with an NDVI>0.72 represent mainly forest and that areas with an NDVI<0.72 represent mainly tundra and woodlands. We integrated the bimodal distributions to find the fraction of area with an NDVI>0.72. Our estimates show that in the sites burned 28 years ago, forests occupy 19 % of the total area. In the sites burned more than 42 years ago, the fraction of forest increased to 28 % of the total area.
While precise calculations of the forest fraction based on the NDVI are challenging, the main results following from Figs. 7 and 8 can be summarized as follows:
-
The NDVI distributions based on the data from non-disturbed tundra and the sites burned 2 years ago are predominantly unimodal, whereas the distributions based on the data from the sites burned 28 years ago and earlier are bimodal.
-
The low-NDVI sites corresponding to vegetation communities in tundra with relatively high amounts of lichen and thus having the lightest colors in the images almost disappear from the distributions calculated for the vegetation communities recovered after fires.
-
Instead, the new state of vegetation recovered after fires is characterized by a higher mean NDVI due to the new peak associated with forest. The fraction of high-NDVI area representing forest increases with the time after the last fire.
3.3.2 Assessment of vegetation shift using visual method, connection to fires and topography
Figure 9 illustrates the shift from dry tundra to other types of vegetation in the sites burned before 1968 (Fig. 6). The largest part of burned dry tundra was in the northern taiga zone, and a relatively large part was in the forest–tundra ecotone. The burned area in southern tundra contained only seven samples; therefore the corresponding results are not statistically reliable. The shift of vegetation indicated by green symbols is clearly seen in the forest–tundra, while it is less pronounced in the northern taiga.
Statistics of the vegetation shift are summarized in Table 7 and illustrated in Fig. 10. In the absence of disturbances, only a tiny fraction (ca. 5 %) of dry tundra turned to woodlands in the southern tundra zone, whereas a somewhat larger proportion (15 %) of changing vegetation was observed in the forest–tundra and northern taiga (Table 7). Note that none of the non-disturbed dry tundra sites developed forest. On the contrary, burned dry tundra exhibited a significant shift towards tree-dominated vegetation: 85 % of samples in the forest–tundra and 45 % of samples in the northern taiga. More than 50 % of samples showed change to forest in the forest–tundra ecotone (Table 7), and more than 10 % of samples showed such a change in the northern taiga.
Finally, we assessed the link between the vegetation shift and topographic characteristics (Fig. 11). The shift was dependent on topography in the non-disturbed sites. The median value of the mean topographic slope was ca. 1∘ in the areas with no detected shift and ca. 3∘ in the areas with the shift towards woodlands, and it increased to 6∘ in the areas with the shift towards forest. Note that there were only five points in the non-disturbed areas with shift to forest; all of them were located in the river valleys (these points were not accounted for in the statistics in Table 7). Oppositely, the slope dependence was weak or absent in the predominantly flat burned areas.
Different climate models generally agree that the greatest warming due to enhanced greenhouse gas emissions occurs at northern high latitudes (Sand et al., 2016). Studies have shown that the snowmelt and spring recovery occurs earlier in the Northern Hemisphere boreal and subarctic forest zone with a trend of 2 d per decade (Pulliainen et al., 2017), having a considerable effect not only on vegetation but also on wildfire dynamics. At our sites, the length of the growing season has a trend of lengthening 4.5–4.8 d per decade and the mean temperature of growing season is increasing by 0.2–0.3 ∘C per decade (in the Supplement, Figs. S2–S4). Since 1966 the average growing season temperature has increased by approximately 1 ∘C and the growing season has become longer by approximately 20 d. The cumulative heat index, GDD5, has increased by 200–300 degree days (Fig. 4); the DI has increased from 0.4 to 0.5–0.6 (in the Supplement, Fig. S6). Interestingly, the strongest increase in GDD5 was observed between the years 1966 and 1985, followed by a stable period during the 1980s and 1990s, and this period was the most favorable to the trees taking over the tundra areas. According to the calculated climatic indices – GDD5 and DI – conditions throughout the study areas are already suitable for forest, and the treeline could have moved to the north. Note that the boundaries of vegetation classes as defined by the topographic maps do not coincide with those of the classes based on SiBCliM (Table 6). This is likely the consequence of the insufficient precision of the bioclimatic model, which can be too rough in transitional areas.
Besides atmospheric heat and moisture, Arctic vegetation is sensitive to the state of underlying permafrost. Myers-Smith et al. (2019) emphasized the importance of increased active layer thickness (ALT) in addition to summer temperature and the elongated growing season for the vegetation shift based on the observations in the Canadian Arctic. They reported a change in vegetation community composition, namely an increase in shrubs and graminoids, driven by climatic factors alone (see also Barrett et al., 2012; Narita et al., 2015). Tchebakova et al. (2010) suggested that for the survival of the tree species Larix sibirica and Picea obovata, native to West Siberia, the ALT should exceed 1.5 m. Matyshak et al. (2017b) reported an ALT of 58–70 cm in the peatlands near Nadym in 2007–2008, whereas Kukkonen et al. (2020) found an ALT of 1–3 m in the nearby boreholes in 2009–2017. Our measurements (Appendix B), although by no means extensive, show that the ALT is 40 cm in the non-disturbed site and 1.5 m in the sites affected by relatively old fires (40 years ago) within study area 1. Due to the changes in surface energy balance, the ALT regularly increases within the first few years following fires (both in forest and tundra ecosystems), and ALT in the burned sites may be larger than in the unburned sites for 2 or 3 decades (Rocha and Shaver, 2011; Köster et al., 2018). A deeper ALT provides more space for tree roots, implying more favorable conditions for trees.
In addition, wildfires create new recruitment opportunities (Bret-Harte et al., 2013; Mekonnen et al., 2019). Combusting the vegetation and part of the organic soil layer, the fires create open patches on the soil where pioneer species can start to grow. Moreover, the burned tundra is darker than the unburned area, which can accelerate tree establishment due to warmer conditions in the soil. This is supported by nutrients released by the burning biomass. Camac et al. (2017) found out that the fires increase shrub seedling survival by as much as 33-fold while warming positively affects their growth rates.
During the last 60 years, the study sites experienced extensive fires burning 40 % of the total territory. The distribution of burned sites among the study areas 1, 2 and 3 was not homogeneous. Within study area 1, a higher fraction of burned areas was detected (Fig. 6). Given the similarity of climatic conditions, a possible explanation is the difference in anthropogenic activity. Oil and gas infrastructure within the areas 2 and 3 was launched only recently, whereas geological prospecting within area 1 had already started in 1967, major construction of infrastructures was performed in 1971 and exploitation of the Medvezhye field started in 1977. In our analysis of vegetation dynamics, we focused on study area 1 which was most affected by fires.
It is interesting to note that ca. 20 % of the burned territories experienced multiple fires with intervals between consequent fires of 15–60 years. Compared to our results, the fire return interval in Siberian forests at similar latitudes but further to the east (100∘ E) is 130–350 years (Kharuk et al., 2011). Note that Kharuk et al. (2011) studied a remote site, where typically lightning ignites a fire. Oppositely, our results suggest that the fire return period in the same latitudes can be significantly reduced, presumably due to anthropogenic influence. Concurrently, this effect could be amplified by higher temperatures and enhanced evaporation. Note that according to Fig. 5, the years of major fires (1976, 1990, 2012 and 2016) were characterized by peaks in potential evapotranspiration, as well as by anomalously high temperatures during the growing season (in the Supplement, Figs. S2–S4) exceeding the mean value by 1 ∘C. Causes of fires in northwest Siberia will be a topic for future research.
The time since the last fire is an important parameter for the assessment of the vegetation state. Within the study areas, the interval between the large-scale fire events, when more than 500 km2 was burned, was 15–25 years. Using the current state of the NDVI in the areas affected by fires, we estimated the time of vegetation recovery. The peak NDVI values in the sites that burned 28 years ago (Fig. 7, Table 4) exceeded the peak non-disturbed NDVI value. The peak NDVI value in the sites that burned 2 years ago was smaller than that of the non-disturbed site. This suggests that the post-fire vegetation recovery in our study areas took 2–28 years. Landhausser and Wein (1993) studied recovery of vegetation after strong fire in field conditions. Within 5 years of the fire, 65 % of the area was non-recovered bare ground, but 22 years after the fire the area was fully recovered, which is in general agreement with our results.
The shift in the NDVI distribution towards larger NDVI values was found in the sites that burned more than 28 years ago, suggesting that recovered vegetation is characterized by a larger amount of biomass, presumably due to the shift in species. Oppositely, lichen does not recover to its state before the fire. The field campaign (Appendix B) revealed an increase in the fraction of green mosses and the tree species (e.g., birch) typical of succession in burned sites. Increased biomass due to change in the vegetation state (increased population of shrubs and forests) after fires is consistent with other studies (Landhausser and Wein, 1993; Barrett et al., 2012; Narita et al., 2015). Different studies underline bigger post-fire changes in the biomass and composition of the non-vascular plant community in tundra areas (Lantz et al., 2013; Jones et al., 2013), compared to the vascular plant community (Landhausser and Wein, 1993), and in these conditions lichen biomass could take decades to centuries to recover.
Our results (Sect. 3.3) suggest that the disturbances have an important effect on forest advance. We observed an increase in the forest and woodland cover in the areas affected by relatively “old” fires (60-year period). In undisturbed conditions, forest took over tundra vegetation on the slopes and in the river valleys. As tundra turned into woodlands on rather moderate slopes (3∘), it is not likely that landslides played a definitive role. Instead, the vegetation shift may be related to the difference in insolation or the hydrological regime (Walvoord et al., 2019). Frost and Epstein (2014) studied the expansion of larch and tall-shrub cover in Siberia based on remote sensing. The expansion of tree and shrub cover was observed in uplands, which were defined as the sites with topographic slopes above 2∘. This is in agreement with our findings. Notably, the topography was not an important factor for the vegetation shift in the fire-affected areas.
We used topographic maps and high-resolution remote sensing to study vegetation dynamics in the forest–tundra zone of northwest Siberia during the last 60 years. We found that the vegetation shift from dry tundra to forest was strongly associated with fires. In the non-disturbed sites experiencing no fires, only 6 % of the area in southern tundra developed some trees during the 60-year period. This number increased to up to 15 % of the area in the forest–tundra ecotone and northern taiga. The shift in the non-disturbed area was sensitive to topography, and trees appeared mainly on the moderate slopes. In the fire-affected sites, after the same period, the tree-dominated vegetation already occupied 40 %–85 % of the previous dry tundra in the forest–tundra ecotone and northern taiga.
Given the importance of the fires for the tundra–forest dynamics, we calculated fire frequency within the study area. Major fires, burning 600–2500 km2 of the study area, occurred every 15–25 years. Most of the burned area experienced fires only once during 60 years, although some parts experienced multiple burning, up to four times. For ca. 1700 km2 of the study area, the period between the consequent fires is rather short, ca. 15–60 years. This was a much shorter period compared to the neighboring remote sites of central Siberia (fire return period longer than 100 years) that are less affected by anthropogenic influence.
Monitoring of wildfires in Russia is focused on forests, whereas the importance of tundra fires is underestimated. This is a major oversight which might have great economic consequences taking into account that tundra fires further decrease pasture areas for reindeer, already extremely overused in northwest Siberia (by 100 %–150 % on Yamal and Gydan peninsulas according to Matveev and Musaev, 2013). In our study sites, the fires burned half of the dry tundra (6000 km2) in 60 years. As concluded from our analysis, most of these areas likely shifted or will shift to woodlands and forests.
Converting the tundra to dark needle-leaved forest causes an energy balance shift where especially areas with spruce will have a positive (warming) feedback on climate in the future. A decrease in albedo causes an increase in energy input to the surface, and partitioning of energy shifts towards sensible heat flux at forested sites (Beringer et al., 2005).
On the positive side, an increase in forest areas provides a means for the enhancement of the carbon sink and accordingly also of CarbonSink+ (Kalliokoski et al., 2019). Overall, the importance of and need for detailed comprehensive long-term data is also obvious; therefore it is important to complete and verify satellite remote sensing data by observations – to establish Station for Measuring Ecosystem – Atmosphere Relations (SMEAR) (Kulmala, 2018) in northwest Siberia as a part of Pan-Eurasian Experiment (PEEX) activities (Kulmala et al., 2015; Lappalainen et al., 2016; Petäjä et al., 2020).
The geoportal “Nadym. Changes in 50 years (1968–2018)” (NC50), available at https://ageoportal.ipos-tmn.ru/nadym/, last access: 3 May 2020, aims to provide detailed geographical information on the study sites. There are three maps in geoportal NC50 (Fig. A1). The maps are synchronized, i.e., zooming or panning in one of the maps results in the same operation in the two other maps. Each map contains a pointer in the center.
- a.
Map 1 is constructed of Corona KH-4b imagery with marked study areas and reference sites. In the upper left corner, there are zoom instruments. In the upper right corner, there is a widget containing bookmarks of the reference sites. The reference sites are marked by yellow polygons in map 1.
- b.
Map 2 is constructed of super high-resolution imagery: Yandex.Maps, Bing Maps or Global Forest Watch. Fire-affected areas from different years can be overlain on this map. In addition, the field of map 2 can be used to check the vegetation change in the control points. In the upper right corner, there is a panel of map layers.
- c.
Map 3 can be used as a digital elevation map (ArcticDEM) or a topographic map. In the upper right corner, there is a panel of map layers and the coordinates of the pointer position (degrees–minutes–seconds). The coordinates in the decimal format are copied to the clipboard by a mouse click.
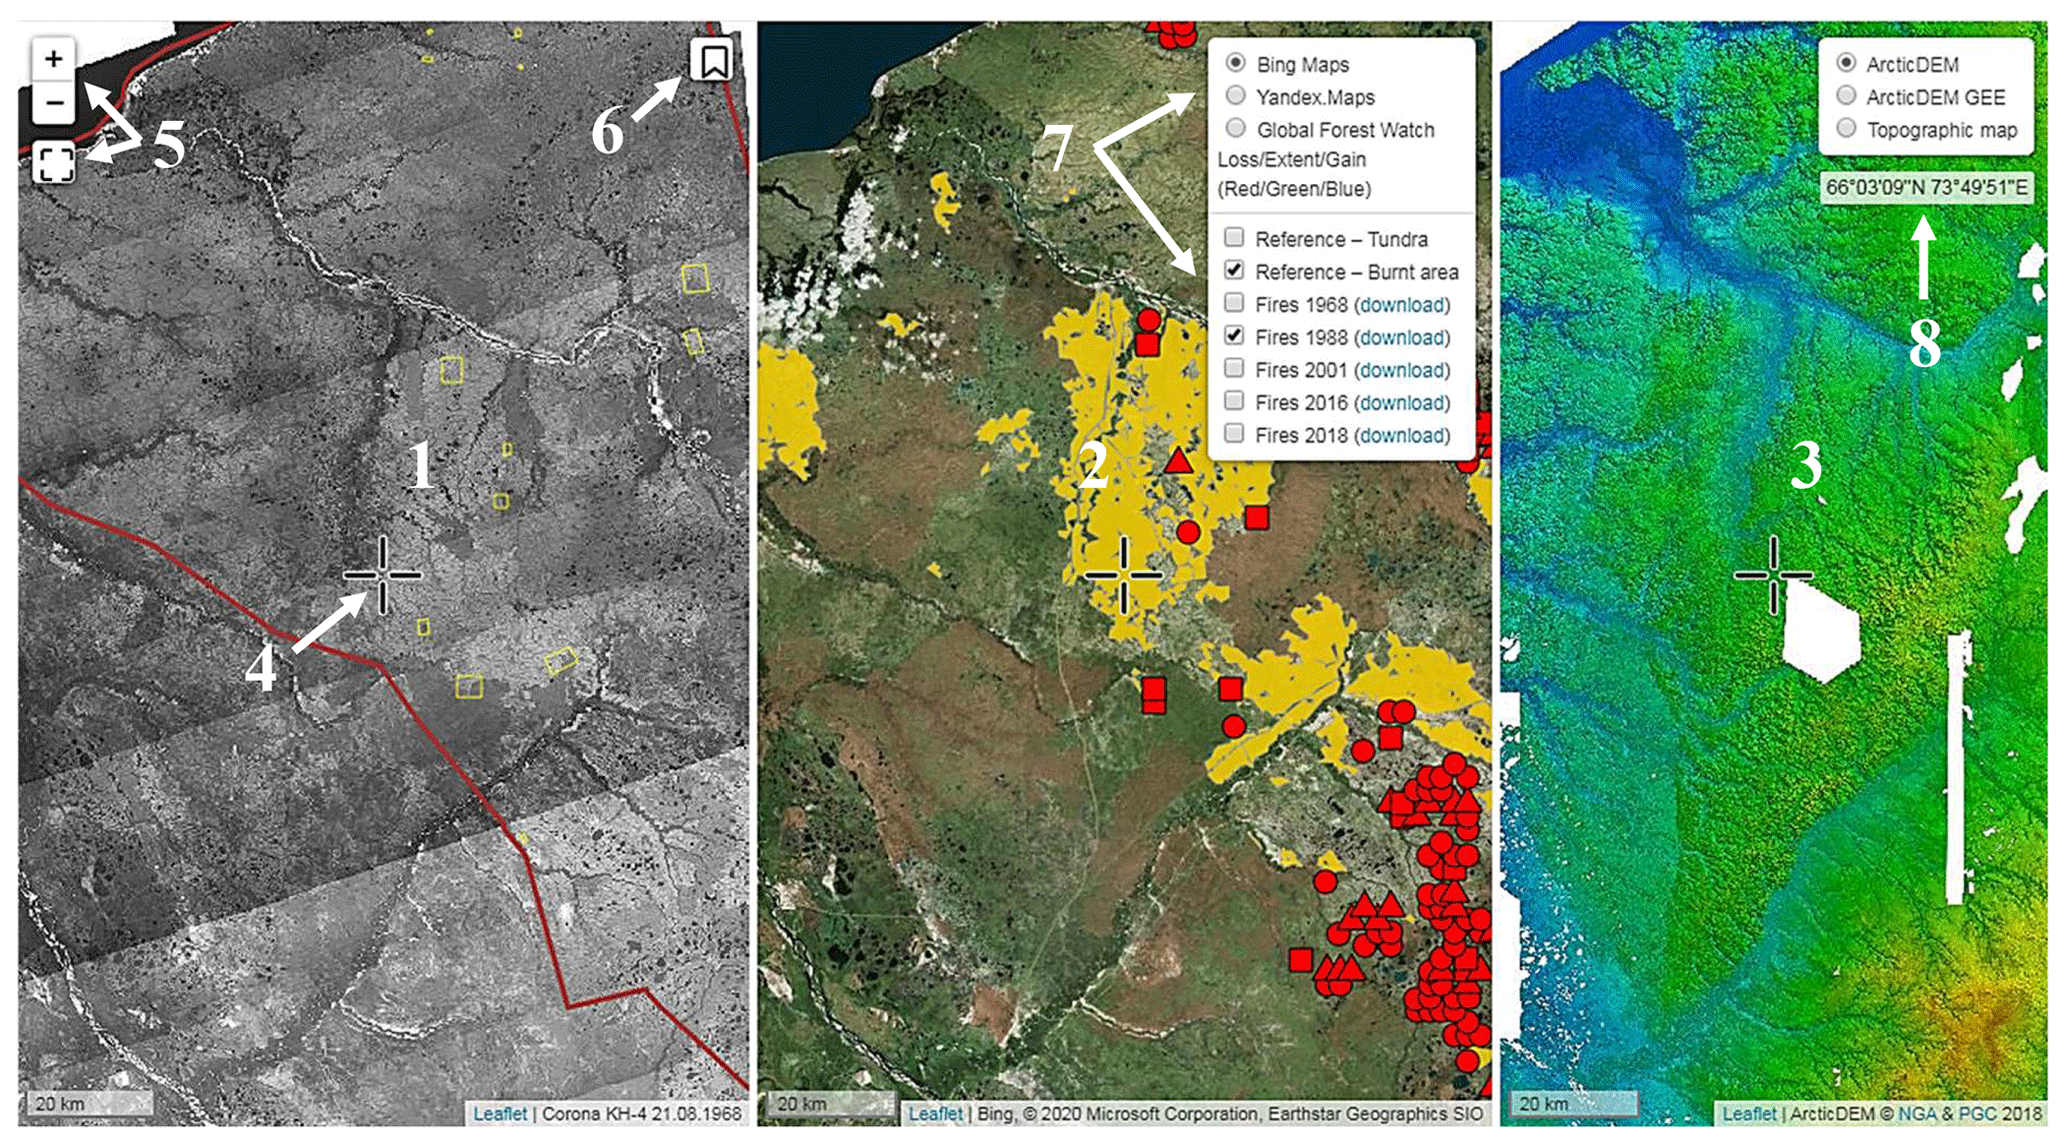
Figure A1Interface of geoportal NC50: (1) map 1; (2) map 2; (3) map 3; (4) map pointer; (5) zoom controls; (6) widget containing bookmarks of the reference sites; (7) panel of base maps and layers; (8) current coordinates.
In August 2019, a field campaign was performed near Pangody in the central part of study area 1 (Fig. 1) to study vegetation cover and the state of permafrost. We chose three sites: one in the non-disturbed area, one in the area burned before 1968, and one in the area burned in 1968 and 1988. Photos from two of them are shown in Fig. B1. The land cover of each site consisted mainly of mosses, grasses and shrubs (detailed classification is given in Table B1), and the major tree species were larch and spruce (Larix sibirica, Picea obovata). In the burned sites, birch (Betula pubescens) and pine (Pinus Sylvestris L., Pinus sibirica) were also observed.
The active layer thickness (the depth of annual thaw) was measured using a metal rod; the rod was pushed vertically into the ground until it reached frozen soil. The active layer thickness (ALT) for three sites is reported in Table B1.
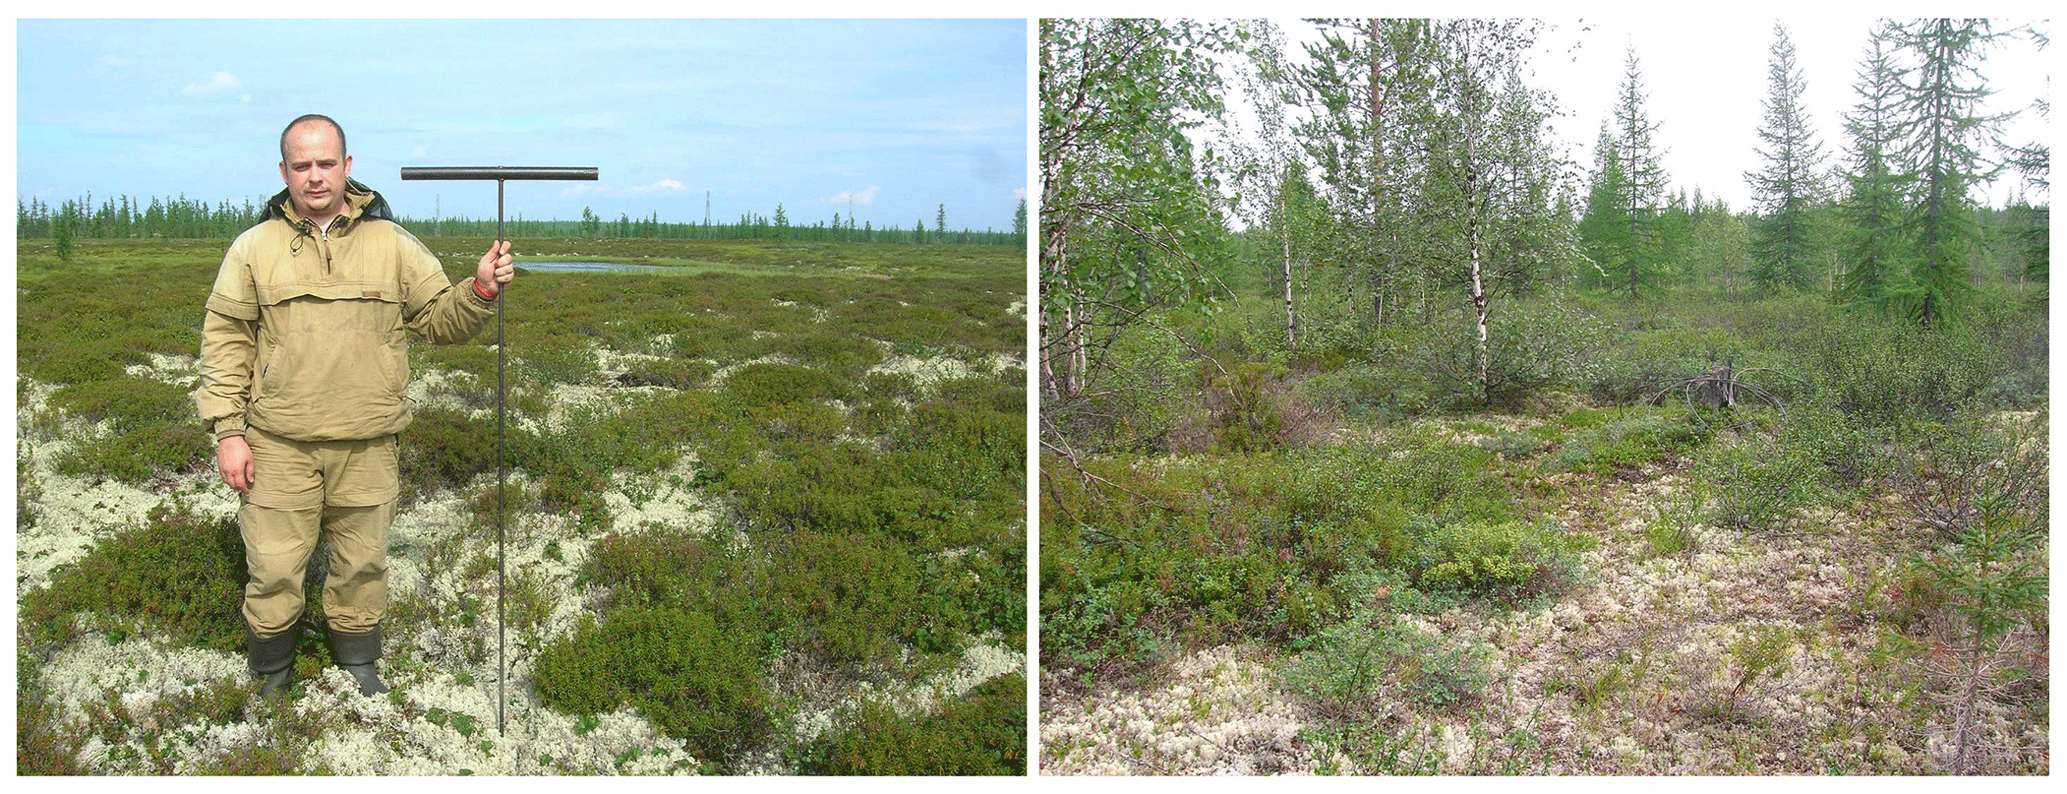
Figure B1Illustration of vegetation cover in the photos from the field campaign: the non-disturbed site (left panel) and the nearby site affected by fires before 1968 and 1988 (right panel).
Table B1Field observations of vegetation and active layer thickness.

Meteorological data are available on the following website: http://meteo.ru. (Bulygina et al., 2019) Study areas, reference sites, burned areas and control points for vegetation change can be found on the geoportal NC50 (https://ageoportal.ipos-tmn.ru/nadym/, Tsymbarovich and Sizov, 2020). Other data sets are available from the authors upon request.
The supplement related to this article is available online at: https://doi.org/10.5194/bg-18-207-2021-supplement.
EE, OS and KK designed and conceptualized the study. OS processed satellite data (mosaics, classification). OS and PT developed the geoportal, analyzed the data, prepared figures and interpreted results. NP and AS performed on-site data acquisition. EE analyzed data (meteo, NDVI), prepared figures, interpreted results and wrote the manuscript. KK interpreted results and contributed to writing and discussion. AS, KK, JB, TP, SZ and MK contributed with data interpretation and with reviewing and editing of the writing. All the authors commented on the manuscript.
The authors declare that they have no conflict of interest.
Ekaterina Ezhova and Tuukka Petäjä acknowledge the Academy of Finland Centres of Excellence program (grant no. 307331) and Belmont Forum project Arctic Community Resilience to Boreal Environmental change: Assessing Risks from fire and disease (ACRoBEAR) via the Academy of Finland, decision number 334792. Oleg Sizov and Andrey Soromotin were funded by the RFBR, research project 20-55-71004, and Belmont Forum project 1729 SERUS. Petr Tsymbarovich was funded by the Russian Science Foundation project 18-17-00178. Markku Kulmala acknowledges the Academy of Finland professor grant (no. 302958) and a ATM-GTP European Research Council grant under the European Union's Horizon 2020 research and innovation program (no. 742206). Oleg Sizov, Andrey Soromotin, Sergej Zilitinkevich and Jaana Bäck acknowledge bilateral collaboration supported by the Academy of Finland grant 314 798/799 and Russian Foundation for Basic Research grants 18-55-11005 and 19-17-00209. Tuukka Petäjä acknowledges funding through the Academy of Finland (Natural Secreted Nano Vesicles as a Source of Novel Biomass Products for Circular Economy, NANOBIOMASS, 307537) and the European Union's Horizon 2020 research and innovation program under grant agreement no. 689443 via the project iCUPE (Integrative and Comprehensive Understanding on Polar Environments). Kajar Köster was supported by the Academy of Finland (Academy Research Fellow project 294600).
This research has been supported by the Academy of Finland (grant nos. 334792, 302958, 314 798/799, 307537, 307331, 294600), the Russian Foundation for Basic Research (grant nos. 20-55-71004, 18-55-11005, 19-17-00209), the Russian Science Foundation (grant no. 18-17-00178) and the European Research Council (grant no. ATM-GTP (742206)).
Open-access funding was provided by the Helsinki University Library.
This paper was edited by Kirsten Thonicke and reviewed by two anonymous referees.
Aakala, T., Hari, P., Dengel, S., Newberry, S. L., Mizunuma, T., and Grace, J.: A prominent stepwise advance of the tree line in north-east Finland, J. Ecol., 102, 1582–1591, 2014. a
Barrett, K., Rocha, A. V., van de Weg, M. J., and Shaver, G.: Vegetation shifts observed in arctic tundra 17 years after fire, Remote Sens. Lett., 3, 729–736, 2012. a, b, c
Beringer, J., Chapin III, F. S., Thompson, C. C., and McGuire, A. D.: Surface energy exchanges along a tundra-forest transition and feedbacks to climate, Agr. Forest Meteorol., 131, 143–161, 2005. a
Bernes, C., Bråthen, K. A., Forbes, B. C., Speed, J. D., and Moen, J.: What are the impacts of reindeer/caribou (Rangifer tarandus L.) on arctic and alpine vegetation? A systematic review, Environ. Evid., 4, 1–26, https://doi.org/10.1186/s13750-014-0030-3, 2015. a
Bjorkman, A. D., Criado, M. G., Myers-Smith, I. H., Ravolainen, V., Jónsdóttir, I. S., Westergaard, K. B., Lawler, J. P., Aronsson, M., Bennett, B., Gardfjell, H., Heiðmarsson, S., Stewart, L., and Normand, S.: Status and trends in Arctic vegetation: Evidence from experimental warming and long-term monitoring, Ambio, 49, 678–692, 2020. a
Blaschke, T.: Object based image analysis for remote sensing, ISPRS J. Photogramm., 65, 2–16, 2010. a
Bonan, G. B.: A computer model of the solar radiation, soil moisture, and soil thermal regimes in boreal forests, Ecol. Model., 45, 275–306, 1989. a
Box, J. E., Colgan, W. T., Christensen, T. R., Schmidt, N. M., Lund, M., Parmentier, F.-J. W., Brown, R., Bhatt, U. S., Euskirchen, E. S., Romanovsky, V. E., Walsh, J. E., Overland, J. E., Wang, M., Corell, R. W., Meier, W. N., Wouters, B., Mernild, S., Mård, J., Pawlak, J., and Olsen, M. S.: Key indicators of Arctic climate change: 1971–2017, Environ. Res. Lett., 14, 045010, https://doi.org/10.1088/1748-9326/aafc1b, 2019. a
Bret-Harte, M. S., Mack, M. C., Shaver, G. R., Huebner, D. C., Johnston, M., Mojica, C. A., Pizano, C., and Reiskind, J. A.: The response of Arctic vegetation and soils following an unusually severe tundra fire, Philos. T. R. Soc. B, 368, 20120490, https://doi.org/10.1098/rstb.2012.0490, 2013. a
Bulygina, O. N., Veselov, V. M., Razuvaev, V. N., and Aleksandrova, T. M.: Description of the data set on the main meteorological parameters at the stations in Russia, available at: http://meteo.ru, last access: 10 July 2019.
Camac, J. S., Williams, R. J., Wahren, C.-H., Hoffmann, A. A., and Vesk, P. A.: Climatic warming strengthens a positive feedback between alpine shrubs and fire, Glob. Change Biol., 23, 3249–3258, 2017. a
Chekunova, V. S.: Geological and geomorphological survey of a part of the lower reaches of the Nadym River basin and parts of the right bank of the Nadym Ob River, VSEGEI, Leningrad, 74 pp., 1954. a
Chorley, R. J.: Introduction to physical hydrology, London: Methuen, 1971. a
Frost, G. V. and Epstein, H. E.: Tall shrub and tree expansion in Siberian tundra ecotones since the 1960s, Glob. Change Biol., 20, 1264–1277, 2014. a, b, c
Hansen, M. C., Potapov, P. V., Moore, R., Hancher, M., Turubanova, S. A., Tyukavina, A., Thau, D., Stehman, S., Goetz, S. J., Loveland, T. R., Kommareddy, A., Egorov, A., Chini, L., Justice, C. O., and Townshend, J. R. G.: High-resolution global maps of 21st-century forest cover change, Science, 342, 850–853, 2013. a
Harsch, M. A. and Bader, M. Y.: Treeline form–a potential key to understanding treeline dynamics, Global Ecol. Biogeogr., 20, 582–596, 2011. a
Ilyina, I. S., Lapshina, E. I., and Lavrenko, N. N.: West Siberian Plain Vegetation Cover, Novosibirsk, Nauka, 251 pp., 1985. a, b, c, d, e
Johansen, B. and Tømmervik, H.: The relationship between phytomass, NDVI and vegetation communities on Svalbard, Int. J. Appl. Earth. Obs., 27, 20–30, 2014. a
Joly, K., Jandt, R. R., and Klein, D. R.: Decrease of lichens in Arctic ecosystems: the role of wildfire, caribou, reindeer, competition and climate in north-western Alaska, Polar Res., 28, 433–442, 2009. a
Jones, B. M., Breen, A. L., Gaglioti, B. V., Mann, D. H., Rocha, A. V., Grosse, G., Arp, C. D., Kunz, M. L., and Walker, D. A.: Identification of unrecognized tundra fire events on the north slope of Alaska, J. Geophys. Res.-Biogeo., 118, 1334–1344, 2013. a
Kalliokoski, T., Aalto, T., Bäck, J., Ezhova, E., Franz, D., Haapanala, S., Juurola, E., Kerminen, V.-M., Kolari, P., Kulmala, L., Liski, J., Mammarella, I., Matkala, L., Petäjä, T., Rantala, P., Vesala., T., and Kulmala, M.: Carbon sink and CarbonSink+: from observations to global potential, University of Helsinki, Helsinki, 77 pp., 2019. a, b
Kaplan, J. O. and New, M.: Arctic climate change with a 2 ∘C global warming: Timing, climate patterns and vegetation change, Climatic Change, 79, 213–241, 2006. a
Katsov, V., Semenov, S., Alekseev, G., Ananicheva, M. D., Anisimov, O. A., Ashik, I. M., Bardin, M. Y., Bogdanova, E. M., Bulygina, O. N., Georgievsky, V. Y., Gruza, G. V., Danilov, A. I., Eremina, T. R., Zolotokrylin, A. N., Karol, I. L., Korzukhin, M. D., Kostianoy, A. G., Krenke, A. N., Lobanov. V. B., Malkova, G. V., Meleshko. V. P., Mescherskaya, A. V., Pavlova. V. N., Pavlova T. V., Popova, E. N., Rankova, E. Y., Revich, B. A., Romanovskaya, A. A., Sporyshev, P. V., Stadnik, V. V., Khlebnikova, E. I., Shalygin, A. L., Sherstyukov, B. G., Shkolnik, I. M., and Yasukevich, V.V.: Second Roshydromet Assessment Report on Climate Change and its Consequences in the Russian Federation, Moscow, Roshydromet, 2014. a, b
Kharuk, V. I., Ranson, K. J., Dvinskaya, M. L., and Im, S. T.: Wildfires in northern Siberian larch dominated communities, Environ. Res. Lett., 6, 045208, https://doi.org/10.1088/1748-9326/6/4/045208, 2011. a, b
Köster, E., Köster, K., Aurela, M., Laurila, T., Berninger, F., Lohila, A., and Pumpanen, J.: Impact of reindeer herding on vegetation biomass and soil carbon content: a case study from Sodankylä, Finland, Boreal Environ. Res., 18, 35–42, 2013. a
Köster, E., Köster, K., Berninger, F., Prokushkin, A., Aaltonen, H., Zhou, X., and Pumpanen, J.: Changes in fluxes of carbon dioxide and methane caused by fire in Siberian boreal forest with continuous permafrost, J. Environ. Manage., 228, 405–415, 2018. a
Kukkonen, I. T., Suhonen, E., Ezhova, E., Lappalainen, H., Gennadinik, V., Ponomareva, O., Gravis, A., Miles, V., Kulmala, M., Melnikov, V., and Drozdov, D.: Observations and modelling of ground temperature evolution in the discontinuous permafrost zone in Nadym, north-west Siberia, Permafrost Periglac., 31, 264–280, 2020. a, b
Kulmala, M.: Build a global Earth observatory, Nature, 553, 21–23, 2018. a
Kulmala, M., Nieminen, T., Chellapermal, R., Makkonen, R., Bäck, J., and Kerminen, V.-M.: Climate feedbacks linking the increasing atmospheric CO2 concentration, BVOC emissions, aerosols and clouds in forest ecosystems, in: Biology, controls and models of tree volatile organic compound emissions, pp. 489–508, Springer, Dordrecht Heidelberg New York London, 2013. a
Kulmala, M., Lappalainen, H. K., Petäjä, T., Kurten, T., Kerminen, V.-M., Viisanen, Y., Hari, P., Sorvari, S., Bäck, J., Bondur, V., Kasimov, N., Kotlyakov, V., Matvienko, G., Baklanov, A., Guo, H. D., Ding, A., Hansson, H.-C., and Zilitinkevich, S.: Introduction: The Pan-Eurasian Experiment (PEEX) multidisciplinary, multiscale and multicomponent research and capacity-building initiative, Atmos. Chem. Phys., 15, 13085–13096, https://doi.org/10.5194/acp-15-13085-2015, 2015. a
Kulmala, M., Ezhova, E., Kalliokoski, T., Noe, S., Vesala, T., Lohila, A., Liski, J., Makkonen, R., Bäck, J., Petäjä, T., and Kerminen, V.-M.: CarbonSink+ – Accounting for multiple climate feedbacks from forests, Boreal Environ. Res., 25, 145–159, 2020. a
Landhausser, S. M. and Wein, R. W.: Postfire vegetation recovery and tree establishment at the Arctic treeline: climate-change-vegetation-response hypotheses, J. Ecol., pp. 665–672, 1993. a, b, c, d, e
Lantz, T. C., Marsh, P., and Kokelj, S. V.: Recent shrub proliferation in the Mackenzie Delta uplands and microclimatic implications, Ecosystems, 16, 47–59, 2013. a
Lappalainen, H. K., Kerminen, V.-M., Petäjä, T., Kurten, T., Baklanov, A., Shvidenko, A., Bäck, J., Vihma, T., Alekseychik, P., Andreae, M. O., Arnold, S. R., Arshinov, M., Asmi, E., Belan, B., Bobylev, L., Chalov, S., Cheng, Y., Chubarova, N., de Leeuw, G., Ding, A., Dobrolyubov, S., Dubtsov, S., Dyukarev, E., Elansky, N., Eleftheriadis, K., Esau, I., Filatov, N., Flint, M., Fu, C., Glezer, O., Gliko, A., Heimann, M., Holtslag, A. A. M., Hõrrak, U., Janhunen, J., Juhola, S., Järvi, L., Järvinen, H., Kanukhina, A., Konstantinov, P., Kotlyakov, V., Kieloaho, A.-J., Komarov, A. S., Kujansuu, J., Kukkonen, I., Duplissy, E.-M., Laaksonen, A., Laurila, T., Lihavainen, H., Lisitzin, A., Mahura, A., Makshtas, A., Mareev, E., Mazon, S., Matishov, D., Melnikov, V., Mikhailov, E., Moisseev, D., Nigmatulin, R., Noe, S. M., Ojala, A., Pihlatie, M., Popovicheva, O., Pumpanen, J., Regerand, T., Repina, I., Shcherbinin, A., Shevchenko, V., Sipilä, M., Skorokhod, A., Spracklen, D. V., Su, H., Subetto, D. A., Sun, J., Terzhevik, A. Y., Timofeyev, Y., Troitskaya, Y., Tynkkynen, V.-P., Kharuk, V. I., Zaytseva, N., Zhang, J., Viisanen, Y., Vesala, T., Hari, P., Hansson, H. C., Matvienko, G. G., Kasimov, N. S., Guo, H., Bondur, V., Zilitinkevich, S., and Kulmala, M.: Pan-Eurasian Experiment (PEEX): towards a holistic understanding of the feedbacks and interactions in the landatmosphereoceansociety continuum in the northern Eurasian region, Atmos. Chem. Phys., 16, 14421–14461, https://doi.org/10.5194/acp-16-14421-2016, 2016. a
MacDonald, G., Kremenetski, K., and Beilman, D.: Climate change and the northern Russian treeline zone, Philos. T. R. Soc. B, 363, 2283–2299, 2008. a
Maliniemi, T., Kapfer, J., Saccone, P., Skog, A., and Virtanen, R.: Long-term vegetation changes of treeless heath communities in northern Fennoscandia: Links to climate change trends and reindeer grazing, J. Veg. Sci., 29, 469–479, 2018. a
Matveev, A. A. and Musaev, R. A.: Preservation of the ecological balance in the context of the economic development of Yamal-Nenets Autonomous district, in: Proceedings of the international conference “Economy and modern Management: Theory and Practice”, p. 33436, Novosibirsk, 2013. a
Matyshak, G., Bogatyrev, L., Goncharova, O. Y., and Bobrik, A.: Specific features of the development of soils of hydromorphic ecosystems in the northern taiga of Western Siberia under conditions of cryogenesis, Eurasian Soil Sci., 50, 1115–1124, 2017a. a
Matyshak, G., Goncharova, O. Y., Moskalenko, N., Walker, D., Epstein, H., and Shur, Y.: Contrasting soil thermal regimes in the Forest-tundra transition near Nadym, West Siberia, Russia, Permafrost Periglac., 28, 108–118, 2017b. a, b
Mekonnen, Z. A., Riley, W. J., Randerson, J. T., Grant, R. F., and Rogers, B. M.: Expansion of high-latitude deciduous forests driven by interactions between climate warming and fire, Nat. Plants, 5, 952–958, 2019. a
Miles, V. V. and Esau, I.: Spatial heterogeneity of greening and browning between and within bioclimatic zones in northern West Siberia, Environ. Res. Lett., 11, 115002, https://doi.org/10.1088/1748-9326/11/11/115002, 2016. a
Myers-Smith, I. H. and Hik, D. S.: Climate warming as a driver of tundra shrubline advance, J. Ecol., 106, 547–560, 2018. a
Myers-Smith, I. H., Grabowski, M. M., Thomas, H. J., Angers-Blondin, S., Daskalova, G. N., Bjorkman, A. D., Cunliffe, A. M., Assmann, J. J., Boyle, J. S., McLeod, E., McLeod, S., Joe, R., Lennie, P., Arey, D., Gordon, R., and Eckert, C.: Eighteen years of ecological monitoring reveals multiple lines of evidence for tundra vegetation change, Ecol. Monogr., 89, e01351, https://doi.org/10.1002/ecm.1351, 2019. a
Myers-Smith, I. H., Kerby, J. T., Phoenix, G. K., Bjerke, J. W., Epstein, H. E., Assmann, J. J., John, C., Andreu-Hayles, L., Angers-Blondin, S., Beck, P. S. A., Berner, L. T., Bhatt, U. S., Bjorkman, A. D., Blok, D., Bryn, A., Christiansen, C. T., Cornelissen, J. H. C., Cunliffe, A. M., Elmendorf, S. C., Forbes, B. C., Goetz, S. J., Hollister, R. D., de Jong, R., Loranty, M. M., Macias-Fauria, M., Maseyk, K., Normand, S., Olofsson, J., Parker, T. C., Parmentier, F. J. W., Post, E., Schaepman-Strub, G., Stordal, F., Sullivan, P. F., Thomas, H. J. D., Tømmervik, H., Treharne, R., Tweedie, C. E., Walker, D. A., Wilmking, M., and Wipf, S.: Complexity revealed in the greening of the Arctic, Nat. Clim. Change, 10, 106–117, 2020. a
Narita, K., Harada, K., Saito, K., Sawada, Y., Fukuda, M., and Tsuyuzaki, S.: Vegetation and permafrost thaw depth 10 years after a tundra fire in 2002, Seward Peninsula, Alaska, Arc. Antarct. Alp. Res., 47, 547–559, 2015. a, b, c, d
Olofsson, J., Oksanen, L., Callaghan, T., Hulme, P. E., Oksanen, T., and Suominen, O.: Herbivores inhibit climate-driven shrub expansion on the tundra, Glob. Change Biol., 15, 2681–2693, 2009. a
Petäjä, T., Ganzei, K., Lappalainen, H. K., Tabakova, K., Makkonen, R., Räisänen, J., Chalov, S., Kulmala, M., Zilitinkevich, S., Baklanov, P., Shakirov, R. B., Mishina, N. V.and Egidarev, E. G., and Kondrat'ev, I. I.: Research agenda for the Russian Far East and utilization of multi-platform comprehensive environmental observations, Int. J. Digit. Earth, 1–27, https://doi.org/10.1080/17538947.2020.1826589, 2020. a
Ponomarev, E. I., Kharuk, V. I., and Ranson, K. J.: Wildfires dynamics in Siberian larch forests, Forests, 7, 125, https://doi.org/10.3390/f7060125, 2016. a
Post, E. and Pedersen, C.: Opposing plant community responses to warming with and without herbivores, P. Natl. Acad. Sci. USA, 105, 12353–12358, 2008. a
Priestley, C. H. B. and Taylor, R.: On the assessment of surface heat flux and evaporation using large-scale parameters, Mon. Weather Rev., 100, 81–92, 1972. a
Pulliainen, J., Aurela, M., Laurila, T., Aalto, T., Takala, M., Salminen, M., Kulmala, M., Barr, A., Heimann, M., Lindroth, A., Laaksonen, A., Derksen, C., Mäkelä, A., Markkanen, T., Lemmetyinen, J., Susiluoto, J., Dengel, S., Mammarella, I., Tuovinen, J. P., and Vesala, T.: Early snowmelt significantly enhances boreal springtime carbon uptake, P. Natl. Acad. Sci. USA, 114, 11081–11086, 2017. a
Renwick, K. M. and Rocca, M. E.: Temporal context affects the observed rate of climate-driven range shifts in tree species, Global Ecol. Biogeogr., 24, 44–51, 2015. a
Rocha, A. V. and Shaver, G. R.: Postfire energy exchange in arctic tundra: the importance and climatic implications of burn severity, Glob. Change Biol., 17, 2831–2841, 2011. a
Ruffner, K. C.: Corona: America's first satellite program, History Staff, Center for the Study of Intelligence, Central Intelligence Agency, Washington, DC, 1995. a, b
Sand, M., Berntsen, T., von Salzen, K., Flanner, M., Langner, J., and Victor, D. G.: Response of Arctic temperature to changes in emissions of short-lived climate forcers, Nat. Clim. Change, 6, 286–289, 2016. a
Sannikov, S.: Survival and growth of seedlings of conifer species in different types of micro-environment on felled areas, Ekologiya, Vol. 1, 60–68, 1970. a
Sizov, O. S. and Lobotrosova, S. A.: Features of revegetation of sand blowout sites in the northern taiga subzone of Western Siberia, Earth Cryosphere, Vol. 3, XX, 3–13, 2016. a
Tchebakova, N. M., Monserud, R. A., and Nazimova, D. I.: A Siberian vegetation model based on climatic parameters, Can. J. Forest Res., 24, 1597–1607, 1994. a, b, c, d
Tchebakova, N. M., Parfenova, E. I., and Soja, A. J.: Potential climate-induced vegetation change in Siberia in the twenty-first century, in: Environmental Change in Siberia, Springer, Dordrecht, 67–82, 2010. a, b
Trofimova, I. E. and Balybina, A. S.: Regionalization of the West Siberian Plain from thermal regime of soils, Geogr. Nat. Res., 36, 234–244, 2015. a
Tsymbarovich, P. and Sizov, O.: Geoportal “Nadym. Changes in 50 years (1968–2018)” (NC50), available at: https://ageoportal.ipos-tmn.ru/nadym, last access: 3 May 2020.
Van Bogaert, R., Haneca, K., Hoogesteger, J., Jonasson, C., De Dapper, M., and Callaghan, T. V.: A century of tree line changes in sub-Arctic Sweden shows local and regional variability and only a minor influence of 20th century climate warming, J. Biogeogr., 38, 907–921, 2011. a
Vermote, E., Justice, C., Claverie, M., and Franch, B.: Preliminary analysis of the performance of the Landsat 8/OLI land surface reflectance product, Remote Sens. Environ., 185, 46–56, 2016. a
Walker, D., Epstein, H., Jia, G., Balser, A., Copass, C., Edwards, E., Gould, W., Hollingsworth, J., Knudson, J., Maier, H., Moody, A., and Raynolds K.: Phytomass, LAI, and NDVI in northern Alaska: Relationships to summer warmth, soil pH, plant functional types, and extrapolation to the circumpolar Arctic, J. Geophys. Res.-Atmos., 108, 2003. a
Walker, D. A., Raynolds, M. K., Daniëls, F. J., Einarsson, E., Elvebakk, A., Gould, W. A., Katenin, A. E., Kholod, S. S., Markon, C. J., Melnikov, E. S., Moskalenko, N. G., Talbot, S., and Yurtsev, B. A.: The circumpolar Arctic vegetation map, J. Veg. Sci., 16, 267–282, 2005. a
Walvoord, M. A., Voss, C. I., Ebel, B. A., and Minsley, B. J.: Development of perennial thaw zones in boreal hillslopes enhances potential mobilization of permafrost carbon, Environ. Res. Lett., 14, 015003, https://doi.org/10.1088/1748-9326/aaf0cc, 2019. a
Woodward, F. I., Lomas, M. R., and Kelly, C. K.: Global climate and the distribution of plant biomes, Philos. T. R. Soc. B, 359, 1465–1476, 2004. a
Wulder, M. A., Loveland, T. R., Roy, D. P., Crawford, C. J., Masek, J. G., Woodcock, C. E., Allen, R. G., Anderson, M. C., Belward, A. S., Cohen, W. B., Dwyer, J., Erb, A., Gao, F., Griffiths, P., Helder, D., Hermosilla, T., Hipple, J.D., Hostert, P., Hughes, M. J., Huntington, J., Johnson, D. M., Kennedy, R., Kilic, A., Li, Z., Lymburner, L., McCorkel, J., Pahlevan, N., Scambos, T.A., Schaaf, C., Schott, J. R., Sheng, Y., Storey, J., Vermote, E., Vogelmann, J., White, J. C., Wynne, R. H., and Zhu, Z.: Current status of Landsat program, science, and applications, Remote Sens. Environ., 225, 127–147, 2019. a
Zhu, K., Woodall, C. W., and Clark, J. S.: Failure to migrate: lack of tree range expansion in response to climate change, Glob. Change Biol., 18, 1042–1052, 2012. a
- Abstract
- Introduction
- Materials and methods
- Results
- Discussion
- Conclusions
- Appendix A: Description of geoportal “Nadym. Changes in 50 years (1968–2018)” (NC50)
- Appendix B: In situ observations of vegetation and permafrost state
- Code and data availability
- Author contributions
- Competing interests
- Acknowledgements
- Financial support
- Review statement
- References
- Supplement