the Creative Commons Attribution 4.0 License.
the Creative Commons Attribution 4.0 License.
 | 13 Apr 2021
Modern silicon dynamics of a small high-latitude subarctic lake
Carolina Olid
Johanna Stadmark
Sherilyn C. Fritz
Sophie Opfergelt
Daniel J. Conley
High biogenic silica (BSi) concentrations occur sporadically in lake sediments throughout the world; however, the processes leading to high BSi concentrations vary. We explored the factors responsible for the high BSi concentration in sediments of a small, high-latitude subarctic lake (Lake 850). The Si budget of this lake had not been fully characterized before to establish the drivers of BSi accumulation in this environment. To do this, we combined measurements of variations in stream discharge, dissolved silica (DSi) concentrations, and stable Si isotopes in both lake and stream water with measurements of BSi content in lake sediments. Water, radon, and Si mass balances revealed the importance of groundwater discharge as a main source of DSi to the lake, with groundwater-derived DSi inputs 3 times higher than those from ephemeral stream inlets. After including all external DSi sources (i.e., inlets and groundwater discharge) and estimating the total BSi accumulation in the sediment, we show that diatom production consumes up to 79 % of total DSi input. Additionally, low sediment accumulation rates were observed based on the dated gravity core. Our findings thus demonstrate that groundwater discharge and low mass accumulation rate can account for the high BSi accumulation during the last 150 cal yr BP. Globally, lakes have been estimated to retain one-fifth of the annual DSi terrestrial weathering flux that would otherwise be delivered to the ocean. Well-constrained lake mass balances, such as presented here, bring clarity to those estimates of the terrestrial Si cycle sinks.
- Article
(5007 KB) - Full-text XML
-
Supplement
(2627 KB) - BibTeX
- EndNote


Diatoms – unicellular golden-brown algae – are found worldwide in all aquatic environments, wetlands, and soils (Battarbee et al., 2002; Clarke, 2003). Diatoms take up dissolved silicic acid, H4SiO4, expressed here as dissolved silica (DSi), and build their shells in the form of amorphous silica, also known as biogenic silica (BSi). Diatom production is thus a crucial component in the global Si cycle (Tréguer and De La Rocha, 2013). Massive accumulations of fossil diatom frustules in sediments have been observed in multiple lakes situated in silicon-rich environments, especially on volcanic bedrock, such as Lake Challa, Tanzania–Kenya (Barker et al., 2013), or in hydrothermally active areas, such as Yellowstone Lake, US (Theriot et al., 2006), or Lake Mývatn, Iceland (Opfergelt et al., 2011). However, lakes without volcanism can also accumulate high concentrations of BSi in the sediment (Frings et al., 2014). One example is high-elevation and high-latitude lakes, where BSi concentrations as high as 60 weight percent (wt %) of SiO2 have been found (Frings et al., 2014; Rosén et al., 2010). In addition, high BSi concentrations in sediment have been observed in Lough Neagh, Northern Ireland (Plunkett et al., 2004); Lake Baikal (Swann and Mackay, 2006); Lake Edward (Russell and Johnson, 2005); and Lake Malawi (Johnson et al., 2011). The processes responsible for the diatom-rich sediment formation in these non-volcanic settings, however, are poorly understood.
High BSi accumulation in sediment has been hypothesized to require sufficient DSi in the water column for diatoms to grow and low detrital input to minimize dilution of autochthonous BSi (Conger, 1942). DSi ultimately originates from weathering of bedrock, and it is transported by rivers through the environment where it can be removed by biological or chemical processes, such as secondary clay mineral formation or amorphous silica precipitation (Jenny, 1941). DSi concentrations in the environment are influenced by factors such as vegetation type (Jenny, 1941; Leng et al., 2009; Struyf et al., 2010) and bedrock type (Jenny, 1941; Opfergelt and Delmelle, 2012) and indirectly by climate forcing (Fortin and Gajewski, 2009; Jenny, 1941) or watershed geomorphology (Jenny, 1941). In particular, attention has been paid to the relative importance of groundwater discharge as a main source of DSi for a few lakes, such as Lake O'Hara, British Columbia (Hood et al., 2006); Lake Mývatn, Iceland (Opfergelt et al., 2011); Crystal Lake, Wisconsin (Kenoyer and Anderson, 1989; Hurley et al., 1985); at the mouth of the Changjiang river system, China (Zhang et al., 2020); and in Canadian and Siberian rivers (Maavara et al., 2018; Pokrovsky et al., 2013). However, the significance of groundwater discharge is still often overlooked in studies about Si dynamics in lakes.
The contribution of groundwater to the lake Si cycle can be evaluated using Si isotopes. Stable Si isotopes are used to trace variation in DSi sources or diatom production and discern processes affecting BSi accumulation in lake sediments. Among the three stable isotopes (28Si, 29Si and 30Si) diatoms preferentially take up the lighter 28Si (De La Rocha et al., 1997). Diatoms tend to fractionate the Si isotopes with a fractionation factor of −1.1 ‰ (De La Rocha et al., 1997), which means that the diatom BSi will have an isotopically lighter ratio compared to the source DSi. Riverine DSi usually shows isotopically heavier ratios compared to groundwater, as there are more processes that fractionate Si isotopes during river transport (Frings et al., 2016; Opfergelt and Delmelle, 2012; Sutton et al., 2018). Therefore, stable Si isotopes are an ideal tracer for the contribution of groundwater.
Here, we investigate the diatom-rich sediment formation in Lake 850 through water and silicon mass balances. Lake 850, northernmost Sweden, is an ideal case study with a high content of BSi in the sediment, ca. 40 wt % (Rosén et al., 2010). Oxygen isotopes from diatoms suggested that the lake's isotopic ratio is mostly influenced by summer precipitation and variations in the ephemeral inlet streams (Shemesh et al., 2001). Unlike previous studies in this lake, we hypothesize that groundwater discharge is an important mechanism controlling lake DSi concentrations. To test this hypothesis, we estimate groundwater flows discharging into the lake using a water and a radon (222Rn) mass balance. DSi concentration and stable Si isotope mass balances were used to determine Si sources for the diatom-rich sediment deposited in recent decades.
Lake 850 (68∘15′ N, 19∘07′ E) is located 14 km southeast from the Abisko Research Station (388 m a.s.l.), northern Sweden. From 1913 to 2019, the mean annual surface atmospheric temperature was −0.4 ∘C, whereas during the study years (2018–2019) the mean annual temperature was 0.03 ∘C. Further, the mean surface atmospheric temperature during the aquatic growing season in 2018–2019 (June to August) was 10.1 ∘C (1 SD = 2.8 ∘C), and the long-term (1913–2019) mean summer temperature was 9.8 ∘C (1 SD = 3.6 ∘C) (ANS, 2020). During the ice-free period direct surface precipitation contribution from the watershed was estimated from the mean precipitation of 48 mm month−1 (ANS, 2020). Lake 850 lies above the tree limit (600 m a.s.l) at 850 m a.s.l. The lake surface area is 0.02 km2, with a maximum depth of 8 m and a catchment area of 0.35 km2 (Rubensdotter and Rosqvist, 2003). The lake's deep basin represents 48 % of the lake surface area. The underlying bedrock is composed of granites and syenites and is overlain by a thin layer of till. The catchment vegetation is comprised of Arctic species of mosses, grasses, and shrubs (Shemesh et al., 2001). There are two ephemeral inlets (max 6 cm deep) in the eastern part of the lake and one outlet (10 cm deep) in the western part (Fig. 1, Table S1). In addition to streams, additional sources of water to rivers and lakes can be snow patches or inputs of groundwater (Pienitz et al., 2008). From mid-October until late May–early June, the lake is ice-covered. The catchment is snow-covered from mid-September to mid-June. In August, the lake is well-mixed, with no thermal stratification. The lake is classified as oligotrophic and has a pH of 6.8 and a dissolved organic carbon concentration of 2.3 mg L−1 (Shemesh et al., 2001).
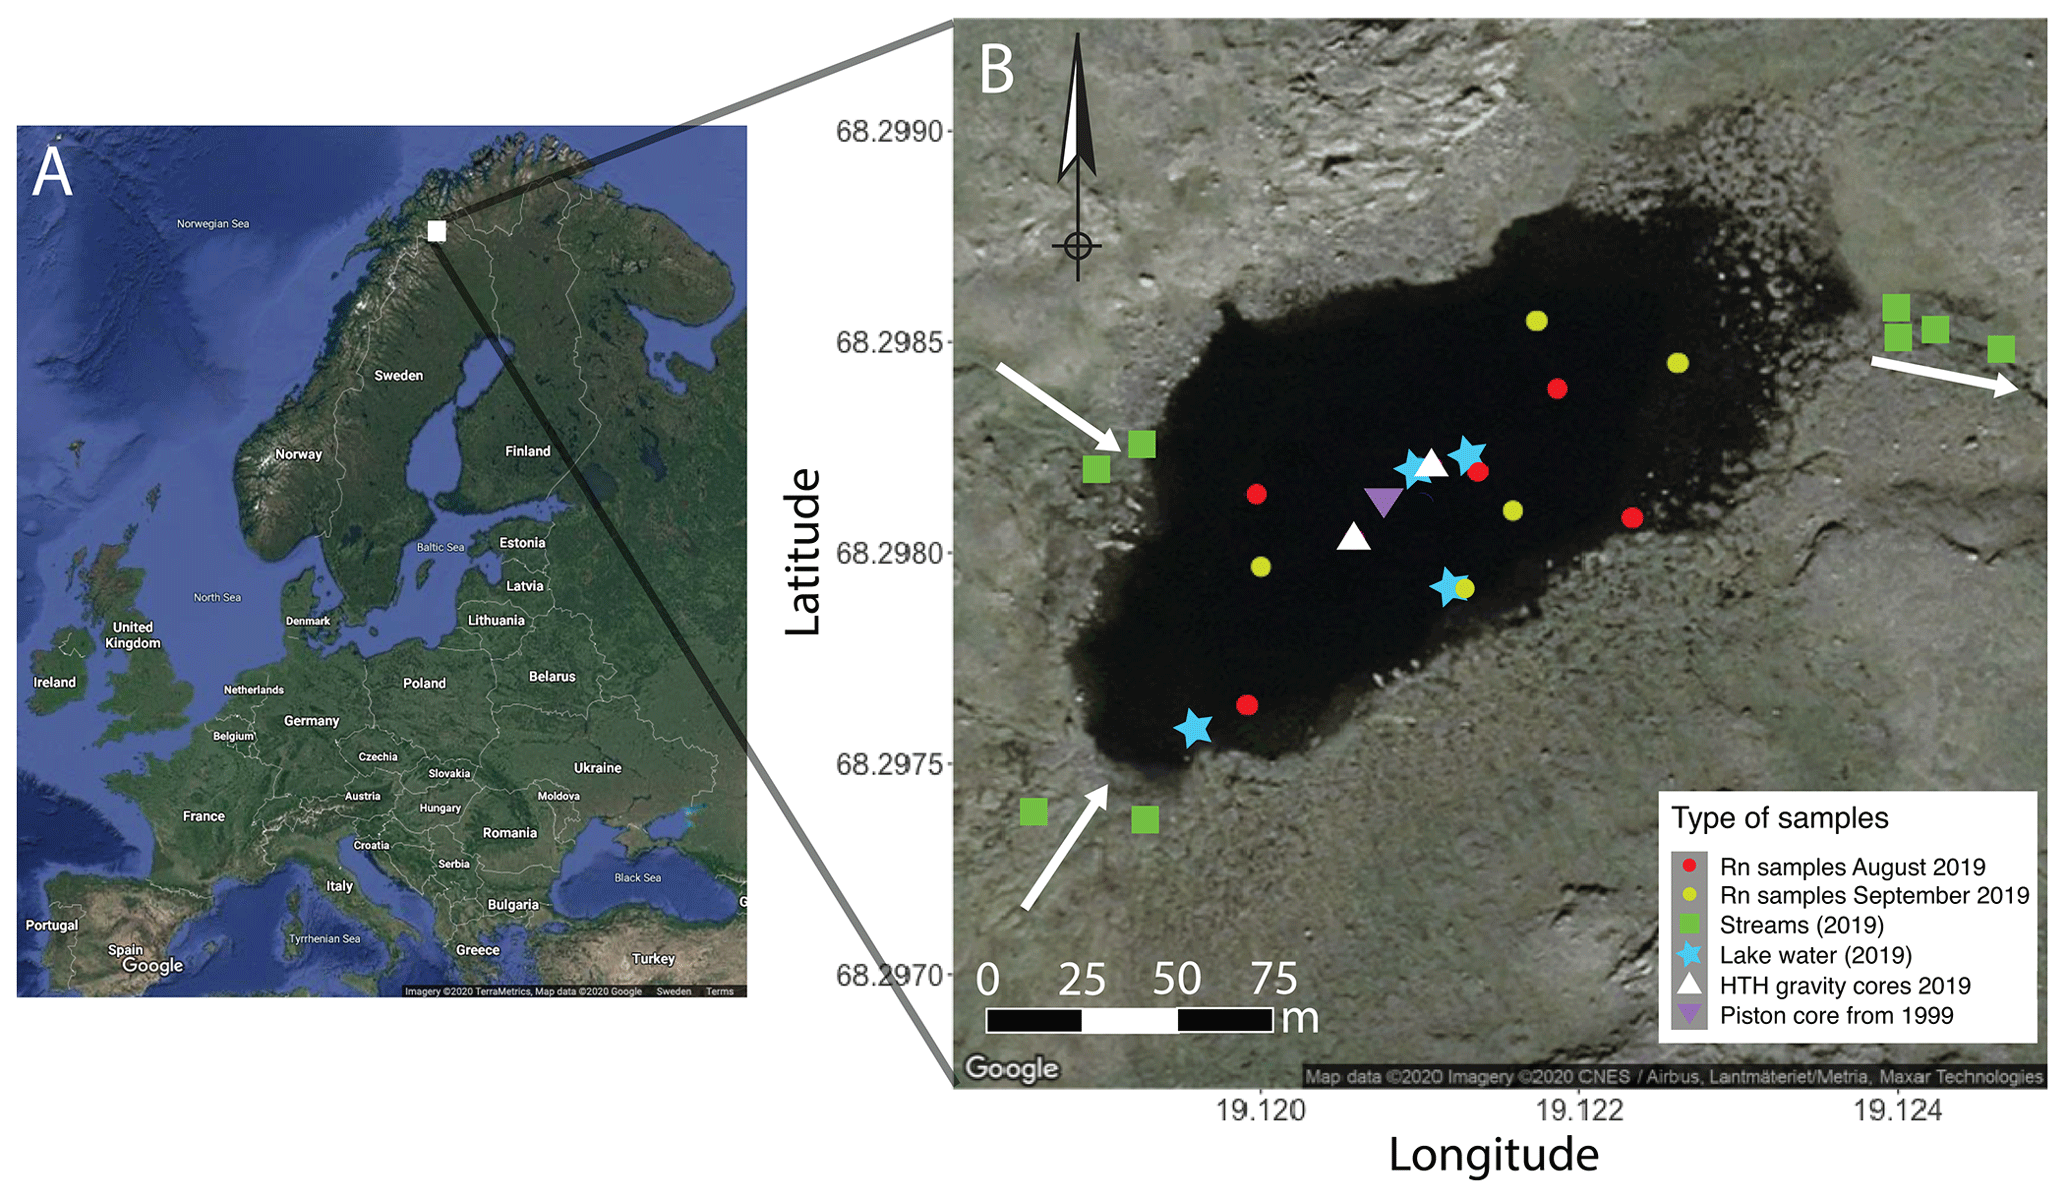
Figure 1Sampling sites of Lake 850 (northern Sweden). Inlets and outlet streams are signified by white arrows. Plotted in R using the package ggmaps (Kahle and Wickham, 2013) and modified.
3.1 Radon mass balance
Radon (222Rn, hereafter Rn) is produced from the radioactive decay of 226Ra (Ra hereafter) present in rocks, soils, and sediments. Radon emanates from Ra-bearing minerals, enters the groundwater, and is transported through the aquifer. Groundwaters usually contain Rn concentrations orders of magnitude higher than surface waters, and groundwater discharging into surface waters can thus be easily detected by a Rn enrichment with respect to surface waters (Burnett and Dulaiova, 2003).
Groundwater discharge into Lake 850 was quantified using a Rn mass balance approach and assuming steady state (Dimova and Burnett, 2011; Dimova et al., 2013). For steady-state conditions, the groundwater flow discharging into the lake can be determined by the imbalance between all Rn sources and loss terms (Eq. 1).
The sources of Rn are the main inlet streams (n=2), Rn production by dissolved Ra in the water column, Rn diffusion from underlying sediments, and groundwater discharge. Radon losses include radioactive decay, atmospheric evasion, and losses through outlet streams (n=1). Losses by recharge into underlying aquifers are considered minor, because the concentration of Rn seeping into sediments is usually much lower than that seeping into the lake (Dimova and Burnett, 2011). By evaluating all Rn source and loss terms, the groundwater flow discharging into the lake can be determined using the following equation:
where Qgw is the unknown groundwater discharge [m3 d−1]; Qin and Qout are the discharge from inlet and outlet streams [m3 d−1], respectively; Rnlake and Rngw are the concentrations of Rn [Bq m−3] in lake water and groundwater, respectively; Rnin and Rnout are the concentrations of Rn [Bq m−3] in the main inlet and outlet streams, respectively; Ralake is the concentration of Ra in the lake water column [Bq m−3]; Fsed is the net diffusive flux of Rn per unit area from lake sediments [Bq m−2 d−1]; Fatm is the loss of Rn to the atmosphere [Bq m−2 d−1]; λ is the radioactive decay constant of Rn [d−1]; and A [m2] and V [m3] are the area and volume of the lake, respectively.
The calculation of Rn loss to the atmosphere was based on the empirical equation by MacIntyre et al. (1995):
where k is the gas transfer coefficient [m d−1] based on an empirical relationship that relates k with wind speed and lake area (Vachon and Prairie, 2013), and α is the air–water partitioning of Rn corrected for salinity and temperature (Schubert et al., 2012).
The steady-state assumption implies that Rn sources and Rn sinks are balanced and constant with respect to the timescale of Rn within the system. The residence time of Rn in the lake can be calculated by dividing the Rn inventory in the lake water by the sum of all tracer losses using the equation
where λ is the radioactive decay constant of Rn [d−1], Qout is the discharge from the outlet stream, V is the lake volume, k is the gas transfer coefficient [m d−1] based on an empirical relationship that relates k with wind speed and lake area (Vachon and Prairie, 2013), and h is the lake depth [m].
Groundwater discharges (Qgw) were estimated for August and September 2019. For the remaining months, we interpolated the estimated values by assuming two different scenarios of (i) constant or (ii) variable groundwater inflows over the year (see Appendix A1) for variable groundwater inflows scenario).
3.2 Water balance
The lake water balance was calculated from the volumetric water balance equation:
where ΔV is the change in lake water volume; Qin and Qout are the stream inflow and outflow, respectively; Qgw is the groundwater inflow; P is precipitation; and E is evaporation. Monthly summer precipitation of 48 mm (ANS, 2020) has been considered to be included in the stream inflow term. Evaporation and precipitation have been shown to only have a small contribution to the lake water balance, and thus they are considered negligible here (Shemesh et al., 2001).
3.3 Silicon mass balance
The DSi flux into and from the lake is calculated as , where Q is discharge [L s−1] and c is DSi concentration [mg SiO2 L−1]. The DSi balance is then calculated as
where ΔDSi is the change of lake DSi [mg SiO2 yr−1], and ϕin, ϕout, and ϕgw are the DSi fluxes of the inlet, outlet, and groundwater discharge [mg SiO2 yr−1], respectively. Finally, ϕBSi represents the flux of BSi into the sediment [mg SiO2 yr−1], and it was calculated as
where SAR is sediment accumulation rate [cm yr−1] calculated from the age–depth model (see Methods Sect. 4.1.2), ρdry is dry bulk sediment density [g cm−3], BSi wt % is the mean of BSi content in sediments, Ased is the area of sedimentary basin of the lake in square centimeters, and 1000 is the unit conversion from grams to milligrams.
Assuming that the lake is in steady state, which means that the sum of input DSi fluxes equals the sum of output Si fluxes, thus ΔDSi=0, DSi concentration in groundwater was then calculated by dividing ϕgw from Eq. (5) by Qgw. The groundwater DSi flux in the ice-free period is dependent on inlet (ϕin), outlet DSi flux (ϕout), and BSi flux to sediment (ϕBSi). However, during the ice-covered period, the ϕgw is dependent only on ϕBSi, if there is some (scenario 1, Appendix B) and on differences of lake volume and DSi concentration. Thus, in order to solve Eq. (5), ϕBSi and lake DSi concentration changes in the ice-covered period are required. The ϕgw during the ice-covered period is calculated by a mixing model (see Appendix A2).
To constrain DSi concentrations in groundwater, we have examined three different scenarios considering different BSi fluxes (ϕBSi) to the sediment driven by the length of diatom production. Two scenarios with maximal and minimal monthly BSi flux appear in the Appendix B aiming to describe maximal and minimal diatom production period and thus groundwater DSi concentrations. The scenario better describing recent diatom production considers that the diatom growing season and thus the BSi flux occur in 4 months, from June until August, in a year (Shemesh et al., 2001), and that scenario is presented here.
3.4 Silicon isotope mass balance
The variability of the isotopic Si ratio of the lake water is likely to be biologically driven and, therefore, was described using a Si isotopic fractionation model. We hypothesize that the lake has sufficient inlet and groundwater supply to allow for DSi concentrations to remain high and that DSi is unlimited for diatom growth; thus, an open-system model was used. The open-system model (Varela et al., 2004) describes the expected diatom δ30SiBSi, as well as the post-uptake ratio of the lake water δ30Sipostuptake.
where δ30Siinitial is the isotopic ratio of the initial DSi source, ε is the fractionation factor of freshwater diatoms −1.1 ± 0.41 ‰ (De La Rocha et al., 1997), and f is the fraction of remaining DSi calculated as , where cinitial and cout are DSi concentrations before and after diatom production uptake. Thus, (1−f) is the DSi utilization by diatom production. The initial DSi concentration is calculated through a mixing model with knowledge of the discharges (Qin and Qgw) and DSi concentrations (cin and cgw) of the end-members.
The initial isotopic ratio of lake DSi before diatom uptake is back-calculated from δ30Sipostuptake (Appendix A3). The known variables are the (1−f) and the δ30Sipostuptake represented either in the lake isotopic composition or in the lake outlet δ30Siout, if δ30Silake=δ30Siout. Further, the groundwater isotopic composition can be calculated from the initial isotopic Si mixture before diatom uptake and fractionation through an isotope mixing model (see Appendix A3).
Similar to the Si mass balance, the isotope Si mass balance was examined through three scenarios that differ in BSi flux to the sediment representing different lengths of diatom production (Appendix B). As differences in BSi fluxes alter groundwater DSi concentrations, the isotopic composition also changes. However, the scenario describing the recent lake functioning is used for the model presented here. Results of this model were compared with measured data of δ30SiBSi and δ30Sipostuptake (which equals δ30Silake). For validation, the groundwater δ30Sigw for monthly steady state was calculated and compared with data in the literature.
4.1 Sample collection, chemical analyses, and chronology
4.1.1 Water sampling
For DSi analyses, water samples from the ephemeral inlets and outlet streams and lake waters were collected monthly from June to September 2019 (Fig. 1, Table S1). Additionally, samples of two profiles of lake water from the deepest part and a shallower part of the lake were collected in August and September 2019. All water samples were filtered directly in the field through a 0.45 µm cellulose Sterivex™-HV Durapore filter and acidified with HCl to pH 2 in the laboratory. DSi concentrations were analyzed by the automated molybdate-blue method (Strickland and Parsons, 1972) with a Smartchem 200, AMS™ discrete analyzer at Lund University with an instrumental error of ±3.7 %. All values for DSi concentrations are reported as milligrams of SiO2.
For Rn analyses, surface water samples (maximum of 1.5 m depth from the surface or 0.5 m depth at the shallow depths) were collected from five different stations (Fig. 1, Table S1). A deeper water sample (4 m depth) was collected from the deeper central point of the lake to evaluate the potential stratification of Rn concentrations. Samples of water from the main inlet and the outlet stream were also collected. Water samples were collected in 1.5 L polyethylene terephthalate (PET) bottles with no headspace using a peristaltic pump. Water was pumped directly into the bottle and left overflowing to replenish the volume at least three times to ensure minimal contact with air. Shortly after collection, Rn concentrations were determined using a Rn-in-air alpha spectrometer RAD7 (Durridge Inc.) coupled to the Big Bottle RAD H2O accessory (Durridge Inc.). All Rn concentrations were decay-corrected for the time of collection.
Discharges from the inlet and outlet streams were determined by measuring the water velocity at 60 % of the sampling point depth using the six-tenths-depth method (Turnipseed and Sauer, 2010) and creating a cross section through the tributary.
4.1.2 Sediment sampling
Two short (∼ 15 cm) sediment gravity cores were sampled with a HTH gravity corer in March and August 2019 (Table S1). Both cores showed an undisturbed water–sediment interface. One of the cores was sliced directly in the field in 1 cm sections. Each section was weighed before and after freeze drying to determine water content, porosity, and wet and dry bulk densities. Total organic carbon (TOC) and total nitrogen (TN) analyses were carried out on all freeze-dried samples, after packing 5 to 10 mg of dry sediment into tin capsules. Five samples throughout the core were tested for carbonate content by acidifying with HCl and heating to 60 ∘C before the TOC measurements (Brodie et al., 2011). The measurements were done on a COSTECH ECS4010 elemental analyzer at the Department of Geology, Lund University, with the mean analytical uncertainty for TOC of 0.3 wt % based on duplicate analysis (n=14). The carbonate content calculated as a difference in TOC between de-calcified and bulk sample was below 0.5 wt % and thus considered negligible.
Biogenic SiO2 content in the sediment was analyzed by sequential alkaline extraction (Conley and Schelske, 2001). Freeze-dried and homogenized samples were digested in 0.1 M Na2CO3 (sample reagent ratio [g mL−1]) in a shaking bath at 85 ∘C for 5 h. Subsamples of 100 µL were taken at 3, 4, and 5 h and neutralized in 9.9 mL of HCl to examine for the dissolution of minerals. The extracted DSi was measured using the automated molybdate-blue method (Strickland and Parsons, 1972) with a Smartchem 200, AMS System™ discrete analyzer at Lund University with an instrumental error of ± 3.7 %. As there were no changes in the amount of total Si extracted during the time course of dissolution (n=3, slope ≈0), the mean BSi concentration from all the values was used to estimate BSi concentration with no correction applied for Si-containing minerals (Conley, 1998). All values for BSi concentrations are reported as wt % of SiO2.
All sediment samples were analyzed for radionuclide concentrations (210Pb, 226Ra, and 137Cs) at Lund University. 210Pb, 226Ra, and 137Cs were determined by direct γ-counting using a high-purity germanium detector ORTEC (model GEM FX8530P4-RB). Freeze-dried and ground samples were sealed for at least 3 weeks before counting to ensure secular equilibrium of 226Ra daughters. 210Pb was determined through the 46 keV γ-emission and 226Ra through the 351 and 609 keV γ-emission of its daughter nuclides 214Pb and 214Bi, respectively. 137Cs was measured by its emission at 662 keV. Self-absorption was measured directly, and the detector efficiency was determined by counting a National Institute of Standards and Technology sediment standard.
Sediment core chronologies were obtained by applying the Bayesian statistics approach with the software package Plum (Aquino-López et al., 2018). The Plum package was applied using the default settings for the thickness of Bacon sections (1 cm). Plum used the individual 226Ra measurements as an estimate of the supported 210Pb concentration. The unsupported 210Pb was found in the uppermost 7 cm, and the software package Plum (Aquino-López et al., 2018) extrapolated the ages for the remaining 7 cm based on measured data.
To constrain the Rn mass balance, the second sediment gravity core was used for equilibration experiments in order to determine Rn diffusion from underlying sediments and the Rn concentration representative of the groundwater discharging into the lake. Briefly, diffusive flux experiments were carried out in the laboratory by incubating ∼ 200 g of dry sediment placed into 500 mL PET bottles with Milli-Q® water, as described in Chanyotha et al. (2014). Using the RAD7 coupled to the Big Bottle RAD H2O accessory (Durridge Inc.), Rn concentrations were monitored for 14 h. The rate of Rn diffusion from the sediment (Fdiff) was derived from the exponential ingrowth of Rn concentrations with time. The bottles containing grab sediments were then stored for more than a month and periodically shaken. After this time, the Rn concentration in water was measured using the RAD7 and converted into groundwater end-member activities using porosity and bulk density as described in Chanyotha et al. (2014).
4.2 Stable Si isotope analyses
Stable Si isotope analyses were performed on diatoms recovered from sediment, lake, and stream water samples. Cleaned diatom material (n=3) from a published core taken in 1999 (Shemesh et al., 2001) was used to determine the stable silicon isotope ratio in sedimentary diatoms and then used in mass balance models. Briefly, pure diatom samples (∼ 0.8 mg) were digested with 0.5 to 1 mL of 0.4 M NaOH (analytical purity) at 50 ∘C for at least 48 h. When all diatoms were dissolved, samples were diluted with Milli-Q® water to prevent precipitation and fractionation of amorphous silica and then neutralized by 0.5 to 1 mL of 0.4 M Suprapur® HCl. The solutions were measured for their DSi concentration to obtain the Si recovery, which was between 90 % and 100 %. Sample solutions were purified for Si isotope analysis by cation-chromatographic separation using 1.5 mL cation-exchange Dowex® 50W-X8 (200–400 mesh) resin following the method of Georg et al. (2006). Silicon from filtered water samples was purified using the same cation-exchange method (Georg et al., 2006). The international Si standard NIST reference material RM-8546 (former NBS-28) and laboratory standard Diatomite were prepared by alkaline NaOH fusion and purified following protocol by Georg et al. (2006).
The reference material RM-8546 (former NBS-28) and laboratory standards IRMM-018, Big-Batch, and Diatomite used in the Vegacenter, Swedish Museum of Natural History, Stockholm, were prepared by another type of fusion with LiBO2 (Sun et al., 2010). Thus, our alkaline NaOH-fused NBS-28 and Diatomite standards (Georg et al., 2006), purified identically to the samples, were matrix-matched to contain 3 mg L−1 Li IPC-MS standard. Similarly, all purified samples were diluted to a concentration of 3 mg L−1 of Si in 0.12 M SeaStar™ HCl matrix and doped with Li to contain 3 mg L−1 Li to match the standard matrix.
The stable isotope measurements were carried out on a NuPlasma (II) HR multi-collector inductively coupled plasma mass spectrometer (MC-ICP-MS, Nu Instruments™) with an Apex HF desolvation nebulizer at the Vegacenter. The 28Si signal intensity of full procedural blanks was determined to be less than 0.35 % of the total signal intensity; thus no sample contamination was observed. Silicon isotope data are reported as deviations of and from the NBS-28 reference solution in ‰, denoted δ30Si and δ29Si as follows:
Each sample was measured three times, bracketed by NBS-28 in between, and full chemical replicates for diatom (n=3) and water samples (n=23) were measured for 65 % of all samples (total measurements n=137). Secondary reference materials Diatomite, Big-Batch, and IRMM-018 were measured throughout all measuring sessions in a period of 3 years, with means of ‰ (2SDrepeated, n=219) for Diatomite, ‰ (2SDrepeated, n=77) for Big-Batch, and ‰ (2SDrepeated, n=100) for IRMM-018 for quality control purposes. All secondary reference material values were in good agreement with values from a previous interlaboratory comparison (Reynolds et al., 2007). The reproducibility of all samples was <0.2 %. At the Vegacenter, the long-term precision for δ30Si is 0.15 ‰ (2 SD).
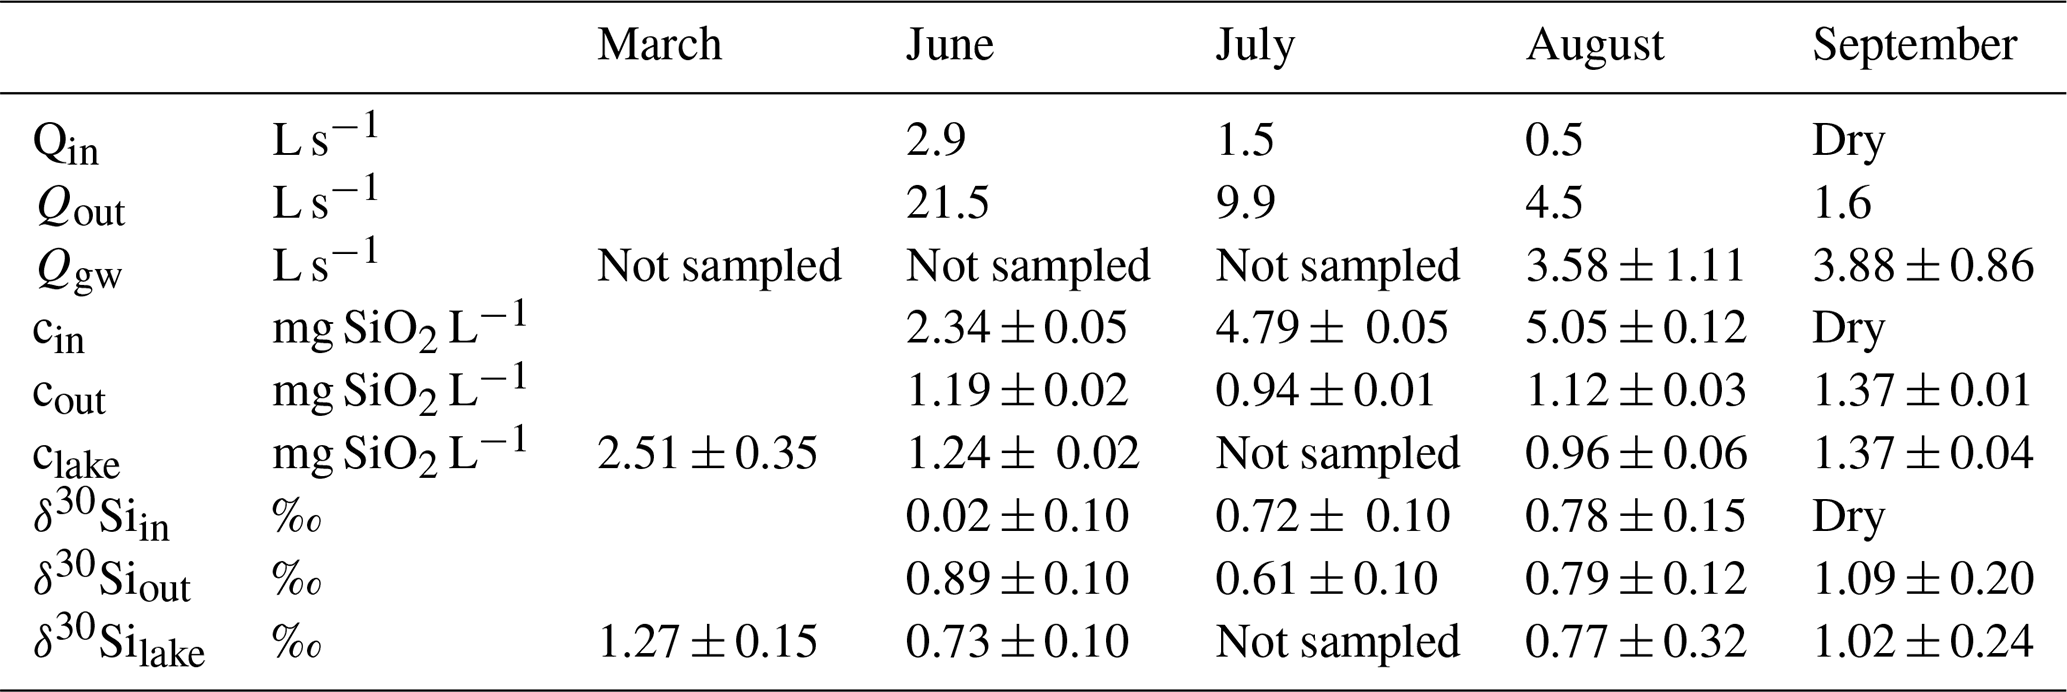
Table 1Summary of discharge from the inlets (Qin), the outlet (Qout) stream, and groundwater discharge (Qgw); dissolved Si concentration as mg SiO2 L−1 in the inlets (cin), the outlet (cout), and the lake water (clake); and stable Si isotopic signal of the inlet (δ30Siin), outlet (δ30Siout), and lake (δ30Silake).
5.1 Lake water chemical and isotopic properties
Lake 850 is a subarctic lake in a region with strong seasonality. The discharge from inlets and the outlet streams show a decreasing trend throughout the ice-free period from June through September (Table 1). The highest water flow rates are observed during the snowmelt period (June and July). Inflow from the stream inlets to the lake in August is low, and both inlets are dry in September.
During the ice-free period direct surface precipitation is 0.65 L s−1, which represents only 1.4 % of the lake volume, and similar or higher discharges are observed in the stream inlets from July to August. Therefore, the influence of precipitation on the water mass balance is limited. The calculated lake water residence time during the high-flow regime in June, defined as lake volume (1.2×10⁵ m3) divided by the lake outlet discharge (Table 1), is 65 d. During the rest of the year, the lake water residence time is between 5 months and 2.4 years.
Lake DSi concentration varies seasonally (Table 1), with the highest values during the ice-covered period in March, reaching 2.51±0.35 mg SiO2 L−1. With snowmelt, the lake DSi decreases to 1.24±0.02 mg SiO2 L−1 in June and to its minimum value of 0.96±0.06 mg SiO2 L−1 in August. With the first snow in September, lake DSi concentration rebounds, having values of 1.37±0.04 mg SiO2 L−1. Data of DSi for the inlets and the outlet streams show two different patterns during the year (Table 1). A lower inlet DSi concentration of 2.34±0.05 mg SiO2 L−1 is observed during snowmelt in June compared to July and August, when the inlet DSi concentrations increase to 4.79±0.05 mg SiO2 L−1 and 5.05±0.12 mg SiO2 L−1, respectively. The lake outlet DSi concentration shows little variability, with the lowest concentration of 0.94±0.01 mg SiO2 L−1 in July and only a small increase up to 1.12±0.03 mg SiO2 L−1 towards the end of the summer season in August. In September, when the inlet streams are snow-covered, the DSi concentration in the outlet stream is the same as the lake water concentration at 1.37±0.01 mg SiO2 L−1.
The stable Si isotope ratios of the lake, inlet, and outlet streams vary during the year. The heaviest lake δ30Silake ratio, 1.27±0.15 ‰, is observed during the ice-cover period, and the lightest ratio, 0.73±0.10 ‰, occurs during the snowmelt in June (Table 1). In June, the inlet has a lighter δ30Siin of 0.02±0.10 ‰, whereas in August the inlet isotopic ratio 0.78±0.15 ‰ has similar values as the lake. The δ30Siout of the outlet in June is slightly heavier (0.89±0.10 ‰) compared to the lake δ30Silake. In July the outlet δ30Siout is lighter than the inlet one (Table 1). During the remainder of the year, the outlet δ30Siout is closely similar to the lake and inlet δ30Silake.
5.2 Groundwater discharge
Surface lake Rn concentrations range between 94 and 136 Bq m−3 in August and from 96–126 Bq m−3 in September. Dissolved Ra in lake waters is assumed to be similar to dissolved Ra found in other lakes in the region (1.4±0.6 Bq m−3). However, the measured Rn inputs (the stream inlets) due to Ra decay were below 0.5 %, compared to the net excess of Rn delivered by groundwater discharge. Thus, the inlet Rn flux was neglected in the total Rn balance.
There was no significant vertical stratification of Rn concentration with Rn concentrations in deep waters (105±26 and 79±24 Bq m−3) in August and September, respectively. Equation (1) was solved analytically to obtain the amount of groundwater discharging into the lake (Qgw) in August and September 2019. Uncertainties of individual terms were included in the estimation of the associated uncertainty (ISO NORM, 1995; Taylor and Kuyatt, 1994).
Using the mean wind speed for the 48 h period prior to sampling (3.1±1.2 and 5.0±1.8 m s−1 in August and September, respectively) resulted in kRn estimates of 1.1±0.2 and 1.2±0.4 m s−1. Uncertainties include the variation in wind speed and uncertainties associated with the empirical equation to estimate kRn. Using the Rn concentration in lake waters, total losses of Rn to the atmosphere are 123±32 and 138±32 Bq m−2 d−1 in August and September, respectively. Radon losses due to decay were 125±22 and 123±15 Bq m−2 d−1, respectively, where uncertainties are obtained from the analytical uncertainties for Rn concentrations in lake waters. Losses of Rn through the outlet stream were 7±4 and 9±4 Bq m−2 d−1. Among all Rn losses, atmospheric evasion (50 %) and decay (47 %) were the terms that have the largest contribution to the Rn mass balance. Radon losses through the outlet stream are almost negligible (3 %). Additionally, using the average kRn and Qout (Eq. 3), the average 222Rn residence time in Lake 850 is ∼2 d.
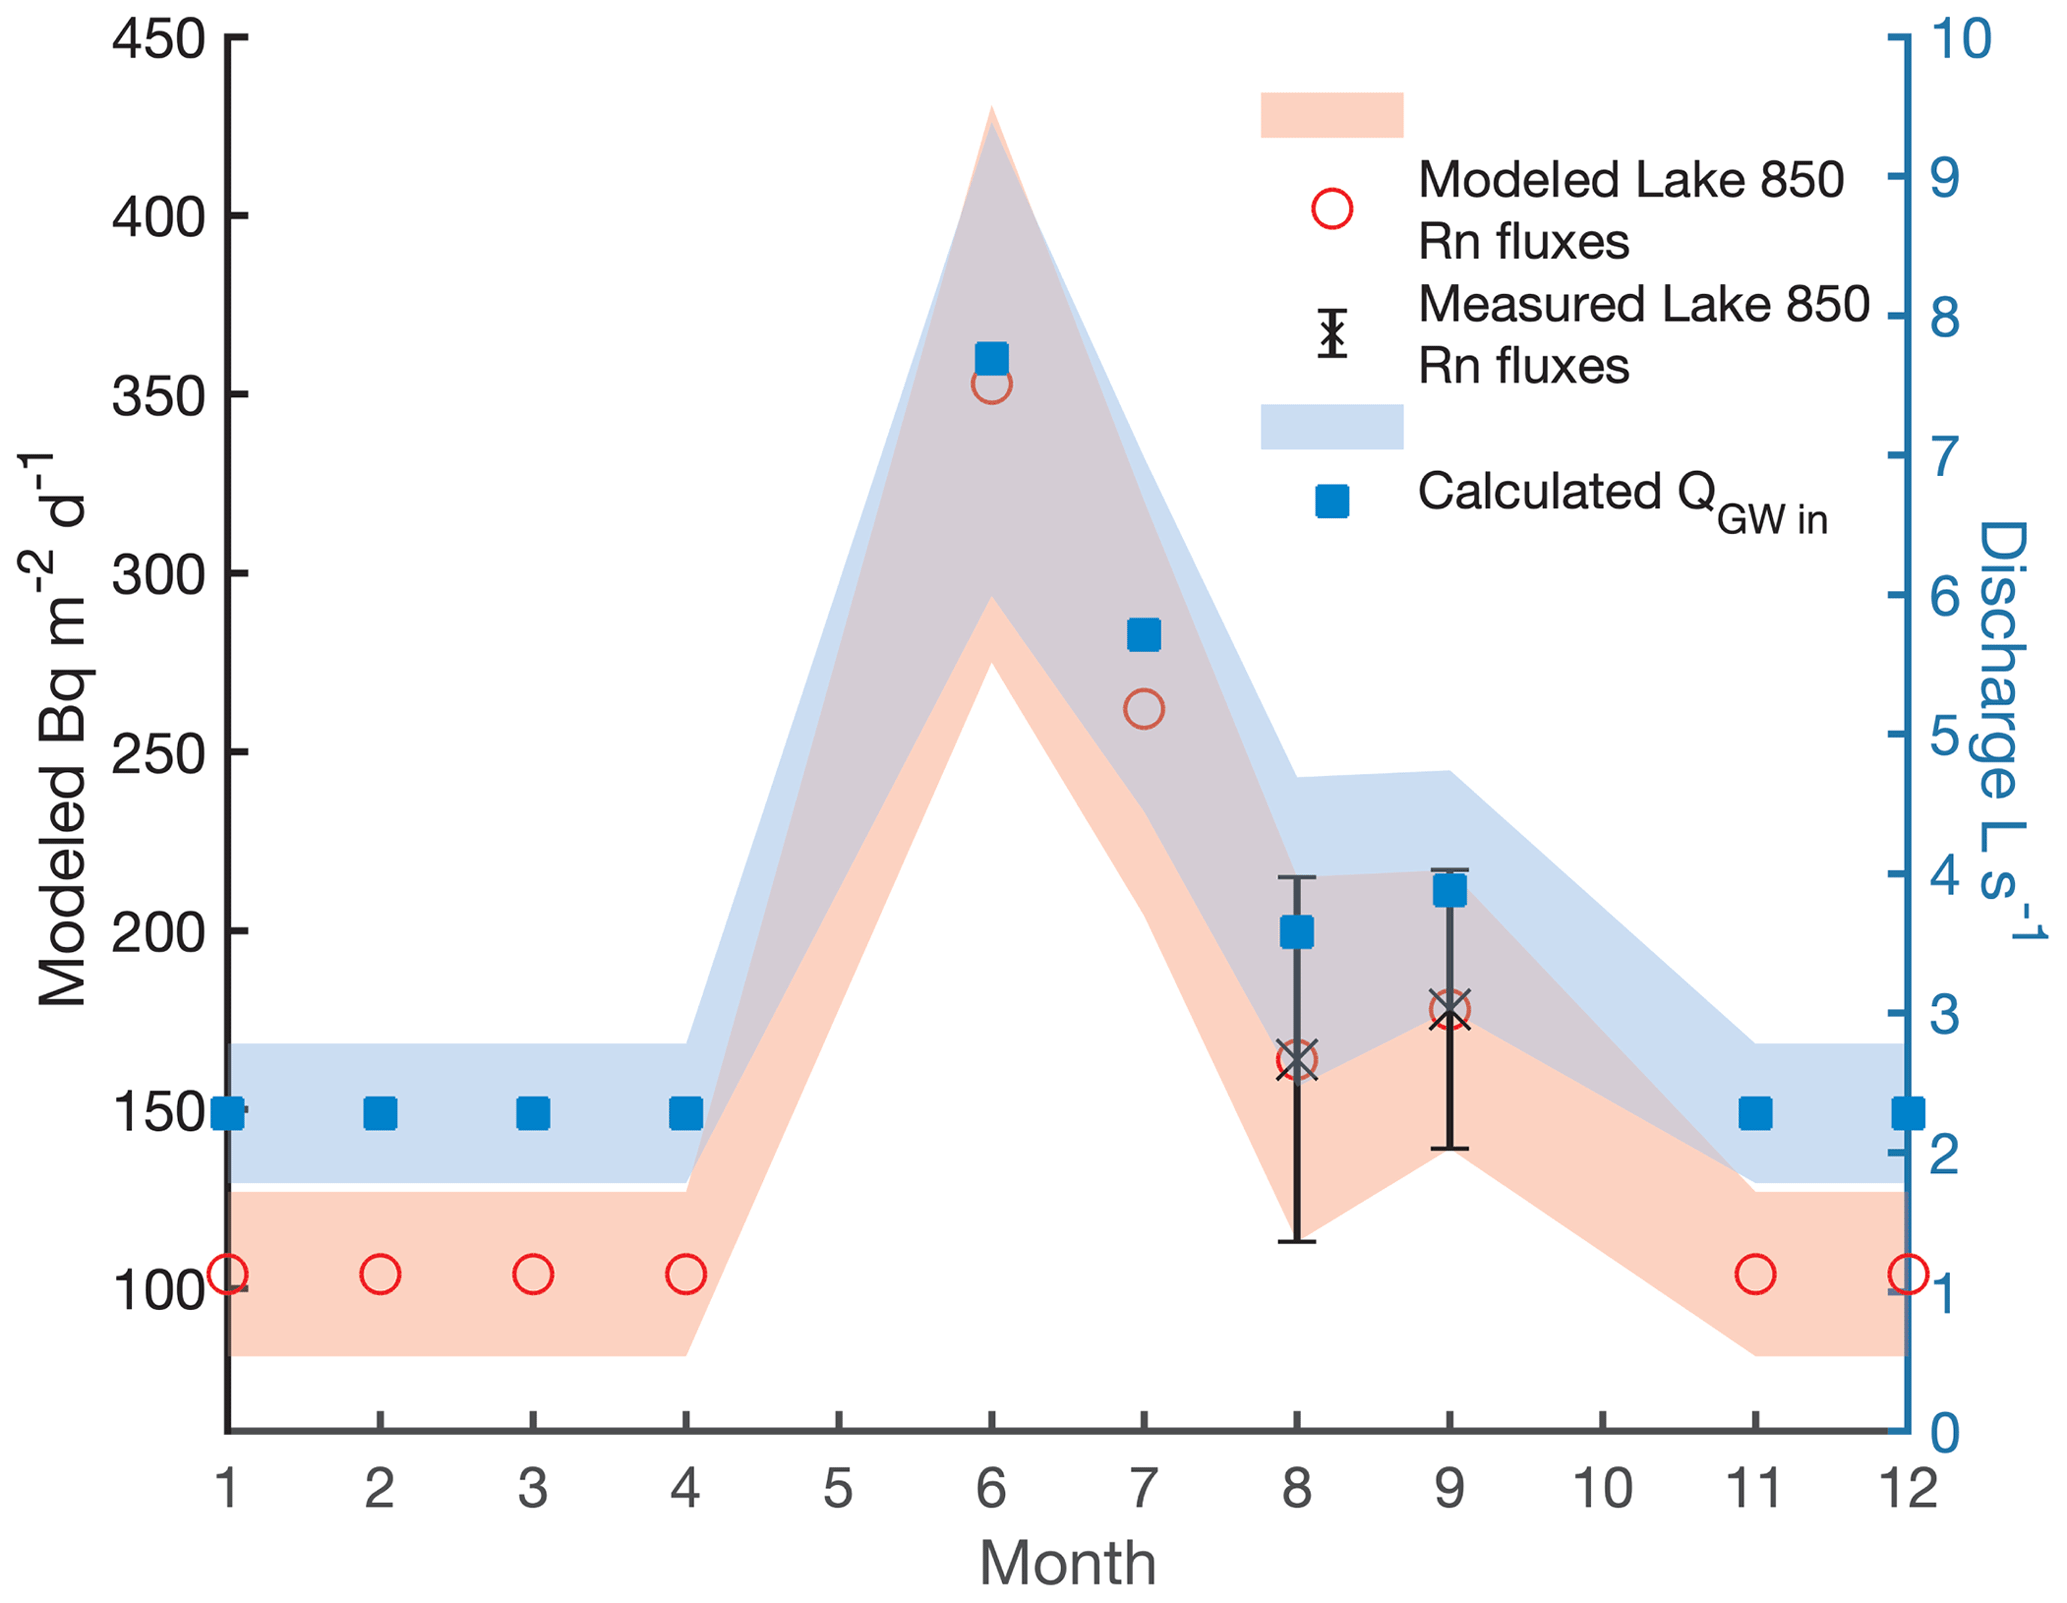
Figure 2The modeled groundwater radon flux of Lake 850 (red circles) based on Rn fluxes in Lake Almberga in Abisko (Olid et al., unpublished data), the measured Rn fluxes in August and September (black cross), and the calculated groundwater discharge in L s−1 throughout the year (blue squares). Uncertainties are shown as error bars and with shading.
Diffusive Rn flux from underlying sediments (Fdiff) obtained from diffusion experiments in the lab is 89±17 Bq m−2 d−1, and it is one of the main sources of Rn into the system. Fluxes of Rn from the sediment compensate for up to 57 % of total Rn losses. Uncertainties associated with this flux are from analytical uncertainties in the slope for the regression analyses of the increase in Rn concentration through time in the sediment diffusion experiment. Due to the low concentrations of Ra in lakes from the same area (1.4±0.6 Bq m−3, C. Olid, unpublished data), Rn inputs due to Ra decay were considered negligible in the Rn mass balance.
Rn inputs from groundwater are required to balance the Rn losses from the lake. The Rn flux into the lake through groundwater discharge is calculated to be 164±51 and 178±39 Bq m−2 d−1 in August and September, respectively. Considering the lake area of 20 000 m2 and the Rn concentration in groundwater obtained from incubation experiments (10 626±1720 Bq m−3), groundwater fluxes are 3.58±1.11 and 3.88±0.86 L s−1 for August and September, respectively. Note that this is a conservative estimate for groundwater fluxes, because we use the highest measured Rn concentration as the end-member.

Figure 3Age–depth model of the gravity core. Red line is the median probability age from all age–depth iterations. Grey shading represents age model probability and contains 95 % confidence interval (dashed lines). The blue rectangles are the unsupported 210Pb concentration in Bq kg−1.
Due to the lack of Rn measurements for the entire year, we estimated groundwater inputs for the months where no sampling was carried out using two scenarios: (i) constant groundwater inflow of 3.73±1.40 L s−1, calculated as the mean of the August and September data, and (ii) modeled groundwater inflow based on groundwater fluxes obtained from a lake survey in the Abisko region in 2018–2019 (C. Olid, unpublished data), which ranged from 2.28±0.50 L s−1 to 7.69±1.70 L s−1 (Fig. 2). The annual Rn fluxes follow a pattern of a distinct peak in discharge in June and a gradual decrease towards July–October, reaching the base-flow level in November (Fig. 2). The ratio between the groundwater Rn flux in September in Lake 850 and the groundwater Rn fluxes from the lake survey was used to model the missing groundwater Rn fluxes in Lake 850 (Fig. 2, Appendix A1).
5.3 Age–depth model, lithology, and mass accumulation rates
The age–depth model for the sediment core is shown in Fig. 3 (or Fig. S2). The mean sediment accumulation rate (SAR) was estimated to be 0.083±0.041 cm yr−1, which equals a sediment accumulation rate of 12±6 yr cm−1 and a mass accumulation rate (MAR) of 16.0±9.3 mg cm−2 yr−1. The presence of mosses in the sediment was observed during the core processing and also was described in the sediment lithology by Shemesh et al. (2001). Changes in the sediment content of aquatic or terrestrial mosses were also supported by the wt % ratio (Fig. 4), suggesting this is the cause of changes in MAR.
Lake 850 sediment is composed of carbonate-free clay gyttja with a mean TOC content of 11.4 wt %, mean TN of 1.1 wt %, and a resultant wt % ratio of 10.2 (Fig. 4). Sediment porosity as high as 89.5 % is found in the surface sediment, where sediment dry bulk density mean is 0.19±0.06 g cm−3. The BSi concentration along the sediment varies from 13.2±0.28 wt % to 22.8±0.24 wt %, with the highest BSi concentration in the surface of the core. The BSi concentrations reported here are lower than previous measurements. For example, BSi concentration in the surface sediment of Lake 850 was previously reported to be 40.3 wt % (Rosén et al., 2010), which is twice the value found here, demonstrating a high variability of BSi in the sediments.
From MAR and BSi wt % we estimated the BSi accumulation rate (ϕBSi). BSi accumulation rates show stable values around 1.8 mg SiO2 cm−2 yr−1 in the upper 7 cm of the core, whereas an increase in BSi accumulation is observed towards the bottom 7 cm of the core (Fig. 4) likely connected to the higher MAR. The mean BSi accumulation rate for the entire gravity core of 2.9±1.5 mg SiO2 cm−2 yr−1 was used as the BSi flux to sediment in the mass balance models. The mean diatom isotopic ratio (δ30SiBSi), measured on cleaned diatoms from the uppermost 8 cm of a sediment piston core from 1999 (Shemesh et al., 2001), is 0.07±0.43 ‰ (n=3).
6.1 Water balance
Two water balance scenarios were considered where changes in the lake level were evaluated: (i) constant groundwater inflow over the annual cycle as an additional water source and (ii) modeled groundwater discharges varying throughout an annual cycle (Figs. 5 and A1). In both scenarios, lake-level increases during the ice-covered period (Fig. 5, blue and green lines) are a result of a potential groundwater inflow. This accumulated water is released through the outlet when the lake ice starts to melt in May–June, and the outlet discharge is thus high (Table 1). After this period, lake level is stabilized, and groundwater replenishes the original lake volume during short periods over the summer.
When groundwater discharge is assumed to be constant (scenario i, 3.73±1.4 L s−1) based on our data from August and September, the lake shows annual lake-level changes up to 1.9 m (Figs. 5 and A1, blue line). From July to December, the lake volume is restored by the groundwater inflow, and, on the annual timescale, the lake level would increase around 2 m every year (Fig. 5, blue line).
Using the modeled annual groundwater inflow (scenario ii, Fig. 2), limited lake-level changes were observed. The maximum lake-level decrease is 1.4 m during summer (Figs. 5 and A1, green line), but groundwater discharge restores lake level during upcoming months. Taking into account the uncertainties, lake-level variation can be as great as 2.8 m or none (Figs. 5 and A1, green shading). This scenario with the smallest lake-level changes is in agreement with previous results of oxygen isotope mass balance (Shemesh et al., 2001). Therefore, we used this water balance model further for the Si balances.
6.2 Silicon and silicon isotope mass balance
Based on the steady-state assumption, BSi accumulation occurs in conditions when the total DSi influx is higher than the stream DSi outflux. Therefore, we construct a Si mass balance based on stream inlets and the outlet. The DSi influx through the inlet stream is not sufficient to maintain lake DSi concentration at steady state in June (red and blue triangles, Fig. 6a). In contrast, in July and August sufficient DSi enters the lake to supply the outlet DSi flux. The monthly inlet DSi flux is between 0.22±0.11 and 0.62±0.31 kg SiO2 d−1, while the outlet DSi flux ranges from 0.19±0.10 to 2.21±1.11 kg SiO2 d−1. However, diatom production is an additional sink of Si by creating a BSi flux into the sediment. The DSi influx is, thus, not sufficient to account for both the DSi outflux and the BSi flux into the sediment (Fig. 6a). Therefore, an external source (i.e., groundwater discharge) must supply additional DSi to compensate for the mean BSi flux (2.9 mg SiO2 cm−2 yr−1) into the sediment.
Groundwater discharges from scenario ii (Fig. 2) were used to build a Si mass balance and a Si isotope mass balance. Here, we assume that the recent BSi flux into the sediment occurs only during the diatom growing season (from June until September) (Fig. 6a; Shemesh et al., 2001). The missing DSi flux resulting from the mass balance was considered to originate from the groundwater flux, and thus we use this flux to calculate back the groundwater DSi concentration and isotopic ratio.
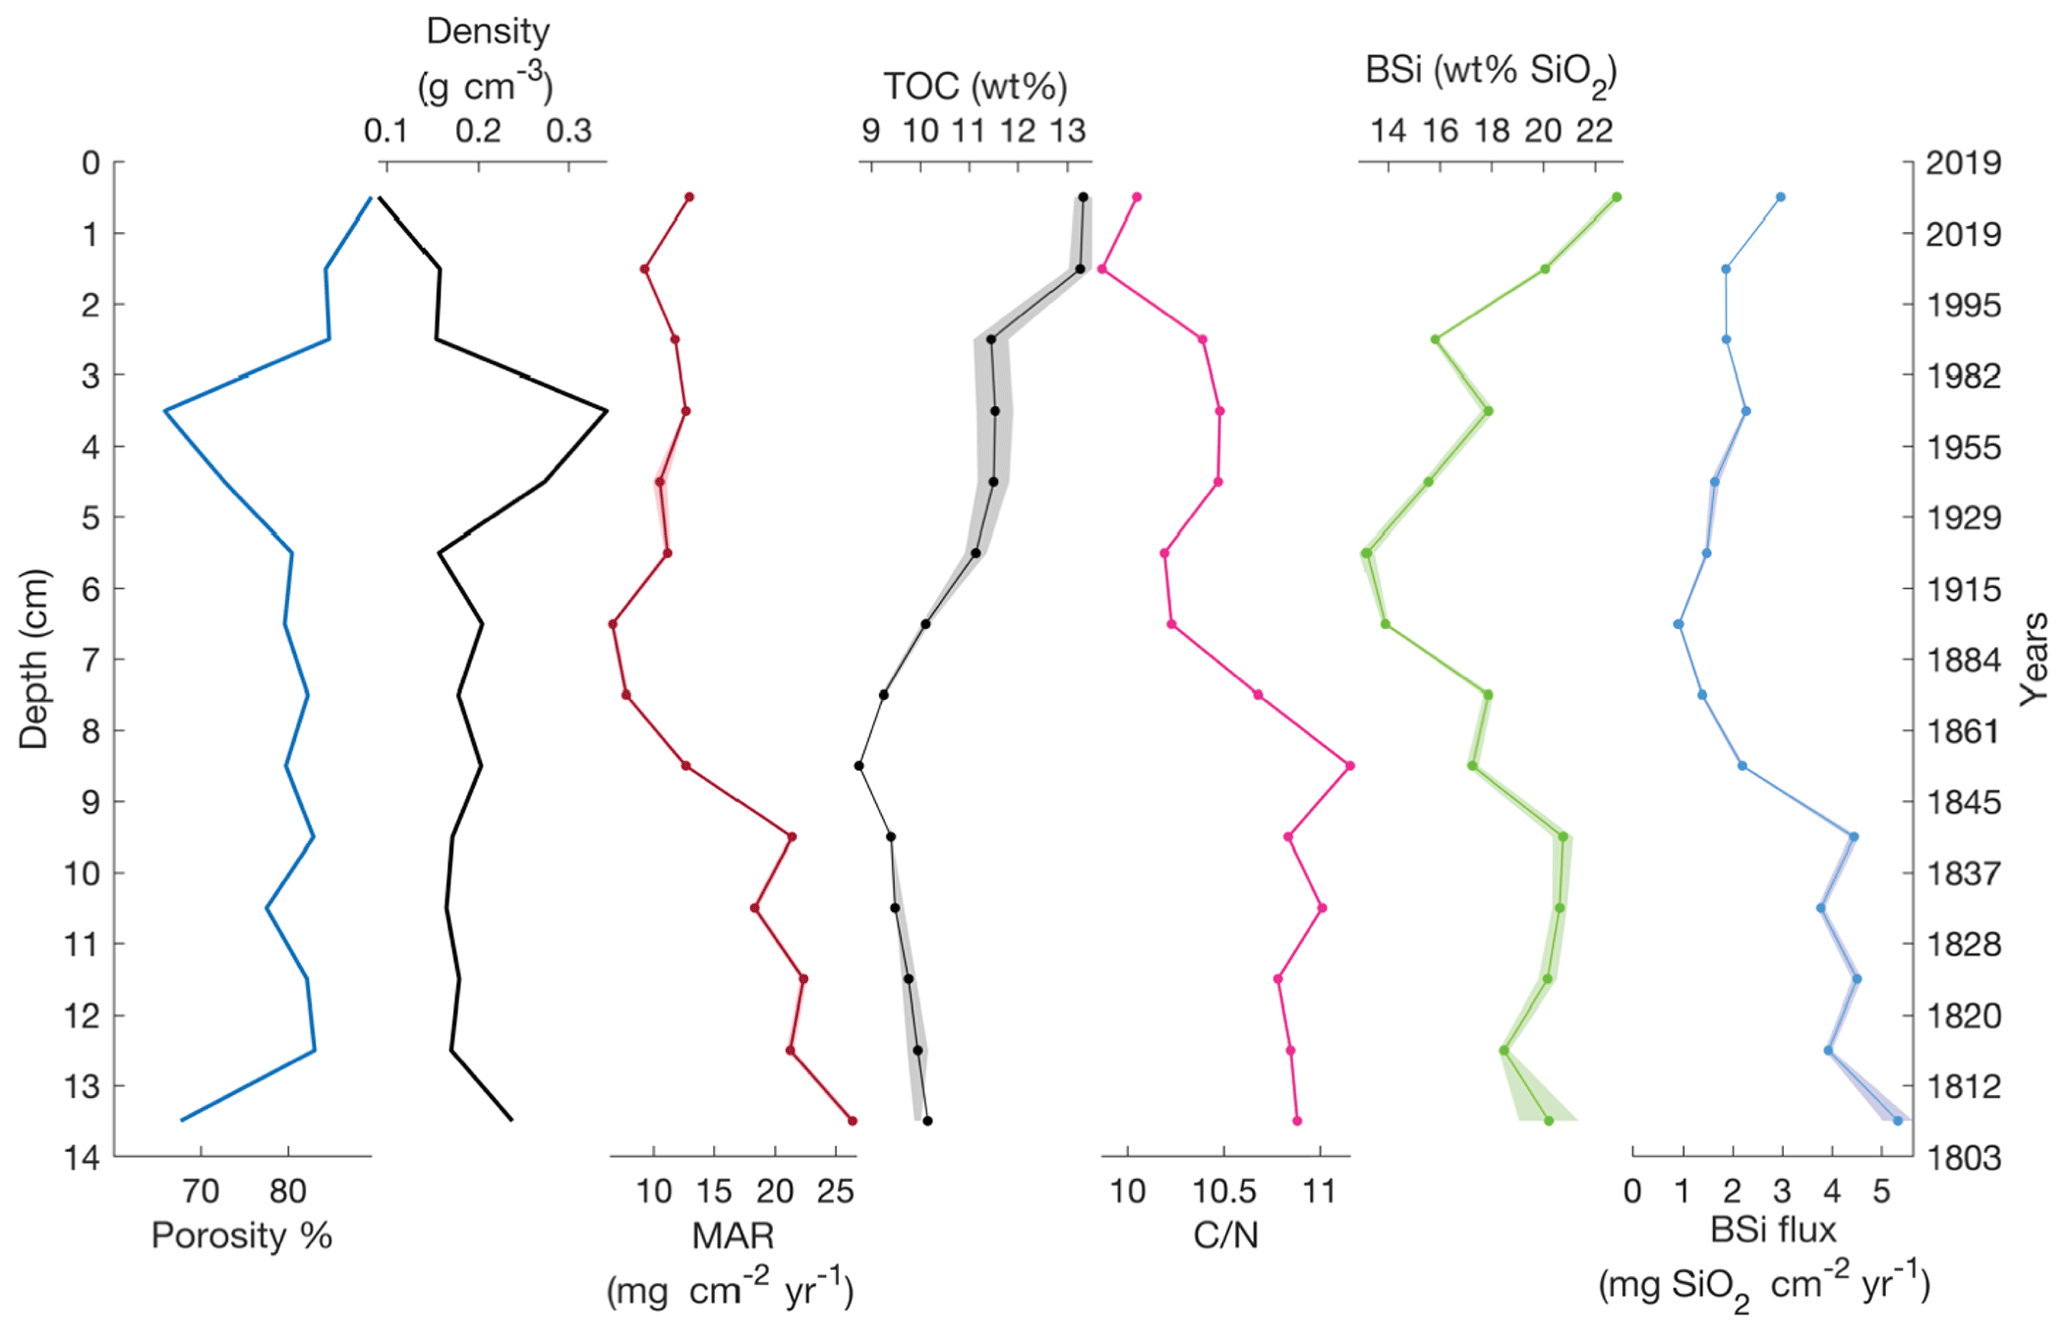
Figure 4The gravity core sediment properties (porosity and dry bulk density), mass accumulation rate (MAR), and sediment density. Total organic carbon (TOC) and showing changes in lake carbon content and sources. Biogenic silica (BSi) and BSi flux calculated from MAR and BSi concentrations. Shading shows 1 standard deviation.
During the diatom growing season, the modeled BSi flux into the sediment increases up to 1.76±0.87 kg SiO2 d−1 (magenta line, Fig. 6a), which produces DSi deficiency in the lake. To balance this deficiency, groundwater discharge must supply between 1.62±1.21 and 3.39±1.81 kg SiO2 d−1 during the diatom growing season (cyan line, Fig. 6a). Considering the modeled groundwater discharges derived from Rn mass balance, the DSi concentration in the groundwater is estimated to range from 3.96±2.14 mg SiO2 L−1 to 5.85±2.99 mg SiO2 L−1 during diatom growth (cyan line, Fig. 6b). During the ice-covered period the BSi flux into the sediment is considered to be negligible, while groundwater is still flowing into the lake. The winter groundwater concentration is calculated from the difference in the lake concentration from September (1.02±0.91 mg SiO2 L−1) to March (2.51±0.35 mg SiO2 L−1) (Appendix A2). Therefore, the groundwater discharging into the lake from late October until mid-June is the only water inflow with a DSi concentration of 5.50±1.22 mg SiO2 L−1.
The Si isotope mass balance using the open fractionation model (Varela et al., 2004) shows that the higher demand of DSi in the productive months (Fig. 6a, b) needs to have a lighter isotopic composition in order to produce the δ30SiBSi of 0.07±0.43 ‰ measured on diatoms preserved in the sediment. The isotopically lighter source is assumed to be groundwater discharge, with calculated ranges from ‰ in July to 0.25±0.58 ‰ in September (Fig. 6c). Using the modeled groundwater δ30Si, the expected δ30SiBSi in all productive months varies from ‰ to ‰ (not shown), values that are in agreement with the sediment BSi of ‰. The production consumes 73 % of the initial DSi in June, 77 % in July and September, and 79 % in August. During the ice-covered period from late October until mid-June, the groundwater base flow is considered to be constant, calculated from the difference of the lake isotopic ratios from September until March (Appendix A3), and thus the ‰ (Fig. 6c).
Lake 850 is unusual in terms of both the DSi and BSi concentration in water and sediment, respectively. The maximum DSi concentration of 2.51 mg SiO2 L−1 in March is among the top 10 % of lakes in northern Sweden (Bigler and Hall, 2002). The mean BSi content in the lake sediment of 40 wt % (Rosén et al., 2010) places Lake 850 in the upper 6 % of lake sediments studied worldwide (Frings et al., 2014). Based on the positive correlation between water residence time and the relative retention of DSi in lakes (Frings et al., 2014), Lake 850 with its DSi retention of 35±17 % of the total DSi inlet input and a residence time ranging from 0.18 to 2.4 years accumulates more DSi as BSi than expected. Although several factors, including the morphology of the watershed (Jenny, 1941; Rubensdotter and Rosqvist, 2003), diatom production and low detrital input (Conger, 1942), vegetation (Struyf et al., 2010), and preservation potential (Ryves et al., 2003), are known to affect sedimentation regimes and BSi accumulation resulting in a diatom-rich sediment, we show here that groundwater input is an important factor leading to the high BSi accumulation in Lake 850.
The combined results from the water, Rn, and Si mass balances indicated the importance of an external source of DSi through groundwater discharge. Groundwater inflow was the primary water and DSi supply to the lake, with a contribution about 3 times higher than the stream inlets (Fig. 6a). The Si and Si isotope mass balance models showed that groundwater DSi concentration and isotopic composition varied during the ice-free period, compared to the ice-covered period, when they were stable (Fig. 6b, c).
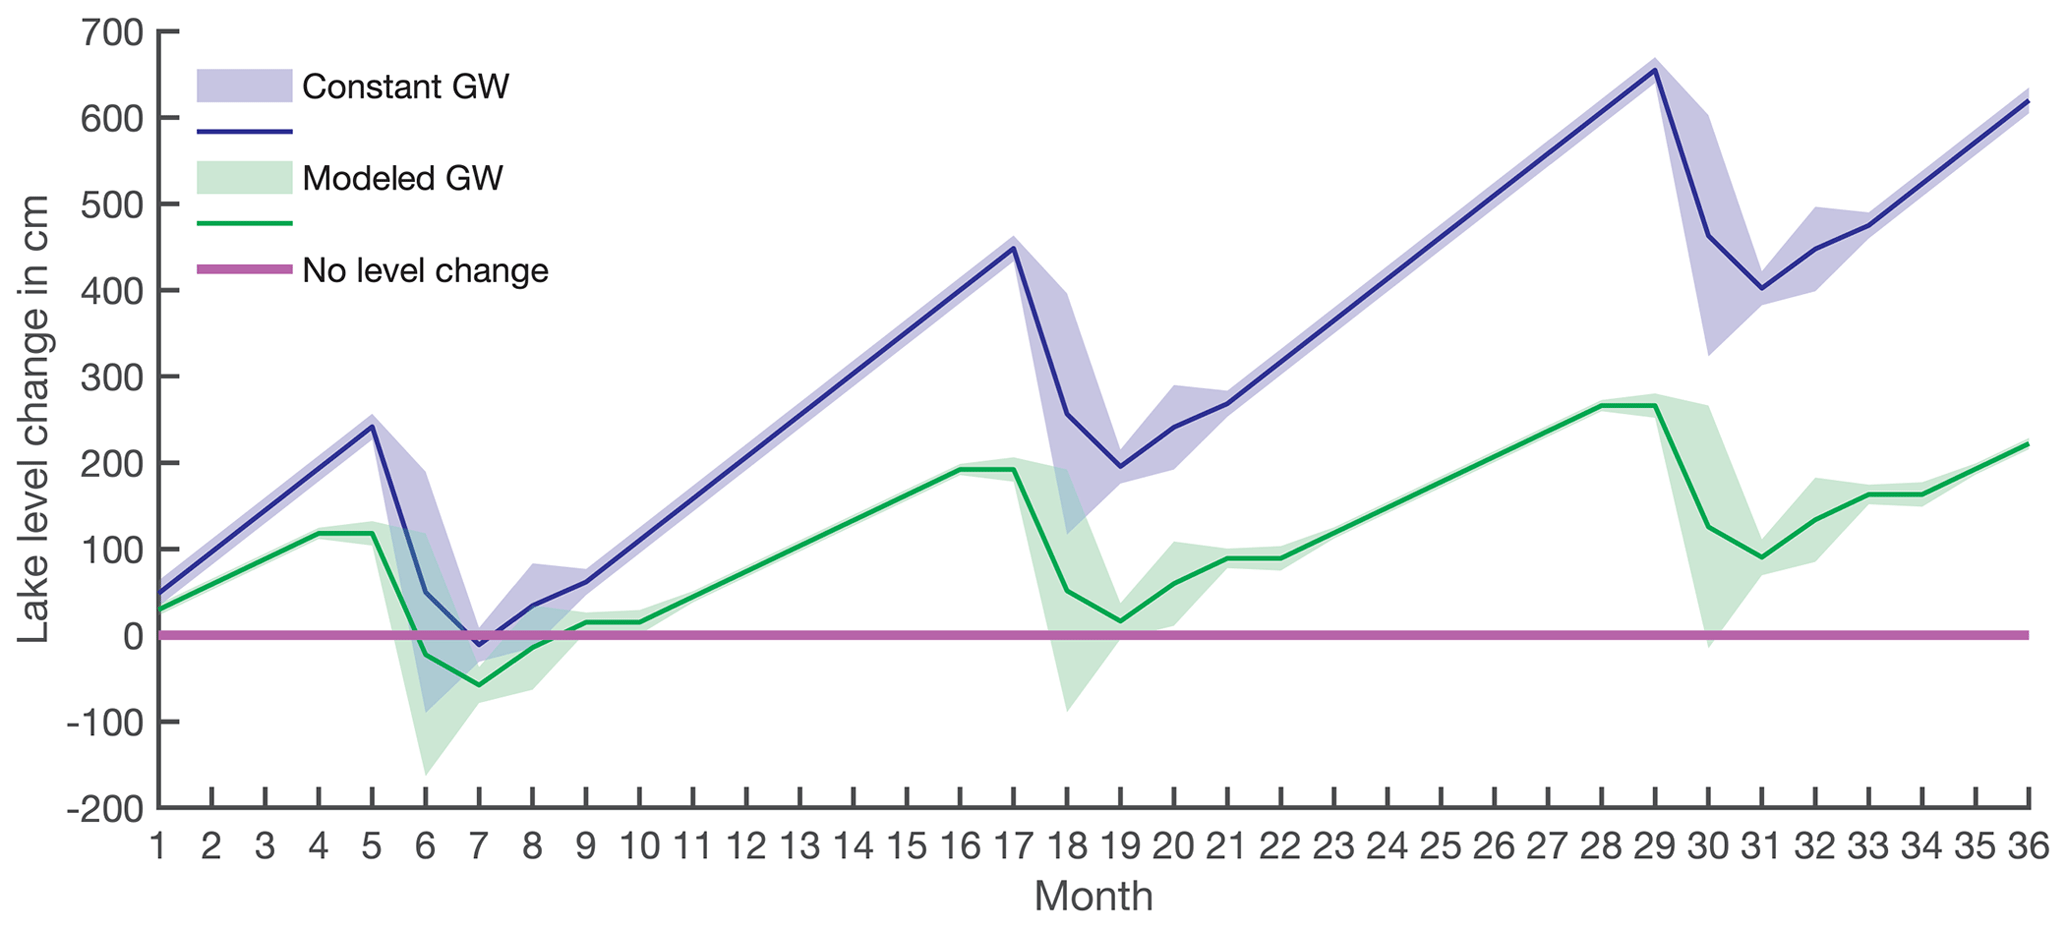
Figure 5Long-term lake-level change calculated based on lake volume changes and water balance. The purple line indicates the lake-level starting point. The blue line with shading is the lake-level change with constant groundwater flow (scenario i), and the green line with shading is the lake-level change based on water balance with modeled groundwater discharges (scenario ii).
The significance of groundwater-sourced DSi to the lake's Si cycle is also evidenced by the relatively lighter stable Si isotope ratio of diatoms from sediment, which suggests that groundwater is the primary DSi source for diatoms. Stream inputs could also be a source of DSi for diatoms, especially in early spring, when snowmelt can deliver isotopically lighter DSi by displacement of shallow groundwater into the stream inlet (Campbell et al., 1995). However, spring snowmelt water and groundwater in June are likely to have the same isotopic composition (Fig. 6c) because the same factors, e.g., short residence time in the watershed, are present in both types of water. Thus, only by using mass balance is the quantification of each DSi source apparent, providing evidence that groundwater supplies almost 4 times more DSi compared to streamflow in June. Our results suggest that the groundwater supply plays a crucial role in providing DSi for the production of diatoms and accumulation of BSi in Lake 850.
7.1 Environmental controls on BSi accumulation
The results from our study can be applied more broadly to other lakes to evaluate factors governing the accumulation of diatom-rich sediment. BSi-rich sediments are likely to be found in lakes situated on silica-rich bedrock, such as in Lake Challa, Tanzania–Kenya (Barker et al., 2013), or, as shown here, in lakes with sufficient DSi inputs from groundwater that supply sufficient DSi during the diatom growing season to alleviate potential DSi limitation of diatom growth. In addition, lakes with high autochthonous carbon production and deposition combined with very low mean sedimentation rates, which commonly characterize Arctic lake sediments (Wolfe et al., 2004), as well as lakes with low-relief watershed morphology and with low stream input, which combined yield low quantities of fine-grained clastic input, are potential systems for high BSi accumulation (Conger, 1942).
7.2 The role of groundwater in the water balance
The water balance coupled with the Rn mass balance indicated that groundwater discharge is an essential water source for the lake. Both models of groundwater inflow (constant and varying groundwater inputs) demonstrated changes in lake volume as a result of high water discharge at the outlet of the lake during spring snowmelt. More pronounced changes in lake volume were observed in scenario i, where constant groundwater inflow was assumed (Fig. 5, blue line). However, because the oxygen isotope data showed negligible evaporation and precipitation effect on lake volume change (Shemesh et al., 2001), this model is not considered to be the most realistic. Scenario ii, which considered a variable groundwater flow (Fig. 5, green line) seems to be more realistic. The modeled groundwater hydrograph (Fig. 2) is comparable with the hydrograph of the neighboring river Miellejohka (Fig. S1) and resembles the hydrographs of groundwater discharge in studies of high-altitude lakes from other regions (Clow et al., 2003; Hood et al., 2006; Huth et al., 2004; Liu et al., 2004). The results from this model show that groundwater discharge is up to 5 times higher than the lake water outflow through the outlet. Similarly, groundwater discharge corresponds to 3 % to 17 % of the lake volume depending on the month.
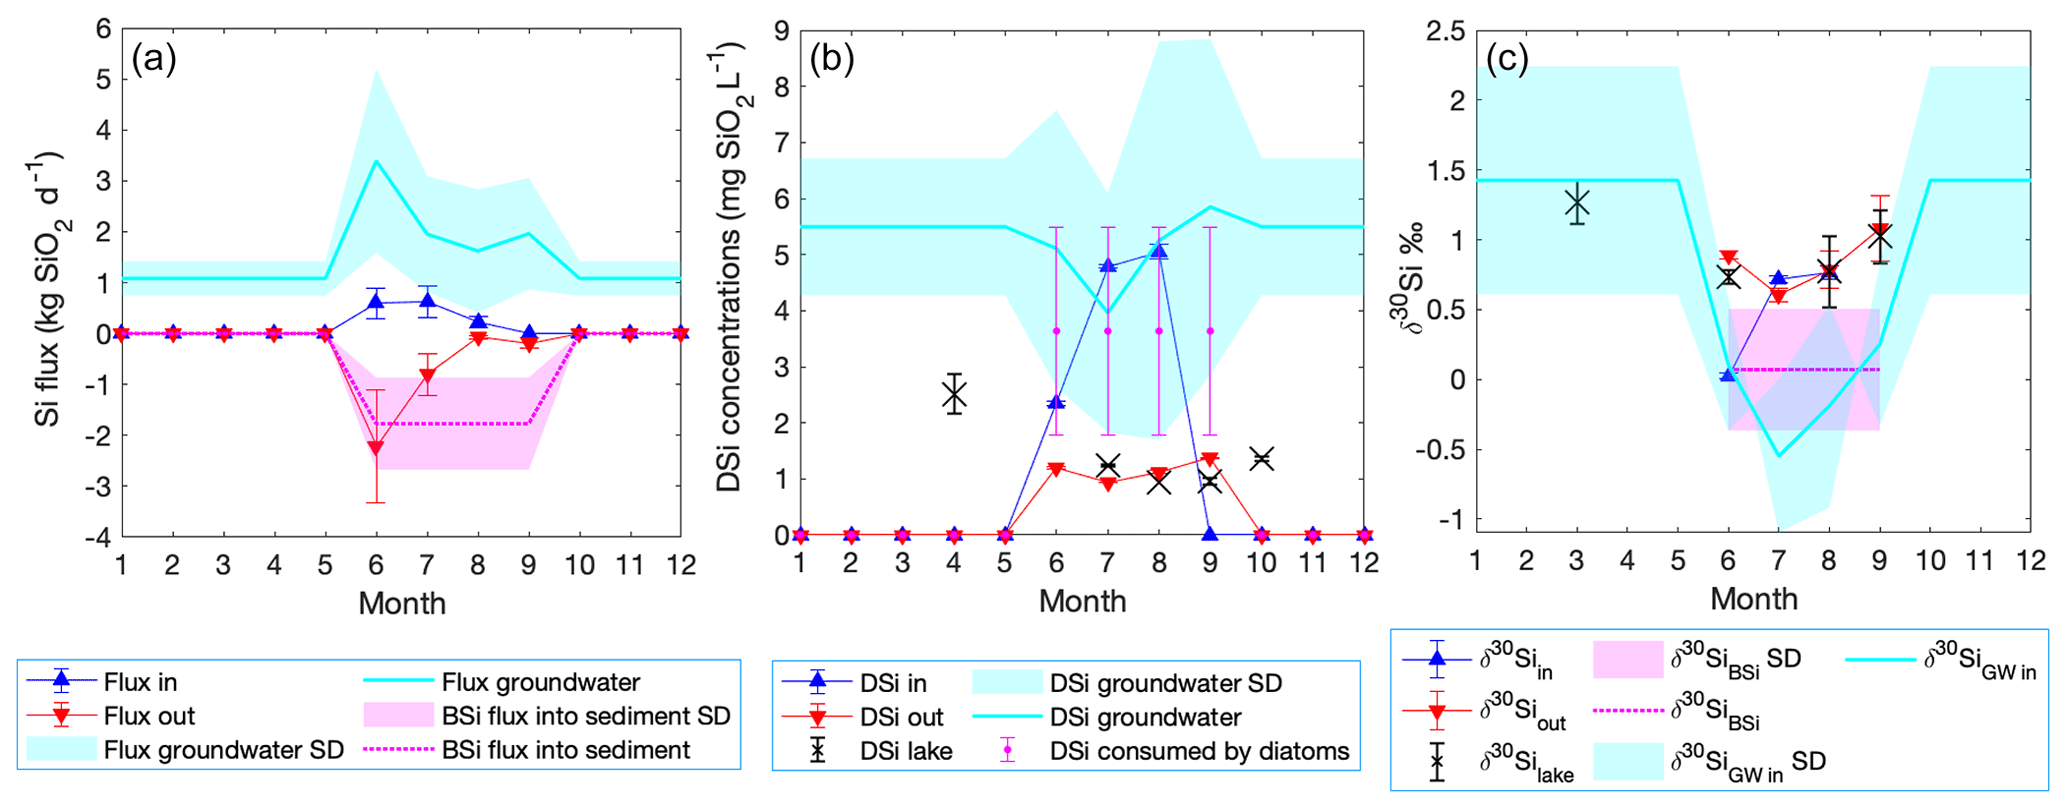
Figure 6Si and Si isotope mass balance model of Lake 850 throughout the year. (a) Mass balance showing the stream DSi influx (blue triangles), the lake outlet DSi outflux as negative flux (red triangles), and the diatom BSi flux based on a diatom bloom season lasting 4 months (magenta dotted line), also as a negative flux. The calculated groundwater DSi flux is shown as a positive flux (cyan line). (b) The monthly changes in the DSi concentration of the inlet (blue triangles), outlet (red triangles), lake (black crosses), diatom DSi uptake (magenta circles), and groundwater (cyan line). (c) The stable Si mass balance showing monthly variation in the isotopic composition of all DSi sources and sinks. Shading and error bars represent uncertainties.
7.3 The role of groundwater in Si concentration mass balance and Si isotope mass balance
The lake Si mass balance (Fig. 6a) shows that modeled groundwater concentration and flux of BSi vary through the year, which is similar to observations from Crystal Lake in Wisconsin (Hurley et al., 1985). Seasonal variations in groundwater DSi concentration related to discharges were also observed in Canadian rivers with groundwater inputs (Maavara et al., 2018). Moreover, the calculated BSi flux into the sediment is comparable (or higher) with BSi fluxes observed in some of the North American Great Lakes (Conley, 1988; Newberry and Schelske, 1986; Schelske, 1985) and lakes with diatomaceous sediment in the Arctic (McKay et al., 2008; Kaplan et al., 2002; Tallberg et al., 2015).
The model of stable Si isotopes shows little variation during the ice-covered period, as no diatom production is expected. The modeled δ30Si of groundwater for the ice-covered period (Fig. 6c) falls into the range of measured groundwater isotopic composition worldwide, which ranges from −1.5 ‰ to 2 ‰ (Frings et al., 2016). However, the modeled groundwater ratio δ30Sigw is heavier than found in other groundwater studies (Georg et al., 2009; Opfergelt et al., 2011; Ziegler et al., 2005), which may reflect lower dissolution of primary minerals, longer groundwater residence time, and possibly some clay mineral formation in the groundwater pathway (Frings et al., 2016; Pokrovsky et al., 2013) during the ice-covered period. Further, no diatom production, and thus no associated Si isotope fractionation, is expected in winter. Therefore, the δ30Silake is influenced by the input of δ30Sigw only and not by diatom production. The δ30Silake measured in March is slightly lighter than all modeled δ30Sigw for the ice-covered period, which can be explained by diatom dissolution in the uppermost sediment layers. However, if the uncertainties of the modeled groundwater isotopic composition are taken into account, the lake ratio is within the same range as the groundwater ratio. Therefore, no additional processes must be present during the ice-covered period, and the groundwater isotopic ratio is reflected in the lake isotopic signal. With snowmelt, the decrease in the modeled δ30Sigw reflects the increase in weathering of primary minerals and decrease in the groundwater residence time due to higher discharges, as also observed in Arctic rivers (Pokrovsky et al., 2013).
The greatest variation in the isotopic ratio of groundwater occurs in August, when the modeled groundwater isotopic composition is fully dependent on the changes in BSi flux into the sediment. As the yearly BSi accumulation occurs during the diatom growing season which is only 4 months, the modeled groundwater must bring additional DSi to supply diatom production. Hence, the isotopic model calculating the groundwater isotopic composition shows δ30Sigw comparable with values for groundwater reported in a small number of other studies (Frings et al., 2016; Opfergelt et al., 2011). Further, the calculated δ30SiBSi based on the initial mixture of the modeled groundwater and stream inlet ratio gives results within the range of the measured δ30SiBSi.
7.4 Model uncertainties
The largest sources of uncertainty in the water and silicon balance models (Figs. 5, 6, and A1) are the discharge uncertainties of the inlet and outlet and the winter groundwater discharges. The spring snowmelt dynamically changes the inlet and outlet discharges, as has been observed on rivers in the area, such as Miellejohka (Fig. S1). With only a single sample every month, there is no information on variation in the stream on a finer temporal scale. Thus, monthly stream flow and the modeled groundwater discharges might be over- or underestimated. Further, uncertainties in the isotopic model and the isotopic composition of the groundwater were propagated from the mass balance model and from the stable isotopic measurements, especially in the outlet water in August.
The water balance based on modeled groundwater inflow suggests that lake-level changes throughout the year are within a range of 0 to 1.4 m (Fig. 5, green line), and, thus, lake area and mean depth also vary throughout the year. Therefore, the underlying assumptions of constant depth and area likely overestimate lake-level change. For a more precise model of lake level, lake volume variations and a detailed bathymetry of Lake 850 are needed. However, the importance of the groundwater contribution to Lake 850 supports the evidence that groundwater should be considered as an important water and DSi source for high-altitude and high-latitude lakes, with support of data on groundwater DSi in Lake O'Hara (Hood et al., 2006), Lake Mývatn (Opfergelt et al., 2011), and Crystal Lake (Hurley et al., 1985; Kenoyer and Anderson, 1989).
Another source of uncertainties in the Si and Si isotope mass balance models originates from the uncertainties on the age–depth model. The uncertainties on MAR, which are calculated from the SAR and the densities, are as high as 50 %. The high uncertainties in the sediment density and SAR are likely due to changes in the sediment composition and increased content of mosses. Therefore, the BSi flux to the sediment carries similar or higher uncertainty. As a result of those uncertainties, the modeled groundwater concentrations and isotopic composition range greatly.
Additionally, the diatom preservation efficiency, which is globally around 3 % in the oceans (Treguer et al., 1995) and around 1 %–2 % in deep lakes (Ryves et al., 2003) of the total diatom production, suggests that 97 %–99 % of diatom BSi is redissolved in the water column in those environments. However, no estimates of sediment preservation efficiency are available for small, cold lakes such as Lake 850. Therefore, the mass balance can be slightly underestimated, in the case that the BSi flux into the sediment, which was calculated from the sediment record, represents only a fraction of the total production. To eliminate this source of uncertainty, annual monitoring of diatom production and accumulation would be needed.
Uncertainty also results from the variability among sediment cores in their BSi content. BSi concentrations in the sediment vary from 13 wt % to 40 wt % in different cores (this study; Rosén et al., 2010). We have tested the combination of the MAR (16.0 mg cm−2 yr−1) reported from this study with the highest BSi of 40.3 wt % from a companion core from Lake 850 (Rosén et al., 2010) to evaluate the impact of BSi flux on the groundwater concentrations. The yearly BSi flux would need to increase by a factor of 2.2, which would result in 1.3 to 2.6 times higher groundwater DSi concentration to support the BSi flux and keep Lake 850 at steady state. However, the BSi content is variable within the sedimentary basin, and thus the sedimentation rate is a crucial factor for the estimate of BSi accumulation. For future model improvement, monitoring of all inlets, groundwater, pore water, and the outlet together with sediment traps to constrain the production, BSi flux, and dissolution would be needed.
The diatom-rich sediment in Lake 850 is formed because of high DSi supply by groundwater during the diatom growing season coupled with low sedimentation rates, which fosters a high accumulation of diatoms in the form of BSi. Water and Si mass balance demonstrated the importance of groundwater as a source of water and DSi, with fluxes that are 3 times greater than stream input. Groundwater supplies lighter δ30Si, which is reflected in the lighter diatom δ30Si ratio. By quantifying the groundwater inputs, the Si and Si isotopic mass balances allowed for the estimate of the stable Si isotope ratios of groundwater throughout the year. The modeled isotopic ratio of groundwater falls into the same range as the world groundwater δ30Si ratio (Frings et al., 2016; Sutton et al., 2018).
Lakes on silica-rich bedrock, with low allochthonous input, low sedimentation rates, low-relief watershed geomorphology, and high groundwater input have high potential to accumulate BSi. These water bodies with high BSi accumulation act as important sinks of Si in the global Si cycle. Our results support the importance of groundwater in the lake silicon budget and suggest that this process should not be overlooked in future investigations on BSi in lakes and global estimates of the terrestrial lake BSi sink.
A1 Modeling groundwater Rn fluxes
Radon fluxes from Lake Almberga from the Abisko region were estimated using the same approach in summer and autumn 2018 and 2019 (C. Olid, unpublished data). The derived Rn fluxes obtained from the lake survey were used here to model groundwater fluxes through the year in Lake 850. To do this, we divided the estimated groundwater Rn flux from the Rn mass balance in Lake 850 in September (178±39 Bq m−2 d−1) by the mean groundwater Rn flux obtained from the lake survey in September (104±10 Bq m−2 d−1, C. Olid, unpublished data). The derived ratio (1.71) was then multiplied by the mean groundwater Rn fluxes from the lake survey to model the groundwater Rn fluxes in Lake 850 for those months when Rn measurements were not available (June, July, and September). Rn fluxes through groundwater during the ice-covered period were assumed to be 59 % of September fluxes (C. Olid, unpublished data; Fig. 2; Table A1). The groundwater Rn flux from November to April was assumed to be constant and equal to April estimations.
Table A1Estimated Rn fluxes in August and September with the derived water discharges through groundwater based on the Rn mass balance.
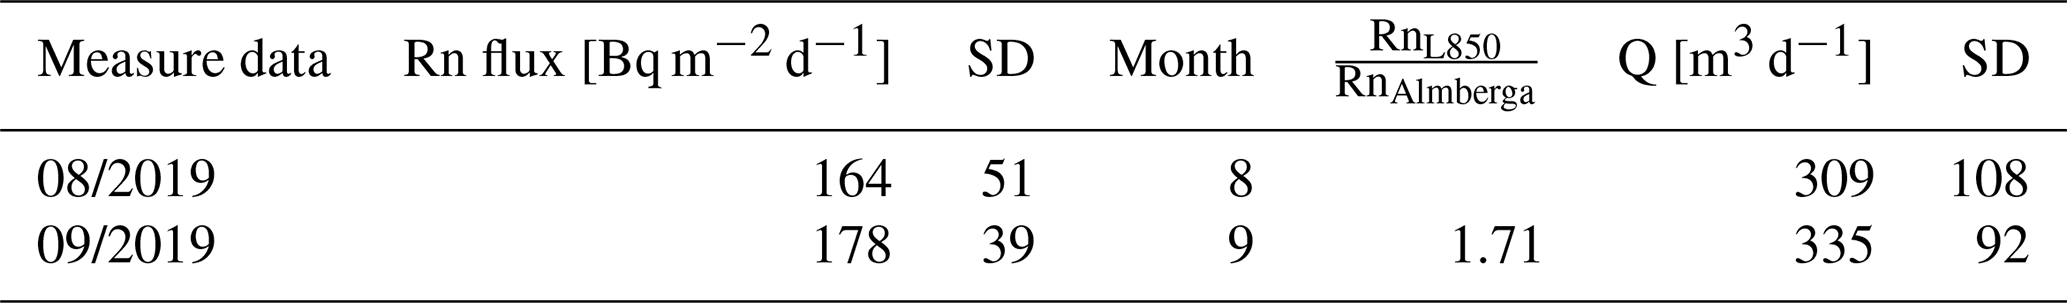
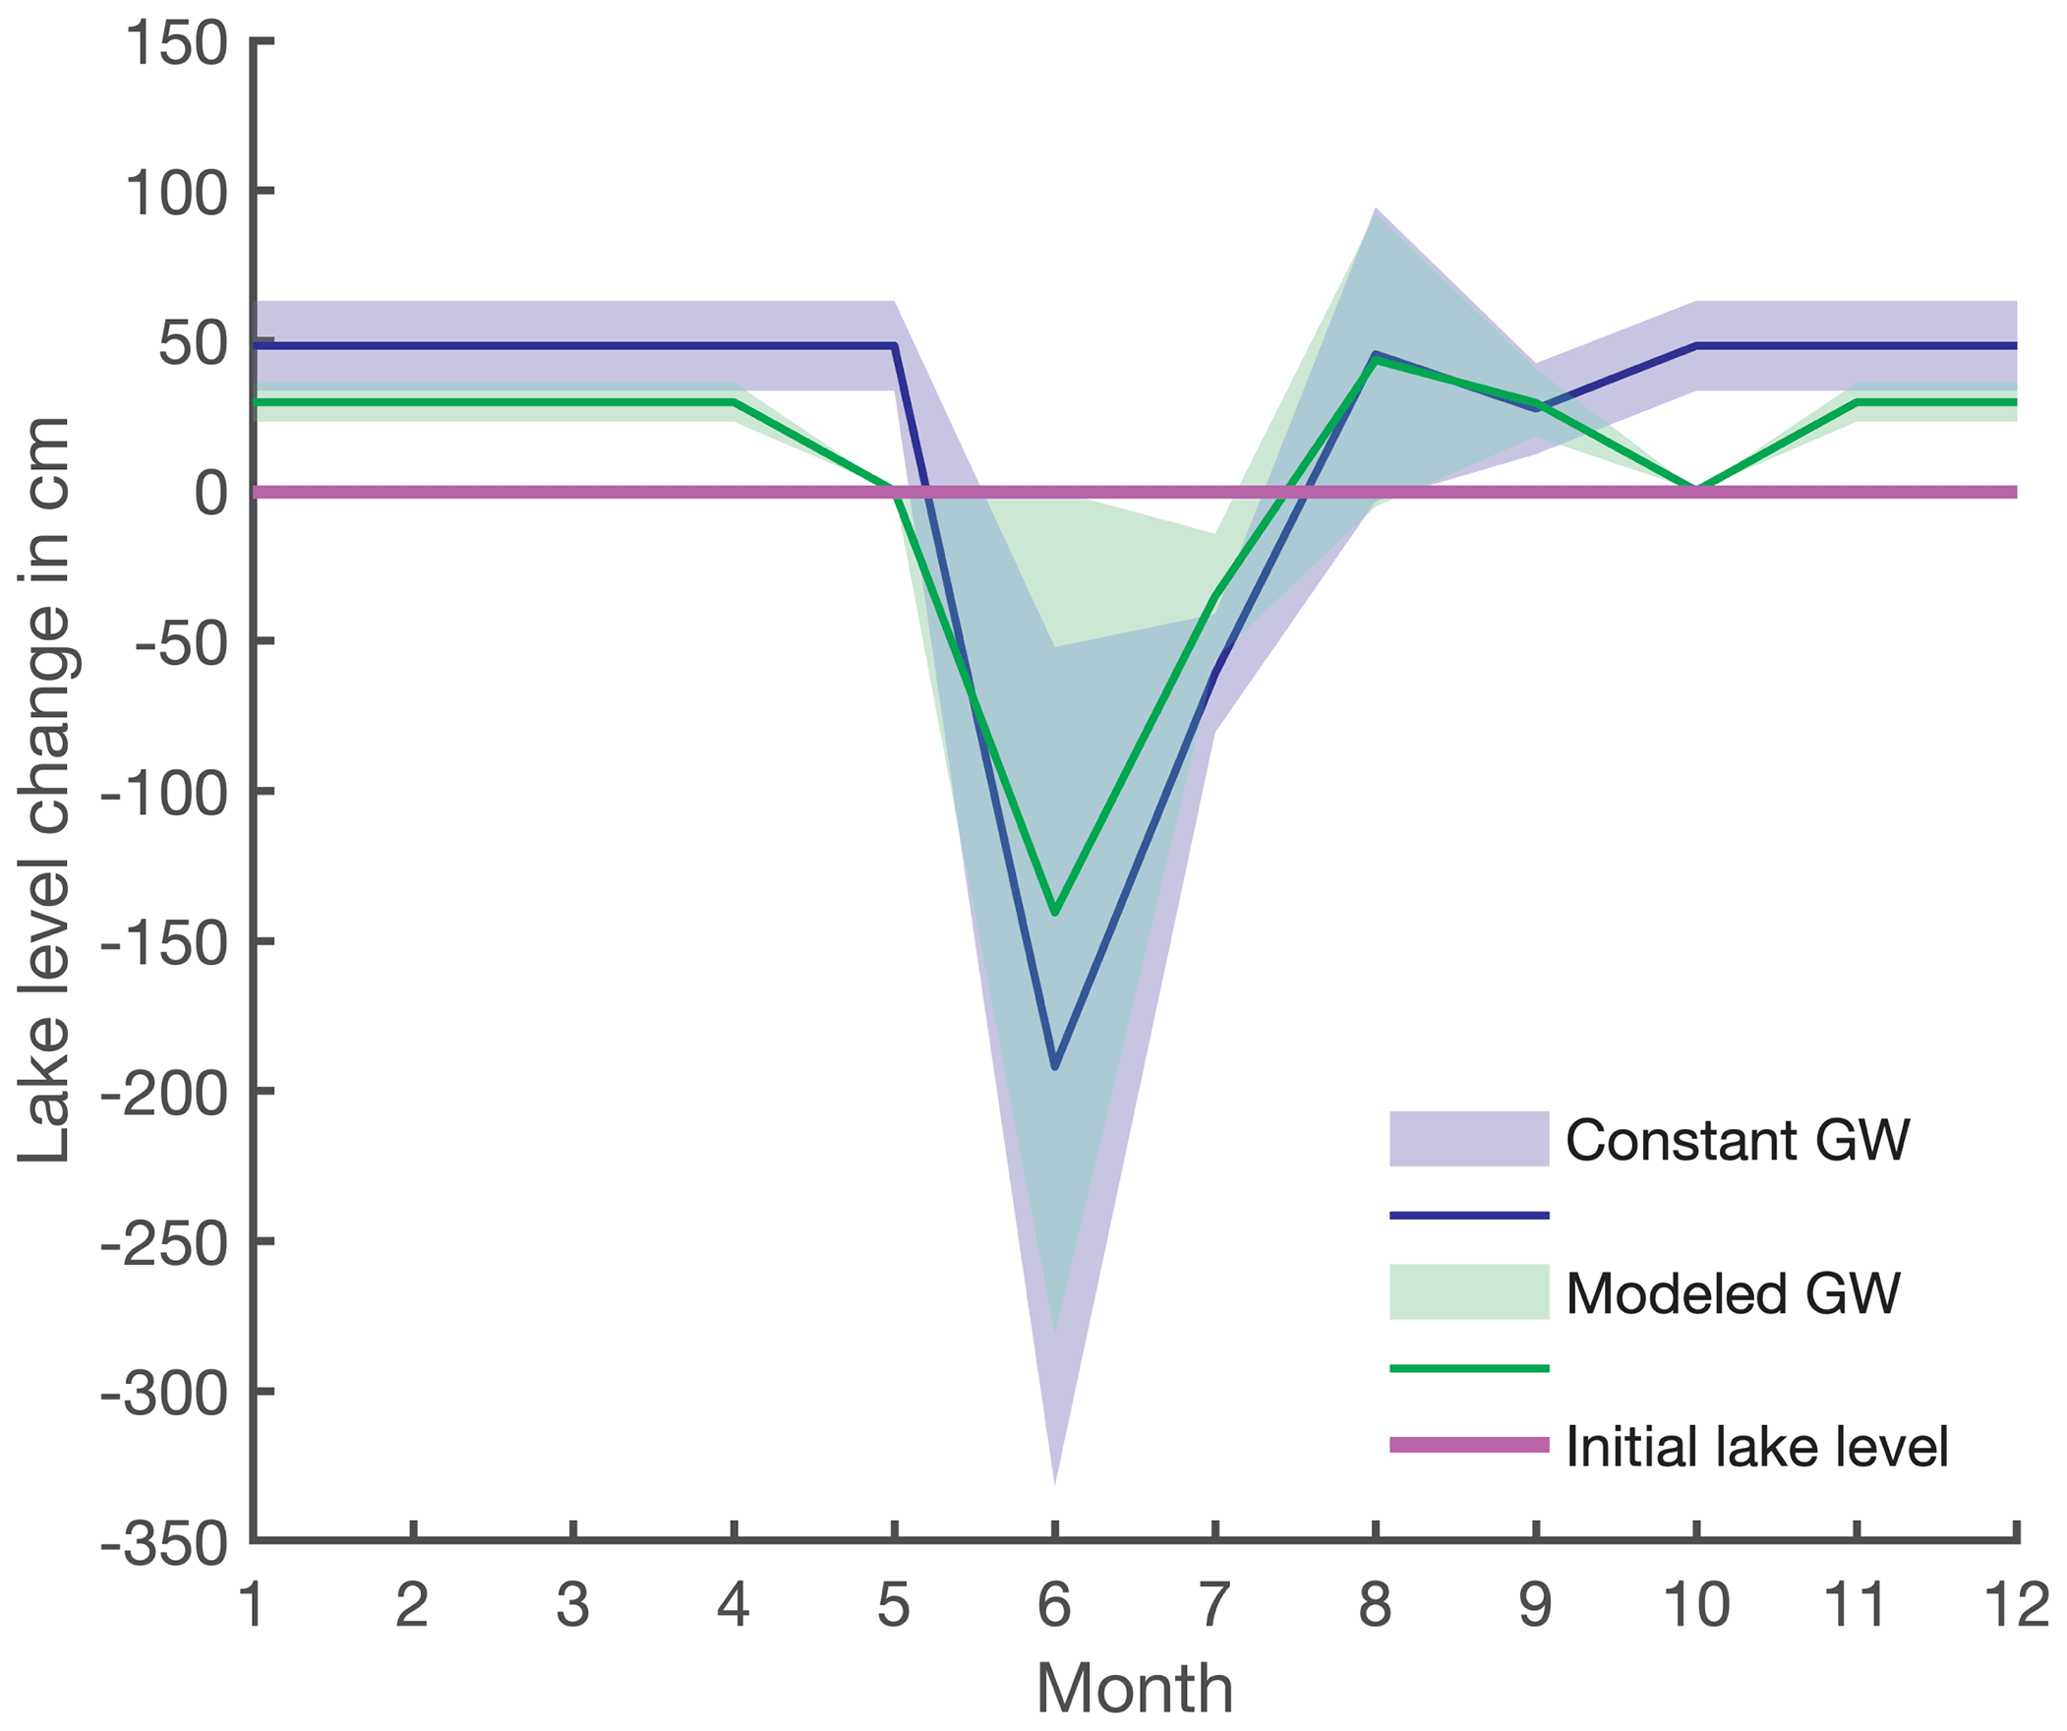
Figure A1Estimated lake-level variation between neighboring months throughout the year with uncertainties as shading. No lake-level change is depicted by the solid purple line. The blue line presents lake-level increase or decrease from one month to another with constant groundwater discharge (scenario i), and the green line is the rate of lake-level variation with modeled groundwater discharges (scenario ii).
A2 Groundwater DSi and δ30Si calculations during the ice-covered period
The groundwater concentration (cgw) during the ice-covered period was calculated from the groundwater discharge, the lake volume from the water balance, and the lake DSi differences between September and March though a mixing model:
where cMar is the lake concentration in March, cSept is the lake concentration in September, VSept is the lake volume in September, and Vgw is the total volume of water brought by groundwater in 8 months. The total water volume brought by groundwater in 8 months was calculated from the modeled groundwater winter discharges (Fig. 2). The lake volume in September is taken from the water balance model, where the modeled groundwater discharges were used (Figs. 5 and A1, green line).
Similarly, the cgw during the ice-covered period in the scenario with continuous BSi flux to the sediment for a period of 8 months was calculated by adding flux into the sediment in the mixing model:
where the ϕBSi is the total flux of BSi to sediment in 8 months. The BSi flux into the sediment for 8 months was calculated as a sum of the continuous monthly BSi flux from September until March.
The isotopic composition of the groundwater during the ice-covered period, based on measured data, was calculated as
where δ30SiMar is the lake isotopic composition in March, δ30SiSept is the lake isotopic composition in September, cSept is the lake concentration in September, cgw is the concentration of groundwater during the ice-covered period (Eqs. A1 or A2, depending on model), Vgw is the total volume of water brought by groundwater in 8 months, and VSept is the lake volume in September.
A3 Silicon isotope mass balance – δ30Sigw calculation
Due to the high groundwater input in Lake 850 proven by the Rn mass balance (see Sect. 5.2 Groundwater discharge), the inlet δ30Si does not represent the initial δ30Si used by diatoms. Therefore, the initial δ30Si of DSi is a mixture of groundwater δ30Si and inlet δ30Si flux weighted. The δ30Siinitial was calculated from δ30Sipostuptake, which equals δ30Silake, as
Further, the groundwater δ30Sigw which fits the measured data and keeps the steady state, was calculated as
The Si and Si isotopic mass balance models were tested for two extreme scenarios to model the highest and the lowest possible concentration of groundwater brought into the lake. Further, a scenario based on recent diatom growth season is modeled (Table B1). The DSi concentration and isotopic composition from the inlet and outlet streams are similar in all three scenarios. The groundwater DSi concentrations and isotopic composition are calculated from the groundwater fluxes influenced by the three potential BSi fluxes into the sediment, representing three possible lengths of diatom production. All scenarios use the open-system isotopic model (Varela et al., 2004) to describe the effect of diatom production on the lake water δ30Si ratio. The difference between the first and second scenarios is the BSi flux into the sediment: scenario (1) considers BSi flux into the sediment throughout the whole year representing lack of an ice-covered period, and scenario (2) considers BSi flux into sediment only present from June until September (Shemesh et al., 2001). Scenario (3) utilizes the open-system isotopic model only for June, with no diatom production the rest of the year, and thus no fractionation in the lake, which describes lake behavior with only a short ice-free period. Here we describe only scenarios 1 and 3, whereas in the main text scenario 2 is presented and discussed.
Table B1A summary of all three scenarios, which were examined through Si and Si isotope mass balance models.
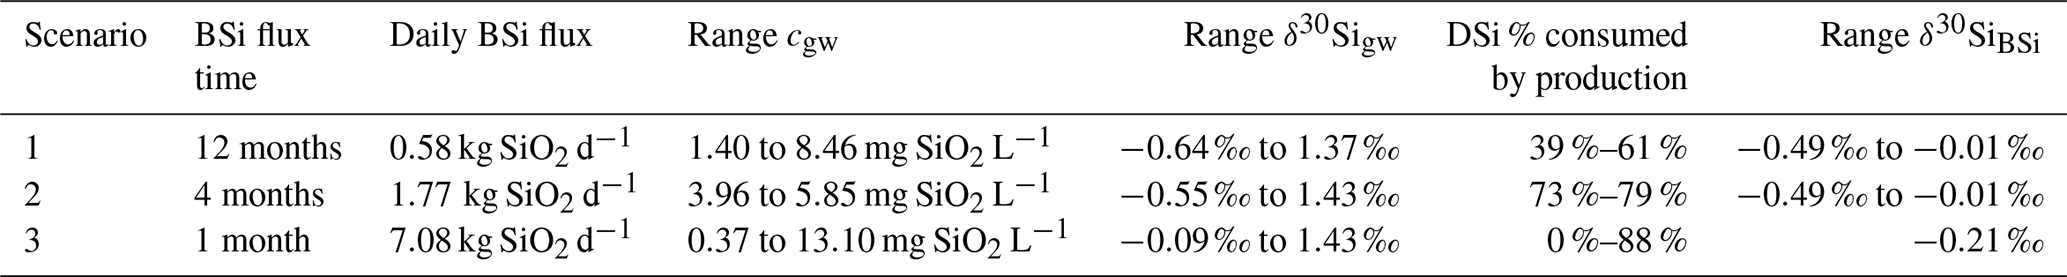
B1 Scenario 1: 12 months of BSi flux into sediment
A scenario assuming a constant BSi flux to the sediment throughout the year (magenta line, Fig. B1a) simulates a situation when climate is warming, and the diatom growth season is prolonged to maximum. Additionally, this scenario was characterized by the minimal groundwater fluxes and DSi concentrations. The DSi removal by diatoms is of 1.21±0.62 mg SiO2 L−1 monthly (magenta points, Fig. B1b). Therefore, with an added BSi flux of 0.58±0.29 kg SiO2 d−1, the lake inlet does not supply sufficient DSi for diatoms to grow. The groundwater DSi concentration is calculated as the DSi flux needed to keep the lake balanced and sustain the diatom production. The groundwater flux of DSi varies from 0.43±0.51 to 2.20±1.37 kg SiO2 d−1, depending on the season (cyan line, Fig. B1a). The highest groundwater DSi flux occurs in June, followed by a decreasing trend towards August, when it reaches the minimum. From August until November, the groundwater DSi flux increases and is stabilized after November, and it is constant until May. From the calculated groundwater flux, the groundwater concentration is between 1.40±1.59 and 3.32±1.93 mg SiO2 L−1 during the ice-free period, and, when combined with the lake DSi deficiency at the end of the season, it is 8.46±0.40 mg SiO2 L−1 (cyan line, Fig. B1b) in the ice-covered period.
In scenario 1, with constant BSi flux into the sediment during the whole year of 0.58±0.29 kg SiO2 d−1, high superficial and groundwater discharges occur in June, with DSi concentrations of 2.34 and 3.32 mg SiO2 L−1, respectively (Fig. B1b). The stream inlet has a light isotopic ratio of ‰. The initial DSi available for diatoms is a mixture of the groundwater and the stream inlet, with ‰. The groundwater was calculated from the δ30Siinital to have an isotopic ratio of ‰ in June. Thus, the expected BSi isotopic ratio was calculated to be ‰, which is within the range of mean measured ‰ in the top sediment layers. The diatom production consumes approximately 61 % of the DSi influx in June.
Although groundwater discharge culminates in July, compared with the decreasing trend in the stream inlet, the isotopic composition of the lake in July is influenced by both the groundwater and the stream. The DSi concentration of the inlet is 4.79±0.03 mg SiO2 L−1, but with 4 times lower discharge than groundwater. The calculated groundwater DSi concentration from the steady-state model is only 1.56±0.95 mg SiO2 L−1 (Fig. B1b). Further, the initial isotopic mixture for diatom growth ‰ is composed of the stream ‰ and the groundwater ‰ (Fig. B1c). The expected BSi isotopic ratio is ‰, which still falls within the mean measured ‰ in the sediment. The diatom production in July consumes 58 % of the DSi.
In August, the isotopic compositions of the stream inlet, lake, and outlet are similar. The DSi concentration of the inlet is at its maximum, with an isotopic composition of 0.78±0.15 ‰, but due to a very low inlet discharge it does not affect the lake. The concentration and isotopic ratio of the outlet and the lake are almost identical; thus, the groundwater input is 1.40±1.59 mg SiO2 L−1 of DSi (Fig. B1b), with an isotopic ratio of ‰ (Fig. B1c). The expected BSi isotopic ratio is ‰, which is in agreement with the mean measured δ30SiBSi in the diatoms from sediment. The diatom production in August consumes 39 % of the lake DSi.
September is the last month before the lake is ice-covered. There is no stream inlet, as the watershed is snow-covered. The groundwater input, with a concentration of 2.31±1.03 mg SiO2 L−1, is 4 times higher than the removal by the lake outlet. This suggests that the lake level changes throughout seasons, which is not considered in any of the Si mass balance and isotopic models examined. The lake DSi of 1.37±0.04 mg SiO2 L−1 is fully influenced by groundwater and diatom production. The groundwater isotopic ratio is 0.65±0.55 ‰, and the diatom production uses 41% of the lake DSi. The expected BSi isotopic ratio is ‰, which is in agreement with the mean measured δ30SiBSi in the diatoms from sediment.
This scenario assumes that the groundwater concentration during the ice-covered lake is recharging the lake DSi, while the BSi flux into the sediment is still present (Fig. B1b). Applying the mixing model (Eqs. A2 and A3), groundwater DSi concentration (8.46±0.40 mg SiO2 L−1), groundwater discharge, lake volume change during the ice-covered period, and the difference of the isotopic composition of the lake water between September (1.02±0.24 ‰) and March (1.27±0.10 ‰), the isotopic ratio of the groundwater is calculated to be 1.37±0.55 ‰ (Fig. B1c).
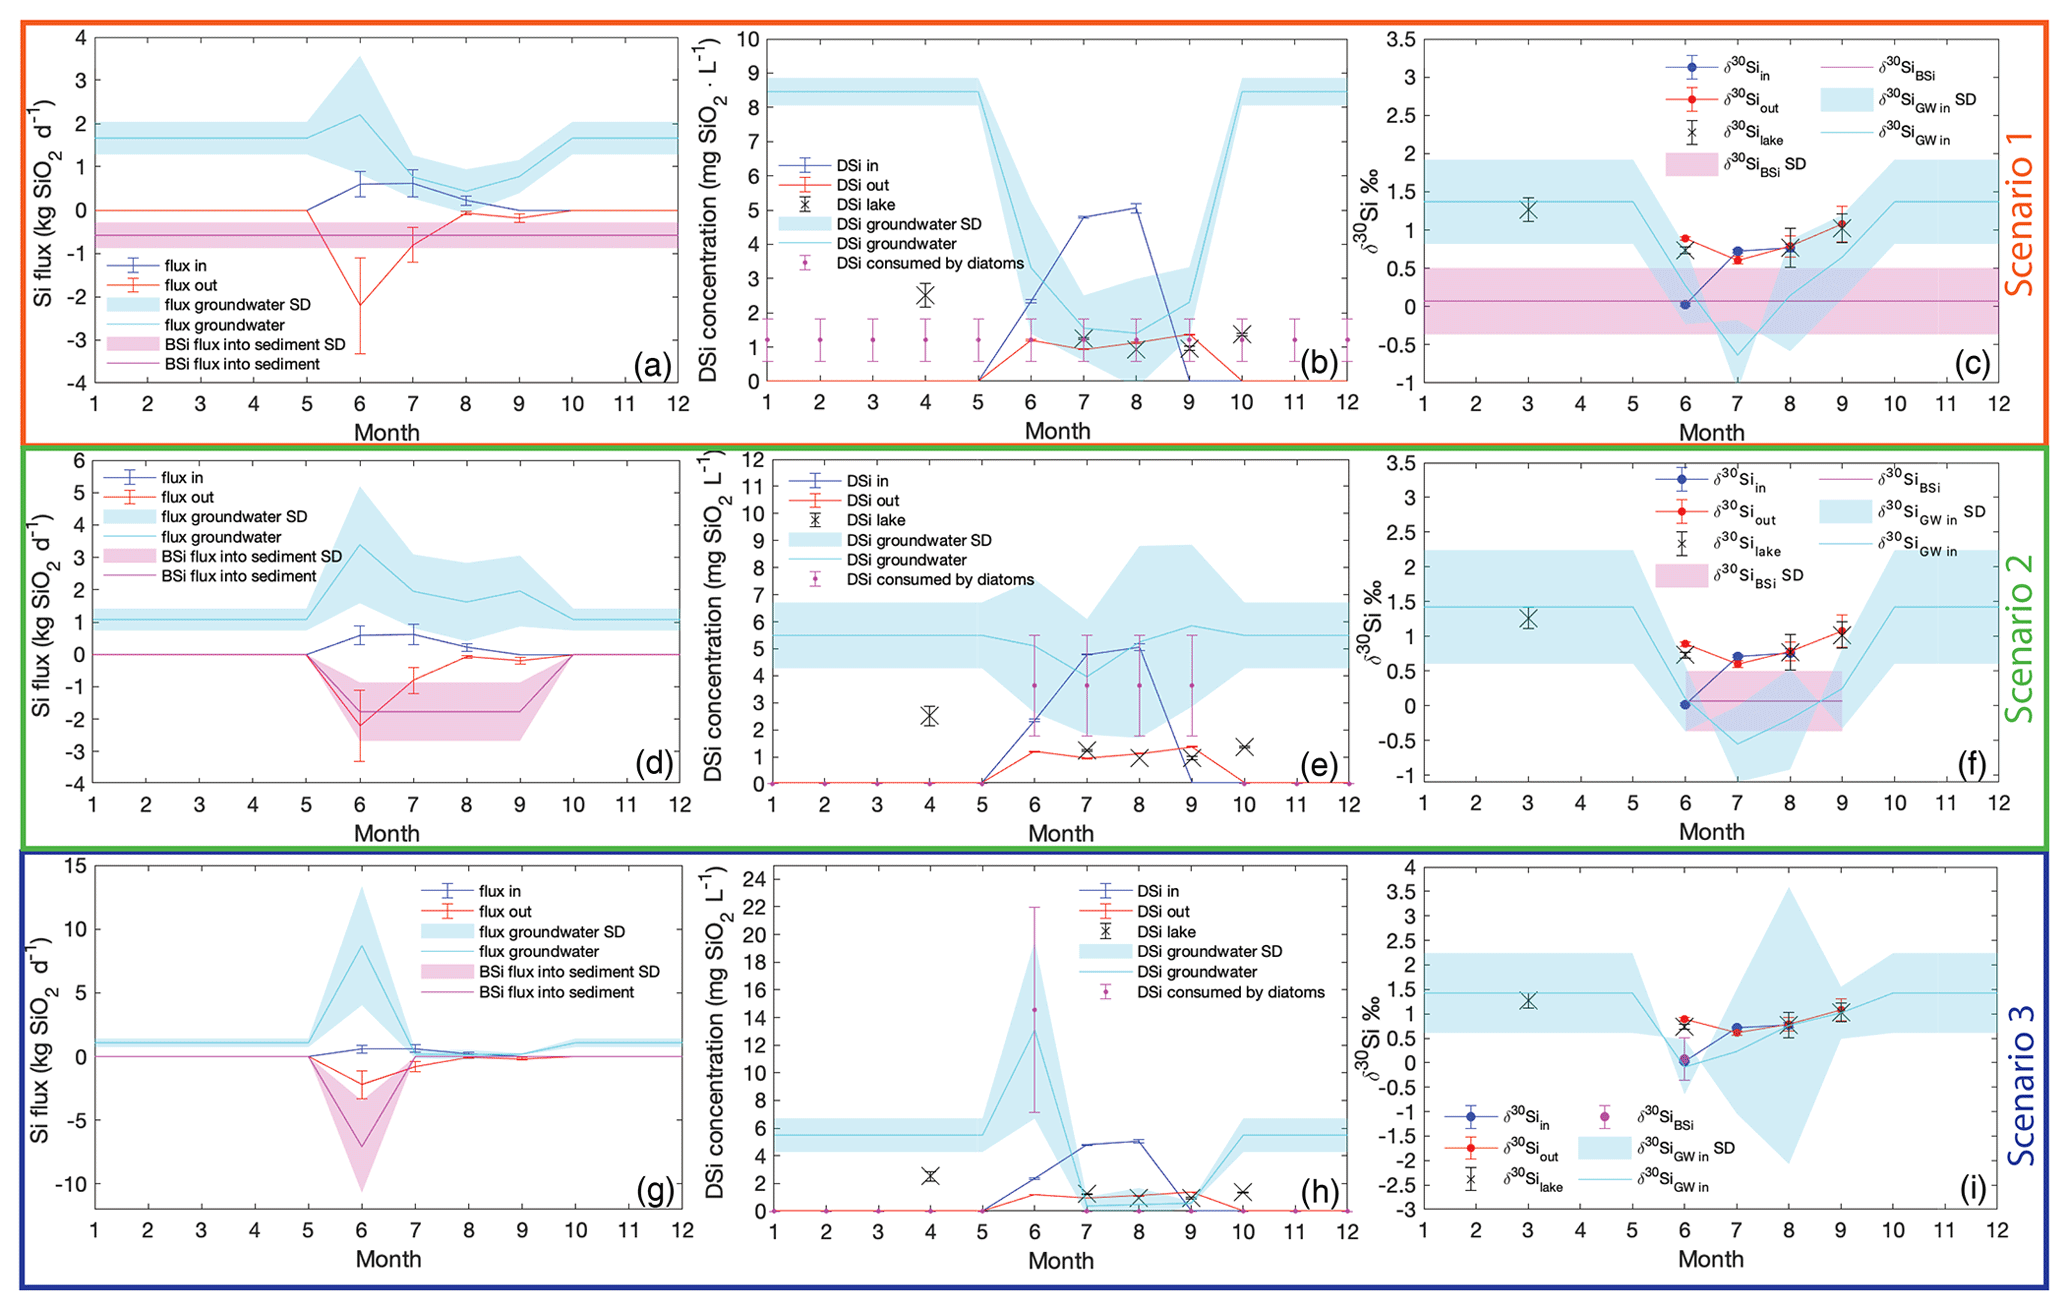
Figure B1Inlet (blue), outlet (red), and groundwater (cyan), and the BSi (magenta) fluxes, concentrations, and isotopic composition. Scenario 1: the constant BSi flux into sediment (a) influences the groundwater DSi concentration (b) and the silicon isotopic composition (c). Scenario 2: the effect of BSi flux adjusted to the diatom bloom season of 4 months (d) on the groundwater concentration (e) and isotopic composition (f). Scenario 3: the diatom bloom represented by the BSi flux into the sediment is restricted to 1 month only. During June all BSi accumulated for 1 year is produced, and the groundwater concentration (h) and the isotopic composition (i) are affected.
B2 Scenario 3: only 1 month of BSi flux into the sediment
The third scenario is based on the inlet and outlet DSi fluxes but assumes that diatom production occurs only in June. This scenario could occur if the climate were to experience cooling and the diatom growth period were extremely shortened. Additionally, this scenario demonstrated the highest groundwater concentrations during the diatom growing season. The rest of the year diatom production, and so the BSi flux into the sediment, is negligible or zero. Therefore, the yearly accumulated BSi settles into the sediment within 1 month, which yields a BSi flux of 7.08±3.62 kg SiO2 d−1 (magenta line, Fig. B1g). In this scenario, groundwater input must be from 0.15±0.37 to 8.70±4.59 kg SiO2 d−1, and the DSi concentration ranges between 0.38±0.66 and 13.10±6.41 mg SiO2 L−1 during the ice-free period (cyan line, Fig. B1h). Similar to the second scenario (in the main text), to restore the lake DSi concentration during the ice-covered period from late October to mid-June, groundwater DSi concentration is around 5.50±1.22 mg SiO2 L−1.
Scenario 3 assumes the BSi flux into the sediment occurs only in June, and the rest of the year there are no processes causing stable Si isotope fractionation. This scenario originates from data in August and September, when the δ30Si of inlet, outlet, and lake are very similar. Only in June is there fractionation between the lake stream inlets and the lake, which is described by the open-system-fractionation model. Therefore, the groundwater concentration in June increases to 13.10±6.41 mg SiO2 L−1 (Fig. B1h), with an isotopic ratio of ‰ (Fig. B1i) to sustain the diatom production represented by BSi flux into the sediment. The production consumes 88 % of the available DSi.
In July, August, and September the groundwater DSi concentration is low, as the lake does not have any production and thus no demand on the DSi. The isotopic composition of the groundwater is 0.38±0.66 ‰, 0.48±1.19 ‰, and 0.57±0.14 ‰, respectively (Fig. B1i). High uncertainties in the isotopic composition of the groundwater reflect the uncertainties in the stream and groundwater discharges and fluxes.
Scenarios 1 and 3 of Si mass balance (Table B1, Fig. B1a and g) demonstrate how the groundwater concentration would change with changes of length of diatom production. It is likely that the diatom growth season would be driven by the changes in climate and thus the ice-free period length. Our models aimed to estimate the changes in the lake DSi and Si balance in those extreme changes of growing season driven by changes in climate. However, the groundwater concentrations are commonly higher than the superficial streams (Frings et al., 2016; Maavara et al., 2018; Opfergelt et al., 2011), which is not the case in scenarios 1 and 3. The groundwater DSi concentrations are lower than in the stream inlet during the ice-free period in those two scenarios (Fig. B1b and h), which suggests that those scenarios have either missing or surplus data of the inlet and outlet DSi concentration and discharges. A more complex model with variable discharges of groundwater and stream inlets and outlet depending on precipitation and evaporation changes would be needed. Therefore, those two scenarios provide only a rough estimate hinting at the changes in DSi and Si isotopic mass balances connected to changes in climate.
All data, if not directly available in tables and appendices, are available in the PANGAEA database (doi:10.1594/PANGAEA.929941). Alternatively all data are available upon request to the authors.
The supplement related to this article is available online at: https://doi.org/10.5194/bg-18-2325-2021-supplement.
PZ and DJC designed the research. PZ and CO carried out the fieldwork. CO performed radon measurements and radon mass balance. PZ performed the TOC, TN, BSi, DSi, and stable Si isotope analyses and performed the data processing. All authors contributed to discussion and data interpretation. PZ and CO wrote the paper with contributions and comments provided by JS, SCF, SO, and DJC.
The authors declare that they have no conflict of interest.
We also thank Aldo Shemesh for providing diatom samples and Christian Bigler, Reiner Gielser, and Carl-Magnus Mörth for advice and help with fieldwork design. Further, we thank the organizations and the individuals who helped with the fieldwork and provided us with equipment and advice: Thomas Westin, Keith W. Larson, Erik Lundin, Svante Zachrisson, CIRC, and field assistants Albin Bjärhall, Mathilde Schnuriger, Lukas Guth, Rosine Cartier, Geert Hensgens, and Jan Foniok. We acknowledge Hans Schöberg and Melanie Kielman for assistance during sample preparation and isotope data acquisition. This is Vegacenter contribution number no. 036.
This research has been supported by the Kungliga Fysiografiska Sällskapet i Lund (grant nos. 38469, 39787, and 40283) and by the Center for Geospehere Dynamics (UNCE/SCI/006) for Petra Zahajská. Further, this research was funded by the Vetenskapsrådet (grant awarded before 2014, no award number) attributed to Daniel J. Conley, the Svenska Forskningsrådet Formas (grant no. 2018-01217) allocated to Carolina Olid, the NSF EAR-1514814 assigned to Sherilyn C. Fritz, and the Fonds National de la Recherche Scientifique (FNRS, Belgium, FC69480) ascribed to Sophie Opfergelt.
This paper was edited by Jack Middelburg and reviewed by three anonymous referees.
ANS: Meteorological data from Abisko Observatory, daily mean 1913-01-01–2019-01-01, Abisko Scientific Research Station, Abisko, Sweden, 2020. a, b, c
Aquino-López, M. A., Blaauw, M., Christen, J. A., and Sanderson, N. K.: Bayesian Analysis of 210Pb Dating, J. Agric. Biol. Envir. St., 23, 317–333, https://doi.org/10.1007/s13253-018-0328-7, 2018. a, b
Barker, P. A., Hurrell, E. R., Leng, M. J., Plessen, B., Wolff, C., Conley, D. J., Keppens, E., Milne, I., Cumming, B. F., Laird, K. R., Kendrick, C. P., Wynn, P. M., and Verschuren, D.: Carbon cycling within an East African lake revealed by the carbon isotope composition of diatom silica: a 25-ka record from Lake Challa, Mt. Kilimanjaro, Quaternary Sci. Rev., 66, 55–63, https://doi.org/10.1016/j.quascirev.2012.07.016, 2013. a, b
Battarbee, R. W., Jones, V. J., Flower, R. J., Cameron, N. G., Bennion, H., Carvalho, L., and Juggins, S.: Diatoms, in: Tracking environmental change using lake sediments, edited by: Smol, J. P., Birks, H. J. B., Last, W. M., Bradley, R. S., and Alverson, K., Springer, Dordrecht, The Netherlands, 155–202, https://doi.org/10.1007/0-306-47668-1_8, 2002. a
Bigler, C. and Hall, R. I.: Diatoms as indicators of climatic and limnological change in Swedish Lapland: a 100-lake calibration set and its validation for paleoecological reconstructions, J. Paleolimnol., 27, 97–115, https://doi.org/10.1023/A:1013562325326, 2002. a
Brodie, C. R., Casford, J. S., Lloyd, J. M., Leng, M. J., Heaton, T. H., Kendrick, C. P., and Yongqiang, Z.: Evidence for bias in C/N, δ13C and δ15N values of bulk organic matter, and on environmental interpretation, from a lake sedimentary sequence by pre-analysis acid treatment methods, Quaternary Sci. Rev., 30, 3076–3087, https://doi.org/10.1016/j.quascirev.2011.07.003, 2011. a
Burnett, W. C. and Dulaiova, H.: Estimating the dynamics of groundwater input into the coastal zone via continuous radon-222 measurements, J. Environ. Radioactiv., 69, 21–35, https://doi.org/10.1016/s0265-931x(03)00084-5, 2003. a
Campbell, D. H., Clow, D. W., Ingersoll, G. P., Mast, M. A., Spahr, N. E., and Turk, J. T.: Processes controlling the chemistry of two snowmelt-dominated streams in the Rocky Mountains, Water Resour. Res., 31, 2811–2821, https://doi.org/10.1029/95wr02037, 1995. a
Chanyotha, S., Kranrod, C., and Burnett, W. C.: Assessing diffusive fluxes and pore water radon activities via a single automated experiment, J. Radioanal. Nucl. Ch., 301, 581–588, https://doi.org/10.1007/s10967-014-3157-3, 2014. a, b
Clarke, J.: The occurrence and significance of biogenic opal in the regolith, Earth-Sci. Rev., 60, 175–194, https://doi.org/10.1016/s0012-8252(02)00092-2, 2003. a
Clow, D., Schrott, L., Webb, R., Campbell, D., Torizzo, A., and Dornblaser, M.: Ground water occurrence and contributions to streamflow in an alpine catchment, Colorado Front Range, Groundwater, 41, 937–950, https://doi.org/10.1111/j.1745-6584.2003.tb02436.x, 2003. a
Conger, P. S.: Accumulation of diatomaceous deposits, Journal of Sediment. Res., 12, 55–66, https://doi.org/10.1306/d4269143-2b26-11d7-8648000102c1865d, 1942. a, b, c
Conley, D. J.: Biogenic silica as an estimate of siliceous microfossil abundance in Great Lakes sediments, Biogeochemistry, 6, 161–179, https://doi.org/10.1007/bf02182994, 1988. a
Conley, D. J.: An interlaboratory comparison for the measurement of biogenic silica in sediments, Mar. Chem., 63, 39–48, https://doi.org/10.1016/s0304-4203(98)00049-8, 1998. a
Conley, J. D. and Schelske, C.: Biogenic Silica, in: Tracking Environmental Change Using Lake Sediments, edited by: Smol, J. P., Birks, H. J. B., Last, W. M., Bradley, R. S., and Alverson, K., Springer, Dordrecht, The Netherlands, 281–293, https://doi.org/10.1007/0-306-47668-1_14, 2002. a
De La Rocha, C. L., Brzezinski, M. A., and Deniro, M. J.: Fractionation of silicon isotopes by marine diatoms during biogenic silica formation, Geochim. Cosmochim. Ac., 61, 5051–5056, https://doi.org/10.1016/s0016-7037(97)00300-1, 1997. a, b, c
Dimova, N. T. and Burnett, W. C.: Evaluation of groundwater discharge into small lakes based on the temporal distribution of radon-222, Limnol. Oceanogr., 56, 486–494, https://doi.org/10.4319/lo.2011.56.2.0486, 2011. a, b
Dimova, N. T., Burnett, W. C., Chanton, J. P., and Corbett, J. E.: Application of radon-222 to investigate groundwater discharge into small shallow lakes, J. Hydrol., 486, 112–122, https://doi.org/10.1016/j.jhydrol.2013.01.043, 2013. a
Fortin, M.-C. and Gajewski, K.: Assessing the use of sediment organic, carbonate and biogenic silica content as indicators of environmental conditions in Arctic lakes, Polar Biol., 32, 985–998, https://doi.org/10.1007/s00300-009-0598-1, 2009. a
Frings, P. J., Clymans, W., Jeppesen, E., Lauridsen, T. L., Struyf, E., and Conley, D. J.: Lack of steady-state in the global biogeochemical Si cycle: emerging evidence from lake Si sequestration, Biogeochemistry, 117, 255–277, https://doi.org/10.1007/s10533-013-9944-z, 2014. a, b, c, d
Frings, P. J., Claymans, W., Fontorbe, G., Rocha, C. L. D. L., and Conley, D. J.: The continental Si cycle and its impact on the ocean Si isotope budget, Chem. Geol., 425, 12–36, https://doi.org/10.1016/j.chemgeo.2016.01.020, 2016. a, b, c, d, e, f
Georg, R., Reynolds, B., Frank, M., and Halliday, A.: New sample preparation techniques for the determination of Si isotopic compositions using MC-ICPMS, Chem. Geol., 235, 95–104, https://doi.org/10.1016/j.chemgeo.2006.06.006, 2006. a, b, c, d
Georg, R., West, A., Basu, A., and Halliday, A.: Silicon fluxes and isotope composition of direct groundwater discharge into the Bay of Bengal and the effect on the global ocean silicon isotope budget, Earth Planet. Sci. Lett., 283, 67–74, https://doi.org/10.1016/j.epsl.2009.03.041, 2009. a
Hood, J. L., Roy, J. W., and Hayashi, M.: Importance of groundwater in the water balance of an alpine headwater lake, Geophys. Res. Lett., 33, L13405, https://doi.org/10.1029/2006gl026611, 2006. a, b, c
Hurley, J. P., Armstrong, D. E., Kenoyer, G. J., and Bowser, C. J.: Ground water as a silica source for diatom production in a precipitation-dominated lake, Science, 227, 1576–1578, https://doi.org/10.1126/science.227.4694.1576, 1985. a, b, c
Huth, A., Leydecker, A., Sickman, J., and Bales, R.: A two-component hydrograph separation for three high-elevation catchments in the Sierra Nevada, California, Hydrol. Process., 18, 1721–1733, https://doi.org/10.1002/hyp.1414, 2004. a
ISO NORM: Guide to expression of uncertainty in measurement, Corrected and Reprinted, International Organization for Standardization, Geneva, Switzerland, 1995. a
Jenny, H.: Factors of Soil Formation: A System of quantitative Pedology, McGraw-Hill, New York, USA, 1941. a, b, c, d, e, f
Johnson, T. C., Brown, E. T., and Shi, J.: Biogenic silica deposition in Lake Malawi, East Africa over the past 150,000 years, Palaeogeogr. Palaeocl., 303, 103–109, https://doi.org/10.1016/j.palaeo.2010.01.024, 2011. a
Kahle, D. and Wickham, H.: ggmap: Spatial Visualization with ggplot2, The R Journal, 5, 144–161, https://doi.org/10.32614/rj-2013-014, 2013. a
Kaplan, M. R., Wolfe, A. P., and Miller, G. H.: Holocene environmental variability in southern Greenland inferred from lake sediments, Quaternary Res., 58, 149–159, https://doi.org/10.1006/qres.2002.2352, 2002. a
Kenoyer, G. J. and Anderson, M. P.: Groundwater's dynamic role in regulating acidity and chemistry in a precipitation-dominated lake, J. Hydrol., 109, 287–306, 1989. a, b
Leng, M. J., Swann, G. E., Hodson, M. J., Tyler, J. J., Patwardhan, S. V., and Sloane, H. J.: The potential use of silicon isotope composition of biogenic silica as a proxy for environmental change, Silicon, 1, 65–77, https://doi.org/10.1007/s12633-009-9014-2, 2009. a
Liu, F., Williams, M. W., and Caine, N.: Source waters and flow paths in an alpine catchment, Colorado Front Range, United States, Water Resour. Res., 40, W09401, https://doi.org/10.1029/2004wr003076, 2004. a
Maavara, T., Slowinski, S., Rezanezhad, F., Van Meter, K., and Van Cappellen, P.: The role of groundwater discharge fluxes on Si: P ratios in a major tributary to Lake Erie, Sci. Total Environ., 622, 814–824, https://doi.org/10.1016/j.scitotenv.2017.12.024, 2018. a, b, c
MacIntyre, S., Wanninkhof, R., and Chanton, J.: Trace gas exchange across the air-water interface in freshwater and coastal marine environments, Blackwell Science, 52–97, 1995. a
McKay, N. P., Kaufman, D. S., and Michelutti, N.: Biogenic silica concentration as a high-resolution, quantitative temperature proxy at Hallet Lake, south-central Alaska, Geophys. Res. Lett., 35, L05709, https://doi.org/10.1029/2007gl032876, 2008. a
Newberry, T. L. and Schelske, C. L.: Biogenic silica record in the sediments of Little Round Lake, Ontario, Hydrobiologia, 143, 293–300, https://doi.org/10.1007/978-94-009-4047-5_37, 1986. a
Opfergelt, S. and Delmelle, P.: Silicon isotopes and continental weathering processes: Assessing controls on Si transfer to the ocen, C. R. Geosci., 344, 723–738, https://doi.org/10.1016/j.crte.2012.09.006, 2012. a, b
Opfergelt, S., Eiriksdottir, E. S., Burton, K. W., Einarsson, A., Siebert, C., Gislason, S. R., and Halliday, A. N.: Quantifying the impact of freshwater diatom productivity on silicon isotopes and silicon fl uxes: Lake Myvatn, Iceland, Earth Planet. Sci. Lett., 305, 73–82, https://doi.org/10.1016/j.epsl.2011.02.043, 2011. a, b, c, d, e, f
Pienitz, R., Doran, P., and Lamoureux, S.: Origin and geomorphology of lakes in the polar regions, Oxford University Press, Oxford, UK, https://doi.org/10.1093/acprof:oso/9780199213887.003.0002, 2008. a
Plunkett, G. M., Whitehouse, N. J., Hall, V. A., Brown, D. M., and Baillie, M. G. L.: A precisely-dated lake-level rise marked by diatomite formation in northeastern Ireland, J. Quaternary Sci., 19, 3–7, https://doi.org/10.1002/jqs.816, 2004. a
Pokrovsky, O., Reynolds, B., Prokushkin, A., Schott, J., and Viers, J.: Silicon isotope variations in Central Siberian rivers during basalt weathering in permafrost-dominated larch forests, Chem. Geol., 355, 103–116, https://doi.org/10.1016/j.chemgeo.2013.07.016, 2013. a, b, c
Reynolds, B. C., Aggarwal, J., Andre, L., Baxter, D., Beucher, C., Brzezinski, M. A., Engstrom, E., Georg, R. B., Land, M., Leng, M. J., Opfergelt, S., Rodushkin, I., Sloane, H. J., van den Boorn, S. H. J. M., Vroon, P. Z., and Cardinal, D.: An inter-laboratory comparison of Si isotope reference materials, J. Anal. Atom. Spectrom., 22, 561–568, https://doi.org/10.1039/b616755a, 2007. a
Rosén, P., Vogel, H., Cunningham, L., Reuss, N., Conley, D. J., and Persson, P.: Fourier transform infrared spectroscopy, a new method for rapid determination of total organic and inorganic carbon and biogenic silica concentration in lake sediments, J. Paleolimnol., 43, 247–259, https://doi.org/10.1007/s10933-009-9329-4, 2010. a, b, c, d, e, f
Rubensdotter, L. and Rosqvist, G.: The effect of geomorphological setting on Holocene lake sediment variability, northern Swedish Lapland, J. Quaternary Sci., 18, 757–767, https://doi.org/10.1002/jqs.800, 2003. a, b
Russell, J. M. and Johnson, T. C.: A high-resolution geochemical record from Lake Edward, Uganda Congo and the timing and causes of tropical African drought during the late Holocene, Quaternary Sci. Rev., 24, 1375–1389, https://doi.org/10.1016/j.quascirev.2004.10.003, 2005. a
Ryves, D. B., Jewson, D. H., Sturm, M., Battarbee, R. W., Flower, R. J., Mackay, A. W., and Granin, N. G.: Quantitative and qualitative relationships between planktonic diatom communities and diatom assemblages in sedimenting material and surface sediments in Lake Baikal, Siberia, Limnol. Oceanogr., 48, 1643–1661, https://doi.org/10.4319/lo.2003.48.4.1643, 2003. a, b
Schelske, C. L.: Biogeochemical silica mass balances in Lake Michigan and Lake Superior, Biogeochemistry, 1, 197–218, https://doi.org/10.1007/bf02187199, 1985. a
Schubert, M., Paschke, A., Lieberman, E., and Burnett, W. C.: Air-water partitioning of 222Rn and its dependence on water temperature and salinity, Environ. Sci. Technol., 46, 3905–3911, https://doi.org/10.1021/es204680n, 2012. a
Shemesh, A., Rosqvist, G., Rietti-Shati, M., Rubensdotter, L., Bigler, C., Yam, R., and Karlén, W.: Holocene climatic change in Swedish Lapland inferred from an oxygen-isotope record of lacustrine biogenic silica, Holocene, 11, 447–454, 2001. a, b, c, d, e, f, g, h, i, j, k, l
Strickland, J. and Parsons, T.: A practical handbook of seawater analysis, second edition, Fisheries research board of Canada, Ottawa, Canada, 1972. a, b
Struyf, E., Mörth, C.-M., Humborg, C., and Conley, D. J.: An enormous amorphous silica stock in boreal wetlands, J. Geophys. Res.-Biogeosci., 115, G04008, https://doi.org/10.1029/2010jg001324, 2010. a, b
Sun, X., Andersson, P., Land, M., Humborg, C., and Mörth, C.-M.: Stable silicon isotope analysis on nanomole quantities using MC-ICP-MS with a hexapole gas-collision cell, J. Anal. Atom. Spectrom., 25, 156–162, 2010. a
Sutton, Jill N., André, Luc, Cardinal, Damien, Conley, Daniel J., De Souza, Gregory F., Dean, Jonathan, Dodd, Justin, Ehlert, Claudia, Ellwood, Michael J., Frings, Patrick J., Grasse, Patricia, Hendry, Katharine, Leng, Melanie J., Michalopoulos, Panagiotis, Panizzo, Virginia N., Swann, and George E. A.: A review of the stable isotope bio-geochemistry of the global silicon cycle and its associated trace elements, Front. Earth Sci., 5, 112, https://doi.org/10.3389/feart.2017.00112, 2018. a, b
Swann, G. E. and Mackay, A. W.: Potential limitations of biogenic silica as an indicator of abrupt climate change in Lake Baikal, Russia, J. Paleolimnol., 36, 81–89, https://doi.org/10.1007/s10933-006-0005-7, 2006. a
Tallberg, P., Opfergelt, S., Cornelis, J.-T., Liljendahl, A., and Weckström, J.: High concentrations of amorphous, biogenic Si (BSi) in the sediment of a small high-latitude lake: implications for biogeochemical Si cycling and for the use of BSi as a paleoproxy, Aquat. Sci., 77, 293–305, https://doi.org/10.1007/s00027-014-0387-y, 2015. a
Taylor, B. N. and Kuyatt, C. E.: Guidelines for evaluating and expressing the uncertainty of NIST measurement results, United States Department of Commerce and Technology Administration, Gaithersburg, USA, 24 pp., https://doi.org/10.6028/nist.tn.1297-1993, 1994. a
Theriot, E. C., Fritz, S. C., Whitlock, C., and Conley, D. J.: Late Quaternary rapid morphological evolution of an endemic diatom in Yellowstone Lake, Wyomin, Paleobiology, 32, 38–54, https://doi.org/10.1666/02075.1, 2006. a
Treguer, P., Nelson, D. M., Van Bennekom, A. J., DeMaster, D. J., Leynaert, A., and Queguiner, B.: The silica balance in the world ocean: a reestimate, Science, 268, 375–379, https://doi.org/10.1126/science.268.5209.375, 1995. a
Tréguer, P. J. and De La Rocha, C. L.: The world ocean silica cycle, Annu. Rev. Mar. Sci., 5, 477–501, 2013. a
Turnipseed, D. and Sauer, V.: Discharge measurements at gaging stations, US Geological Survey, Reston, USA, https://doi.org/10.3133/tm3A8, 2010. a
Vachon, D. and Prairie, Y. T.: The ecosystem size and shape dependence of gas transfer velocity versus wind speed relationships in lakes, Can. J. Fish. Aquat. Sci., 70, 1757–1764, https://doi.org/10.1139/cjfas-2013-0241, 2013. a, b
Varela, D. E., Pride, C. J., and Brzezinski, M. A.: Biological fractionation of silicon isotopes in Southern Ocean surface waters, Global Biogeochem. Cy., 18, GB1047, https://doi.org/10.1029/2003gb002140, 2004. a, b, c
Wolfe, A. P., Miller, G. H., Olsen, C. A., Forman, S. L., Doran, P. T., and Holmgren, S. U.: Geochronology of high latitude lake sediments, in: Long-term environmental change in Arctic and Antarctic lakes, edited by: Pienitz, R., Douglas, M. S. V., and Smol, J. P., Dordrecht, The Netherlands, Springer, 19–52, 2004. a
Zhang, A., Zhang, J., and Liu, S.: Spatial and temporal variations of dissolved silicon isotope compositions in a large dammed river system, Chem. Geol., 545, 119645, https://doi.org/10.1016/j.chemgeo.2020.119645, 2020. a
Ziegler, K., Chadwick, O. A., Brzezinski, M. A., and Kelly, E. F.: Natural variations of δ30Si ratios during progressive basalt weathering, Hawaiian Islands, Geochim. Cosmochim. Ac., 69, 4597–4610, https://doi.org/10.1016/j.gca.2005.05.008, 2005. a
- Abstract
- Introduction
- Study area
- Numerical analyses – mass balance models
- Materials and methods
- Results
- Mass balance models
- Discussion
- Conclusions
- Appendix A: Methods
- Appendix B: Mass balance models: extreme Si and Si isotope mass balances
- Appendix C: Discussion: scenario evaluation
- Data availability
- Author contributions
- Competing interests
- Acknowledgements
- Financial support
- Review statement
- References
- Supplement