the Creative Commons Attribution 4.0 License.
the Creative Commons Attribution 4.0 License.
 | 28 May 2021
Competing effects of nitrogen deposition and ozone exposure on northern hemispheric terrestrial carbon uptake and storage, 1850–2099
Martina Franz
Sönke Zaehle
Tropospheric ozone (O3) and nitrogen deposition affect vegetation growth and, thereby, the ability of the land biosphere to take up and store carbon. However, the magnitude of these effects on the contemporary and future terrestrial carbon balance is insufficiently understood. Here, we apply an extended version of the O–CN terrestrial biosphere model that simulates the atmosphere to canopy transport of O3, its surface and stomatal uptake, the O3-induced leaf injury, and the coupled terrestrial carbon and nitrogen cycles. We use this model to simulate past and future impacts of air pollution against a background of concurrent changes in climate and carbon dioxide concentrations (CO2) for two contrasting representative concentration pathway (RCP) scenarios (RCP2.6 and RCP8.5).
The simulations show that O3-related damage considerably reduced northern hemispheric gross primary production (GPP) and long-term carbon storage between 1850 and the 2010s. The simulated O3 effect on GPP in the Northern Hemisphere peaked towards the end of the 20th century, with reductions of 4 %, causing a reduction in the northern hemispheric carbon sink of 0.4 Pg C yr−1. During the 21st century, O3-induced reductions in GPP and carbon storage are projected to decline, through a combination of direct air pollution control methods that reduce near-surface O3 and the indirect effects of rising atmospheric CO2, which reduces stomatal uptake of O3 concurrent with increases of leaf-level water use efficiency. However, in hot spot regions such as East Asia, the model simulations suggest a sustained decrease in GPP by more than 8 % throughout the 21st century. O3 exposure reduces projected carbon storage at the end of the 21st century by up to 15 % in parts of Europe, the US, and East Asia. Our simulations suggest that the stimulating effect of nitrogen deposition on regional GPP and carbon storage is lower in magnitude compared to the detrimental effect of O3 during most of the simulation period for both RCPs. In the second half of the 21st century, the detrimental effect of O3 on GPP is outweighed by nitrogen deposition, but the effect of nitrogen deposition on land carbon storage remains lower than the effect of O3. Accounting for the stimulating effects of nitrogen deposition but omitting the detrimental effect of O3 may lead to an overestimation of projected carbon uptake and storage.
- Article
(6820 KB) - Full-text XML
-
Supplement
(9306 KB) - BibTeX
- EndNote


Productivity and carbon storage in many northern hemispheric terrestrial ecosystems are affected by the limited availability of nitrogen (N; Vitousek and Howarth, 1991; LeBauer and Treseder, 2008; Zaehle, 2013). As a side effect of air pollution, increased deposition of reactive nitrogen from, e.g., anthropogenic fossil fuel burning and increased soil emissions associated with fertilizer use (Galloway et al., 2004) have the potential to fertilize these N-limited ecosystems and, thereby, enhance productivity and carbon storage (Norby, 1998; Zaehle et al., 2011; Thomas et al., 2010). However, oxidized forms of reactive nitrogen in the atmosphere (collectively referred to as NOy) are also a precursor of tropospheric ozone (O3). Ozone (O3) is a toxic air pollutant that enters plants primarily though the leaves' stomata where it can induce cellular damage (Fiscus et al., 2005; Tausz et al., 2007; McAinsh et al., 2002). Commonly observed effects are visible injury (Langebartels et al., 1991; Wohlgemuth et al., 2002) and reductions in photosynthetic capacity (Tjoelker et al., 1995; Wittig et al., 2007) and growth or yield (Grantz et al., 2006; Hayes et al., 2007; Feng and Kobayashi, 2009; Wittig et al., 2009; Leisner and Ainsworth, 2012). Ozone-induced plant damage can reduce the terrestrial carbon uptake and storage and, through this, cause an increase in atmospheric CO2 concentrations and an intensification of climate change (Sitch et al., 2007; Ainsworth et al., 2012). Ozone mixing ratios in Europe have approximately doubled during the 20th century (Cooper et al., 2014). The anthropogenic increase in NOy emissions primarily from combustion sources has been identified as being the major cause for the increasing near-surface O3 concentrations between 1970–1995 in the midlatitudes of the Northern Hemisphere (Fusco and Logan, 2003). Ozone levels are projected to decline until the end of the 21st century due to assumed stringent air pollution policies, but future climate conditions with increasing temperatures and reduced cloudiness and precipitation will tend to increase O3 formation, with increasing daily O3 peaks and average concentrations in summer (Meleux et al., 2007; van Vuuren et al., 2011). The application of the representative concentration pathway (RCP) scenarios (Moss et al., 2010; van Vuuren et al., 2011) in 14 global chemistry transport models results in the projection of declining annual global mean surface O3 concentrations in most regions of the globe, except South Asia, where increases are simulated (Wild et al., 2012). Projections of nitrogen deposition in the 21st century suggest little change across all scenarios of the RCPs, despite notable regional differences (Lamarque et al., 2013). A small decline in deposition rates is proposed only under the scenario RCP2.6.
Simulations with nitrogen-enabled terrestrial biosphere models suggest that N deposition may be responsible for 10 % to 50 % of the global residual land carbon uptake (Zaehle et al., 2011; Quéré et al., 2018). Several models, including the O3 effect on the carbon cycle, suggest that simulated present-day and future O3 exposure can reduce regional- and global-scale productivity (Felzer et al., 2005; Sitch et al., 2007; Franz et al., 2017; Lombardozzi et al., 2015; Oliver et al., 2018). For instance, modeling studies by Sitch et al. (2007) and Oliver et al. (2018) suggest a reduction in O3-induced damage of gross primary production (GPP) by 4 %–15 % and an associated reduction in land carbon storage by 3 %–10 %, where Sitch et al. (2007) simulated global O3 impacts between 1901–2100, and Oliver et al. (2018) focused on a European-scale damage between 1901–2050.
Here, we assess the combined effect of O3 and nitrogen deposition on the northern hemispheric terrestrial biosphere against the background of simulated changes due to increasing atmospheric CO2 and climate change. Elevated levels of atmospheric CO2 stimulate leaf photosynthesis and reduce stomatal conductance (Medlyn et al., 2001; Ainsworth and Long, 2005) and, therefore, can increase plant growth and plant nitrogen limitation (Oren et al., 2001; Norby et al., 2009; Zaehle et al., 2014). However, reductions in stomatal conductance reduce the leaf-level uptake of air pollutants like O3 and, thereby, have the potential to restrict O3-induced damage to plants (Paoletti and Grulke, 2005; Barnes and Pfirrmann, 1992; Isebrands et al., 2001; Talhelm et al., 2014; Zak et al., 2011; Noormets et al., 2010).
We analyze the response of the northern hemispheric carbon cycle to changes in climate, atmospheric CO2, and O3, as well as N deposition for the historical period (1850–2005) and two future scenarios (2006–2099), i.e., a high and low climate change mitigation scenario (RCP2.6 and RCP8.5, respectively). In a factorial analysis, we investigate the impact of the single drivers (O3, CO2, and N deposition) and their interaction (specifically, the interaction between O3 and CO2 and O3 and N deposition) on plant growth and terrestrial carbon storage. We employ a significantly enhanced version of the O–CN terrestrial biosphere model (Zaehle and Friend, 2010), which explicitly accounts for the O3 transport and deposition from the free troposphere into the stomata, as well as O3 removal by other processes (such as soil and leaf surface uptake; Franz et al., 2017). This model has been evaluated against biomass damage relationships observed in a range of fumigation and/or filtration experiments with European tree species (Büker et al., 2015; Franz et al., 2018).
Simulations are conducted with the O–CN terrestrial biosphere model (Zaehle and Friend, 2010; Franz et al., 2017), version tunVC, where O3 damage is calculated based on injury functions to the maximum carboxylation capacity of the leaf Vcmax (Franz et al., 2018). The tunVC injury functions were calibrated to reproduce observed biomass damage relationships of experiments with a range of European tree species in fumigation and/or filtration experiments (Franz et al., 2018; Büker et al., 2015).
The O–CN model includes an O3 deposition scheme that explicitly accounts for the O3 transport and deposition from the free troposphere into the stomata (Franz et al., 2017). Here, we use the ozone deposition scheme referred to as the D model in Franz et al. (2017), contrary to Franz et al. (2018) where the O3 deposition scheme was turned off.
2.1 The O–CN model
O–CN (Zaehle and Friend, 2010) is a further development of the land surface scheme of ORCHIDEE ((Organizing Carbon and Hydrology In Dynamic Ecosystems; Krinner et al., 2005), and it simulates the coupled terrestrial carbon (C), nitrogen (N), and water cycles for 12 plant functional types. The model accounts for the effects of nitrogen availability on growth, root–shoot allocation, litter, and soil organic matter decay, and represents a comprehensive nitrogen cycle, including process-oriented formulations for nitrogen leaching and gas losses, and its ability to reproduce N fertilization experiments has been evaluated by Meyerholt and Zaehle (2015). O–CN compares well to a range of regional to global terrestrial biosphere benchmarks (Quéré et al., 2018). O–CN is driven by climate data, N deposition, atmospheric composition, including the atmospheric CO2 and O3 concentrations, and land use information.
O–CN simulates a multilayer canopy with up to 20 layers (each with a thickness of up to 0.5 leaf area index), where net photosynthesis is calculated for shaded and sunlit leaves, with consideration of the light profiles of diffuse and direct radiation on the aerodynamic resistance (Kull and Kruijt, 1998; Friend, 2001; Zaehle and Friend, 2010). Stomatal conductance to water, CO2, and O3 is calculated, coupled to net photosynthesis, following a Ball–Berry-type formulation (see Sect. 2.2). Leaf nitrogen concentration and leaf area determine the photosynthetic capacity, which are both affected by ecosystem-available N. The maximum carboxylation capacity (Vcmax) and electron transport capacity (Jmax) of the leaf increases with an increased leaf nitrogen concentration, leading to an increase in the maximum net photosynthesis and stomatal conductance per unit leaf area (Zaehle and Friend, 2010). The highest leaf N content is simulated at the top of the canopy and exponentially decreases with increasing canopy depth (Friend, 2001; Niinemets et al., 2015). Following this, the net photosynthesis, stomatal conductance, and O3 uptake are generally highest at the top of the canopy and lowest at the bottom of the canopy. Changes in stomatal conductance affect transpiration rates and estimates of O3 uptake and O3 damage.
2.2 Ozone injury calculation in O–CN
Leaf-level O3 uptake is determined by stomatal conductance and atmospheric O3 concentrations, as described in Franz et al. (2017). In contrast to Franz et al. (2017), the stomatal conductance gst is calculated based on the Ball–Berry formulation (Ball et al., 1987) as follows:
where RH is the atmospheric relative humidity, f(heightl) is the water transport limitation with canopy height, [CO2] is the atmospheric CO2 concentration, An,l is the net photosynthesis, g0 is the residual conductance when An approaches zero, and g1 is the stomatal-slope parameter, as in Krinner et al. (2005). The index “l” indicates that gst and An are calculated separately for each canopy layer. An,l is calculated, as described in Zaehle and Friend (2010), as a function of the leaf internal partial pressure of CO2, absorbed photosynthetic photon flux density on shaded and sunlit leaves, leaf temperature, the nitrogen-specific rates of maximum light harvesting, electron transport (Jmax), and carboxylation rates (Vcmax).
The stomatal conductance to O3 is calculated as follows:
where the factor 1.51 accounts for the different diffusivity of O3 from water vapor (Massman, 1998).
For each canopy layer, the O3 stomatal flux (fst,l, ) is calculated from the canopy O3 concentration ([O3]can), and gst,l is calculated as follows
where the leaf internal O3 concentration ([O3]i) is assumed to be zero (Laisk et al., 1989).
The O3 deposition module calculates [O3]can from the O3 concentration at 45 m height ([O3]atm), which represents the lowest-level O3 concentrations in the forcing data (Franz et al., 2017). Based on the constant flux assumption, [O3]can, in units of nmol m−3, is calculated as follows:
with Ra being the aerodynamic resistance, Rb being the canopy-scale, quasi-laminar layer resistance, and Rc being the compound surface resistance to O3 deposition. Rc is calculated as being the sum of the canopy-scale stomatal resistance and the non-stomatal resistance to O3 uptake (Franz et al., 2017). The non-stomatal resistance is defined by the O3 destruction on the leaf surface, within-canopy resistance to O3 transport, and ground surface resistance (Franz et al., 2017).
Without the application of the O3 deposition module, the O3 uptake inside the leaves would be calculated based on the near-surface O3 concentrations from the forcing data, without accounting for the turbulent transport between the lower troposphere and the leaves, and the deposition and destruction of ozone on other surfaces.
The accumulation of O3 fluxes into the leaves above a threshold of X (, ) with the following:
gives the CUOXl. Summing CUOXl over all canopy layers gives the canopy value of CUOX (Franz et al., 2017). In this study, a flux threshold of 1 , i.e., CUO1, is applied to account for the plant's ability to detoxify part of the taken-up O3 (Franz et al., 2018; LRTAP-Convention, 2017; Büker et al., 2015). The cumulative uptake of O3 without detoxification, i.e., a threshold of zero, is represented by CUO0.
Emerging leaves are assumed to be undamaged and accumulate CUOX during the growing season. The CUOXl is reduced by the fraction of the newly developed leaves per time step and canopy layer. Deciduous plant functional types (PFTs) shed all CUOX at the end of the growing season and grow uninjured leaves the next spring. Evergreen PFTs shed proportionate amounts of CUOX during the entire year when new leaves or needles are grown or old foliage is replaced.
The O3 injury fraction () is calculated as a linear function of CUO1l as follows:
where the slope of the injury function (b) is set to 0.075 for broadleaf species and 0.025 for needleleaf species (Franz et al., 2018). is calculated separately for each canopy layer l, according to the specific accumulated O3 uptake of the respective canopy layer (CUO1l), and takes values between 0 and 1. Within-canopy gradients in stomatal conductance and photosynthetic capacity cause variations in CUO1l and, hence, between canopy layers.
The effect of O3 injury on plant carbon uptake is calculated by the following:
with the maximum carboxylation capacity of the leaf in the respective canopy layer (Vcmax,l), which is used in the calculation of An,l. Jmax,l is reduced in proportion to Vcmax,l, such that the ratio between both is maintained.
Ozone-induced reductions in An,l cause a decline in gst,l as both are tightly coupled. Lower values of gst,l diminish the O3 uptake into the plant (fst,l) and slow the increase in CUO1l and, hence, O3-induced injury.
2.3 Model forcing
The model is driven by climate model output of the Institute Pierre Simon Laplace (IPSL) general circulation model IPSL-CM5A-LR (Dufresne et al., 2013), which is bias-corrected according to the Inter-Sectoral Impact Model Intercomparison Project (ISIMIP; Hempel et al., 2013). The applied meteorological forcing for near-surface conditions comprises the daily data of specific humidity, incoming longwave radiation, incoming shortwave radiation, cloudiness, wind speed, maximum temperature, minimum temperature, and total precipitation, which are disaggregated to the 30 min time step of the model using a statistical weather generator (Krinner et al., 2005). Reduced and oxidized monthly mean nitrogen deposition in wet and dry form and monthly mean near-surface O3 concentrations are provided by CAM, the community atmosphere model (Lamarque et al., 2010; Cionni et al., 2011). Land cover, soil, and N fertilizer application are used as in Zaehle et al. (2011) and kept at 2000 values throughout the simulation. Data on atmospheric CO2 concentrations are obtained from Meinshausen et al. (2011). Through all simulations, present-day land use information is applied for the year 2000 (Hurtt et al., 2011).
Figure 1 provides an overview of the scenarios applied in this study. Note that there are important regional patterns behind the changes in N deposition and near-surface O3 which are shown in the Supplement (Figs. S1 and S2).
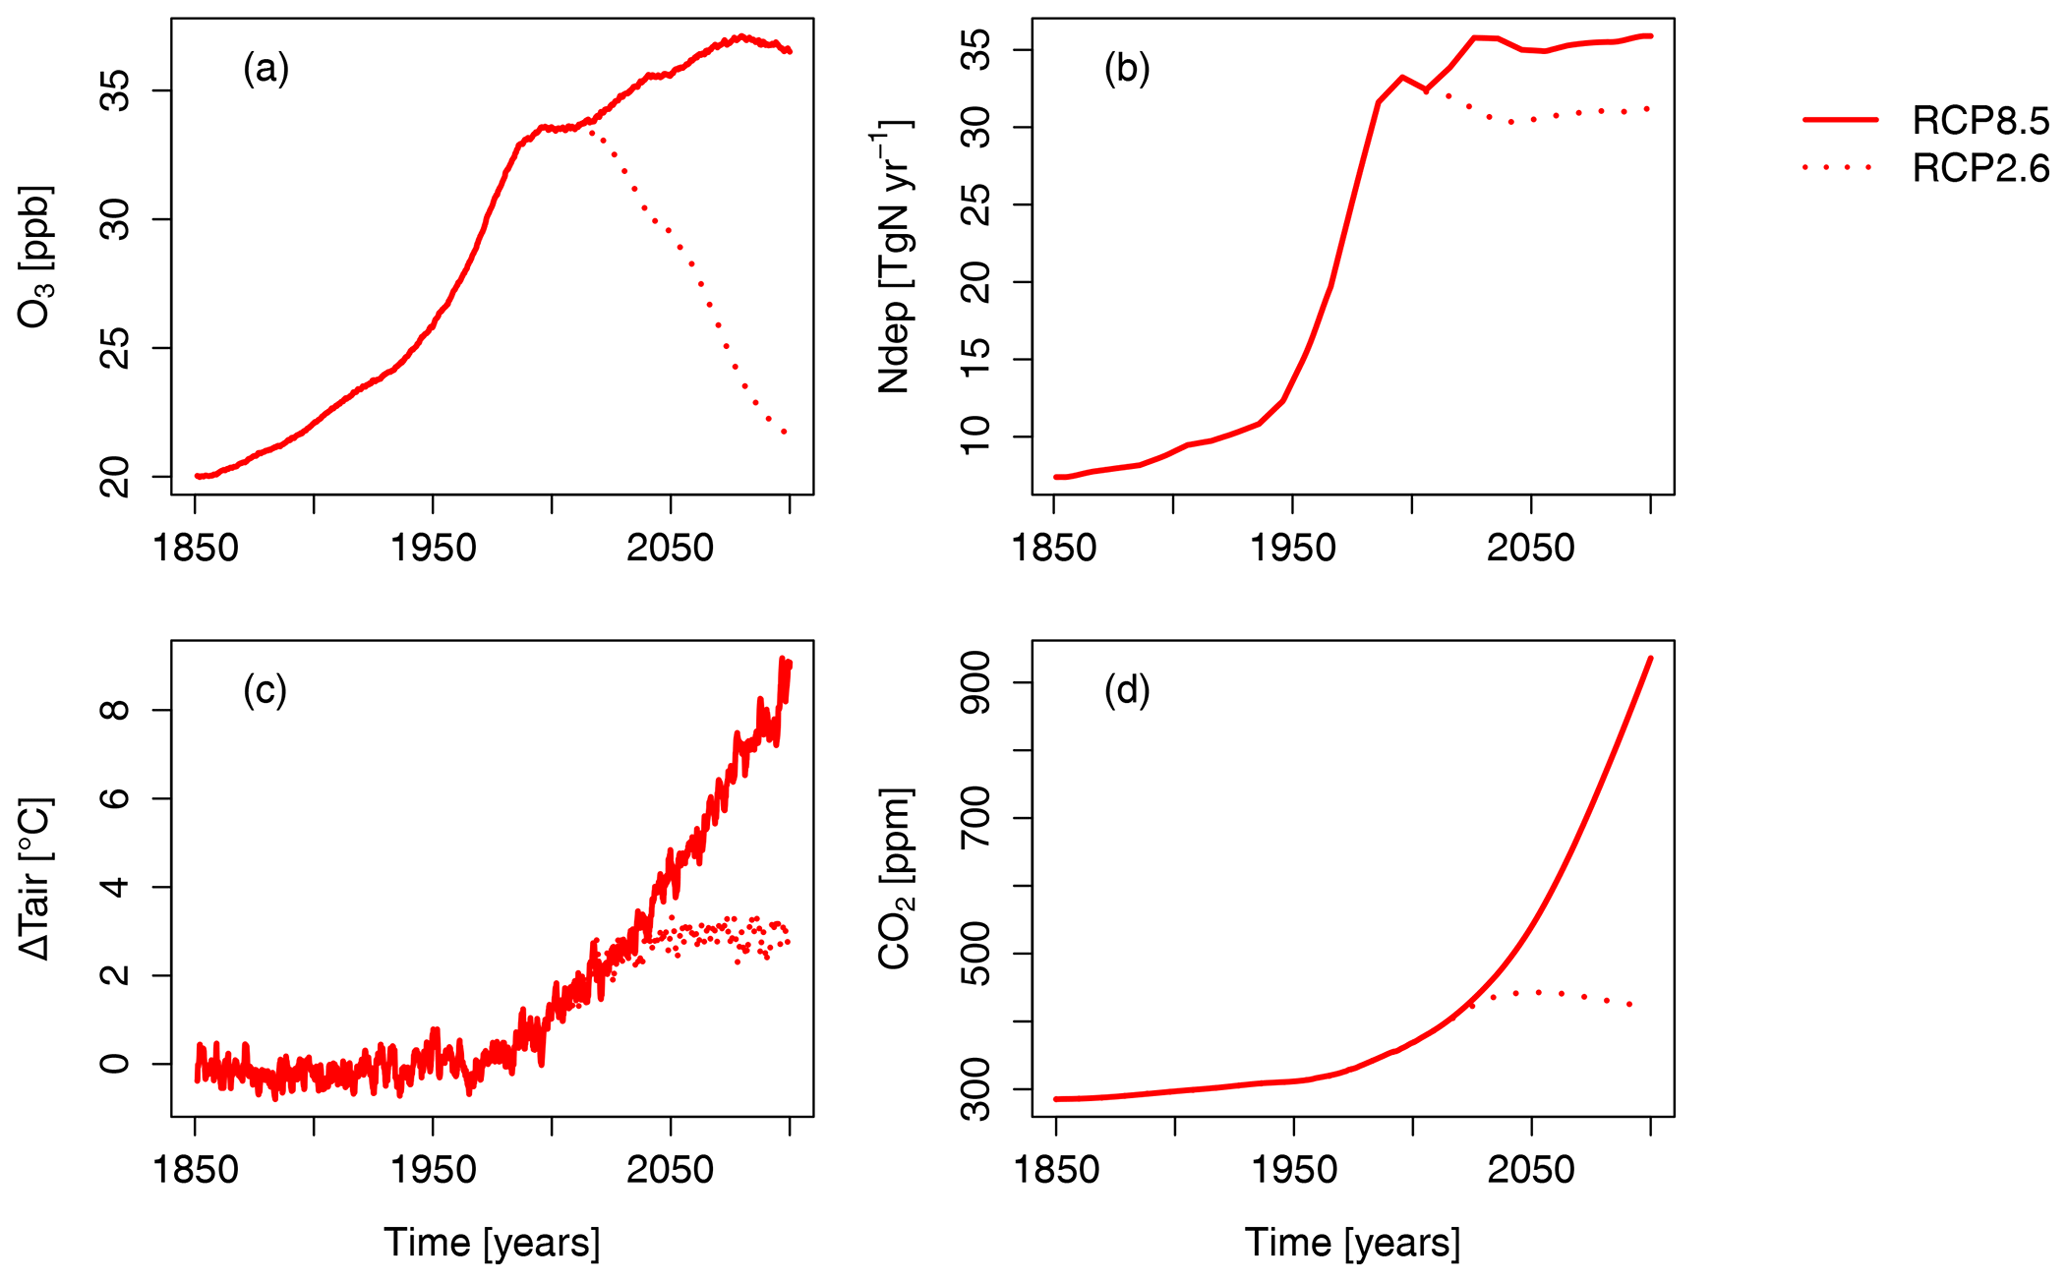
Figure 1Time series of the terrestrial northern hemispheric ( N) mean (a) near-surface O3 concentration, (b) summed nitrogen deposition, (c) air temperature at 2 m height, and (d) atmospheric CO2 concentration according to the RCP2.6 and RCP8.5 emission scenario. For visual clarity, the effect of the seasonal cycles of near-surface O3 and N deposition are smoothed by a moving average of 12 months. See Figs. S1 and S2 for spatial patterns of nitrogen deposition and near-surface O3.
2.4 Modeling protocol
The model is run at a spatial resolution of 1 and operates on a 30 min time step. As the injury functions developed by Franz et al. (2018) are based on exposure experiments with boreal and temperate European tree species, the simulation domain is restricted to the temperate and boreal region of the Northern Hemisphere ( N).
To achieve equilibrium in terms of the terrestrial vegetation and soil carbon and nitrogen pools, O–CN is run for 1291 years (including 10 iterations of 1000 years of soil biogeochemistry and 100 years of vegetation and soil biogeochemistry) by using the forcing data of the year 1850 data. Prior to the year 1901, climate years are randomly iterated from the period of 1901 to 1930, as 1901 is the first year of the climate data set.
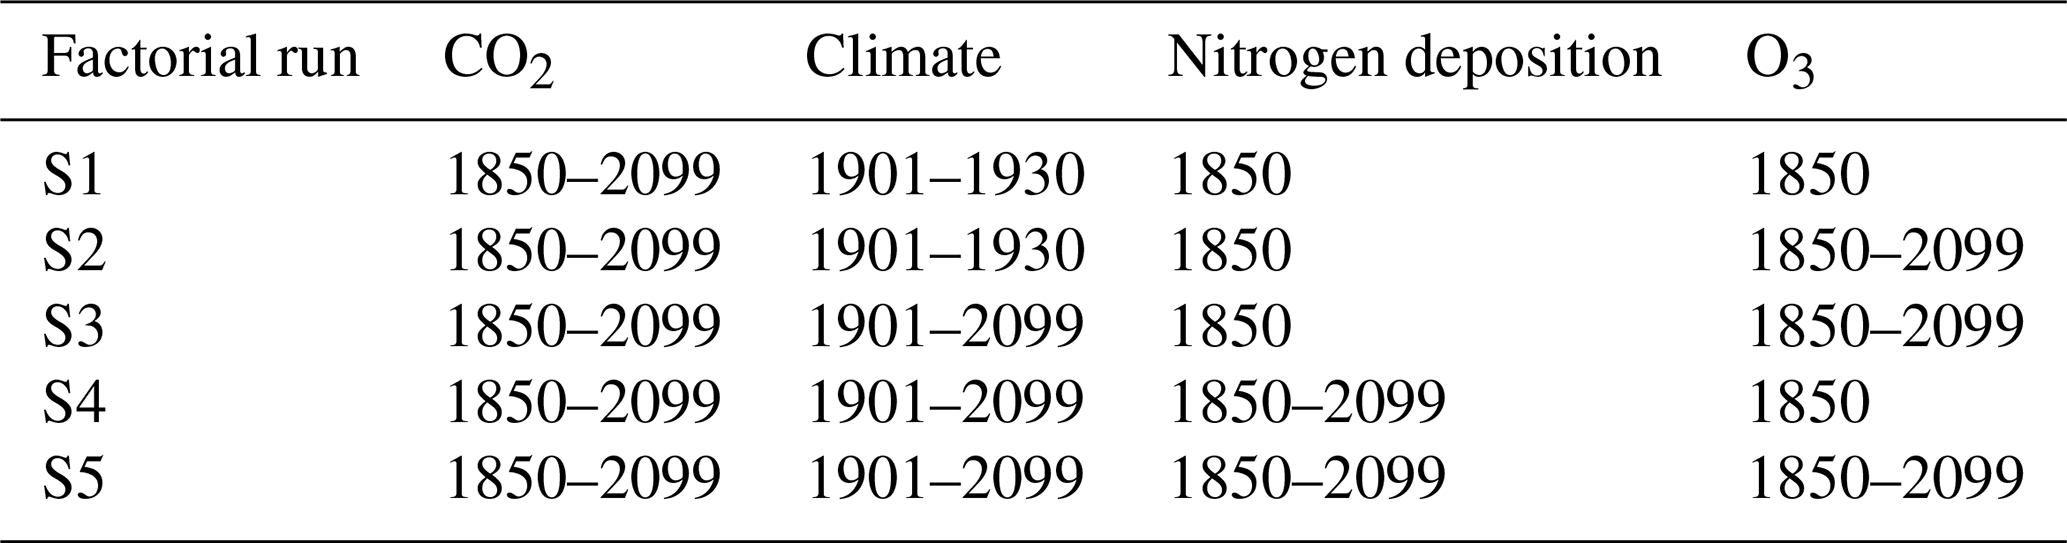
From this equilibrium, five factorial simulation runs are simulated, where key drivers of plant growth and carbon sequestration (CO2, climate, nitrogen deposition, and O3) are simulated either as fixed to the reference year or transient (i.e., progressively changing within the simulation period; see Table 1). These simulations run from the year 1850 to 2099. The period up to the year 2005 is simulated as being identical for both RCP scenarios. From 2006 until 2099, simulations are run using the forcing according to either the RCP2.6 or the RCP8.5 forcing scenario (Moss et al., 2010; van Vuuren et al., 2011).
Table 1Forcing setting of the factorial runs. Climate forcing for the years prior to 1901 is always drawn from the same random sequence of years between 1901 and 1930.
To investigate the impact of the O3 deposition scheme on the simulation results, the factorial runs are repeated with a model version in which the O3 deposition scheme is turned off (see the ATM model version in Franz et al., 2017). In simulations where the O3 deposition module is turned off, the canopy O3 concentration equals the O3 concentration at 45 m above the surface, which is the hight of the lowest level of the forcing data.
2.5 Factorial analysis
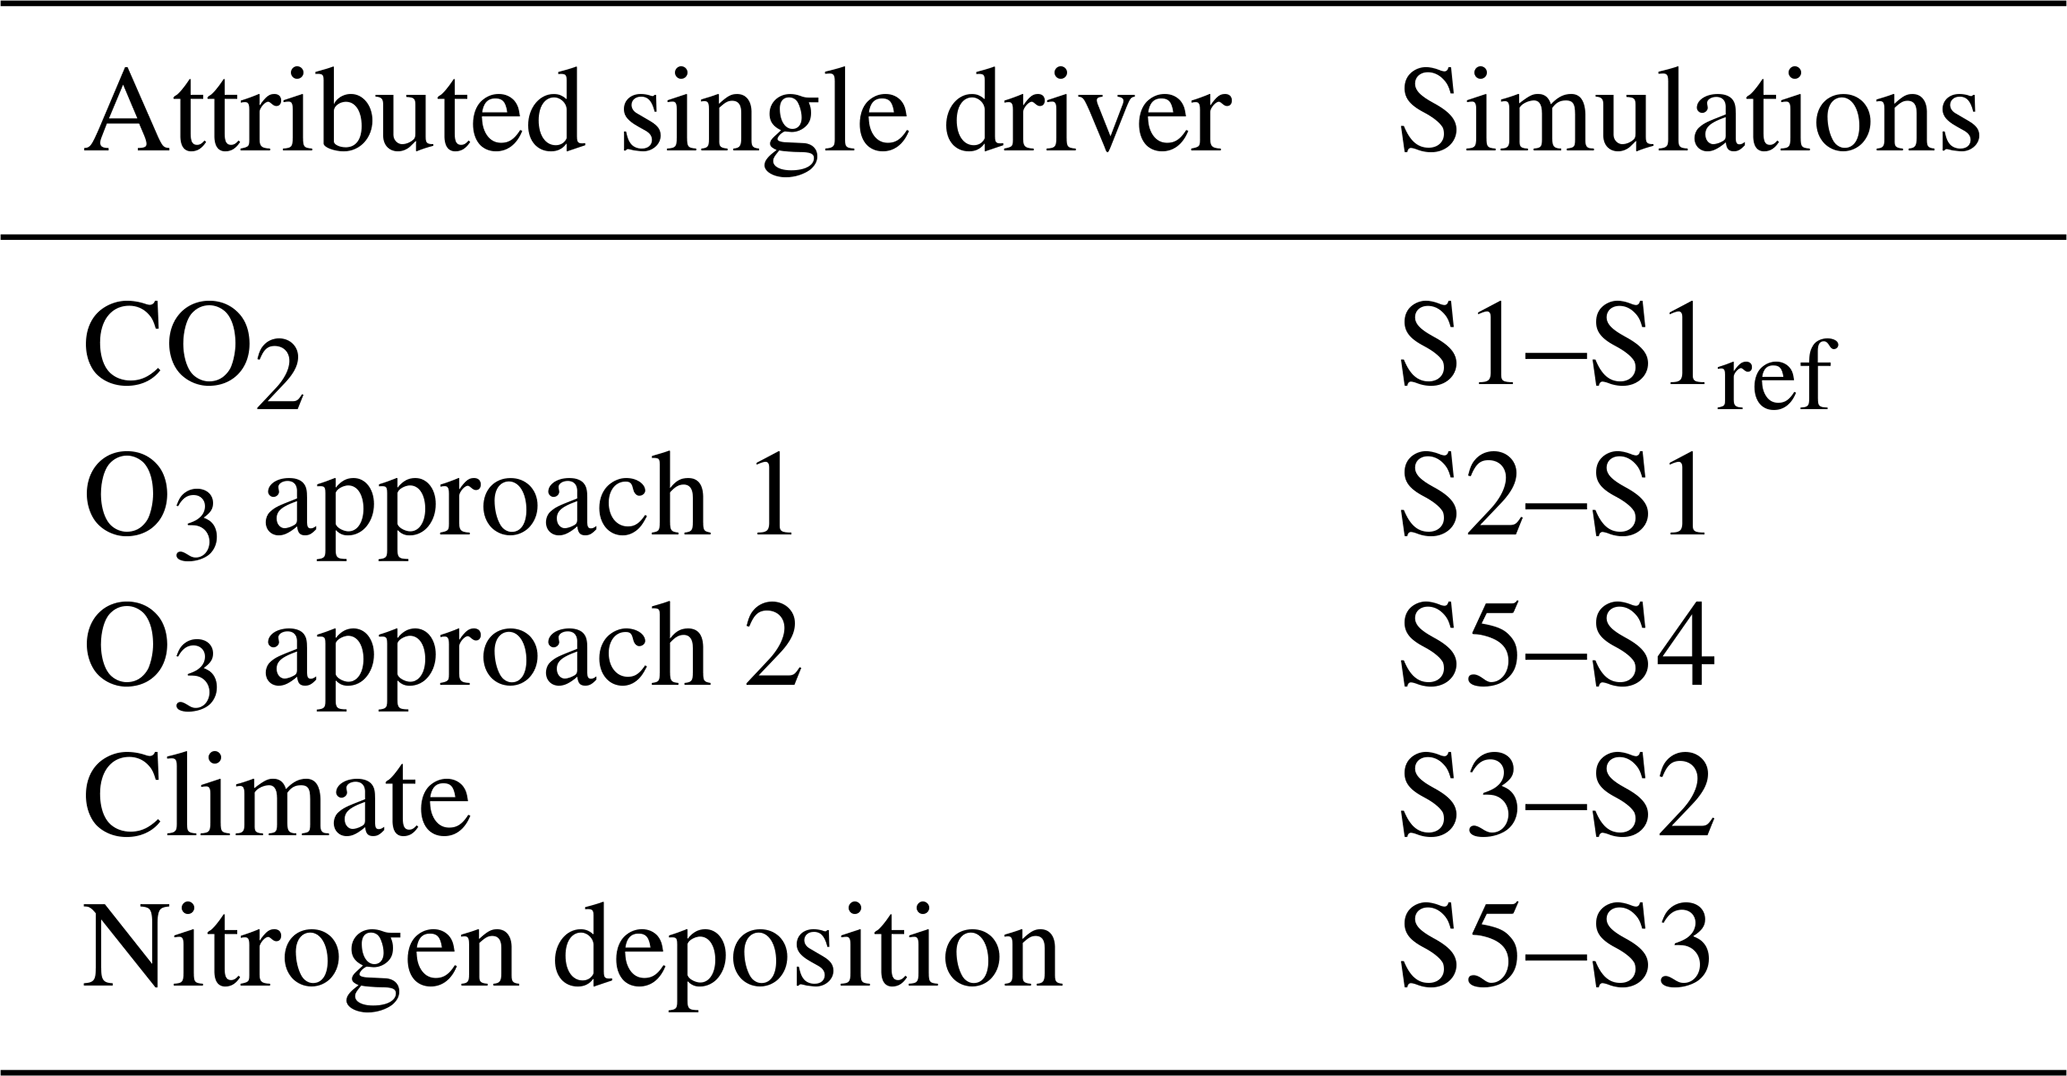
The impact of a single forcing driver on the simulation results can be approximated by subtracting the simulation results of suitable combination of factorial runs from one another (see Table 2). In the following, the term forcing driver is used to refer to the input variables of the conducted simulations, and single driver refers to the approximated impact of a single forcing driver on the simulation results. The described approach is an approximation of the impact of the single drivers and assumes that the effects on the analyzed output variables are additive. The assumption of additive effects is a necessary simplification to restrict the number of simulations and computation time (Zaehle et al., 2010). For O3, a main driver of interest, two different approaches for calculating the single driver were realized. In one approach, the O3 impact is calculated from the two factorial runs, with only one or two transient drivers (simulations S1 and S2), and a second time from the factorial runs, where all and all but one driver (simulations S5 and S4, respectively) is simulated transient. The comparison of these two approaches for calculating the single driver might indicate the extent of the impact of interacting forcing drivers on the estimate of the O3 single driver. The relative changes between two simulation runs, SX and SY, are calculated as (SX−SY)SY.
Table 2Calculation of the single driver effects (CO2, climate, nitrogen deposition, and O3) from the conducted simulations. S1ref refers to the mean of the years 1850 to 1859 of the S1 simulation. See Table 1 for information on the forcing setting of the factorial runs S1–S5.
The simulations show a strong increase in gross primary production (GPP) in the Northern Hemisphere ( N) between the years 1850 and 2099 with all forcings considered in this study (S5; Fig. 2). In simulations based on the RCP8.5 scenario, GPP increases throughout the 21st century, roughly doubling by the year 2099 relative to 1850 values. In the RCP2.6 scenario, the simulated increase in GPP levels off in the 2040s at approximately one-third of the simulated increase at the end of the 21st century in the RCP8.5 scenario. The changes in terrestrial carbon storage reflect these changes in GPP (see Fig. 2d).
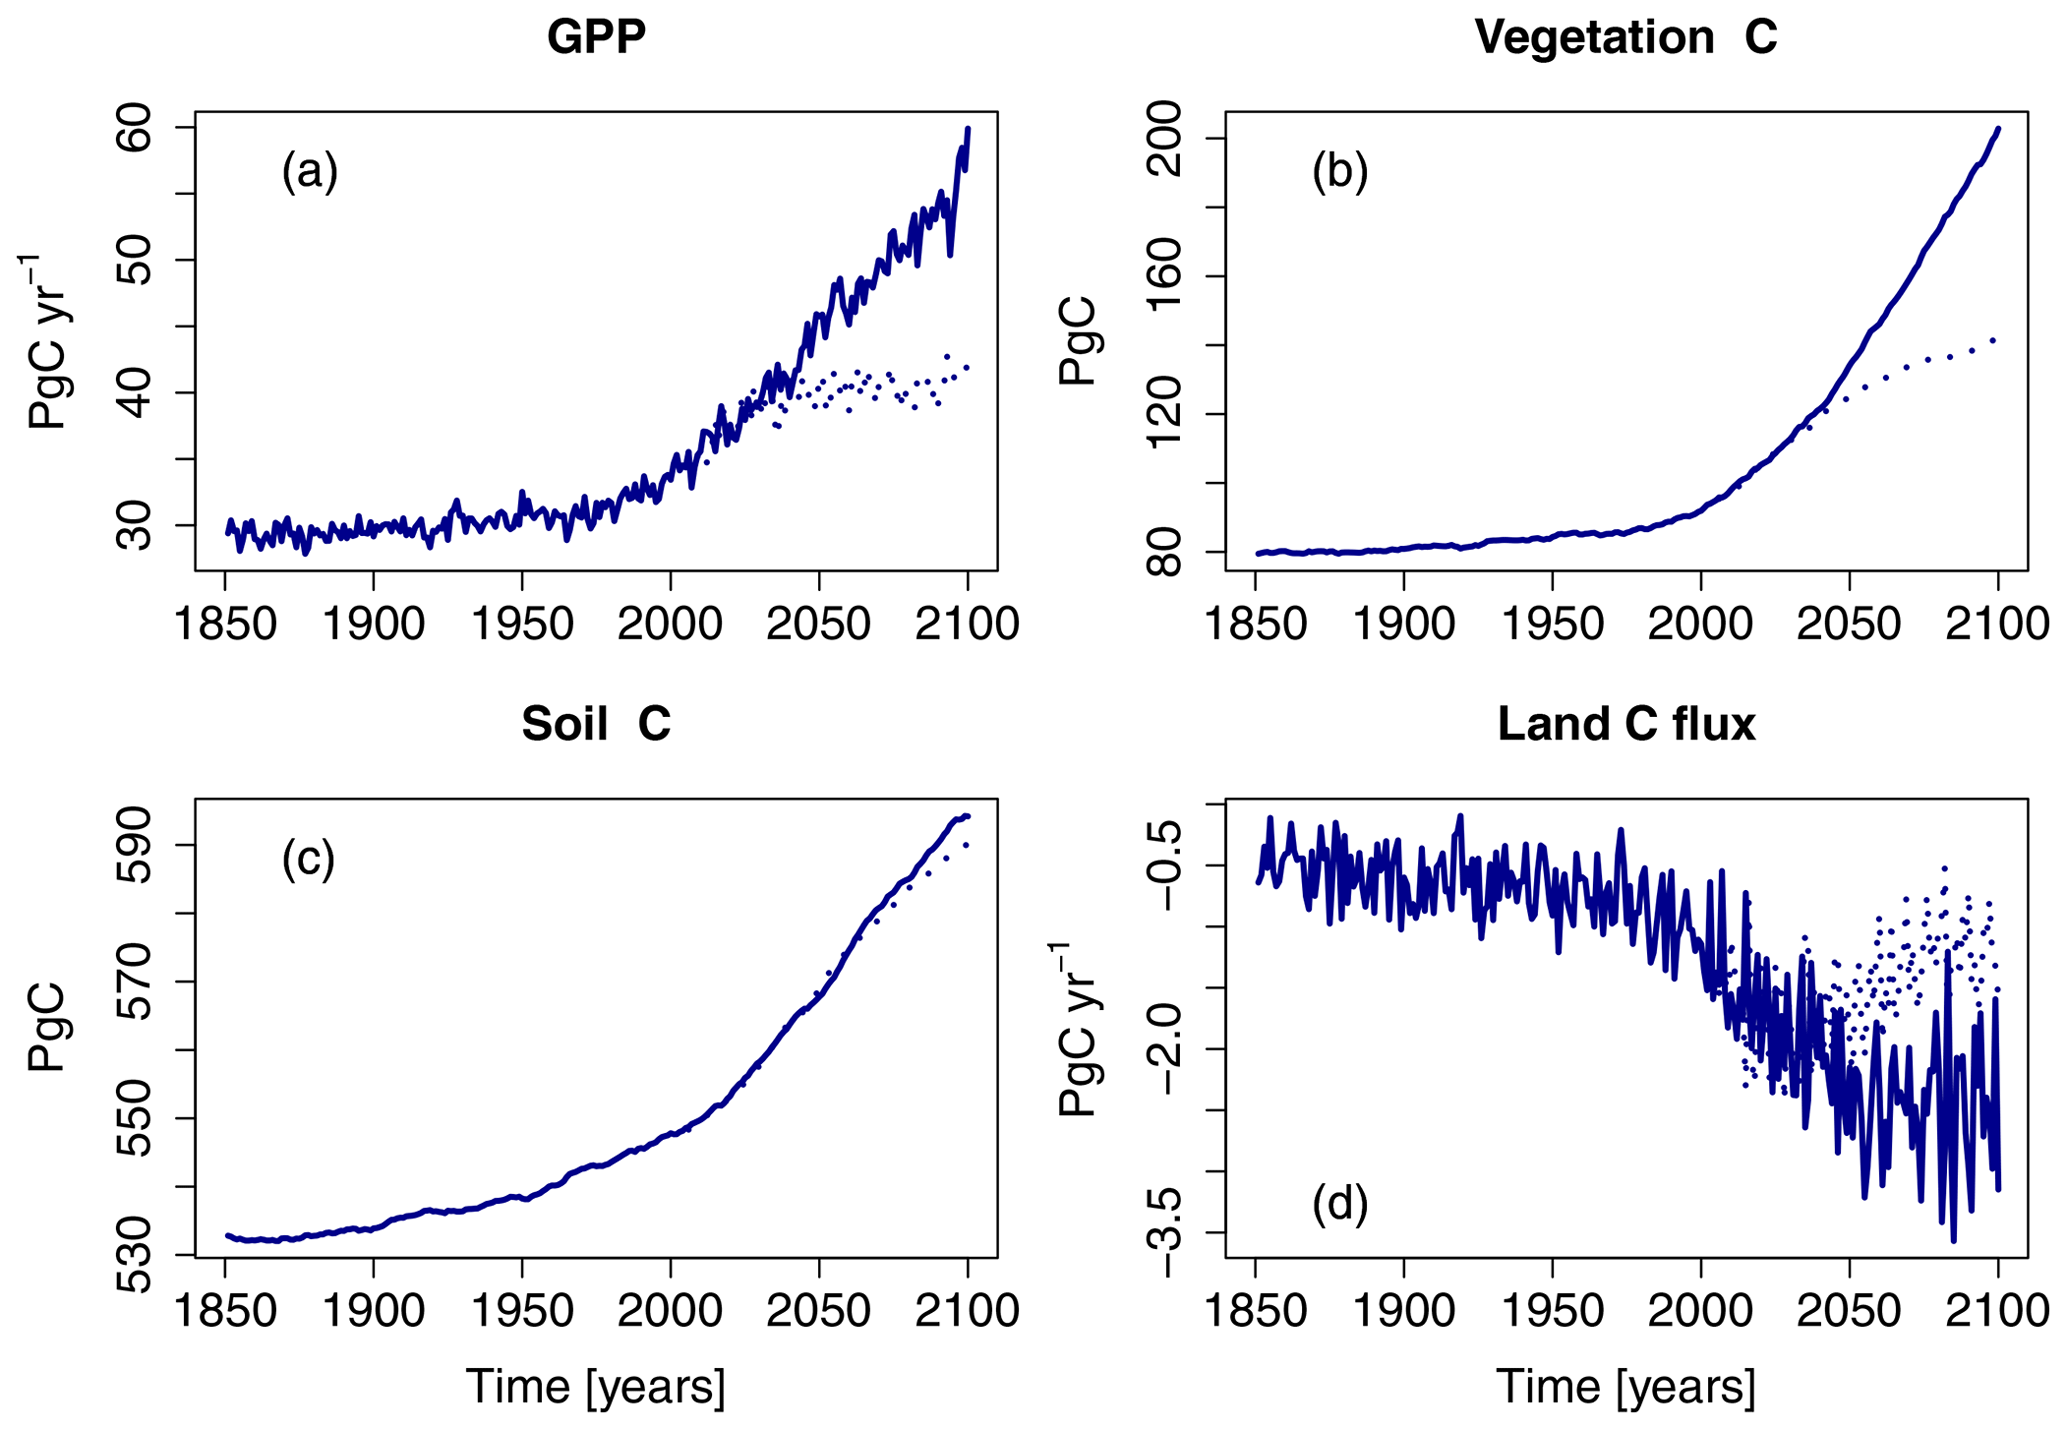
Figure 2Simulated northern hemispheric gross primary production (GPP), vegetation carbon (vegetation C), soil carbon, and net land C flux of the factorial run S5 (all variables are simulated transient; see Table 1). Displayed is the period of 1850–2099 for both the RCP2.6 and RCP8.5. See also Table 3.
Concurrent with the strong increase in GPP is an increased foliar uptake of O3, which parallels the increase in near-surface and canopy air O3 concentrations (Fig. 3). Simulated changes in the cumulative O3 uptake without a flux threshold (CUO0; see Sect. 2) strongly follow changes in the O3 concentrations during the entire simulation period. Accounting for the ability of leaves to detoxify part of the O3 taken up, the cumulative canopy O3 uptake above a flux threshold of 1 (CUO1) does not remain at relatively constant values during the 21st century under RCP8.5. Instead, it reaches a maximum at the end of the 20th century and steadily declines afterwards. This difference between CUO0 and CUO1 for simulations based on RCP8.5 implies that the frequency at which the detoxification threshold is exceed gradually declines during the 21st century. This results from a decline in peak uptake rates (Fst) in the 21st century (Fig. 3b) despite fairly constant near-surface O3 concentrations (Fig. 3a). The decline in peak uptake rates is the consequence of the reduced ratio of stomatal conductance to net photosynthesis under high atmospheric CO2.
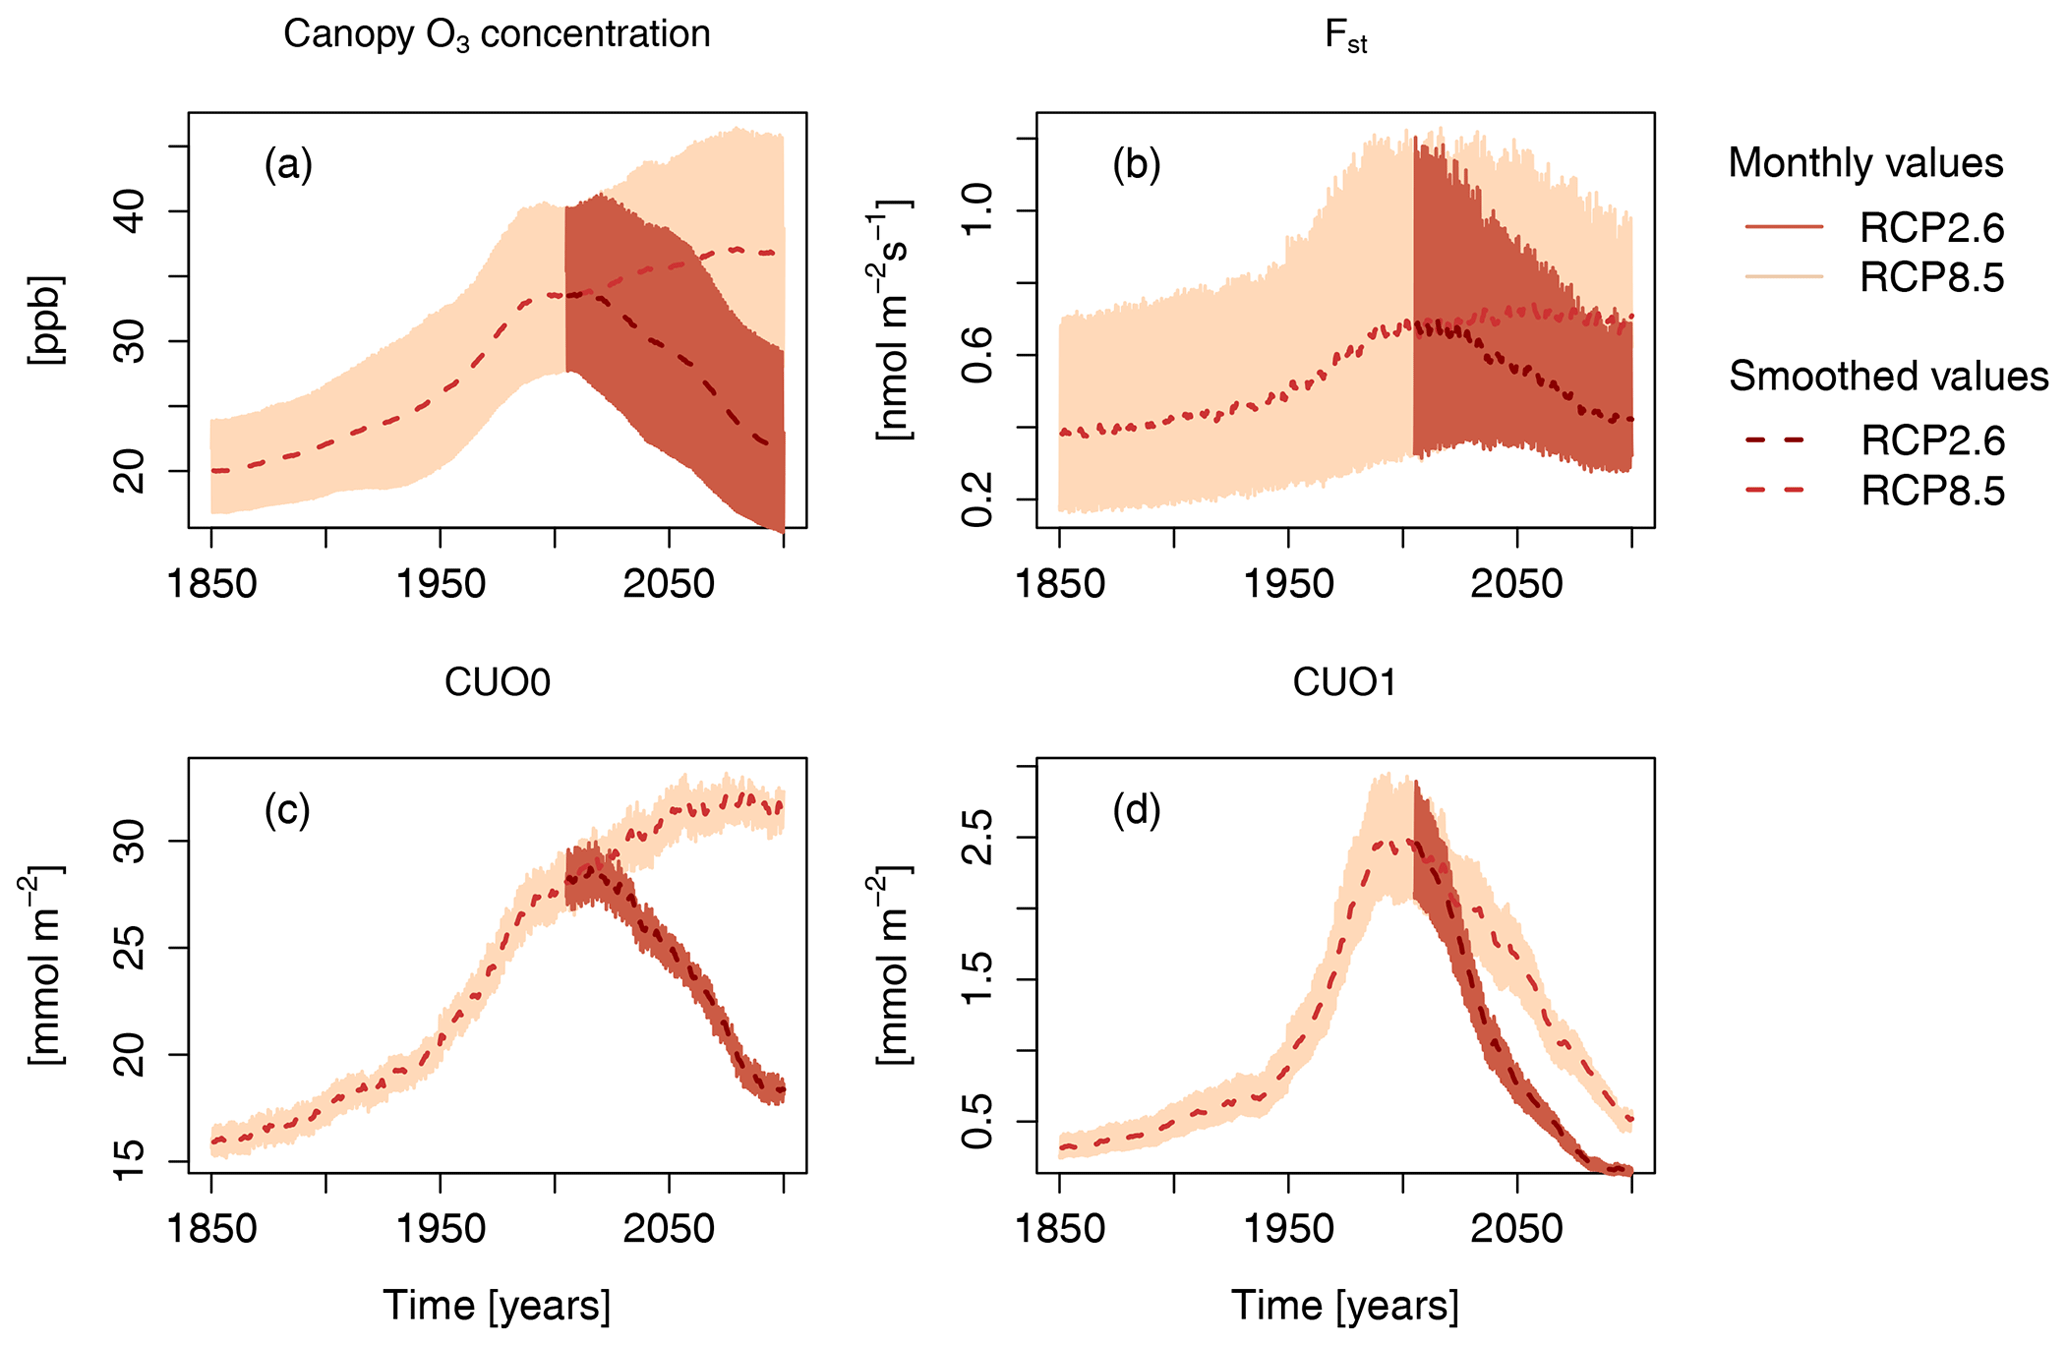
Figure 3Simulated canopy O3 concentration, O3 uptake (Fst), cumulative O3 uptake without a flux threshold (CUO0), and cumulative O3 uptake above a flux threshold of 1 (CUO1) of the factorial run S5 (all forcing variables are simulated transient). Displayed are monthly values and smoothed values, where the effect of the seasonal cycle is smoothed by the application of a moving average of 12 months.
3.1 Factorial analysis
We next decompose the simulations into the effects of the different model drivers with a special focus on the effects of O3 and nitrogen deposition. In all five factorial runs, the simulated GPP increases strongly between 1850 and 2099 and approximately doubles for the S5 run based on RCP8.5 (see Fig. 2a). The primary cause for this simulated increase is the CO2 fertilization effect induced by increasing atmospheric CO2 concentrations (see Fig. 4c and Table 3). Climate change is the second most important factor for the simulated increase, whereas the positive effect of N deposition is less pronounced. Ozone injury causes a modest decrease in productivity, which manifests strongest during the 1990s. During the 20th century, the decline gradually reverses. The land carbon sink strongly responds to elevated levels of CO2 (see Fig. 4f), whereas climate change induces a varying impact on the land carbon sink. During the second half of the 21st century, the effect of climate mainly causes a reduction in the simulated land carbon sink.
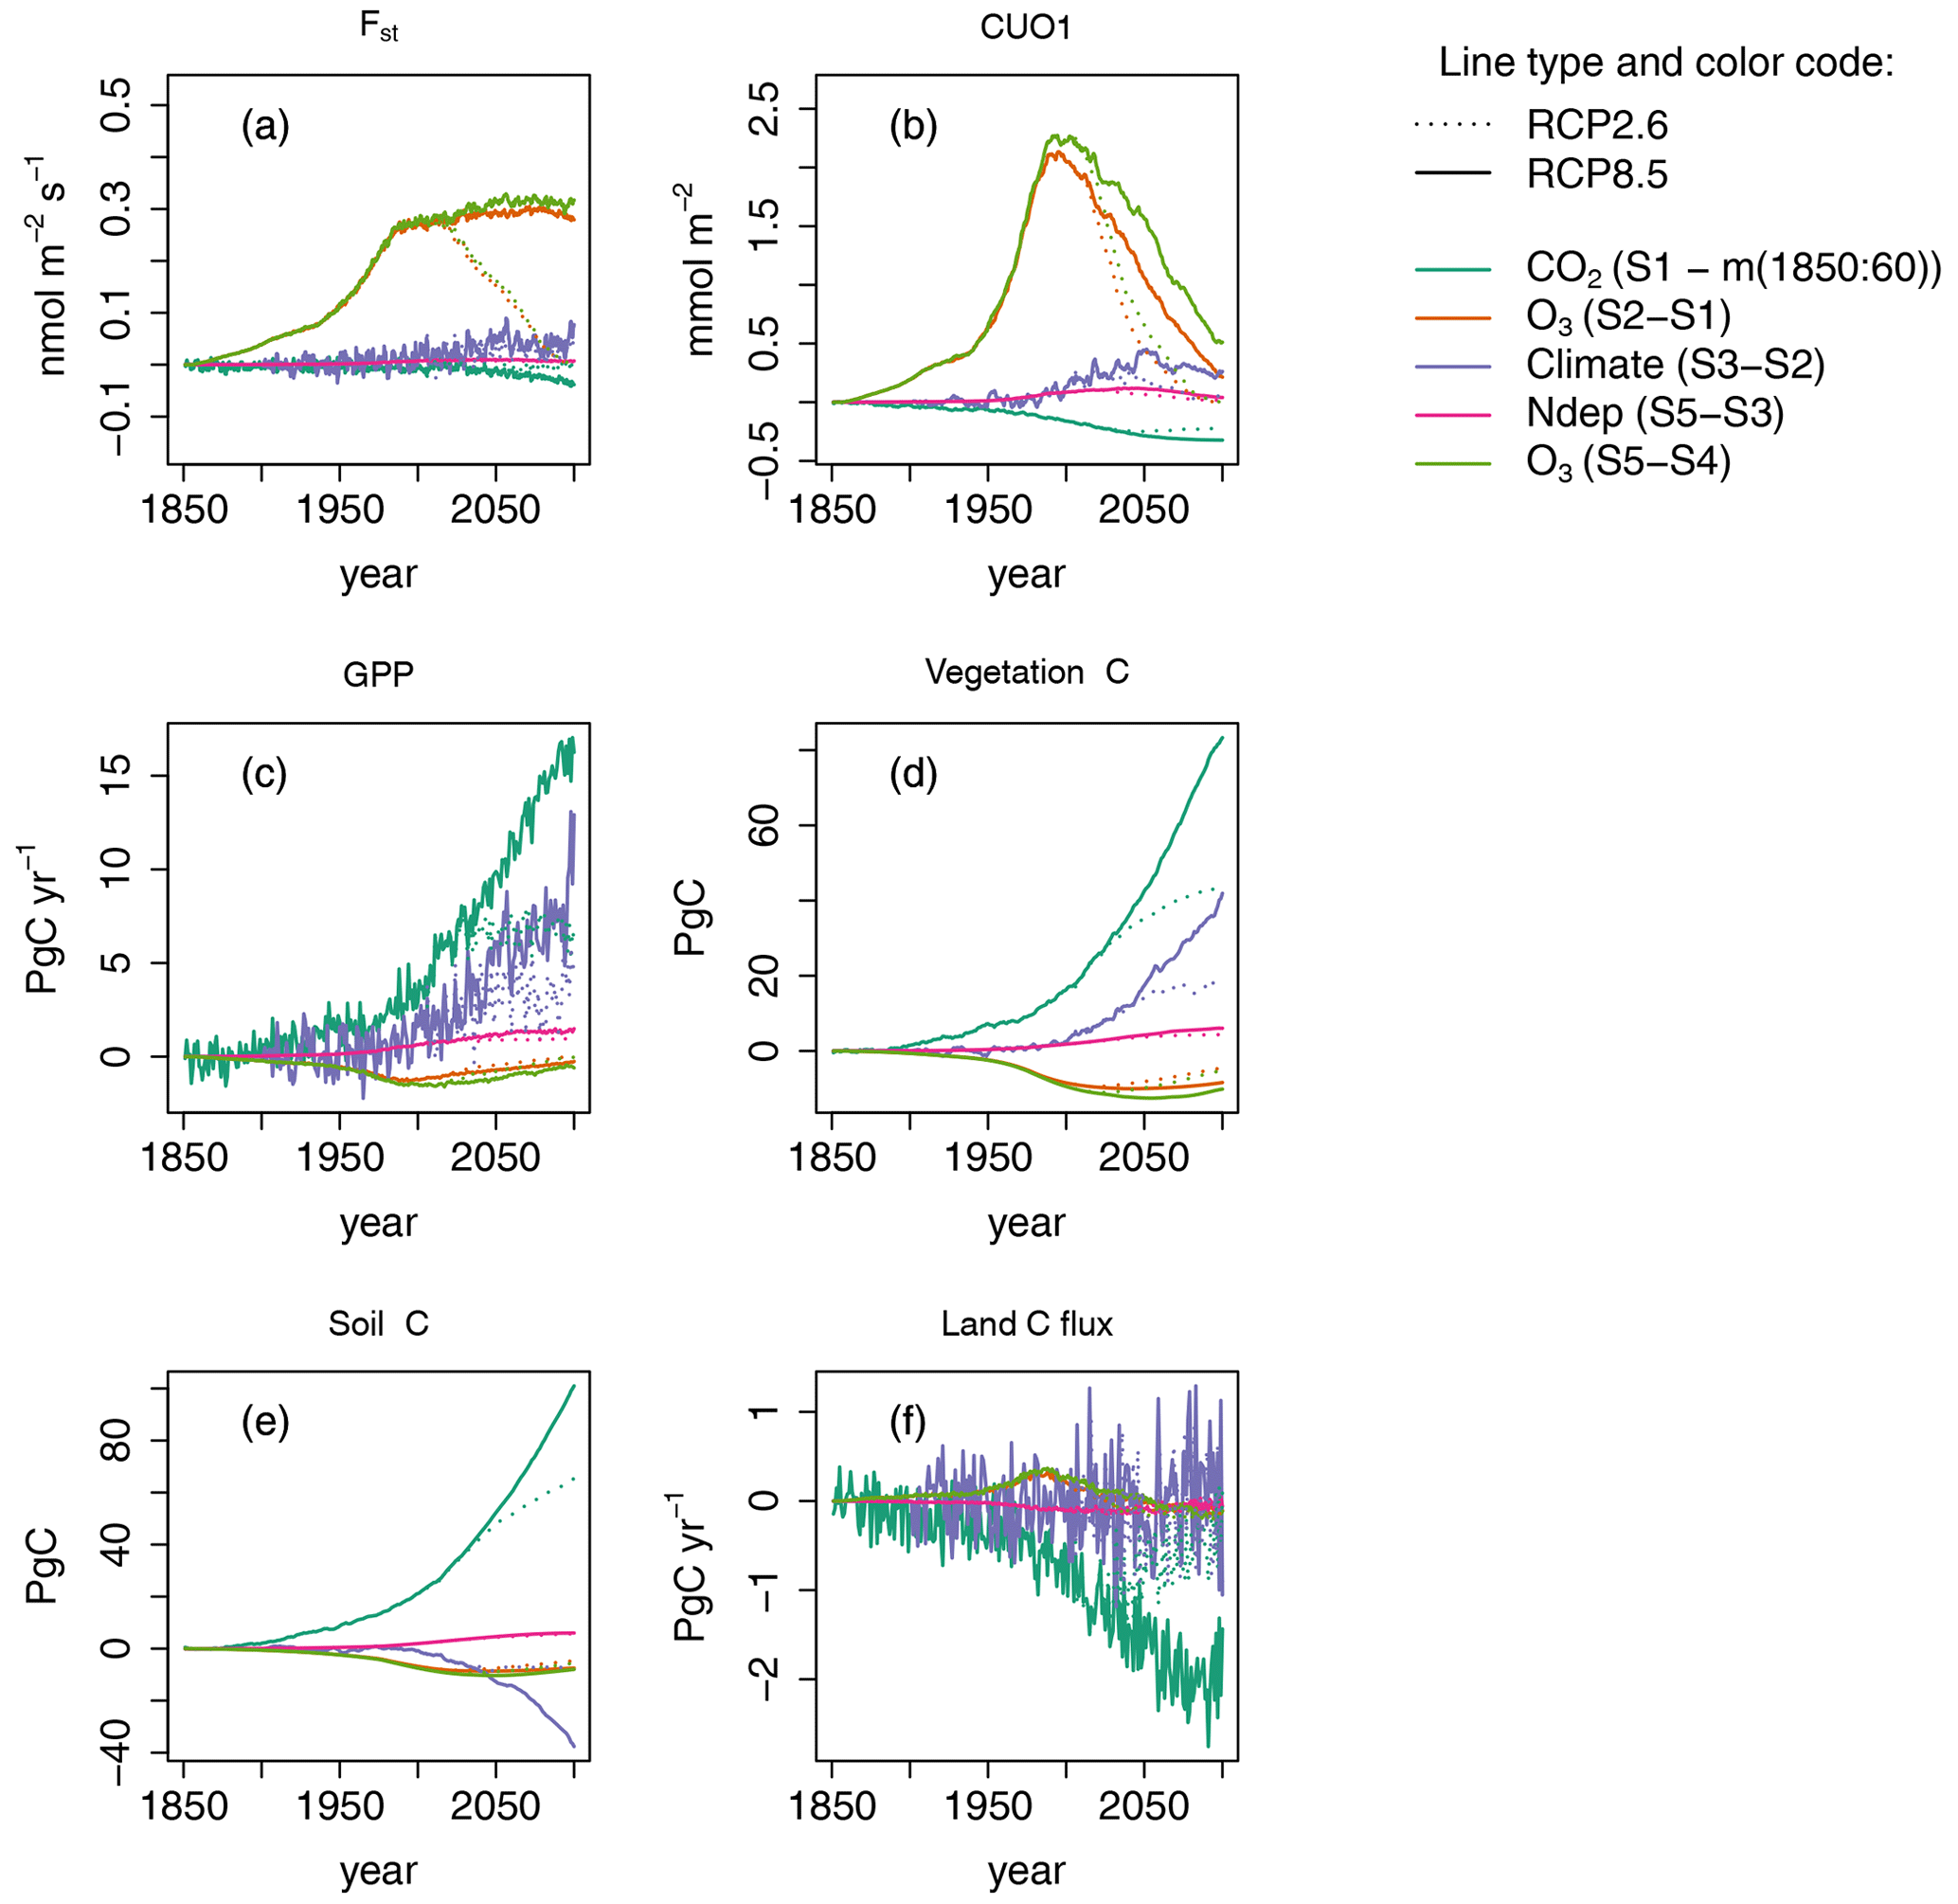
Figure 4Single drivers obtained by subtracting factorial runs for selected output variables. Displayed are the results for simulated regional mean O3 uptake (Fst), regional mean cumulative canopy O3 uptake above a flux threshold of 1 (CUO1), regional summed GPP, regional summed stocks of total carbon biomass (vegetation C), soil organic matter carbon (soil C), and summed land carbon flux (land C flux) for simulations based on RCP2.6 and RCP8.5. The effect of the seasonal cycle is smoothed by the application of a moving average of 12 months (a, b).
3.2 Magnitude of nitrogen deposition impact
Nitrogen deposition has a positive effect on the simulated carbon uptake, storage, and O3 uptake and accumulation in plants, but the magnitude varies between the different scenarios. N deposition increased summed regional GPP by about 2.1 % (0.7 PgC yr−1) at the beginning of the 21st century compared to preindustrial values (see Figs. 5 and S3 and Table 4). At the end of the 21st century, GPP is increased by approximately 2.5 % under both RCPs.
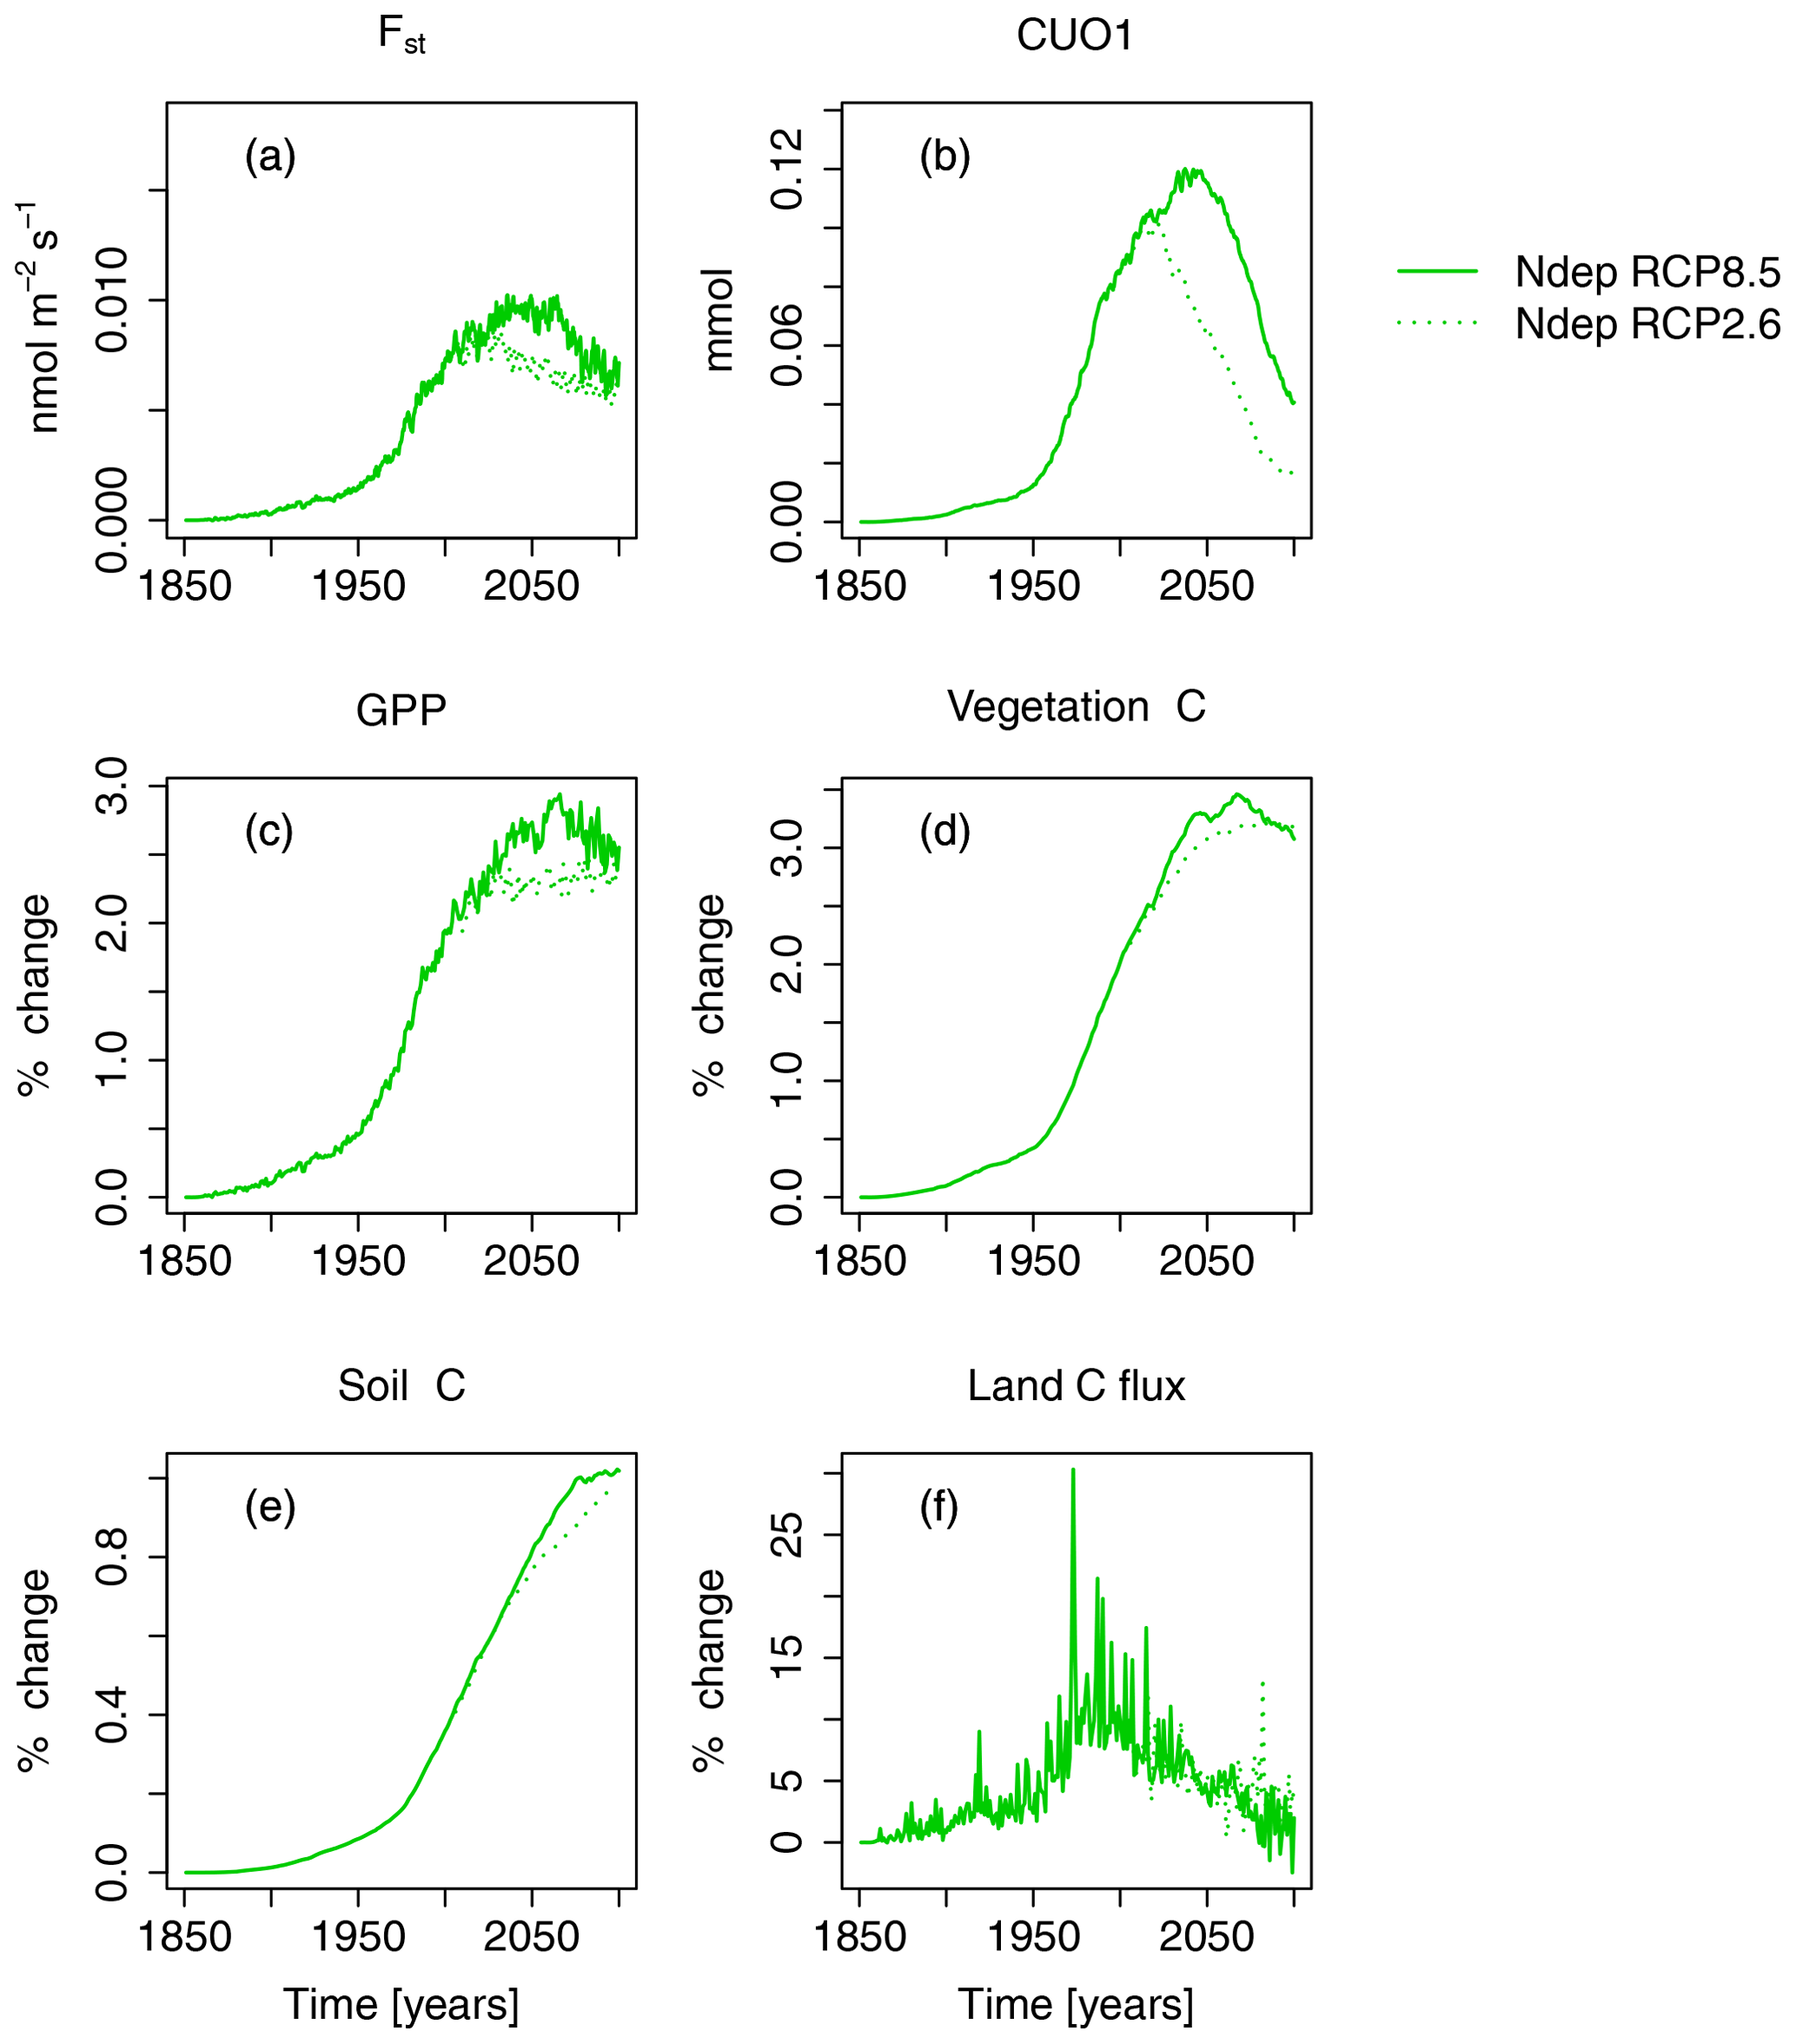
Figure 5Nitrogen deposition induced absolute change in regional mean O3 uptake (Fst), mean cumulative O3 uptake above a flux threshold of 1 (CUO1), and change in percent of summed GPP, summed carbon biomass (vegetation C), summed carbon soil organic matter (soil C), and summed land carbon flux (land C flux) compared to preindustrial values in the simulation region. The nitrogen-deposition-induced change is calculated from the simulation runs S3 and S5 (see Table 2). Solid lines indicate results from simulations based on RCP8.5, and dotted lines are results from simulations based on RCP2.6. The effect of the seasonal cycle is smoothed by the application of a moving average of 12 months (a, b).
Carbon stored in vegetation (vegetation C) is increased by nitrogen deposition by about 2 % (2.1 PgC) at the beginning of the 21st century and by approximately 3 % (4.4 and 6.1 PgC yr−1 for RCP2.6 and RCP8.5, respectively) at the end of the 21st century. This positive effect of N deposition keeps growing in East Asia until the of the 21st century (see Table 4), whereas in Europe and in the temperate North America, the GPP and vegetation C enhancement by nitrogen deposition peaks around the mid-21st century and declines thereafter. The soil C is less affected by nitrogen deposition, and maximal increases of ≈1 % (6 PgC) compared to preindustrial values are simulated at the end of the 21st century. Nitrogen deposition enhances the simulated land carbon sink (land C flux) most in the period between 1950 and 2050 by 5 %–25 % (−0.02 … −0.15 PgC yr−1) compared to preindustrial values.
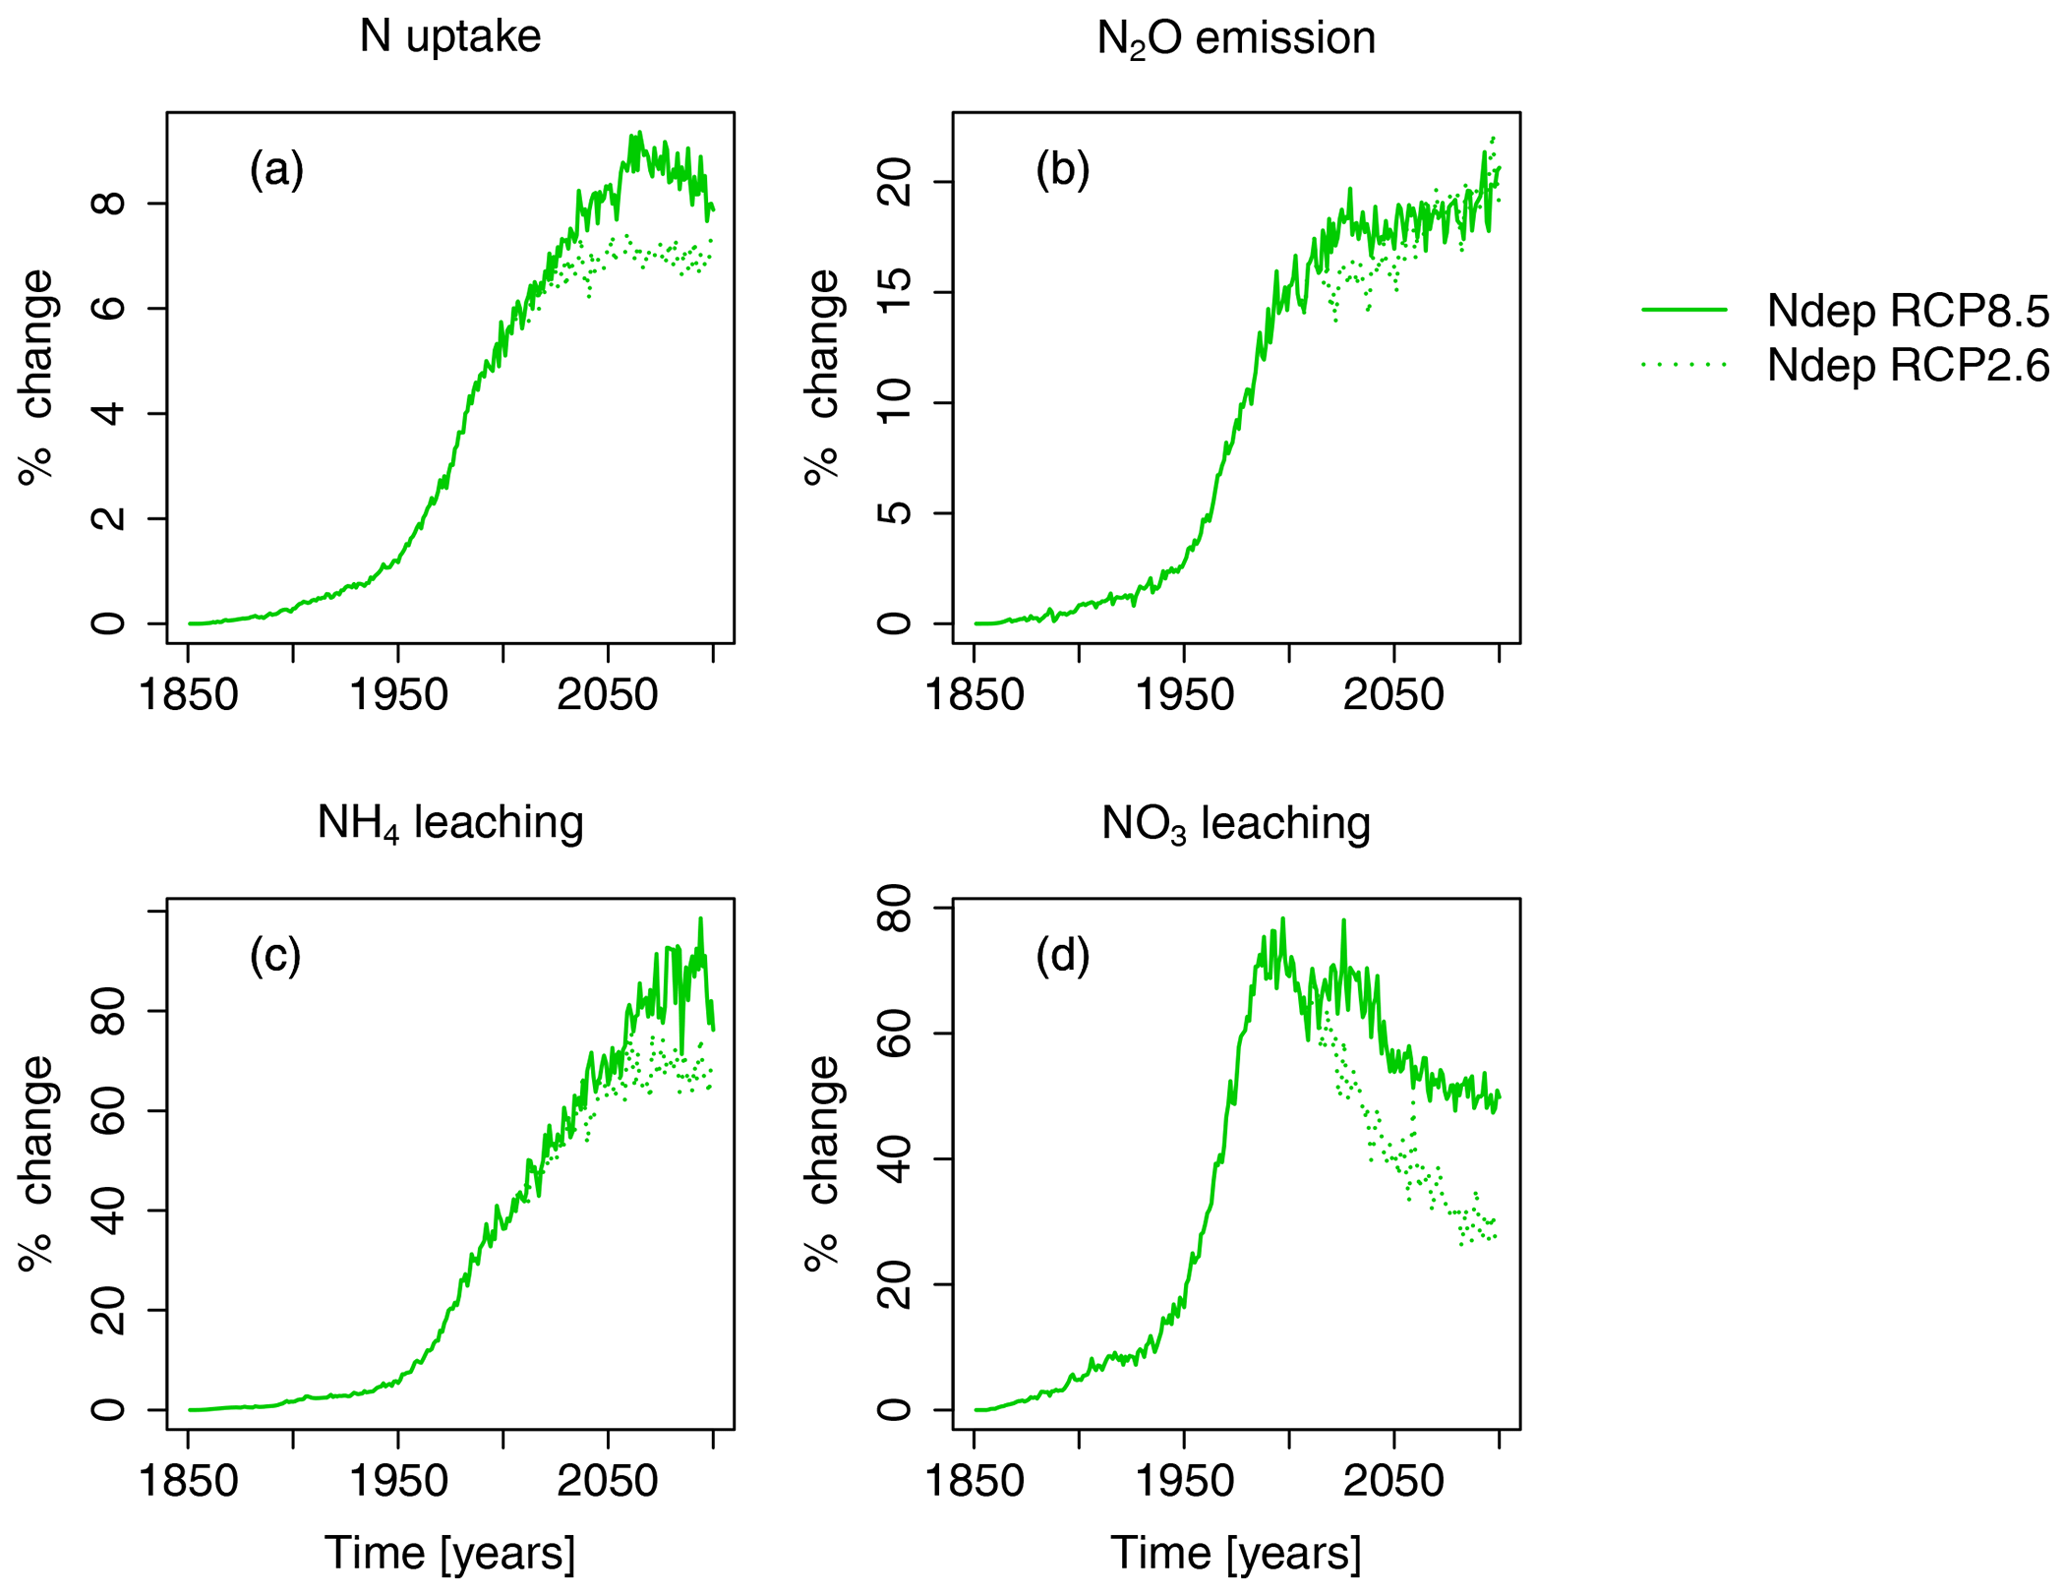
Figure 6Nitrogen-deposition-induced change in percent of total N uptake by region, N2O emission, NH4 leaching, and NO3 leaching compared to preindustrial values in the simulation region. The nitrogen-deposition-induced change in percent is calculated from the simulation runs S3 and S5 (see Table 2). Solid lines indicate results from simulations based on RCP8.5, and dotted lines are results from simulations based on RCP2.6.
Nitrogen deposition steadily increases plant nitrogen uptake until the middle of the 21st century, with maximum simulated increases of about 40 TgNH4yr−1 or 9 % (see Figs. 6 and S4). Concurrently, N deposition increases N2O emissions by 0.7 Tg N2O yr−1 (20 %), and NH4 leaching of 10 Tg NH4 yr−1 (100 %), compared to preindustrial values, are simulated. NO3 leaching increases until the end of the 20th century by 6 Tg NO3 yr−1 (80 %), compared to preindustrial values, and declines again afterwards.
3.3 Magnitude of O3 deposition impact
3.3.1 Ozone uptake
Projections of O3 uptake and damage are primarily controlled by the scenarios of near-surface O3 (Fig. 4a, b). The simulated mean O3 uptake (Fst) due to changes in near-surface O3 concentration increases by approximately 0.27 (70 %) between the preindustrial period and the year 2000 (see Fig. 7a). Under the RCP8.5 scenario, Fst increases until the end of the 21st century, reaching more than a 90 % increase compared to preindustrial times. Conversely, in simulations based on RCP2.6, Fst declines strongly, and by the end of the 21st century, comparable values to simulations, based on preindustrial O3 concentrations, are reached. The mean CUO1 increases by approximately 2.3 mmol O3 m−2 until the year 2000 and strongly declines until the end of the 21st century (see Fig. 7b). In simulations based on RCP2.6, the CUO1 values reach comparable values to simulations based on preindustrial O3 concentrations by 2099.
However, foliar O3 uptake is reduced by increasing atmospheric CO2 concentrations because of its effect on the relationship between stomatal conductance and net photosynthesis. The effect of CO2 can also be seen in the reduction in CUO1 during the 21st century, as shown in Fig. 3. Lower stomatal conductances reduce Fst and CUO1, even if the O3 concentrations slightly increase in simulations based on RCP8.5. Nitrogen deposition slightly increases Fst by, at most, 0.008 and 0.01 for RCP2.6 and RCP8.5, respectively (see Fig. 5a). This relates to an increase in CUO1 of about 1 %. Climate change increases stomatal O3 uptake by about 0.04 during the 21st century and is considerably stronger compared to N deposition.
The two different approaches for assessing the contribution of O3 to the simulated trends in the carbon cycle, based on analyzing alternative combinations of model drivers (see Table 2), yield similar but not identical results (see Fig. 7). Typically, the differences between the two approaches do not exceed 1 %, except for CUO1, where larger relative changes occur for small absolute changes (see Fig. 7b).
3.3.2 Ozone damage
In the period of 1970–1990, i.e., the time of the peak increase in near-surface O3 concentrations, the simulated detrimental effects of O3 on GPP nearly completely counteract the positive effect of rising CO2 concentrations (see Fig. 4c). The negative impact of O3 on GPP shows a maximum in the 1990s at approximately −1.5 PgC yr−1 (4 %) compared to preindustrial values (see Figs. 7c and S5 and Table 4). In the subsequent decades, the simulated O3-induced reduction in GPP declines to 1 % by the end of the 21st century for RCP8.5 and to close to zero for RCP2.6.
Due to the stabilization of atmospheric CO2 in the RCP2.6 scenario, the increase in GPP levels off at 2040s levels but continues to rise under RCP8.5 with increasing CO2. The growth-stimulating effect of N deposition is smaller than the negative impact induced by O3 during the 20th century (see Fig. 4c). This pattern is reversed during the course of the 21st century (see Sect. 3.4).
The O3 effect on GPP propagates to vegetation and, thus, considerably affects the simulated total carbon biomass in vegetation (vegetation C) and, to a limited extent, also soil C storage. In the simulations with transient O3 (S2, S3, and S5), the regionally integrated vegetation C ceases to grow in the 1950s for 30–50 years (see in Fig. 2b), causing a loss of carbon storage compared to the simulations without increasing O3 of about 8 PgC (8 %). Despite the declining effect of O3 on GPP, vegetation C remains reduced for much of the first half of the 21st century and only recovers very slowly afterwards (see Fig. 4c and d). The strongest O3-induced reduction in mean simulated vegetation C in the simulation area occurs in the period of 2000–2020 at approximately 10 % (see Figs. 7d and S5). The O3 effect on vegetation C declines to 5 % by 2099 for RCP8.5 and 4 % for RCP2.6 (see Table 4). The soil C is less strongly impacted by O3, with simulated maximal reductions of less than 2 % (10 PgC).
O3 impact on land C storage (land C flux) peaks at the end of the 20th century. In the 1990s, the effect of O3 on the land sink is about 0.4 PgCyr−1 or approximately 20 %. During the 21st century, the O3 effect on the land C flux is reversed and eventually becomes positive. In the 2090s, the simulated land C flux is increased by about 4 % to 7 % for RCP8.5 and 16 % for RCP2.6. This seemingly counterintuitive effect is the result of lower O3-induced net primary production, which reduces the formation of soil C. The resulting lower stock in soil C in simulations accounting for O3 damage results in lower increases in heterotrophic respiration due to climate change during the 21st century, which causes the reversal of the O3 effect on the land C sink.
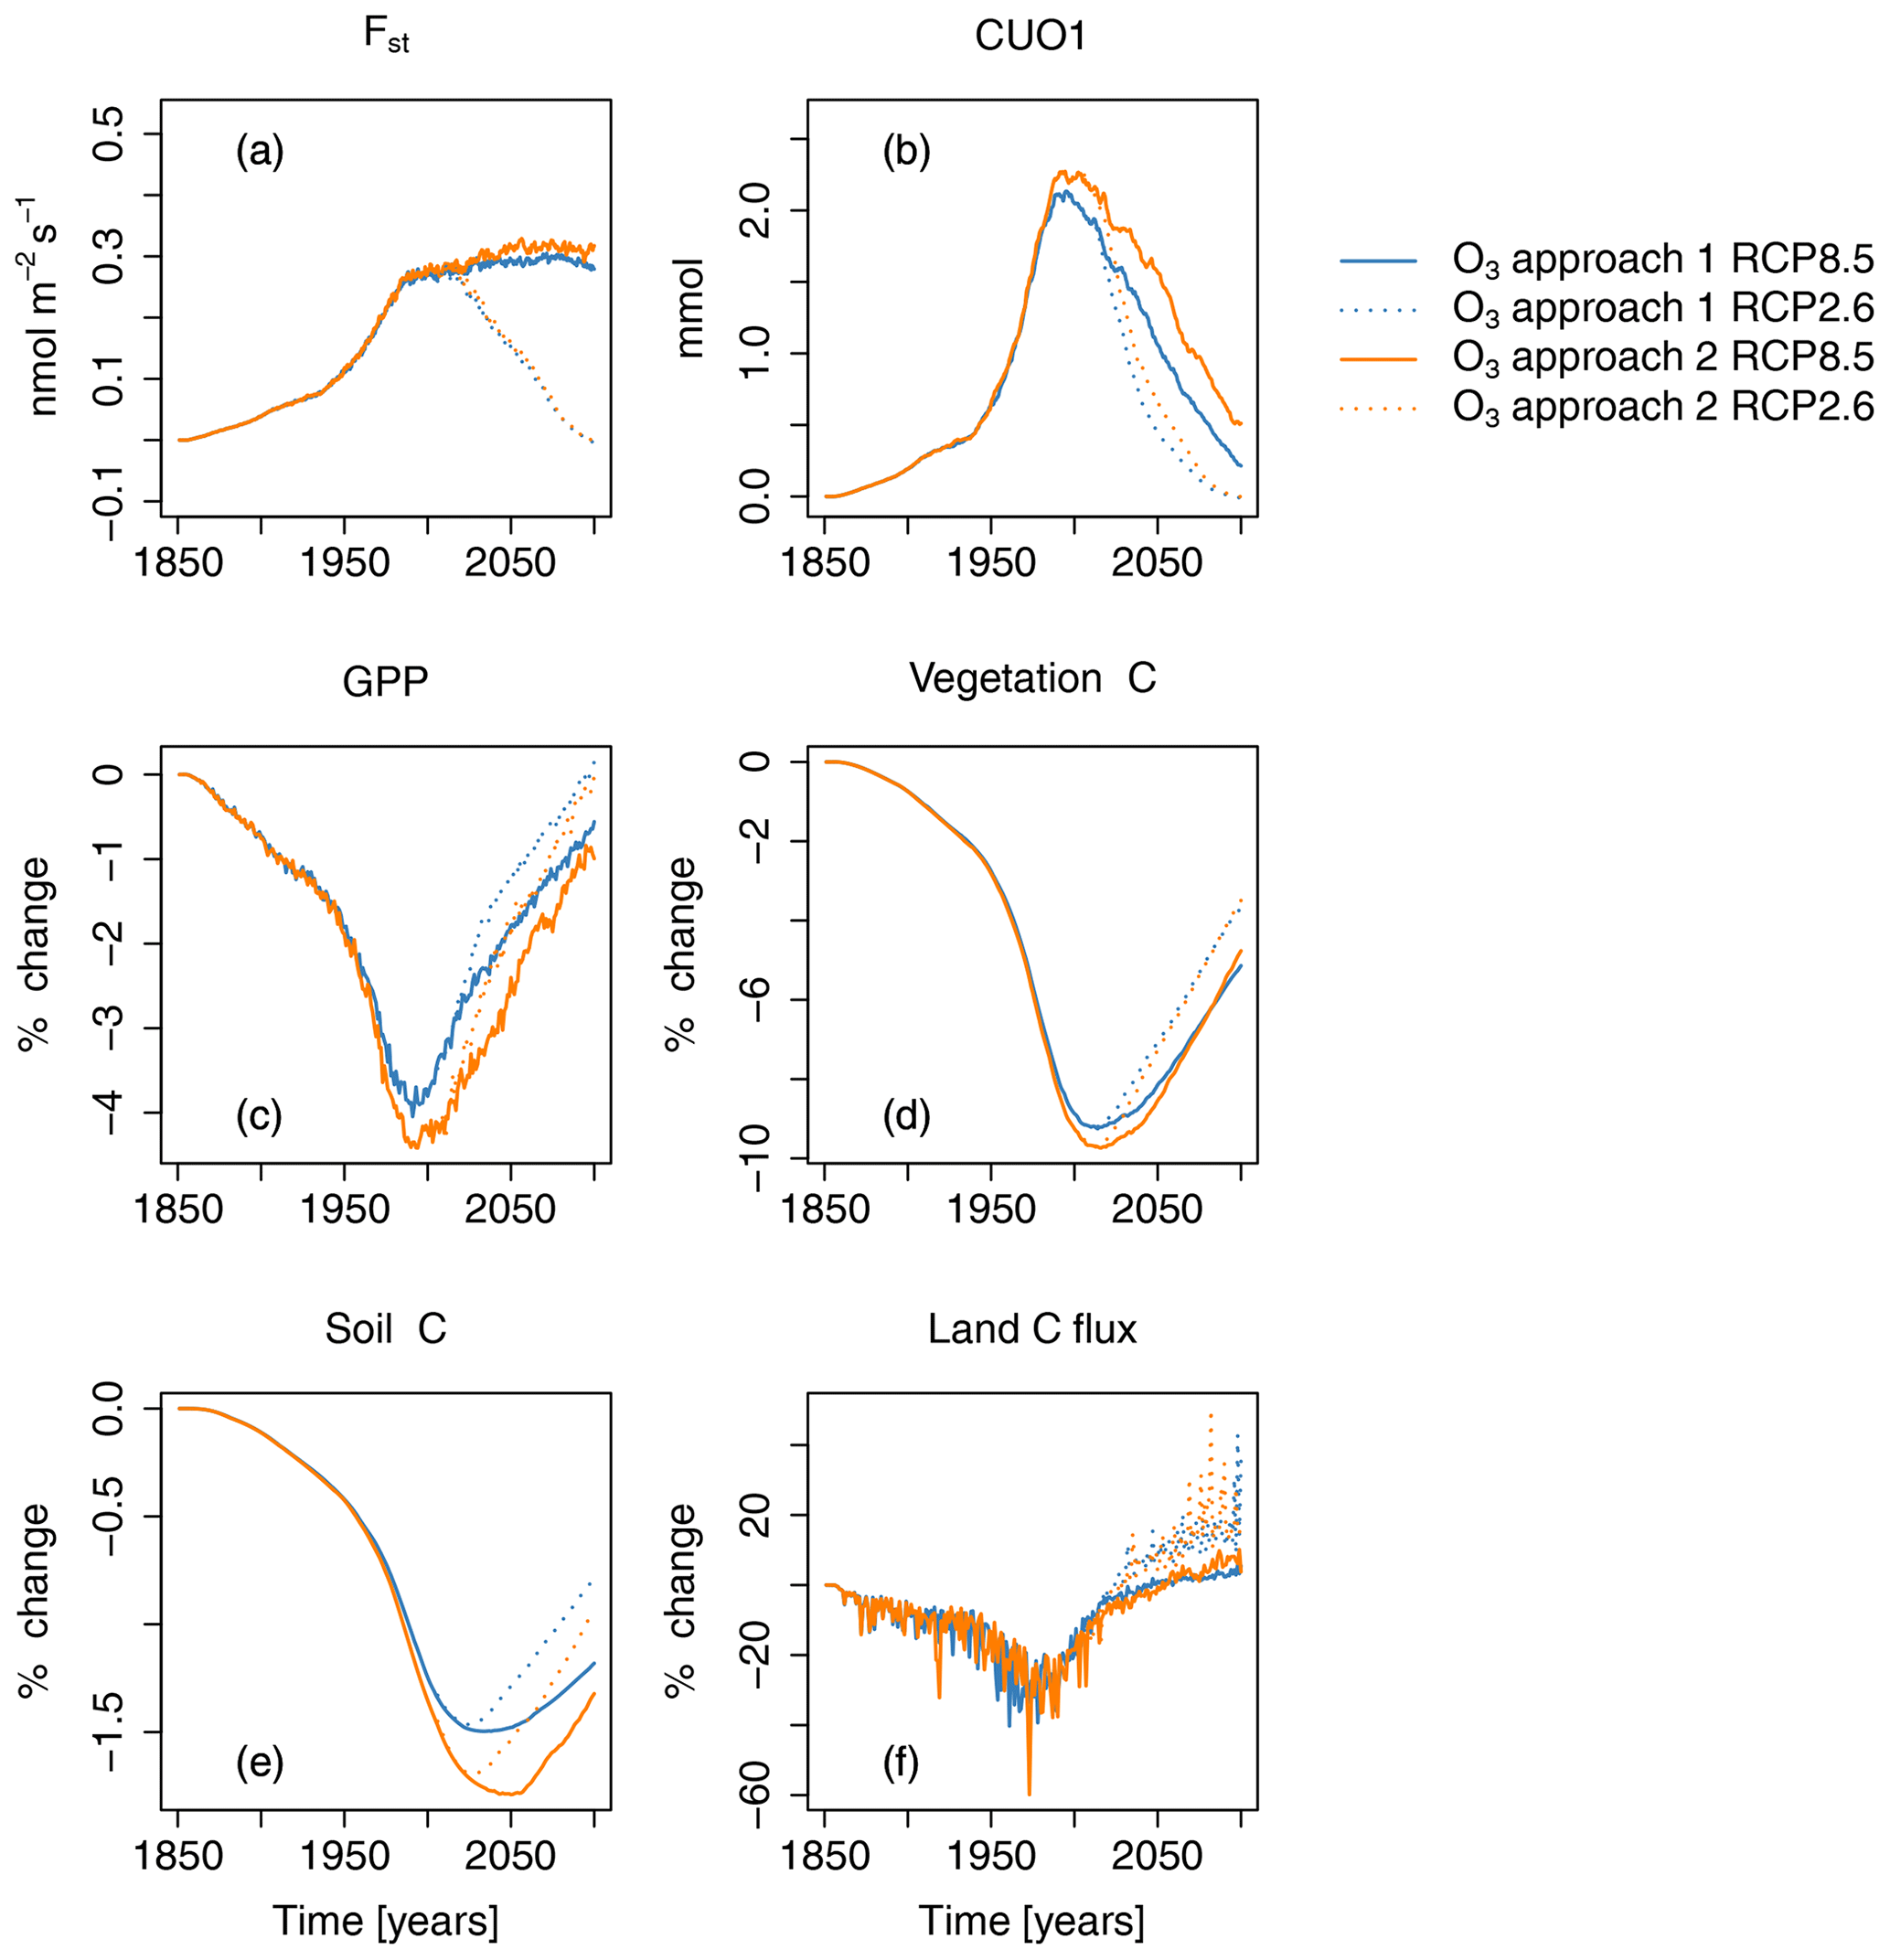
Figure 7Ozone-induced absolute change in regional mean O3 uptake (Fst), mean cumulative O3 uptake above a flux threshold of 1 (CUO1), and change in percent of summed GPP, total carbon biomass in vegetation (vegetation C), summed carbon soil organic matter (soil C), and summed land carbon flux (land C flux) compared to preindustrial values in the simulation region. Different colors indicate different approaches for calculating the O3-induced change from the factorial runs. Orange lines represent approach 1 – (S2−S1)S1; blue lines represent approach 2 – (S5−S4)S4. Solid lines indicate results from simulations based on RCP8.5, and dotted lines are results from simulations based on RCP2.6. The effect of the seasonal cycle is smoothed by the application of a moving average of 12 months.
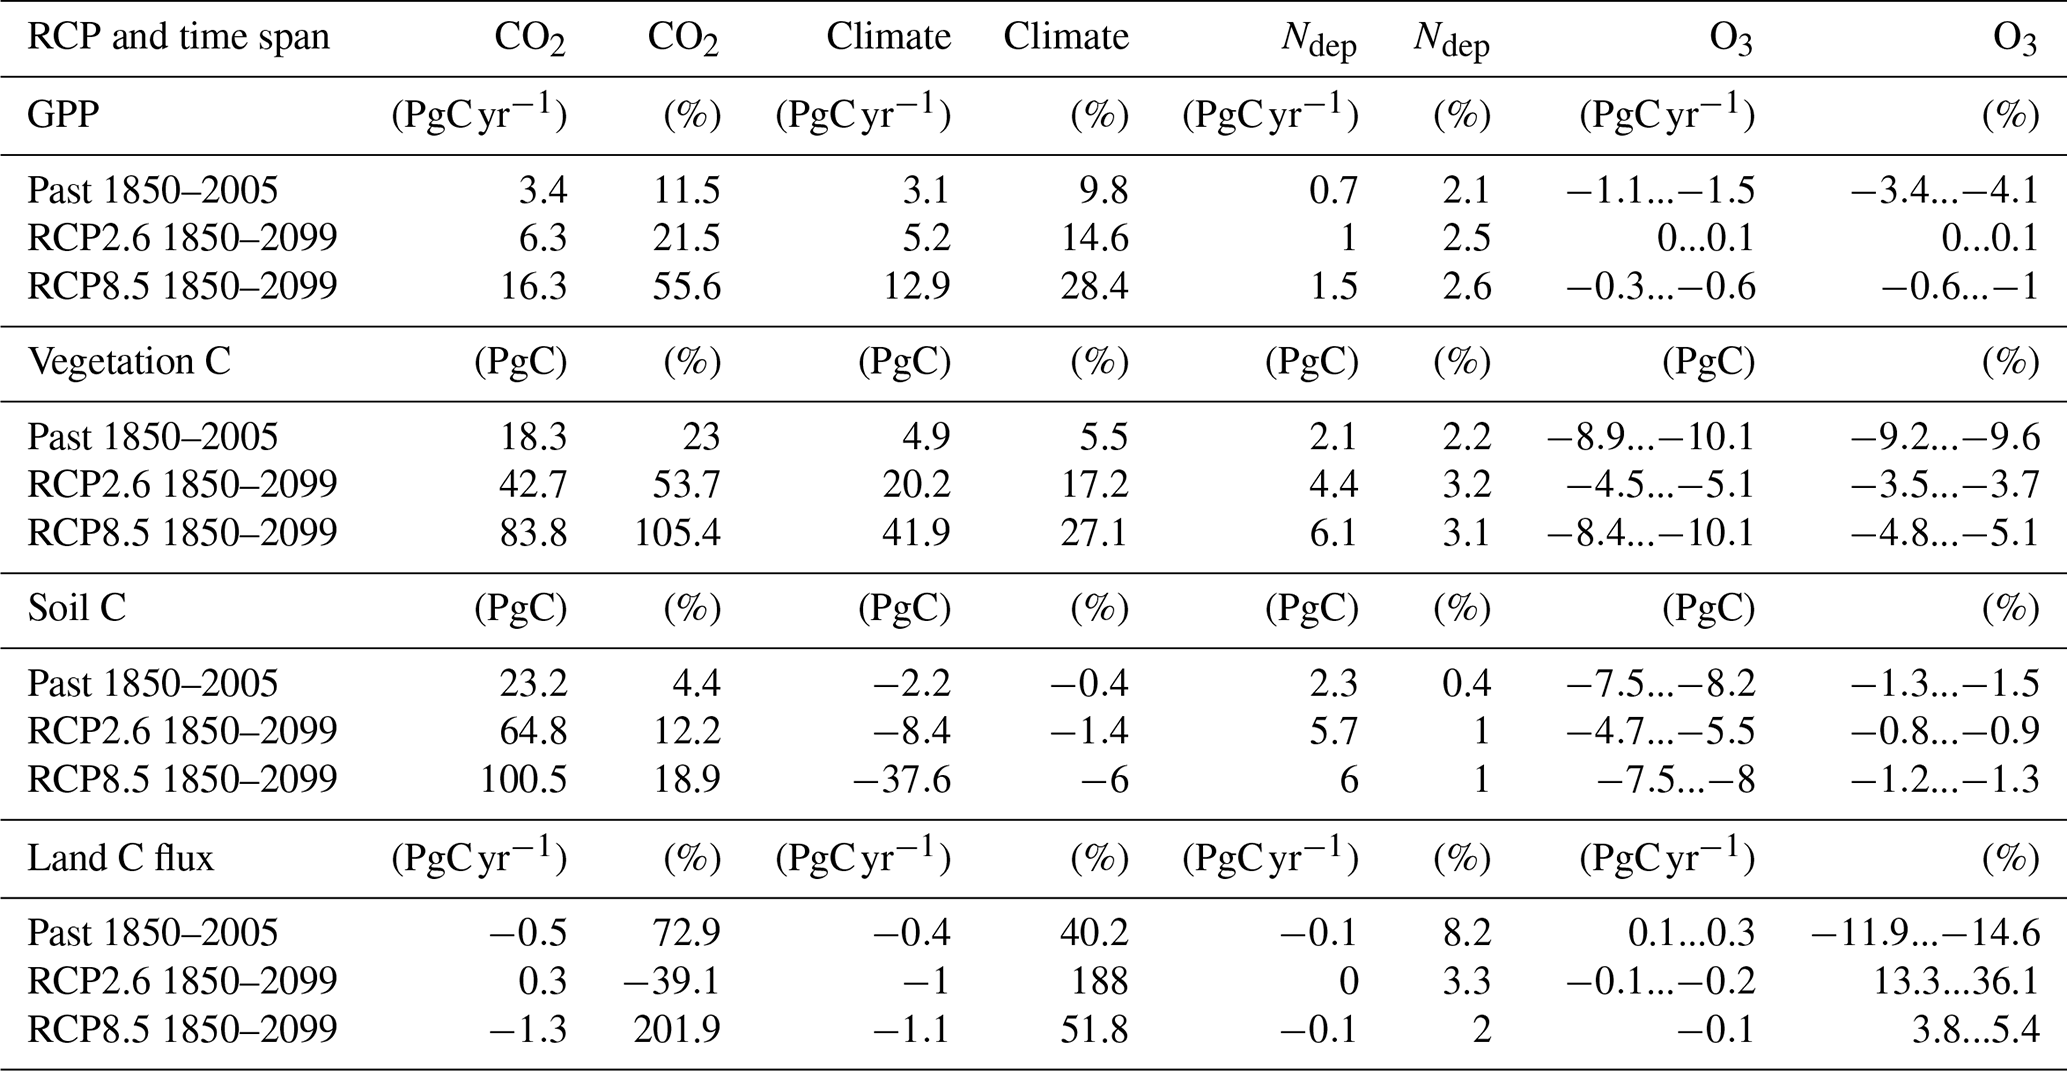
Table 3Absolute and relative change in GPP, total carbon biomass in vegetation (vegetation C), soil organic matter carbon (soil C), and land carbon flux (land C flux) induced by changing atmospheric CO2 concentrations, climate, nitrogen deposition (Ndep), and O3 concentrations. The differences in GPP, vegetation C, soil C, and land C flux are presented for simulations of the past years (1850 to 2005) and for the entire simulation period (1850 to 2099). The reported change refers to the change between the last and the first year of the respective time periods. The given range indicates the estimates according to both approaches for calculating the O3 impact.
3.3.3 Regional patterns
The simulated cumulative O3 uptake above a flux threshold of 1 (CUO1) shows a strong geographic variation. Highest values of CUO1 are simulated during the 1990s in the eastern and northeastern US, large parts of central Europe, and East Asia (see Fig. S6a). Evergreen trees accumulate O3 damage over several years because of the longer lifetime of their leaves compared to deciduous trees. This can result in high values of CUO1, even if O3 concentrations are moderate. At the end of the 21st century, simulated CUO1 values reach comparable values to preindustrial times in large parts of the simulation region and slightly lower values in large parts of the US and Eurasia in simulations based on RCP2.6.
The highest O3-induced absolute reductions in GPP occur in Europe, eastern USA and East Asia, where the respective increase in CUO1 is highest. During the 1990s, peak reductions of about 150–220 gCm2yr−1 (8 %–11 %) are simulated in the eastern USA, southern Europe, and East Asia (see Fig. 8). Simulated O3-induced reductions in GPP decline in the decades of 2040 and 2090 for both RCPs and in many regions, while considerable O3-induced reductions in GPP are simulated until the end of the 21st century in East Asia. In the 2040s, under the RCP8.5 scenario, relative reductions in GPP of 4 %–8 % are simulated in southern Europe and parts of the eastern and western USA, while peak relative decreases of 8 %–11 % are simulated in East Asia. Towards the end of the 21st century O3-induced reductions in GPP continue to decline, but reductions of above 8 % are still simulated in small parts of East Asia. Slight increases in GPP are simulated in a large fraction of the eastern USA and small, scattered areas in Asia. Simulations based on RCP2.6 indicate, for the end of the 21st century, close to no O3-induced damage compared to preindustrial values over large parts of the simulation domain. Small absolute reductions are simulated in parts of Europe and small absolute increases are simulated in the eastern USA, induced by lower CUO1 values compared to preindustrial values (see Fig. S6). Increased atmospheric CO2 concentrations compared to preindustrial values reduce the stomatal conductance, restrict O3 uptake, and enable the increase in GPP values.
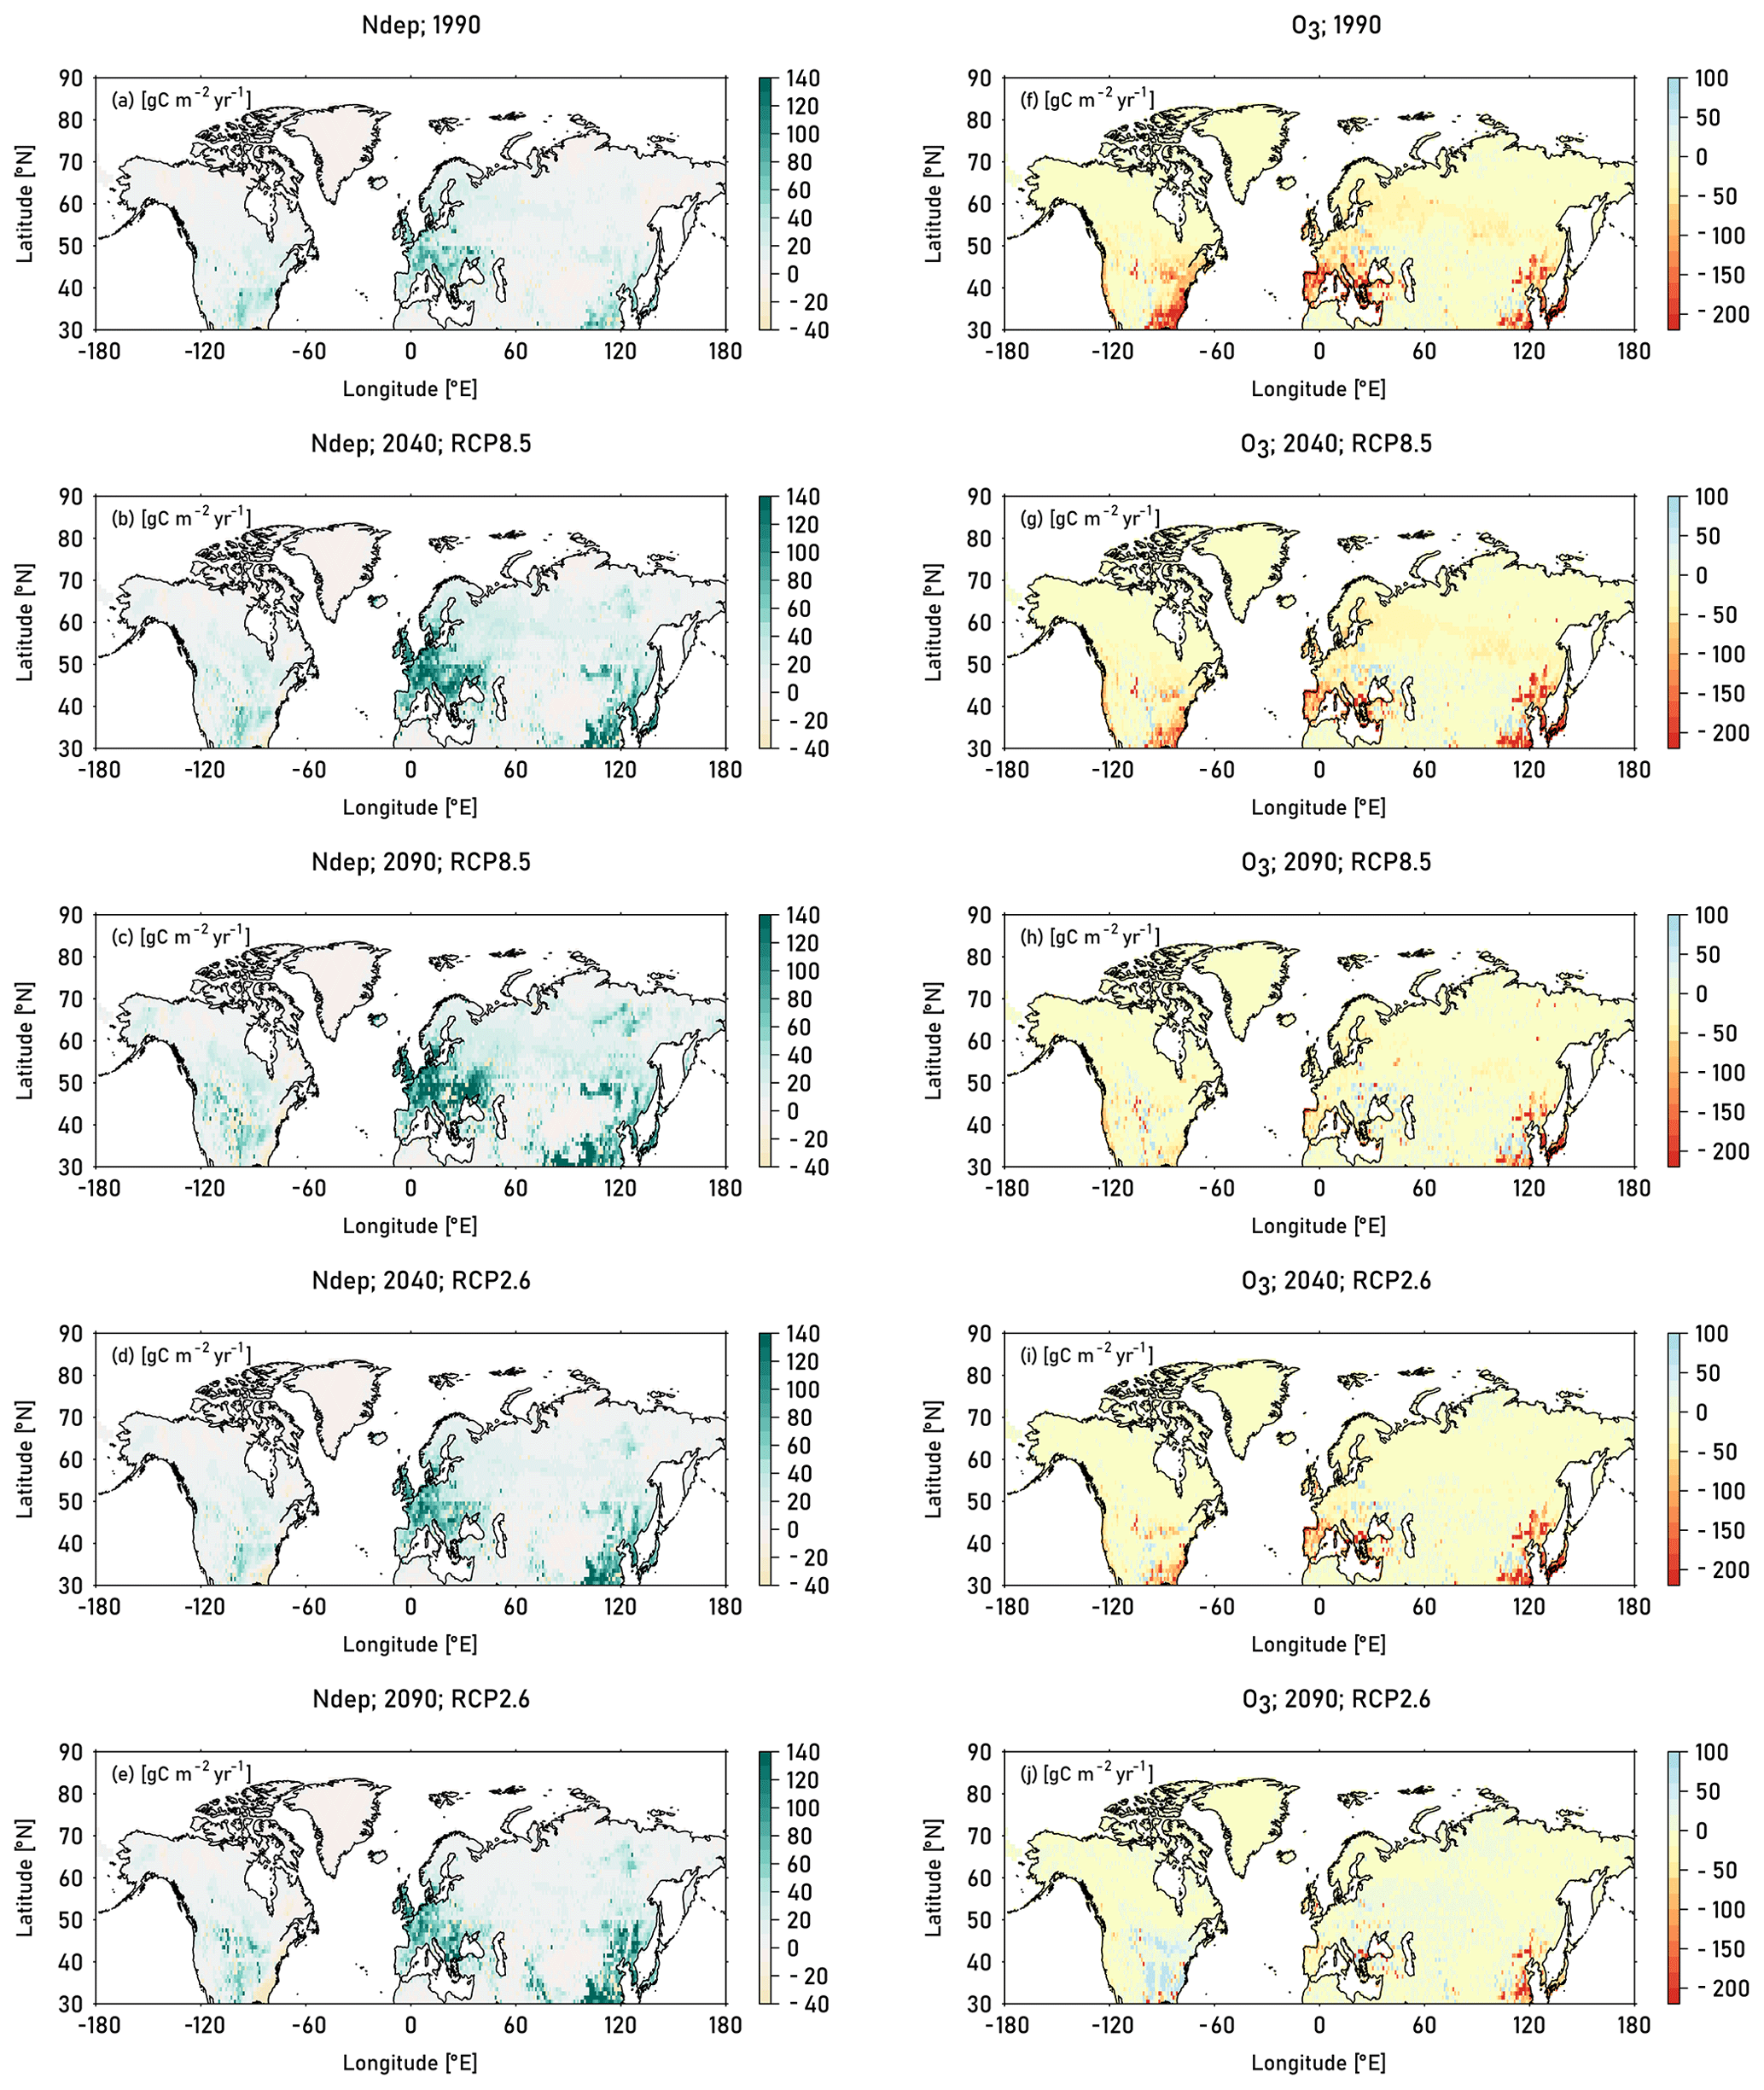
Figure 8Absolute change in GPP compared to preindustrial values induced by nitrogen deposition (left column) and O3 calculated according to approach 2 (right column). The induced change in GPP is displayed for the decades 1990 (mean of the years 1990–1999), 2040 (mean of the years 2040–2049), and 2090 (mean of the years 2090–2099). For the decades 2040 and 2090, results from simulations based on RCP8.5 and RCP2.6 are displayed. See Table 2 for details on the calculation of the single drivers.
As expected, O3 impacts on vegetation C and soil C peak, later compared to GPP (see Fig. 7c–e and Table 4). For both scenarios, the strongest O3-induced absolute reductions in vegetation C of 1400–1600 gCm2 occur in the decade of 2040 in the eastern US, southern Europe, and East Asia (see Fig. 10). For both RCPs, the O3-induced vegetation C reductions exceed 20 % in parts of Europe, eastern and western USA and East Asia in the middle of the 21st century. By the end of the 21st century, the O3-induced vegetation C reduction attenuates in these hot spots for both RCPs, though it is stronger in simulations based on RCP2.6.
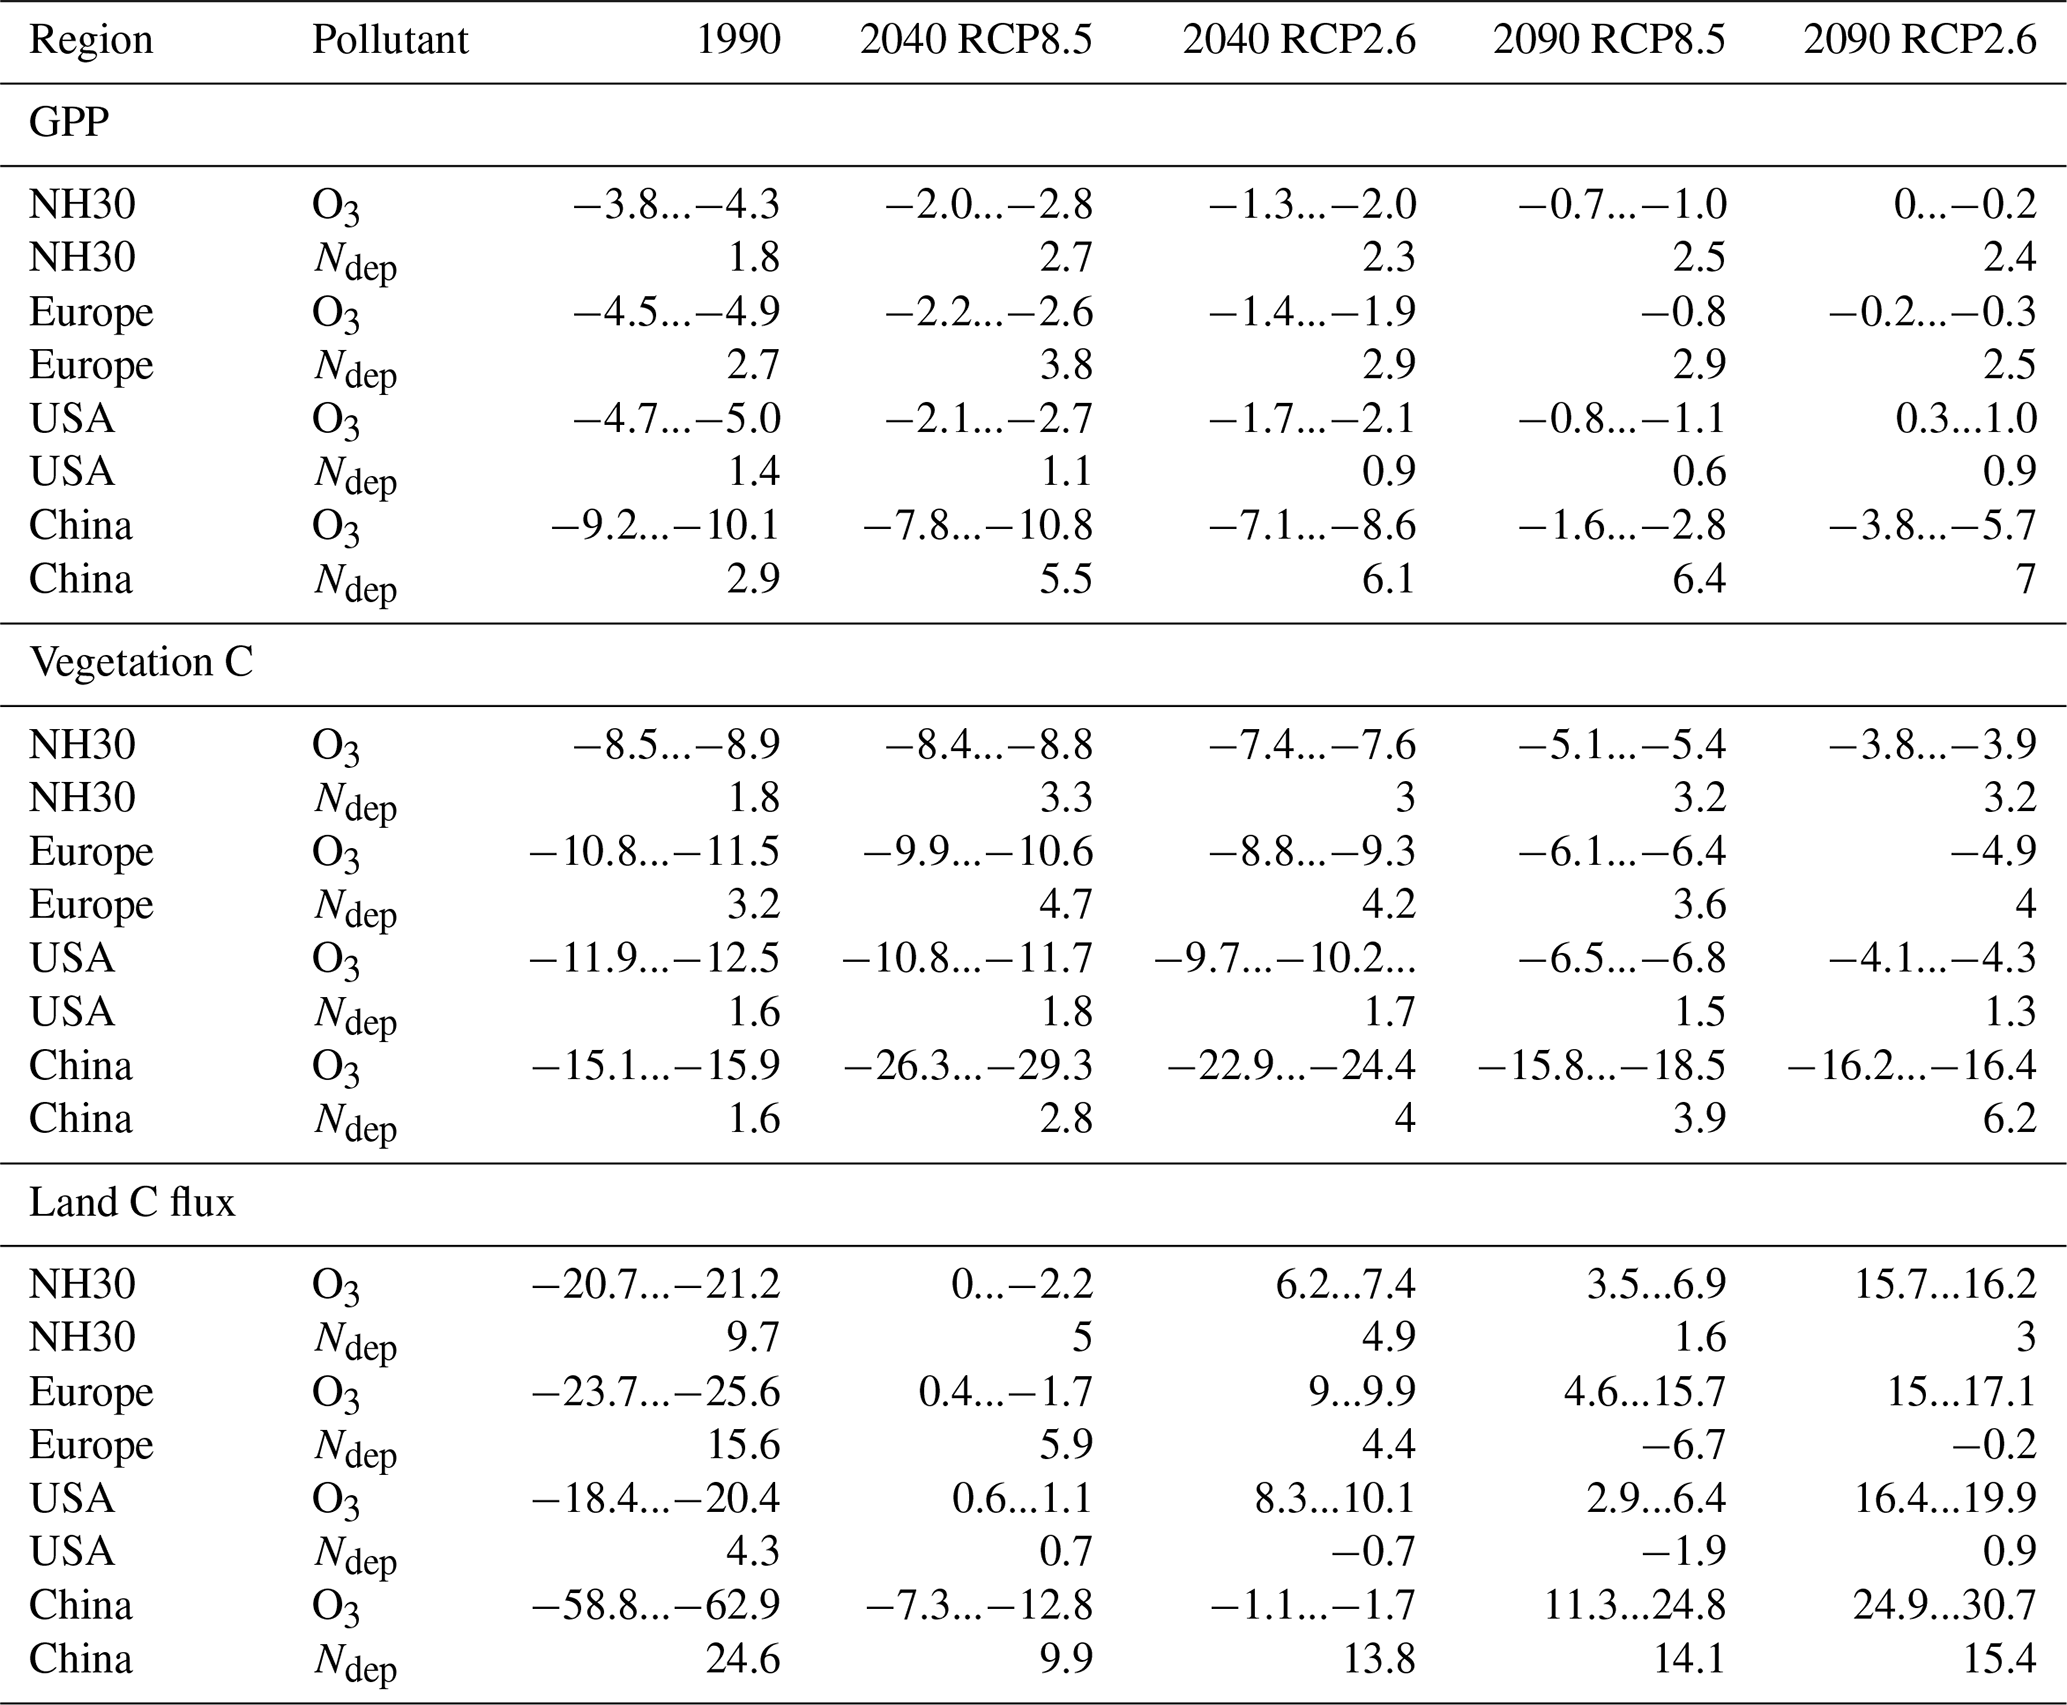
Table 4Mean percent change in GPP, total carbon biomass in vegetation (vegetation C), and land carbon flux (land C flux) induced by O3 during the decades of 1990 (1990–1999), 2040 (2040–2049), and 2090 (2090–2099) compared to preindustrial values for the Northern Hemisphere north of 30∘N (NH30) for Europe, USA, and China. The given range indicates the estimates according to both approaches for calculating the O3 impact. The spread in the effect sizes due to interannual variability, derived from error propagation of the yearly estimates, is displayed in Table S1.
3.4 Comparative impact of N deposition and O3
The magnitude of the O3-induced damage on GPP exceeded the growth-stimulating effect induced by nitrogen deposition over large parts of the 20th century and until the beginning of the 21st century (see Fig. 4c). In contrast to the near-surface O3 concentrations, the regional mean nitrogen deposition does not decline during the 21st century but slightly increases in RCP8.5 and RCP2.6. The growth-stimulating effect on GPP induced by nitrogen deposition becomes higher in magnitude during the 21st century compared to the detrimental effect of O3 (see Figs. 4c and S8 and Table 4).
The growth-stimulating effect of nitrogen deposition on vegetation C remains lower in magnitude compared to the detrimental effects of O3 for both emission scenarios throughout the entire simulation period (see Fig. 4d and Table 3). However, in simulations based on RCP2.6, the O3-induced reduction on vegetation C is at the end of the 21st century only slightly higher in magnitude compared to the growth-stimulating effect induced by nitrogen deposition (see Table 4).
The extent of the simulated impact of O3 and nitrogen deposition on the terrestrial carbon uptake (GPP) and storage (vegetation C) differs strongly within the simulated region. Nitrogen deposition stimulates GPP compared to simulations run with preindustrial deposition values mainly in Europe and East Asia. Simulated increases in GPP in these regions constitute about 80–140 gC m2 yr−1 for simulations run based on RCP8.5 (see left column in Fig. 8). In relative terms, peak increases of 10 %–16 % are found in parts of eastern, central, and northern Asia and small parts of Europe (see Fig. S7). Simulated increases in GPP are higher and hot spot areas more extended in the decade of 2090 compared to the 2040 decade for both RCPs (see Fig. S8). Simulations based on RCP2.6 exhibit similar patterns compared to simulations based on RCP8.5 but show a less strong increase in GPP induced by nitrogen deposition.
Nitrogen deposition induces peak increases in vegetation C of 500–600 gC m2 compared to preindustrial values in parts of Europe and East Asia (see Fig. 10). Highest relative increases in vegetation C of 14 %–17 % are simulated in the decades of 2040 and 2090 in regions of southern and northern Asia, where absolute changes are mostly small.
3.5 Impact of the O3 deposition scheme
In the simulations presented in the previous sections, O–CN was applied with its O3 deposition scheme turned on. To test the impact of the application of the O3 deposition scheme on the estimated ozone damage, we reran the simulations with the O3 deposition scheme turned off. In simulations where the O3 deposition scheme is turned off, the O3 is assumed to enter leaves directly, without accounting for the turbulent transport between the lower troposphere and the leaves and the deposition and destruction of O3 on other surfaces. Turning off the O3 deposition scheme results in considerably higher estimates of Fst and CUO1, resulting in higher damage estimates (see Fig. 9). In simulations where the O3 deposition scheme is turned off, O3-induced reductions in GPP and vegetation C are approximately twice as high compared to simulations in which the O3 deposition scheme is turned on. Peak reductions in the GPP amount are 3 PgC yr−1 (≈ 8 %) compared to approximately 1.5 PgC yr−1 (≈ 4 %) in simulations where the deposition scheme is turned on. At the end of the 21st century, the simulated reductions in vegetation carbon storage (vegetation C) constitute 25 PgC (≈ 11 %) in simulations where the deposition scheme is turned off and 10 PgC (≈ 5 %) in simulations where the deposition scheme is driven by the RCP8.5 scenario. As for GPP and vegetation C, the omission of the O3 deposition scheme causes, roughly, a doubling of the simulated damage to soil carbon organic matter (soil C) and summed land carbon flux (land C flux).
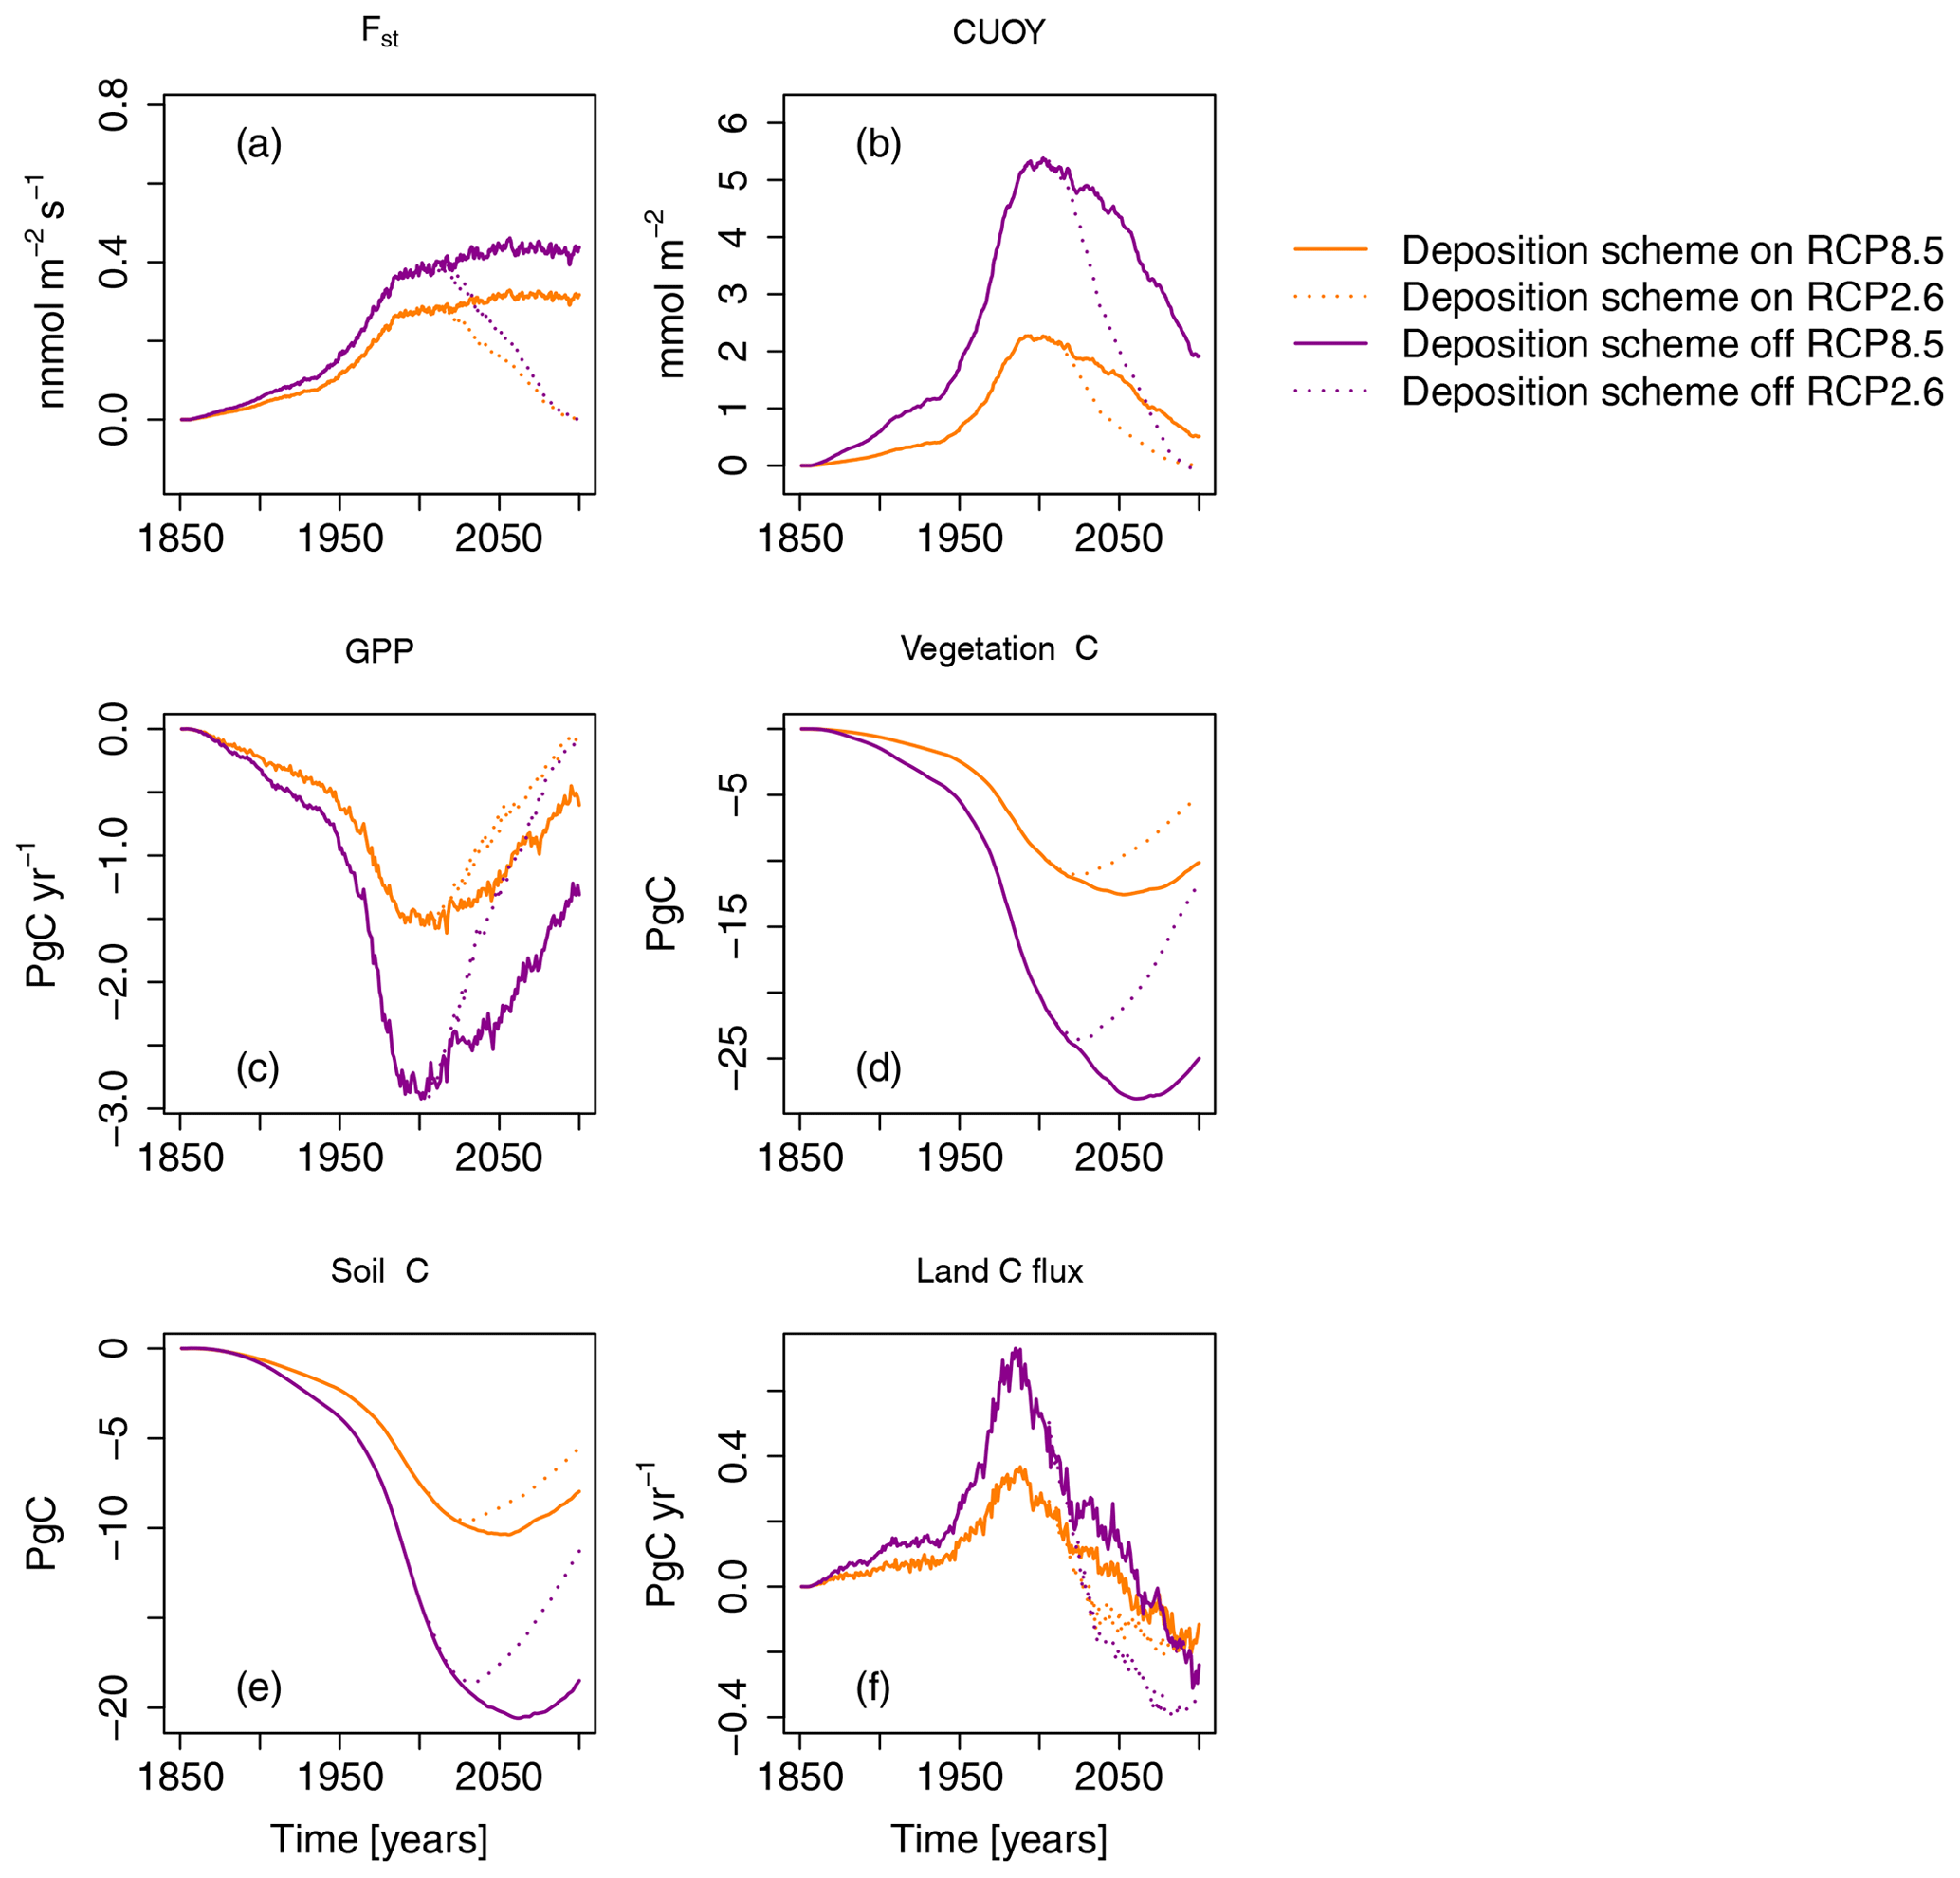
Figure 9Ozone impacts on the regional mean O3 uptake (Fst), mean cumulative O3 uptake above a flux threshold of 1 (CUO1), summed GPP, total carbon biomass in vegetation (vegetation C), summed carbon soil organic matter (soil C), and summed land carbon flux (land C flux) compared to preindustrial values in the simulation region. The displayed O3 impact is calculated based on approach 2. Orange lines indicate results based on a model version in which the O3 deposition scheme is turned on. Magenta lines indicate results based on a model version in which the O3 deposition scheme is turned off. Solid lines indicate results from simulations based on RCP8.5, and dotted lines are results from simulations based on RCP2.6. The effect of the seasonal cycle is smoothed by the application of a moving average of 12 months (a, b).

Figure 10Absolute change in the total carbon biomass in vegetation (vegetation C) compared to preindustrial values induced by nitrogen deposition (left column) and O3 calculated according to approach 2 (right column). The induced change in the total carbon biomass is displayed for the decades 1990 (mean of the years 1990–1999), 2040 (mean of the years 2040–2049), and 2090 (mean of the years 2090–2099). For the decades 2040 and 2090, results from simulations based on RCP8.5 and RCP2.6 are displayed. See Table 2 for details on the calculation of the single drivers.
The simulations of the Northern Hemisphere biosphere from 1850–2099, according to the representative concentration pathway scenarios 2.6 and 8.5, indicate that air pollution (O3 and nitrogen deposition) may have considerably affected carbon uptake and plant growth in the past and will continue to have a considerable impact during the 21st century.
In our simulations, nitrogen deposition stimulates the simulated land carbon sink of the Northern Hemisphere N the strongest in the period between 1950 and 2050 by 5 %–25 % (0.02...0.15 PgC yr−1) compared to preindustrial values.
These values are broadly consistent with a meta-analysis by Schulte-Uebbing and de Vries (2018), who estimated that nitrogen stimulates the global land carbon sink in aboveground and belowground woody biomass by 0.112–0.243 Pg C yr−1. Global carbon storage in forests was estimated to increase by about 0.27 Pg C yr−1 as induced by N deposition for the period 1997–2013 in simulations based on RCP4.5 (Wang et al., 2017). Thomas et al. (2010) found that the aboveground biomass increment increased by 40 % compared to preindustrial conditions in the northeastern and north-central USA during the 1980s and 1990s, from which they estimate that N deposition stimulates global tree carbon storage by 0.3 Pg C yr−1.
Our simulations indicate a O3-induced reduction in the land C flux of 0.4 Pg C yr−1 in the decade of 1990. During the 21st century, the O3 effect on the land C flux is reversed and becomes positive. This is caused by lower increases in soil respiration due to climate change as a result of O3-induced declines of net primary production and, thus, litter fall. This highlights the importance of investigating interactive processes on longer timescales together to obtain a better understanding of their net effect on the land carbon sink.
The stimulating effect of nitrogen deposition on regional mean GPP and biomass is lower in magnitude compared to the detrimental effect of O3 during most of the simulation period for both RCPs (results for RCP2.6 not shown). Both effects approximately even out in their impact on the mean regional GPP by 2030–2050. By the end of the 21st century, the stimulating effect of nitrogen deposition on GPP exceeds the negative impact induced by O3. However, regions that experience strong O3-induced negative effects do not always coincide with regions that benefit from the stimulating effect of nitrogen deposition (see Fig. S8).
During the 21st century, the cumulative O3 uptake above a flux threshold of 1 (CUO1), on which the damage calculations are based, declines due to the impact of the CO2 fertilization effect on stomatal conductance and O3 uptake. This result is in agreement with Oliver et al. (2018), who found in Europe-wide simulations that elevated future CO2 levels and reductions in O3 concentrations result in reduced O3-induced damage values by 2050. Induced by the simulated decline in CUO1, the mean regional reduction in GPP decreases in the decade of 2050 to approximately 2 % in simulations based on RCP8.5 and 1 %–1.5 % in simulations based on RCP2.6. By the end of the 21st century, damage induced by elevated levels of O3 decreases to approximately 1 % in simulations based on RCP8.5 and close to zero for RCP2.6. Simulations with the Joint UK Land Environment Simulator (JULES) model estimate a 8 %–15 % reduction in global GPP between 1901–2100 (Sitch et al., 2007). A more recent version of the JULES model suggests a 4 %–9 % reduction in European GPP due to O3 between 1901 and 2050 (Oliver et al., 2018). Both estimates are higher compared to the simulation results here (see Table 4).
Our estimates of the impact of O3 on the land C sink are smaller than that of Oliver et al. (2018), who simulated a O3-induced reduction in the land C sink by −0.7...−1.3 PgC in the decade of 1970. The simulated detrimental O3 effect declines in the following decades to −0.3...−0.5 PgC in the period of 2002–2011. A possible reason for the higher estimates by Sitch et al. (2007) is the absence of a O3 deposition scheme in JULES, which might have caused higher surface O3 concentrations and, hence, increased O3 uptake and incurred damage. The near-surface O3 concentrations used in the simulations here to force the model report O3 concentrations at a height of approximately 45 m above the surface. The O3 deposition scheme included in O–CN uses the O3 concentration of the free troposphere to calculate the O3 concentration at canopy level.
If the O3 concentration from the forcing is used as if being at canopy level, the O–CN model simulates a higher O3 uptake. Following this, doubly high damage values to GPP and vegetation C are calculated compared to simulations where the deposition scheme is applied to calculate the canopy level O3 concentration. This highlights the importance of using canopy level O3 concentrations to calculate O3 uptake and damage to prevent a considerable overestimation of O3-induced damage.
4.1 Air pollution impacts on GPP and total carbon biomass
The average O3 effect on GPP in the Northern Hemisphere ( N) increases until the 1990s, when GPP is reduced by approximately 4 % compared to the preindustrial period. Regional hot spots in southern Europe, East Asia, and the eastern USA exhibit O3 induced reductions of 8 %–11 % for the decade of 1990. In a meta-analyses by Wittig et al. (2009), net photosynthesis damage of trees grown in ambient O3 concentrations vs. charcoal-filtered air is estimated to amount to 11 % and 19 % for trees grown in elevated O3 concentrations vs. charcoal-filtered air. Lombardozzi et al. (2013) estimates damage to net photosynthesis of temperate deciduous trees to amount to 12 % and 16 % for temperate evergreen trees. A reduction of 28 % in net photosynthesis is estimated for woody plants grown in elevated O3 compared to a control by Li et al. (2017). Simulated O3 damage values in hot spot areas are close to the lower damage estimates suggested by Wittig et al. (2009) and Lombardozzi et al. (2013), while the regional means, including many areas with low O3 exposure, result in lower average O3 damage than estimated by these meta-analyses.
Several process-based models estimated O3-induced damage to GPP or net primary production (NPP) on global or regional scales. A mean global O3-induced reduction in NPP of 0.8 %–2.9 % from 1989 to 1993 is estimated by the Terrestrial Ecosystem Model (TEM; Felzer et al., 2005). Simulations with the community land model suggest a 10.8 % reduction in global mean GPP for present-day O3 concentrations (Lombardozzi et al., 2015). A mean reduction in NPP of 4.5 % in China between 1961–2000 is estimated by a process-based dynamic land ecosystem model (Ren et al., 2007). The simulation of O3 damage to China's forests suggest a 0.2 %–1.6 % decrease in NPP from the 1960s to 2005 (Ren et al., 2011). Simulations using the TEM estimate a mean reduction in NPP of 2.6 %–6.8 % in the USA for the period of the late 1980s to early 1990s (Felzer et al., 2004). The Yale Interactive terrestrial Biosphere (YIBs) model simulates a 4 %–8 % damage to GPP due to O3 in the eastern USA and a 8 %–17 % damage in hot spots for the decade of 1998–2007 (Yue and Unger, 2014). In the Euro–Mediterranean region, a reduction in GPP of 22 % is estimated for the year 2002 by the ORCHIDEE model (Anav et al., 2011). The mean GPP of the years 2001–2010 in Europe is simulated to be reduced by 7.6 % compared to not accounting for O3 damage by the O–CN model (Franz et al., 2017). Here, on a regional mean basis, O3-induced reductions of about 4 % are simulated at the end of the 20th century and the beginning of the 21st century compared to preindustrial values. At the end of the 21st century, close to zero O3-induced reductions in GPP are simulated by O–CN here. An exception are hot spots, like East Asia, where peak decreases of more than 8 % are simulated for both RCPs at the end of 21st century. Our damage estimates here are lower compared to at least most of the previous estimates suggested by biosphere models.
In our simulations, the O3-induced regional reduction in total carbon biomass in vegetation (vegetation C) reaches peak values of 8 %–10 % at the end of the 20th century and the first half of the 21st century. Damage values of 20 %–23 % are simulated in damage hot spots in southern Europe, East Asia, and the eastern and western USA for the decade of 1990 (see Fig. S9). A meta-analyses conducted with trees suggests a 7 % reduction in total biomass for trees grown in ambient air compared to charcoal-filtered air and a 17 % reduction for trees grown in elevated O3 concentrations compared to charcoal-filtered air (Wittig et al., 2009). In a meta-analyses by Li et al. (2017), a 14 % reduction in total biomass is calculated for trees grown in elevated O3 concentrations (mean of 116 ppb – parts per billion) compared to controls grown in a mean O3 concentration of 21 ppb. The simulated regional mean estimate of O3-induced damage to vegetation C is higher compared to the estimate of trees grown in ambient vs. charcoal-filtered air by Wittig et al. (2009) and lower compared to trees grown in elevated O3 vs. charcoal-filtered air or a mean of 21 ppb O3 (Wittig et al., 2009; Li et al., 2017). Simulated damage values in the hot spots are higher compared to the estimates by the meta-analyses.
Our simulated declines in O3-induced damage to GPP and vegetation C during the 21st century generally agree with simulated reductions in potential threat to vegetation by Klingberg et al. (2014).
Klingberg et al. (2014) report that, by 2050, the O3 exposure index AOT40 (Accumulated exposure Over a Threshold of 40 ppb O3) is projected to decrease over wide areas of Europe below the critical levels defined by the EU directive (2008/50/EC) and the Long-range Transboundary Air Pollution (LRTAP) convention in simulations of the chemistry transport model, MATCH, driven by the RCP4.5 emission scenario. Their simulations suggest that the more physiologically based O3 damage index POD1 (Phytotoxic Ozone Dose above a threshold of 1 nmol m−2 s−1) declines as well; however, this is to a lesser extent compared to the AOT40 index and is not below critical levels defined for forest trees (Klingberg et al., 2014).
An ensemble of six global atmospheric chemistry transport models project improvements of the AOT40 index in the Northern Hemisphere by 2099 under RCP2.6 and RCP4.5, while critical levels continue to be exceeded over many areas (Sicard et al., 2017). By 2099, the potential impact of O3 on photosynthesis and carbon assimilation is projected to decline by 61 % under the RCP2.6 scenario, by 47 % under RCP4.5, and increase by 70 % under the RCP8.5 scenario compared to the early 2000s (Sicard et al., 2017).
4.2 Interactive effects of O3 and CO2
Elevated levels of CO2 (eCO2) have the potential to induce stomatal closure (Paoletti and Grulke, 2005), which might limit O3 uptake and damage. Contradictory evidence exists showing that either eCO2 ameliorated the negative effects of O3 on plants (Barnes and Pfirrmann, 1992; Broadmeadow and Jackson, 2000; Isebrands et al., 2001; Riikonen et al., 2004) or that there was little interaction between both gases, and the stimulating effect of eCO2 on NPP persisted (Talhelm et al., 2014; Zak et al., 2011). Results from the Aspen FACE (Free-Air Carbon Dioxide Enrichment) experiment indicate that stomatal conductance and O3 uptake were not reduced by eCO2 in their experiment (Uddling et al., 2010) and that O3 fumigation completely offset the growth enhancement observed in the eCO2 treatment for O3-sensitive and O3-tolerant clones (Karnosky et al., 2003).
Several studies find species-specific positive or negative impacts of eCO2 and elevated levels of O3 (eCO3) on photosynthesis (Noormets et al., 2001), growth (Isebrands et al., 2001), and biomass (King et al., 2005). An amplification of the negative effects of O3 under eCO2 on leaf chlorophyll content, nitrogen content, and electron transport capacity (Jmax) was observed in O3-sensitive and O3-tolerant aspen clones (Noormets et al., 2010). A possible reason for the amplification of O3-induced negative effects under eCO2 is a possible downregulation or suppression of antioxidant production under eCO2 and, hence, increased injury (Wustman et al., 2001; Karnosky et al., 2003). All in all, a clear picture of the joint effects of eCO2+eCO3 on plants or plant groups is still lacking.
Terrestrial biosphere models often assume a tight coupling between net photosynthesis and stomatal conductance, which induces stomatal closure in case of simulated eCO2 and restricts O3 uptake and damage (Felzer et al., 2004, 2005; Sitch et al., 2007; Oliver et al., 2018; Yue and Unger, 2014). For example, Sitch et al. (2007) simulated a 6 %–9 % reduction in O3-induced damage to GPP due to elevated levels of CO2 and a 5 %–10 % reduction in the ozone-related effect on land carbon storage between the years 1901 and 2100 in a scenario with strongly rising atmospheric CO2. Oliver et al. (2018) simulated a 1 %–2 % decrease in O3-induced damage to GPP and land carbon storage caused by elevated levels of CO2 between 1901 and 2050. The largest simulated impact of O3 on the land carbon sink occurred during the 20th century when the tropospheric O3 concentration rose quickly (Oliver et al., 2018). During the 21th century, simulated O3 concentrations changed less, and the simulated elevated levels of CO2 restricted O3 uptake and induced damage (Oliver et al., 2018). This agrees well with our findings here that O3-induced damage increases from preindustrial times until the end of the 20th century (GPP) or the beginning of the 21st century (vegetation C) and afterwards decreases again (see Fig. 7).
However, the simulation of reduced O3 uptake and incurred damage induced by eCO2 does not mirror all the effects observed in field experiments (Wustman et al., 2001; Karnosky et al., 2003; Noormets et al., 2010). Similar to other terrestrial biosphere models, O–CN does not account for observed effects like an exacerbation of O3-induced damage due to eCO2 (Wustman et al., 2001; Karnosky et al., 2003) or unaltered rates of stomatal conductance and O3 uptake under eCO2 (Uddling et al., 2010). Following this, the presented low values of simulated future O3 damage represent a possible future scenario under the assumption that the large majority of plants react to the combined exposure of elevated levels of CO2 and O3 with a reduced stomatal uptake of O3 and reduced incurred damage.
4.3 Limitations of comparisons between publications
When interpreting the comparison of our results and previously published simulation results, one has to keep in mind that the different modeling setups and approaches differ in several aspects that considerably affect the damage estimate. Models often apply different injury functions which relate O3 uptake to plant damage (Lombardozzi et al., 2012, 2015; Franz et al., 2017; Oliver et al., 2018). However, injury functions have the potential to induce considerable over- or underestimation of simulated biomass damage compared to measured damage values (Franz et al., 2018). Simulations differ in the time period covered, e.g., Sitch et al. (2007), with 1901–2100, Lombardozzi et al. (2015), with 25 years with an average O3 concentration of the years 2002–2009, Franz et al. (2017), with 1961–2011, and Oliver et al. (2018), with 1901–2050. They also differ in the forcing considered, e.g., the representation of changing CO2 concentrations, nitrogen deposition and land cover and/or land use change. For instance, Sitch et al. (2007) simulate changing CO2 concentrations, while Lombardozzi et al. (2015) do not; Franz et al. (2017) account for changing CO2 concentrations and nitrogen deposition but use static land cover (kept fixed at 2005 levels), and Oliver et al. (2018) simulate changing CO2 concentrations and a partly fixed land cover but no effect of N deposition. Furthermore, damage estimates are calculated based on different reference periods and conditions. Damage might be given as the difference between a simulation accounting for O3 damage compared to a reference simulation not accounting for O3 damage (Lombardozzi et al., 2015; Franz et al., 2017). Another approach is to report the damage simulated between a specific time period. Sitch et al. (2007) calculate O3-induced damage between 1901–2100 and Oliver et al. (2018) between 1901–2001 and 2001–2050.
Different modeling studies apply differing emission scenarios, e.g., Intergovernmental Panel on Climate Change Special Report on Emission Scenarios (IPCC SRES; Sitch et al., 2007) and the RCP scenarios used here, which might impact simulated O3 uptake and incurred damage. The application of the IPCC SRES scenarios, which assume a large increase in O3 precursor emissions, imply an increase in annual global mean surface O3 concentrations by 4–6 ppb (Wild et al., 2012). Contrary to this, the application of the RCP scenarios (Moss et al., 2010; van Vuuren et al., 2011) in 14 global chemistry transport models results in the projection of declining annual global mean surface O3 concentrations of as much as 2 ppb by 2050 in most regions of the globe, except South Asia where increases are simulated (Wild et al., 2012). Lower projected ozone-induced damage in our study compared to Sitch et al. (2007) is therefore also a consequence of the assumed scenario.
Turnock et al. (2020) found that the sixth Coupled Model Intercomparison Project (CMIP6) model overestimates observed surface O3 concentrations by up to 16 ppb across most regions of the globe. This will likely lead to a general overestimation of simulated O3 damage by terrestrial biosphere models. However, the ozone deposition scheme included in O–CN has the potential to ameliorate this observed discrepancy. The calculation of canopy level O3 concentrations from the lowest level O3 concentrations of the forcing data are lower and, thus, probably closer to the observations.
A further important difference between the published results is the time resolution of the O3 forcing applied in the simulations. Some studies used hourly O3 forcing (e.g., Lombardozzi et al., 2015; Franz et al., 2017; Oliver et al., 2018) and others are forced by monthly diurnal mean values (e.g., Sitch et al., 2007 and the simulations here). As the formation of O3 shows a pronounced diurnal cycle (Sanz et al., 2007), the use of monthly mean O3 concentrations probably impacts the simulated estimates of O3 uptake. However, to what extent the omission of a diurnal cycle impacts O3 uptake, accumulation, and damage estimates is yet uncertain.
4.4 Limits to the parameterization of O3 damage in O–CN
Plants can activate defense mechanism and physiological pathways to produce protective compounds like ascorbate and polyamines which can detoxify at least part of the ozone taken up (Kangasjärvi et al., 1994; Kronfuß et al., 1998; Tausz et al., 2007). In the simulations conducted here, we account for detoxification by introducing a flux threshold but do not account for the cost for producing protective compounds like antioxidants due to the lack of suitable data. This could potentially introduce a bias towards underestimating damage to GPP if the leaf injury parameterizations are based on leaf-level data.
Ozone sensitivity is known to differ between plant groups, plant species, and between genotypes (Wittig et al., 2007; Lombardozzi et al., 2013; Li et al., 2017; Hayes et al., 2007; Karnosky et al., 2003). The assumed injury function is a key aspect of the simulation of O3 damage and has a large impact on the extent of the estimated damage (Franz et al., 2018). However, the scarcity of suitable data restricts the possibility to parameterize injury functions for all simulated PFTs (e.g., 12 PFTs in O–CN), let alone a variation of the O3 sensitivity within PFTs. Furthermore, it restricts the evaluation of O3 submodels and the included injury functions. The injury functions used for the simulations here are tuned to reproduce observed biomass damage from filtration and/or fumigation experiments of broadleaved and needleleaved tree species (Franz et al., 2018). The simulations are restricted to the Northern Hemisphere ( N) to limit the domain of simulation to temperate and/or boreal forests and, thus, similar species as used for the tuning of the injury functions. Due to the lack of suitable damage functions for grass species, we here applied the damage functions developed to match damage to trees. This induces a bias in the damage estimates and will likely result in an underestimation of simulated damage for example for the crop plant functional types.
The biomass damage experiments used to parameterize the injury function in O–CN were conducted with young trees grown in monocultures. The common attempt to estimate responses of adult trees grown under natural conditions by the extrapolation of results from short-term experiments with young trees is subject to several issues, e.g., due to the differing environmental conditions and changing O3 sensitivities with increasing tree size or age (Schaub et al., 2005; Cailleret et al., 2018; Franz et al., 2018). It is yet uncertain if the simulation of injury to photosynthesis based on experiments with young trees can be transferred to adult trees to obtain realistic biomass damage estimates.
Differing O3 sensitivities can induce changes in community composition (Barbo et al., 1998; Kubiske et al., 2007; Zak et al., 2011) and the interactive effects of changing CO2 and O3 concentrations (Karnosky et al., 2003). The responses of plants grown under interspecific competition, e.g., in forests, may not be transferred from results of filtration and/or fumigation experiments (with elevated CO2 and/or O3) of plants grown in monocultures (Kozovits et al., 2005). For instance, Zak et al. (2011) found that initial declines in forest productivity induced by elevated levels of O3 were compensated for by the growth of O3-tolerant individuals, resulting in an equivalent NPP between ambient and elevated levels of O3. Simulations by an individual-based forest model indicate that O3 damage might not reduce the carbon sequestration capacity of forests if the reduced carbon fixation of O3-sensitive species is compensated by increased carbon fixation of less O3-sensitive species at the ecosystem level (Wang et al., 2016). The simulation of community dynamics is limited in O–CN, as it does not account for species, and therefore, acclimation processes at the ecosystem level are not accounted for. The effect of interspecific competition on O3 damage is not reflected in the used injury function as the experiments are conducted with monocultures. These two factors can contribute to an overestimation of simulated damage.
The application of present-day land use information fixed to the year 2000 in our simulations may affect simulated trends of GPP, canopy conductance, and biomass production in regions where land cover and/or land use have historically changed or are projected to change during the scenario period. This can lead to a discrepancy in the simulated effect of nitrogen deposition and O3 damage. For example, O3 damage differs between plant functional types, and a shift to highly productive crops would result in an increase in damage.
Holding the N fertilizer application at the year 2000 levels in our simulations here imposes a bias on the simulated GPP, biomass production, and O3 damage in regions where fertilizer application changed. Regions in which fertilizer application decreased would show a reduction in growth stimulation along with a reduction in O3 damage. Regions exposed to increases in fertilizer application would exhibit a stimulation in growth along with an increase in O3 damage.
The simulations conducted here are run offline, and following this, atmosphere and biosphere do not induce feedback on one another. Forcing variables like O3 concentrations and nitrogen deposition are provided by a different model than the climate. This imposes an inconsistency between the biosphere, climate, and the abundance of the air pollutants for which the formation depends on climate variables. This contributes to unavoidable inconsistencies between the atmospheric forcing and the land fluxes when making offline simulations compared to a simulation with a fully coupled Earth system model. However, these limitations do not invalidate the simulated sensitivity of the land carbon cycle simulation to the forcing applied.
O3 damage considerably reduced simulated carbon uptake (GPP) and storage (vegetation C) in the simulation area, where the maximal impact occurs at the end of the 20th century and beginning of the 21st century, respectively. The detrimental O3 impact declines during the 21st century and reaches mean regional reductions of 0 %–1 % for GPP and 4 %–5 % for vegetation C by the end of the 21st century compared to preindustrial values. However, in hot spots, decreases in GPP of more than 8 % (East Asia) and decreases in vegetation C of more than 15 % (parts of Europe, eastern and western USA, and East Asia) are simulated at the end of the 21st century. Nitrogen deposition increases GPP less than O3 impacts decrease it for most of the simulated period. The increasing effect of nitrogen deposition on vegetation C is lower compared to the decreasing effect of O3 for the entire simulation period. Accounting for the stimulating effects of nitrogen deposition but omitting the detrimental effect of O3 can lead to an overestimation of carbon uptake and storage.
We cannot make the code publicly available because part of it was not developed by the authors and is not publicly available.
No original measurements were used.
The supplement related to this article is available online at: https://doi.org/10.5194/bg-18-3219-2021-supplement.
MF and SZ developed the experiment design. MF performed the simulations and analyses and led the writing of the paper.
The authors declare that they have no conflict of interest.
The research leading to this publication was supported by the EU Framework Programme (grant no. 282910; ECLAIRE) and the Max Planck Society for the Advancement of Science e.V. (through the ENIGMA project). This project has received funding from the European Research Council (ERC) under the European Union's Horizon 2020 Research and Innovation Programme (grant no. 647204; QUINCY).
This research has been supported by the Max-Planck-Gesellschaft (ENIGMA), the European Research Council, Horizon 2020 (grant no. 647204; QUINCY), and EU Framework Programme (grant no. 282910; ECLAIRE).
The article processing charges for this open-access publication were covered by the Max Planck Society.
This paper was edited by Alexey V. Eliseev and reviewed by three anonymous referees.
Ainsworth, E. A. and Long, S. P.: What have we learned from 15 years of free-air CO2 enrichment (FACE)? A meta-analytic review of the responses of photosynthesis, canopy properties and plant production to rising CO2, New Phytol., 165, 351–372, https://doi.org/10.1111/j.1469-8137.2004.01224.x, 2005. a
Ainsworth, E. A., Yendrek, C. R., Sitch, S., Collins, W. J., and Emberson, L. D.: The Effects of Tropospheric Ozone on Net Primary Productivity and Implications for Climate Change, Annu. Rev. Plant Biol., 63, 637–661, 2012. a
Anav, A., Menut, L., Khvorostyanov, D., and Viovy, N.: Impact of tropospheric ozone on the Euro-Mediterranean vegetation, Glob. Change Biol., 17, 2342–2359, 2011. a
Ball, J. T., Woodrow, I. E., and Berry, J. A.: A Model Predicting Stomatal Conductance and its Contribution to the Control of Photosynthesis under Different Environmental Conditions, in: Progress in Photosynthesis Research, edited by: Biggins, J., Springer, Dordrecht, https://doi.org/10.1007/978-94-017-0519-6_48, 1987. a
Barbo, D., Chappelka, A., Somers, G., Miller-Goodman, M., and Stolte, K.: Diversity of an early successional plant community as influenced by ozone, New Phytol., 138, 653–662, 1998. a
Barnes, J. and Pfirrmann, T.: The influence of CO2 andO3, singly and in combination, on gas exchange, growth and nutrient status of radish (Raphanus sativus L.), New Phytol., 121, 403–412, 1992. a, b
Broadmeadow, M. S. and Jackson, S.: Growth responses of Quercus petraea, Fraxinus excelsior and Pinus sylvestris to elevated carbon dioxide, ozone and water supply, New Phytol., 146, 437–451, 2000. a
Büker, P., Feng, Z., Uddling, J., Briolat, A., Alonso, R., Braun, S., Elvira, S., Gerosa, G., Karlsson, P., Le Thiec, D., Marzuoli, R., Mills, G., Oksanen, E., Wieser, G., Wilkinson, M., and Emberson, L.: New flux based dose-response relationships for ozone for European forest tree species, Environ. Pollut., 206, 163–174, https://doi.org/10.1016/j.envpol.2015.06.033, 2015. a, b, c
Cailleret, M., Ferretti, M., Gessler, A., Rigling, A., and Schaub, M.: Ozone effects on European forest growth – Towards an integrative approach, J. Ecol., 106, 1377–1389, 2018. a
Cionni, I., Eyring, V., Lamarque, J. F., Randel, W. J., Stevenson, D. S., Wu, F., Bodeker, G. E., Shepherd, T. G., Shindell, D. T., and Waugh, D. W.: Ozone database in support of CMIP5 simulations: results and corresponding radiative forcing, Atmos. Chem. Phys., 11, 11267–11292, https://doi.org/10.5194/acp-11-11267-2011, 2011. a
Cooper, O. R., Parrish, D., Ziemke, J., Balashov, N., Cupeiro, M., Galbally, I., Gilge, S., Horowitz, L., Jensen, N., Lamarque, J.-F., Naik, V., Oltmans, S., Schwab, J., Shindell, D., Thompson, A., Thouret, V., Wang, Y., and Zbinden, R.: Global distribution and trends of tropospheric ozone: An observation-based review, Elementa: Science of the Anthropocene, 2, 000029, https://doi.org/10.12952/journal.elementa.000029, 2014. a
Dufresne, J.-L., Foujols, M.-A., Denvil, S., Caubel, A., Marti, O., Aumont, O., Balkanski, Y., Bekki, S., Bellenger, H., Benshila, R., Bony, S., Bopp, L., Braconnot, P., Brockmann, P., Cadule, P., Cheruy, F., Codron, F., Cozic, A., Cugnet, D., de Noblet, N., Duvel, J.-P., Ethé, C., Fairhead, L., Fichefet, T., Flavoni, S., Friedlingstein, P., Grandpeix, J.-Y., Guez, L., Guilyardi, E., Hauglustaine, D., Hourdin, F., Idelkadi, A., Ghattas, J., Joussaume, S., Kageyama, M., Krinner, G., Labetoulle, S., Lahellec, A., Lefebvre, M.-P., Lefevre, F., Levy, C., Li, Z. X., Lloyd, J., Lott, F., Madec, G., Mancip, M., Marchand, M., Masson, S., Meurdesoif, Y., Mignot, J., Musat, I., Parouty, S., Polcher, J., Rio, C., Schulz, M., Swingedouw, D., Szopa, S., Talandier, C., Terray, P., Viovy, N., and Vuichard, N.: Climate change projections using the IPSL-CM5 Earth System Model: from CMIP3 to CMIP5, Clim. Dynam., 40, 2123–2165, 2013. a
Felzer, B., Kicklighter, D., Melillo, J., Wang, C., Zhuang, Q., and Prinn, R.: Effects of ozone on net primary production and carbon sequestration in the conterminous United States using a biogeochemistry model, Tellus B, 56, 230–248, 2004. a, b
Felzer, B., Reilly, J., Melillo, J., Kicklighter, D., Sarofim, M., Wang, C., Prinn, R., and Zhuang, Q.: Future Effects of Ozone on Carbon Sequestration and Climate Change Policy Using a Global Biogeochemical Model, Clim. Change, 73, 345–373, 2005. a, b, c
Feng, Z. and Kobayashi, K.: Assessing the impacts of current and future concentrations of surface ozone on crop yield with meta-analysis, Atmos. Environ., 43, 1510–1519, 2009. a
Fiscus, E., Booker, F., and Burkey, K.: Crop responses to ozone: uptake, modes of action, carbon assimilation and partitioning, Plant Cell Environ., 28, 997–1011, 2005. a
Franz, M., Simpson, D., Arneth, A., and Zaehle, S.: Development and evaluation of an ozone deposition scheme for coupling to a terrestrial biosphere model, Biogeosciences, 14, 45–71, https://doi.org/10.5194/bg-14-45-2017, 2017. a, b, c, d, e, f, g, h, i, j, k, l, m, n, o, p, q, r
Franz, M., Alonso, R., Arneth, A., Büker, P., Elvira, S., Gerosa, G., Emberson, L., Feng, Z., Le Thiec, D., Marzuoli, R., Oksanen, E., Uddling, J., Wilkinson, M., and Zaehle, S.: Evaluation of simulated ozone effects in forest ecosystems against biomass damage estimates from fumigation experiments, Biogeosciences, 15, 6941–6957, https://doi.org/10.5194/bg-15-6941-2018, 2018. a, b, c, d, e, f, g, h, i, j, k
Friend, A.: Modelling canopy CO2 fluxes: are `big-leaf' simplifications justified?, Glob. Ecol. Biogeogr., 10, 603–619, 2001. a, b
Fusco, A. and Logan, J.: Analysis of 1970–1995 trends in tropospheric ozone at Northern Hemisphere midlatitudes with the GEOS-CHEM model, J. Geophys. Res., 108, 1988–1997, 2003. a
Galloway, J. N., Dentener, F. J., Capone, D. G., Boyer, E. W., Howarth, R. W., Seitzinger, S. P., Asner, G. P., Cleveland, C. C., Green, P., Holland, E. A., Karl, D., Michaels, A., Porter, J., Townsend, A., and Vöosmarty, C.: Nitrogen Cycles: Past, Present, and Future, Biogeochemistry, 70, 153–226, 2004. a
Grantz, D., Gunn, S., and VU, H.: O3 impacts on plant development: a meta-analysis of root/shoot allocation and growth, Plant Cell Environ., 29, 1193–1209, 2006. a
Hayes, F., Jones, M., Mills, G., and Ashmore, M.: Meta-analysis of the relative sensitivity of semi-natural vegetation species to ozone, Environ. Pollut., 146, 754–762, 2007. a, b
Hempel, S., Frieler, K., Warszawski, L., Schewe, J., and Piontek, F.: A trend-preserving bias correction – the ISI-MIP approach, Earth Syst. Dynam., 4, 219–236, https://doi.org/10.5194/esd-4-219-2013, 2013. a
Hurtt, G. C., Chini, L. P., Frolking, S., Betts, R. A., Feddema, J., Fischer, G., Fisk, J. P., Hibbard, K., Houghton, R. A., Janetos, A., Jones, C. D., Kindermann, G., Kinoshita, T., Klein Goldewijk, K., Riahi, K., Shevliakova, E., Smith, S., Stehfest, E., Thomson, A., Thornton, P., van Vuuren, D. P., and Wang, Y. P.: Harmonization of land-use scenarios for the period 1500–2100: 600 years of global gridded annual land-use transitions, wood harvest, and resulting secondary lands, Clim. Change, 109, 117, https://doi.org/10.1007/s10584-011-0153-2, 2011. a
Isebrands, J., McDonald, E., Kruger, E., Hendrey, G., Percy, K., Pregitzer, K., Sober, J., and Karnosky, D.: Growth responses of Populus tremuloides clones to interacting elevated carbon dioxide and tropospheric ozone, Environ. Pollut., 115, 359–371, 2001. a, b, c
Kangasjärvi, J., Talvinen, J., Utriainen, M., and Karjalainen, R.: Plant defence systems induced by ozone, Plant Cell Environ., 17, 783–794, 1994. a
Karnosky, D. F., Zak, D. R., Pregitzer, K. S., Awmack, C. S., Bockheim, J. G., Dickson, R. E., Hendrey, G. R., Host, G. E., King, J. S., Kopper, B. J., Kruger, E. L., Kubiske, M. E., Lindroth, R. L., Mattson, W. J., Mcdonald, E. P., Noormets, A., Oksanen, E., Parsons, W. F. J., Percy, K. E., Podila, G. K., Riemenschneider, D. E., Sharma, P., Thakur, R., Sôber, A., Sôber, J., Jones, W. S., Anttonen, S., Vapaavuori, E., Mankovska, B., Heilman, W., and Isebrands, J. G.: Tropospheric O3 moderates responses of temperate hardwood forests to elevated CO2: a synthesis of molecular to ecosystem results from the Aspen FACE project, Funct. Ecol., 17, 289–304, 2003. a, b, c, d, e, f
King, J., Kubiske, M., Pregitzer, K., Hendrey, G., McDonald, E., Giardina, C., Quinn, V., and Karnosky, D.: TroposphericO3 compromises net primary production in young stands of trembling aspen, paper birch and sugar maple in response to elevated atmospheric CO2, New Phytol., 168, 623–636, 2005. a
Klingberg, J., Engardt, M., Karlsson, P. E., Langner, J., and Pleijel, H.: Declining ozone exposure of European vegetation under climate change and reduced precursor emissions, Biogeosciences, 11, 5269–5283, https://doi.org/10.5194/bg-11-5269-2014, 2014. a, b, c
Kozovits, A. R., Matyssek, R., Blaschke, H., Göttlein, A., and Grams, T. E.: Competition increasingly dominates the responsiveness of juvenile beech and spruce to elevated CO2 and/or O3 concentrations throughout two subsequent growing seasons, Glob. Change Biol., 11, 1387–1401, 2005. a
Krinner, G., Viovy, N., de Noblet-Ducoudré, N., Ogée, J., Polcher, J., Friedlingstein, P., Ciais, P., Sitch, S., and Prentice, I.: A dynamic global vegetation model for studies of the coupled atmosphere-biosphere system, Global Biogeochem. Cy., 19, GB1015, https://doi.org/10.1029/2003GB002199, 2005. a, b, c
Kronfuß, G., Polle, A., Tausz, M., Havranek, W., and Wieser, G.: Effects of ozone and mild drought stress on gas exchange, antioxidants and chloroplast pigments in current-year needles of young Norway spruce [Picea abies (L.) Karst.], Trees-Structure and Function, 12, 482–489, 1998. a
Kubiske, M., Quinn, V., Marquardt, P., and Karnosky, D.: Effects of Elevated Atmospheric CO2 and/or O3 on Intra-and Interspecific Competitive Ability of Aspen, Plant Biol., 9, 342–355, 2007. a
Kull, O. and Kruijt, B.: Leaf photosynthetic light response: a mechanistic model for scaling photosynthesis to leaves and canopies, Funct. Ecol., 12, 767–777, 1998. a
Laisk, A., Kull, O., and Moldau, H.: Ozone Concentration in Leaf Intercellular Air Spaces is Close to Zero, Plant Physiol., 90, 1163–1167, 1989. a
Lamarque, J.-F., Bond, T. C., Eyring, V., Granier, C., Heil, A., Klimont, Z., Lee, D., Liousse, C., Mieville, A., Owen, B., Schultz, M. G., Shindell, D., Smith, S. J., Stehfest, E., Van Aardenne, J., Cooper, O. R., Kainuma, M., Mahowald, N., McConnell, J. R., Naik, V., Riahi, K., and van Vuuren, D. P.: Historical (1850–2000) gridded anthropogenic and biomass burning emissions of reactive gases and aerosols: methodology and application, Atmos. Chem. Phys., 10, 7017–7039, https://doi.org/10.5194/acp-10-7017-2010, 2010. a
Lamarque, J.-F., Dentener, F., McConnell, J., Ro, C.-U., Shaw, M., Vet, R., Bergmann, D., Cameron-Smith, P., Dalsoren, S., Doherty, R., Faluvegi, G., Ghan, S. J., Josse, B., Lee, Y. H., MacKenzie, I. A., Plummer, D., Shindell, D. T., Skeie, R. B., Stevenson, D. S., Strode, S., Zeng, G., Curran, M., Dahl-Jensen, D., Das, S., Fritzsche, D., and Nolan, M.: Multi-model mean nitrogen and sulfur deposition from the Atmospheric Chemistry and Climate Model Intercomparison Project (ACCMIP): evaluation of historical and projected future changes, Atmos. Chem. Phys., 13, 7997–8018, https://doi.org/10.5194/acp-13-7997-2013, 2013. a
Langebartels, C., Kerner, K., Leonardi, S., Schraudner, M., Trost, M., Heller, W., and Sandermann Jr., H.: Biochemical Plant Responses to Ozone: I. Differential Induction of Polyamine and Ethylene Biosynthesis in Tobacco, Plant Physiol., 95, 882–889, https://doi.org/10.1104/pp.95.3.882, 1991. a
LeBauer, D. and Treseder, K.: Nitrogen limitation of net primary productivity in terrestrial ecosystems is globally distributed, Ecology, 89, 371–379, 2008. a
Leisner, C. and Ainsworth, E.: Quantifying the effects of ozone on plant reproductive growth and development, Glob. Change Biol., 18, 606–616, 2012. a
Li, P., Feng, Z., Catalayud, V., Yuan, X., Xu, Y., and Paoletti, E.: A meta-analysis on growth, physiological and biochemical responses of woody species to ground-level ozone highlights the role of plant functional types, Plant Cell Environ., 40, 2369–2380, 2017. a, b, c, d
Lombardozzi, D., Levis, S., Bonan, G., and Sparks, J. P.: Predicting photosynthesis and transpiration responses to ozone: decoupling modeled photosynthesis and stomatal conductance, Biogeosciences, 9, 3113–3130, https://doi.org/10.5194/bg-9-3113-2012, 2012. a
Lombardozzi, D., Sparks, J. P., and Bonan, G.: Integrating O3 influences on terrestrial processes: photosynthetic and stomatal response data available for regional and global modeling, Biogeosciences, 10, 6815–6831, https://doi.org/10.5194/bg-10-6815-2013, 2013. a, b, c
Lombardozzi, D., Levis, S., Bonan, G., Hess, P., and Sparks, J.: The Influence of Chronic Ozone Exposure on Global Carbon and Water Cycles, J. Climate, 28, 292–305, 2015. a, b, c, d, e, f, g
LRTAP-Convention: Manual on Methodologies and Criteria for Modelling and Mapping Critical Loads and Levels; and Air Pollution Effects, Risks and Trends, available at: https://icpvegetation.ceh.ac.uk/publications/documents/FinalnewChapter3v4Oct2017_000.pdf (last access: 13 May 2021), 2017. a
Massman, W.: A review of the molecular diffusivities of H2O, CO2, CH4, CO, O3, SO2, NH3, N2O, NO, and NO2 in air, O2 and N2 near STP, Atmos. Environ., 32, 1111–1127, https://doi.org/10.1016/S1352-2310(97)00391-9, 1998. a
McAinsh, M., Evans, N., Montgomery, L., and North, K.: Calcium signalling in stomatal responses to pollutants, New Phytol., 153, 441–447, 2002. a
Medlyn, B., Barton, C., Broadmeadow, M., Ceulemans, R., De Angelis, P., Forstreuter, M., Freeman, M., Jackson, S., Kellomäki, S., Laitat, E., et al.: Stomatal conductance of forest species after long-term exposure to elevated CO2 concentration: A synthesis, New Phytol., 149, 247–264, 2001. a
Meinshausen, M., Smith, S. J., Calvin, K., Daniel, J. S., Kainuma, M., Lamarque, J.-F., Matsumoto, K., Montzka, S., Raper, S., Riahi, K., Thomson, A., Velders, G. J. M., and van Vuuren, D. P.: The RCP greenhouse gas concentrations and their extensions from 1765 to 2300, Clim. Change, 109, 213, https://doi.org/10.1007/s10584-011-0156-z, 2011. a
Meleux, F., Solmon, F., and Giorgi, F.: Increase in summer European ozone amounts due to climate change, Atmos. Environ., 41, 7577–7587, 2007. a
Meyerholt, J. and Zaehle, S.: The role of stoichiometric flexibility in modelling forest ecosystem responses to nitrogen fertilization, New Phytol., 208, 1042–1055, https://doi.org/10.1111/nph.13547, 2015. a
Moss, R. H., Edmonds, J. A., Hibbard, K. A., Manning, M. R., Rose, S. K., Van Vuuren, D. P., Carter, T. R., Emori, S., Kainuma, M., Kram, T., Meehl, G. A., Mitchell, J. F. B., Nakicenovic, N., Riahi, K., Smith, S. J., Stouffer, R. J., Thomson, A. M., Weyant, J. P., and Wilbanks, T. J.: The next generation of scenarios for climate change research and assessment, Nature, 463, 747–756, https://doi.org/10.1038/nature08823, 2010. a, b, c
Niinemets, Ü., Keenan, T. F., and Hallik, L.: A worldwide analysis of within-canopy variations in leaf structural, chemical and physiological traits across plant functional types, New Phytol., 205, 973–993, 2015. a
Noormets, A., Sober, A., Pell, E., Dickson, R., Podila, G., Sober, J., Isebrands, J., and Karnosky, D.: Stomatal and non-stomatal limitation to photosynthesis in two trembling aspen (Populus tremuloides Michx.) clones exposed to elevated CO2 and/or O3, Plant Cell Environ., 24, 327–336, 2001. a
Noormets, A., Kull, O., Sôber, A., Kubiske, M., and Karnosky, D.: Elevated CO2 response of photosynthesis depends on ozone concentration in aspen, Environ. Pollut., 158, 992–999, 2010. a, b, c
Norby, R.: Nitrogen deposition: a component of global change analyses, New Phytol., 139, 189–200, 1998. a
Norby, R., Warren, J., Iversen, C., Garten, C., Medlyn, B., and McMurtrie, R.: CO2 Enhancement of Forest Productivity Constrained by Limited Nitrogen Availability, Nature Precedings, 107, 19368–19373, https://doi.org/10.1038/npre.2009.3747.1, 2009. a
Oliver, R. J., Mercado, L. M., Sitch, S., Simpson, D., Medlyn, B. E., Lin, Y.-S., and Folberth, G. A.: Large but decreasing effect of ozone on the European carbon sink, Biogeosciences, 15, 4245–4269, https://doi.org/10.5194/bg-15-4245-2018, 2018. a, b, c, d, e, f, g, h, i, j, k, l, m, n, o
Oren, R., Ellsworth, D. S., Johnsen, K. H., Phillips, N., Ewers, B. E., Maier, C., Schäfer, K. V., McCarthy, H., Hendrey, G., McNulty, S. G., and Katul, G. G.: Soil fertility limits carbon sequestration by forest ecosystems in a CO2-enriched atmosphere, Nature, 411, 469–472, https://doi.org/10.1038/35078064, 2001. a
Paoletti, E. and Grulke, N.: Does living in elevated CO2 ameliorate tree response to ozone? A review on stomatal responses, Environ. Pollut., 137, 483–493, 2005. a, b
Le Quéré, C., Andrew, R. M., Friedlingstein, P., Sitch, S., Hauck, J., Pongratz, J., Pickers, P. A., Korsbakken, J. I., Peters, G. P., Canadell, J. G., Arneth, A., Arora, V. K., Barbero, L., Bastos, A., Bopp, L., Chevallier, F., Chini, L. P., Ciais, P., Doney, S. C., Gkritzalis, T., Goll, D. S., Harris, I., Haverd, V., Hoffman, F. M., Hoppema, M., Houghton, R. A., Hurtt, G., Ilyina, T., Jain, A. K., Johannessen, T., Jones, C. D., Kato, E., Keeling, R. F., Goldewijk, K. K., Landschützer, P., Lefèvre, N., Lienert, S., Liu, Z., Lombardozzi, D., Metzl, N., Munro, D. R., Nabel, J. E. M. S., Nakaoka, S., Neill, C., Olsen, A., Ono, T., Patra, P., Peregon, A., Peters, W., Peylin, P., Pfeil, B., Pierrot, D., Poulter, B., Rehder, G., Resplandy, L., Robertson, E., Rocher, M., Rödenbeck, C., Schuster, U., Schwinger, J., Séférian, R., Skjelvan, I., Steinhoff, T., Sutton, A., Tans, P. P., Tian, H., Tilbrook, B., Tubiello, F. N., van der Laan-Luijkx, I. T., van der Werf, G. R., Viovy, N., Walker, A. P., Wiltshire, A. J., Wright, R., Zaehle, S., and Zheng, B.: Global Carbon Budget 2018, Earth Syst. Sci. Data, 10, 2141–2194, https://doi.org/10.5194/essd-10-2141-2018, 2018. a, b
Ren, W., Tian, H., Liu, M., Zhang, C., Chen, G., Pan, S., Felzer, B., and Xu, X.: Effects of tropospheric ozone pollution on net primary productivity and carbon storage in terrestrial ecosystems of China, J. Geophys. Res., 112, D22S09, https://doi.org/10.1029/2007JD008521, 2007. a
Ren, W., Tian, H., Tao, B., Chappelka, A., Sun, G., Lu, C., Liu, M., Chen, G., and Xu, X.: Impacts of tropospheric ozone and climate change on net primary productivity and net carbon exchange of China's forest ecosystems, Glob. Ecol. Biogeogr., 20, 391–406, 2011. a
Riikonen, J., Lindsberg, M.-M., Holopainen, T., Oksanen, E., Lappi, J., Peltonen, P., and Vapaavuori, E.: Silver birch and climate change: variable growth and carbon allocation responses to elevated concentrations of carbon dioxide and ozone, Tree Physiol., 24, 1227–1237, 2004. a
Sanz, M., Calatayud, V., and Sánchez-Peña, G.: Measures of ozone concentrations using passive sampling in forests of South Western Europe, Environ. Pollut., 145, 620–628, 2007. a
Schaub, M., Skelly, J., Zhang, J., Ferdinand, J., Savage, J., Stevenson, R., Davis, D., and Steiner, K.: Physiological and foliar symptom response in the crowns of Prunus serotina, Fraxinus americana and Acer rubrum canopy trees to ambient ozone under forest conditions, Environ. Pollut., 133, 553–567, 2005. a
Schulte-Uebbing, L. and de Vries, W.: Global-scale impacts of nitrogen deposition on tree carbon sequestration in tropical, temperate, and boreal forests: A meta-analysis, Glob. Change Biol., 24, e416–e431, https://doi.org/10.1111/gcb.13862, 2018. a
Sicard, P., Anav, A., De Marco, A., and Paoletti, E.: Projected global ground-level ozone impacts on vegetation under different emission and climate scenarios, Atmos. Chem. Phys., 17, 12177–12196, https://doi.org/10.5194/acp-17-12177-2017, 2017. a, b
Sitch, S., Cox, P., Collins, W., and Huntingford, C.: Indirect radiative forcing of climate change through ozone effects on the land-carbon sink, Nature, 448, 791–794, 2007. a, b, c, d, e, f, g, h, i, j, k, l, m, n
Talhelm, A. F., Pregitzer, K. S., Kubiske, M. E., Zak, D. R., Campany, C. E., Burton, A. J., Dickson, R. E., Hendrey, G. R., Isebrands, J. G., Lewin, K. F., Nagy, J., and Karnosky, D. F.: Elevated carbon dioxide and ozone alter productivity and ecosystem carbon content in northern temperate forests, Glob. Change Biol., 20, 2492–2504, https://doi.org/10.1111/gcb.12564, 2014. a, b
Tausz, M., Grulke, N., and Wieser, G.: Defense and avoidance of ozone under global change, Environ. Pollut., 147, 525–531, 2007. a, b
Thomas, R. Q., Canham, C. D., Weathers, K. C., and Goodale, C. L.: Increased tree carbon storage in response to nitrogen deposition in the US, Nature Geosci., 3, 13–17, 2010. a, b
Tjoelker, M., Volin, J., Oleksyn, J., and Reich, P.: Interaction of ozone pollution and light effects on photosynthesis in a forest canopy experiment, Plant Cell Environ., 18, 895–905, 1995. a
Turnock, S. T., Allen, R. J., Andrews, M., Bauer, S. E., Deushi, M., Emmons, L., Good, P., Horowitz, L., John, J. G., Michou, M., Nabat, P., Naik, V., Neubauer, D., O'Connor, F. M., Olivié, D., Oshima, N., Schulz, M., Sellar, A., Shim, S., Takemura, T., Tilmes, S., Tsigaridis, K., Wu, T., and Zhang, J.: Historical and future changes in air pollutants from CMIP6 models, Atmos. Chem. Phys., 20, 14547–14579, https://doi.org/10.5194/acp-20-14547-2020, 2020. a
Uddling, J., Hogg, A., Teclaw, R., Carroll, M., and Ellsworth, D.: Stomatal uptake ofO3 in aspen and aspen-birch forests under free-air CO2 and O3 enrichment, Environ. Pollut., 158, 2023–2031, 2010. a, b
van Vuuren, D. P., Edmonds, J., Kainuma, M., Riahi, K., Thomson, A., Hibbard, K., Hurtt, G. C., Kram, T., Krey, V., Lamarque, J.-F., Masui, T., Meinshausen, M., Nakicenovic, N., Smith, S. J., and Rose, S. K.: The representative concentration pathways: an overview, Clim. Change, 109, 5, https://doi.org/10.1007/s10584-011-0148-z, 2011. a, b, c, d
Vitousek, P. M. and Howarth, R. W.: Nitrogen limitation on land and in the sea: how can it occur?, Biogeochemistry, 13, 87–115, 1991. a
Wang, B., Shugart, H. H., Shuman, J. K., and Lerdau, M. T.: Forests and ozone: productivity, carbon storage, and feedbacks, Sci. Rep., 6, 22133, https://doi.org/10.1038/srep22133, 2016. a
Wang, R., Goll, D., Balkanski, Y., Hauglustaine, D., Boucher, O., Ciais, P., Janssens, I., Penuelas, J., Guenet, B., Sardans, J., Bopp, L., Vuichard, N., Zhou, F., Li, B., Piao, S., Peng, S., Huang, Y., and Tao, S.: Global forest carbon uptake due to nitrogen and phosphorus deposition from 1850 to 2100, Glob. Change Biol., 23, 4854–4872, https://doi.org/10.1111/gcb.13766, 2017. a
Wild, O., Fiore, A. M., Shindell, D. T., Doherty, R. M., Collins, W. J., Dentener, F. J., Schultz, M. G., Gong, S., MacKenzie, I. A., Zeng, G., Hess, P., Duncan, B. N., Bergmann, D. J., Szopa, S., Jonson, J. E., Keating, T. J., and Zuber, A.: Modelling future changes in surface ozone: a parameterized approach, Atmos. Chem. Phys., 12, 2037–2054, https://doi.org/10.5194/acp-12-2037-2012, 2012. a, b, c
Wittig, V., Ainsworth, E., and Long, S.: To what extent do current and projected increases in surface ozone affect photosynthesis and stomatal conductance of trees? A meta-analytic review of the last 3 decades of experiments, Plant Cell Environ., 30, 1150–1162, 2007. a, b
Wittig, V., Ainsworth, E., Naidu, S., Karnosky, D., and Long, S.: Quantifying the impact of current and future tropospheric ozone on tree biomass, growth, physiology and biochemistry: a quantitative meta-analysis, Glob. Change Biol., 15, 396–424, 2009. a, b, c, d, e, f
Wohlgemuth, H., Mittelstrass, K., Kschieschan, S., Bender, J., Weigel, H., Overmyer, K., Kangasjärvi, J., Sandermann, H., and Langebartels, C.: Activation of an oxidative burst is a general feature of sensitive plants exposed to the air pollutant ozone, Plant Cell Environ., 25, 717–726, 2002. a
Wustman, B., Oksanen, E., Karnosky, D., Noormets, A., Isebrands, J., Pregitzer, K., Hendrey, G., Sober, J., and Podila, G.: Effects of elevated CO2 and O3 on aspen clones varying in O3 sensitivity: can CO2 ameliorate the harmful effects of O3?, Environ. Pollut., 115, 473–481, 2001. a, b, c
Yue, X. and Unger, N.: Ozone vegetation damage effects on gross primary productivity in the United States, Atmos. Chem. Phys., 14, 9137–9153, https://doi.org/10.5194/acp-14-9137-2014, 2014. a, b
Zaehle, S.: Terrestrial nitrogen–carbon cycle interactions at the global scale, Philos. T. Roy. Soc. B, 368, 20130125, https://doi.org/10.1098/rstb.2013.0125, 2013. a
Zaehle, S. and Friend, A.: Carbon and nitrogen cycle dynamics in the O-CN land surface model: 1. Model description, site-scale evaluation, and sensitivity to parameter estimates, Global Biogeochem. Cy., 24, GB1005, https://doi.org/10.1029/2009GB003521, 2010. a, b, c, d, e, f
Zaehle, S., Friend, A., Friedlingstein, P., Dentener, F., Peylin, P., and Schulz, M.: Carbon and nitrogen cycle dynamics in the O-CN land surface model: 2. Role of the nitrogen cycle in the historical terrestrial carbon balance, Global Biogeochem. Cy., 24, GB1006, https://doi.org/10.1029/2009GB003522, 2010. a
Zaehle, S., Ciais, P., Friend, A. D., and Prieur, V.: Carbon benefits of anthropogenic reactive nitrogen offset by nitrous oxide emissions, Nat. Geosci., 4, 601–605, 2011. a, b, c
Zaehle, S., Medlyn, B. E., De Kauwe, M. G., Walker, A. P., Dietze, M. C., Hickler, T., Luo, Y., Wang, Y.-P., El-Masri, B., Thornton, P., Jain, A., Wang, S., Warlind, D., Weng, E., Parton, W., Iversen, C. M., Gallet-Budynek, A., McCarthy, H., Finzi, A., Hanson, P. J., Prentice, I. C., Oren, R., and Norby, R. J.: Evaluation of 11 terrestrial carbon–nitrogen cycle models against observations from two temperate Free-Air CO2 Enrichment studies, New Phytol., 202, 803–822, https://doi.org/10.1111/nph.12697, 2014. a
Zak, D. R., Pregitzer, K. S., Kubiske, M. E., and Burton, A. J.: Forest productivity under elevated CO2 and O3: positive feedbacks to soil N cycling sustain decade-long net primary productivity enhancement by CO2, Ecol. Lett., 14, 1220–1226, 2011. a, b, c, d