the Creative Commons Attribution 4.0 License.
the Creative Commons Attribution 4.0 License.
 | 18 Jun 2021
Committed and projected future changes in global peatlands – continued transient model simulations since the Last Glacial Maximum
Jurek Müller
Fortunat Joos
Peatlands are diverse wetland ecosystems distributed mostly over the northern latitudes and tropics. Globally they store a large portion of the global soil organic carbon and provide important ecosystem services. The future of these systems under continued anthropogenic warming and direct human disturbance has potentially large impacts on atmospheric CO2 and climate.
We performed global long-term projections of peatland area and carbon over the next 5000 years using a dynamic global vegetation model forced with climate anomalies from 10 models of the Coupled Model Intercomparison Project (CMIP6) and three standard future scenarios. These projections are seamlessly continued from a transient simulation from the Last Glacial Maximum to the present to account for the full transient history and are continued beyond 2100 with constant boundary conditions.
Our results suggest short to long-term net losses of global peatland area and carbon, with higher losses under higher-emission scenarios. Large parts of today's active northern peatlands are at risk, whereas peatlands in the tropics and, in case of mitigation, eastern Asia and western North America can increase their area and carbon stocks.
Factorial simulations reveal committed historical changes and future rising temperature as the main driver of future peatland loss and increasing precipitations as the driver for regional peatland expansion.
Additional simulations forced with climate anomalies from a subset of climate models which follow the extended CMIP6 scenarios, transient until 2300, show qualitatively similar results to the standard scenarios but highlight the importance of extended transient future scenarios for long-term carbon cycle projections.
The spread between simulations forced with different climate model anomalies suggests a large uncertainty in projected peatland changes due to uncertain climate forcing.
Our study highlights the importance of quantifying the future peatland feedback to the climate system and its inclusion into future earth system model projections.
- Article
(9505 KB) - Full-text XML
-
Supplement
(1259 KB) - BibTeX
- EndNote


Peatlands are a wetland type that is characterized by thick layers of accumulated organic matter facilitated by permanently waterlogged conditions (Moore, 1989; Blodau, 2002). Suitable conditions can vary globally and can depend on local hydrology, topography, climate, and vegetation (Gorham, 1957), resulting in multiple forms from minerotrophic fens to ombrotrophic bogs and forested tropical peat swamps (Rydin and Jeglum, 2013; Page and Baird, 2016; Lindsay, 2018). Although peatlands cover only 3 % of the global land area (Xu et al., 2018b), they have an integral role in the global carbon cycle (Gorham, 1991; Yu, 2011; Page et al., 2011). They function as long-term carbon stores holding up to a third of the total global soil organic carbon (Page et al., 2011; Yu, 2012). Most of today's peatlands formed and accumulated carbon over the last 12 000 years, driven by deglacial climate change and ice sheet retreat (e.g., Halsey et al., 2000; Gajewski et al., 2001; MacDonald et al., 2006; Gorham et al., 2007; Yu et al., 2010; Ruppel et al., 2013; Morris et al., 2018; Treat et al., 2019; Müller and Joos, 2020). Peatlands often are at the same time long-term sinks of carbon (e.g., Gorham et al., 2012; Lähteenoja et al., 2012; Leifeld et al., 2019) as well as large natural sources of methane (e.g., Frolking and Roulet, 2007; LAI, 2009; Korhola et al., 2010; Yu et al., 2013; Packalen et al., 2014; Dommain et al., 2018). The net radiative effect over the Holocene has been a cooling (Frolking and Roulet, 2007).
Apart from their function as long-term carbon stores, and net carbon sinks, peatlands provide many more important ecosystem services (Kimmel and Mander, 2010; Page and Baird, 2016). Peatlands act as hydrological buffers providing purified drinking water (Xu et al., 2018a). As unique ecosystems, peatlands are a habitat to many rare and specialized species and thus preserve global biodiversity (Minayeva and Sirin, 2012). Culturally they can serve recreational and spiritual functions. For environmental researchers, they provide a unique archive for environmental and cultural change over millennia (de Jong et al., 2010).
Direct and indirect anthropogenic disturbances, however, have exerted increasing pressures on global peatlands, threatening their important ecosystem services and potentially putting large carbon stocks at risk (Posa et al., 2011; Goldstein et al., 2020). Direct disturbances include peatland drainage for land-use conversion and peat mining, which has led to large carbon losses in temperate and tropical regions (Hergoualc'h and Verchot, 2011; Dohong et al., 2017; Leifeld et al., 2019; Dommain et al., 2018; Hoyt et al., 2020). Low water tables after drainage also facilitate increased peat burning (Turetsky et al., 2015; Page and Hooijer, 2016). Drainage of agricultural areas can also affect neighboring unmanaged peatlands (Beauregard et al., 2020). Degradation following past land-use conversion will continue to release large amounts of carbon over decades to come (Leifeld and Menichetti, 2018). Given prompt action, this committed and additional carbon loss could be partly mitigated with large-scale restoration and re-wetting efforts (Warren et al., 2017; Nugent et al., 2019; Günther et al., 2020) in conjunction with strong protection policies (Humpenöder et al., 2020; Wibisana and Setyorini, 2021).
Indirect human disturbances are mediated through anthropogenic climate change which is rapidly changing the boundary conditions for global peatlands. Mean annual precipitation is projected to increase in regions of large peatland extent such as the northern high latitudes and Southeast Asia (Collins et al., 2013), possibly improving conditions for peatland development and carbon accumulation. However, increases in precipitation are often offset by increased evapotranspiration under a warmer climate. Temperatures are projected to disproportionately increase in the northern high latitudes (Collins et al., 2013), where the largest portion of global peatlands reside (Xu et al., 2018b). Industrial warming has already led to increases in peatland evapotranspiration (Helbig et al., 2020b), leading to a widespread drying trend in the peatlands of northern Europe (Swindles et al., 2019; Zhang et al., 2020) and eastern Canada peatlands (Pellerin and Lavoie, 2003). The water table is an important regulator in peatland ecosystems with complex feedbacks to vegetation and carbon cycling (Sawada et al., 2003; Zhong et al., 2020). A water table drawdown leads to increased fire frequency (Turetsky et al., 2015) and a shift in vegetation cover from moss-dominated to shrub- and tree-dominated (Pellerin and Lavoie, 2003; Talbot et al., 2010; Pinceloup et al., 2020; Beauregard et al., 2020). Lower water tables also lead to the exposure of progressively deeper peat layers to oxic conditions, increasing decomposition (Ise et al., 2008; Zhong et al., 2020). Higher temperatures also generally lead to higher decomposition rates with increases in both measured CO2 (Hopple et al., 2020; Kluber et al., 2020) and methane emissions (Turetsky et al., 2014). Although some studies suggest deep peat carbon to be robust under future warming (Wilson et al., 2016). In the northern high latitudes, this might be offset by increases in plant productivity, even leading to net increases in carbon accumulation (Charman et al., 2013; Gallego-Sala et al., 2018).
About 46 % of northern peatlands are underlain by permafrost (Hugelius et al., 2020), which in some regions is quickly thawing as a response to global warming (Camill, 2005; Lara et al., 2016; Mamet et al., 2017). Permafrost thaw is projected to accelerate dramatically depending on the future scenario (Lawrence et al., 2012; Guo and Wang, 2016). Permafrost peatlands have been found to often collapse after thaw and form thermokarst landscapes and collapse-scar wetlands (Payette et al., 2004; Olefeldt et al., 2016; Magnússon et al., 2020) characterized by carbon loss and high methane emissions (Jiang et al., 2020; Voigt et al., 2019; Turetsky et al., 2020; Estop‐Aragonés et al., 2020). Given sustained inundation, renewed and invigorated accumulation is assumed to set in after collapse, leading to an eventual return to a net cooling effect after decades to millennia of net warming (Swindles et al., 2015; Jones et al., 2017; Magnússon et al., 2020). However, some peatlands show an increase in carbon accumulation already directly after thaw (Estop-Aragonés et al., 2018).
Investigating the potential future trajectories of global peatlands is of great importance, given the multiple pressures on peatlands as unique ecosystems and carbon stores, which will further increase with future climate and land-use change. Although the potential feedbacks between peatlands, the carbon cycle, and the climate system could be immense, peatlands are in general still not included in state-of-the-art earth system models (ESMs) (Loisel and Bunsen, 2020), with only a few exceptions (Schuldt et al., 2013). A large part of the global carbon cycle is thus also missing in the future climate and carbon cycle projections used for the determination of international climate mitigation targets, such as the sixth phase of the Coupled Model Intercomparison Project (CMIP6) (Eyring et al., 2016). Different approaches have been used to independently project different aspects of future peatland dynamics under future scenarios. Paleo-data-driven approaches can be used to investigate future peatland carbon accumulation rates (Gallego-Sala et al., 2018). Bioclimatic envelope models enable estimates of regional peatland area changes in blanket bogs in the United Kingdom (Gallego-Sala et al., 2016; Ferretto et al., 2019) and China (Cong et al., 2020). Process-based models provide another way to project potential futures of complex systems under changing boundary conditions. Peatland projections, however, have mostly focused on peatland area (Alexandrov et al., 2016) and peatland carbon dynamics (Spahni et al., 2013; Warren et al., 2017; Wang et al., 2018; Chaudhary et al., 2017; Voigt et al., 2019; Swinnen et al., 2019; Chaudhary et al., 2020) independently. A still limited but increasing number of dynamic global vegetation models (DGVMs) with dynamically determined peatland area (Kleinen et al., 2012; Stocker et al., 2014b; Largeron et al., 2018; Qiu et al., 2018) enables, for the first time, the projection of peatland area and carbon dynamics on a large spatial scale (Qiu et al., 2020). The focus, however, is still often put on northern boreal peatlands alone (Chaudhary et al., 2020; Qiu et al., 2020).
The dynamic simulation of peatlands is complicated by the non-trivial model spinup. Peatland initiation, expansion, and peat carbon accumulation and loss occurred at different times in different regions during the glacial termination and the Holocene as climate and environmental conditions changed. However, peat models are typically spun up uniformly for all regions, over a constant period, and by applying constant preindustrial climate and environmental (e.g., CO2, total land area, and land-use area) conditions. This common spinup approach does not fully account for the transient and gradual evolution of peatlands, driven and constrained by transient climate evolution, ice sheet retreat, and sea-level rise (Loisel et al., 2017). In a system with long timescales such as peatlands, the system's history might be a strong determinant of future changes.
Here we present the first combined projection of global peatland area and carbon dynamics. A previously published transient simulation from the Last Glacial Maximum (LGM, 22 000 years before present) to the present (Müller and Joos, 2020) is used to base the projections on a fully transient spinup. This allows not only the consideration of all legacy effects of the transient peatland development but also the consideration of former peatlands in the carbon balance calculation. Committed and future peatland responses to three different standard future emission and land-use scenarios are investigated using the DGVM LPX-Bern. Simulations are continued with constant forcing beyond 2100 to reveal delayed long-term effects on peatlands over the next 5000 years. Standard simulations are compared to additional simulations with extended transient scenario forcing until 2300 and constant forcing thereafter. Uncertainties and drivers are analyzed using multiple climate model forcings and factorial simulations.
2.1 Model description
All simulations were performed with the Land surface Processes and eXchanges (LPX-Bern) dynamic global vegetation model (DGVM) version 1.4 (Lienert and Joos, 2018). The model setup is mostly identical to Müller and Joos (2020), which is briefly described below. LPX-Bern includes an interactive carbon, water, and nitrogen cycle and simulates dynamic vegetation composition with plant functional types (PFTs), which compete for water, light, and nutrients (Sitch et al., 2003; Xu-Ri et al., 2012; Spahni et al., 2013). The implementation of permafrost and peatlands as long-term carbon stores is based on the LPJ-WHyMe model (Wania et al., 2009a, b) with the addition of dynamic peatland area (Stocker et al., 2014b).
Peatland vegetation is represented by five peat plant functional types (PFTs): Sphagnum and flood-tolerant graminoids as indicative mostly for high-latitude peatlands, and flood-tolerant tropical evergreen, deciduous tree PFTs, and a flood-tolerant C4 type grass as indicative mostly for tropical peatlands (Stocker et al., 2014b). Carbon cycling in peat soils is based on the distinction between a lower, fully water saturated slow overturning pool (catotelm; from 0.3 to 2 m of the soil column) and an upper, fast-overturning pool (acrotelm; upper 0.3 m of the soil column) with fluctuating water table position (WTP) (Spahni et al., 2013). Decay rates are modulated by temperature in the catotelm and by temperature and WTP in the acrotelm (Wania et al., 2009a). The size and sign of the carbon flux between acrotelm and catotelm are determined by the acrotelm carbon balance. Methane emissions from peatlands are simulated but not part of the analysis in this study.
The area fraction covered by peat in a given grid cell is determined dynamically with the DYPTOP module (Dynamical Peatland Model Based on TOPMODEL) (Stocker et al., 2014b). The TOPMODEL approach (Beven and Kirkby, 1979) is used to predict the monthly inundated area fraction given sub-grid-scale topographic information and mean grid cell WTP, averaged over all land classes. The area potentially available for peatlands is then determined by inundation persistency. Peatlands expand or shrink towards a changing potential extent with a rate of 1 % of their current grid cell fraction per year. The grid cell fraction lost during peatland retreat is treated as a separate land class for former peatlands. It inherits the carbon stocks of the shrinking peatland and is subsequently treated in the same way as the mineral soils regarding vegetation, hydrology, and carbon cycling. Growing active peatlands first expand on former peatlands inheriting the remaining carbon there. This treatment prevents carbon dissolution into mineral soils due to fluctuations in peatland area.
Different to Müller and Joos (2020) we also consider changing land-use area in our simulations. Land-use area in the model is represented by three specific land classes: pasture, cropland, and urban (Lienert and Joos, 2018). Pastures and croplands have specific vegetation represented by two herbaceous PFTs each. Changes in land-use area are treated as net changes, where all growing land classes proportionally inherit the carbon, water, and nutrients of all shrinking land classes. A more complex implementation, which considers gross changes, exists but is not compatible with the peatland module used here (Stocker et al., 2014a). In the absence of gross change information, three assumptions were made. (1) Changes within the three land-use classes that do not affect the total land-use area are assumed as shifts between land-use types (e.g., shift from pasture to cropland). (2) Increases in total land-use area reduce all other land classes proportionally, including peatlands. (3) Peatland area that is converted to land-use area cannot be reclaimed by expanding peatlands at a later stage. These assumptions are simplifications that fail especially in areas where peatlands are preferentially targeted for land-use conversion, such as in Indonesia (Dommain et al., 2018; Hoyt et al., 2020), or are subject to restoration efforts after conversion (e.g., Haapalehto et al., 2011; Young et al., 2017). However, given the technical restrictions and the lack of detailed worldwide information about gross land-use changes on peatlands, we think this simplified approach is the most robust.
The above-described representation of peatlands in the LPX is a simplification in many respects. The absence of local processes and information such as lateral water flow, local soil features, or influence of animals by grazing and river damming can limit the ability of the TOPMODEL approach to predict peatlands on a regional to local scale. Further, direct human-caused influences such as land use, drainage, or peat mining are only considered in a strongly simplified way. The lack of a distinction and transition between different peatland types like fens, bogs, blanket bogs, or marshes neglects possible differences in the constraints on their formation and evolution. The treatment of acrotelm and catotelm as single carbon pools, and the absence of strong disturbances such as peat fires, constitute limits on the comparability of the model results to peat core carbon profiles. This simplified representation, nevertheless, has been shown to reproduce peatland area and carbon accumulation well within the observational constraints (Wania et al., 2009a; Spahni et al., 2013; Stocker et al., 2014b, 2017; Müller and Joos, 2020) while using a minimal set of free parameters.
2.2 Calculation of peat carbon
Peat carbon can be present not only in soils of active but also in the soils of former peatlands. Peat may be preserved during peatland conversion and form distinct organic soil layers on non-peatland areas (Lähteenoja et al., 2012; Broothaerts et al., 2014; Xu et al., 2016; Campos et al., 2016; Treat et al., 2019). In the model, subsequent land classes inherit the soil carbon from former peatlands, including peatlands converted to land-use areas. Yet, this peat carbon is mixed within the model's soil pools and cannot be directly distinguished from carbon transferred to soils from more recently established vegetation. It is, however, possible to track peat carbon that at one point was sequestered in the catotelm of active peatlands through the soil pools of other land classes using post processing. For this, transient model output for peatland area changes, the decay rates of slow overturning pools, and the carbon input into the catotelm of active peatlands is needed. Area changes are used to transfer carbon between active peatlands, former peatlands, land-use areas, and natural vegetation classes. Transient decay rates are used to decay the carbon in the respective pools. Carbon is thus tracked from its entry into the catotelm of an actively accumulating peatland until its decay there or in a former peatland or land-use area. This approach cannot take account of the acrotelm carbon. However, acrotelm carbon constitutes only a small part of simulated total peatland carbon (5 % at 1975), and we can assume that this carbon at the peat surface is quickly respired after peatland transformation. For the analysis, we refer to two different variables related to peat carbon: (1) peatland carbon, which refers to the carbon stored in the acrotelm and catotelm pools of active peatlands, and (2) total peat carbon, which is calculated in post-processing and represents all carbon in the catotelm of active peatlands and organic, not-yet-decomposed carbon that was at some point sequestered into a catotelm on peatlands transformed to land-use areas and other former peatlands. After ecosystem transformation, depending on the transition and the conditions thereafter, former peatlands can see a fast collapse or erosion of carbon stocks (Hoyt et al., 2020; Li et al., 2018) as well as buried peat carbon layers preserved for millennia (Treat et al., 2019). The two carbon variables can be interpreted as two bounding cases to the fate of peat carbon in former peatlands. Changes in the variable peatland carbon can represent a fast emission bounding case where peatland carbon is lost immediately after ecosystem or land-use transformation. The slow emission bounding case, with peat carbon decaying in former peatlands over a long timescale, can be represented by changes in the variable total peat carbon. The true fate of peat carbon in former peatlands in most cases will lie somewhere in between these worst- and best-case scenarios.
2.3 Simulation setup
The simulations presented here are a direct continuation of a transient simulation from the Last Glacial Maximum (LGM) to the present, which was discussed in detail in Müller and Joos (2020). This enables future projections starting from a truly transient spinup, including all potential legacy effects of the past 22 000 years. The LGM simulation was run with a model resolution of 2.5∘ latitude × 3.75∘ longitude and was forced with CO2 (Joos and Spahni, 2008) and temperature and precipitation fields. Temperature and precipitation anomalies were taken from the transient CCSM3 run TraCE21k (Liu et al., 2009). The TraCE21k anomalies were imposed on the CRU TS 3.1 (Mitchell and Jones, 2005) base climate from 1960 to 1990. Interannual variability thus came from TraCE21k. Temperature anomalies were calculated as absolute and precipitation anomalies as relative values.
The resolution of the LGM simulation was adopted for the future simulations. This ensures a truly seamless transition between the simulations, without unpredictable effects of downscaling on peatland dynamics.
In the original LGM simulation, land use was not considered as the focus of the study was on the natural development and evolution of peatlands since the LGM. To integrate a transient history of land use, the simulation was restarted in the year 1500 with subsequent transient land-use forcing (Hurtt et al., 2020) and otherwise unchanged boundary conditions.
In the year 1975, the midpoint of the base climate period, forcing transitions from TraCE21k to CMIP6 climate anomalies (temperature, precipitation, and cloud cover) (O'Neill et al., 2016, see Fig. 1), whereas the base climate remains unchanged. From this point on, simulations are done for each model of a 10-member climate model ensemble (see Sect. 2.5). Short historical simulations from 1975 to 2014 bridge the gap between the LGM simulation and the start of the CMIP6 scenarios with anomalies taken from the CMIP6 historical simulation of the climate model ensemble.
Simulations corresponding to three different CMIP6 scenarios start from the year 2015. One strong-mitigation scenario (SSP1-2.6), one middle-of-the-road scenario (SSP2-4.5) and one high-emission scenario (SSP5-8.5) were selected to represent the scenario range. The standard CMIP6 scenarios end in the year 2100. To investigate the delayed long-term responses of peatlands, the forcing is extended into the future with a detrended version of the last 30 years of each time series repeated over almost 5000 years until the year 7000. The trend correction was done per grid cell and month and with respect to the end of the time series. Scenario CO2 forcing was adopted from Meinshausen et al. (2020). Land-use forcing is taken from the Land-Use Harmonization (LUH2) project (see Fig. 2g–i, Hurtt et al., 2020).
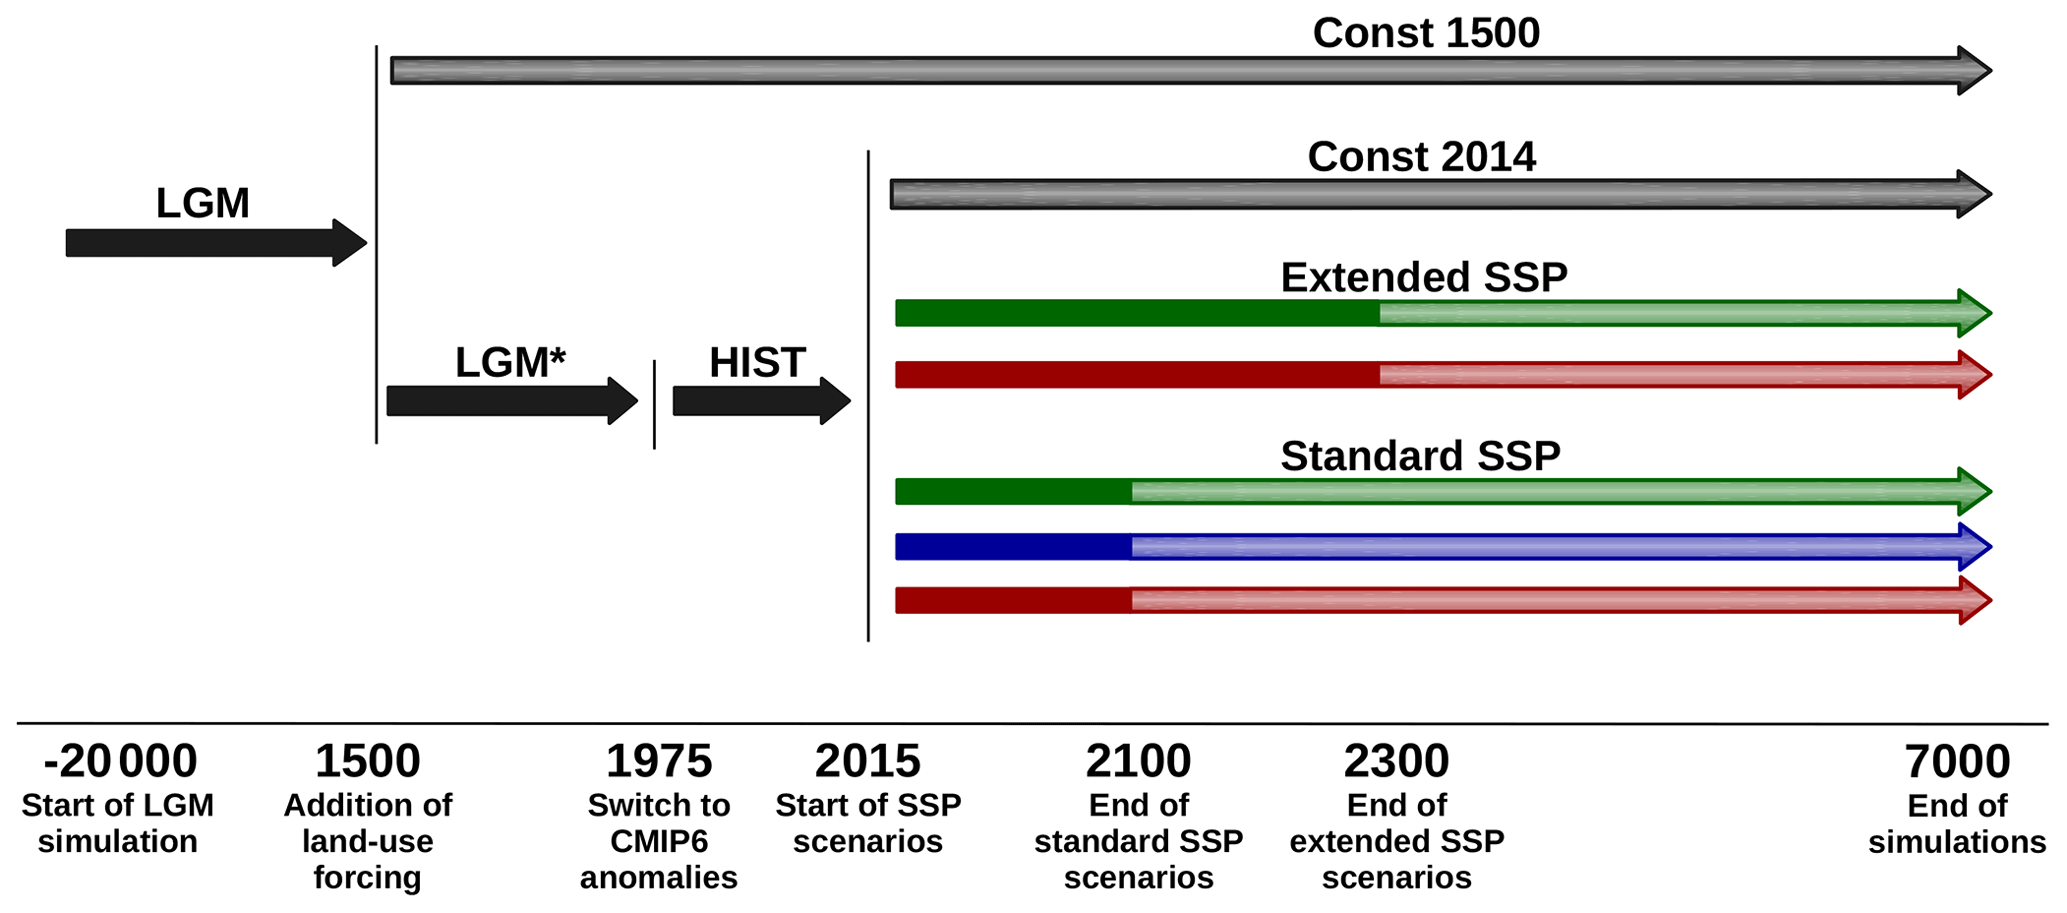
Figure 1Diagram of the simulation setup. A transient simulation from the LGM to 1975 and with additional land-use forcing after 1500 (LGM*) is followed by short historical simulations until 2014 (HIST) and subsequent standard and extended Shared Socioeconomic Pathway (SSP) scenario simulations forced by CMIP6 climate anomalies. After the end of the transient forcing (solid arrows), SSP scenarios are continued with constant forcing (light color arrows). Additional commitment simulations with constant boundary conditions start at 1500 and 2014.
CMIP6 also includes extended versions of the scenarios SSP1-2.6 and SSP5-8.5 that range until 2300. At the time of this study, however, only three climate models had provided output for these extended scenarios. Climate projections of these three models alone are not representative of the full CMIP6 scenario. They were, however, included in the 10-member climate model ensemble used here (see Sect. 2.5 and Fig. S1) and additional simulations with transient climate and CO2 forcing until 2300 were performed to compare results to the standard simulations.
To disentangle future changes in peatlands that are induced by changes in climate, CO2, and land use up to 2014 from those induced by future changes in these drivers, we performed an additional simulation with constant boundary conditions at 2014 levels for each ensemble member. Here climate forcing was extended with a detrended version of the last 30 years of the historical forcing. Similarly, a control simulation was performed with constant boundary conditions after 1500 to show the undisturbed model state. These simulations reveal the committed changes in peatland area and carbon induced by the deglacial changes prior to the preindustrial state at 1500 and the changes over the historical period until 2014 respectively.
2.4 Driver contributions
To determine the different driver contributions to the changes in peatland variables, additional factorial simulations were performed for all scenarios and climate model ensemble members. For each standard simulation, there are five factorial simulations with one of the five transient forcings (temperature, precipitation, cloud cover, CO2, and land use) kept constant at 2014.
The driver contribution to the anomaly of peatland variables was determined as the difference between the standard run anomaly and the anomaly in the respective factorial run. The contribution from already committed changes due to past climate and land-use change was determined as the anomalies in the simulations with overall constant forcing after 2014 (see Sect. 2.3). The residual of the difference between the sum of all contributions and the standard run anomaly was identified as the contributions from non-linear interactions and other factors not considered in the analysis. Cloud cover was found to have only a minimal effect on the considered peat variables in the LPX-Bern, and thus for further analysis its contribution was added to the other/non-linear category.
As a second step, driver contributions were classified as driving contributions (same sign as peatland variable anomaly) and dampening contributions (opposite sign as peatland variable anomaly) and re-normalized respectively. Figures show only the driving contributions of the respective positive and negative peatland variable anomalies.
2.5 Climate model selection
We chose a subset of 10 climate models out of a CMIP6 ensemble of 22 models (see Figs. 2a–f and S1) that at the time (June 2020) provided monthly output for all necessary forcing variables – precipitation, near-surface temperature, and cloud cover – and for all considered experiments – historical, SSP1-2.6, SSP2-4.5, and SSP5-8.5. Climate model output was downloaded from the earth system grid database. One additional model, the Community Integrated Earth System Model (CIESM), had to be excluded from the CMIP6 ensemble as it showed a discontinuity in the precipitation data between the historical and the scenario simulations.
Three models, IPSL-CM6A-LR, MRI-ESM2-0, and CanESM5, were included in the subset a priori as they were the only ones that also provided output for both of the extended SSP1-2.6 and SSP5-8.5 scenarios (see Sect. 2.3). The other seven were chosen for the ensemble subset to optimally represent the full CMIP6 ensemble as a whole. The optimization targets of ensemble total range, interquartile range, and median, were defined with respect to the anomalies (from 1961–1990 to 2071–2100) in precipitation and temperature as the most important forcings to the LPX-Bern. The optimization was inspired by McSweeney and Jones (2016). A total of 2000 randomly drawn subsets were ranked according to the distance of the subset to the targets with normalized scores calculated and averaged over all individual grid cells, months, scenarios, and variables. The rating of the best-performing subsets was further improved by a careful handpicked combination, resulting in the final subset including the climate models referenced in Table 1.
This subset performs best when calculated both over the total land area and over the simulated peatland area alone. Over land, temperature anomaly total range, interquartile range, and median differ between the ensemble subset and the full ensemble by 0.25, −0.18, and 0.02 ∘C respectively, with larger distance at higher-emission scenarios. Averaged over the simulated peatland area at 1975, the distances are 0.28, −0.31, and 0.03 ∘C respectively. For precipitation, anomaly total range, interquartile range, and median differ between full ensemble and ensemble subset by 9.7, 0.64, and −0.15 mm over all land area and 7.3, 0.54, and −0.49 mm over the peatland area respectively. The optimization procedure thus yielded an ensemble subset representative of the full CMIP6 ensemble, although, given the number of possible combinations, optimization could be improved further with further sampling.
Rong et al. (2018)Rong (2019a, b)Dunne et al. (2020)Krasting et al. (2018); John et al. (2018)Swart et al. (2019a)Swart et al. (2019b, c)Döscher et al. (2021)EC-Earth Consortium (EC-Earth) (2019a, b)Volodin et al. (2017)Volodin et al. (2019a, b)Boucher et al. (2020)Boucher et al. (2018, 2019)Mauritsen et al. (2019)Wieners et al. (2019b, a)Yukimoto et al. (2019a)Yukimoto et al. (2019b, c)Lee et al. (2020)Byun et al. (2019b, a)Seland et al. (2020)Seland et al. (2019a, b)Table 1Ensemble of CMIP6 earth system models used to force the LPX-Bern. Output data were used for monthly precipitation, surface temperature, and cloud cover from the “r1i1p1f1” variant of the respective historical simulations and future scenarios SSP1-2.6, SSP2-4.5, and SSP5-8.5
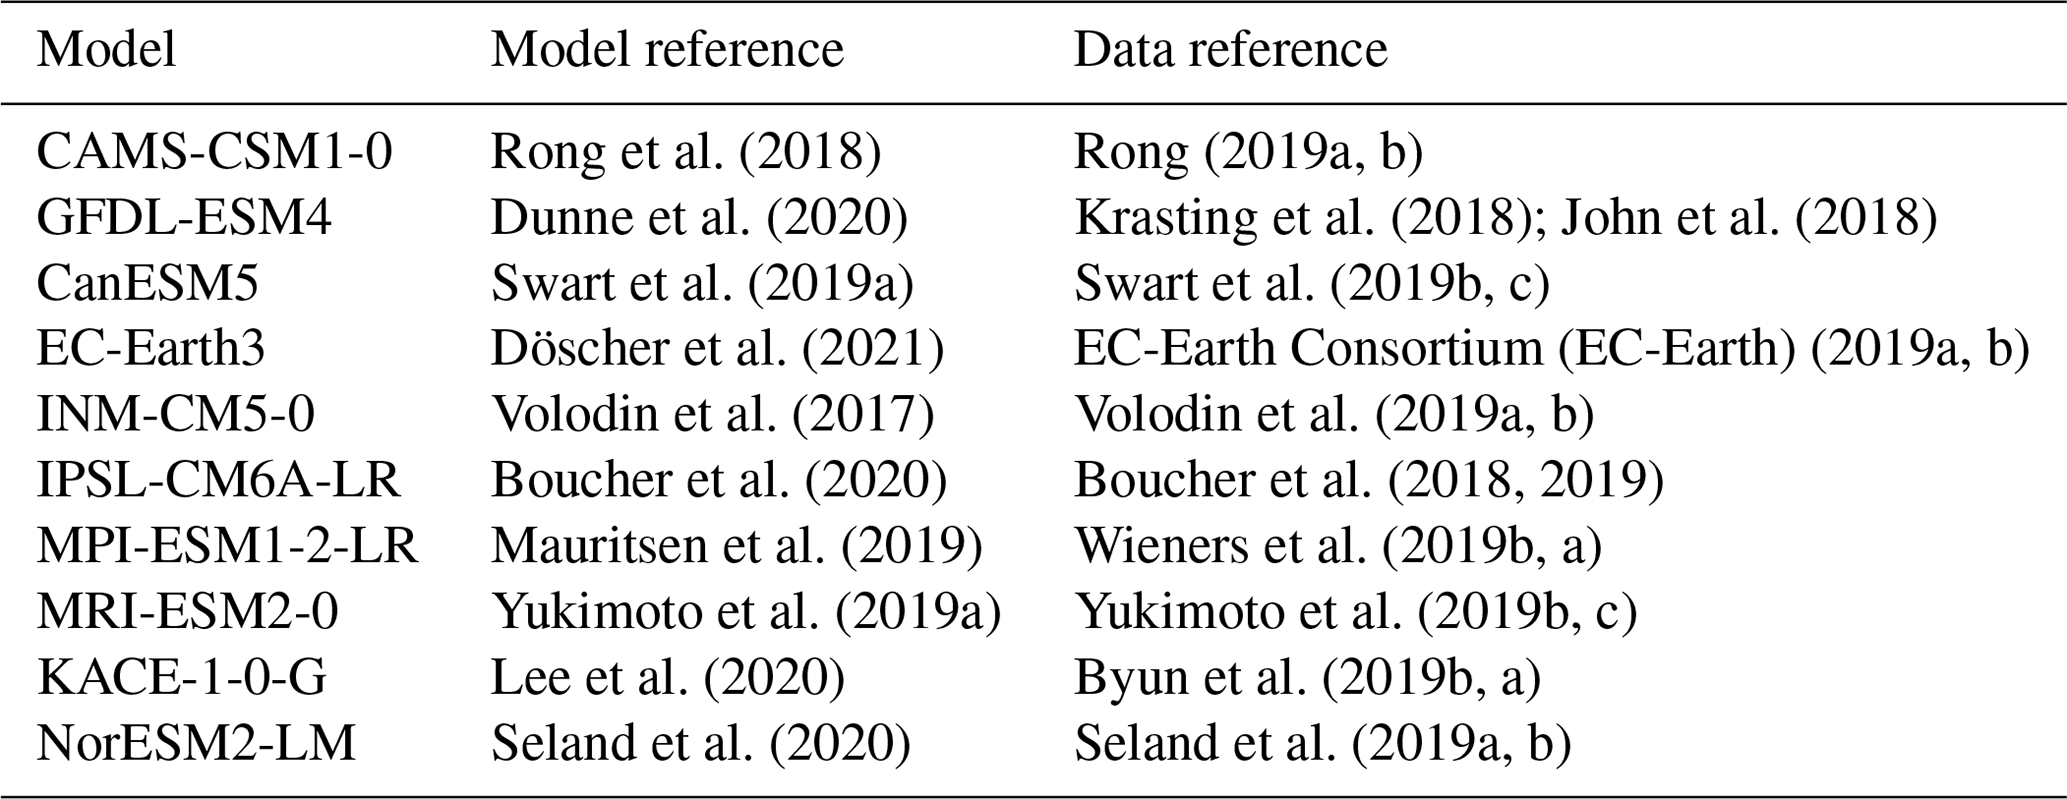
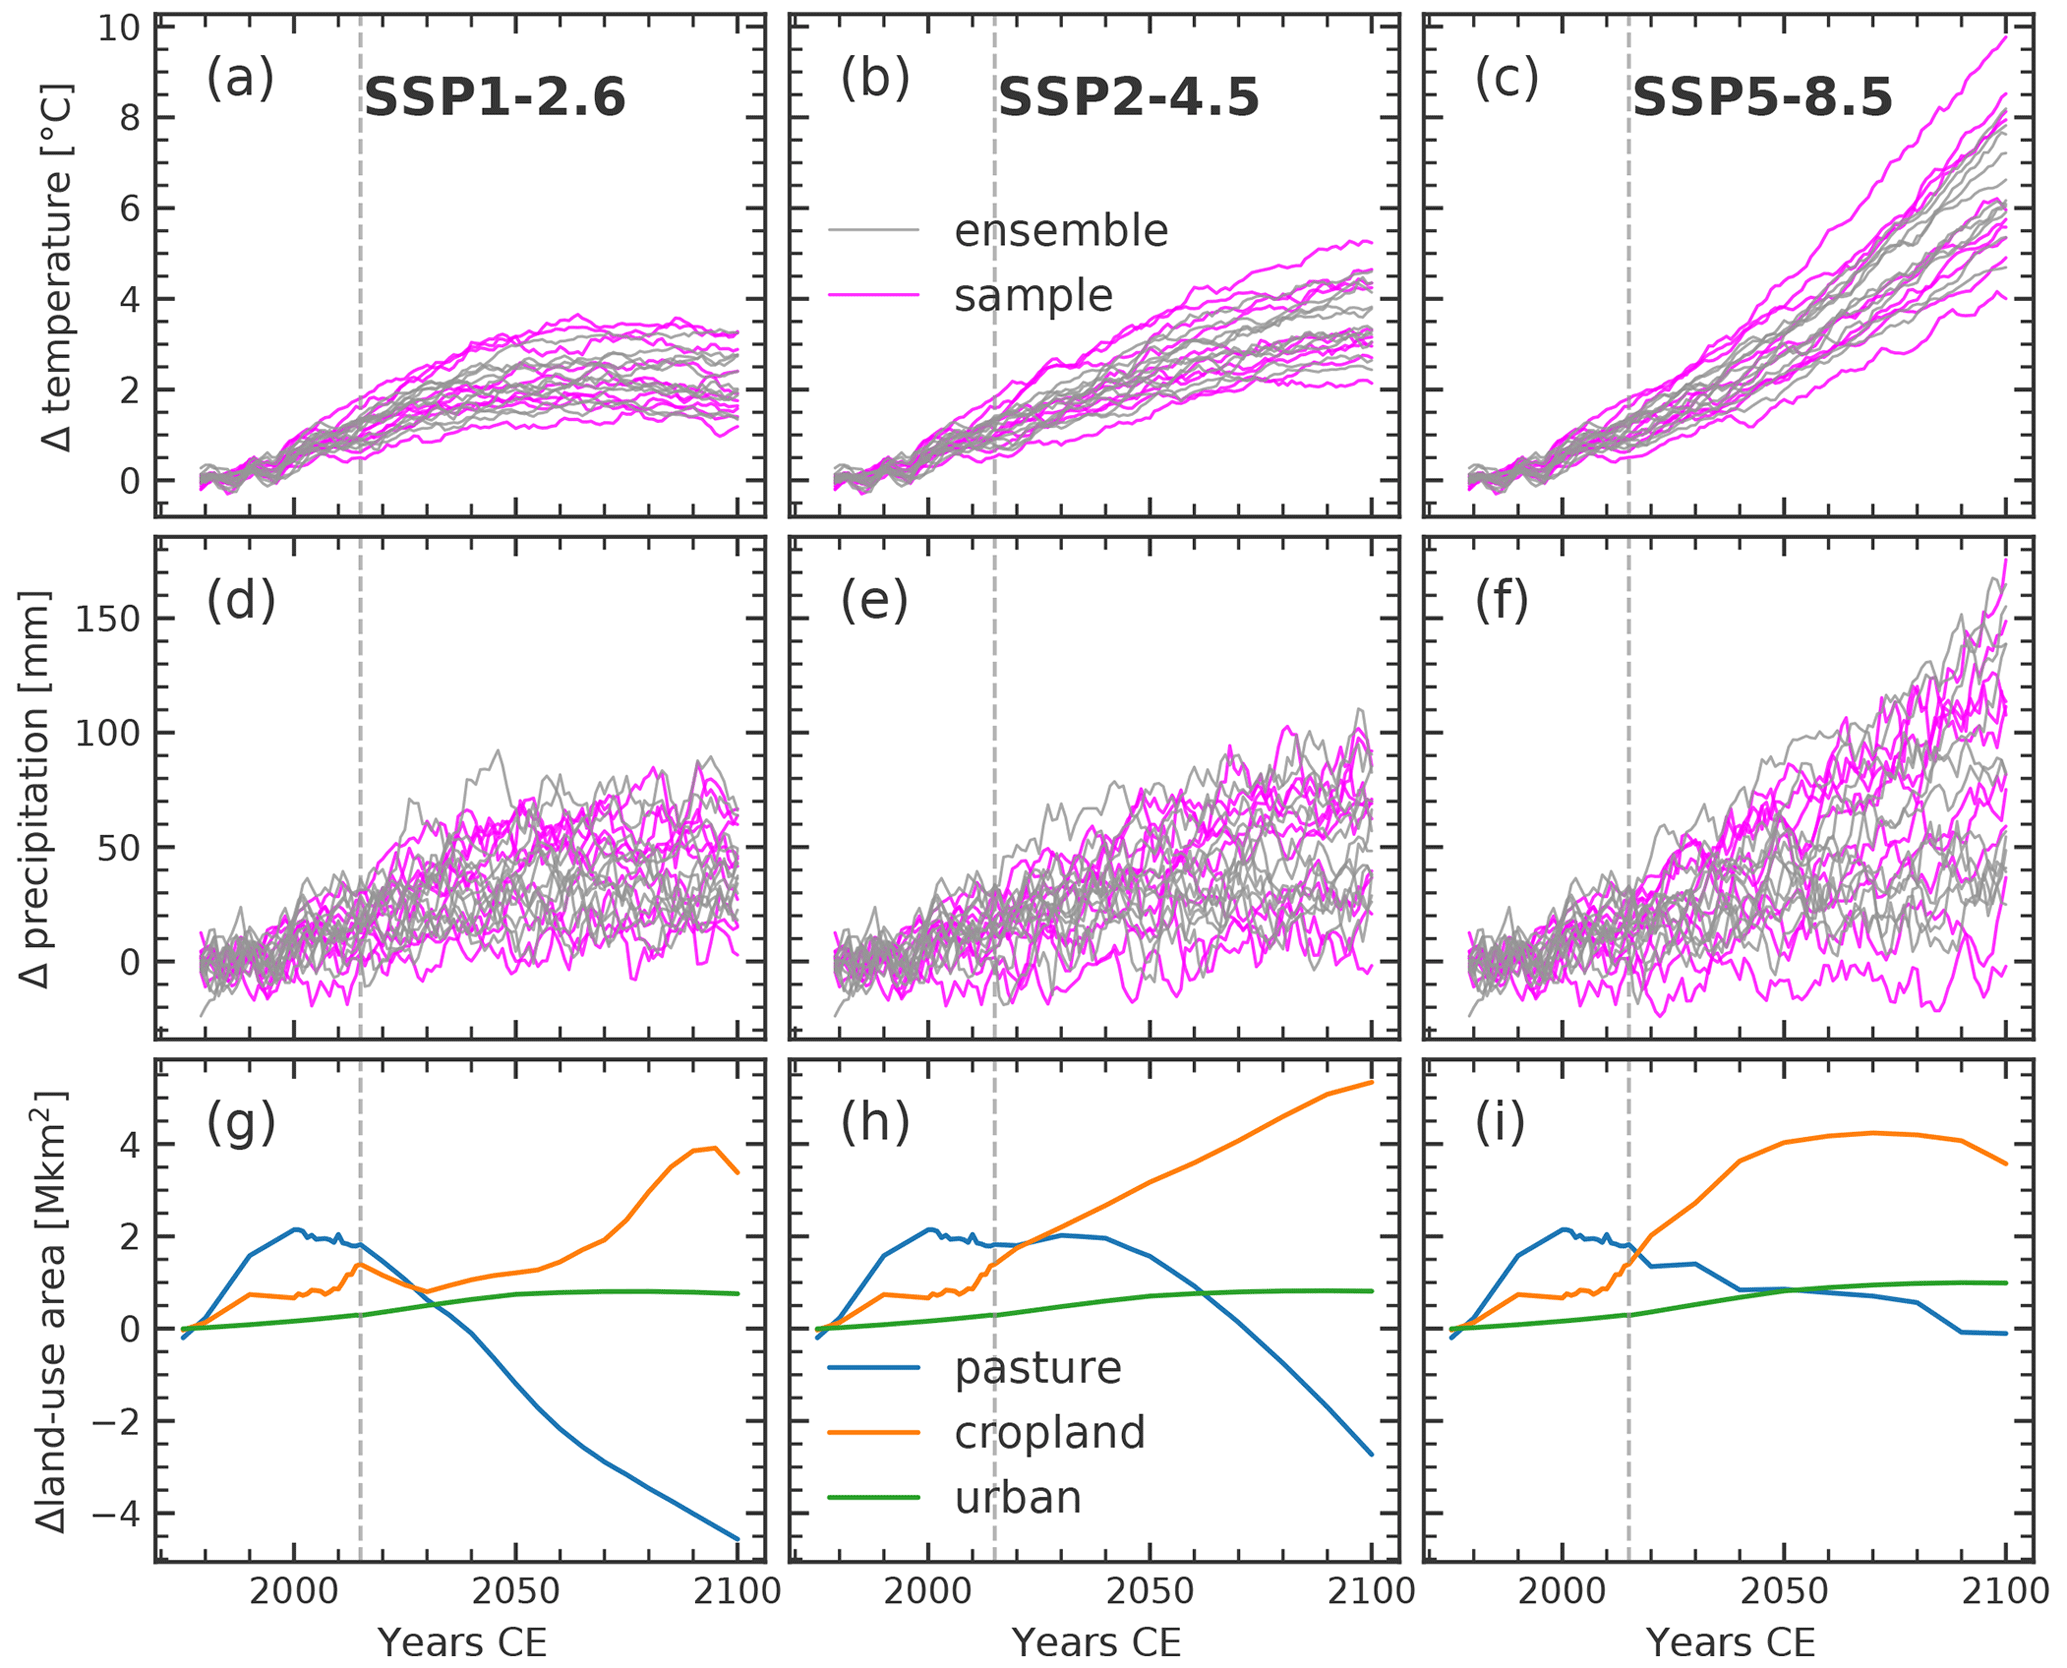
Figure 2Global surface air temperature (a–c), precipitation (d–f), and land-use area (g–i) anomalies for the 1961-1990 average for three CMIP6 scenarios: SSP1-2.6 (a, d, g), SSP2-4.5 (b, e, h), SSP5-8.5 (c, f, i). Magenta lines show anomalies of the climate model ensemble subset applied to force LPX-Bern versus the rest of the CMIP6 ensemble in gray. Dashed vertical gray lines show the year 2015 from which the future scenarios diverge. Pasture, cropland, and urban land-use areas amount to 31.2, 14.4, and 0.3 Mkm2 during the 1961–1990 baseline period respectively.
2.6 Present-day model state
There are still considerable uncertainties connected to estimates of the global area covered by peatlands and the amount of organic carbon stored within them. Estimates for northern peatland area, using various methods ranging from inventory based to machine learning, lie between 2.4 and 4.0 million square kilometers (Mkm2) (Yu et al., 2010; Loisel et al., 2017; Xu et al., 2018b; Hugelius et al., 2020). For tropical peatlands, which are still much less studied than northern peatlands, peatland area estimates have increased in recent years following the discovery of large new peatland complexes, such as in the Congo Basin (Dargie et al., 2017), and due to new methodologies trying to account for potentially undiscovered peatlands (Gumbricht et al., 2017). Earlier estimates of tropical peatland area thus range from 0.37 to 0.44 Mkm2 (Yu et al., 2010; Page et al., 2011) and more recent estimates from 1.0 to 1.7 Mkm2 (Gumbricht et al., 2017; Xu et al., 2018b). Peatland areas simulated by LPX in the year 1975, the end of the transient simulation from the LGM, are within the range of literature estimates with a global, northern (>30∘ N), and tropical (30∘ S to 30∘ N) peatland area of 3.8, 2.8, and 1.0 Mkm2 respectively. Global peatland area is shifted more towards the tropics as in most estimates. However, most major peatland complexes seen in global peatland maps, e.g., PEATMAP (Xu et al., 2018b, see Fig. 3), are captured well. Major regional differences exist in Africa, where LPX-Bern fails to simulate the large Congo Basin peatland complex. Peatland area is also underestimated in northern Europe. In North America the model overestimates peatland area in Alaska and Quebec and underestimates peatland extent in western Canada.
Estimates of global peatland carbon are directly dependent on peatland area estimates and thus also come with a large uncertainty range. Northern peatlands have been estimated to store 270 to 604 gigatons of carbon (GtC), using various methods and area estimates (see Yu, 2012, and Yu et al., 2014, for a review). For tropical peatlands, estimates of organic carbon storage range from 44 to 92 GtC in earlier estimates (Yu et al., 2010; Page et al., 2011) and increase as a result of larger assumed areas in recent estimates from 70 to 288 GtC (Dargie et al., 2017; Ribeiro et al., 2021). In the year 1975, peatlands simulated by the LPX-Bern have accumulated about 441 GtC of soil organic carbon globally. From this, northern and tropical peatlands make up 319 and 121 GtC respectively. Simulated carbon stocks thus lie within the literature estimates but again with a distribution shifted more towards the tropics than most estimates suggest.
Throughout the 22 000 years of the transient simulation up to the year 1975, peatland area was highly dynamic with today's peatlands gradually expanding but also large paleo-peatlands vanishing over time (Müller and Joos, 2020). There, similarly as described in Sect. 2.2, the carbon from former peatlands was tracked through subsequent land classes until its decay. At 1975 LPX-Bern gives a total of 195 GtC of peat carbon leftover from former peatlands on land, with 165 GtC in northern latitudes and 28 GtC in the tropics. Total peat carbon is thus simulated to be 612 GtC. Very little is known about the amount and location of peat leftover and buried from former peatlands, although various deposits have been found (Treat et al., 2019). Peat carbon lost due to past or future sea-level rise is not considered in this study.
Unlike the original LGM simulation in Müller and Joos (2020), here land use and land-use change is considered since the year 1500, with land-use areas being able to expand onto peatlands (see Sect. 2.3). Up to 1975 about 0.42 Mkm2 of peatland area and 50 GtC of peatland carbon are lost from active peatlands due to land-use change in the simulation. Carbon loss is reduced to about 5 GtC when considering total peat carbon, which does not assume an immediate loss but a slow decay in former peatlands. Leifeld et al. (2019) estimate that about 0.51 Mkm2 of peatland area and 22 ± 5 GtC of peatland carbon was lost globally from 1850 to 2015 due to drainage and land-use conversion of peatlands, which is in rough agreement with the simulated values (see also Sect. 3.1.1).
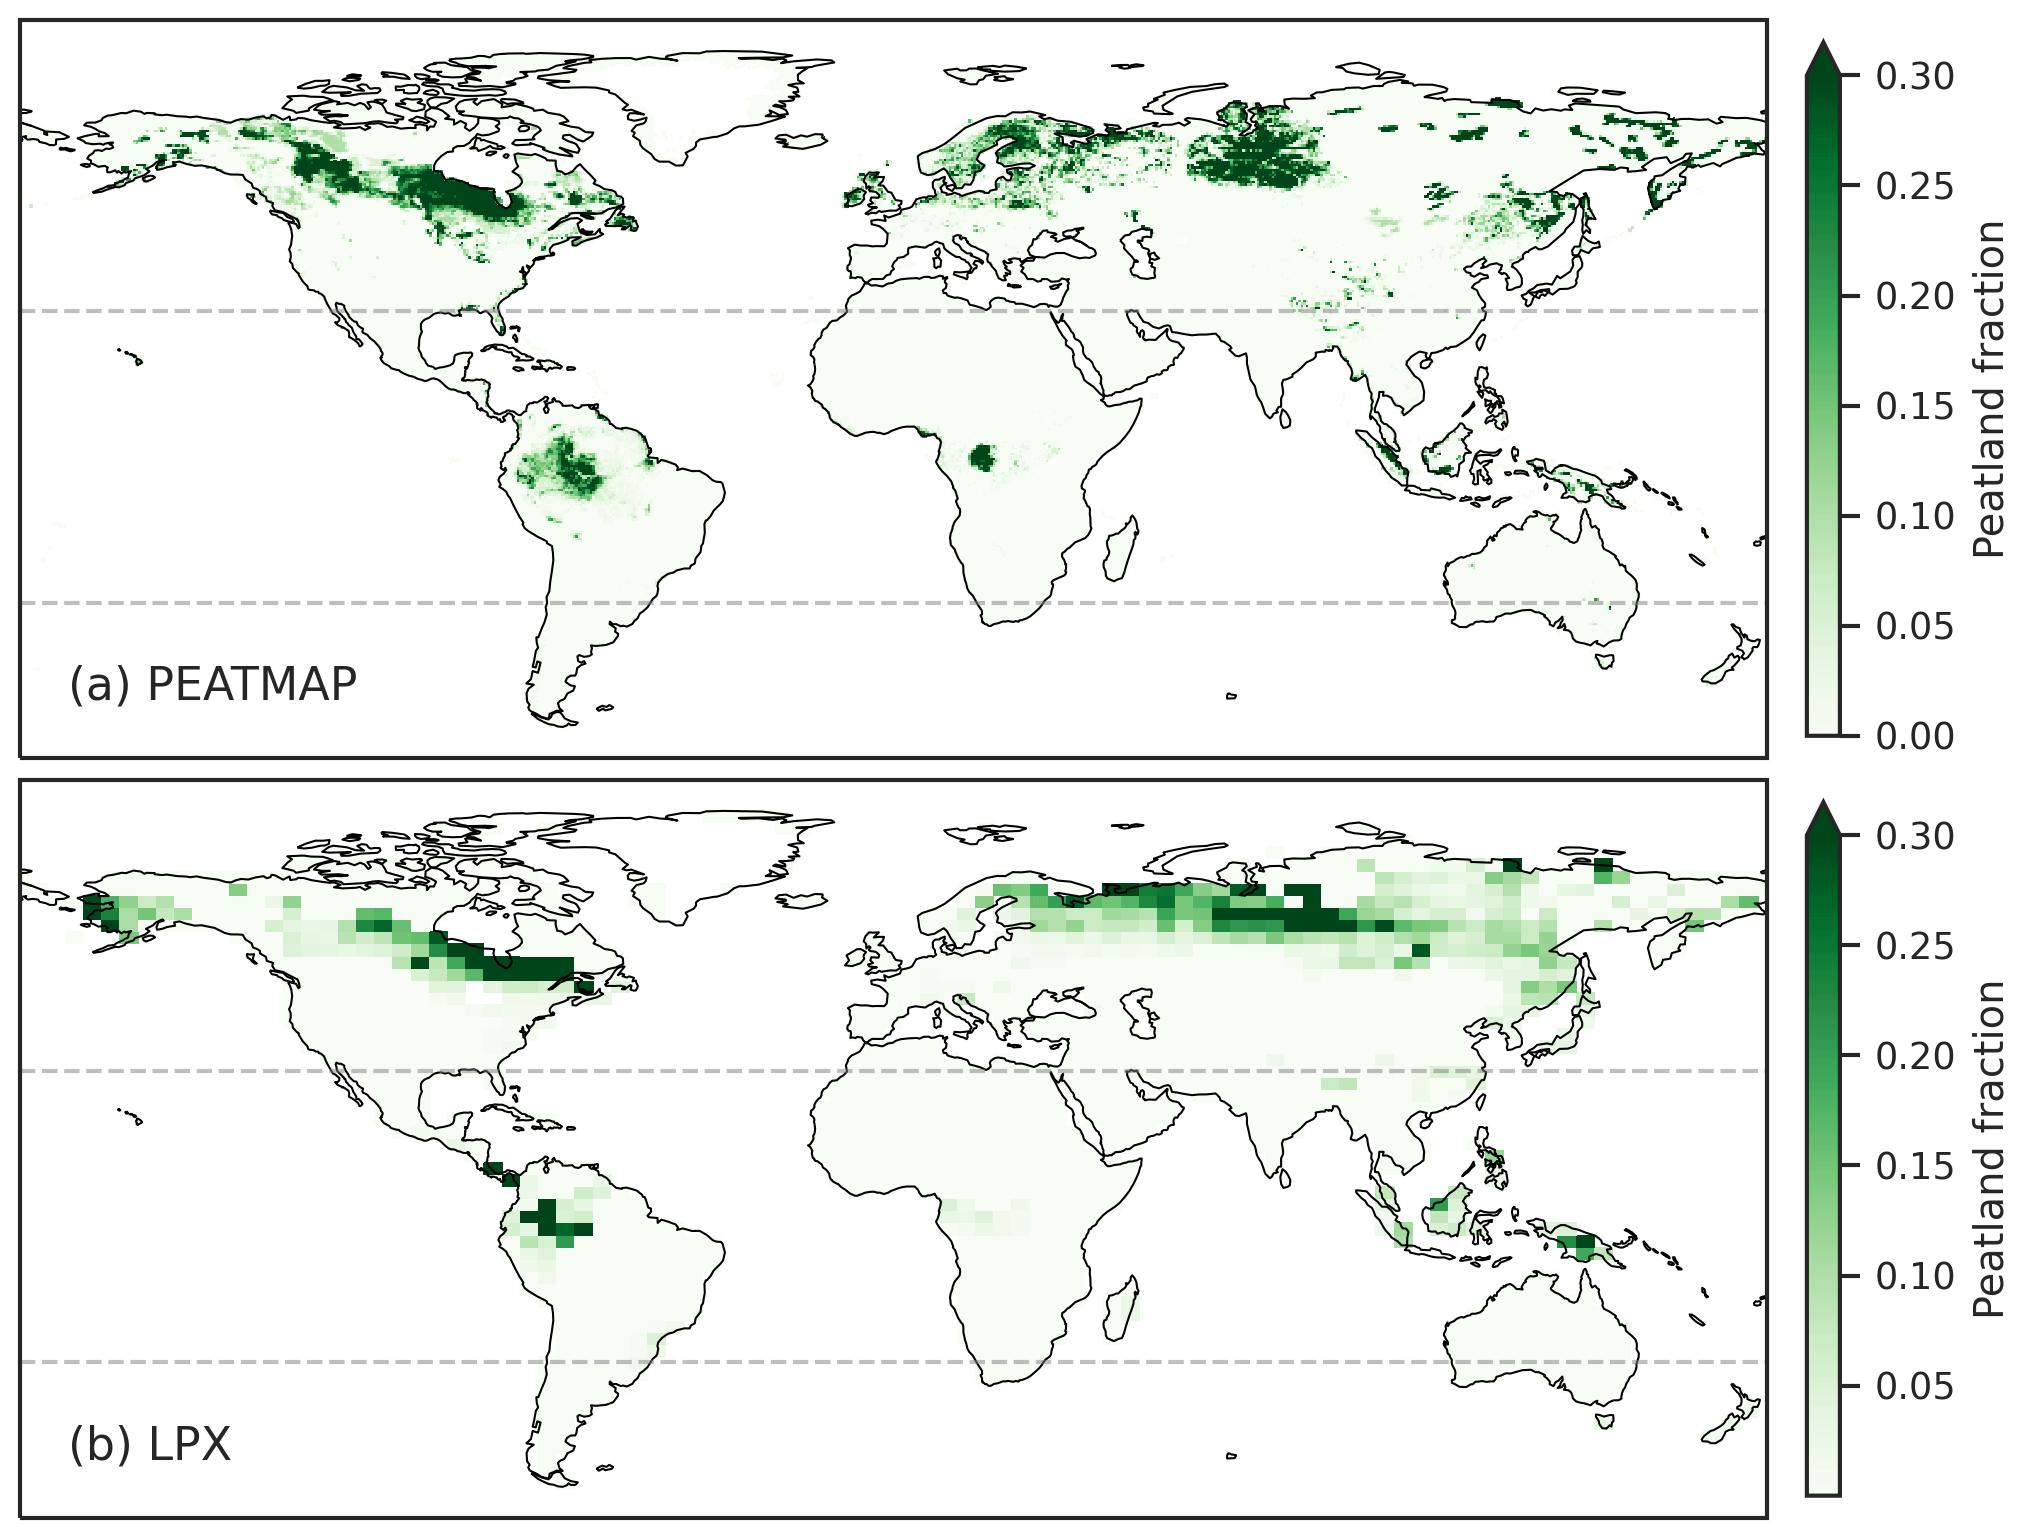
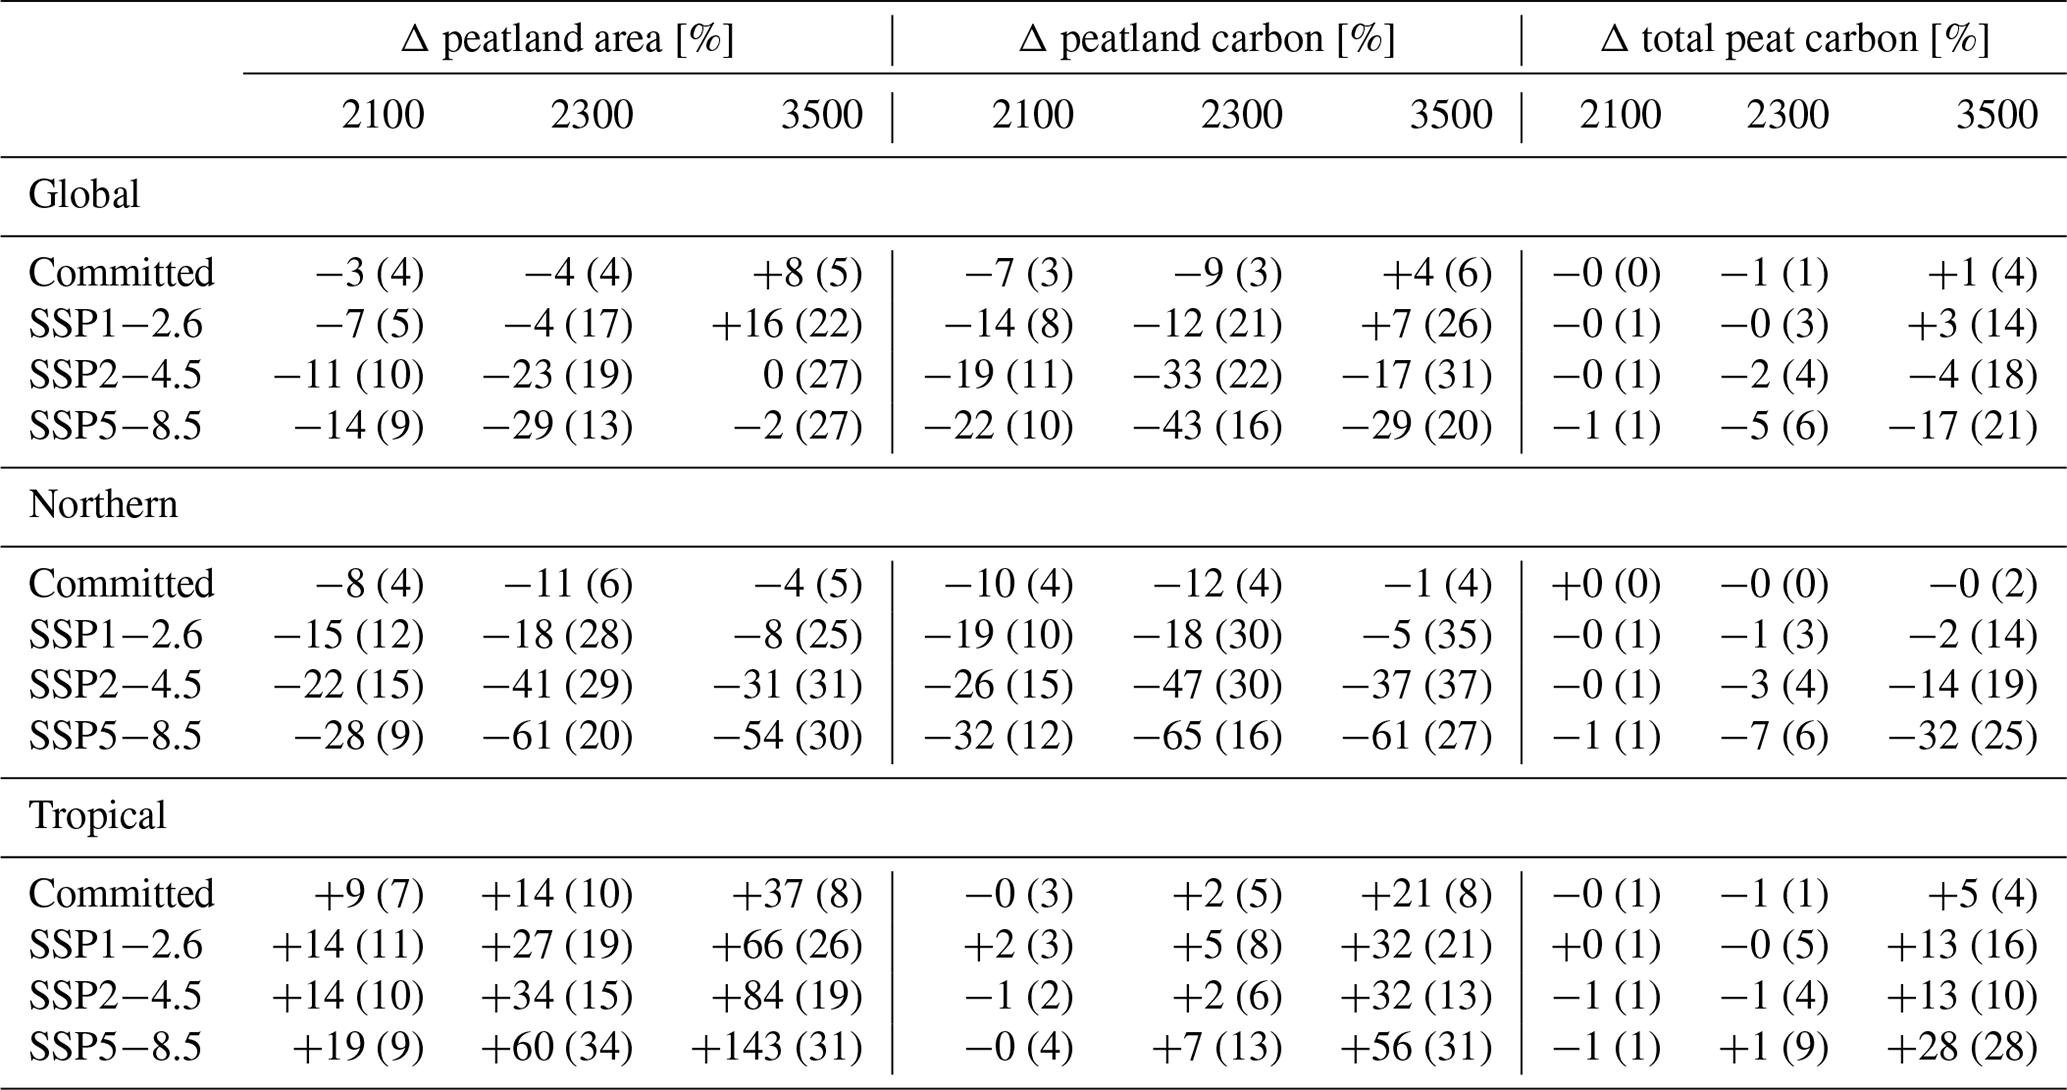
Table 2Median and corresponding interquartile range (IQR) in parentheses of relative anomalies for simulated peatland area, peatland carbon, and total peat carbon as defined in Sect. 2.2. Medians and the IQR are given relative to 1995–2014 averages. IQR boundaries are listed in Table S1. Values are rounded to integer values. Northern latitudes are defined as >30∘ N and tropical latitudes as 30∘ S–30∘ N. For the reference period, simulated median peatland area, carbon, and total peat carbon is 3.7 Mkm2, 423 GtC, and 611 GtC for global peatlands; 2.7 Mkm2, 301 GtC, and 500 GtC for northern peatlands; and 1 Mkm2, 121 GtC, and 142 GtC for tropical peatlands respectively
3.1 Historical and committed changes
3.1.1 Historical 1975–2014
The gap between the end of the transient LGM run in 1975 and the beginning of the future scenarios in 2015 is bridged by short historical simulations. These are forced with climate anomalies from the 10 ensemble climate models (see Sect. 2.3). During this short period, climate anomalies already drift apart substantially between the different climate models (see Fig. 2). Differences in climate forcing are propagated to differences in peatland responses. Averaged over 1995–2014 simulated global peatland area varies between 3.6–3.8 Mkm2. Legacy effects and accelerating climate change lead to a reduction in peatland area with respect to 1975 in most simulations, resulting in a median of 3.7 Mkm2. A part of this reduction (median: −0.1 Mkm2) is also attributable to an increase in land-use area, which claims an additional 0.06 Mkm2 from 1975 to 2014.
The respective carbon stored in global peatlands is simulated to be 423 (419–432) GtC, with changes mostly a result of the peatland area changes. Changes in total peat carbon, including carbon in former peatlands (see Sect. 2.2), also are mostly negative but small, with global peat carbon stocks at 611 (610–612) GtC.
3.1.2 Committed 2015–2300
Past changes in climate and land use have long-lasting effects on global peatlands that are superimposed on changes induced by future disturbances. To disentangle the effects of past and future changes in drivers, simulations with constant 2014 boundary conditions were made for each climate model ensemble member. These “commitment” simulations reveal the delayed response to disturbances in the past and thus represent the committed changes independent of the future scenario for climate, land use, and CO2 (Figs. 4, 5, and S2).
In most commitment simulations, global peatland area continues to decrease and reaches a new equilibrium until 2300. Gross changes reveal, however, also regions of local peatland expansion (Fig. 4). Northeastern Canada, northern Europe, and East Asia are regions with large losses, whereas northwestern Canada, northeastern Asia, and Southeast Asia see an increase in peatland area up to 2300.
Peatland carbon decreases together with global area in most simulations, with the new peatland area showing lower carbon density as lost areas. Total peat carbon, depending on the overall balance of accumulation and decay rather than on peatland area dynamics, is changing only slightly but is declining in 8 out of 10 simulations. Taken together, the simulations suggest a small to moderate peat carbon loss to the atmosphere over the next 300 years given 2014 conditions. Uncertainties, however, are large. The spread between the simulations increases significantly after 2014 despite boundary conditions being kept constant. In the year 2300, the simulated global peatland area anomaly relative to 1995–2014 averages ranges from −13 % to +4 %, with a median of −4 % and interquartile range (IQR) from −6 % to −2 % (Table 2). Global carbon stored in active peatlands and global total peat carbon are simulated to change by −9 (total range: −16 to −0; IQR: −10 to −7) % and −1 (−2 to +1; −1 to −0) % respectively. The increasing uncertainty highlights how relatively small differences in forcing can propagate and result in large long-term ecosystem and carbon cycle uncertainties.
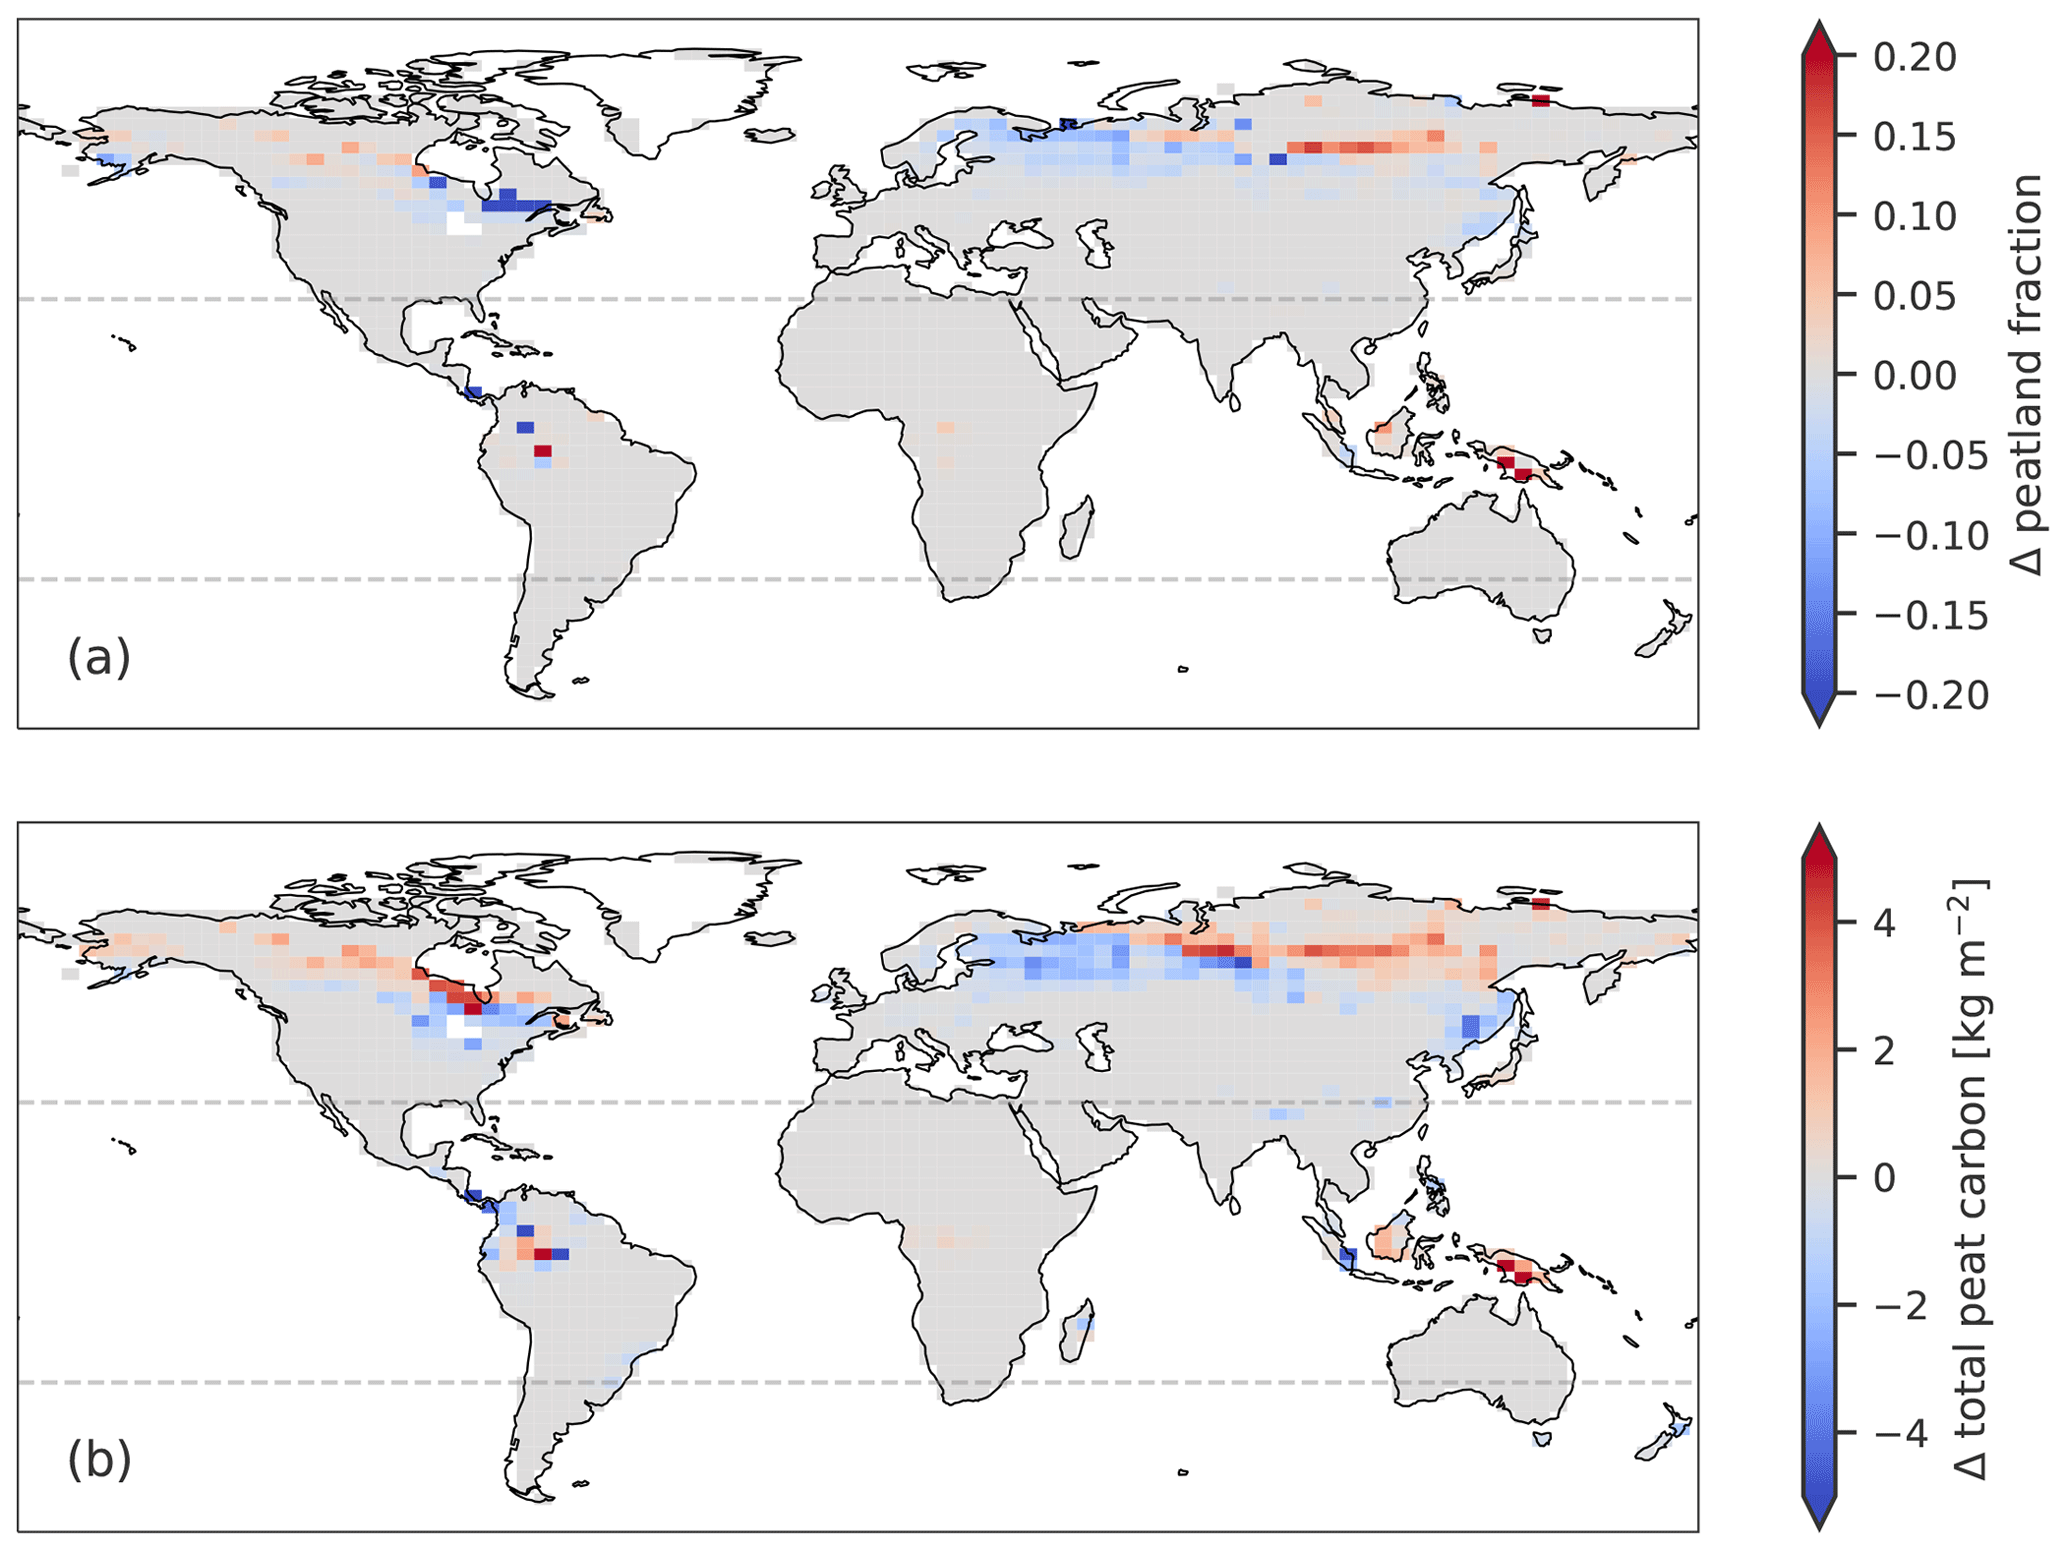
Figure 4Median anomalies for the simulations with constant 2014 forcing at 2300 in (a) peatland area fraction and (b) total peat carbon as defined in Sect. 2.2. Anomalies are calculated between 20-year averages spanning 1995–2014 and 2291–2310.
3.1.3 Committed after 2300
Some simulated peatland responses to historical changes in climate and land use are delayed even beyond 2300. Between about 2700 and 3500 all simulations see a rapid peatland expansion. At 3500 the global peatland area anomaly compared to 1995–2014 averages is +8 (−1 to +16; +5 to +11) %. With that, peatland area is simulated even larger than at present but with a dramatically shifted global and regional distribution. The delayed peatland expansion is limited to the northern highest latitudes and the tropics. The resulting peatland distribution at 3500 shows loss of sizable parts of today's northern peatlands, with new peatlands partly expanding into permafrost regions and the tropics.
Carbon accumulation within old, as well as newly formed, active peatlands continues over millennia, reaching a global peatland carbon stock of +4 (−4 to +16; +1 to +8) % in the year 3500 compared to 1995–2014 averages, illustrating a large long-term accumulation potential (Fig. S2).
For global total peat carbon, the expansion in peatland area also results in a trend reversal in most simulations. The large accumulation in the newly established peatlands helps to shift the balance from decay-dominated to accumulation-dominated. At 3500 total peat carbon is simulated at +1 (−5 to +7; −1 to +2) % compared to 1995–2014 averages and continues to increase with continued accumulation until the end of the simulation.
3.1.4 1500 control simulation
An additional simulation with constant 1500 CE boundary conditions, and thus with only limited land use and no industrial climate change, shows that without major disturbance peatland area remains stable, with only a small increase of 2 % over the whole 5500 years of simulation (Figs. 5 and S2). Carbon shows a stronger positive trend reflecting the still large accumulation potential of undisturbed global peatlands, with an increase of 22 % and 17 % for peatland and total peat carbon respectively. Millennium-scale accumulation rates, however, are larger in simulations with constant 2014 boundary conditions, due to higher productivity in high latitudes and newly emerging peatlands. This indicates that despite an initial loss peat carbon storage under 2014 conditions could exceed storage under 1500 conditions but only after millennia of ecosystem transformations and renewed carbon accumulation. Another study investigating the fate of permafrost peatland carbon in the circum-Arctic region comes to similar conclusions about the future long-term storage capacity of peatlands (Swindles et al., 2015).
3.2 Future projections
3.2.1 Standard scenarios
2015–2300
The standard CMIP6 scenarios provide transient climate anomalies from 2015 to 2100, after which boundary conditions are held constant. Until the end of the century, global peatland area, peatland carbon, and total peat carbon are simulated to decline (Table 2). This decline is larger than committed changes alone and increases with increasing scenario-based emissions for all three variables (Figs. 5 and 6). These results suggest a clear relationship between future emissions pathways and resulting peatland area and carbon losses until the end of the century.
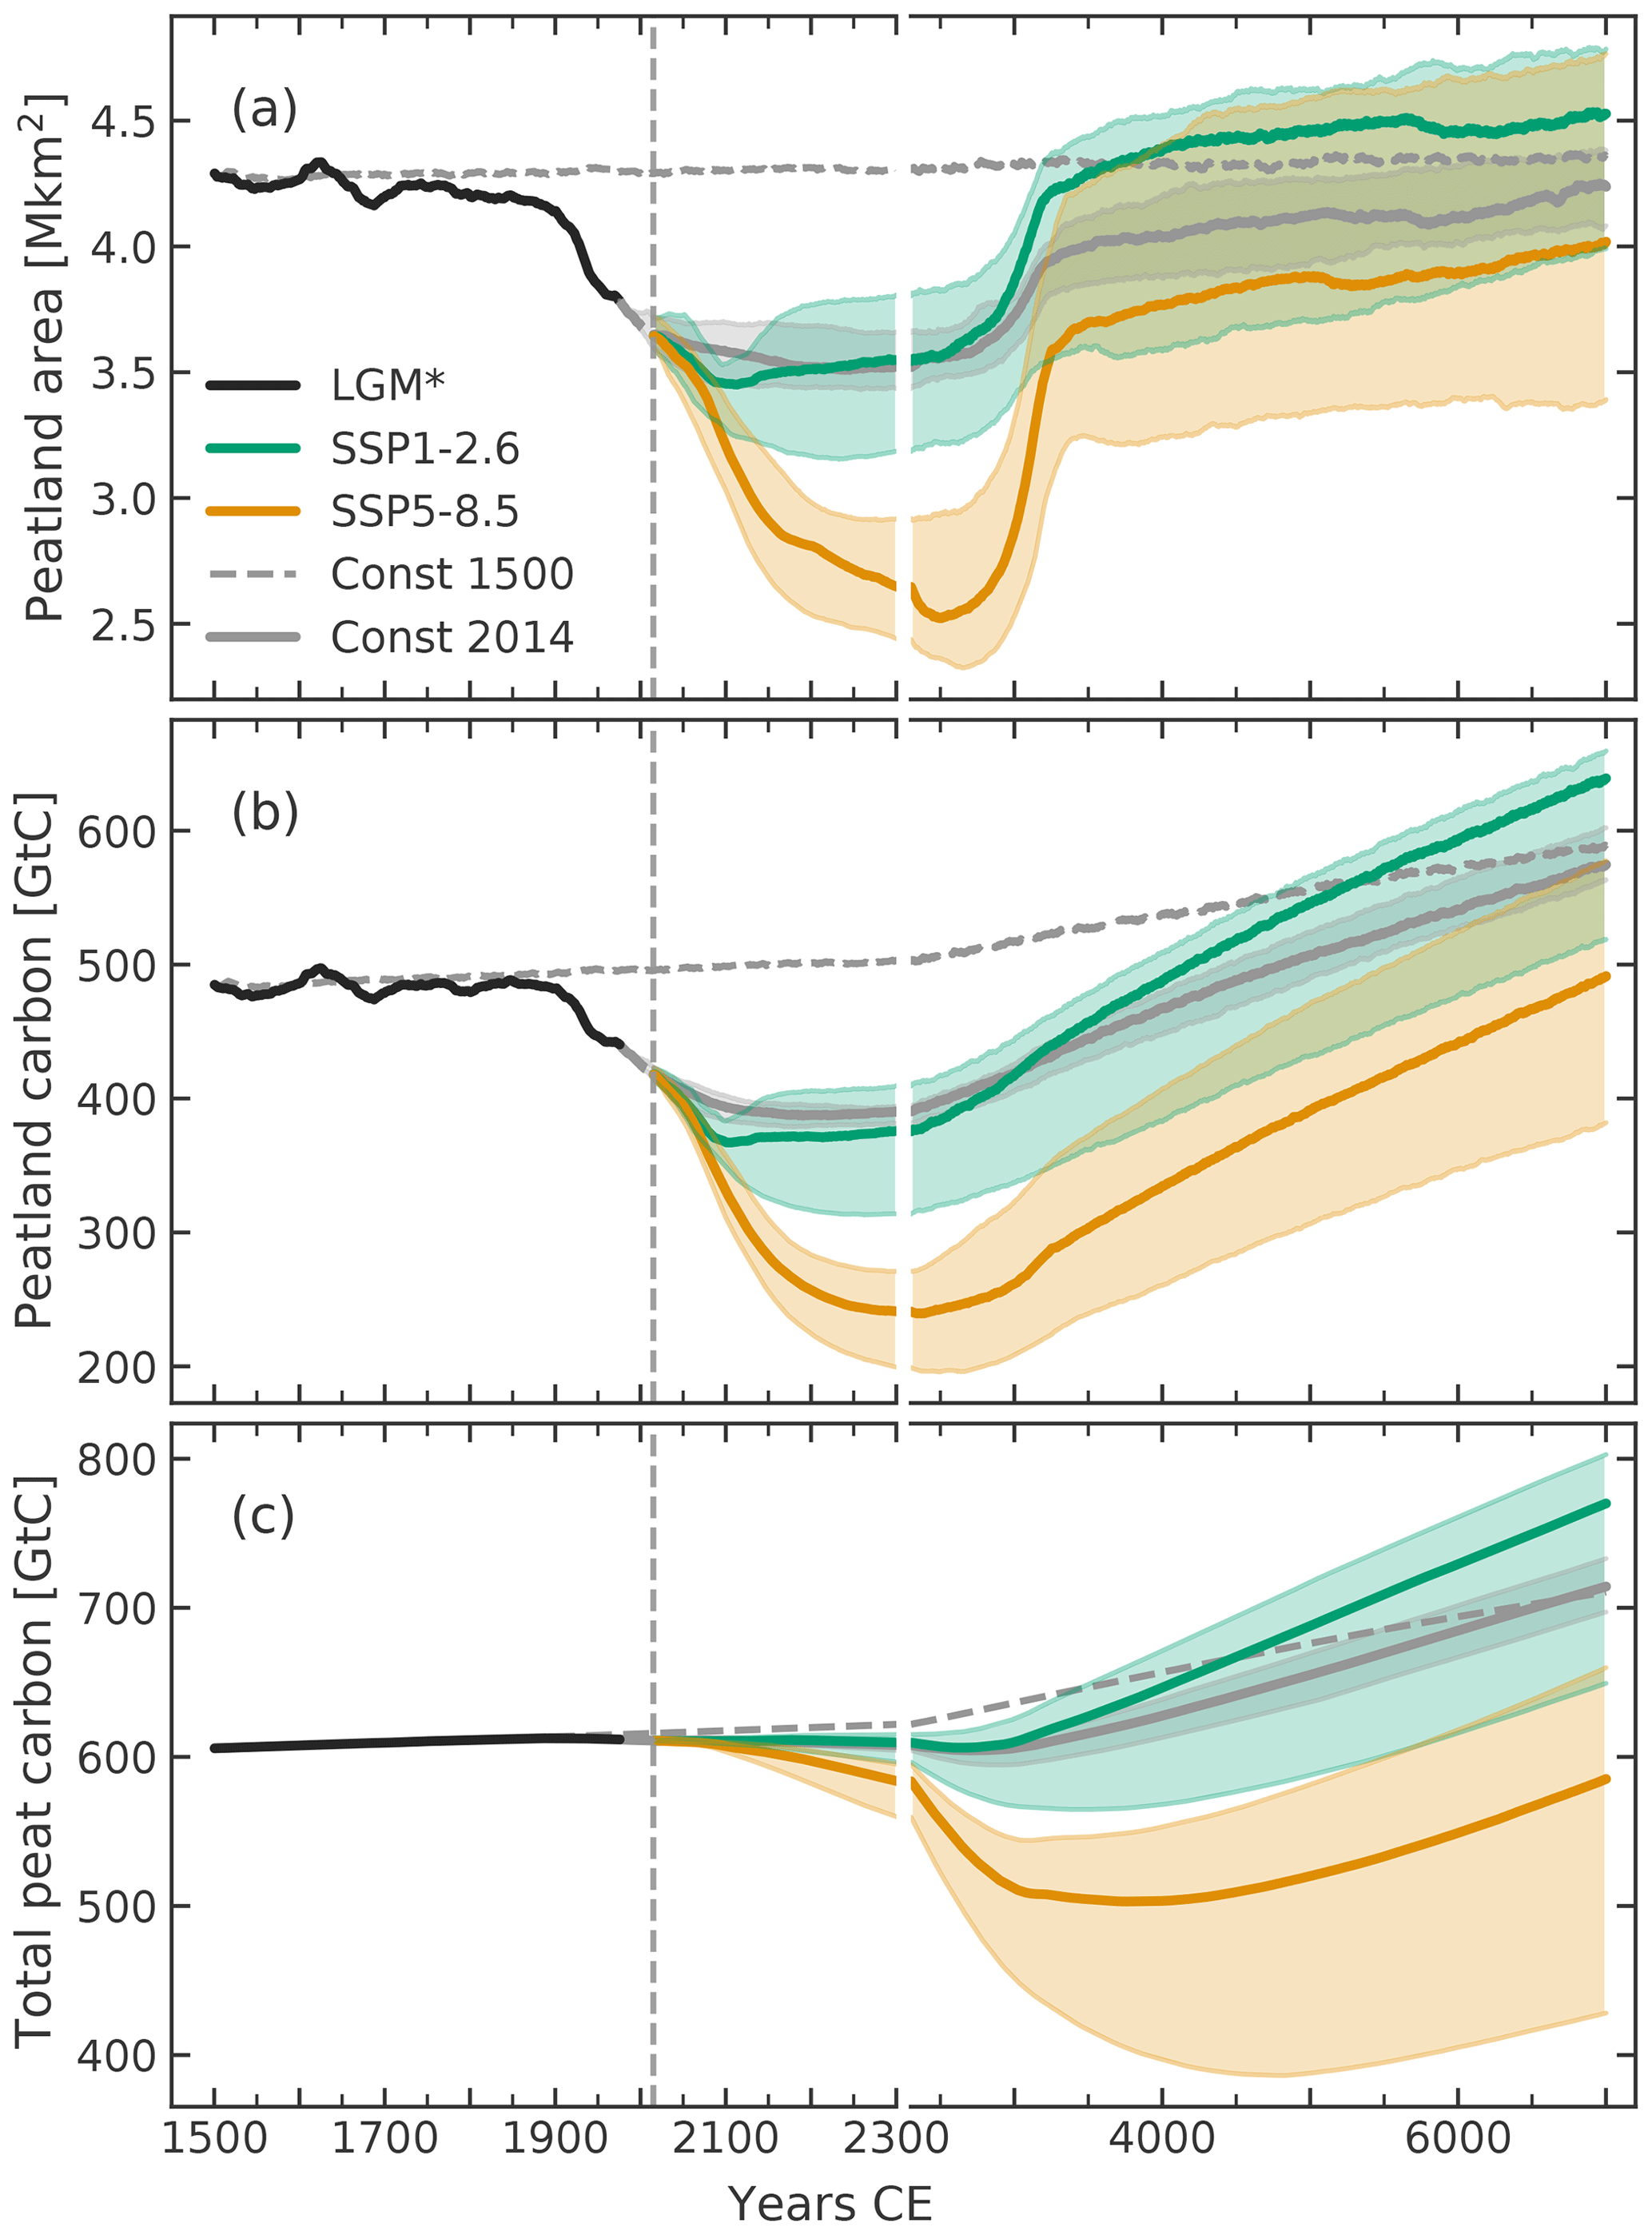
Figure 5Simulated continued transient evolution after the LGM run (LGM*) of (a) global peatland area, (b) global peatland carbon, and (c) global total peat carbon as defined in Sect. 2.2 under the SSP1–2.6 and SSP5–8.5 scenarios and under constant 1500 and 2014 forcing. SSP2–4.5 is not plotted to increase readability. Lines and shading for SSP1–2.6, SSP5–8.5, and constant 1500 forcing show ensemble medians and interquartile ranges respectively. The dashed vertical line indicates the year 2014. Note the change in the time axis after the year 2300.
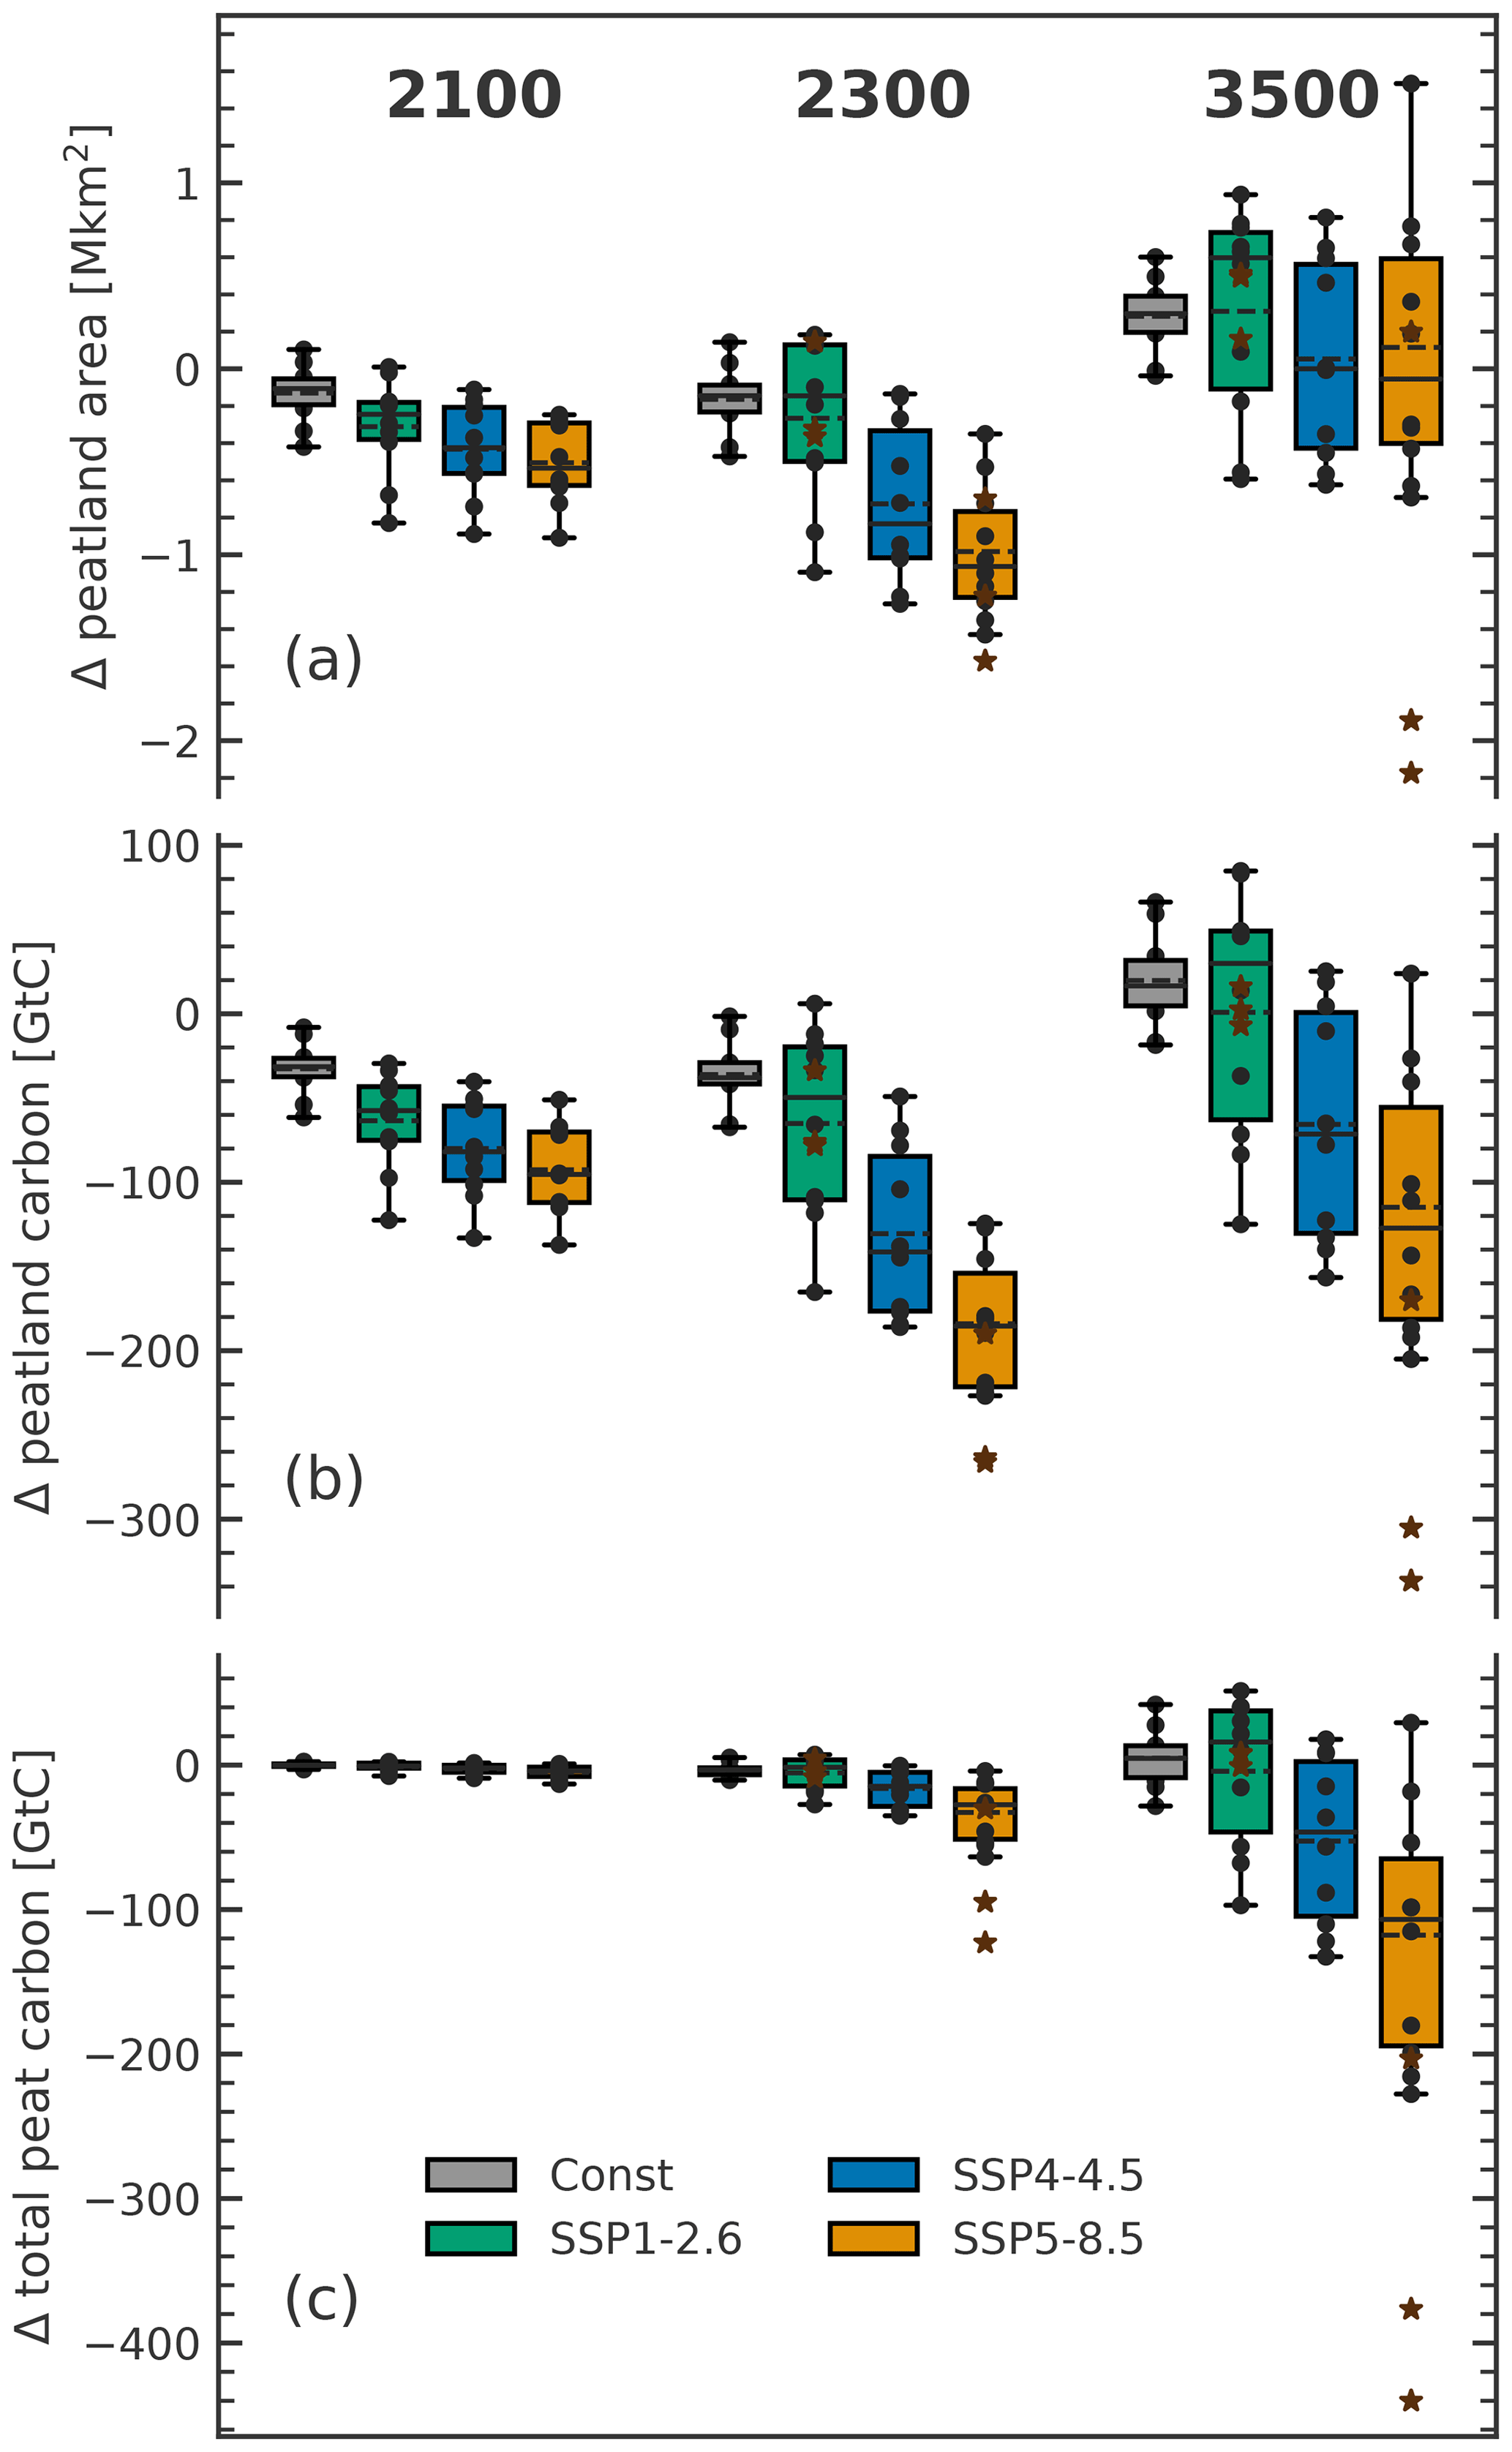
Figure 6Boxplots of anomalies in (a) global peatland area, (b) global peatland carbon, and (c) global total peat carbon as defined in Sect. 2.2 for simulations under three future scenarios and constant 2014 forcing. Black dots indicate the individual simulations forced with different climate model anomalies. Boxes indicate the interquartile range, whiskers the total range, solid lines the median, and dashed lines the mean. Brown stars indicate additional simulations forced with extended versions of scenario SSP1–2.6 and SSP5–8.5. Anomalies are calculated between 20-year averages (2091–2110, 2291–2310, and 3491–3510) and the reference period 1995–2014.
From 2100 to 2300, global peatland area, peatland carbon, and total peat carbon continue to decrease for scenarios SSP2–4.5 and SSP5–8.5 despite constant boundary conditions after 2100 (Table 2). Only under the strong-mitigation scenario SSP1–2.6 do most simulations show an increase in peatland area and partly in carbon compared to 2100. Medians are similar to the simulations under constant 2014 forcing. However, the uncertainty, represented by the spread between the simulations, is larger in the SSP scenarios than in the commitment simulations. This uncertainty increases with time for all scenarios.
Spatial anomaly patterns at 2300 for the strong-mitigation scenario SSP1–2.6 (Fig. 7) are similar to the committed changes (Fig. 4). The regions of peatland area loss are northeastern Canada, northern Europe, central Russia, and East Asia, and peatland area increases can be found in northwestern Canada, northeastern Asia, and Southeast Asia. Losses and gains are further amplified with respect to the committed changes. Thus, the increase in global area after 2100 in SSP1–2.6 is not due to a recovery of lost peatlands but rather due to a stronger increase of peat area in the regions of local peatland expansion.
The higher the scenario-based emissions are, the more extensive the regions of peatland area and carbon loss in the northern high latitudes become and the more reduced the regions of gains are. In the high-emission scenario SSP5–8.5, losses dominate most of the northern high latitudes (Fig. 8). Small regions of area gains remain in northeastern Asia but with weakened expansion compared to lower-emission scenarios. The northern peatland area is simulated to reduce by 18 %, 41 %, and up to 61 % until 2300 under SSP1–2.6, SSP2–4.5, and SSP5–8.5 respectively. These results suggest that large parts of today's northern peatlands might be at risk under future climate change. In the tropics, this trend is reversed, with area expansion in South America and Southeast Asia amplified under higher-emission scenarios. Although net area gains in the tropics are substantial, carbon anomalies remain small and at 2100 only positive for the strong-mitigation scenario, indicating a strong concurrent increase in heterotrophic respiration.
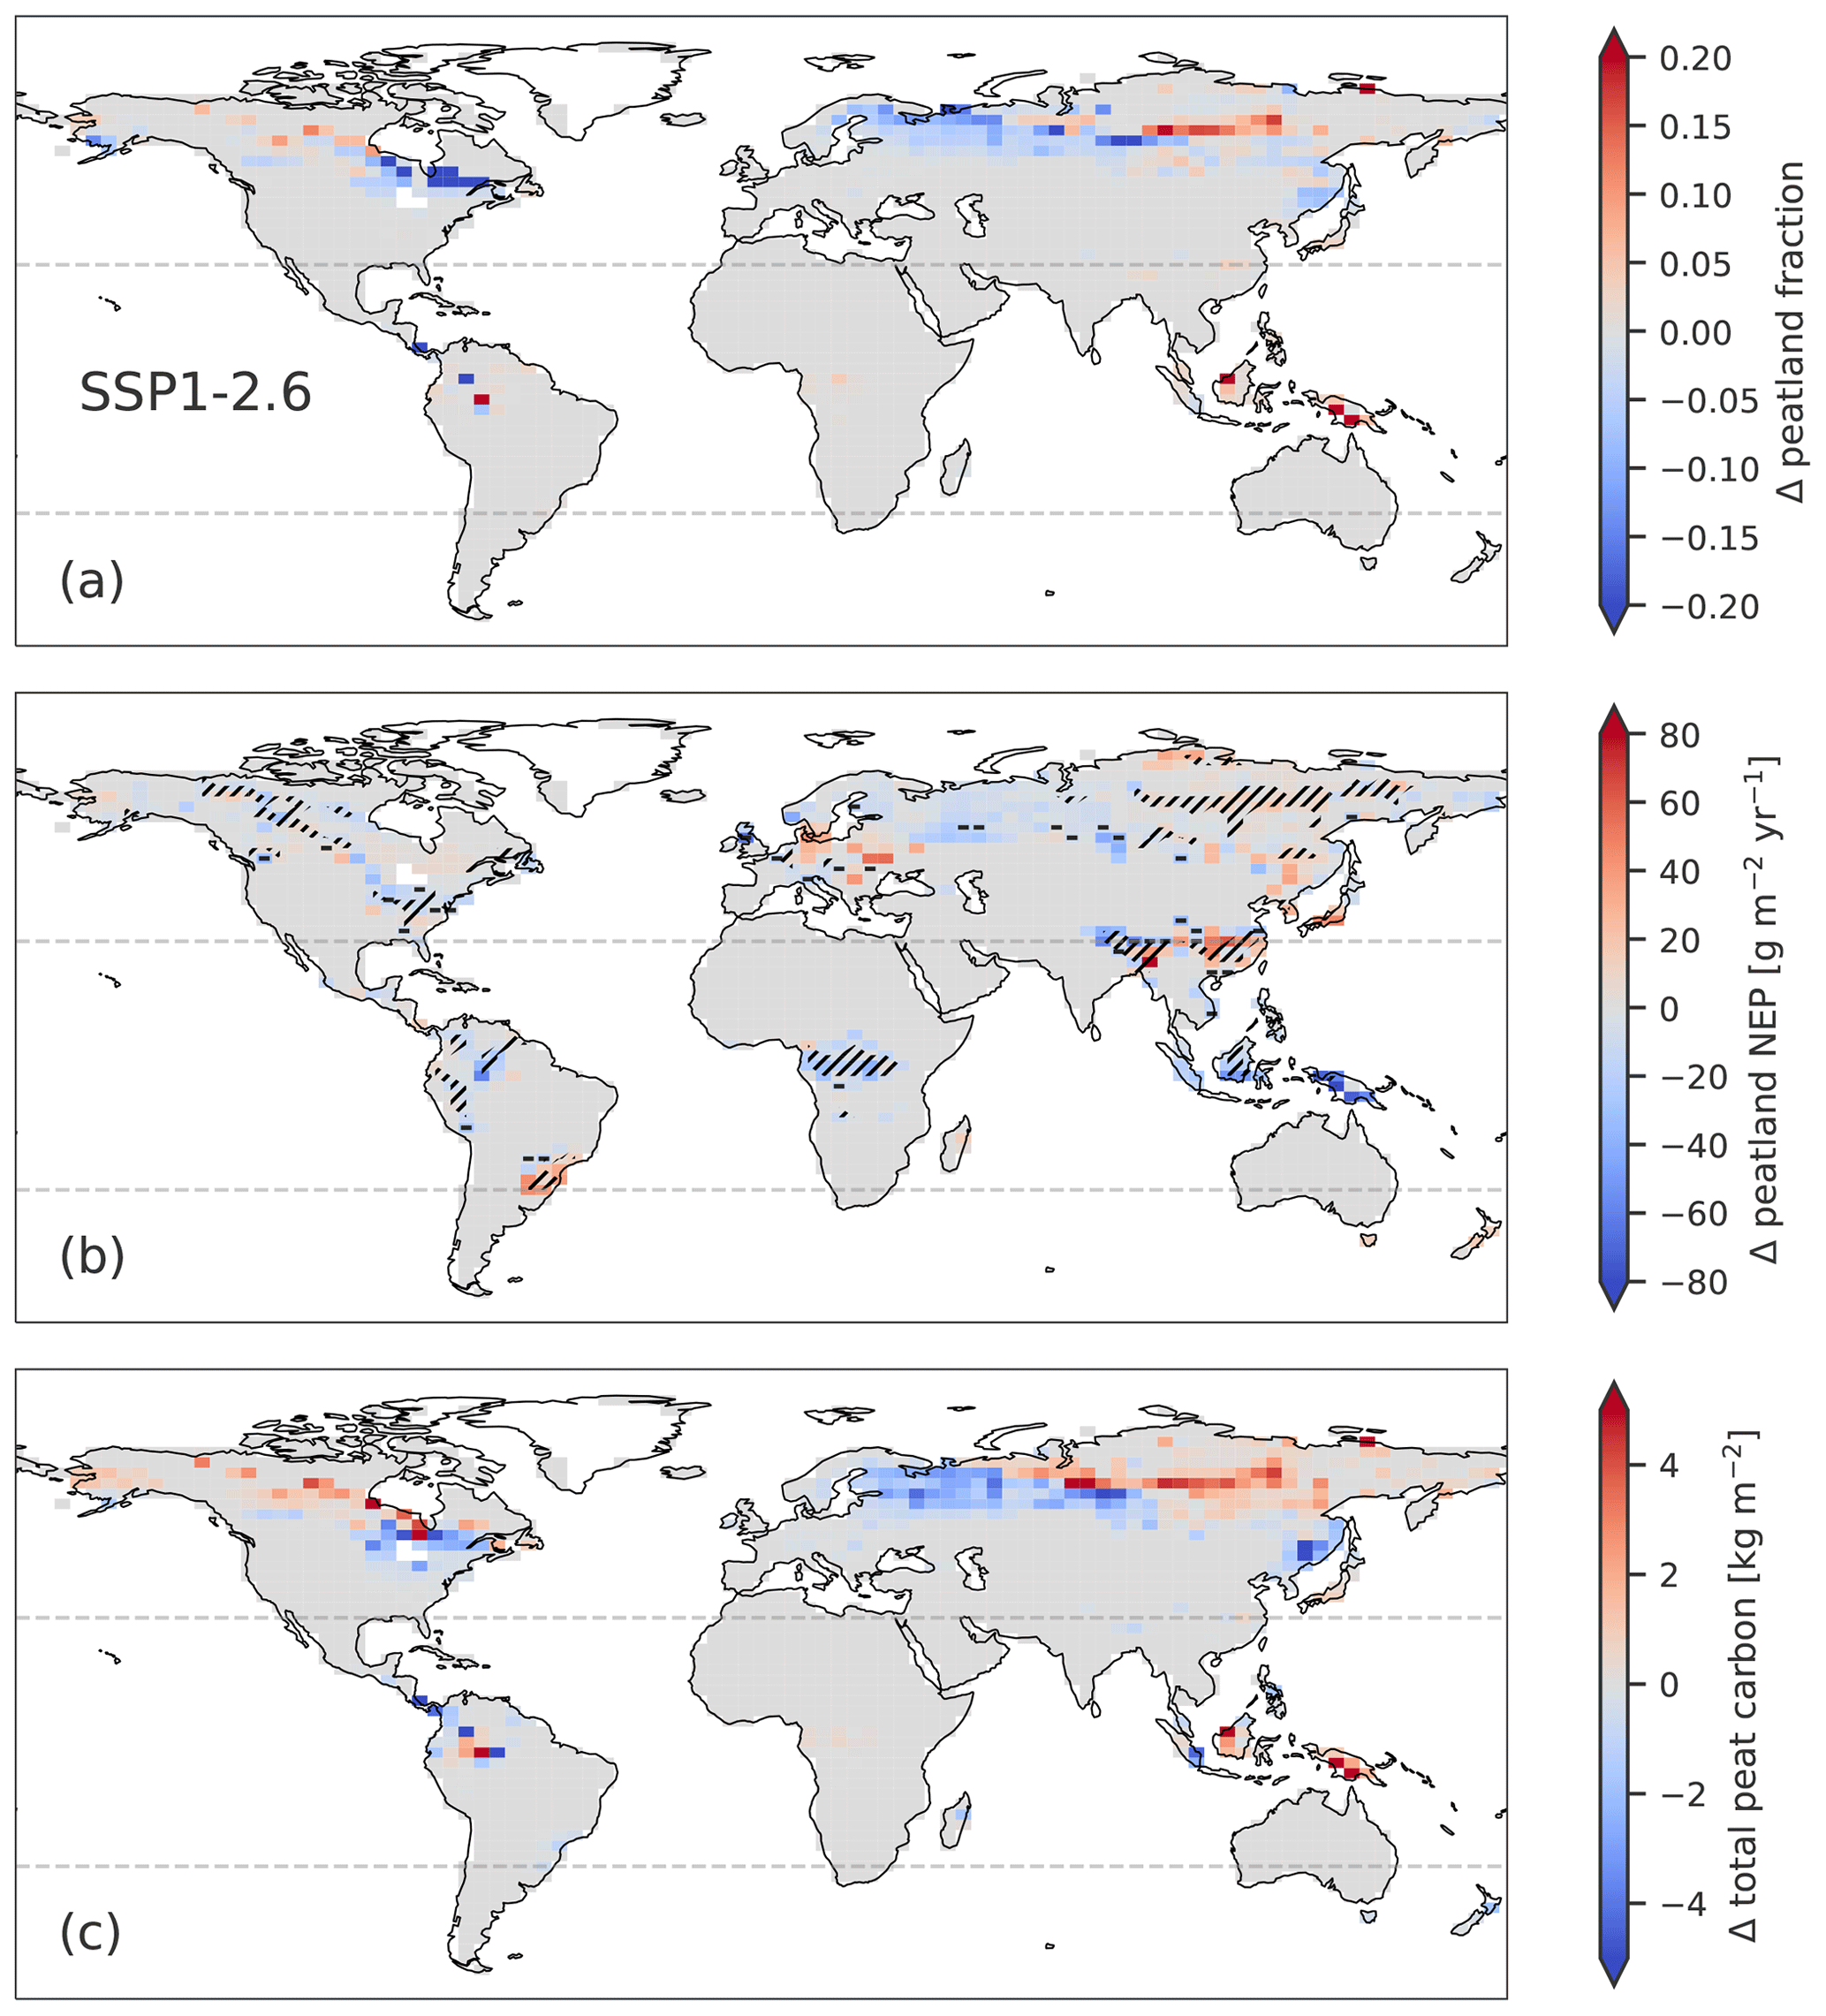
Figure 7Simulated median anomalies under the SSP1–2.6 scenario in the year 2300 in (a) peatland area fraction, (b) peatland NEP, and (c) total peat carbon as defined in Sect. 2.2. Anomalies are calculated between 20-year averages spanning 1995–2014 and 2291–2310. Grid cells where NEP becomes negative are marked with a minus. Hatched areas in panel (b) indicate a positive area anomaly, which in the model can lead to an increase in NEP through the dilution of soil carbon and a corresponding reduction in soil carbon respiration per area
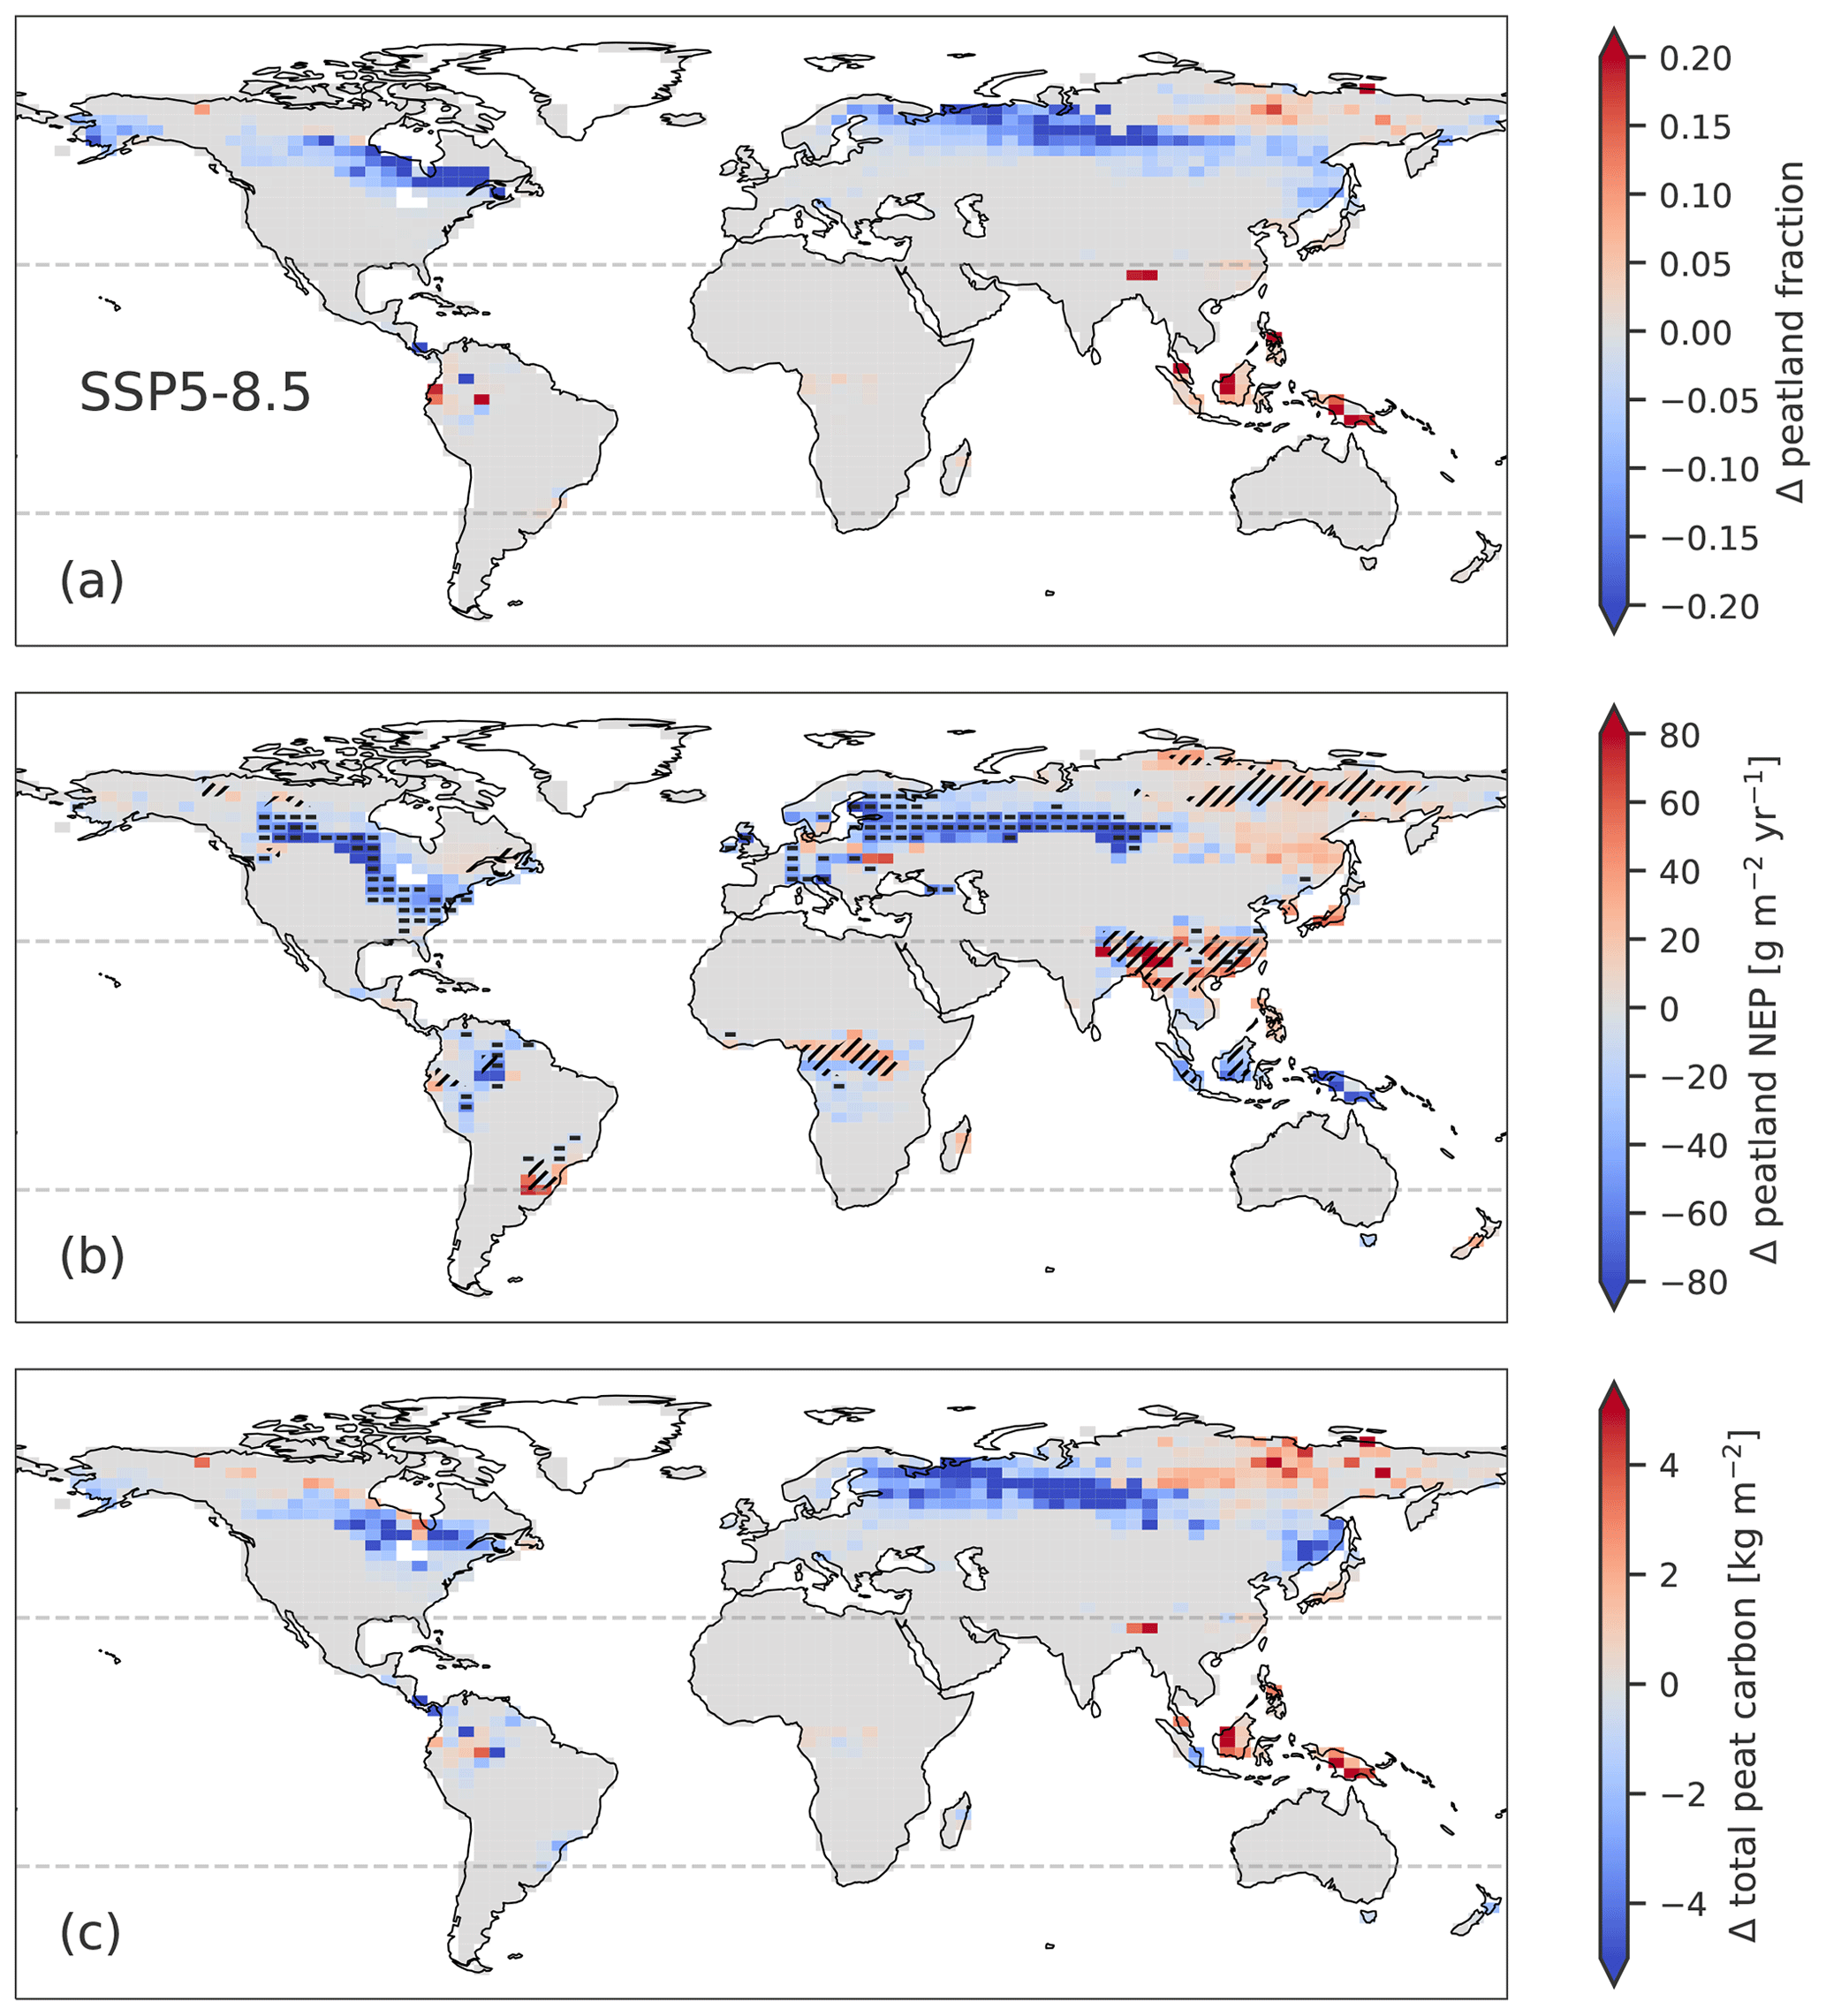
Figure 8As Fig. 7 but for the SSP5–8.5 scenario.
Taken together these results suggest a likely net loss of global peatland area as well as carbon until the end of the century, driven mostly by northern peatlands, even under the strongest mitigation scenario and continued net loss up to 2300 for the scenarios SSP2–4.5 and SSP5–8.5, with climate assumed to remain constant after 2100. This is in contrast to another recent modeling study investigating future northern peatland area and carbon dynamics. Qiu et al. (2020) used the ORCHIDEE-PEAT DGVM model, with similar TOPMODEL-driven peatland area dynamics as the LPX-Bern and forced by IPSL-CM5A-LR and GFDL-ESM2M model climate to simulate northern peatland dynamics from 1861–2099. They found a strong positive trend in northern peatland area and together with a sustained sink also in peatland carbon over the whole historical period and the two investigated scenarios RCP2.6 and RCP6.0. They identified the main driver of this trend as an internal feedback between grid cell water table position and peatland area, which is independent of the climate forcing. This feedback is also part of the LPX-Bern implementation; however, here it does not lead to a strong sustained historical or future increase in northern peatland area, illustrated by the relatively stable control simulation under constant 1500 boundary conditions (Fig. 5). On the contrary, here it amplifies the simulated negative trend (see Sect. 3.3). One of the main reasons for the different behaviors might be the spinup procedure, which is very different in both cases. Whereas Qiu et al. (2020) used an idealized spinup with constant climate conditions, the spinup in this study corresponds to a full transient simulation. Other factors could be the different parametrization and implementation details. Despite the differences in projected net peatland area trends, there are also regional agreements. Qiu et al. (2020) found central and northern Europe to be regions of future peatland loss, especially given the warmer IPSL-CM5A-LR forcing, and northeastern Asia to be a region of particularly strong peatland expansion, partly matching regional patterns presented here. For central Russia, the simulated dynamics partly agree with another modeling study. Alexandrov et al. (2016) projected the potential future peatland area in western Siberia using an impeded drainage model and MPI-ESM climate anomalies. They found a strong increase in potential area north of 60∘ N and a strong decrease south of 60∘ N. A similar response pattern can be found in the simulations forced with MPI-ESM1-2-LR climate anomalies and weaker also in the ensemble medians but only up to the SSP2–4.5 scenario, after which losses dominate over western Siberia.
Peatland area dynamics translate directly and indirectly into the simulated carbon dynamics. In the strong-mitigation scenario, the simulated net loss of northern peatland carbon and total peat carbon is mainly a result of the northern peatland dynamics rather than of declining carbon accumulation rates. Figure 7b shows that the net ecosystem production (NEP) of active peatlands, which represents the net carbon uptake from the atmosphere per year, changes only slightly until 2300, with decreases throughout the tropics and in parts of the northern latitudes. Regional increases in NEP are simulated in central and eastern Europe as well as East Asia. The same is true for the SSP2–4.5 scenario but with slightly larger decreases in the northern mid-latitudes. Under the high-emission scenario SSP5–8.5, simulated NEP decreases strongly in North America, Europe, and western Asia, with most mid- to high-latitude active peatlands turning from a carbon sink to a carbon source and thus contributing directly to the net carbon loss. Regionally NEP increases are simulated again mostly in East Asia, with larger increases compared to SSP1–2.6. (Fig. 8b). It has to be noted that in the case of regional peatland expansion NEP might increase independent of environmental drivers, simply due to the dilution of soil carbon. The results are in broad accordance with a previous study conducted with an older version of the LPX-Bern. Spahni et al. (2013) conducted transient northern peatland simulations from the LGM up to 2100 with prescribed peatland area using CMIP5 future climate anomalies together with the LPX-Bern version 1.0. They found mean northern peatland NEP to slightly decrease over time under the RCP2.6 scenario and strongly decrease under RCP8.5. Qiu et al. (2020), however, simulate net NEP of northern peatlands to increase slightly and peak mid-century before a decline back to roughly 2005 levels at 2099. Regionally, Qiu et al. (2020) project NEP to decline in western Canada, western Europe, and the China–Russia border, especially under the RCP6.0 scenario, but only matching western Canada as a region of NEP decline simulated by LPX-Bern. In both models, northern peatland productivity and soil carbon respiration increase concurrently but balance slightly differently. Chaudhary et al. (2020) investigated past and future carbon accumulation rates (CARs) of northern-high-latitude peatlands up to 2100 using a dynamic vegetation model and similarly found net increases in simulated CARs until the mid-century and declining rates thereafter, which are most pronounced under the RCP8.5 scenario. They found Siberian and highest-latitude peatlands to potentially increase their CARs, whereas northern European and North American mid-latitude peatlands were most vulnerable to carbon sink decreases or even carbon loss, roughly matching regions of NEP increases and decreases simulated by LPX-Bern. Gallego-Sala et al. (2018) used data-derived relationships between CARs and climate variables for global future projections. They found a latitude-dependent response, with CARs increasing continuously until 2300 in high latitudes and decreasing in low latitudes. Under a high-emission scenario, CARs switched in mid-latitudes from an increasing to a decreasing trend with rising temperatures. Changes in peatland NEP simulated by LPX-Bern have a less-latitude-dependent pattern but also project carbon uptake to decrease most strongly in the tropics and large parts of the mid-latitudes, with widespread switching to net carbon sources. Large increases in the northern-high-latitude peatland NEP, however, are only simulated in East Asia and parts of eastern Europe.
3.2.2 After 2300
The continuation of the simulations for several millennia under constant boundary conditions reveals the delayed long-term responses of peatlands to the previous changes in forcing. Similar to the committed changes, the future scenarios see a delayed rapid expansion in global peatland area between about 2700 and 3500 CE (Figs. 5, 6, and Table 2). Regionally this expansion is dominated by new peatlands in tropical South Asia, with smaller contributions in the highest northern latitudes and Africa. The expansion in South Asia increases in magnitude under increasing emission scenarios. This leads to a large overlap between the uncertainty ranges of the different scenarios after 3500. The median of global peatland area anomaly in 2300, however, is substantially higher for SSP1–2.6 than for the other scenarios and for constant 2014 climate. Medians of global peatland area in the higher-emission scenarios SSP2–4.5 and SSP5–8.5 remain below the levels given by 2014 boundary conditions for the whole time of the simulation, despite the large delayed expansion.
Carbon storage in old and new active peatlands increases continuously after 2300, with similar rates for all scenarios, preserving the large differences in total peatland carbon stocks formed in previous centuries. The peatland expansion after about 2700 also results in a trend reversal in total peat carbon which continues to increase thereafter. Rates of global carbon sequestration are larger than rates under constant 1500 or 2014 conditions, which are most pronounced in the SSP1–2.6 scenario. Towards the end of the simulation, total peat carbon storage in SSP1–2.6 exceeds carbon stocks under constant 1500 conditions. This reflects higher mean productivity of the remaining and newly formed peatlands under moderately warmer and wetter conditions and with a higher atmospheric CO2 concentration.
Taken together, the long-term response of global peatlands to future climate change suggests that under strongly limited future climate change and after negative effects dominating over centuries, potential global peatland area and peat carbon could increase compared to today and even compared to pre-industrial levels on a millennial timescale. Higher-emission scenarios, however, show a negative effect on global peatland area and a reduced peat carbon storage potential persisting for millennia compared to constant 2014 conditions. Uncertainties towards the end of the simulations, indicated by the ensemble spread, however, become very large.
3.2.3 Extended scenarios
The assumption of stable climate and atmospheric CO2 levels over millennia after 2100 is a highly idealized one and not suited for predictions. The extended simulations are rather intended to reveal delayed responses and long-lasting effects in the slow-reacting peatland system. Depending on the future emission pathway, global temperature and atmospheric CO2 are expected to either decline, stabilize, or dramatically increase beyond 2100 (see Sect. 3.2.3). Continued ocean and land uptake of CO2 and heat will shape the future climate, sea level, and atmosphere for centuries to millennia after greenhouse gas emissions stop (Frölicher and Joos, 2010; Zickfeld et al., 2013; Frölicher et al., 2014; Clark et al., 2016). Additionally, possible tipping points in the earth system could abruptly change the trajectory of the climate system (Lenton et al., 2008). Learning about the long-term responses to disturbances of key parts of the climate system, such as peatlands and their large carbon stocks, is an important part of understanding future earth system responses as a whole.
To additionally investigate the effect of transient boundary conditions from 2100 to 2300, additional simulations were performed for 3 of the 10 ensemble models that provided climate output for the extended scenarios SSP1–2.6 and SSP5–8.5 (see Sect. 2). Results are compared to simulations with standard scenarios in Figs. 9 and 6. For the extended SSP1–2.6 scenario, global mean temperatures begin to decline again after peaking at about 2100 together with atmospheric CO2 concentrations (Fig. S1). This leads to a weakening of the long-term peatland response compared to constant 2100 conditions in all three simulations. Simulations forced with climate anomalies from the IPSL and CanESM models, with relatively large climate sensitivities, show negative global peatland area and carbon variable anomalies up to 2100. After 2100, the extended scenario mitigates the external pressure, and long-term losses in peatland area and carbon are lower than under continued 2100 conditions. The simulation forced with MRI climate anomalies, with a relatively small climate sensitivity, on the other hand, sees a positive global peatland area anomaly at 2100 and thus shows less global peatland area and long-term peatland carbon storage under the extended scenario, compared to constant 2100 conditions.
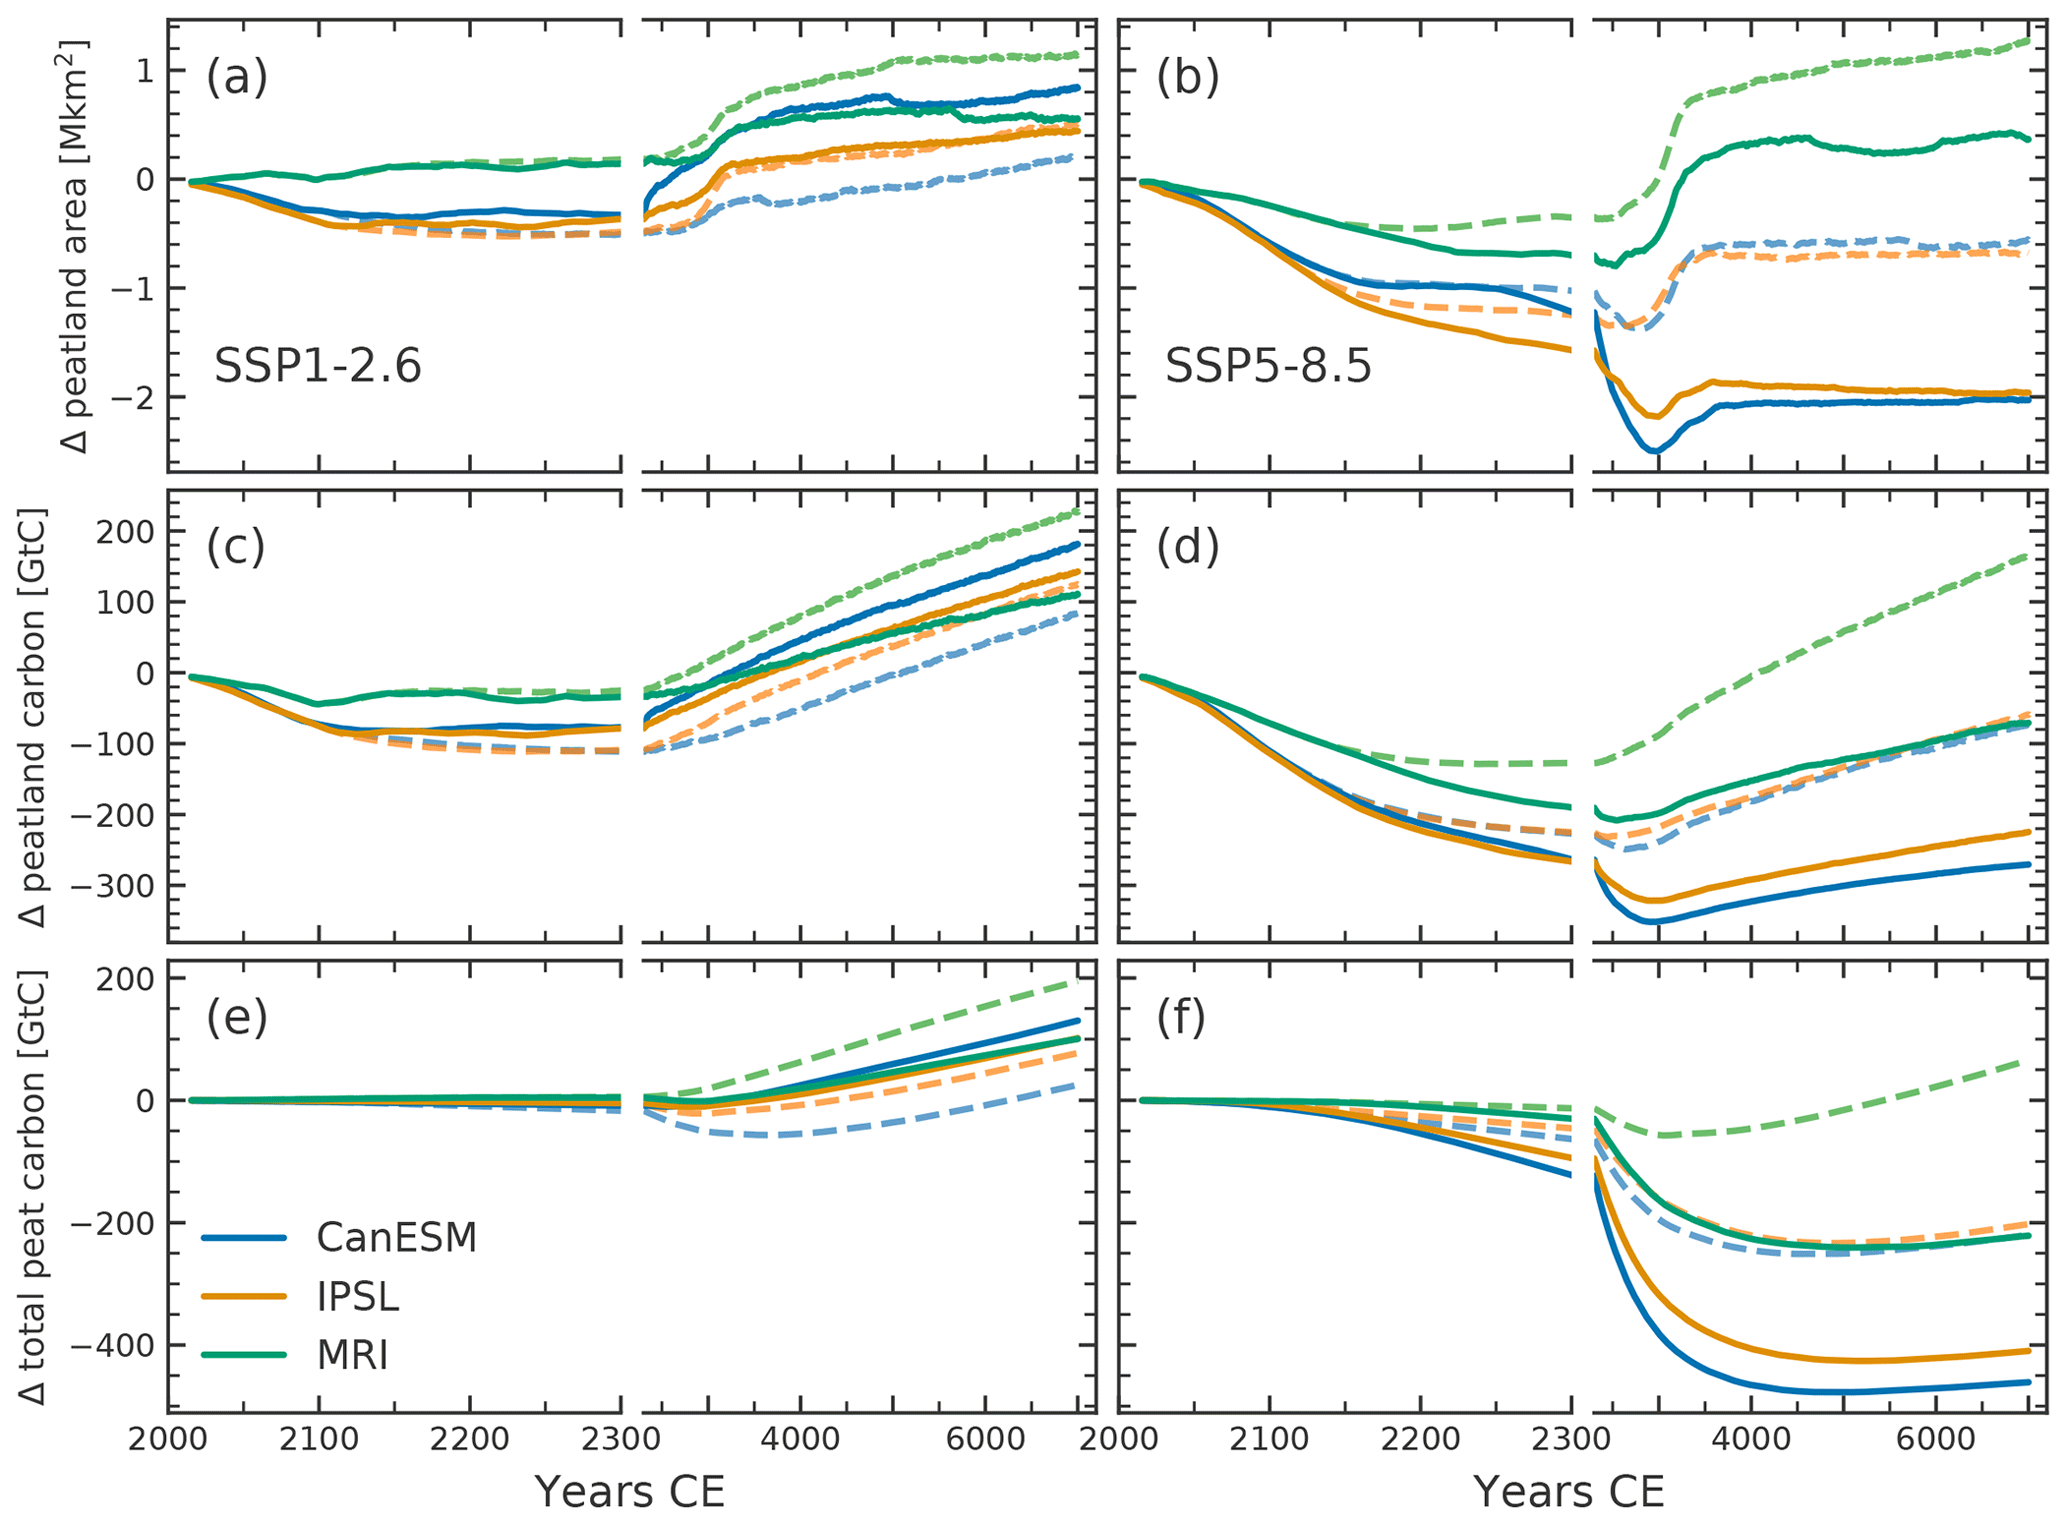
Figure 9Simulated anomalies of (a–b) global peatland area, (c–d) global peatland carbon, and (e–f) global total peat carbon as defined in Sect. 2.2 for three models providing output for the extended future scenarios SSP1–2.6 (a, c, e) and SSP5–8.5 (b, d, f). Solid lines show simulations with extended scenario forcing, evolving transiently until 2300. Dashed lines show simulations with standard scenario forcing, transient only until 2100. Note the change in the time axis after the year 2300
The extended SSP5–8.5 scenario forces global temperatures and atmospheric CO2 to increase drastically until 2300 (Fig. S2). Mean global temperatures over land reach 24–34 ∘C at 2300 with an atmospheric CO2 concentration of 2162 ppm. Under these extreme conditions all simulations show a reduction in global peatland area and carbon compared to constant 2100 conditions. The simulations forced with the IPSL and CanESM models lose practically all high- and mid-latitude peatlands as well as the Amazon basin complex until the end of the simulation. This results in a peatland carbon and total peat carbon reduction of about 50 %–60 %. Old and newly established peatlands that remain until the end of the simulations are mostly located in tropical South Asia, Southeast Asia, and coastal regions of South America. The responses in the simulation forced with climate anomalies from the less sensitive MRI model are less extreme but also show a significant reduction in global peatland area and carbon compared to constant 2100 conditions.
The models that provided the extended scenario output are not representative of the ensemble or the full CMIP6 ensemble as a whole. The additional simulations, however, make clear, that the consideration of transient climate after 2100 can change simulated long-term peatland responses strongly, depending on the emission pathway. If the discussed differences in the peatland response to constant and transient forcing after 2100 are similar for all climate models, assumptions can be made about how the ensemble results would change in the case of transient climate until 2300. Transiently extending SSP1–2.6 would likely lead to an overall weaker peatland response, leading to a reduced model spread and less peat carbon loss in the ensemble median. For the SSP5–8.5 we would expect a larger loss of peatland area and carbon over the whole ensemble, shifting medians to larger negative anomalies. As the end of the 21st century approaches steadily, the main focus of future projections and climate policy remains on the next few decades up to 2100. To better understand the long-term effects of past and future emissions on global peatlands and to assess their potentially large feedbacks on future climate, the horizon of the future must be expanded beyond 2100. Scenarios extended to 2300 should be elevated to standard practice for future climate projections.
3.3 Driver contributions
A factorial analysis was used to attribute the positive and negative changes in peatland variables to individual forcing drivers (see Sect. 2.4). Figure 10 shows the calculated mean driver contributions to the global gross positive and negative anomalies in peatland area, peatland carbon, and total peat carbon.
Increases in peatland area up to 2300, both in the high and low latitudes, are driven mostly by committed changes (constant 2014 conditions) and an increase in regional precipitation. In northern permafrost regions, this is further strengthened given strong mitigation and moderately rising temperatures resulting in longer growing seasons and larger water retention (Fig. A1). Suggested pathways of permafrost peatlands after thaw are still debated but include rapid degradation (Avis et al., 2011; Turetsky et al., 2020), collapse followed by long-term recovery (Jones et al., 2017; Magnússon et al., 2020; Swindles et al., 2015), and increased carbon accumulation (Estop-Aragonés et al., 2018), depending on multiple factors such as thaw velocity and local hydrology.
Simulated peatland area losses are driven mostly by committed changes and increasing temperatures. Higher temperatures lead to an increase in evapotranspiration, especially in boreal peatlands (Helbig et al., 2020b), and thus a decrease in the regional water balance which is not compensated for despite a potential concurrent increase in annual precipitation. This corresponds to the already observed decade-to-century-long drying trends in northern Europe (Swindles et al., 2019; Zhang et al., 2020) and eastern Canada peatlands (Pellerin and Lavoie, 2003; Pinceloup et al., 2020; Beauregard et al., 2020), regions of large simulated committed area loss, which is found to result in negative effects on carbon accumulation rates and strong trends of woody encroachment. These trends are expected to continue and amplify under future climate change.
In the LPX-Bern, a decreasing water balance can lead to a positive feedback on the retreating water table. A long-term drawdown of the mean grid cell water table leads to a reduction in peatland area, which in turn reduces the mean grid cell water table further. In some cases, this can lead to a much larger reduction in peatland area than would be the result of the initial disturbance. In reality a lot of complex and often still poorly understood both positive and negative hydrological feedbacks control the peatland water table position in response to disturbances (Morris et al., 2011; Waddington et al., 2015). The simplified structure of DGVMs like the LPX-Bern cannot mirror these complex interactions, and thus this strong internal feedback needs to be interpreted with caution. However, although peatlands, in some cases, have been found to be relatively resilient with respect to limited disturbances (Cole et al., 2015; Swindles et al., 2016; Page and Baird, 2016), there could be possible tipping points that could lead to fast vegetation and ecosystem transitions under strong persisting disturbance (Eppinga et al., 2009; Heijmans et al., 2013; Page and Baird, 2016).
Peatland carbon and total peat carbon dynamics up to 2300 are dominated by committed and temperature-driven losses. The decline in peatland area directly reduces global peatland carbon and indirectly affects the total peat carbon balance by reducing overall accumulation. At the same time, global decay in active as well as in former peatlands is increased by the higher temperatures. Peatland NEP in the northern high latitudes is also driven in large parts by committed changes and increasing temperatures which can both increase or decrease NEP given the balance between respiration and productivity and their effect on permafrost (Figs. A1 and A2). Increasing CO2, precipitation, and non-linear interactions between the drivers have strong positive effects on NEP in East Asia. In the tropics, the negative trend in NEP is mostly driven by the higher temperatures and non-linear effects.
Up to 2300, land-use change and atmospheric CO2 have a comparatively small impact on the global scale. Increasing CO2 concentrations have a positive effect on carbon accumulation which is progressively larger with increasing emission scenarios. This also translates into a moderate peatland area gain at 2300. Effects of land-use change are negative for all peatland variables but remain small. One reason for this small impact might be that only net land-use area increases are considered to affect peatlands in the model. The global net increase in land-use area, however, is much smaller in the future scenarios, than for the historical period (Sect. 2.6). Especially in regions where peatlands are directly targeted for land-use conversion, such as in Indonesia (Dommain et al., 2018; Hoyt et al., 2020), our approach might significantly underestimate the negative effect of land-use change.

Figure 10Mean driver contributions to gross positive and negative anomalies since 2014 in (a) global peatland area, (b) global peatland carbon, and (c) global total peat carbon as defined in Sect. 2.2. Anomalies for all three future scenarios are with respect to 2014. Committed driving contributions can decrease, i.e., switching from driving to dampening, if the anomaly in the respective grid cell changes sign under the different scenarios
The late expansion after 2300 is driven by peatlands newly establishing in model grid cells with no previous peatland presence. In some grid cells, the historical and future climate change and atmospheric CO2 rise lead to the fulfillment of criteria for peatland establishment, targeting the peatland water and carbon balance. The more the boundary conditions change under future scenarios, the more grid cells, especially in the tropics, become able to support peatlands (see Sect. 3.2.2). Initiation of new peatlands in the tropics is mostly driven by CO2 fertilization nudging the carbon balance over the initiation thresholds (Fig. A3). In northeastern Asia, the temperature rise is the most prominent initiation driver, whereas in northwestern Canada mostly precipitation increases drive the initiation of new peatlands. In the model, newly established peatlands start from a small seed, and their growth is restricted to 1 % of their size per year. They thus reach noticeable size only centuries after their initial establishment. Outside of the model world, the speed of lateral expansion of growing peatlands depends on multiple factors, including local topography, hydrology, and peatland type (Charman, 2002; Ruppel et al., 2013). Topography can constrain lateral expansion velocities. Depending on terrain slopes, peat accumulation can be limited to a small area or depression for centuries to millennia until the peat column grows tall enough or expand quickly over a flat plain (Bauer et al., 2003; Loisel et al., 2013; Broothaerts et al., 2014; Le Stum-Boivin et al., 2019). This heterogeneity and complexity in lateral expansion of newly established peatlands is not represented by the model used here. The magnitude and timing of the simulated late expansion should therefore be taken with care. However, the results suggest that historical and future climate change might create the potential for newly forming peatlands in regions where conditions have been mostly unsuitable before.
3.4 Climate forcing uncertainty
The spread between simulations forced with climate anomalies from the different CMIP6 climate models indicates a large climate-anomaly-related uncertainty in simulated peatland variables. This is in line with previous studies that also found a large uncertainty propagation from climate variables to peatland and carbon cycle variables in general (Stocker et al., 2013; Ahlström et al., 2017; Qiu et al., 2020; Müller and Joos, 2020).
The magnitude of uncertainties is regionally different, with large uncertainties in the northern high latitudes for peatland area (Fig. S3) and total peat carbon (Fig. S4) and in the mid-latitudes for peatland NEP (Fig. S5). The climate variables driving the uncertainty depend on the region and peatland variable in question. Linear regressions for each grid cell were used to investigate how the differences between the model climate anomalies translate to the simulated peatland variables. Differences in northern-high-latitude peatland area between simulations were found to be dominantly a factor of climate model temperature. Warmer anomalies resulted in less peatland area in most grid cells, except for northeastern Asia, where warmer temperatures facilitate peat expansion in some grid cells (Fig. S3). In the tropics, the difference in precipitation is the best predictor for most grid cells, with anomalies from wetter models resulting in larger peatlands. Total peat carbon, determined by the balance between total accumulation and total decay of peat carbon, shows a similar regional pattern (Fig. S4). Northern-high- and mid-latitude peat carbon is reduced with higher temperature anomalies as the area for accumulation declines and heterotrophic respiration increases. In the tropics precipitation remains the dominant predictor, increasing the accumulation area and limiting respiration. For peatland NEP, precipitation minus evapotranspiration, as a measure of the moisture balance, resulted in a larger number of grid cells with significant (regression p value <0.05) results compared to temperature or precipitation alone (Fig. S5). Climate models resulting in a more positive water balance mostly also resulted in a higher peatland NEP due to the controls of peatland water table depth on both productivity and respiration. In permafrost regions, also temperature on its own is a strong positive factor for simulated peatland NEP.
The results show that the differences in peatland responses to different climate forcings can be explained mostly by the same drivers and mechanisms as the transient changes (discussed in Sect. 3.3). They also reveal the large dependence of peatland and carbon cycle projections on key properties of climate models. Further constraining model climate sensitivity is thus essential to reduce uncertainty in carbon cycle projections. Here the climate model ensemble subset was selected to best represent the full CMIP6 ensemble and with this the fullest possible range of projections. However, model performance compared to different targets is highly variable (Harrison et al., 2014), and different ensemble subset selections or weighted ensemble medians might be preferable in future work, depending on the focus.
The simulations presented here are also subject to other large but less quantifiable uncertainties. Keeping the forcing constant after 2100 or 2300 is an idealization with true climate dynamics depending on highly uncertain factors such as future social and economic dynamics and potential tipping points. Structural and parameter uncertainties, not only in the peat module, but through all components of the model, are unavoidable in simplified global models such as the LPX-Bern, especially on regional and local scales. Implementation of peatlands in DGVMs is still in its early stages, and comprehensive model comparison and structural uncertainty evaluation are still mostly lacking. With the inclusion of peatlands into more and more DGVMs and earth system models, comparative studies might identify the most promising model developments and thus pave the way for more robust peatland and carbon cycle projections.
The dynamic global vegetation model LPX-Bern was used to estimate committed and projected mid- to long-term future changes in global peatland area and carbon under three different climate and land-use scenarios. A previously published transient simulation from the Last Glacial Maximum to the present (Müller and Joos, 2020) was used as the starting point for the future projections, accounting for the transient history and potential legacy effects of today's and former peatlands. LPX-Bern was forced by climate anomalies from 10 different CMIP6 earth system models, selected to optimally represent the full CMIP6 ensemble range. Peat carbon dynamics were analyzed for carbon in active peatlands (peatland carbon) and peat carbon in all land classes including former peatlands (total peat carbon), representing two land–atmosphere interaction bounding cases.
Averaged over 1995–2014, median global peatland area, peatland carbon, and total peat carbon are simulated to be 3.7 Mkm2, 423 GtC, and 611 GtC respectively. This puts the modeled peatlands within the range of literature estimates but with a heavier weight on tropical peatlands than most estimates suggest. Simulations with constant 2014 boundary conditions revealed committed losses of northern peatland area (median: −8 %) and peatland carbon (median: −10 %) until the end of the century and beyond, with losses in Europe and eastern Canada partly compensated for by peatland area expansion in eastern Asia, the western part of North America, and the tropics. These results suggest that past climate and land-use change has already led to regional changes in the environmental conditions that put a large part of today's northern peatlands at risk while potentially improving conditions for others. With higher-emission scenarios, global net losses in peatland area and carbon are increased with increases in losses in the northern latitudes and increasing gains in the tropics. Under the SSP1–2.6, SSP2–4.5, and SSP5–8.5 scenario, assuming constant climate, CO2, and land-use forcing after 2100, the northern peatland area is simulated to decrease by a median of −18 %, −41 %, and −61 % until 2300 respectively, with concomitant decreases in northern peatland carbon (−18 %, −47 %, and −65 %) and total peat carbon (−1 %, −3 %, and −7 %). These results illustrate the extent to which today's northern peatlands and their large carbon stocks are at risk from future climate change. Estimated peat carbon loss here depends on the assumed emission bounding case and could be large if the carbon is quickly released to the atmosphere (peatland carbon) or moderate to small if the carbon decays only slowly after ecosystem transformation (total peat carbon). To reduce this persisting uncertainty, additional research focus on the fate of carbon in former peatlands is needed, leading to dedicated model parameterizations for this carbon pool. In our simulations, higher future emissions are clearly tied to a larger potential loss of peatland area and carbon, highlighting the role of fast emission reduction for peatland protection. While direct human disturbances of peatlands through drainage and land-use conversion can be partly mitigated by prompt peatland restoration and legal protection, indirect disturbances from anthropogenic climate change can only be limited by drastically cutting future emissions.
All simulations showed delayed peatland responses beyond 2300 under constant climate and environmental forcing, most notably a delayed peatland expansion in grid cells with no prior peatland presence. This delayed peatland expansion is especially pronounced in the tropics and the highest northern latitudes. Although the timing and magnitude of this expansion are most likely strongly model dependent, it illustrates the potential for new peat initiation in regions that were formerly unsuited for peat development. Towards the end of the simulations, medians for simulated global peatland area, peatland carbon, and total peat carbon in the strong-mitigation scenario exceed the ones of the 1500 and 2014 commitment simulations. The millennial-scale potential for global peatland area and peat carbon storage is thus simulated to be larger under strongly mitigated climate change than under pre-industrial or present-day conditions. This potential, however, is only realized after centuries to millennia of dominating negative effects, with large permanent losses of northern peatland area, peat carbon, and ecosystem services provided by them. For the higher-emission scenarios, globally aggregated negative changes in area and carbon persist until the end of the simulation.
Additional simulations with extended SSP scenario climate forcing from three different climate models showed that continuing transient forcing along a scenario trajectory can substantially change the simulated results. Extending the SSP1–2.6 scenario to 2300 with global temperature anomalies decreasing again after 2100 led to a reduction in the response, positive or negative, relative to the standard scenario. The extension of SSP5–8.5 on the other hand leads to a drastically increased loss of peatland area and carbon due to the extreme increases in mean global temperature until 2300. Assuming similar results when extended scenarios would be used for the whole ensemble, model spread and median peat carbon loss are expected to be smaller under SSP1–2.6, and median loss of peatland area and carbon is expected to be substantially larger under SSP5–8.5. These results highlight the importance of extended emission pathways to project long-term effects of anthropogenic climate change not only on peatlands but on the carbon cycle and the climate system as a whole. As the current century grows shorter the next phase of CMIP should aim to extend projections beyond the end of the century as a standard practice.
Driver contributions to future changes were analyzed using factorial simulations. Besides committed changes, increasing temperature was identified as the main driver of peatland area and carbon losses, and increasing precipitation was identified as the main driver of gains. After 2300, influences of CO2 and non-linear interactions on peat initiation become more apparent, when peatland area begins to expand more widely. Cloud cover was found to have only small influences on global peatland variables. Future changes in the net area under land use are small (<11 %) in the scenarios compared to the historical changes and have a small impact on global peatlands in our simulations. Here a simplified assumption was taken, with peatlands being affected by land-use change proportional to their size. However, this might not be the case if peatlands are directly targeted for conversion to land-use areas. Future studies might try to integrate specific peatland–land-use conversion scenarios to better quantify the effect of potential future land-use conversion within a global modeling framework.
The spread between the simulations forced with different climate anomalies from the 10 ensemble climate models reveals that a large uncertainty is propagated from the climate anomalies to the global peatland and carbon cycle variables. Depending on the region, uncertainty was propagated mostly by temperature, precipitation, or a combination of both. The uncertainty increases with time even after climate forcing is kept constant due to the long response timescales important for peatlands. Even in the case of the 2014 commitment simulations, which only see 40 years of slightly diverging climate anomalies, uncertainties grow large over time. This shows that small differences in climate forcing can propagate to large long-term differences in peatland and carbon cycle variables. In future studies, uncertainties could be reduced by including a skill criterion into the climate model ensemble selection or the subsequent ensemble analysis. Structural model uncertainties are harder to quantify but could potentially be equally large. A focus of future work must be to quantify these structural uncertainties in peatland model intercomparison projects and continue model development towards simple but robust formulations for dynamic peatlands on a global scale. Given the large and diverse uncertainties involved, the results presented here should be interpreted as a model analysis of potential risks, their transient evolution, environmental drivers, and uncertainties rather than as robust predictions.
The climate and the terrestrial carbon cycle in the simulations presented in this study are uncoupled. The results, however, suggest potentially large feedbacks between the simulated changes in global peatlands and the global carbon cycle and climate system. Carbon released to the atmosphere would additionally warm the climate, leading to a positive feedback. Every 100 GtC released from peatlands would cause a warming of about 0.2 ∘C (Allen et al., 2009). Other feedbacks not considered here include changes in the methane source, surface energy balance, and surface albedo. Changing surface albedo and energy balance might lead to warming given a transition from moss-dominated boreal peatlands to a dense forest (Helbig et al., 2020a), but it is strongly dependent on the actual vegetation succession. Decreasing methane emissions from reduced northern peatlands could be compensated for or even superseded by increased emissions from expanding tropical peatlands. In addition, methane emissions increase with temperature (Turetsky et al., 2014). The sign of the methane feedback, therefore, is dependent on multiple factors. The absence of these potentially important feedbacks between peatlands and the climate system in the state-of-the-art future projections such as produced by the CMIP is a potential limit to formulating adequate climate policy. Future work should focus on the production of fully coupled peatland–climate simulations to assess the magnitude of the potential feedbacks, as well as the integration of peatland modules into the next generation of earth system and integrated assessment models (Loisel et al., 2021).
Taken together our study provides long-term future projections of global peatland area and carbon, based on a transient spinup since the Last Glacial Maximum, and accompanied by an in-depth analysis of future scenarios, drivers, and uncertainties. It suggests that large parts of northern peatlands are at risk of both committed and future climate change and highlights the need for strong-mitigation and protection efforts. The large uncertainties found call for continued model development and refinement. The long response timescales and potentially large climate feedbacks of peatlands stress the need for century-to-millennial-scale coupled climate–peatland simulations.
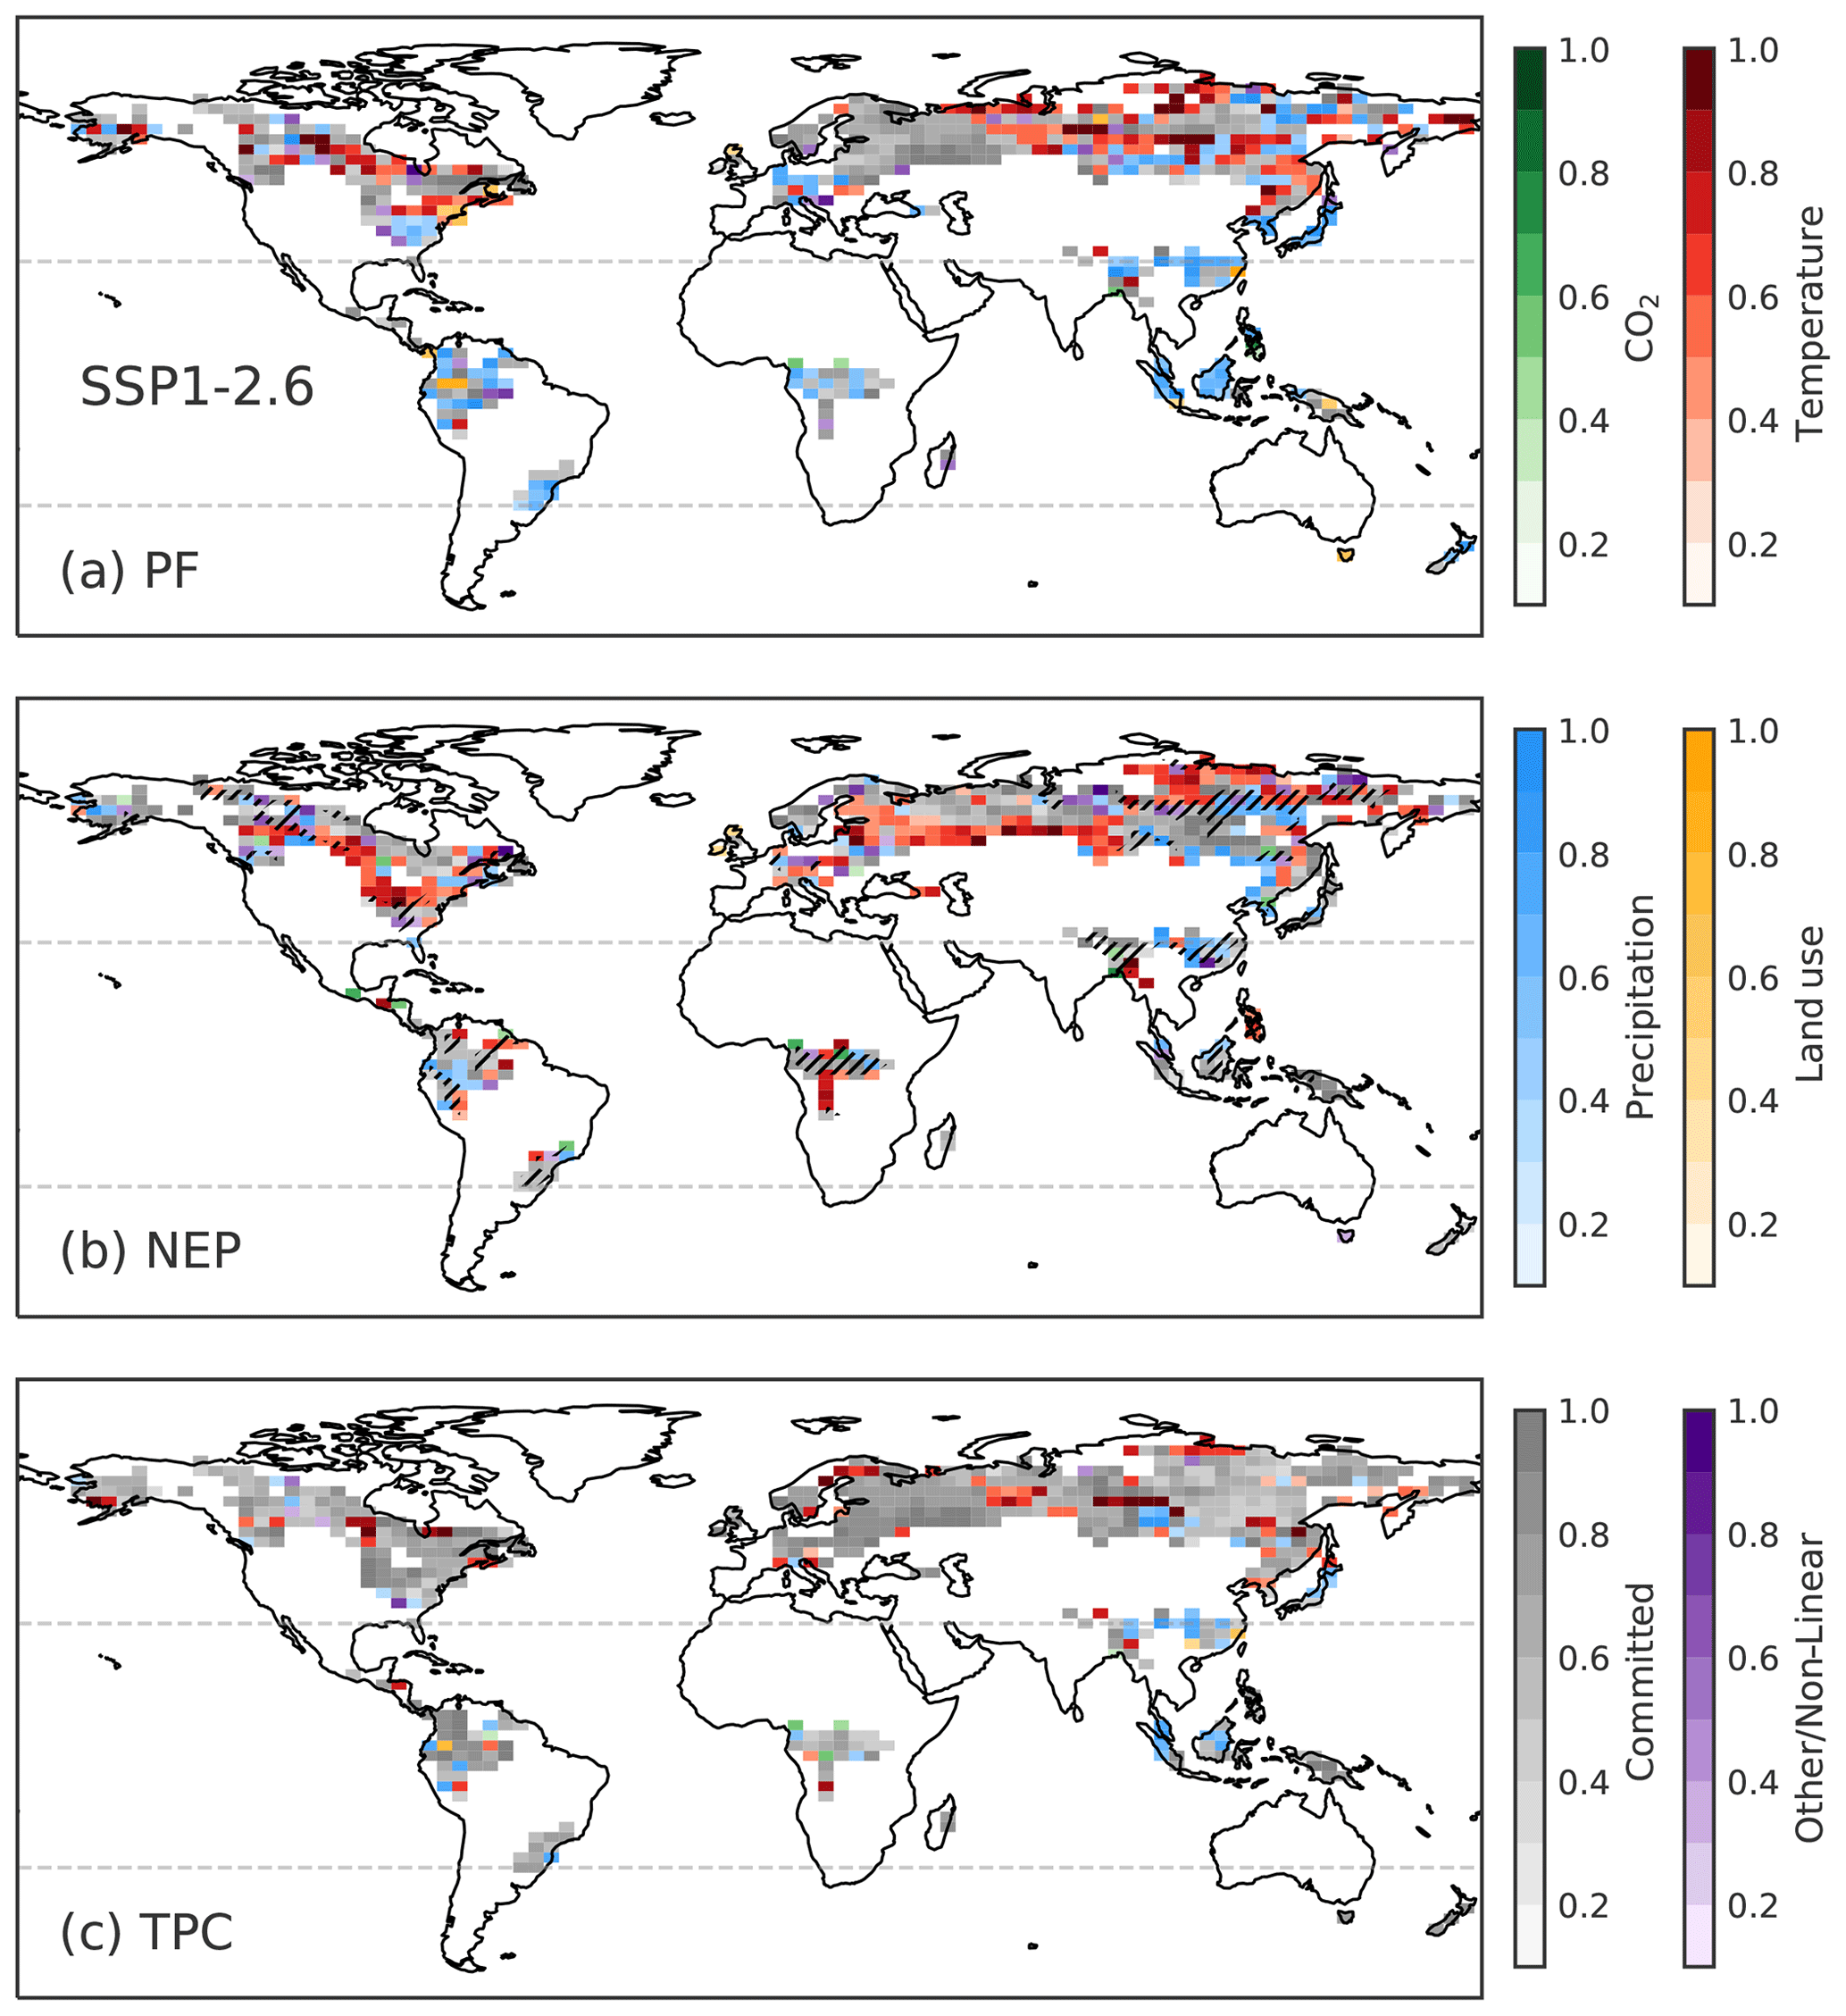
Figure A1Dominant driver contributions to SSP1-2.6 anomalies at 2300 in (a) peatland area fraction (PF), (b) peatland NEP, and (c) total peat carbon (TPC). Colors indicate the most important driver and color shade the contribution of the respective driver on a scale from 0 (no contribution) to 1 (only contributor). Anomalies are calculated with respect to 1995–2014 averages.
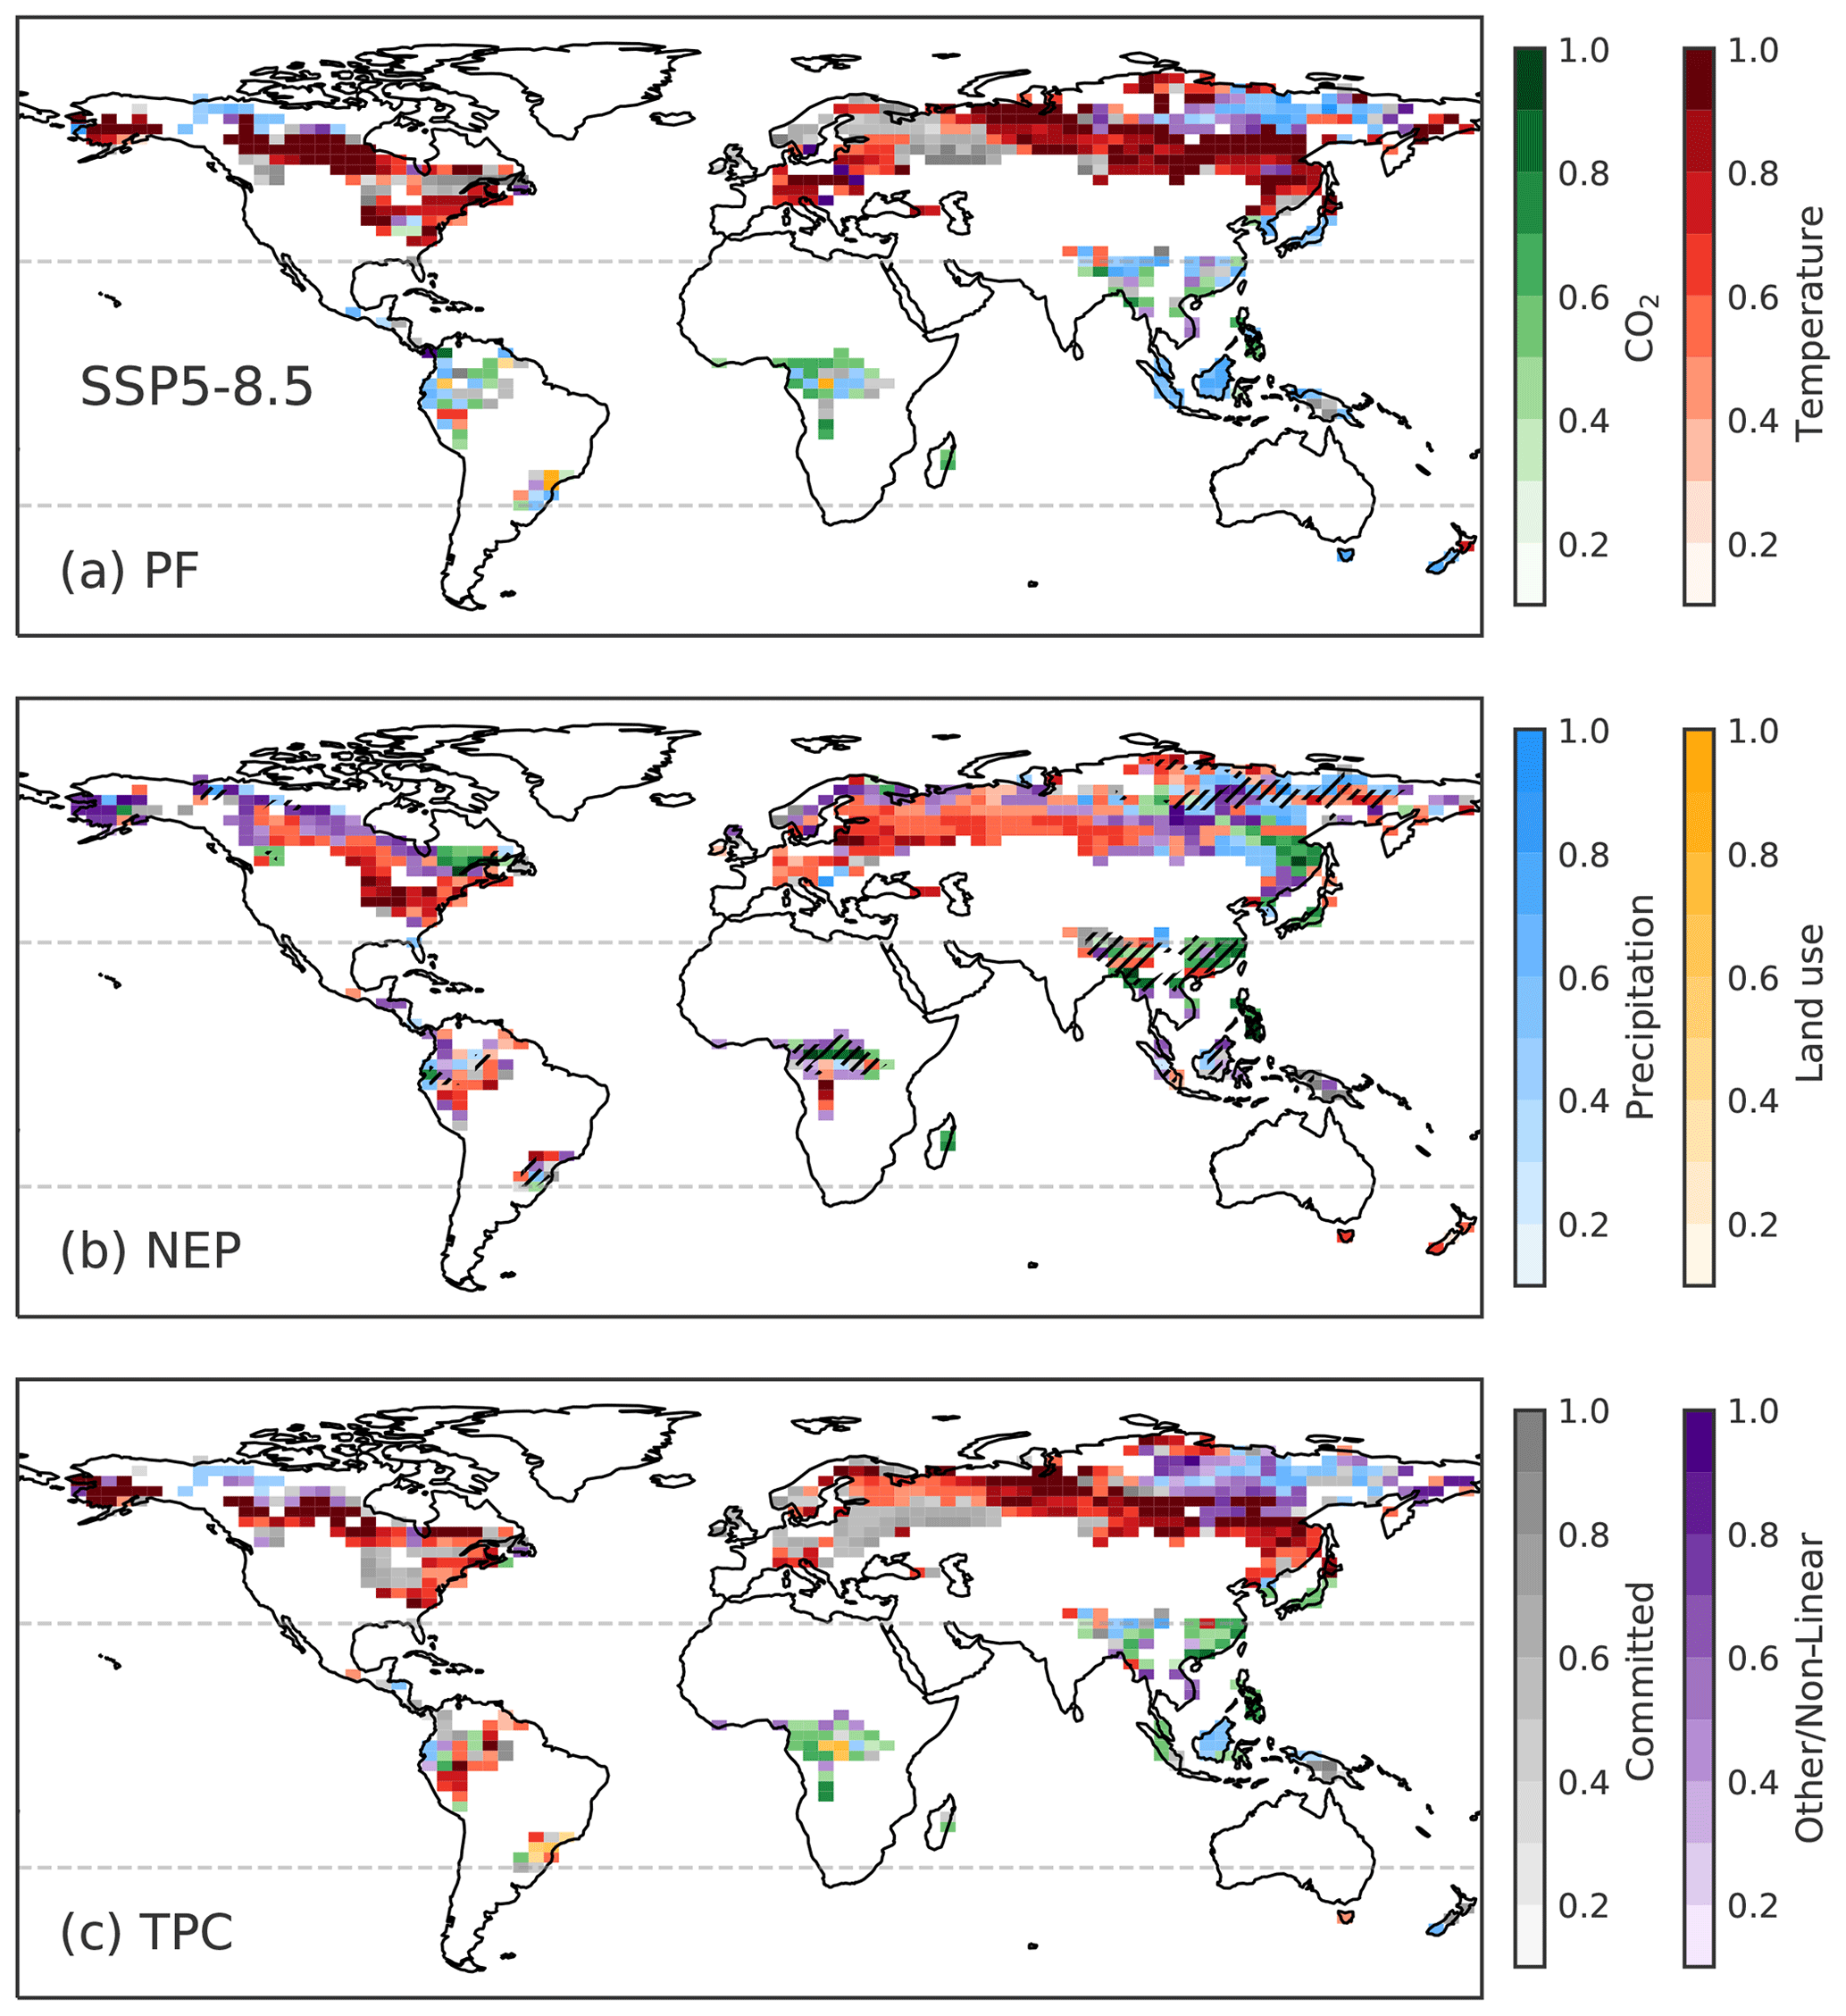
Figure A2As Fig. A1 but for the SSP5–8.5 scenario.
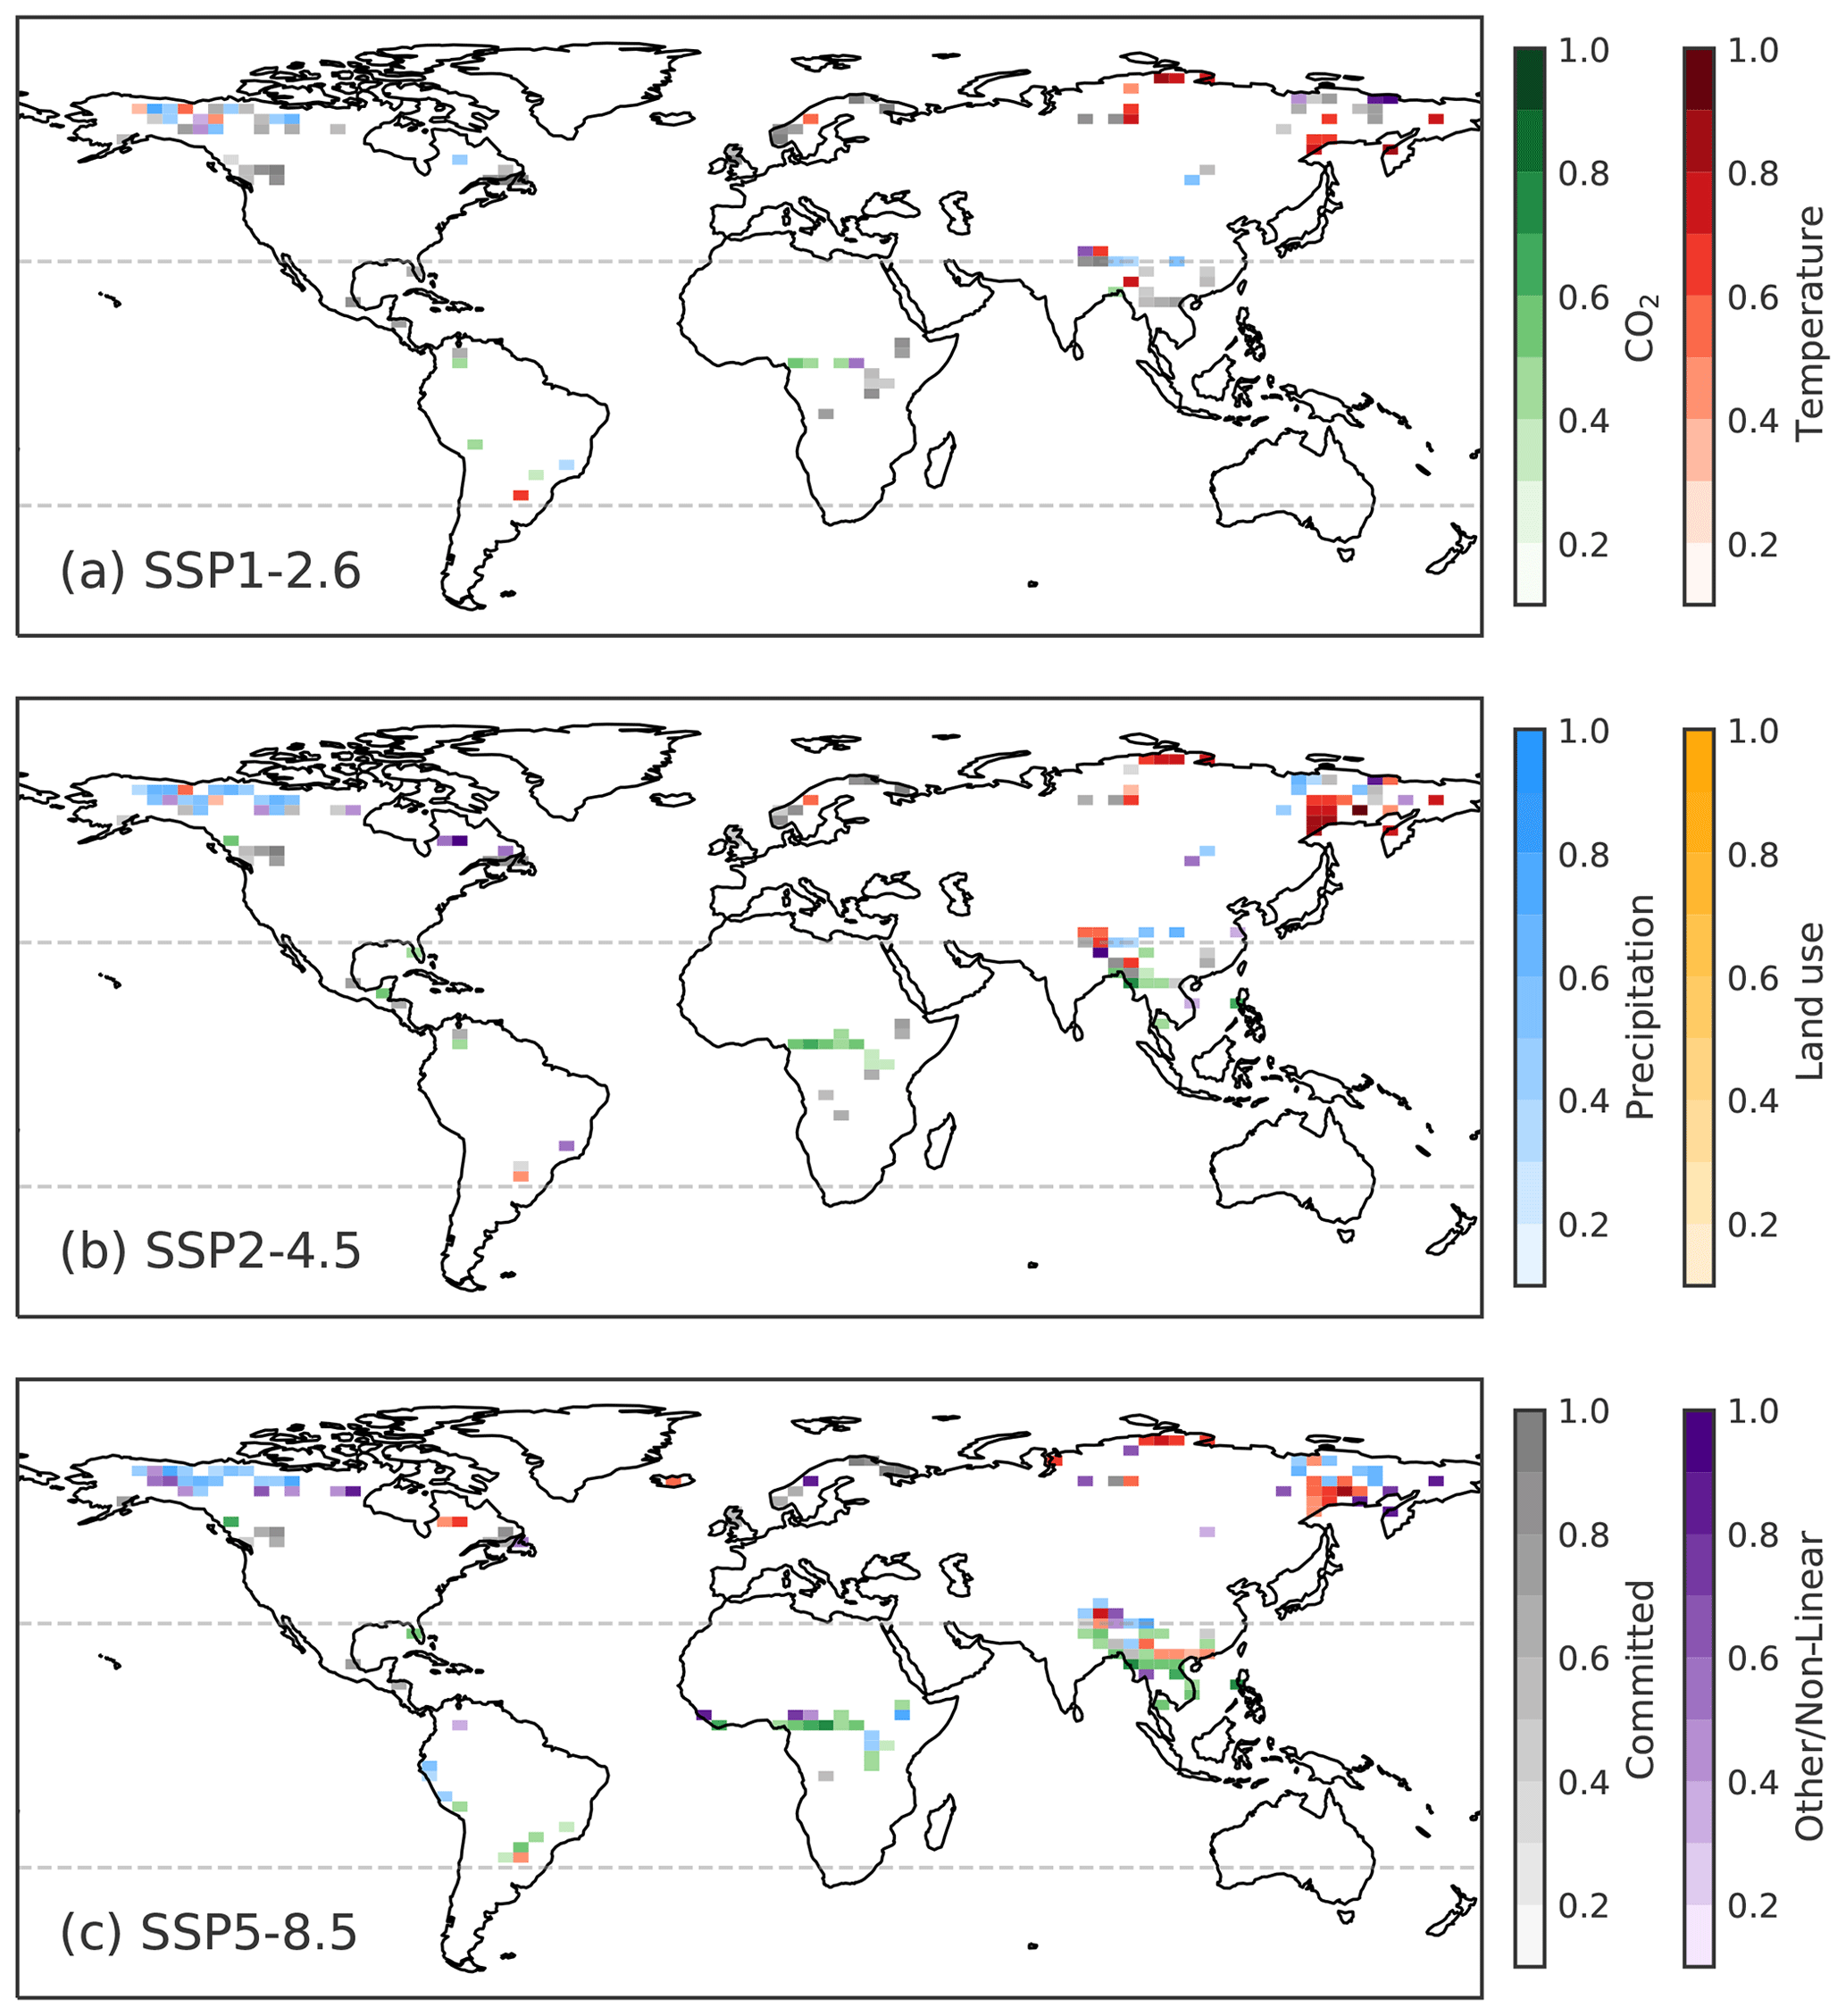
Figure A3Dominant driver contributions to peatland area at 3500 in grid cells with no peatland presence before the year 1500 for (a) SSP1–2.6, (b) SSP2–4.5, and (c) SSP5–8.5. Colors indicate the most important driver and color shade the contribution of the respective driver on a scale from 0 (no contribution) to 1 (only contributor).
The Supplement with additional figures and tables is available below. LPX-Bern model output for variables and simulations presented here is available for download under https://doi.org/10.5281/zenodo.4627681 (Müller and Joos, 2021).
The supplement related to this article is available online at: https://doi.org/10.5194/bg-18-3657-2021-supplement.
JM and FJ designed the study. JM performed the simulations and the analyses in consultation with FJ. JM prepared the figures and wrote the paper with input from FJ.
The authors declare that they have no conflict of interest.
This project received funding from the Swiss National Science Foundation and from the European Union's Horizon 2020 research and innovation program under the project COMFORT (Our common future ocean in the Earth system – quantifying coupled cycles of carbon, oxygen, and nutrients for determining and achieving safe operating spaces with respect to tipping points) and under the project 4C (Climate-Carbon Interactions in the Current Century). The work reflects only the authors' view; the European Commission and their executive agency are not responsible for any use that may be made of the information the work contains. This study was undertaken as part of C-PEAT, a working group of the Past Global Changes (PAGES) project, which in turn received support from the Swiss Academy of Sciences and the Chinese Academy of Sciences. We thank Sebastian Lienert, Renato Spahni, and Benjamin Stocker for their contributions to the development of LPX-Bern. We acknowledge the World Climate Research Programme's Working Group on Coupled Modelling, which is responsible for CMIP, and the climate modeling groups for producing and making available their model output.
This research has been supported by the Schweizerischer Nationalfonds zur Förderung der Wissenschaftlichen Forschung (grant nos. 200020-172476 and 200020_200511) and the European Commission, Horizon 2020 (project COMFORT, grant no. 820989; and project 4C, grant no. 821003).
This paper was edited by Alexey V. Eliseev and reviewed by Thomas Kleinen and one anonymous referee.
Ahlström, A., Schurgers, G., and Smith, B.: The large influence of climate model bias on terrestrial carbon cycle simulations, Environ. Res. Lett., 12, 014004, https://doi.org/10.1088/1748-9326/12/1/014004, 2017. a
Alexandrov, G. A., Brovkin, V. A., and Kleinen, T.: The influence of climate on peatland extent in Western Siberia since the Last Glacial Maximum, Sci. Rep., 6, 6–11, https://doi.org/10.1038/srep24784, 2016. a, b
Allen, M. R., Frame, D. J., Huntingford, C., Jones, C. D., Lowe, J. A., Meinshausen, M., and Meinshausen, N.: Warming caused by cumulative carbon emissions towards the trillionth tonne, Nature, 458, 1163–1166, https://doi.org/10.1038/nature08019, 2009. a
Avis, C. A., Weaver, A. J., and Meissner, K. J.: Reduction in areal extent of high-latitude wetlands in response to permafrost thaw, Nat. Geosci., 4, 444–448, https://doi.org/10.1038/ngeo1160, 2011. a
Bauer, I. E., Gignac, L. D., and Vitt, D. H.: Development of a peatland complex in boreal western Canada: Lateral site expansion and local variability in vegetation succession and long-term peat accumulation, Can. J. Bot., 81, 833–847, https://doi.org/10.1139/b03-076, 2003. a
Beauregard, P., Lavoie, M., and Pellerin, S.: Recent Gray Birch (Betula populifolia) Encroachment in Temperate Peatlands of Eastern North America, Wetlands, 40, 351–364, https://doi.org/10.1007/s13157-019-01186-3, 2020. a, b, c
Beven, K. J. and Kirkby, M. J.: A physically based, variable contributing area model of basin hydrology, Hydrol. Sci. Bull., 24, 43–69, https://doi.org/10.1080/02626667909491834, 1979. a
Blodau, C.: Carbon cycling in peatlands — A review of processes and controls, Environ. Rev., 10, 111–134, https://doi.org/10.1139/a02-004, 2002. a
Boucher, O., Denvil, S., Levavasseur, G., Cozic, A., Caubel, A., Foujols, M.-A., Meurdesoif, Y., Cadule, P., Devilliers, M., Ghattas, J., Lebas, N., Lurton, T., Mellul, L., Musat, I., Mignot, J., and Cheruy, F.: IPSL IPSL-CM6A-LR model output prepared for CMIP6 CMIP historical, Version 20200601, https://doi.org/10.22033/ESGF/CMIP6.5195, 2018. a
Boucher, O., Denvil, S., Levavasseur, G., Cozic, A., Caubel, A., Foujols, M.-A., Meurdesoif, Y., Cadule, P., Devilliers, M., Dupont, E., and Lurton, T.: IPSL IPSL-CM6A-LR model output prepared for CMIP6 ScenarioMIP, Version 20200601, https://doi.org/10.22033/ESGF/CMIP6.1532, 2019. a
Boucher, O., Servonnat, J., Albright, A. L., Aumont, O., Balkanski, Y., Bastrikov, V., Bekki, S., Bonnet, R., Bony, S., Bopp, L., Braconnot, P., Brockmann, P., Cadule, P., Caubel, A., Cheruy, F., Codron, F., Cozic, A., Cugnet, D., D'Andrea, F., Davini, P., Lavergne, C., Denvil, S., Deshayes, J., Devilliers, M., Ducharne, A., Dufresne, J., Dupont, E., Éthé, C., Fairhead, L., Falletti, L., Flavoni, S., Foujols, M., Gardoll, S., Gastineau, G., Ghattas, J., Grandpeix, J., Guenet, B., Guez, Lionel, E., Guilyardi, E., Guimberteau, M., Hauglustaine, D., Hourdin, F., Idelkadi, A., Joussaume, S., Kageyama, M., Khodri, M., Krinner, G., Lebas, N., Levavasseur, G., Lévy, C., Li, L., Lott, F., Lurton, T., Luyssaert, S., Madec, G., Madeleine, J., Maignan, F., Marchand, M., Marti, O., Mellul, L., Meurdesoif, Y., Mignot, J., Musat, I., Ottlé, C., Peylin, P., Planton, Y., Polcher, J., Rio, C., Rochetin, N., Rousset, C., Sepulchre, P., Sima, A., Swingedouw, D., Thiéblemont, R., Traore, A. K., Vancoppenolle, M., Vial, J., Vialard, J., Viovy, N., and Vuichard, N.: Presentation and Evaluation of the IPSL‐CM6A‐LR Climate Model, J. Adv. Model. Earth Syst., 12, 1–52, https://doi.org/10.1029/2019MS002010, 2020. a
Broothaerts, N., Notebaert, B., Verstraeten, G., Kasse, C., Bohncke, S., and Vandenberghe, J.: Non-uniform and diachronous Holocene floodplain evolution: a case study from the Dijle catchment, Belgium, J. Quaternary Sci., 29, 351–360, https://doi.org/10.1002/jqs.2709, 2014. a, b
Byun, Y.-H., Lim, Y.-J., Shim, S., Sung, H. M., Sun, M., Kim, J., Kim, B.-H., Lee, J.-H., and Moon, H.: NIMS-KMA KACE1.0-G model output prepared for CMIP6 ScenarioMIP, Version 20200601, https://doi.org/10.22033/ESGF/CMIP6.2242, 2019a. a
Byun, Y.-H., Lim, Y.-J., Sung, H. M., Kim, J., Sun, M., and Kim, B.-H.: NIMS-KMA KACE1.0-G model output prepared for CMIP6 CMIP historical, Version 20200601, https://doi.org/10.22033/ESGF/CMIP6.8378, 2019b. a
Camill, P.: Permafrost thaw accelerates in boreal peatlands during late-20th century climate warming, Clim. Change, 68, 135–152, https://doi.org/10.1007/s10584-005-4785-y, 2005. a
Campos, J. R. d. R., Silva, A. C., Slater, L., Nanni, M. R., and Vidal-Torrado, P.: Stratigraphic control and chronology of peat bog deposition in the Serra do Espinhaço Meridional, Brazil, CATENA, 143, 167–173, https://doi.org/10.1016/j.catena.2016.04.009, 2016. a
Charman, D.: Peatlands and environmental change, John Wiley & Sons Ltd., UK, 2002. a
Charman, D. J., Beilman, D. W., Blaauw, M., Booth, R. K., Brewer, S., Chambers, F. M., Christen, J. A., Gallego-Sala, A., Harrison, S. P., Hughes, P. D. M., Jackson, S. T., Korhola, A., Mauquoy, D., Mitchell, F. J. G., Prentice, I. C., van der Linden, M., De Vleeschouwer, F., Yu, Z. C., Alm, J., Bauer, I. E., Corish, Y. M. C., Garneau, M., Hohl, V., Huang, Y., Karofeld, E., Le Roux, G., Loisel, J., Moschen, R., Nichols, J. E., Nieminen, T. M., MacDonald, G. M., Phadtare, N. R., Rausch, N., Sillasoo, Ü., Swindles, G. T., Tuittila, E.-S., Ukonmaanaho, L., Väliranta, M., van Bellen, S., van Geel, B., Vitt, D. H., and Zhao, Y.: Climate-related changes in peatland carbon accumulation during the last millennium, Biogeosciences, 10, 929–944, https://doi.org/10.5194/bg-10-929-2013, 2013. a
Chaudhary, N., Miller, P. A., and Smith, B.: Modelling past, present and future peatland carbon accumulation across the pan-Arctic region, Biogeosciences, 14, 4023–4044, https://doi.org/10.5194/bg-14-4023-2017, 2017. a
Chaudhary, N., Westermann, S., Lamba, S., Shurpali, N., Sannel, A. B. K., Schurgers, G., Miller, P. A., and Smith, B.: Modelling past and future peatland carbon dynamics across the pan-Arctic, Glob. Change Biol., 26, 4119–4133, https://doi.org/10.1111/gcb.15099, 2020. a, b, c
Clark, P. U., Shakun, J. D., Marcott, S. A., Mix, A. C., Eby, M., Kulp, S., Levermann, A., Milne, G. A., Pfister, P. L., Santer, B. D., Schrag, D. P., Solomon, S., Stocker, T. F., Strauss, B. H., Weaver, A. J., Winkelmann, R., Archer, D., Bard, E., Goldner, A., Lambeck, K., Pierrehumbert, R. T., and Plattner, G. K.: Consequences of twenty-first-century policy for multi-millennial climate and sea-level change, Nat. Clim. Change, 6, 360–369, https://doi.org/10.1038/nclimate2923, 2016. a
Cole, L. E., Bhagwat, S. A., and Willis, K. J.: Long-term disturbance dynamics and resilience of tropical peat swamp forests, J. Ecol., 103, 16–30, https://doi.org/10.1111/1365-2745.12329, 2015. a
Cong, M., Xu, Y., Tang, L., Yang, W., and Jian, M.: Predicting the dynamic distribution of Sphagnum bogs in China under climate change since the last interglacial period, PLoS One, 15, e0230969, https://doi.org/10.1371/journal.pone.0230969, 2020. a
Dargie, G. C., Lewis, S. L., Lawson, I. T., Mitchard, E. T., Page, S. E., Bocko, Y. E., and Ifo, S. A.: Age, extent and carbon storage of the central Congo Basin peatland complex, Nature, 542, 86–90, https://doi.org/10.1038/nature21048, 2017. a, b
de Jong, R., Blaauw, M., Chambers, F. M., Christensen, T. R., de Vleeschouwer, F., Finsinger, W., Fronzek, S., Johansson, M., Kokfelt, U., Lamentowicz, M., Le Roux, G., Mauquoy, D., Mitchell, E. A., Nichols, J. E., Samaritani, E., and van Geel, B.: Climate and Peatlands, in: Chang. Clim. Earth Syst. Soc., edited by Dodson, J., Springer Netherlands, Dordrecht, 85–121, https://doi.org/10.1007/978-90-481-8716-4_5, 2010. a
Dohong, A., Aziz, A. A., and Dargusch, P.: A review of the drivers of tropical peatland degradation in South-East Asia, Land Use Policy, 69, 349–360, https://doi.org/10.1016/j.landusepol.2017.09.035, 2017. a
Dommain, R., Frolking, S., Jeltsch-Thömmes, A., Joos, F., Couwenberg, J., and Glaser, P. H.: A radiative forcing analysis of tropical peatlands before and after their conversion to agricultural plantations, Glob. Change Biol., 24, 5518–5533, https://doi.org/10.1111/gcb.14400, 2018. a, b, c, d
Döscher, R., Acosta, M., Alessandri, A., Anthoni, P., Arneth, A., Arsouze, T., Bergmann, T., Bernadello, R., Bousetta, S., Caron, L.-P., Carver, G., Castrillo, M., Catalano, F., Cvijanovic, I., Davini, P., Dekker, E., Doblas-Reyes, F. J., Docquier, D., Echevarria, P., Fladrich, U., Fuentes-Franco, R., Gröger, M., v. Hardenberg, J., Hieronymus, J., Karami, M. P., Keskinen, J.-P., Koenigk, T., Makkonen, R., Massonnet, F., Ménégoz, M., Miller, P. A., Moreno-Chamarro, E., Nieradzik, L., van Noije, T., Nolan, P., O’Donnell, D., Ollinaho, P., van den Oord, G., Ortega, P., Prims, O. T., Ramos, A., Reerink, T., Rousset, C., Ruprich-Robert, Y., Le Sager, P., Schmith, T., Schrödner, R., Serva, F., Sicardi, V., Sloth Madsen, M., Smith, B., Tian, T., Tourigny, E., Uotila, P., Vancoppenolle, M., Wang, S., Wårlind, D., Willén, U., Wyser, K., Yang, S., Yepes-Arbós, X., and Zhang, Q.: The EC-Earth3 Earth System Model for the Climate Model Intercomparison Project 6, Geosci. Model Dev. Discuss. [preprint], https://doi.org/10.5194/gmd-2020-446, in review, 2021. a
Dunne, J. P., Horowitz, L. W., Adcroft, A. J., Ginoux, P., Held, I. M., John, J. G., Krasting, J. P., Malyshev, S., Naik, V., Paulot, F., Shevliakova, E., Stock, C. A., Zadeh, N., Balaji, V., Blanton, C., Dunne, K. A., Dupuis, C., Durachta, J., Dussin, R., Gauthier, P. P. G., Griffies, S. M., Guo, H., Hallberg, R. W., Harrison, M., He, J., Hurlin, W., McHugh, C., Menzel, R., Milly, P. C. D., Nikonov, S., Paynter, D. J., Ploshay, J., Radhakrishnan, A., Rand, K., Reichl, B. G., Robinson, T., Schwarzkopf, D. M., Sentman, L. T., Underwood, S., Vahlenkamp, H., Winton, M., Wittenberg, A. T., Wyman, B., Zeng, Y., and Zhao, M.: The GFDL Earth System Model Version 4.1 (GFDL‐ESM 4.1): Overall Coupled Model Description and Simulation Characteristics, J. Adv. Model. Earth Syst., 12, 1–56, https://doi.org/10.1029/2019MS002015, 2020. a
EC-Earth Consortium (EC-Earth): EC-Earth-Consortium EC-Earth3 model output prepared for CMIP6 CMIP historical, Version 20200601, https://doi.org/10.22033/ESGF/CMIP6.4700, 2019a. a
EC-Earth Consortium (EC-Earth): EC-Earth-Consortium EC-Earth3 model output prepared for CMIP6 ScenarioMIP, Version 20200601, https://doi.org/10.22033/ESGF/CMIP6.251, 2019b. a
Eppinga, M. B., Rietkerk, M., Wassen, M. J., and De Ruiter, P. C.: Linking habitat modification to catastrophic shifts and vegetation patterns in bogs, Plant Ecol., 200, 53–68, https://doi.org/10.1007/s11258-007-9309-6, 2009. a
Estop-Aragonés, C., Cooper, M. D., Fisher, J. P., Thierry, A., Garnett, M. H., Charman, D. J., Murton, J. B., Phoenix, G. K., Treharne, R., Sanderson, N. K., Burn, C. R., Kokelj, S. V., Wolfe, S. A., Lewkowicz, A. G., Williams, M., and Hartley, I. P.: Limited release of previously-frozen C and increased new peat formation after thaw in permafrost peatlands, Soil Biol. Biochem., 118, 115–129, https://doi.org/10.1016/j.soilbio.2017.12.010, 2018. a, b
Estop‐Aragonés, C., Olefeldt, D., Abbott, B. W., Chanton, J. P., Czimczik, C. I., Dean, J. F., Egan, J. E., Gandois, L., Garnett, M. H., Hartley, I. P., Hoyt, A., Lupascu, M., Natali, S. M., O'Donnell, J. A., Raymond, P. A., Tanentzap, A. J., Tank, S. E., Schuur, E. A. G., Turetsky, M., and Anthony, K. W.: Assessing the Potential for Mobilization of Old Soil Carbon After Permafrost Thaw: A Synthesis of 14C Measurements From the Northern Permafrost Region, Global Biogeochem. Cy., 34, 1–26, https://doi.org/10.1029/2020GB006672, 2020. a
Eyring, V., Bony, S., Meehl, G. A., Senior, C. A., Stevens, B., Stouffer, R. J., and Taylor, K. E.: Overview of the Coupled Model Intercomparison Project Phase 6 (CMIP6) experimental design and organization, Geosci. Model Dev., 9, 1937–1958, https://doi.org/10.5194/gmd-9-1937-2016, 2016. a
Ferretto, A., Brooker, R., Aitkenhead, M., Matthews, R., and Smith, P.: Potential carbon loss from Scottish peatlands under climate change, Reg. Environ. Change, 19, 2101–2111, https://doi.org/10.1007/s10113-019-01550-3, 2019. a
Frölicher, T. L. and Joos, F.: Reversible and irreversible impacts of greenhouse gas emissions in multi-century projections with the NCAR global coupled carbon cycle-climate model, Clim. Dynam., 35, 1439–1459, https://doi.org/10.1007/s00382-009-0727-0, 2010. a
Frölicher, T. L., Winton, M., and Sarmiento, J. L.: Continued global warming after CO2 emissions stoppage, Nat. Clim. Change, 4, 40–44, https://doi.org/10.1038/nclimate2060, 2014. a
Frolking, S. and Roulet, N. T.: Holocene radiative forcing impact of northern peatland carbon accumulation and methane emissions, Glob. Change Biol., 13, 1079–1088, https://doi.org/10.1111/j.1365-2486.2007.01339.x, 2007. a, b
Gajewski, K., Viau, A., Sawada, M., Atkinson, L. J., and Wilson, S.: Sphagnum peatland distribution in North America and Eurasia during the past 21,000 years, Carbon N. Y., 15, 297–310, 2001. a
Gallego-Sala, A. V., Charman, D. J., Harrison, S. P., Li, G., and Prentice, I. C.: Climate-driven expansion of blanket bogs in Britain during the Holocene, Clim. Past, 12, 129–136, https://doi.org/10.5194/cp-12-129-2016, 2016. a
Gallego-Sala, A. V., Charman, D. J., Brewer, S., Page, S. E., Colin Prentice, I., Friedlingstein, P., Moreton, S., Amesbury, M. J., Beilman, D. W., Bjamp, S., Blyakharchuk, T., Bochicchio, C., Booth, R. K., Bunbury, J., Camill, P., Carless, D., Chimner, R. A., Clifford, M., Cressey, E., Courtney-Mustaphi, C., Vleeschouwer, O., Jong, R., Fialkiewicz-Koziel, B., Finkelstein, S. A., Garneau, M., Githumbi, E., Hribjlan, J., Holmquist, J., M Hughes, P. D., Jones, C., Jones, M. C., Karofeld, E., Klein, E. S., Kokfelt, U., Korhola, A., Lacourse, T., Roux, G., Lamentowicz, M., Large, D., Lavoie, M., Loisel, J., Mackay, H., MacDonald, G. M., Makila, M., Magnan, G., Marchant, R., Marcisz, K., Martamp, A., Cortizas, N., Massa, C., Mathijssen, P., Mauquoy, D., Mighall, T., G Mitchell, F. J., Moss, P., Nichols, J., Oksanen, P. O., Orme, L., Packalen, M. S., Robinson, S., Roland, T. P., Sanderson, N. K., Britta Sannel, A. K., Steinberg, N., Swindles, G. T., Edward Turner, T., Uglow, J., Vamp, M., Bellen, S., Linden, M., Geel, B., Wang, G., Yu, Z., Zaragoza-Castells, J., and Zhao, Y.: Latitudinal limits to the predicted increase of the peatland carbon sink with warming, Nat. Clim. Change, 8, 907–914, https://doi.org/10.1038/s41558-018-0271-1, 2018. a, b, c
Goldstein, A., Turner, W. R., Spawn, S. A., Anderson-Teixeira, K. J., Cook-Patton, S., Fargione, J., Gibbs, H. K., Griscom, B., Hewson, J. H., Howard, J. F., Ledezma, J. C., Page, S., Koh, L. P., Rockström, J., Sanderman, J., and Hole, D. G.: Protecting irrecoverable carbon in Earth's ecosystems, Nat. Clim. Change, 10, 287–295, https://doi.org/10.1038/s41558-020-0738-8, 2020. a
Gorham, E.: The Development of Peat Lands, Q. Rev. Biol., 32, 145–166, https://doi.org/10.1086/401755, 1957. a
Gorham, E.: Northern Peatlands: Role in the Carbon Cycle and Probable Responses to Climatic Warming, Ecol. Appl., 1, 182–195, https://doi.org/10.2307/1941811, 1991. a
Gorham, E., Lehman, C., Dyke, A., Janssens, J., and Dyke, L.: Temporal and spatial aspects of peatland initiation following deglaciation in North America, Quaternary Sci. Rev., 26, 300–311, https://doi.org/10.1016/j.quascirev.2006.08.008, 2007. a
Gorham, E., Lehman, C., Dyke, A., Clymo, D., and Janssens, J.: Long-term carbon sequestration in North American peatlands, Quaternary Sci. Rev., 58, 77–82, https://doi.org/10.1016/j.quascirev.2012.09.018, 2012. a
Gumbricht, T., Roman‐Cuesta, R. M., Verchot, L., Herold, M., Wittmann, F., Householder, E., Herold, N., and Murdiyarso, D.: An expert system model for mapping tropical wetlands and peatlands reveals South America as the largest contributor, Glob. Change Biol., 23, 3581–3599, https://doi.org/10.1111/gcb.13689, 2017. a, b
Günther, A., Barthelmes, A., Huth, V., Joosten, H., Jurasinski, G., Koebsch, F., and Couwenberg, J.: Prompt rewetting of drained peatlands reduces climate warming despite methane emissions, Nat. Commun., 11, 1–5, https://doi.org/10.1038/s41467-020-15499-z, 2020. a
Guo, D. and Wang, H.: CMIP5 permafrost degradation projection:A comparison among different regions, J. Geophys. Res.-Atmos., 121, 4499–4517, https://doi.org/10.1002/2015JD024108, 2016. a
Haapalehto, T. O., Vasander, H., Jauhiainen, S., Tahvanainen, T., and Kotiaho, J. S.: The effects of peatland restoration on water-table depth, elemental concentrations, and vegetation: 10 years of changes, Restor. Ecol., 19, 587–598, https://doi.org/10.1111/j.1526-100X.2010.00704.x, 2011. a
Halsey, L. A., Vitt, D. H., Gignac, L. D., Bryologist, T., and Summer, N.: Sphagnum-Dominated Peatlands in North America since the Last Glacial Maximum: Their Occurrence and Extent Sphagnum-dominated Peatlands in North America Since the Last Glacial Maximum : Their Occurrence and Extent, Bryologist, 103, 334–352, https://doi.org/10.1639/0007-2745(2000)103[0334:SDPINA]2.0.CO;2, 2000. a
Harrison, S. P., Bartlein, P. J., Brewer, S., Prentice, I. C., Boyd, M., Hessler, I., Holmgren, K., Izumi, K., and Willis, K.: Climate model benchmarking with glacial and mid-Holocene climates, Clim. Dynam., 43, 671–688, https://doi.org/10.1007/s00382-013-1922-6, 2014. a
Heijmans, M. M. P. D., van der Knaap, Y. A. M., Holmgren, M., and Limpens, J.: Persistent versus transient tree encroachment of temperate peat bogs: effects of climate warming and drought events, Glob. Change Biol., 19, 2240–2250, https://doi.org/10.1111/gcb.12202, 2013. a
Helbig, M., Waddington, J. M., Alekseychik, P., Amiro, B., Aurela, M., Barr, A. G., Black, T. A., Carey, S. K., Chen, J., Chi, J., Desai, A. R., Dunn, A., Euskirchen, E. S., Flanagan, L. B., Friborg, T., Garneau, M., Grelle, A., Harder, S., Heliasz, M., Humphreys, E. R., Ikawa, H., Isabelle, P.-E., Iwata, H., Jassal, R., Korkiakoski, M., Kurbatova, J., Kutzbach, L., Lapshina, E., Lindroth, A., Löfvenius, M. O., Lohila, A., Mammarella, I., Marsh, P., Moore, P. A., Maximov, T., Nadeau, D. F., Nicholls, E. M., Nilsson, M. B., Ohta, T., Peichl, M., Petrone, R. M., Prokushkin, A., Quinton, W. L., Roulet, N., Runkle, B. R. K., Sonnentag, O., Strachan, I. B., Taillardat, P., Tuittila, E.-S., Tuovinen, J.-P., Turner, J., Ueyama, M., Varlagin, A., Vesala, T., Wilmking, M., Zyrianov, V., and Schulze, C.: The biophysical climate mitigation potential of boreal peatlands during the growing season, Environ. Res. Lett., 15, 104004, https://doi.org/10.1088/1748-9326/abab34, 2020a. a
Helbig, M., Waddington, J. M., Alekseychik, P., Amiro, B. D., Aurela, M., Barr, A. G., Black, T. A., Blanken, P. D., Carey, S. K., Chen, J., Chi, J., Desai, A. R., Dunn, A., Euskirchen, E. S., Flanagan, L. B., Forbrich, I., Friborg, T., Grelle, A., Harder, S., Heliasz, M., Humphreys, E. R., Ikawa, H., Isabelle, P. E., Iwata, H., Jassal, R., Korkiakoski, M., Kurbatova, J., Kutzbach, L., Lindroth, A., Löfvenius, M. O., Lohila, A., Mammarella, I., Marsh, P., Maximov, T., Melton, J. R., Moore, P. A., Nadeau, D. F., Nicholls, E. M., Nilsson, M. B., Ohta, T., Peichl, M., Petrone, R. M., Petrov, R., Prokushkin, A., Quinton, W. L., Reed, D. E., Roulet, N. T., Runkle, B. R., Sonnentag, O., Strachan, I. B., Taillardat, P., Tuittila, E. S., Tuovinen, J. P., Turner, J., Ueyama, M., Varlagin, A., Wilmking, M., Wofsy, S. C., and Zyrianov, V.: Increasing contribution of peatlands to boreal evapotranspiration in a warming climate, Nat. Clim. Change, 10, 555–560, https://doi.org/10.1038/s41558-020-0763-7, 2020b. a, b
Hergoualc'h, K. and Verchot, L. V.: Stocks and fluxes of carbon associated with land use change in Southeast Asian tropical peatlands: A review, Global Biogeochem. Cy., 25, GB2001, https://doi.org/10.1029/2009GB003718, 2011. a
Hopple, A. M., Wilson, R. M., Kolton, M., Zalman, C. A., Chanton, J. P., Kostka, J., Hanson, P. J., Keller, J. K., and Bridgham, S. D.: Massive peatland carbon banks vulnerable to rising temperatures, Nat. Commun., 11, 2373, https://doi.org/10.1038/s41467-020-16311-8, 2020. a
Hoyt, A. M., Chaussard, E., Seppalainen, S. S., and Harvey, C. F.: Widespread subsidence and carbon emissions across Southeast Asian peatlands, Nat. Geosci., 13, 435–440, https://doi.org/10.1038/s41561-020-0575-4, 2020. a, b, c, d
Hugelius, G., Loisel, J., Chadburn, S., Jackson, R. B., Jones, M., MacDonald, G., Marushchak, M., Olefeldt, D., Packalen, M., Siewert, M. B., Treat, C., Turetsky, M., Voigt, C., and Yu, Z.: Large stocks of peatland carbon and nitrogen are vulnerable to permafrost thaw, P. Natl. Acad. Sci. USA, 117, 20438–20446, https://doi.org/10.1073/pnas.1916387117, 2020. a, b
Humpenöder, F., Karstens, K., Lotze-Campen, H., Leifeld, J., Menichetti, L., Barthelmes, A., and Popp, A.: Peatland protection and restoration are key for climate change mitigation, Environ. Res. Lett., 15, 104093, https://doi.org/10.1088/1748-9326/abae2a, 2020. a
Hurtt, G. C., Chini, L., Sahajpal, R., Frolking, S., Bodirsky, B. L., Calvin, K., Doelman, J. C., Fisk, J., Fujimori, S., Klein Goldewijk, K., Hasegawa, T., Havlik, P., Heinimann, A., Humpenöder, F., Jungclaus, J., Kaplan, J. O., Kennedy, J., Krisztin, T., Lawrence, D., Lawrence, P., Ma, L., Mertz, O., Pongratz, J., Popp, A., Poulter, B., Riahi, K., Shevliakova, E., Stehfest, E., Thornton, P., Tubiello, F. N., van Vuuren, D. P., and Zhang, X.: Harmonization of global land use change and management for the period 850–2100 (LUH2) for CMIP6, Geosci. Model Dev., 13, 5425–5464, https://doi.org/10.5194/gmd-13-5425-2020, 2020. a, b
Collins, M., Knutti, R., Arblaster, J., Dufresne, J.-L., Fichefet, T., Friedlingstein, P., Gao, X., Gutowski, W. J., Johns, T., Krinner, G., Shongwe, M., Tebaldi, C., Weaver, A. J., and Wehner, M.: Long-term Climate Change: Projections, Com- mitments and Irreversibility. In: Climate Change 2013: The Physical Science Basis. Contribution of Working Group I to the Fifth Assessment Report of the Intergovernmental Panel on Climate Change, edited by: Stocker, T. F., Qin, D., Plattner, G.-K., Tignor, M., Allen, S. K., Boschung, J., Nauels, A., Xia, Y., Bex, V., and Midgley, P. M., Cambridge University Press, Cambridge, United Kingdom and New York, NY, USA, 2013. a, b
Ise, T., Dunn, A. L., Wofsy, S. C., and Moorcroft, P. R.: High sensitivity of peat decomposition to climate change through water-table feedback, Nat. Geosci., 1, 763–766, https://doi.org/10.1038/ngeo331, 2008. a
Jiang, L., Song, Y., Sun, L., Song, C., Wang, X., Ma, X., Liu, C., and Gao, J.: Effects of warming on carbon emission and microbial abundances across different soil depths of a peatland in the permafrost region under anaerobic condition, Appl. Soil Ecol., 156, 103712, https://doi.org/10.1016/j.apsoil.2020.103712, 2020. a
John, J. G., Blanton, C., McHugh, C., Radhakrishnan, A., Rand, K., Vahlenkamp, H., Wilson, C., Zadeh, N. T., Dunne, J. P., Dussin, R., Horowitz, L. W., Krasting, J. P., Lin, P., Malyshev, S., Naik, V., Ploshay, J., Shevliakova, E., Silvers, L., Stock, C., Winton, M., and Zeng, Y.: NOAA-GFDL GFDL-ESM4 model output prepared for CMIP6 ScenarioMIP, Version 20200601, https://doi.org/10.22033/ESGF/CMIP6.1414, 2018. a
Jones, M. C., Harden, J., O'Donnell, J., Manies, K., Jorgenson, T., Treat, C., and Ewing, S.: Rapid carbon loss and slow recovery following permafrost thaw in boreal peatlands, Glob. Change Biol., 23, 1109–1127, https://doi.org/10.1111/gcb.13403, 2017. a, b
Joos, F. and Spahni, R.: Rates of change in natural and anthropogenic radiative forcing over the past 20,000 years, P. Natl. Acad. Sci. USA, 105, 1425–1430, https://doi.org/10.1073/pnas.0707386105, 2008. a
Kimmel, K. and Mander, Ü.: Ecosystem services of peatlands: Implications for restoration, Prog. Phys. Geogr., 34, 491–514, https://doi.org/10.1177/0309133310365595, 2010. a
Kleinen, T., Brovkin, V., and Schuldt, R. J.: A dynamic model of wetland extent and peat accumulation: Results for the Holocene, Biogeosciences, 9, 235–248, https://doi.org/10.5194/bg-9-235-2012, 2012. a
Kluber, L. A., Johnston, E. R., Allen, S. A., Nicholas Hendershot, J., Hanson, P. J., and Schadt, C. W.: Constraints on microbial communities, decomposition and methane production in deep peat deposits, PLoS One, 15, 1–20, https://doi.org/10.1371/journal.pone.0223744, 2020. a
Korhola, A., Ruppel, M., Seppä, H., Väliranta, M., Virtanen, T., and Weckström, J.: The importance of northern peatland expansion to the late-Holocene rise of atmospheric methane, Quaternary Sci. Rev., 29, 611–617, https://doi.org/10.1016/j.quascirev.2009.12.010, 2010. a
Krasting, J. P., John, J. G., Blanton, C., McHugh, C., Nikonov, S., Radhakrishnan, A., Rand, K., Zadeh, N. T., Balaji, V., Durachta, J., Dupuis, C., Menzel, R., Robinson, T., Underwood, S., Vahlenkamp, H., Dunne, K. A., Gauthier, P. P. G., Ginoux, P., Griffies, S. M., Hallberg, R., Harrison, M., Hurlin, W., Malyshev, S., Naik, V., Paulot, F., Paynter, D. J., Ploshay, J., Reichl, B. G., Schwarzkopf, D. M., Seman, C. J., Silvers, L., Wyman, B., Zeng, Y., Adcroft, A., Dunne, J. P., Dussin, R., Guo, H., He, J., Held, I. M., Horowitz, L. W., Lin, P., Milly, P. C. D., Shevliakova, E., Stock, C., Winton, M., Wittenberg, A. T., Xie, Y., and Zhao, M.: NOAA-GFDL GFDL-ESM4 model output prepared for CMIP6 CMIP historical, Version 20200601, https://doi.org/10.22033/ESGF/CMIP6.8597, 2018. a
Lähteenoja, O., Reátegui, Y. R., Räsänen, M., Torres, D. D. C., Oinonen, M., and Page, S.: The large Amazonian peatland carbon sink in the subsiding Pastaza-Marañón foreland basin, Peru, Glob. Change Biol., 18, 164–178, https://doi.org/10.1111/j.1365-2486.2011.02504.x, 2012. a, b
LAI, D.: Methane Dynamics in Northern Peatlands: A Review, Pedosphere, 19, 409–421, https://doi.org/10.1016/S1002-0160(09)00003-4, 2009. a
Lara, M. J., Genet, H., McGuire, A. D., Euskirchen, E. S., Zhang, Y., Brown, D. R. N., Jorgenson, M. T., Romanovsky, V., Breen, A., and Bolton, W. R.: Thermokarst rates intensify due to climate change and forest fragmentation in an Alaskan boreal forest lowland, Glob. Change Biol., 22, 816–829, https://doi.org/10.1111/gcb.13124, 2016. a
Largeron, C., Krinner, G., Ciais, P., and Brutel-Vuilmet, C.: Implementing northern peatlands in a global land surface model: Description and evaluation in the ORCHIDEE high-latitude version model (ORC-HL-PEAT), Geosci. Model Dev., 11, 3279–3297, https://doi.org/10.5194/gmd-11-3279-2018, 2018. a
Lawrence, D. M., Slater, A. G., and Swenson, S. C.: Simulation of present-day and future permafrost and seasonally frozen ground conditions in CCSM4, J. Clim., 25, 2207–2225, https://doi.org/10.1175/JCLI-D-11-00334.1, 2012. a
Le Stum-Boivin, É., Magnan, G., Garneau, M., Fenton, N. J., Grondin, P., and Bergeron, Y.: Spatiotemporal evolution of paludification associated with autogenic and allogenic factors in the black spruce–moss boreal forest of Québec, Canada, Quaternary Res., 91, 650–664, https://doi.org/10.1017/qua.2018.101, 2019. a
Lee, J., Kim, J., Sun, M.-A., Kim, B.-H., Moon, H., Sung, H. M., Kim, J., and Byun, Y.-H.: Evaluation of the Korea Meteorological Administration Advanced Community Earth-System model (K-ACE), Asia-Pacific J. Atmos. Sci., 56, 381–395, https://doi.org/10.1007/s13143-019-00144-7, 2020. a
Leifeld, J. and Menichetti, L.: The underappreciated potential of peatlands in global climate change mitigation strategies, Nat. Commun., 9, 1071, https://doi.org/10.1038/s41467-018-03406-6, 2018. a
Leifeld, J., Wüst-Galley, C., and Page, S.: Intact and managed peatland soils as a source and sink of GHGs from 1850 to 2100, Nat. Clim. Change, 9, 945–947, https://doi.org/10.1038/s41558-019-0615-5, 2019. a, b, c
Lenton, T. M., Held, H., Kriegler, E., Hall, J. W., Lucht, W., Rahmstorf, S., and Schellnhuber, H. J.: Tipping elements in the Earth's climate system, P. Natl. Acad. Sci. USA, 105, 1786–1793, https://doi.org/10.1073/pnas.0705414105, 2008. a
Li, C., Grayson, R., Holden, J., and Li, P.: Erosion in peatlands: Recent research progress and future directions, Earth-Sci. Rev., 185, 870–886, https://doi.org/10.1016/j.earscirev.2018.08.005, 2018. a
Lienert, S. and Joos, F.: A Bayesian ensemble data assimilation to constrain model parameters and land-use carbon emissions, Biogeosciences, 15, 2909–2930, https://doi.org/10.5194/bg-15-2909-2018, 2018. a, b
Lindsay, R.: Peatland Classification, in: Wetl. B., Springer Netherlands, Dordrecht, 1515–1528, https://doi.org/10.1007/978-90-481-9659-3_341, 2018. a
Liu, Z., Otto-Bliesner, B. L., He, F., Brady, E. C., Tomas, R., Clark, P. U., Carlson, A. E., Lynch-Stieglitz, J., Curry, W., Brook, E., Erickson, D., Jacob, R., Kutzbach, J., and Cheng, J.: Transient simulation of last deglaciation with a new mechanism for bolling-allerod warming, Science, 325, 310–314, https://doi.org/10.1126/science.1171041, 2009. a
Loisel, J. and Bunsen, M.: Abrupt Fen-Bog Transition Across Southern Patagonia: Timing, Causes, and Impacts on Carbon Sequestration, Front. Ecol. Evol., 8, 1–19, https://doi.org/10.3389/fevo.2020.00273, 2020. a
Loisel, J., Yu, Z., Parsekian, A., Nolan, J., and Slater, L.: Quantifying landscape morphology influence on peatland lateral expansion using ground-penetrating radar (GPR) and peat core analysis, J. Geophys. Res.-Biogeo., 118, 373–384, https://doi.org/10.1002/jgrg.20029, 2013. a
Loisel, J., van Bellen, S., Pelletier, L., Talbot, J., Hugelius, G., Karran, D., Yu, Z., Nichols, J., and Holmquist, J.: Insights and issues with estimating northern peatland carbon stocks and fluxes since the Last Glacial Maximum, Earth-Sci. Rev., 165, 59–80, https://doi.org/10.1016/j.earscirev.2016.12.001, 2017. a, b
Loisel, J., Gallego-Sala, A. V., Amesbury, M. J., Magnan, G., Anshari, G., Beilman, D. W., Benavides, J. C., Blewett, J., Camill, P., Charman, D. J., Chawchai, S., Hedgpeth, A., Kleinen, T., Korhola, A., Large, D., Mansilla, C. A., Müller, J., van Bellen, S., West, J. B., Yu, Z., Bubier, J. L., Garneau, M., Moore, T., Sannel, A. B., Page, S., Väliranta, M., Bechtold, M., Brovkin, V., Cole, L. E., Chanton, J. P., Christensen, T. R., Davies, M. A., De Vleeschouwer, F., Finkelstein, S. A., Frolking, S., Gałka, M., Gandois, L., Girkin, N., Harris, L. I., Heinemeyer, A., Hoyt, A. M., Jones, M. C., Joos, F., Juutinen, S., Kaiser, K., Lacourse, T., Lamentowicz, M., Larmola, T., Leifeld, J., Lohila, A., Milner, A. M., Minkkinen, K., Moss, P., Naafs, B. D., Nichols, J., O'Donnell, J., Payne, R., Philben, M., Piilo, S., Quillet, A., Ratnayake, A. S., Roland, T. P., Sjögersten, S., Sonnentag, O., Swindles, G. T., Swinnen, W., Talbot, J., Treat, C., Valach, A. C., and Wu, J.: Expert assessment of future vulnerability of the global peatland carbon sink, Nat. Clim. Change, 11, 70–77, https://doi.org/10.1038/s41558-020-00944-0, 2021. a
MacDonald, G. M., Beilman, D. W., Kremenetski, K. V., Sheng, Y., Smith, L. C., and Velichko, A. A.: Rapid Early Development of Circumarctic Peatlands and Atmospheric CH4 and CO2 Variations, Science, 314, 285–288, https://doi.org/10.1126/science.1131722, 2006. a
Magnússon, R. Í., Limpens, J., Huissteden, J., Kleijn, D., Maximov, T. C., Rotbarth, R., Sass‐Klaassen, U., and Heijmans, M. M. P. D.: Rapid Vegetation Succession and Coupled Permafrost Dynamics in Arctic Thaw Ponds in the Siberian Lowland Tundra, J. Geophys. Res.-Biogeo., 125, 1–20, https://doi.org/10.1029/2019JG005618, 2020. a, b, c
Mamet, S. D., Chun, K. P., Kershaw, G. G., Loranty, M. M., and Peter Kershaw, G.: Recent Increases in Permafrost Thaw Rates and Areal Loss of Palsas in the Western Northwest Territories, Canada, Permafrost Periglac., 28, 619–633, https://doi.org/10.1002/ppp.1951, 2017. a
Mauritsen, T., Bader, J., Becker, T., Behrens, J., Bittner, M., Brokopf, R., Brovkin, V., Claussen, M., Crueger, T., Esch, M., Fast, I., Fiedler, S., Fläschner, D., Gayler, V., Giorgetta, M., Goll, D. S., Haak, H., Hagemann, S., Hedemann, C., Hohenegger, C., Ilyina, T., Jahns, T., Jimenéz‐de‐la‐Cuesta, D., Jungclaus, J., Kleinen, T., Kloster, S., Kracher, D., Kinne, S., Kleberg, D., Lasslop, G., Kornblueh, L., Marotzke, J., Matei, D., Meraner, K., Mikolajewicz, U., Modali, K., Möbis, B., Müller, W. A., Nabel, J. E. M. S., Nam, C. C. W., Notz, D., Nyawira, S., Paulsen, H., Peters, K., Pincus, R., Pohlmann, H., Pongratz, J., Popp, M., Raddatz, T. J., Rast, S., Redler, R., Reick, C. H., Rohrschneider, T., Schemann, V., Schmidt, H., Schnur, R., Schulzweida, U., Six, K. D., Stein, L., Stemmler, I., Stevens, B., Storch, J., Tian, F., Voigt, A., Vrese, P., Wieners, K., Wilkenskjeld, S., Winkler, A., and Roeckner, E.: Developments in the MPI‐M Earth System Model version 1.2 (MPI‐ESM1.2) and Its Response to Increasing CO2, J. Adv. Model. Earth Syst., 11, 998–1038, https://doi.org/10.1029/2018MS001400, 2019. a
McSweeney, C. F. and Jones, R. G.: How representative is the spread of climate projections from the 5 CMIP5 GCMs used in ISI-MIP?, Clim. Serv., 1, 24–29, https://doi.org/10.1016/j.cliser.2016.02.001, 2016. a
Meinshausen, M., Nicholls, Z. R. J., Lewis, J., Gidden, M. J., Vogel, E., Freund, M., Beyerle, U., Gessner, C., Nauels, A., Bauer, N., Canadell, J. G., Daniel, J. S., John, A., Krummel, P. B., Luderer, G., Meinshausen, N., Montzka, S. A., Rayner, P. J., Reimann, S., Smith, S. J., van den Berg, M., Velders, G. J. M., Vollmer, M. K., and Wang, R. H. J.: The shared socio-economic pathway (SSP) greenhouse gas concentrations and their extensions to 2500, Geosci. Model Dev., 13, 3571–3605, https://doi.org/10.5194/gmd-13-3571-2020, 2020. a
Minayeva, T. Y. and Sirin, A. A.: Peatland biodiversity and climate change, Biol. Bull. Rev., 2, 164–175, https://doi.org/10.1134/s207908641202003x, 2012. a
Mitchell, T. D. and Jones, P. D.: An improved method of constructing a database of monthly climate observations and associated high-resolution grids, Int. J. Climatol., 25, 693–712, https://doi.org/10.1002/joc.1181, 2005. a
Moore, P. D.: The ecology of peat-forming processes: a review, Int. J. Coal Geol., 12, 89–103, https://doi.org/10.1016/0166-5162(89)90048-7, 1989. a
Morris, P. J., Belyea, L. R., and Baird, A. J.: Ecohydrological feedbacks in peatland development: A theoretical modelling study, J. Ecol., 99, 1190–1201, https://doi.org/10.1111/j.1365-2745.2011.01842.x, 2011. a
Morris, P. J., Swindles, G. T., Valdes, P. J., Ivanovic, R. F., Gregoire, L. J., Smith, M. W., Tarasov, L., Haywood, A. M., and Bacon, K. L.: Global peatland initiation driven by regionally asynchronous warming, P. Natl. Acad. Sci. USA, 115, 4851–4856, https://doi.org/10.1073/pnas.1717838115, 2018. a
Müller, J. and Joos, F.: Global peatland area and carbon dynamics from the Last Glacial Maximum to the present – a process-based model investigation, Biogeosciences, 17, 5285–5308, https://doi.org/10.5194/bg-17-5285-2020, 2020. a, b, c, d, e, f, g, h, i, j
Müller, J. and Joos, F.: Committed and projected future changes in global peatlands – continued transient model simulations since the Last Glacial Maximum, Zenodo [Dataset], https://doi.org/10.5281/zenodo.4627681, 2021.
Nugent, K. A., Strachan, I. B., Roulet, N. T., Strack, M., Frolking, S., and Helbig, M.: Prompt active restoration of peatlands substantially reduces climate impact, Environ. Res. Lett., 14, 124030, https://doi.org/10.1088/1748-9326/ab56e6, 2019. a
Olefeldt, D., Goswami, S., Grosse, G., Hayes, D., Hugelius, G., Kuhry, P., McGuire, A. D., Romanovsky, V. E., Sannel, A., Schuur, E., and Turetsky, M. R.: Circumpolar distribution and carbon storage of thermokarst landscapes, Nat. Commun., 7, 13043, https://doi.org/10.1038/ncomms13043, 2016. a
O'Neill, B. C., Tebaldi, C., Van Vuuren, D. P., Eyring, V., Friedlingstein, P., Hurtt, G., Knutti, R., Kriegler, E., Lamarque, J. F., Lowe, J., Meehl, G. A., Moss, R., Riahi, K., and Sanderson, B. M.: The Scenario Model Intercomparison Project (ScenarioMIP) for CMIP6, Geosci. Model Dev., 9, 3461–3482, https://doi.org/10.5194/gmd-9-3461-2016, 2016. a
Packalen, M. S., Finkelstein, S. A., and McLaughlin, J. W.: Carbon storage and potential methane production in the Hudson Bay Lowlands since mid-Holocene peat initiation, Nat. Commun., 5, 1–8, https://doi.org/10.1038/ncomms5078, 2014. a
Page, S. and Baird, A.: Peatlands and Global Change: Response and Resilience, Annu. Rev. Environ. Resour., 41, 35–57, https://doi.org/10.1146/annurev-environ-110615-085520, 2016. a, b, c, d
Page, S. E. and Hooijer, A.: In the line of fire: The peatlands of Southeast Asia, Philos. Trans. R. Soc. B, 371, https://doi.org/10.1098/rstb.2015.0176, 2016. a
Page, S. E., Rieley, J. O., and Banks, C. J.: Global and regional importance of the tropical peatland carbon pool, Glob. Change Biol., 17, 798–818, https://doi.org/10.1111/j.1365-2486.2010.02279.x, 2011. a, b, c, d
Payette, S., Delwaide, A., Caccianiga, M., and Beauchemin, M.: Accelerated thawing of subarctic peatland permafrost over the last 50 years, Geophys. Res. Lett., 31, 1–4, https://doi.org/10.1029/2004GL020358, 2004. a
Pellerin, S. and Lavoie, C.: Recent expansion of jack pine in peatlands of southeastern Québec: A paleoecological study, Écoscience, 10, 247–257, https://doi.org/10.1080/11956860.2003.11682772, 2003. a, b, c
Pinceloup, N., Poulin, M., Brice, M.-H., and Pellerin, S.: Vegetation changes in temperate ombrotrophic peatlands over a 35 year period, PLoS One, 15, e0229146, https://doi.org/10.1371/journal.pone.0229146, 2020. a, b
Posa, M. R. C., Wijedasa, L. S., and Corlett, R. T.: Biodiversity and conservation of tropical peat swamp forests, Bioscience, 61, 49–57, https://doi.org/10.1525/bio.2011.61.1.10, 2011. a
Qiu, C., Zhu, D., Ciais, P., Guenet, B., Krinner, G., Peng, S., Aurela, M., Bernhofer, C., Brümmer, C., Bret-Harte, S., Chu, H., Chen, J., Desai, A. R., Dušek, J., Euskirchen, E. S., Fortuniak, K., Flanagan, L. B., Friborg, T., Grygoruk, M., Gogo, S., Grünwald, T., Hansen, B. U., Holl, D., Humphreys, E., Hurkuck, M., Kiely, G., Klatt, J., Kutzbach, L., Largeron, C., Laggoun-Défarge, F., Lund, M., Lafleur, P. M., Li, X., Mammarella, I., Merbold, L., Nilsson, M. B., Olejnik, J., Ottosson-Löfvenius, M., Oechel, W., Parmentier, F. J. W., Peichl, M., Pirk, N., Peltola, O., Pawlak, W., Rasse, D., Rinne, J., Shaver, G., Peter Schmid, H., Sottocornola, M., Steinbrecher, R., Sachs, T., Urbaniak, M., Zona, D., and Ziemblinska, K.: ORCHIDEE-PEAT (revision 4596), a model for northern peatland CO2, water, and energy fluxes on daily to annual scales, Geosci. Model Dev., 11, 497–519, https://doi.org/10.5194/gmd-11-497-2018, 2018. a
Qiu, C., Zhu, D., Ciais, P., Guenet, B., and Peng, S.: The role of northern peatlands in the global carbon cycle for the 21st century, Glob. Ecol. Biogeogr., 29, 956–973, https://doi.org/10.1111/geb.13081, 2020. a, b, c, d, e, f, g, h
Ribeiro, K., Pacheco, F. S., Ferreira, J. W., de Sousa-Neto, E. R., Hastie, A., Krieger Filho, G. C., Alvalá, P. C., Forti, M. C., and Ometto, J. P.: Tropical peatlands and their contribution to the global carbon cycle and climate change, Glob. Change Biol., 27, 489–505, https://doi.org/10.1111/gcb.15408, 2021. a
Rong, X.: CAMS CAMS_CSM1.0 model output prepared for CMIP6 CMIP historical, Version 20200601, https://doi.org/10.22033/ESGF/CMIP6.9754, 2019a. a
Rong, X.: CAMS CAMS-CSM1.0 model output prepared for CMIP6 ScenarioMIP, Version 20200601, https://doi.org/10.22033/ESGF/CMIP6.11004, 2019b. a
Rong, X., Li, J., Chen, H., Xin, Y., Su, J., Hua, L., Zhou, T., Qi, Y., Zhang, Z., Zhang, G., and Li, J.: The CAMS Climate System Model and a Basic Evaluation of Its Climatology and Climate Variability Simulation, J. Meteorol. Res., 32, 839–861, https://doi.org/10.1007/s13351-018-8058-x, 2018. a
Ruppel, M., Väliranta, M., Virtanen, T., and Korhola, A.: Postglacial spatiotemporal peatland initiation and lateral expansion dynamics in North America and northern Europe, Holocene, 23, 1596–1606, https://doi.org/10.1177/0959683613499053, 2013. a, b
Rydin, H. and Jeglum, J. K.: The Biology of Peatlands, Oxford University Press, https://doi.org/10.1093/acprof:osobl/9780199602995.001.0001, 2013. a
Sawada, M., Viau, A. E., and Gajewski, K.: The biogeography of aquatic macrophytes in North America since the Last Glacial Maximum, J. Biogeogr., 30, 999–1017, https://doi.org/10.1046/j.1365-2699.2003.00866.x, 2003. a
Schuldt, R. J., Brovkin, V., Kleinen, T., and Winderlich, J.: Modelling Holocene carbon accumulation and methane emissions of boreal wetlands-an Earth system model approach, Biogeosciences, 10, 1659–1674, https://doi.org/10.5194/bg-10-1659-2013, 2013. a
Seland, Ø., Bentsen, M., Olivié, D., Toniazzo, T., Gjermundsen, A., Graff, L. S., Debernard, J. B., Gupta, A. K., He, Y.-c., Kirkevåg, A., Schwinger, J., Tjiputra, J., Aas, K. S., Bethke, I., Fan, Y., Griesfeller, J., Grini, A., Guo, C., Ilicak, M., Karset, I. H. H., Landgren, O., Liakka, J., Moseid, K. O., Nummelin, A., Spensberger, C., Tang, H., Zhang, Z., Heinze, C., Iversen, T., and Schulz, M.: Overview of the Norwegian Earth System Model (NorESM2) and key climate response of CMIP6 DECK, historical, and scenario simulations, Geosci. Model Dev., 13, 6165–6200, https://doi.org/10.5194/gmd-13-6165-2020, 2020. a
Seland, Ø., Bentsen, M., Oliviè, D. J. L., Toniazzo, T., Gjermundsen, A., Graff, L. S., Debernard, J. B., Gupta, A. K., He, Y., Kirkevåg, A., Schwinger, J., Tjiputra, J., Aas, K. S., Bethke, I., Fan, Y., Griesfeller, J., Grini, A., Guo, C., Ilicak, M., Karset, I. H. H., Landgren, O. A., Liakka, J., Moseid, K. O., Nummelin, A., Spensberger, C., Tang, H., Zhang, Z., Heinze, C., Iversen, T., and Schulz, M.: NCC NorESM2-LM model output prepared for CMIP6 CMIP historical, Version 20200601, https://doi.org/10.22033/ESGF/CMIP6.8036, 2019a. a
Seland, Ø., Bentsen, M., Oliviè, D. J. L., Toniazzo, T., Gjermundsen, A., Graff, L. S., Debernard, J. B., Gupta, A. K., He, Y., Kirkevåg, A., Schwinger, J., Tjiputra, J., Aas, K. S., Bethke, I., Fan, Y., Griesfeller, J., Grini, A., Guo, C., Ilicak, M., Karset, I. H. H., Landgren, O. A., Liakka, J., Moseid, K. O., Nummelin, A., Spensberger, C., Tang, H., Zhang, Z., Heinze, C., Iversen, T., and Schulz, M.: NCC NorESM2-LM model output prepared for CMIP6 ScenarioMIP, Version 20200601, https://doi.org/10.22033/ESGF/CMIP6.604, 2019b. a
Sitch, S., Smith, B., Prentice, I. C., Arneth, A., Bondeau, A., Cramer, W., Kaplan, J. O., Levis, S., Lucht, W., Sykes, M. T., Thonicke, K., and Venevsky, S.: Evaluation of ecosystem dynamics, plant geography and terrestrial carbon cycling in the LPJ dynamic global vegetation model, Glob. Change Biol., 9, 161–185, https://doi.org/10.1046/j.1365-2486.2003.00569.x, 2003. a
Spahni, R., Joos, F., Stocker, B. D., Steinacher, M., and Yu, Z. C.: Transient simulations of the carbon and nitrogen dynamics in northern peatlands: From the Last Glacial Maximum to the 21st century, Clim. Past, 9, 1287–1308, https://doi.org/10.5194/cp-9-1287-2013, 2013. a, b, c, d, e
Stocker, B. D., Roth, R., Joos, F., Spahni, R., Steinacher, M., Zaehle, S., Bouwman, L., Xu-Ri, and Prentice, I. C.: Multiple greenhouse-gas feedbacks from the land biosphere under future climate change scenarios, Nat. Clim. Chang., 3, 666–672, https://doi.org/10.1038/nclimate1864, 2013. a
Stocker, B. D., Feissli, F., Strassmann, K. M., Spahni, R., and Joos, F.: Past and future carbon fluxes from land use change, shifting cultivation and wood harvest, Tellus B, 66, https://doi.org/10.3402/tellusb.v66.23188, 2014a. a
Stocker, B. D., Spahni, R., and Joos, F.: DYPTOP: A cost-efficient TOPMODEL implementation to simulate sub-grid spatio-temporal dynamics of global wetlands and peatlands, Geosci. Model Dev., 7, 3089–3110, https://doi.org/10.5194/gmd-7-3089-2014, 2014b. a, b, c, d, e
Stocker, B. D., Yu, Z., Massa, C., and Joos, F.: Holocene peatland and ice-core data constraints on the timing and magnitude of CO2 emissions from past land use, P. Natl. Acad. Sci. USA, 114, 1492–1497, https://doi.org/10.1073/pnas.1613889114, 2017. a
Swart, N. C., Cole, J. N. S., Kharin, V. V., Lazare, M., Scinocca, J. F., Gillett, N. P., Anstey, J., Arora, V., Christian, J. R., Hanna, S., Jiao, Y., Lee, W. G., Majaess, F., Saenko, O. A., Seiler, C., Seinen, C., Shao, A., Sigmond, M., Solheim, L., von Salzen, K., Yang, D., and Winter, B.: The Canadian Earth System Model version 5 (CanESM5.0.3), Geosci. Model Dev., 12, 4823–4873, https://doi.org/10.5194/gmd-12-4823-2019, 2019a. a
Swart, N. C., Cole, J. N. S., Kharin, V. V., Lazare, M., Scinocca, J. F., Gillett, N. P., Anstey, J., Arora, V., Christian, J. R., Jiao, Y., Lee, W. G., Majaess, F., Saenko, O. A., Seiler, C., Seinen, C., Shao, A., Solheim, L., von Salzen, K., Yang, D., Winter, B., and Sigmond, M.: CCCma CanESM5 model output prepared for CMIP6 CMIP historical, Version 20200601, https://doi.org/10.22033/ESGF/CMIP6.3610, 2019b. a
Swart, N. C., Cole, J. N. S., Kharin, V. V., Lazare, M., Scinocca, J. F., Gillett, N. P., Anstey, J., Arora, V., Christian, J. R., Jiao, Y., Lee, W. G., Majaess, F., Saenko, O. A., Seiler, C., Seinen, C., Shao, A., Solheim, L., von Salzen, K., Yang, D., Winter, B., and Sigmond, M.: CCCma CanESM5 model output prepared for CMIP6 ScenarioMIP, Version 20200601, https://doi.org/10.22033/ESGF/CMIP6.1317, 2019c. a
Swindles, G. T., Morris, P. J., Mullan, D., Watson, E. J., Turner, T. E., Roland, T. P., Amesbury, M. J., Kokfelt, U., Schoning, K., Pratte, S., Gallego-Sala, A., Charman, D. J., Sanderson, N., Garneau, M., Carrivick, J. L., Woulds, C., Holden, J., Parry, L., and Galloway, J. M.: The long-term fate of permafrost peatlands under rapid climate warming, Sci. Rep., 5, 1–6, https://doi.org/10.1038/srep17951, 2015. a, b, c
Swindles, G. T., Morris, P. J., Wheeler, J., Smith, M. W., Bacon, K. L., Edward Turner, T., Headley, A., and Galloway, J. M.: Resilience of peatland ecosystem services over millennial timescales: Evidence from a degraded British bog, J. Ecol., 104, 621–636, https://doi.org/10.1111/1365-2745.12565, 2016. a
Swindles, G. T., Morris, P. J., Mullan, D. J., Payne, R. J., Roland, T. P., Amesbury, M. J., Lamentowicz, M., Turner, T. E., Gallego-Sala, A., Sim, T., Barr, I. D., Blaauw, M., Blundell, A., Chambers, F. M., Charman, D. J., Feurdean, A., Galloway, J. M., Gałka, M., Green, S. M., Kajukało, K., Karofeld, E., Korhola, A., Lamentowicz, Ł., Langdon, P., Marcisz, K., Mauquoy, D., Mazei, Y. A., McKeown, M. M., Mitchell, E. A. D., Novenko, E., Plunkett, G., Roe, H. M., Schoning, K., Sillasoo, Ü., Tsyganov, A. N., van der Linden, M., Väliranta, M., and Warner, B.: Widespread drying of European peatlands in recent centuries, Nat. Geosci., 12, 922–928, https://doi.org/10.1038/s41561-019-0462-z, 2019. a, b
Swinnen, W., Broothaerts, N., and Verstraeten, G.: Modelling long-term blanket peatland development in eastern Scotland, Biogeosciences, 16, 3977–3996, https://doi.org/10.5194/bg-16-3977-2019, 2019. a
Talbot, J., Richard, P., Roulet, N., and Booth, R.: Assessing long-term hydrological and ecological responses to drainage in a raised bog using paleoecology and a hydrosequence, J. Veg. Sci., 21, 143–156, https://doi.org/10.1111/j.1654-1103.2009.01128.x, 2010. a
Treat, C. C., Kleinen, T., Broothaerts, N., Dalton, A. S., Dommain, R., Douglas, T. A., Drexler, J. Z., Finkelstein, S. A., Grosse, G., Hope, G., Hutchings, J., Jones, M. C., Kuhry, P., Lacourse, T., Lähteenoja, O., Loisel, J., Notebaert, B., Payne, R. J., Peteet, D. M., Sannel, A. B. K., Stelling, J. M., Strauss, J., Swindles, G. T., Talbot, J., Tarnocai, C., Verstraeten, G., Williams, C. J., Xia, Z., Yu, Z., Väliranta, M., Hättestrand, M., Alexanderson, H., and Brovkin, V.: Widespread global peatland establishment and persistence over the last 130,000 y, P. Natl. Acad. Sci. USA, 116, 201813305, https://doi.org/10.1073/pnas.1813305116, 2019. a, b, c, d
Turetsky, M. R., Kotowska, A., Bubier, J., Dise, N. B., Crill, P., Hornibrook, E. R., Minkkinen, K., Moore, T. R., Myers-Smith, I. H., Nykänen, H., Olefeldt, D., Rinne, J., Saarnio, S., Shurpali, N., Tuittila, E. S., Waddington, J. M., White, J. R., Wickland, K. P., and Wilmking, M.: A synthesis of methane emissions from 71 northern, temperate, and subtropical wetlands, Glob. Change Biol., 20, 2183–2197, https://doi.org/10.1111/gcb.12580, 2014. a, b
Turetsky, M. R., Benscoter, B., Page, S., Rein, G., Van Der Werf, G. R., and Watts, A.: Global vulnerability of peatlands to fire and carbon loss, Nat. Geosci., 8, 11–14, https://doi.org/10.1038/ngeo2325, 2015. a, b
Turetsky, M. R., Abbott, B. W., Jones, M. C., Anthony, K. W., Olefeldt, D., Schuur, E. A., Grosse, G., Kuhry, P., Hugelius, G., Koven, C., Lawrence, D. M., Gibson, C., Sannel, A. B. K., and McGuire, A. D.: Carbon release through abrupt permafrost thaw, Nat. Geosci., 13, 138–143, https://doi.org/10.1038/s41561-019-0526-0, 2020. a, b
Voigt, C., Marushchak, M. E., Mastepanov, M., Lamprecht, R. E., Christensen, T. R., Dorodnikov, M., Jackowicz‐Korczyński, M., Lindgren, A., Lohila, A., Nykänen, H., Oinonen, M., Oksanen, T., Palonen, V., Treat, C. C., Martikainen, P. J., and Biasi, C.: Ecosystem carbon response of an Arctic peatland to simulated permafrost thaw, Glob. Change Biol., 25, 1746–1764, https://doi.org/10.1111/gcb.14574, 2019. a, b
Volodin, E., Mortikov, E., Gritsun, A., Lykossov, V., Galin, V., Diansky, N., Gusev, A., Kostrykin, S., Iakovlev, N., Shestakova, A., and Emelina, S.: INM INM-CM5-0 model output prepared for CMIP6 CMIP historical, Version 20200601, https://doi.org/10.22033/ESGF/CMIP6.5070, 2019a. a
Volodin, E., Mortikov, E., Gritsun, A., Lykossov, V., Galin, V., Diansky, N., Gusev, A., Kostrykin, S., Iakovlev, N., Shestakova, A., and Emelina, S.: INM INM-CM5-0 model output prepared for CMIP6 ScenarioMIP, Version 20200601, https://doi.org/10.22033/ESGF/CMIP6.12322, 2019b. a
Volodin, E. M., Mortikov, E. V., Kostrykin, S. V., Galin, V. Y., Lykossov, V. N., Gritsun, A. S., Diansky, N. A., Gusev, A. V., and Iakovlev, N. G.: Simulation of the present-day climate with the climate model INMCM5, Clim. Dynam., 49, 3715–3734, https://doi.org/10.1007/s00382-017-3539-7, 2017. a
Waddington, J. M., Morris, P. J., Kettridge, N., Granath, G., Thompson, D. K., and Moore, P. A.: Hydrological feedbacks in northern peatlands, Ecohydrology, 8, 113–127, https://doi.org/10.1002/eco.1493, 2015. a
Wang, S., Zhuang, Q., Lähteenoja, O., Draper, F. C., and Cadillo-Quiroz, H.: Potential shift from a carbon sink to a source in Amazonian peatlands under a changing climate, P. Natl. Acad. Sci. USA, 115, 12407–12412, https://doi.org/10.1073/pnas.1801317115, 2018. a
Wania, R., Ross, I., and Prentice, I. C.: Integrating peatlands and permafrost into a dynamic global vegetation model: 2. Evaluation and sensitivity of vegetation and carbon cycle processes, Global Biogeochem. Cy., 23, GB3015, https://doi.org/10.1029/2008GB003413, 2009a. a, b, c
Wania, R., Ross, L., and Prentice, I. C.: Integrating peatlands and permafrost into a dynamic global vegetation model: 1. Evaluation and sensitivity of physical land surface processes, Global Biogeochem. Cy., 23, 1–19, https://doi.org/10.1029/2008GB003412, 2009b. a
Warren, M., Frolking, S., Dai, Z., and Kurnianto, S.: Impacts of land use, restoration, and climate change on tropical peat carbon stocks in the twenty-first century: implications for climate mitigation, Mitig. Adapt. Strateg. Glob. Change, 22, 1041–1061, https://doi.org/10.1007/s11027-016-9712-1, 2017. a, b
Wibisana, A. G. and Setyorini, S. N.: Peatland Protection in Indonesia: Toward the Right Direction?, in: Springer Clim., Springer International Publishing, 301–328, https://doi.org/10.1007/978-3-030-55536-8_15, 2021. a
Wieners, K.-H., Giorgetta, M., Jungclaus, J., Reick, C., Esch, M., Bittner, M., Gayler, V., Haak, H., de Vrese, P., Raddatz, T., Mauritsen, T., von Storch, J.-S., Behrens, J., Brovkin, V., Claussen, M., Crueger, T., Fast, I., Fiedler, S., Hagemann, S., Hohenegger, C., Jahns, T., Kloster, S., Kinne, S., Lasslop, G., Kornblueh, L., Marotzke, J., Matei, D., Meraner, K., Mikolajewicz, U., Modali, K., Müller, W., Nabel, J., Notz, D., Peters, K., Pincus, R., Pohlmann, H., Pongratz, J., Rast, S., Schmidt, H., Schnur, R., Schulzweida, U., Six, K., Stevens, B., Voigt, A., and Roeckner, E.: MPI-M MPIESM1.2-LR model output prepared for CMIP6 ScenarioMIP, Version 20200601, https://doi.org/10.22033/ESGF/CMIP6.793, 2019a. a
Wieners, K.-H., Giorgetta, M., Jungclaus, J., Reick, C., Esch, M., Bittner, M., Legutke, S., Schupfner, M., Wachsmann, F., Gayler, V., Haak, H., de Vrese, P., Raddatz, T., Mauritsen, T., von Storch, J.-S., Behrens, J., Brovkin, V., Claussen, M., Crueger, T., Fast, I., Fiedler, S., Hagemann, S., Hohenegger, C., Jahns, T., Kloster, S., Kinne, S., Lasslop, G., Kornblueh, L., Marotzke, J., Matei, D., Meraner, K., Mikolajewicz, U., Modali, K., Müller, W., Nabel, J., Notz, D., Peters, K., Pincus, R., Pohlmann, H., Pongratz, J., Rast, S., Schmidt, H., Schnur, R., Schulzweida, U., Six, K., Stevens, B., Voigt, A., and Roeckner, E.: MPI-M MPI-ESM1.2-LR model output prepared for CMIP6 CMIP historical, Version 20200601, https://doi.org/10.22033/ESGF/CMIP6.6595, 2019b. a
Wilson, R. M., Hopple, A. M., Tfaily, M. M., Sebestyen, S. D., Schadt, C. W., Pfeifer-Meister, L., Medvedeff, C., McFarlane, K. J., Kostka, J. E., Kolton, M., Kolka, R., Kluber, L. A., Keller, J. K., Guilderson, T. P., Griffiths, N. A., Chanton, J. P., Bridgham, S. D., and Hanson, P. J.: Stability of peatland carbon to rising temperatures, Nat. Commun., 7, 13723, https://doi.org/10.1038/ncomms13723, 2016. a
Xu, H., Lan, J., Sheng, E., Liu, Y., Liu, B., Yu, K., Ye, Y., Cheng, P., Qiang, X., Lu, F., and Wang, X.: Tropical/Subtropical Peatland Development and Global CH4 during the Last Glaciation, Sci. Rep., 6, 30431, https://doi.org/10.1038/srep30431, 2016. a
Xu, J., Morris, P. J., Liu, J., and Holden, J.: Hotspots of peatland-derived potable water use identified by global analysis, Nat. Sustain., 1, 246–253, https://doi.org/10.1038/s41893-018-0064-6, 2018a. a
Xu, J., Morris, P. J., Liu, J., and Holden, J.: PEATMAP: Refining estimates of global peatland distribution based on a meta-analysis, CATENA, 160, 134–140, https://doi.org/10.1016/j.catena.2017.09.010, 2018b. a, b, c, d, e, f
Xu-Ri, Prentice, I. C., Spahni, R., and Niu, H. S.: Modelling terrestrial nitrous oxide emissions and implications for climate feedback, New Phytol., 196, 472–488, https://doi.org/10.1111/j.1469-8137.2012.04269.x, 2012. a
Young, D. M., Baird, A. J., Morris, P. J., and Holden, J.: Simulating the long-term impacts of drainage and restoration on the ecohydrology of peatlands, Water Resour. Res., 53, 6510–6522, https://doi.org/10.1002/2016WR019898, 2017. a
Yu, Z.: Holocene carbon flux histories of the world's peatlands: Global carbon-cycle implications, The Holocene, 21, 761–774, https://doi.org/10.1177/0959683610386982, 2011. a
Yu, Z., Loisel, J., Brosseau, D. P., Beilman, D. W., and Hunt, S. J.: Global peatland dynamics since the Last Glacial Maximum, Geophys. Res. Lett., 37, 1–5, https://doi.org/10.1029/2010GL043584, 2010. a, b, c, d
Yu, Z., Loisel, J., Turetsky, M. R., Cai, S., Zhao, Y., Frolking, S., MacDonald, G. M., and Bubier, J. L.: Evidence for elevated emissions from high-latitude wetlands contributing to high atmospheric CH4 concentration in the early Holocene, Global Biogeochem. Cy., 27, 131–140, https://doi.org/10.1002/gbc.20025, 2013. a
Yu, Z., Loisel, J., Charman, D. J., Beilman, D. W., and Camill, P.: Holocene peatland carbon dynamics in the circum-Arctic region: An introduction, The Holocene, 24, 1021–1027, https://doi.org/10.1177/0959683614540730, 2014. a
Yu, Z. C.: Northern peatland carbon stocks and dynamics: A review, Biogeosciences, 9, 4071–4085, https://doi.org/10.5194/bg-9-4071-2012, 2012. a, b
Yukimoto, S., Kawai, H., Koshiro, T., Oshima, N., Yoshida, K., Urakawa, S., Tsujino, H., Deushi, M., Tanaka, T., Hosaka, M., Yabu, S., Yoshimura, H., Shindo, E., Mizuta, R., Obata, A., Adachi, Y., and Ishii, M.: The Meteorological Research Institute Earth System Model Version 2.0, MRI-ESM2.0: Description and Basic Evaluation of the Physical Component, J. Meteorol. Soc. Jpn. Ser. II, 97, 931–965, https://doi.org/10.2151/jmsj.2019-051, 2019a. a
Yukimoto, S., Koshiro, T., Kawai, H., Oshima, N., Yoshida, K., Urakawa, S., Tsujino, H., Deushi, M., Tanaka, T., Hosaka, M., Yoshimura, H., Shindo, E., Mizuta, R., Ishii, M., Obata, A., and Adachi, Y.: MRI MRI-ESM2.0 model output prepared for CMIP6 CMIP historical, Version 20200601, https://doi.org/10.22033/ESGF/CMIP6.6842, 2019b. a
Yukimoto, S., Koshiro, T., Kawai, H., Oshima, N., Yoshida, K., Urakawa, S., Tsujino, H., Deushi, M., Tanaka, T., Hosaka, M., Yoshimura, H., Shindo, E., Mizuta, R., Ishii, M., Obata, A., and Adachi, Y.: MRI MRI-ESM2.0 model output prepared for CMIP6 ScenarioMIP, Version 20200601, https://doi.org/10.22033/ESGF/CMIP6.638, 2019c. a
Zhang, H., Väliranta, M., Piilo, S., Amesbury, M. J., Aquino‐López, M. A., Roland, T. P., Salminen‐Paatero, S., Paatero, J., Lohila, A., and Tuittila, E.: Decreased carbon accumulation feedback driven by climate‐induced drying of two southern boreal bogs over recent centuries, Glob. Change Biol., 26, 2435–2448, https://doi.org/10.1111/gcb.15005, 2020. a, b
Zhong, Y., Jiang, M., and Middleton, B. A.: Effects of water level alteration on carbon cycling in peatlands, Ecosyst. Heal. Sustain., 6, 1806113, https://doi.org/10.1080/20964129.2020.1806113, 2020. a, b
Zickfeld, K., Eby, M., Weaver, A. J., Alexander, K., Crespin, E., Edwards, N. R., Eliseev, A. V., Feulner, G., Fichefet, T., Forest, C. E., Friedlingstein, P., Goosse, H., Holden, P. B., Joos, F., Kawamiya, M., Kicklighter, D., Kienert, H., Matsumoto, K., Mokhov, I. I., Monier, E., Olsen, S. M., Pedersen, J. O., Perrette, M., Philippon-Berthier, G., Ridgwell, A., Schlosser, A., Von Deimling, T. S., Shaffer, G., Sokolov, A., Spahni, R., Steinacher, M., Tachiiri, K., Tokos, K. S., Yoshimori, M., Zeng, N., and Zhao, F.: Long-Term climate change commitment and reversibility: An EMIC intercomparison, J. Clim., 26, 5782–5809, https://doi.org/10.1175/JCLI-D-12-00584.1, 2013. a