the Creative Commons Attribution 4.0 License.
the Creative Commons Attribution 4.0 License.
 | 12 Jul 2021
Variable tree rooting strategies are key for modelling the distribution, productivity and evapotranspiration of tropical evergreen forests
Boris Sakschewski
Werner von Bloh
Markus Drüke
Anna Amelia Sörensson
Romina Ruscica
Fanny Langerwisch
Maik Billing
Sarah Bereswill
Marina Hirota
Rafael Silva Oliveira
Jens Heinke
Kirsten Thonicke
A variety of modelling studies have suggested tree rooting depth as a key variable to explain evapotranspiration rates, productivity and the geographical distribution of evergreen forests in tropical South America. However, none of those studies have acknowledged resource investment, timing and physical constraints of tree rooting depth within a competitive environment, undermining the ecological realism of their results. Here, we present an approach of implementing variable rooting strategies and dynamic root growth into the LPJmL4.0 (Lund-Potsdam-Jena managed Land) dynamic global vegetation model (DGVM) and apply it to tropical and sub-tropical South America under contemporary climate conditions. We show how competing rooting strategies which underlie the trade-off between above- and below-ground carbon investment lead to more realistic simulation of intra-annual productivity and evapotranspiration and consequently of forest cover and spatial biomass distribution. We find that climate and soil depth determine a spatially heterogeneous pattern of mean rooting depth and below-ground biomass across the study region. Our findings support the hypothesis that the ability of evergreen trees to adjust their rooting systems to seasonally dry climates is crucial to explaining the current dominance, productivity and evapotranspiration of evergreen forests in tropical South America.
- Article
(10833 KB) - Full-text XML
- BibTeX
- EndNote


Tropical evergreen forest is the naturally dominant biome type in South America over a large climatic range including regions with a marked dry season (Hirota et al., 2011; Xiao et al., 2006). To withstand seasonal shortages of precipitation and sustain productivity, trees with evergreen phenology often have access to deep soil water via deep roots (Brum et al., 2019; Canadell et al., 1996; Johnson et al., 2018; Kim et al., 2012; Markewitz et al., 2010). Consequently, recent studies have suggested a heterogeneous spatial pattern of maximum rooting depth across tropical forest biomes in South America which differs by orders of magnitude depending on local groundwater, soil and climate conditions (Canadell et al., 1996; Fan et al., 2017). So far different modelling approaches have been presented which have highlighted the crucial role of rooting depth in the productivity and therefore the distribution of evergreen trees in South America. In a pioneering study more than 20 years ago, Kleidon and Heimann (1998) systematically searched for rooting strategies which yield the highest net primary productivity over South America with a dynamic global vegetation model (DGVM) to explain intra-annual rates of evapotranspiration (ET) and vegetation cover. Follow-up studies have further underlined the importance of deep roots for the water cycle of South America (Kleidon and Heimann, 2000). Accordingly, Lee et al. (2005) found that allowing for deep roots and hydraulic redistribution of water in the soil column in a general circulation model (GCM) improved simulated Amazon forest productivity and ET in the dry season. Baker et al. (2008) came to similar results when introducing deep roots in a land surface model. Ichii et al. (2007) found that constraining rooting depth across the Amazon based on satellite-derived data of forest productivity yields similar results in a terrestrial ecosystem model. More recently, Langan et al. (2017) showed for the same study area how diverse rooting strategies in a tree individual and a trait-based DGVM can improve simulated intra-annual productivity and ET as well as better explain patterns of different tropical biome types and biomass in fire-prone ecosystems. While these studies are important steps in acknowledging the diversity of tree rooting depth and its effects on ET and forest productivity, some assumptions of the underlying models might decrease the reliability of their results. These assumptions are related to (1) resource investment, (2) temporal growth and (3) physical constraints of rooting depth.
(1) Most global vegetation models so far have not accounted for coarse roots (Warren et al., 2015) even though such roots can make up the majority of total root biomass (Xiao et al., 2003). This approach in global vegetation models may be sufficient when employing shallow tree rooting strategies only, but with increasing rooting depth, costs for coarse roots increase substantially. Since the amount of resources trees can allocate to their processes and structures is finite, a local adaptation of tree rooting depth must follow a trade-off between above- and below-ground resource investment (Nikolova et al., 2011). Generally, above-ground investments in leaf and stem growth can increase light absorption and CO2 uptake, while below-ground investments can increase the uptake of water and nutrients. Depending on local environmental and competitive conditions, one or the other allocation strategy might be more advantageous, eventually leading to substantial regional variation in the mean ratios between below-ground and above-ground biomass (Leuschner et al., 2007; Mokany et al., 2006). Therefore, the simulated spectrum of tree rooting strategies which can survive and co-exist should be in accordance with this crucial trade-off. (2) In contrast to above-ground stem growth, most global vegetation models do not simulate gradual root growth (Warren et al., 2015). Instead simulated vegetation types are assigned a constant relative distribution of fine roots throughout the soil column at any point in space and time (Best et al., 2011; Lawrence et al., 2011; Schaphoff et al., 2018a; Smith et al., 2014). As under the above-mentioned simplification under (1), this approach may be sufficient when accounting for shallow rooting strategies only, but when the maximum tree rooting depth is strongly increased, it is questionable that the time needed to reach this depth is negligible, especially when accounting for competition of different vegetation types. Rooting depth increases rather gradually and non-linearly over a tree's lifetime with a velocity driven by a mix of plastic optimization and allometric determination (Brum et al., 2019; Brunner et al., 2015; Nikolova et al., 2011; Poorter et al., 2012; Warren et al., 2015). Even though smaller-scale models have implemented root optimization schemes in the past (Schymanski et al., 2008), the knowledge base for a mechanistic bottom-up modelling approach of plastic root optimization is very sparse (Jenik, 1978; Poorter et al., 2012; Warren et al., 2015) and knowledge of certain allometric rules (Brum et al., 2019; Eshel and Grünzweig, 2013; Mokany et al., 2006) seems enough to be applied in global vegetation models. (3) Most global vegetation models so far have not accounted for a location-dependent soil depth but have applied a constant soil depth across the globe (Best et al., 2011; Guimberteau et al., 2017; Lawrence et al., 2011; Ostle et al., 2009; Schaphoff et al., 2018a; Smith et al., 2014). Again, this approach may be sufficient when accounting for shallow rooting strategies only, but allowing for deep tree rooting strategies should go in parallel with accounting for their potential physical barriers. Recent data products on global soil depth now enable the better constraining of rooting depth in vegetation models across scales (Pelletier et al., 2016).
Here we overcome the above-mentioned limitations and present a new approach of diversifying tree rooting strategies of tropical plant functional types (PFTs) in the DGVM LPJmL4.0 (Lund-Potsdam-Jena managed Land; Schaphoff et al., 2018a) which increases the ecological reliability with the following aspects: (1) a global product of soil depth restricts the maximum tree rooting depth; (2) PFTs are sub-divided according to a broad spectrum of different possible tree rooting strategies with a range of maximum rooting depths between 0.5 and 18 m; (3) all sub-PFTs grow in competition and their individual performance determines dominance; (4) dominance is supported by the best-performing sub-PFTs increasing their establishment rate; (5) sub-PFTs have to invest carbon in coarse roots, i.e. acknowledging the trade-off between growing deeper roots and allocating available carbon to other compartments (stem and leaf growth); and (6) sub-PFT roots are growing deeper over time depending on tree height. Given these new model developments we here re-evaluate the hypotheses that, with regard to tropical evergreen forests in South America,
- I.
climate and soil depth determine dominant tree rooting strategies,
- II.
tree rooting depth influences distribution and dominance, and
- III.
diverse tree rooting strategies are key for explaining rates of evapotranspiration and productivity.
Therefore, we compare several model versions of LPJmL4.0 differing in the above-mentioned model developments and evaluate simulated evapotranspiration, productivity, biomass and spatial distribution of evergreen and deciduous tree PFTs using different sources of validation data.
2.1 The LPJmL4.0 model
LPJmL4.0 is a process-based dynamic global vegetation model (DGVM) which simulates the surface energy balance, water fluxes, fire disturbance, carbon fluxes and stocks of the global land (Schaphoff et al., 2018a). Plant productivity is modelled on the basis of leaf-level photosynthesis responding to climatic and environmental conditions, atmospheric CO2 concentration, canopy conductance, autotrophic respiration, phenology, and management intensity. Fire disturbance is modelled using the simple fire module Glob-FIRM (Thonicke et al., 2001), which relates the length of the fire season to fractional annual area burnt. The model simulates 11 plant functional types (PFTs), 3 bioenergy functional types (BFTs) and 12 crop functional types (CFTs) to represent average plants of natural vegetation, bioenergy plantations and agriculture, respectively. Three PFTs represent the natural vegetation of the tropics and sub-tropics, namely the “tropical broadleaved evergreen tree” mainly representing tropical evergreen forest; the “tropical broadleaved deciduous tree” representing tropical dry forest and the woody component of savanna; and “tropical herbs” representing the herbaceous layer in grasslands, savanna and forests. The standard spatial model resolution is a 0.5∘ × 0.5∘ longitude–latitude grid. For each grid cell the fractional coverage of bioenergy and agricultural BFTs and CFTs follows a prescribed land-use data set, whereas in the remaining grid-cell area, natural PFTs grow in competition.
2.2 A new tree rooting scheme for LPJmL4.0
All changes made to LPJmL4.0 in order to simulate variable tree rooting strategies resulted in a new sub-version of LPJmL4.0 which we call LPJmL4.0-VR hereafter (where VR stands for variable roots). A detailed description of our modelling approach can be found in Appendix A.
For our purposes we extended the general maximum soil depth of 3 m in LPJmL4.0 to 20 m in LPJmL4.0-VR but restrict it to local soil depth information at the spatial model resolution of 0.5∘ × 0.5∘; see Sect. 2.3.2. We applied the same basic scheme for vertical soil layer partitioning from LPJmL4.0 (Schaphoff et al., 2018a) in order to keep model differences small (Appendix A, Sect. A1.1 and Table A1). We increased the number of rooting strategies for each of the two tropical tree PFTs (broadleaved evergreen and broadleaved deciduous), by splitting each PFT into 10 sub-PFTs. Each of those 10 sub-PFTs was assigned a different maximum vertical distribution of fine roots throughout the soil column following classical allometric rules applied in LPJmL4.0 (Appendix A, Sect. A1.3 and Fig. A1). Those distributions were chosen in order to allow the sub-PFTs to reach different maximum rooting depths in discrete steps between 0.5 and 18 m (Table A2). We here refer to the depth at which the cumulated fine-root biomass from the soil surface downwards amounts to 95 % (D95_max; Eq. A3). To account for additional carbon investments needed to grow deeper rooting systems, we introduced two new carbon pools, namely root sapwood and root heartwood (Appendix A, Sect. A1.4). Like stem sapwood in LPJmL4.0, root sapwood in LPJmL4.0-VR also needs to satisfy the assumptions of the pipe model (Shinozaki et al., 1964; Waring et al., 1982). This implementation creates a trade-off between below-ground and above-ground carbon investment. To allow for dynamic root growth, we implemented a logistic root growth function, which calculates a general maximum conceivable tree rooting depth depending on tree height (Appendix A, Sect. A1.5), in an approximation of the findings of Brum et al. (2019). Consequently, each sub-PFT shows a logistic growth of rooting depth which is dependent on the sub-PFT height and which saturates towards its specific D95_max (Fig. A2). Therefore, limitations of above-ground sub-PFT growth due to below-ground carbon investment of different tree rooting strategies (Sect. 2.2.4) are equal in the sapling phase of all sub-PFTs (starting from bare ground) but diverge with increasing sub-PFT height. In the case that temporal root depths exceed the grid-cell specific local soil depth (as prescribed by local soil depth information; see Sect. 2.3.2), all the respective fine-root biomass exceeding this soil depth is transferred to the last soil layer matching this soil depth (see also Fig. 1 and Supplementary Video 1 for a visualization of new below-ground carbon pools and root growth in LPJmL4.0-VR available at http://www.pik-potsdam.de/~borissa/LPJmL4_VR/Supplementary_Video_1.pptx, last access: 20 March 2020).
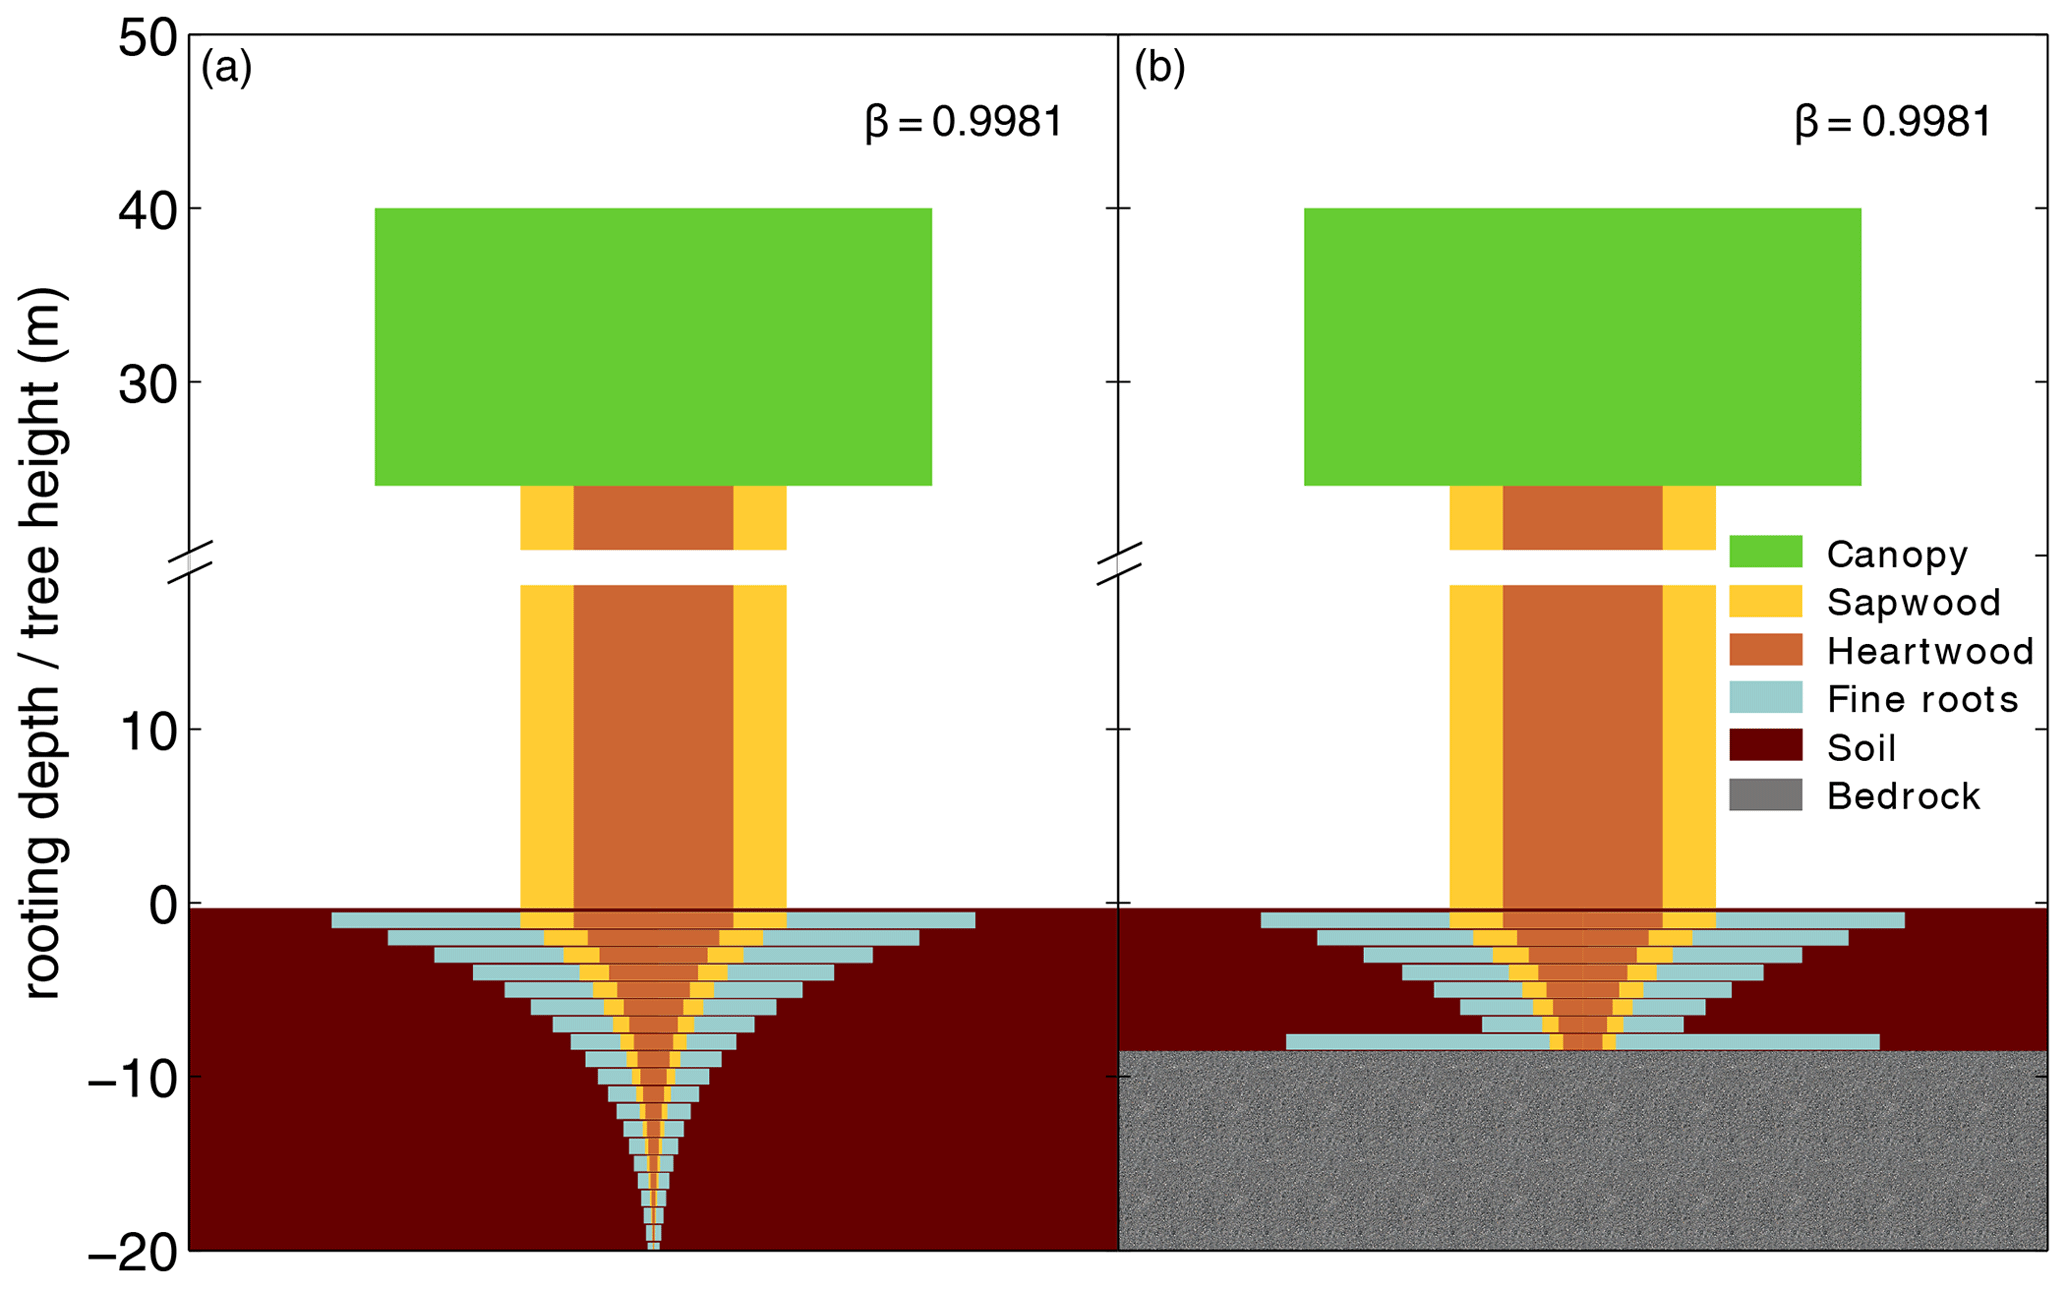
Figure 1Visualization of below-ground carbon allocation to different carbon pools of a tree PFT in LPJmL4.0-VR with a height of 40 m and a D95_max of 14 m (sub-PFT no. 8 in Table A2) growing in a grid cell with a soil depth of 20 m (a) and a soil depth of 7 m (b). As with stem sapwood, root sapwood also needs to satisfy the pipe model. In the first soil layer the root sapwood cross-sectional area is equal to the stem sapwood cross-sectional area, as all water taken up by fine roots needs to pass this layer. In each following soil layer, the root sapwood cross-sectional area is reduced by the sum of the relative amount of fine roots of all soil layers above, thus adjusting the amount of sapwood needed to satisfy the pipe model. Please also see Supplementary Video 1 for a visualization of root growth and development of below-ground carbon pools over time available at http://www.pik-potsdam.de/~borissa/LPJmL4_VR/Supplementary_Video_1.pptx.
To fully investigate the effects of 20 tropical sub-PFTs growing in competition, we adjusted the original PFT establishment routine of LPJmL4.0 (Appendix A, Sect. A1.6). The adjustments lead to a higher establishment rate for productive sub-PFTs relative to their spatial dominance and vice versa, without changing the overall establishment rate as originally set by Prentice et al. (1993). The adjusted establishment routine has the effect that non-viable sub-PFTs are outcompeted over time. Furthermore, we increased the universal and constant maximum background mortality rate of tree PFTs in LPJmL4.0-VR to 7 % in order to counter-balance increased survival rates and therefore biomass accumulation under enhanced water access (Appendix A, Sect. A1.7).
2.3 Model input data
2.3.1 Climate input data
All versions of LPJmL used in this study (Sect. 2.4) were forced with four different climate inputs, each delivering the climate variables air temperature, precipitation, and long-wave and short-wave downward radiation at daily or monthly resolution:
-
A combination of the WATCH data set (Weedon et al., 2011) and the WFDEI data set (Weedon et al., 2014), as used in the ISIMIP (https://www.isimip.org/gettingstarted/input-data-bias-correction/details/5/, last access: 20 June 2019), was used. This input data set is called WATCH+WFDEI hereafter.
-
The Global Soil Wetness Project Phase 3 (GSWP3) was used (Dirmeyer et al., 2006; http://hydro.iis.u-tokyo.ac.jp/GSWP3/index.html, last access: 20 June 2019).
-
The Noah Global Land Assimilation System version 2.0 was used (GLDAS; Rodell et al., 2004).
-
Climate forcing as in Schaphoff et al. (2018a) was used, with monthly precipitation provided by the Global Precipitation Climatology Centre (GPCC Full Data Reanalysis version 7.0; Becker et al., 2013), daily mean temperature from the Climate Research Unit (CRU TS version 3.23; Harris et al., 2014), short-wave downward radiation and net downward radiation reanalysis data from ERA-Interim (Dee et al., 2011), and number of wet days from New et al. (2000) used to allocate monthly precipitation to individual days. This input data set is called CRU hereafter.
2.3.2 Soil and sediment thickness
For this study, we regridded a global 1×1 km soil and sediment thickness product (Pelletier et al., 2016) to the 0.5∘ × 0.5∘ spatial resolution of LPJmL4.0-VR, set the global maximum value to 20 m according to the maximum soil depth chosen for LPJmL4.0-VR (Sect. 2.2 and Appendix A, Sect. A1.1), and used the resulting map as grid-cell-specific model input (Fig. A3). Regridding was performed using the software R (R Core Team, 2019) with the package “raster” (Hijmans and van Etten, 2016). We used the aggregate function to calculate the average value of all data entries of Pelletier et al. (2016) falling into the coarser 0.5∘ grid of LPJmL.
2.4 Model versions and simulation protocol
In order to investigate the impact of simulating variable rooting strategies and root growth, we employ three model versions of LPJmL in this study: (1) LPJmL4.0, (2) LPJmL4.0-VR and (3) LPJmL4.0-VR-base. LPJmL4.0-VR-base has the same settings as LPJmL4.0-VR except variable rooting strategies, i.e. using the two rooting strategy parameterizations of LPJmL4.0 (Appendix A, Sect. A1.3) for the respective 10 sub-PFTs of the tropical broadleaved evergreen PFT and the tropical broadleaved deciduous PFT. We regard LPJmL4.0-VR-base as the baseline model of this study because comparisons to LPJmL4.0-VR enable the investigation of differences caused by the presence or absence of variable tree rooting strategies.
Each simulation was initialized with 5000 simulation years of spin-up from bare ground without land use by periodically cycling the first 30 years of the respective climate data set (1901–1930 for WATCH+WFDEI, GSWP3, and CRU and 1948–1977 for GLDAS) and using a pre-industrial atmospheric CO2 level of 278 ppm. The first spin-up ensures that carbon pools and local distributions of PFTs and sub-PFTs are in equilibrium with the climate (Schaphoff et al., 2018a). In a second spin-up phase cycling the same 30 years of climate data, historical land use and changing levels of atmospheric CO2 concentration are introduced. The second spin-up starts in the year 1700 and ends with the first year available in each climate data set. Land use is updated annually as described in Schaphoff et al. (2018a). Before the year 1840 a constant pre-industrial atmospheric CO2 concentration of 278 ppm is prescribed. After this year atmospheric CO2 increases annually based on data of Tans and Keeling (2015) as described in Schaphoff et al. (2018a). After the second spin-up, transient simulations start with the first year available in each climate data set and end in 2010. Land use and atmospheric CO2 are consistently updated annually while continuing to follow the same data sets as used in the second spin-up.
At the beginning of the first spin-up, all sub-PFTs in LPJmL4.0-VR and LPJmL4.0-VR-base have the same chance to establish; i.e. tree rooting strategies are uniformly distributed. During the spin-up simulations, local environmental filtering and competition in connection with PFT-dominance-dependent establishment rates (Sect. 2.2 and Appendix A, Sect. A1.6) determine which tree rooting strategies are best suited and which are outcompeted. Therefore, the transient simulations already start with distinct distributions of tree rooting strategies.
2.5 Model validation
2.5.1 Validation data
Regional biomass pattern
For evaluation of simulated regional patterns of AGB we compare the results of the three LPJmL model versions used in this study to two remote-sensing-based biomass maps (Avitabile et al., 2016; Saatchi et al., 2011) which were regridded to the spatial resolution of the LPJmL models. Data of Avitabile et al. (2016) were regridded using the software R (R Core Team, 2019) with the package raster (Hijmans and van Etten, 2016). We used the aggregate function to calculate the average value of all data entries of Avitabile et al. (2016) falling into the coarser 0.5∘ grid of LPJmL. Regridded data of Saatchi et al. (2011) were taken from Carvalhais et al. (2014).
Local-scale evapotranspiration and productivity
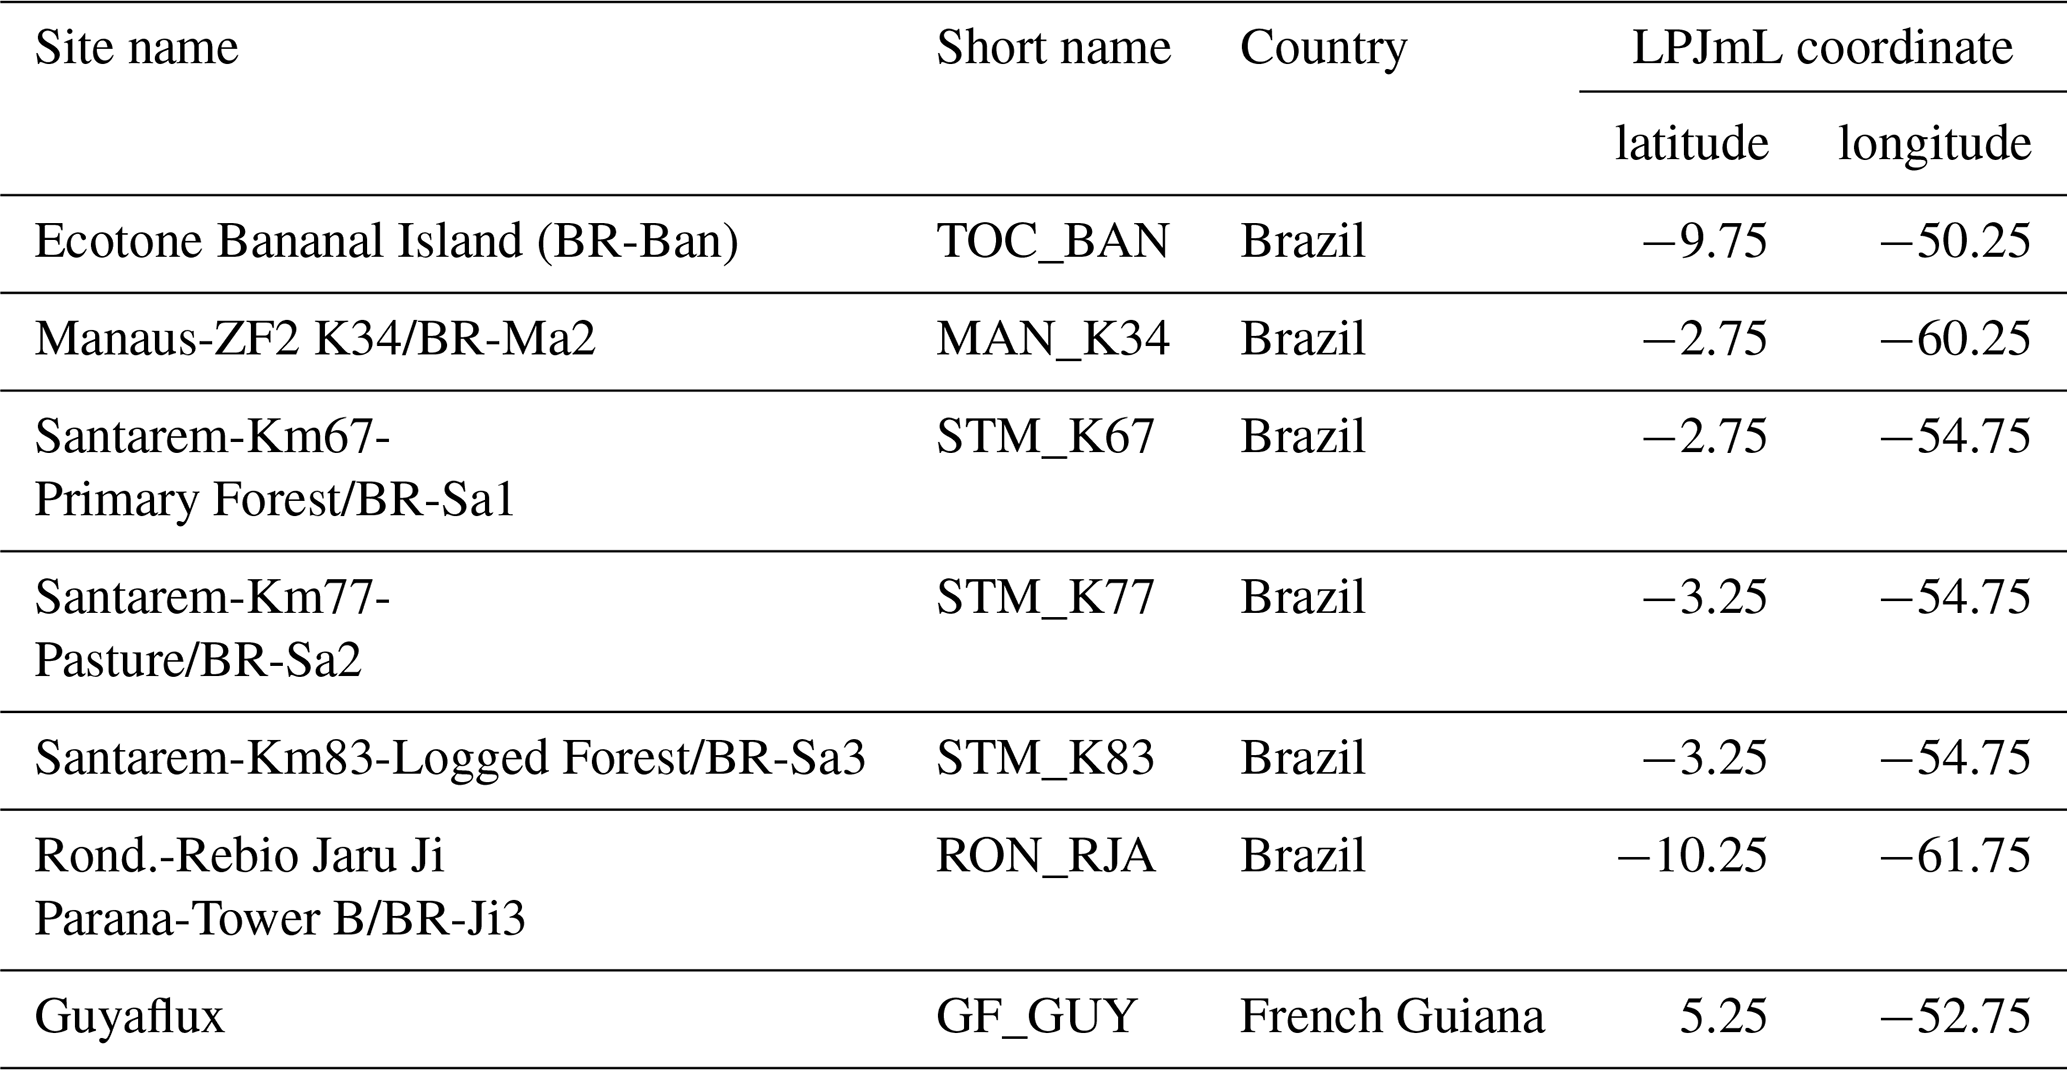
To evaluate simulated local ET and net ecosystem exchange (NEE) of the three LPJmL versions used in this study, we compare FLUXNET eddy covariance measurements of ET at seven sites and NEE at three sites across the study region (Bonal et al., 2008; Saleska et al., 2013; Table A3) to simulated rates of local ET and NEE. We used only three sites for NEE comparisons because only those sites provided continuous data covering more than 2 years. FLUXNET data were downloaded from https://fluxnet.fluxdata.org (under https://doi.org/10.18140/FLX/1440032 and https://doi.org/10.18140/FLX/1440165) on 10 October 2017 and from https://daac.ornl.gov/LBA/guides/CD32_Brazil_Flux_Network.html on 6 November 2019.
Continental-scale gridded evapotranspiration products and selection of regions
To evaluate the simulated ET over large regions and during a long period (1981–2010), we use three global gridded data sets: Global Land Data Assimilation System version 2 (Rodell et al., 2004), ERA-Interim/Land (ERAI-L; Balsamo et al., 2015) and Global Land Evaporation Amsterdam Model v3.2 (GLEAM; Miralles et al., 2011; Martens et al., 2017).
GLDAS and ERAI-L are reanalysis products, meaning that they are land surface models forced with meteorological data that have been corrected with observations to give better estimates of land surface variables. The selection of these two products is based on the study of Sörensson and Ruscica (2018), who found these models perform better over South America than other reanalysis and satellite-based ET products. GLDAS uses the land surface model Noah (Ek et al., 2003) forced by Princeton meteorological data set version 2.2 (Sheffield et al., 2006). The soil depth of Noah is 2 m, and the model uses four soil layers and vegetation data from the University of Maryland (https://geog.umd.edu/feature/global-land-cover-facility-(glcf), last access: 30 June 2021). ERAI-L uses the land surface model HTESSEL (Hydrology-Tiled ECMWF Scheme for Surface Exchanges over Land; Balsamo et al., 2009) forced by ERA-Interim atmospheric data with a GPCP-based correction (Adler et al., 2003) of monthly precipitation. The soil depth of ERAI-L is 2.89 m; the model uses four soil layers and vegetation data from ECOCLIMAP (Masson et al., 2003).
GLEAM uses the Priestley–Taylor equation to estimate the potential ET and a set of algorithms with meteorological and vegetation satellite data as input to calculate the actual ET. The version used here, GLEAMv3.2a (Martens et al., 2017; downloaded from https://www.gleam.eu/#downloads, last access: 15 June 2019), uses precipitation input from MSWEP v1.0 (Beck et al., 2017), vegetation cover from the MODIS product MOD44B and the remotely sensed vegetation optical index from CCI LPRM (Liu et al., 2013) and assimilates soil moisture from both remote sensing (ESA CCI SM v2.3; Liu et al., 2012) and land reanalysis (GLDAS Noah; Rodell et al., 2004). The original spatio-temporal resolution of GLDAS and GLEAM is 0.25∘ × 0.25∘, while for ERAI-L it is 0.75∘ × 0.75∘. Monthly time series were calculated from daily values for the three data sets. Hereafter, we use the short names GLDAS, ERAI-L and GLEAM for the described reference data sets.
For the temporal analysis of ET we used five climatological regions across the study area: Northern South America (NSA), Equatorial Amazon West (EQ W), Equatorial Amazon East (EQ E), Southern Amazon (SAMz), and the South American Monsoon System (SAMS) region (see Fig. 3f). These regions result from a k-means clustering analysis of the annual cycles of the main drivers of ET: precipitation and surface net radiation (for details see Sörensson and Ruscica, 2018). Additionally we divided the large EQ region used by Sörensson and Ruscica (2018) into two smaller regions (EQ W and EQ E) at 60∘ W, since this is the approximate division between regimes that have a maximum cumulative water deficit (MCWD; Sect. 2.5.3) of around −200 mm a−1 (EQ W) and of around −500 mm a−1 (EQ E).
Spatial distribution of vegetation types
To evaluate the simulated regional distribution of simulated biome types of the three LPJmL versions, we compare our results to satellite-derived vegetation composition maps from ESA Land Cover CCI V2.0.7 (Li et al., 2018), which were reclassified to the PFTs of LPJmL from Forkel et al. (2014). In this data set PFT dominance is indicated by foliage projected cover (FPC) which is also a standard output variable of the three LPJmL model versions, allowing a direct comparison to model results.
Spatial pattern of rooting depth
We compare regional patterns of mean rooting depth simulated with LPJmL4.0-VR to a map showing the maximum depth of root water uptake (Fan et al., 2017), which was regridded to the 0.5∘ × 0.5∘ spatial resolution of LPJmL4.0-VR. This product was inversely modelled by taking the dynamically interacting variables of soil water supply and plant water demand into account. In Fan et al. (2017) supply was based on climate, soil properties, topography, and demand of plant transpiration deduced from remotely sensed reanalysis of atmospheric water fluxes and leaf area index (LAI) data.
2.5.2 Validation metrics
All statistical evaluations of model results were based on (1) Pearson correlation and (2) normalized mean square error (NME; Kelley et al., 2013). NME is calculated as
where yi is the simulated value and xi the reference value in the grid cell or time step i. is the mean reference value. NME takes the value 0 at perfect agreement and 1 when the model performs as well as the reference mean, and values >2 indicate complete disagreement.
Maximum cumulative water deficit as indicator of seasonal water stress
To analyse and explain the geographical pattern of rooting depth, ET and productivity, we use the maximum cumulative water deficit (MCWD) as an independent indicator of potential seasonal water demand of vegetation. The MCWD is a widely used indicator for seasonal water stress of tropical and sub-tropical forests in South America (Aragão et al., 2007; Lewis et al., 2011; Malhi et al., 2009). The MCWD captures the seasonal difference in ET and precipitation in a cumulative way and therefore comprises dry-season strength and duration. Here we calculate the MCWD on a monthly basis. Therefore, we first calculate the cumulative water deficit CWDn of each month n as
where PET is the potential monthly ET and P is the monthly sum of precipitation. The CWD is constrained to values ≤0 and is set to 0 at the end of each hydrological year, here the last day of September, as in Lewis et al. (2011). We use P from climate input used for model forcing (Sect. 2.3.1) and PET as it is simulated by LPJmL4.0 (Schaphoff et al., 2018a), which is only dependent on net surface radiation and air temperature, therefore remaining an explanatory variable independent of vegetation dynamics. We chose this PET instead of using the commonly used constant ET of 100 mm per month to calculate the CWD (Aragão et al., 2007; Lewis et al., 2011; Malhi et al., 2009) because, in this way, the CWD better corresponds to the actual climatological conditions in the different LPJmL model versions used in this study (Sect. 2.4). The MCWD is then calculated as
where y indicates the calendrical year.
3.1 Regional pattern of tree rooting strategies
In LPJmL4.0-VR the contribution of each tree rooting strategy to the overall net primary productivity (NPP) appears highly dependent on local environmental conditions.
Based on the information of how much NPP each sub-PFT contributes in each grid cell, we derived maps of mean rooting depth over the whole study region for the time span 2001–2010 for each climate input used in this study (Fig. 2). Figure 2 shows the mean of the actually achieved D95 of each sub-PFT (evergreen and deciduous combined) weighted by the respective relative NPP contribution of each sub-PFT to total forest NPP (which we call , hereafter). Therefore, the regional pattern of reflects the effects of climate and soil depth. A general east-to-west gradient of over the Amazon region follows climatic gradients of precipitation and the MCWD (Figs. B1–B2), while soil depth (Fig. A3) constrains especially in the south-eastern Amazon. In general, areas with higher mean annual rainfall and a weaker dry season show lower and vice versa (please also see Fig. B3 for a detailed exemplary comparison of sub-PFT NPP for two grid cells with contrasting climate conditions). This pattern holds true under all climate inputs, with some minor local differences, and is in line with an inversely modelled global gridded product of the maximum depth of root water uptake (MDRU in Fan et al., 2017). Nevertheless, we find considerable absolute differences between MDRU and (Fig. B4), which can easily emerge from different model settings and assumptions, e.g. related to differences in spatial model resolution, simulated water percolation and underlying vegetation features.
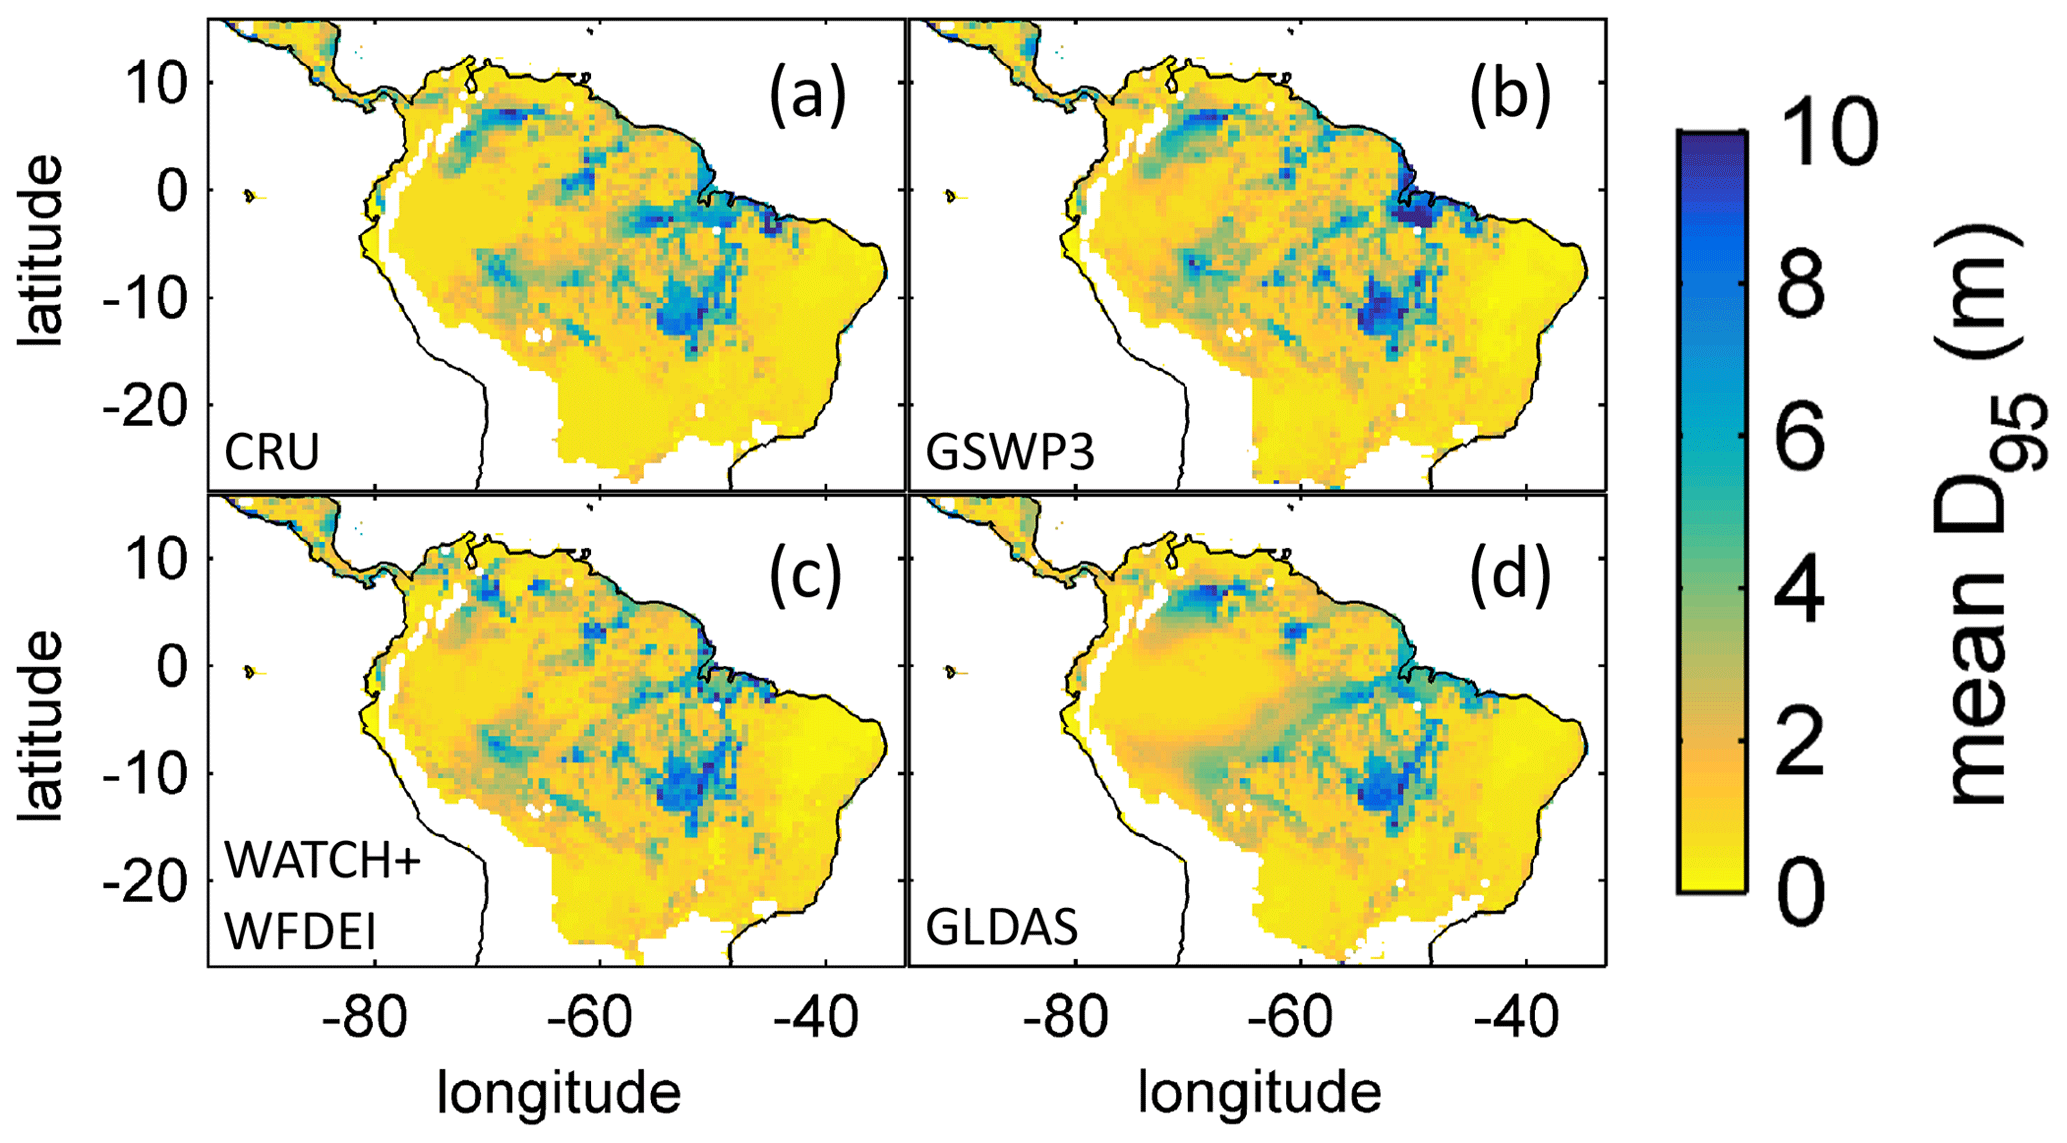
Figure 2Regional NPP-weighted mean rooting depth () of all sub-PFTs (evergreen and deciduous PFTs combined) for 2001–2010 and different climate inputs simulated with LPJmL4.0-VR. (a) CRU climate input. (b) GSWP3 climate input. (c) WATCH+WFDEI climate input. (d) GLDAS climate input. The colour-scale maximum is set to 10 m.
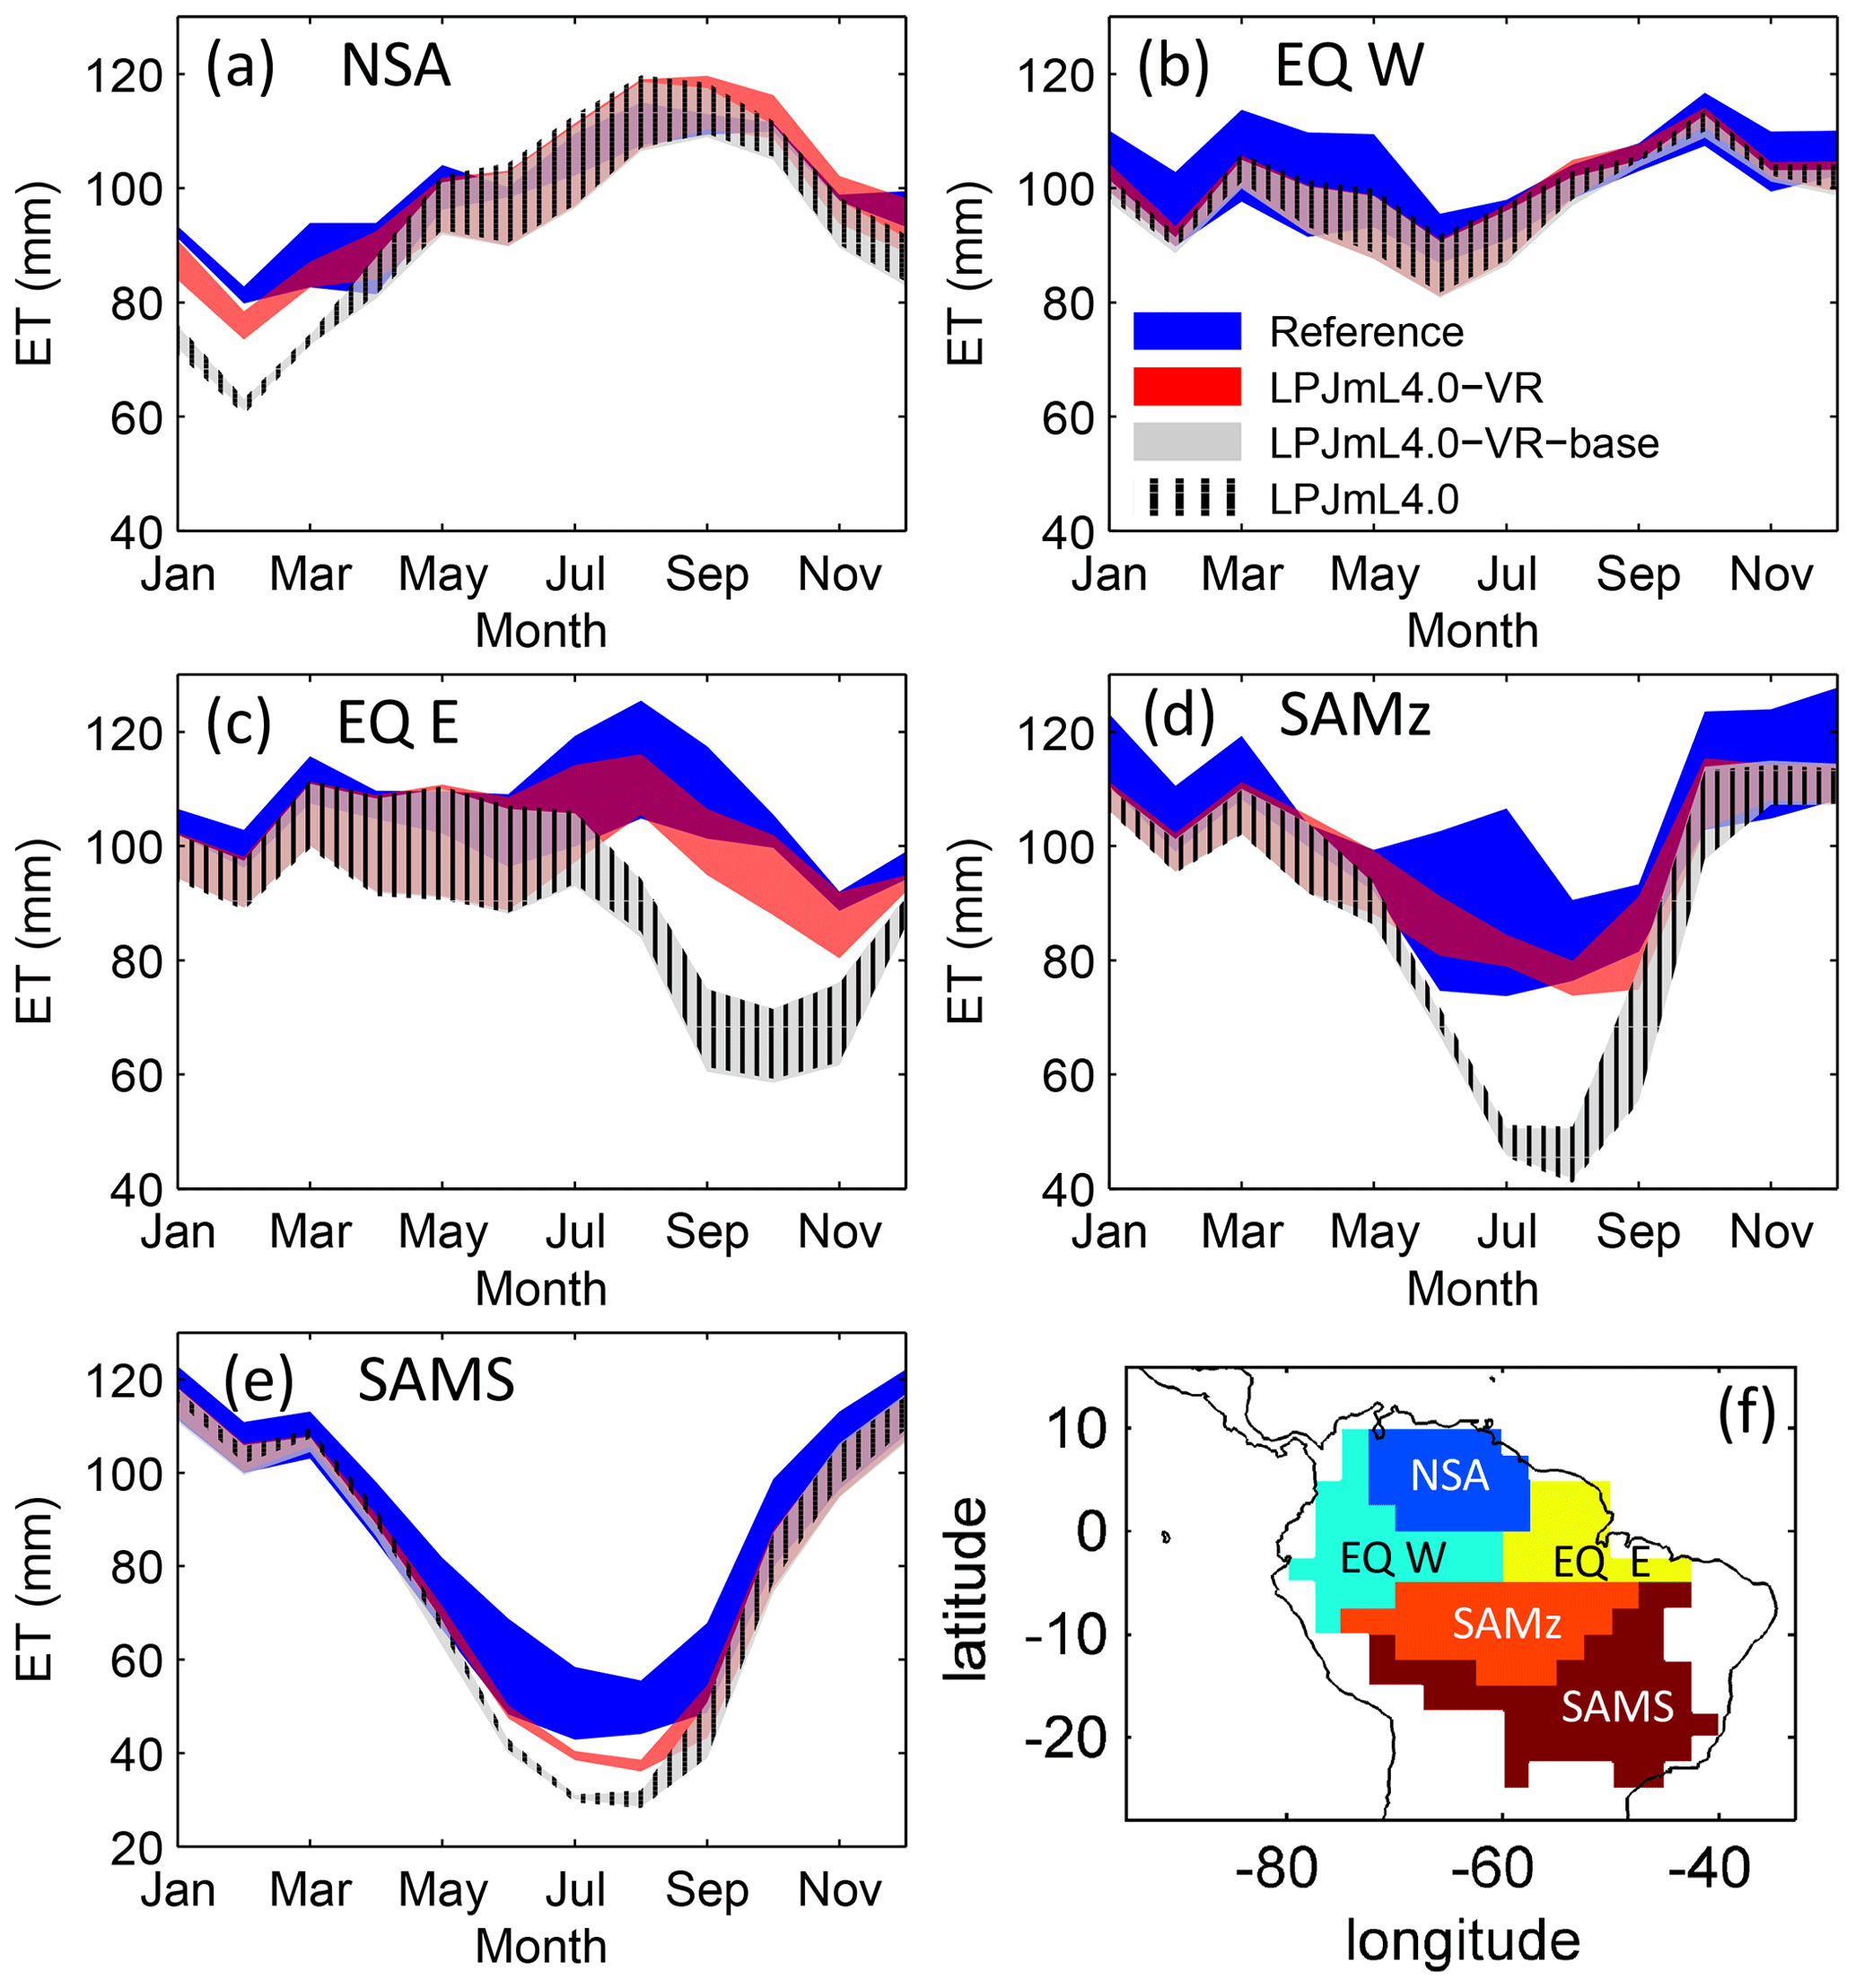
Figure 3Comparisons of continental-scale gridded ET products against simulated ET within five regional climatological clusters (a–e) as defined in Sect. 2.5.1. Shown is the mean annual cycle of 1981–2010 and the mean for the whole cluster area. Corridors denote the minimum–maximum range between either the Reference ET products (Sect. 2.5.1, “Validation data”) or the model outputs under the different climate forcings used in this study. (f) Geographical extent of climatological clusters (adapted from Sörensson and Ruscica, 2018). Statistical measures of the individual comparisons can be found in Table B3 (comparisons of corridor means).
Focussing on the climatological clusters (Sect. 2.5.1 and Fig. 3f) under CRU climate input, the western Amazon (EQ W), with mean annual precipitation (MAP) of 2708 mm and a mean MCWD of −163 mm, displays an overall mean of 1.14 m and a maximum of 5.47 m, despite considerably deeper soils present. In this cluster Fan et al. (2017) find a mean and maximum MDRU of 1.26 and 17.95 m, respectively. In the northern, western and southern Amazon clusters (NSA, EQ E, SAMz) with lower MAP of 2299, 2190 and 2035 mm and considerably lower MCWDs of −488, −438 and −497 mm, respectively, mean increases to 2.32, 3.20 and 2.68 m, respectively (mean MDRU of 1.85, 2.84 and 3.28 m). Here, maximum values reach 11.97, 11.27 and 9.04 m, respectively (maximum MDRU of 14.28, 13.47 m and 16.57 m). In the monsoon-dominated region (SAMS), displaying the lowest MAP of 1449 mm and MCWD of −649 mm, mean decreases to 1.37 m (mean MDRU 2.61 m). The maximum of this region reaches 11.17 m located at the border with SAMz (maximum MDRU 49.37 m).
The regional simulation of also allows us to generalize which tree rooting strategies occupy which climate space. Using the MCWD and MAP to define a climate space, we find a clear adjustment of (Fig. B5). A core region with deep-rooted forests (mean m) is found where the MCWD ranges between −1300 and −400 and where MAP is at least 1500 mm (see also maps of the MCWD and MAP in Figs. B1 and B2). This core region is surrounded by a small band of medium-rooting-depth forests (mean –4 m). Rather shallow-rooted forests (mean m) are found in increasingly drier climates where MAP is less than 1000 mm and in more seasonal climates where the MCWD is below −500 mm. Shallow-rooted forests are also simulated in very wet conditions where the MCWD is greater than −300 mm and MAP is 1200 mm or higher.
3.2 Evapotranspiration and productivity
The climatological clusters within the Amazon region which undergo the strongest dry season (EQ E and SAMz) show the largest differences between simulations with variable (LPJmL4.0-VR) and constant (LPJmL4.0-VR-base and LPJmL4.0) tree rooting strategies. In those clusters LPJmL4.0-VR shows a significantly higher agreement with validation data (Fig. 3c, d and Table B3). Agreement is largest for EQ E where NME and r2 show values of 0.62 and 0.91, respectively, whereas constant rooting systems in the other two models lead to values of NME ≥1.92 and r2≤0.21 (Table B3). In NSA and EQ W model differences are less pronounced as annual precipitation deficits are lower and deep rooting systems play a lesser role. Still, variable rooting systems lead to noticeably higher agreement in NSA between January and April (Fig. 3a), where monthly precipitation is lower compared to the rest of the year. In the monsoon-dominated cluster SAMS outside the Amazon region (Fig. 3e), model differences are least pronounced, since shallow-rooting forests dominate this area in LPJmL4.0-VR (Fig. 2), which are very similar to the forests with constant tree rooting strategies in the other two model versions.
Results of regional ET are in line with results of site-specific ET. On the local level, the variable tree rooting strategies of LPJmL4.0-VR lead to a major improvement in reproducing measured FLUXNET NEE and ET (Appendix B, Sect. B1.1 and Fig. B6–B7), increasing the confidence of regional modelling results.
3.3 Distribution of plant functional types
The simulated relative dominance of tropical tree PFTs across the study area differs substantially between model versions (Fig. 4). In simulations with LPJmL4.0, more than half of the grid cells show the evergreen and deciduous PFTs to be equally dominant (Fig. 4g–h). Only in areas outside moist tropical climate regions does the model tend towards dominance of the deciduous PFT, whereas in the Amazon region, for example, the evergreen and deciduous PFTs co-exist in almost equal abundance. These patterns strongly differ from satellite-derived geographical PFT distributions (Fig. 4a–b) and therefore yield in respective comparisons the highest NME values among all models (Table B4). In contrast LPJmL4.0-VR and LPJmL4.0-VR-base show clear dominance patterns of both tropical tree PFTs across the study area (Fig. 4c–f). Nevertheless, differences between LPJmL4.0-VR and LPJmL4.0-VR-base are quite substantial. In LPJmL4.0-VR-base the tropical evergreen PFT dominates the north-western Amazon region only, negligibly extending further than the borders of climatological clusters NSA and EQ W combined. Beyond these borders the tropical deciduous PFT dominates (Fig. 4e–f). In contrast, in LPJmL4.0-VR (Fig. 4e–f) the evergreen tree PFT dominates the entire Amazon region including EQ E and SAMz, and the deciduous PFT is pushed towards drier and more seasonal climates (including parts of SAMS). Therefore, LPJmL4.0-VR yields the lowest NME values in comparison to satellite-derived PFT distributions (Table B4).
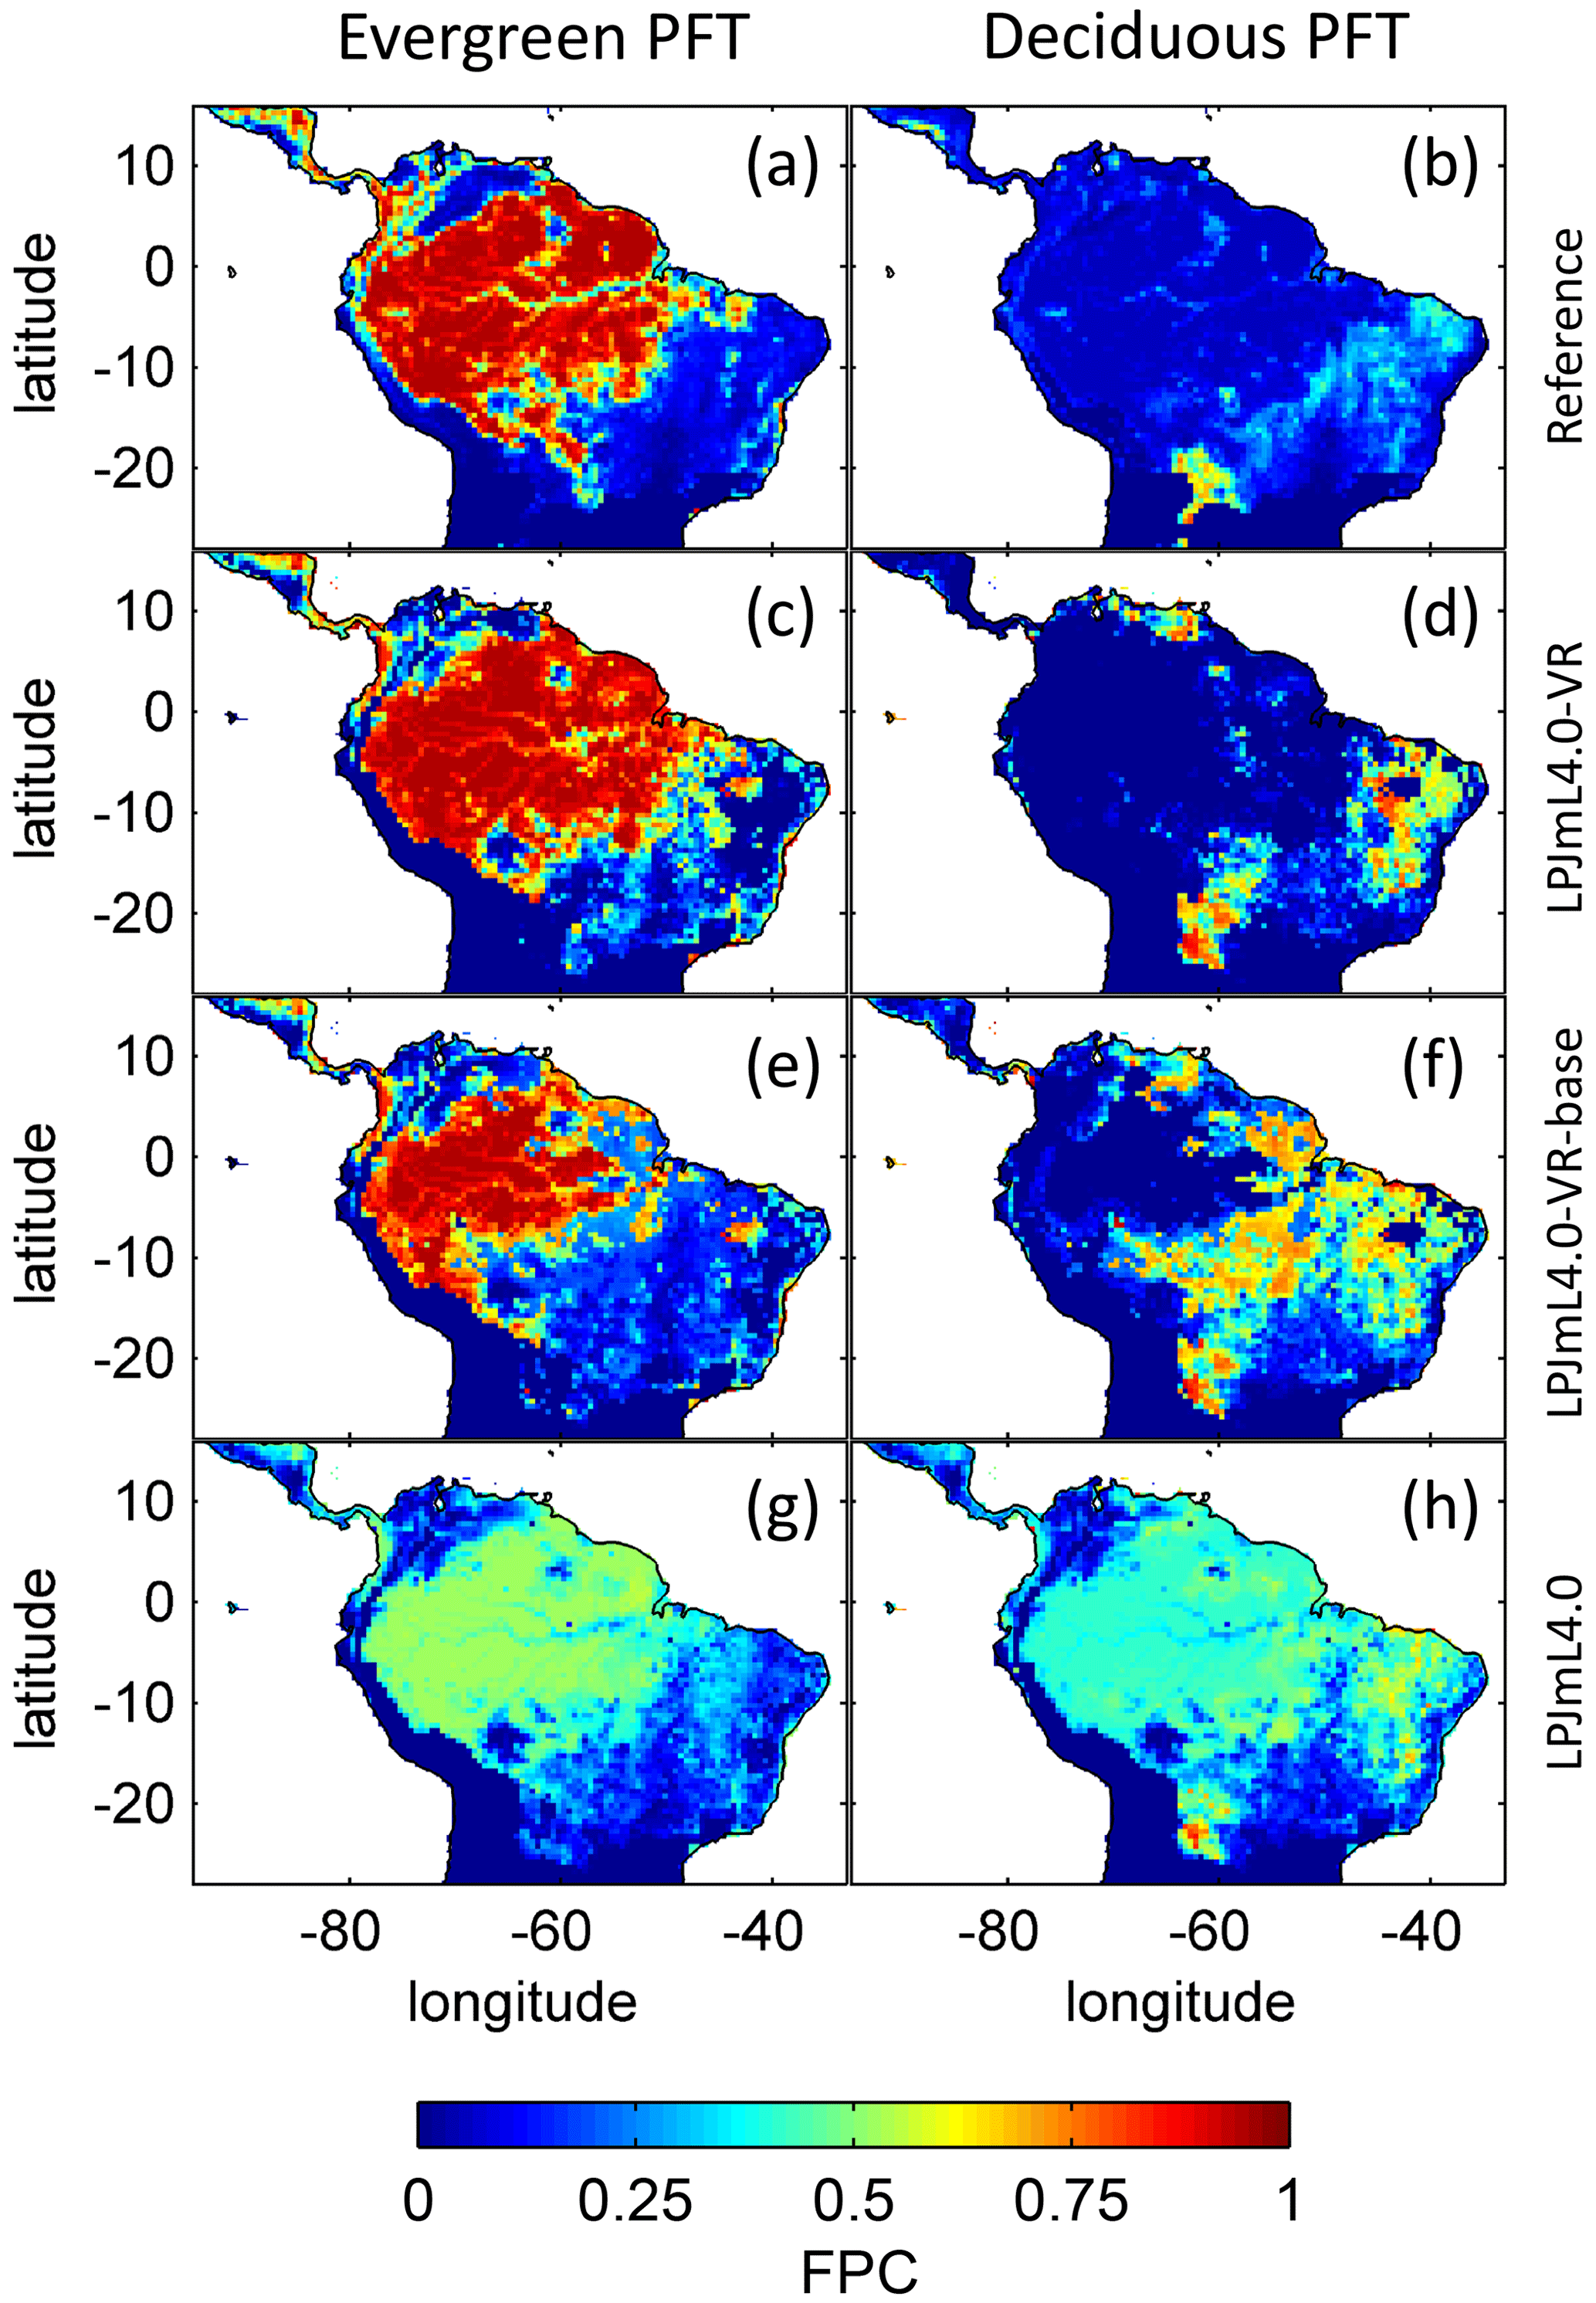
Figure 4Foliage projective cover (FPC) of evergreen (a, c, e, g) and deciduous (b, d, f, h) PFTs over the study region. (a–b) Satellite-derived vegetation composition from ESA Land Cover CCI V2.0.7 (Li et al., 2018) reclassified to the PFTs of LPJmL as in Forkel et al. (2014). (b–c) LPJmL4.0-VR. (d–e) LPJmL4.0-VR-base. (f–g) LPJmL4.0. All LPJmL model versions were forced with CRU climate input. The FPC shown for all models refers to 2001–2010. For statistical measures of individual comparisons between model versions (c–h) and satellite-derived vegetation composition (a–b), see Table B4.
4.1 Climate and soil depth determine dominant tree rooting strategies
The geographical patterns of simulated are very similar under four different climate input data sets (Fig. 2). This gives confidence in the general robustness of our results and modelling approach as differences in climate data do not lead to substantially different model behaviour. This is further supported by similar regional rates of ET simulated under the different climate data inputs (Fig. 3).
Simulated (Fig. 2) clearly follows climate gradients and soil depth found in the study region (Figs. A3, B2, B3). Here, MAP and the MCWD can serve as explanatory variables of simulated (Fig. B5). These findings are in line with the general ecological expectation and former studies that seasonal water depletion of upper soil layers, as a combination of annual precipitation and dry-season length and strength, is positively correlated with the rooting depth of tropical evergreen trees (Baker et al., 2009; Ichii et al., 2007; Kleidon and Heimann, 1998, 1999). We also find lower thresholds for MAP and the MCWD where strongly decreases again (Fig. B5), which can be explained by different mechanisms leading to a regime shift from the evergreen to the deciduous tree PFT as discussed below (see Sect. 4.2).
To evaluate our model results against empirical data, we checked the data availability on maximum rooting depth across South America in the TRY database (Kattge et al., 2020; data downloaded September 2019). As is also shown in Fan et al. (2017), we found the number of sites within the TRY database where maximum rooting depth has been measured in South America to be very low. Moreover, the number of data entries per site appeared very small, where 33 TRY sites falling within our study area showed a mean of nine and a median of six data entries, while 15 sites showed five or fewer data entries. Therefore, we decided not to include site-specific comparisons of rooting depth as it is not clear how representative these measurements are for the local forest communities. More research is necessary to increase the number of observation sites and improve the empirical basis of field-based rooting depth to allow for site-specific model evaluation. Nevertheless, as shown in Fan et al. (2017) measured, site-specific maximum rooting depth across the Amazon region follows the known climatic gradient as expected (Figs. B1, B2). The same holds true for the inversely modelled MDRU of Fan et al. (2017; shown in Fig. B4), which gives confidence in our results.
4.2 Rooting depth influences the distribution, dominance and biomass of tropical plant functional types
In all three model versions used in this study, the same land use is applied (Sect. 2.4), which shapes the geographical extent and maximum dominance of natural vegetation in our results. This is why FPC maps of all model versions show the shape of the Amazon region as a distinct pattern (Fig. 4), even though it is less visible for LPJmL4.0-VR-base and one has to consider both tropical tree PFTs at the same time (Fig. 4e–f). Within the Amazon region, LPJmL4.0 simulates similar dominance of the evergreen and deciduous PFT (Fig. 4g–h) which contradicts evaluation data (Fig. 4a–b) and indicates similar performance of the two PFTs or missing mechanisms rewarding better performance over time. We here find that introducing a performance-dependent tree establishment rate (Sect. 2.2 and Appendix A, Sect. A1.6) clearly resolves this issue. This feature produces clear dominance patterns of both PFTs in LPJmL4.0-VR and LPJmL4.0-VR-base. Apparently, by rewarding better performance, variable tree rooting strategies (LPJmL4.0-VR) become necessary to reproduce the dominance of the evergreen PFT throughout the Amazon region (Fig. 4e–f). To remain superior in drier and more seasonal environments in the south to south-eastern Amazon region, the evergreen PFT needs to access deep water by adjusting its rooting depth (Fig. 2). Clearly, this adjustment of rooting depth is only possible within a certain climatic envelope. Below certain thresholds of MAP (around 1000 mm) and the MCWD (around −500 mm), mean decreases again (Fig. B5), which coincides with a transition from the evergreen to the deciduous PFT. Those thresholds are similar to thresholds between evergreen forests and savanna found by, for example, Malhi et al. (2009) at annual precipitation of 1500 mm and at an MCWD of −300 mm. The substantially lower MCWD value found in our study can be explained by the differences in calculating the CWD. While Malhi et al. (2009) assume a constant rate of ET per month of 100 mm, we use the monthly variable PET (Sect. 2.5.3). Since PET is often significantly higher than 100 mm, our monthly CWD and therefore MCWD values are lower.
Similarly to Malhi et al. (2009), Staver et al. (2011) find that the climatic thresholds for evergreen forest are not very distinct and savanna can simultaneously be found in a climatic range around the mean threshold. The authors ascribe this forest–savanna bi-stability to climate–fire–vegetation feedbacks. Many recent studies investigating potential forest–savanna bi-stability and tipping points of forests in and around the Amazon region rely solely on such climatic ranges of tropical biomes (Hirota et al., 2011; Wuyts et al., 2017; Zemp et al., 2017; Staal et al., 2018; Ciemer et al., 2019). The results of LPJmL4.0-VR show that knowledge on local tree root adaptations is another important explanatory variable of vegetation cover, reducing the uncertainty and width of anticipated climatic ranges where vegetation cover could be bi-stable. These findings are supported by a recent study that finds rooting depth more crucial than fire dynamics for explaining PFT dominance in South America (Langan et al., 2017).
Whether the transition between the evergreen and deciduous tree PFT for the thresholds of MAP and the MCWD we find with LPJmL4.0-VR is mainly caused by (a) environmental filtering (including vegetation–fire feedbacks) of deep tree rooting strategies, (b) their competitive exclusion by shallow-rooted deciduous sub-PFTs together with the tropical herbaceous PFT (Fig. B8) or (c) most probably a combination of both is yet to be determined. Given that we used the most simplistic fire module of LPJmL (Glob-FIRM; Thonicke et al., 2001) and current land-use input to allow model evaluation against remotely sensed data in this study, investigating the natural mechanisms of tropical PFT shifts should be the focus of further studies.
Regardless of the mechanisms that eventually lead to a PFT shift, we can state that neither costs for deep-root investment nor a heterogeneous pattern of soil depth across the study region disproves that locally adapted tree rooting depth is key for explaining the current geographical distribution of tropical evergreen forests in South America. Given the large differences between LPJmL4.0-VR and LPJmL4.0-VR-base (Fig. 4), it is clear that in roughly half of the Amazon region the carbon balance of the evergreen PFT is superior to the deciduous PFT only when investing substantial amounts of carbon in deeper roots, i.e. below-ground biomass (Fig. B9). On the one hand this investment has a direct negative effect on productivity, because during growth the allocation of assimilated carbon shifts towards respiring below-ground biomass while investments in productive AGB (Fig. B10) need to be reduced. On the other hand, drier and more seasonal environments show less cloud cover during the dry season (Nemani et al., 2003), enhancing photosynthesis at this time of the year which increases productivity as long as water access is assured (Costa et al., 2010; Wu et al., 2016). The trade-off between AGB and BGB investment most probably leads to a more homogenous AGB pattern across the Amazon region with similar values over a wide climatic range (compare EQ E and SAMz in Fig. B10c–e).
4.3 Diverse tree rooting strategies improve simulated evapotranspiration and productivity
LPJmL4.0-VR simulates rates of local ET and NEE which reasonably match respective measurements at different FLUXNET sites throughout the Amazon region (Figs. B6–B7), even though we run the model with regionally gridded instead of locally measured climate data. While potentially lacking information on local short-term weather events, gridded climate input still seems to be sufficient to capture broad seasonal signals for our comparisons on a monthly basis. This also increases the confidence in our results on a regional scale.
Across large parts of the Amazon region, variable tree rooting strategies decrease the intra-annual variability in ET and maintain high rates of NEE and ET during the dry season in accordance with the intra-annual trends suggested by evaluation data (Figs. 3, B6, B7). More than that, simulated rates of ET and productivity can peak during the dry season, e.g. in EQ E, which has been explained by increased solar radiation during this time of the year (Nemani et al., 2003; da Rocha et al., 2004). Especially in EQ E and SAMz, at least parts of the forest area must have access to sufficient water in the model and in reality (Costa et al., 2010; Wu et al., 2016). Given that LPJmL4.0-VR and LPJmL4.0-VR-base are essentially identical models with the same soil depth input and subsequent hydrology over the whole soil column, their differences in simulated ET and NEE must emerge from their only difference, which is the number of simulated tree rooting strategies. Therefore, local root adaptations in LPJm4.0-VR can be regarded as a buffer against seasonal precipitation deficits by usage of deep water (exemplarily shown in large detail for the FLUXNET Site STM_K67 in Fig. B11).
We can here quantify this water access for the first time on the basis of carbon investment and return and limited by spatial heterogeneous soil depth. Without limits to rooting depth in the form of local soil depth (e.g. by applying a universal soil depth of 20 m) and below-ground carbon investment, seasonally dry climatological clusters would potentially shift towards deeper-rooted sub-PFT dominance, consequently leading to an overestimation of ET rates. Therefore, we argue that both factors are of great importance in explaining regional rates of ET. This also means that forests in the same climatological cluster contribute very differently to the overall ET and therefore to moisture recycling across South America. We can here mechanistically explain this coherence as we show for the first time on the regional scale how PFTs with variable tree rooting strategies adjust to local environmental conditions and in return lead to simulated rates of ET very close to validation data (Figs. 3, B6). The heterogeneous picture of we find (Fig. 2) might provide a direct guideline for where to put emphasis on forest conservation to maintain continental-scale moisture recycling, as directly scales with rates of ET.
Being able to mechanistically reproduce and explain the broad-scale stabilization of water fluxes into the atmosphere has wide implications for DGVM frameworks and simulation of ET as moisture input to the atmosphere in Earth system models (ESMs). Our approach can help to better quantify the role of forests for local- to continental-scale moisture recycling and to project the fate of forests under future climate and land-use change. The approach presented here is easily applicable for a wide range of DGVMs and ESMs which simulate fine-root distribution in a similar way to in the LPJmL model family (based on Jackson et al., 1996). A first and easy-to-implement step for other models could be to prescribe the relative fine-root distribution in a spatially explicit way in accordance with values presented in this study.
In this paper we reconfirm the hypotheses that climate and soil depth determine dominant tree rooting strategies (hypothesis I) and tree rooting depth is key for explaining the distribution and dominance (hypothesis II) as well as evapotranspiration and productivity rates (hypothesis III) of tropical evergreen forests in South America, even when the competition of tree rooting strategies and carbon investment in gradually growing roots are considered. In fact our findings suggest that roughly half of the evergreen forests in the Amazon region depend on investments in rooting systems which go deeper than the standard average PFT parameterization based on the literature allows for. Those deep root systems can be regarded as a buffer against seasonal precipitation deficits by usage of deep water, and they keep rates of ET and productivity at high levels throughout the year.
A major advance of the new sub-model version LPJmL4.0-VR is that simulations start with uniform input distributions of tree rooting strategies in each location which develop into a distribution of abundance driven by local environmental filtering and competition. Therefore, these distributions are not a pre-selected input but an emergent simulation output.
The new model features will enable the introduction of local tree rooting depth as a key explanatory variable into future studies dealing with bi-stability of potential forest cover in tropical regions. Generally, we are convinced that our approach is of high importance to all modelling frameworks of DGVMs and Earth system models (ESMs) aiming at quantifying continental-scale moisture recycling, forest tipping points and resilience. So far, the importance of local-scale tree root adaptations for regional-scale ecosystem functions underlines the need to protect this below-ground functional diversity and not only in the scope of future global change.
A1 A new tree rooting scheme for LPJmL4.0
In this section we describe the new basic scheme for soil layer partitioning, the new tree rooting scheme, the simulation of below-ground carbon investment and how different tree rooting strategies (implemented in the new scheme) compete.
A1.1 Scheme for soil layer partitioning
LPJmL4.0 employs a globally universal soil depth of 3 m. For LPJmL4.0-VR we extended the general maximum soil depth to 20 m (but restrict it to local soil depth information at the model's spatial resolution; Sect. 2.3.2). We applied the same basic scheme for soil layer partitioning from LPJmL4.0 (Schaphoff et al., 2018a) in order to keep model differences small (Table A1). We chose a maximum soil depth of 20 m to considerably increase the maximum soil depth compared to the constant 3 m in LPJmL4.0 while keeping the increment of computational demand connected to adding more soil layers within an acceptable range. As with LPJmL4.0 (Schaphoff et al., 2018a), we use grid-cell-specific soil texture information which is applied to the whole soil column.
A1.2 Water balance, infiltration and percolation
We here provide a very brief description of LPJmL's water balance and soil hydrology. A detailed description can be found in Schaphoff et al. (2018a).
The hydraulic conductivity and water-holding capacity (water content at permanent wilting point, at field capacity, and at saturation) for each grid cell are derived from information on soil texture from the Harmonized World Soil Database (HWSD) version 1 (Nachtergaele et al., 2009), and relationships between texture and hydraulic properties are derived from Cosby et al. (1984). Each soil layer's (Appendix A, Sect. A1.1) water content can be altered by infiltrating rainfall and percolation. The soil water content of the first soil layer determines the infiltration rate of rain and irrigation water. The excess water that does not infiltrate generates surface water runoff. Water percolation through the soil layers is calculated by the storage routine technique (Arnold et al., 1990) as used in regional hydrological models such as SWIM (Krysanova et al., 1998). Water percolation thus depends on the hydraulic conductivity of each soil layer and the soil water content between field capacity and saturation at the beginning and the end of the day for all soil layers. Similarly to water infiltration into the first soil layer, percolation in each soil layer is limited by the soil moisture of the following lower layer. Excess water over the saturation levels forms lateral runoff in each layer and contributes to subsurface runoff. Surface and subsurface runoff accumulate to form river discharge. The routines for water balance, infiltration and percolation were not changed for LPJmL4.0-VR. Thus the routines now apply for soil columns of up to a 20 m depth (Appendix A, Sect. A1.1).
Table A1Soil layer partitioning scheme used in LPJmL4.0-VR. The first metre of the soil column is split into three soil layers, and after 1 m of soil depth each following soil layer is assigned a thickness of 1 m as in LPJmL4.0. Whereas LPJmL4.0's last soil layer reaches 3 m, LPJmL4.0-VR's last soil layer reaches 20 m.
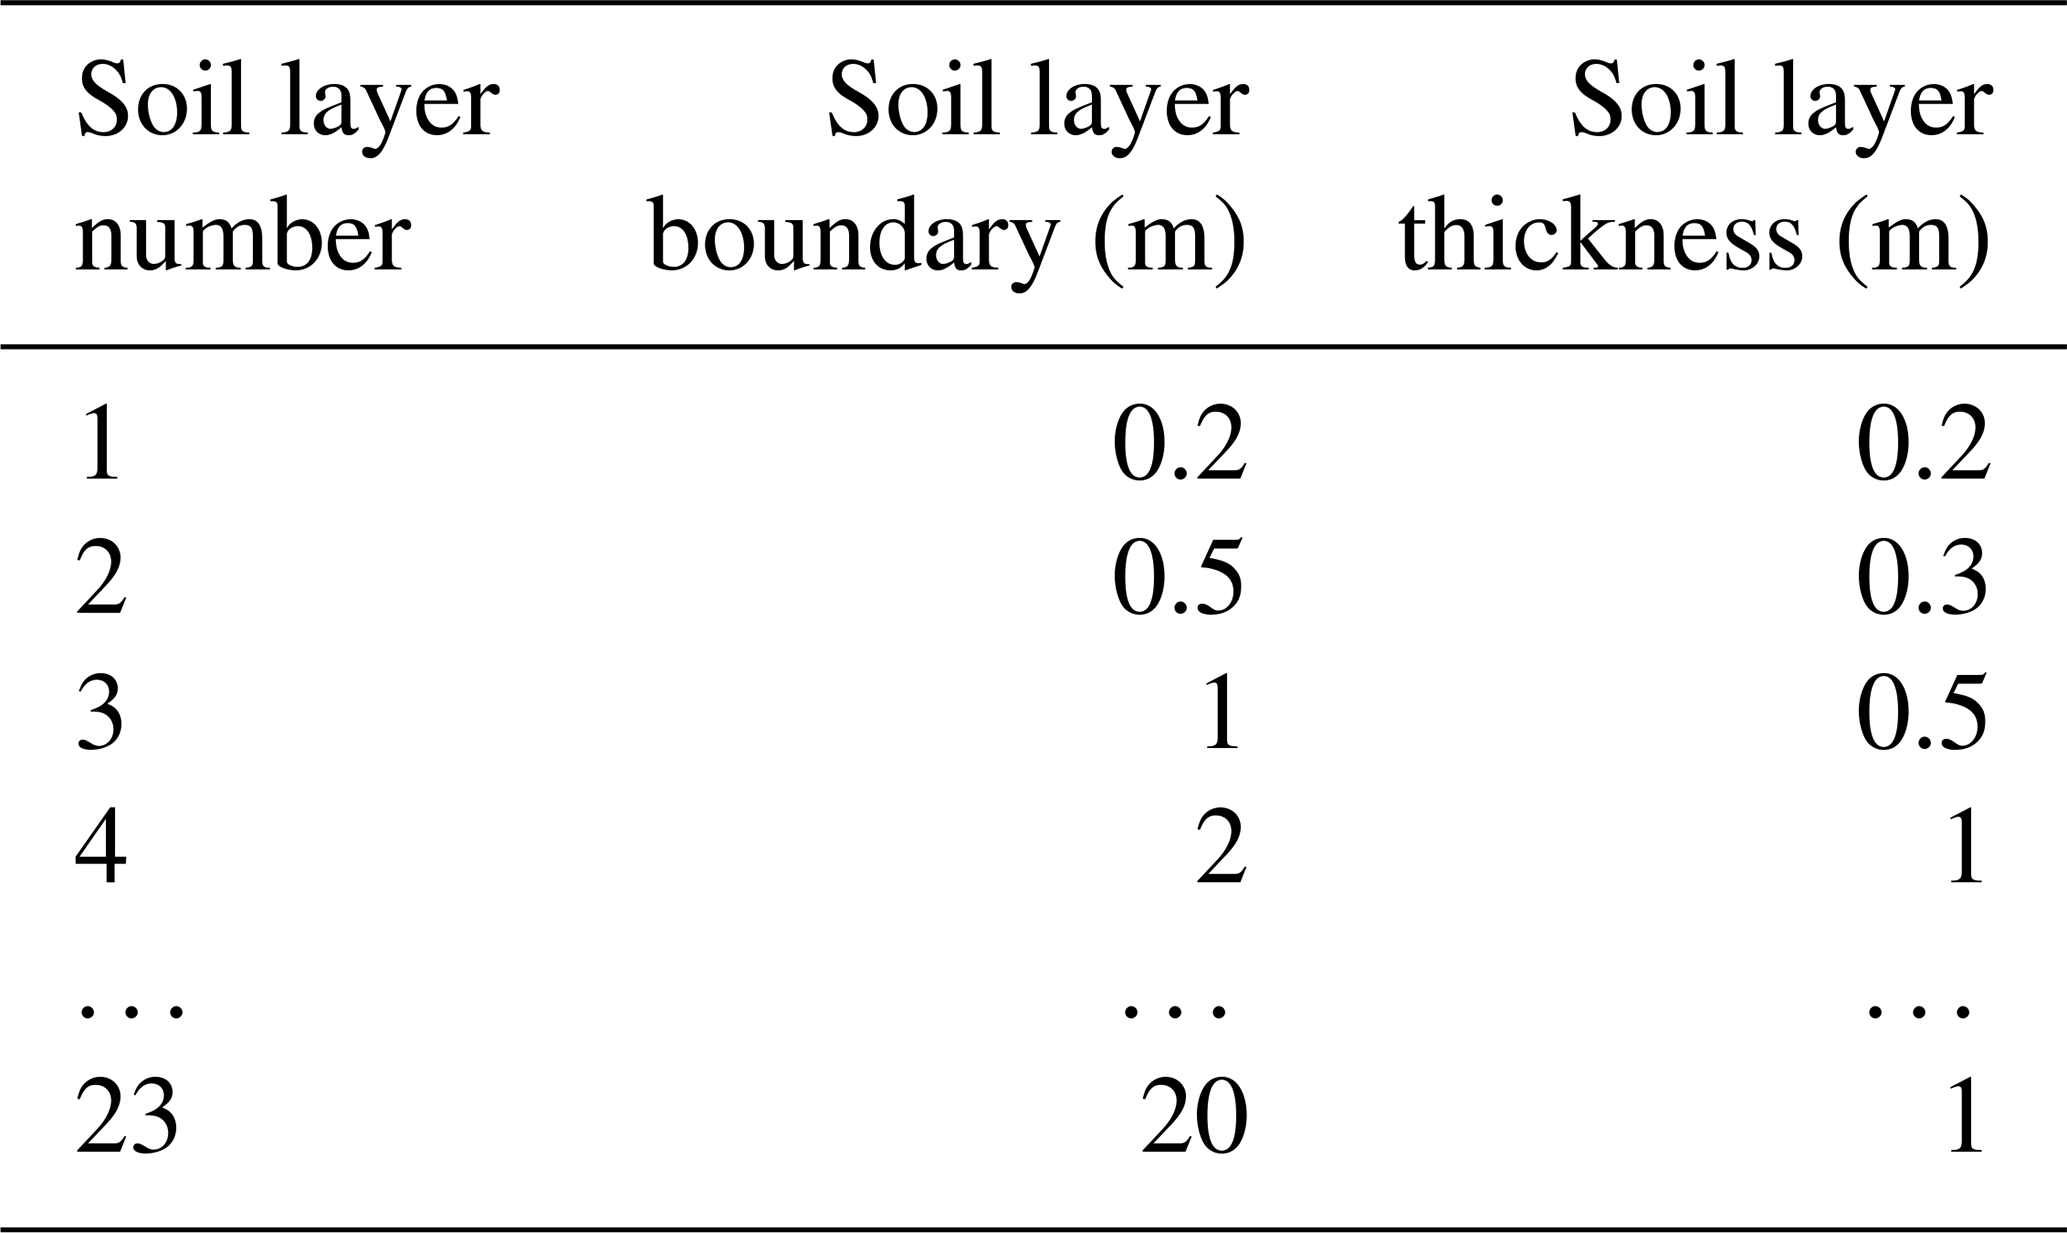

Figure A1Relative amount of fine roots in each soil layer for different β values in LPJmL4.0 and LPJmL4.0-VR. In the legend, βold1 and βold2 correspond to the β values of the two tropical tree PFTs (deciduous and evergreen) simulated in LPJmL4.0. The corresponding graphs lie on top of each other due to marginal differences in their β values. β1–β10 correspond to the 10 β values used in LPJmL4.0-VR (Table A2) to create the 10 sub-PFTs of the tropical evergreen and deciduous tree PFTs (Appendix A, Sect. A1.3). For LPJmL4.0-VR the fine-root distribution at maximum rooting depth is shown. Please note, the first three soil layers (as described in Appendix A, Sect. A1.1) in this visualization are treated as one layer of 1 m thickness for reasons of visual clarity.
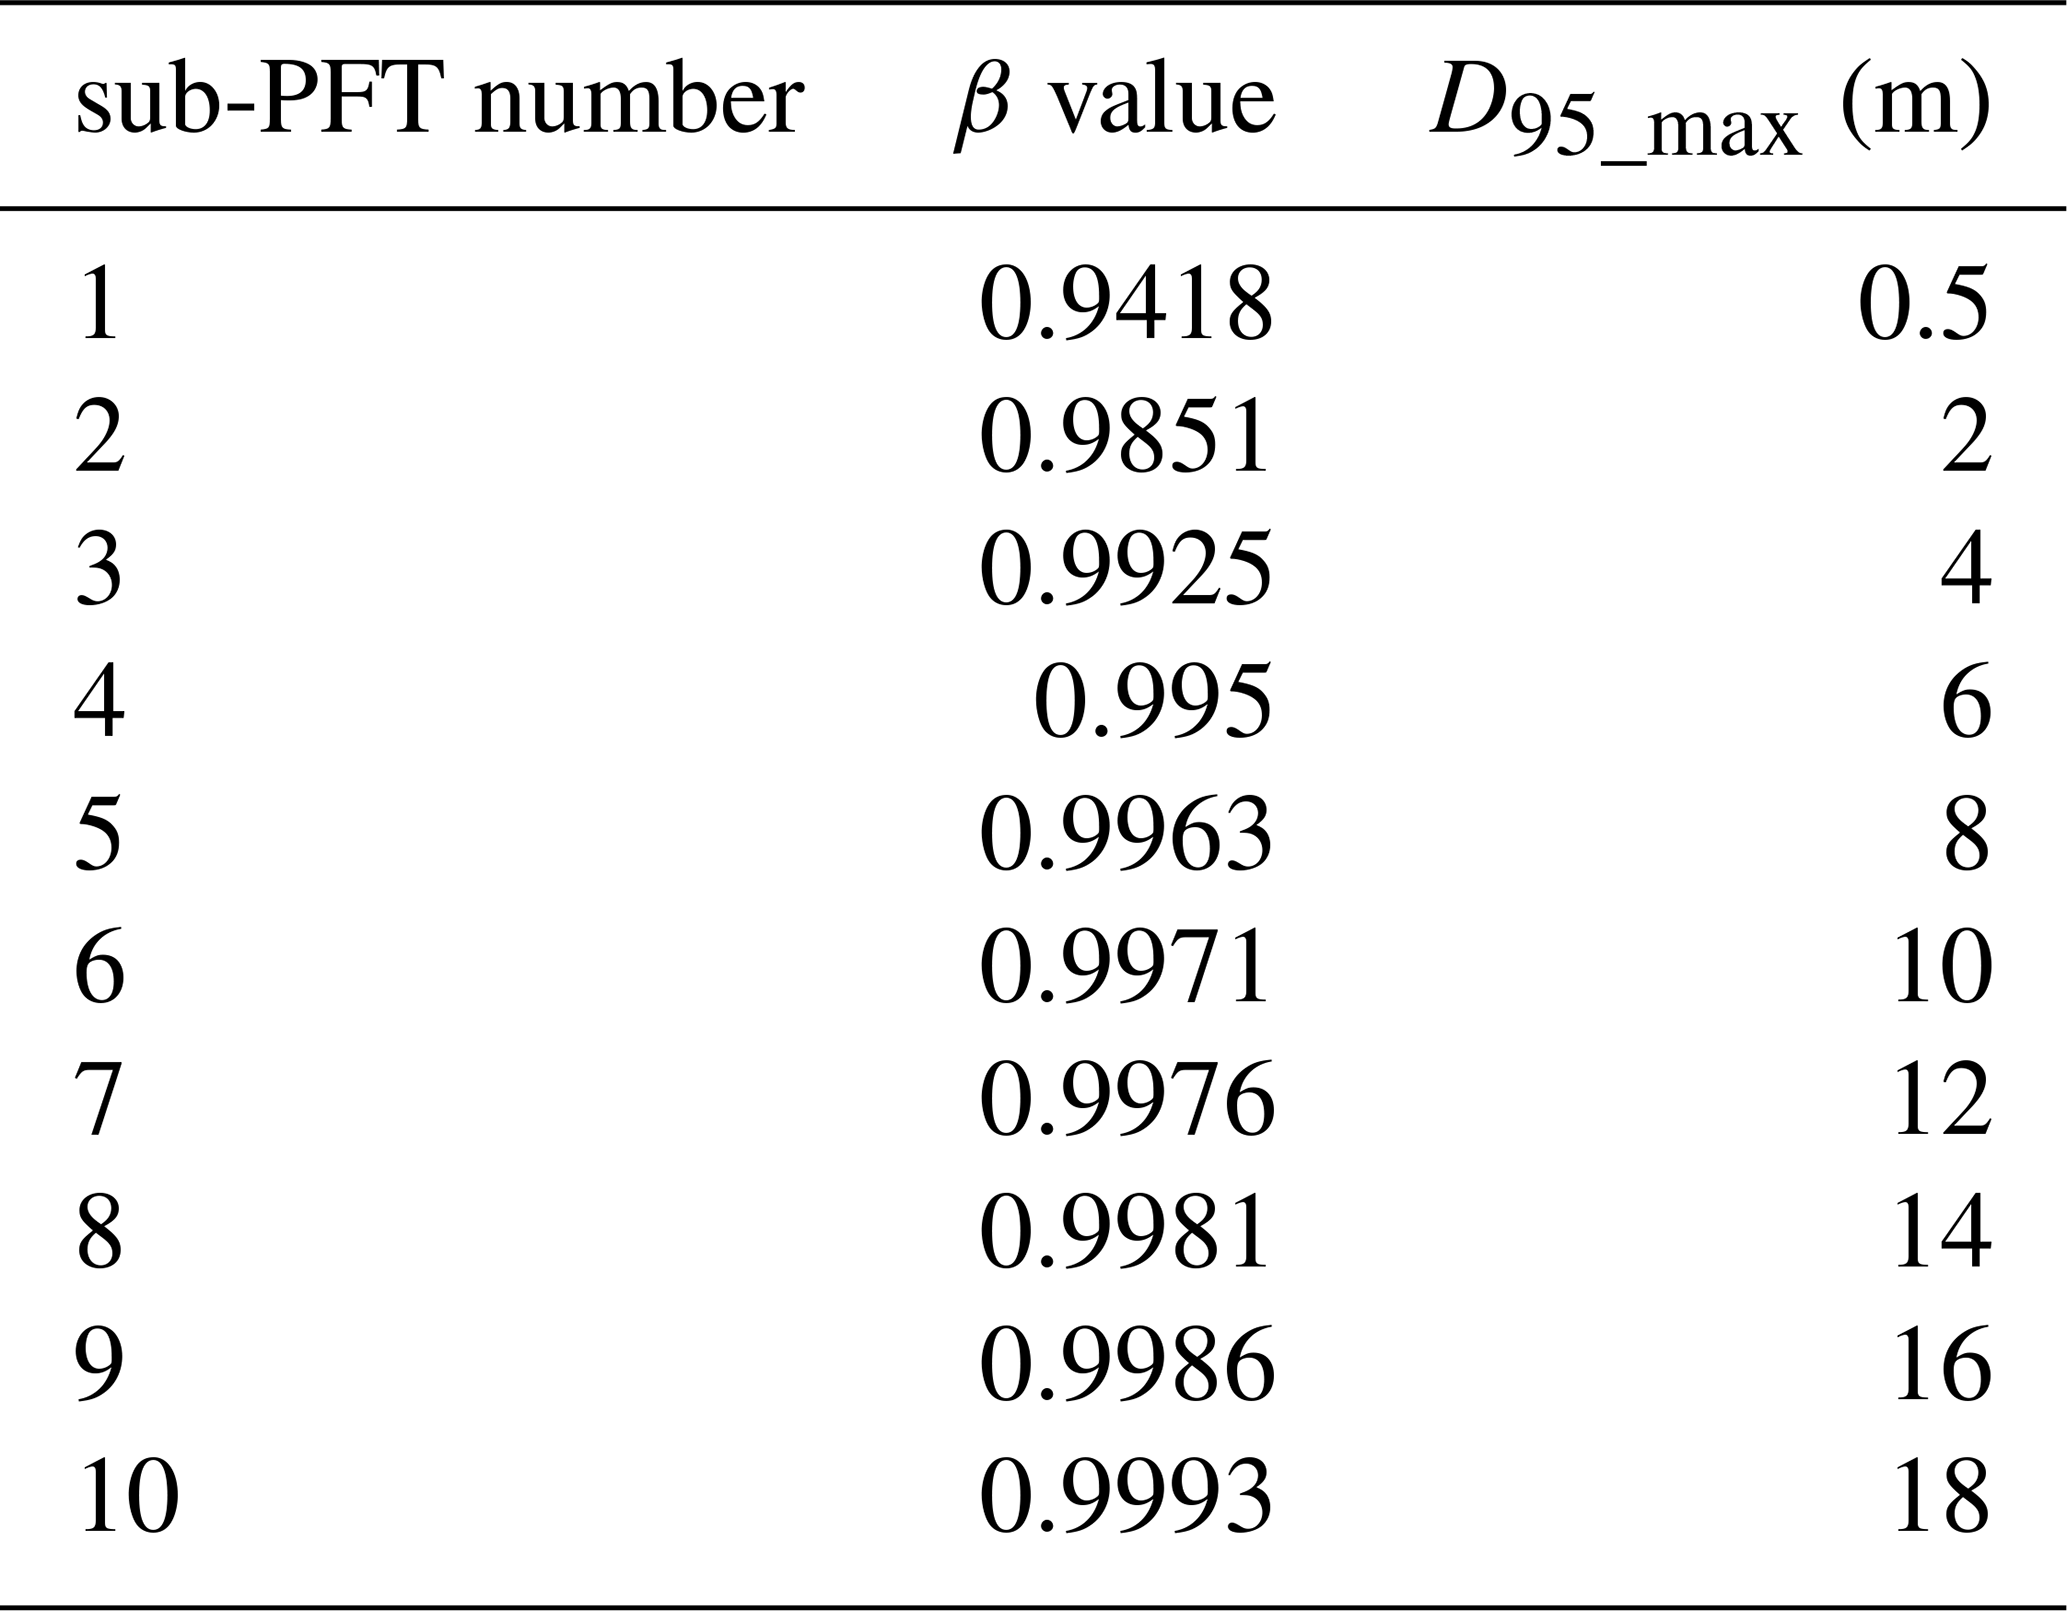
Table A2β values assigned to the 10 sub-PFTs of each tropical PFT (evergreen and deciduous) in LPJmL4.0-VR and the corresponding maximum rooting depth reached by 95 % of the roots (D95_max).
A1.3 Diversifying general tree rooting strategies
In LPJmL4.0 the tree rooting strategy of a PFT is reflected by a certain prescribed vertical distribution of fine roots throughout the soil column. Each soil layer l is assigned a PFT-specific relative amount of fine roots, rootdistl:
where zl is the soil layer boundary depth in centimetres of each soil layer l and rootdist(zl) is the relative amount of fine roots between the forest floor and the boundary of soil layer l. The function rootdist(z) is defined following Jackson et al. (1996):
where β is a constant parameter shaping the vertical distribution of fine roots and therefore determining the tree rooting strategy and zbottom is the maximum soil depth in centimetres. In LPJmL4.0 each PFT is assigned a different β value reflecting the average tree rooting strategy on this broad PFT scale (Schaphoff et al., 2018a).
To quantify the maximum rooting depth of PFTs that actually results from this approach (Eqs. A1 and A2), we here calculate the depth at which the cumulated fine-root biomass from the soil surface downwards is 95 % (D95_max) as follows:
In LPJmL4.0 the β values of tropical tree PFTs are set to 0.962 for the tropical broadleaved evergreen tree and to 0.961 for the tropical broadleaved deciduous tree following Jackson et al. (1996). According to Eq. A3 both PFTs have a D95_max smaller than 1 m. For LPJmL4.0-VR we extended this representation of tree rooting strategies by splitting both tropical tree PFTs into 10 sub-PFTs and assigning each with a different β value. These values were chosen to cover a range of different D95_max values between 0.5 and 18 m (Table A2). We chose 18 m as the largest D95_max value in order to avoid that roots of the respective sub-PFT significantly exceed the maximum soil depth of 20 m (see also Appendix A, Sect. 1.5). Figure A1 shows the new maximum distribution of fine roots throughout the soil column for the different β values chosen (Table A2).
A1.4 Below-ground carbon investment
Tropical trees can avoid water stress under seasonally dry climates by growing relatively deep roots (Brum et al., 2019; Fan et al., 2017), which is accompanied by increased below-ground carbon investment. Thus, the need for deep water access creates a trade-off between below-ground and above-ground carbon investment. Therefore, a new carbon allocation scheme for LPJmL4.0-VR was necessary to account for this trade-off in order to reproduce locally to regionally observed patterns and distributions of tree rooting strategies instead of prescribing them. In LPJmL4.0-VR we introduced two new carbon pools, namely root sapwood and root heartwood. Like stem sapwood in LPJmL4.0, root sapwood in LPJmL4.0-VR also needs to satisfy the assumptions of the pipe model (Shinozaki et al., 1964; Waring et al., 1982). The pipe model describes that, for a certain amount of leaf area, a certain amount of water-conducting tissue must be available. In LPJmL4.0 the cross-sectional area of stem sapwood needs to be proportional to the leaf area LAind as follows:
where kla:sa is a constant describing the ratio of leaf area and stem sapwood cross-sectional area (SAind). In LPJmL4.0-VR we also apply the pipe model to root sapwood. The root sapwood cross-sectional area in the first soil layer is equal to the stem sapwood cross-sectional area, as all water must be transported through the root sapwood within this soil layer. In the following soil layers downwards, the root sapwood cross-sectional area decreases by the relative amount of fine roots in all soil layers above (Fig. 1). Root sapwood is turned into root heartwood at an equal rate to stem sapwood being turned into stem heartwood, i.e. 5 % per year as implemented in LPJmL4.0 (see Schaphoff et al., 2018a).
Table A3Description of FLUXNET sites used for the evaluation of simulated ET.
A1.5 Root growth
In LPJmL4.0 (Schaphoff et al., 2018a) no vertical root growth is simulated; thus the relative distribution of fine roots over the soil column is constant over space and time. It means that PFTs starting from bare ground in a sapling stage display the same relative distribution of fine roots throughout the soil column as a full-grown forest, which contradicts the principles of dynamic root growth over a tree's lifetime. Applied to LPJmL4.0-VR, the below-ground biomass of an initialized deep-rooting-strategy sub-PFT would exceed its above-ground biomass (AGB) by orders of magnitude when considering coarse roots. Consequently, deep rooting strategies would always be disadvantageous, calling for modelling gradual root growth in LPJmL4.0-VR. Unfortunately, little is known about how roots of tropical trees grow over time, given the fact that this research field is strongly time and resource demanding and at the same time the variety of tree species, rooting strategies and environmental conditions is large (Jenik, 1978). A recent promising study by Brum et al. (2019) was able to capture the effective functional rooting depth (EFRD) of different size classes of 12 dominant tree species in a seasonal Amazon forest where tree roots grow considerably deep with maximum values reaching below 30 m. To our knowledge this is the only study capturing the relation between the size of tropical trees and their maximum rooting depth in a high spatial resolution covering sufficient tree-height classes to derive a functional relation between tree height and rooting depth. Following the findings of Brum et al. (2019), we here implemented a logistic root growth function, which calculates a general maximum conceivable tree rooting depth D depending on tree height:
where S is the maximum soil depth in the model (20 m), k is a dimensionless constant defining the growth rate of the standard logistic growth function (set to 0.02), h is the average tree height of a PFT in metres and D0 is the initial rooting depth of tree PFT saplings (set to 0.1 m; tree saplings in LPJmL4.0-VR are initialized with a height of 0.45 m as in LPJmL4.0). The distribution of fine-root biomass of each sub-PFT in the soil column is then adjusted according to D at each time step, by restricting zbottom in Eq. (A2). Every time D crosses a specific soil layer boundary (Appendix A, Sect. A1.1), zbottom is assigned the value of the next soil layer boundary. Thus, zbottom increases in discrete steps. Consequently, each tree rooting strategy allowed for in this study (Appendix A, Sect. A1.3) shows a logistic growth of rooting depth which is dependent on the sub-PFT height and which saturates towards its specific maximum rooting depth (Fig. A2). Therefore, limitations of above-ground sub-PFT growth due to below-ground carbon investment of different tree rooting strategies (Appendix A, Sect. A1.4) are equal in the sapling phase of all sub-PFTs (starting from bare ground) and start to diverge with increasing sub-PFT height. In the case that D exceeds the grid-cell-specific local soil depth (as prescribed by the soil thickness input; see Sect. 2.3.2), all the respective fine-root biomass exceeding this soil depth is transferred to the last soil layer matching this soil depth (see also Fig. 1 right panel and Supplementary Video 1 for a visualization of root growth available at http://www.pik-potsdam.de/~borissa/LPJmL4_VR/Supplementary_Video_1.pptx).

Figure A2Relation between tree height and rooting depth in LPJmL4.0-VR. Black line: implemented general growth function of rooting depth (Eq. A5). Lines with colour scale from yellow to blue: growth functions of rooting depth for each of the 10 sub-PFTs (Sect. 2.2.3). Here temporal rooting depth is expressed as D95 and eventually reaches D95_max (Eq. A3). Solid red line: mean effective functional rooting depth over tree height (EFRD) adapted from Brum et al. (2019) using Eq. (A5). Dashed red line: respective 75th-percentile EFRD over tree height adapted from Brum et al. (2019). Please also see Supplementary Video 1 for a visualization of root growth and development of below-ground carbon pools over time available at http://www.pik-potsdam.de/~borissa/LPJmL4_VR/Supplementary_Video_1.pptx.
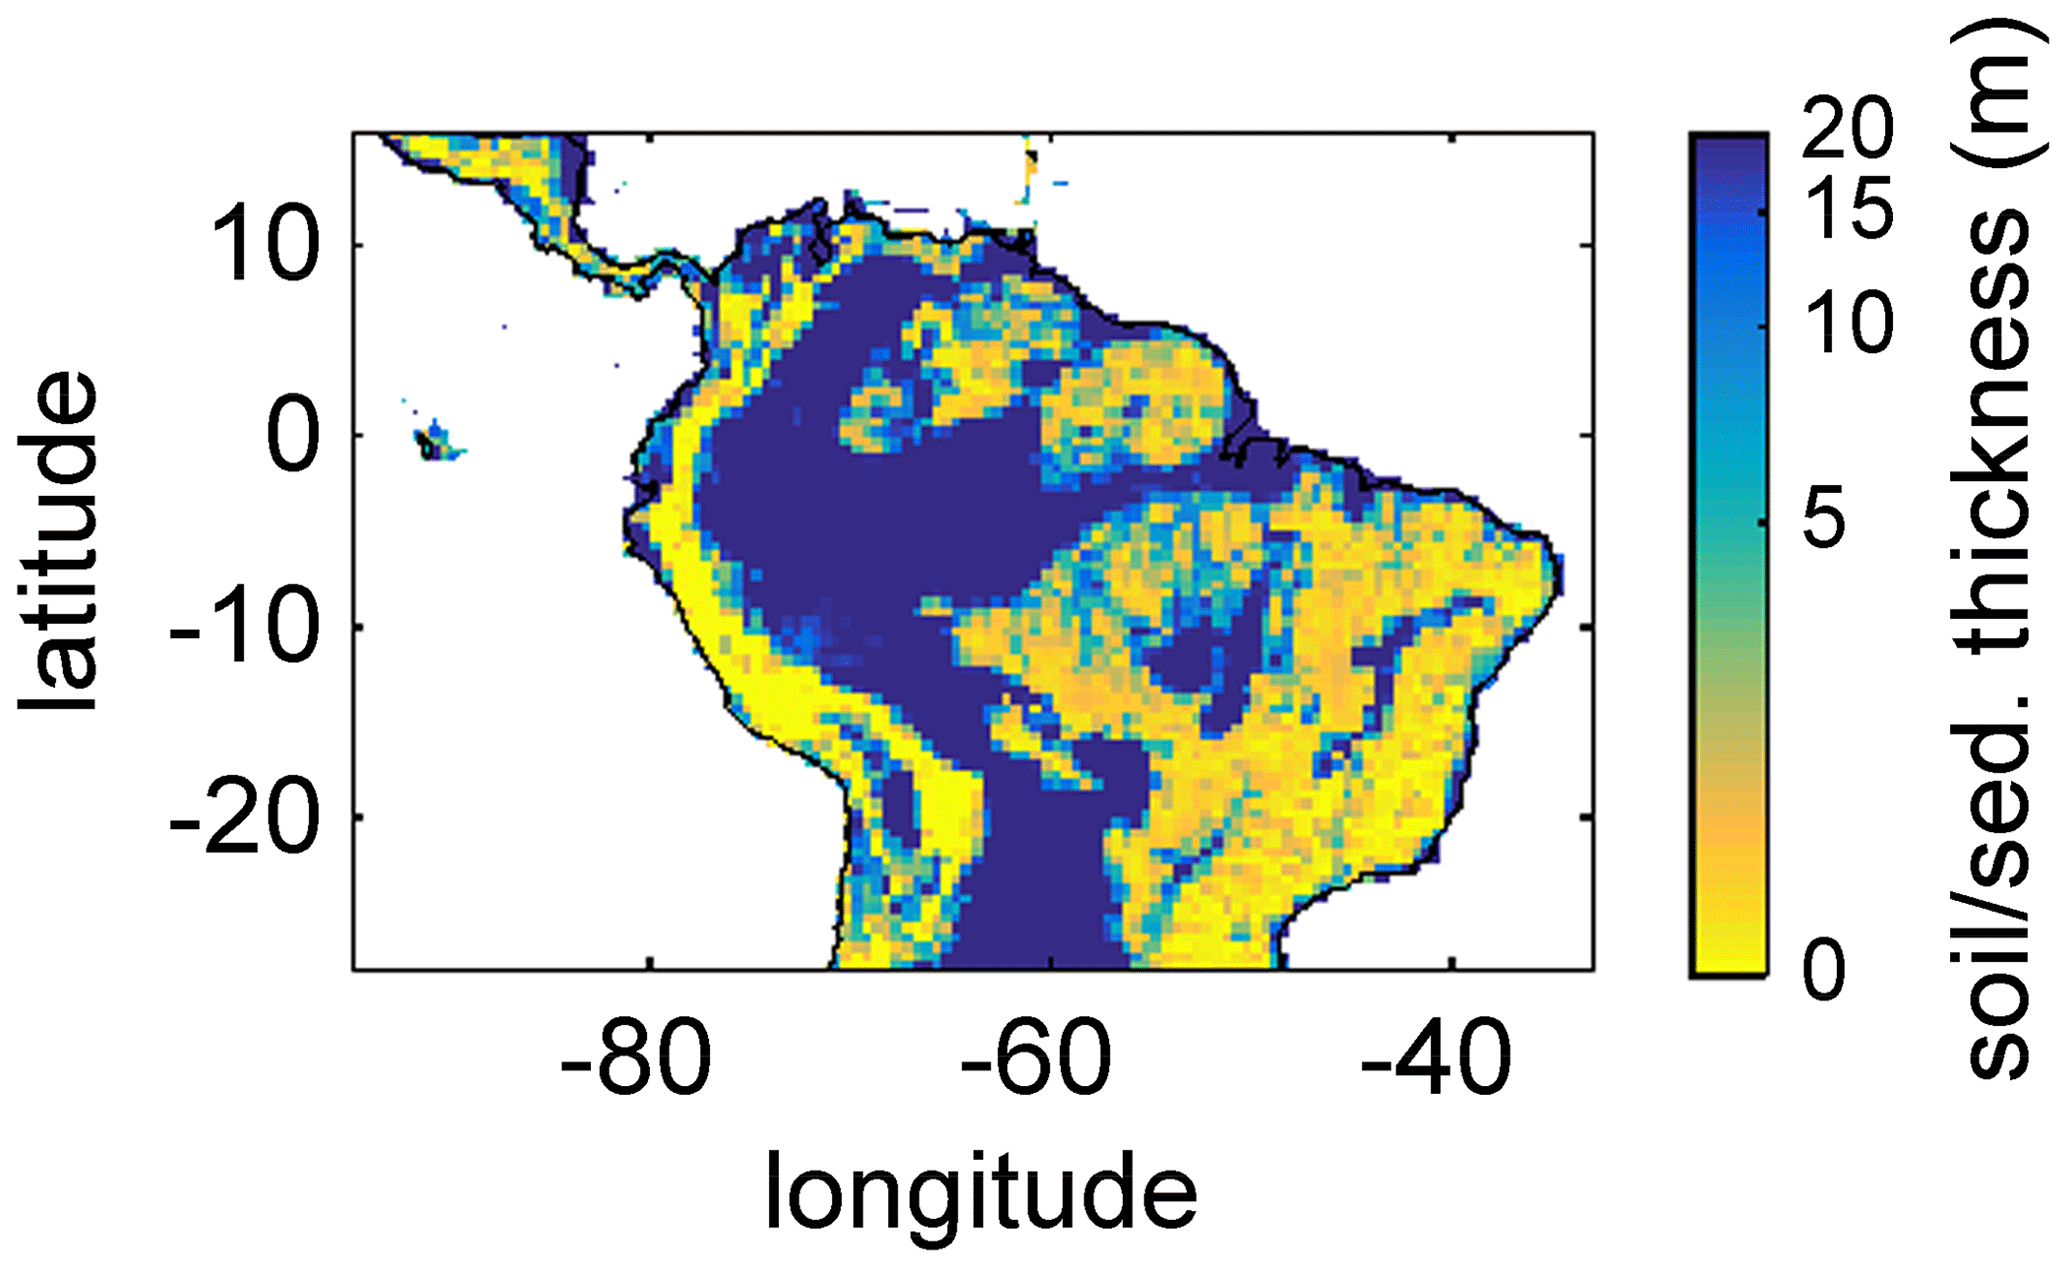
Figure A3Soil/sediment thickness from Pelletier et al. (2016) regridded to the 0.5∘ × 0.5∘ longitude–latitude grid of LPJmL4.0-VR and restricted to a maximum of 20 m. Colour bar in decadic logarithm.
The parameter k in Eq. (A5) was chosen to preserve the slope of the 75th-percentile function describing the relation between tree height and EFRD as found in Brum et al. (2019). We could not implement any of the original functions as suggested in Brum et al. (2019) since they deliver unrealistically low values of rooting depth (between 0 and 10 cm) for trees ≤ 10 m, which results in a strong competitive disadvantage against herbaceous PFTs in LPJmL4.0-VR. We decided for the slope of the 75th-percentile function to allow for root growth rates close to the maximum which also allows for the largest D95_max values in this study (Appendix A, Sect. 1.3) to be reached. Note that Brum et al. (2019) originally propose a relation between tree diameter at breast height (DBH) and EFRD. For our purposes we related rooting depth to tree height (h), which is calculated from DBH in LPJmL4.0 according to Huang et al. (1992):
where kallom2 and kallom3 are constants set to 40 and 0.67, respectively (Schaphoff et al., 2018a).
A1.6 Competition of rooting strategies
In each grid cell all sub-PFTs of the evergreen and deciduous tree PFTs compete for light and water following LPJmL4.0's approach to simulate plant competition. In LPJmL4.0, the number of new PFT saplings per unit area (estPFT in ind m−2 a−1, where ind is individuals) which are established each year is proportional to a maximum establishment rate kest and to the sum of foliage projected cover (FPC; a relative number between 0 and 1) of all tree PFTs present in a grid cell (FPCTREE). It declines in proportion to canopy light attenuation when the sum of woody FPCs exceeds 0.95, thus simulating a decline in establishment success with canopy closure (Prentice et al., 1993):
where is the number of established tree individuals (ind m−2 a−1). It is important to note that LPJmL4.0 does not simulate individual trees. As a common method of DGVMs, tree saplings enter the average individual of a PFT as described in Schaphoff et al. (2018a).
To allow for environmental filtering of tree rooting strategies which are best adapted to local environmental conditions, we changed the standard tree establishment scheme in LPJmL4.0-VR. Now, the establishment rates of sub-PFTs (estsub_PFT) are additionally weighted by the local dominance of each sub-PFT as follows:
where FPCsub_PFT is the FPC of each sub-PFT. The new term leads to a higher establishment rate for productive sub-PFTs relative to their spatial dominance and vice versa, without changing the overall establishment rate as set by Prentice et al. (1993). This function has the effect that non-viable sub-PFTs are outcompeted over time.
A1.7 Background mortality
In LPJmL4.0 background mortality is modelled by a fractional reduction in PFT biomass, which depends on growth efficiency (Schaphoff et al., 2018a). This annual rate of mortality is limited by a constant maximum mortality rate of 3 % of tree individuals per year which is applied to all tree PFTs. In other words, the fastest total biomass loss of a tree PFT due to low growth efficiency can happen within about 33 simulation years. In general, this maximum mortality rate can be regarded as a global tuning parameter of biomass accumulation as it caps the maximum biomass loss. Since many mechanisms influencing tree mortality in the real world, e.g. hydraulic failure (Johnson et al., 2018), are not yet implemented in most DGVMs including LPJmL4.0 (Allen et al., 2015), the parameterization of background tree mortality remains a challenging topic. Under the current model status of LPJmL4.0, maximum mortality rates are a necessary feature, while future model development must overcome the concept of applying a maximum mortality rate by refining and implementing the most important mechanisms that influence tree mortality.
In LPJmL4.0-VR tree PFTs can access water in soil depths which were formerly inaccessible. This enhances the general growth efficiency of tree PFTs and consequently decreases their overall background mortality. Since global biomass patterns simulated with LPJmL4.0 were already in an acceptable range, the maximum background mortality in LPJmL4.0-VR was calibrated and is now increased to 7 % in order to counter-balance increased survival rates and therefore biomass accumulation.
B1 Local evapotranspiration
Differences in intra-annual rates of ET and NEE between the three LPJmL model versions are most pronounced at FLUXNET sites with high seasonality of rainfall (Fig. B6b, e, g and Fig. B7b, e, g). Here, variable tree rooting strategies (LPJmL4.0-VR) lead to a major improvement in reproducing measured FLUXNET NEE and ET, also expressed in reduced NME and increased r2 values (Tables B1, B2). Whereas constant tree rooting strategies (LPJmL4.0-VR-base and LPJmL4.0) simulate decreasing ET and increasing NEE during dry seasons at these sites, which is anticorrelated to FLUXNET measurements, variable tree rooting strategies (LPJmL4.0-VR) follow the intra-annual FLUXNET signals. The most pronounced improvements are found at STM_K67 and STM_K83, where the NME of ET and NEE drop below or close to 1 and where r2 values considerably increase compared to in the other two model versions (Tables B1, B2). For STM_K67, the r2 of NEE is higher under LPJmL4.0 and LPJmL4.0-VR-base, but this refers to a significant negative correlation.
Table B1Normalized mean error (NME), coefficient of determination (r2) and p value of F statistic piecewise calculated for simulated ET of the different LPJmL model versions used in this study forced with CRU climate input and FLUXNET data of ET at seven FLUXNET sites (in accordance with Fig. B6).

Table B2Normalized mean error (NME), coefficient of determination (r2) and p value of F statistic piecewise calculated for simulated NEE of the different LPJmL model versions used in this study forced with CRU climate input and FLUXNET data of NEE at three FLUXNET sites (in accordance with Fig. B7).
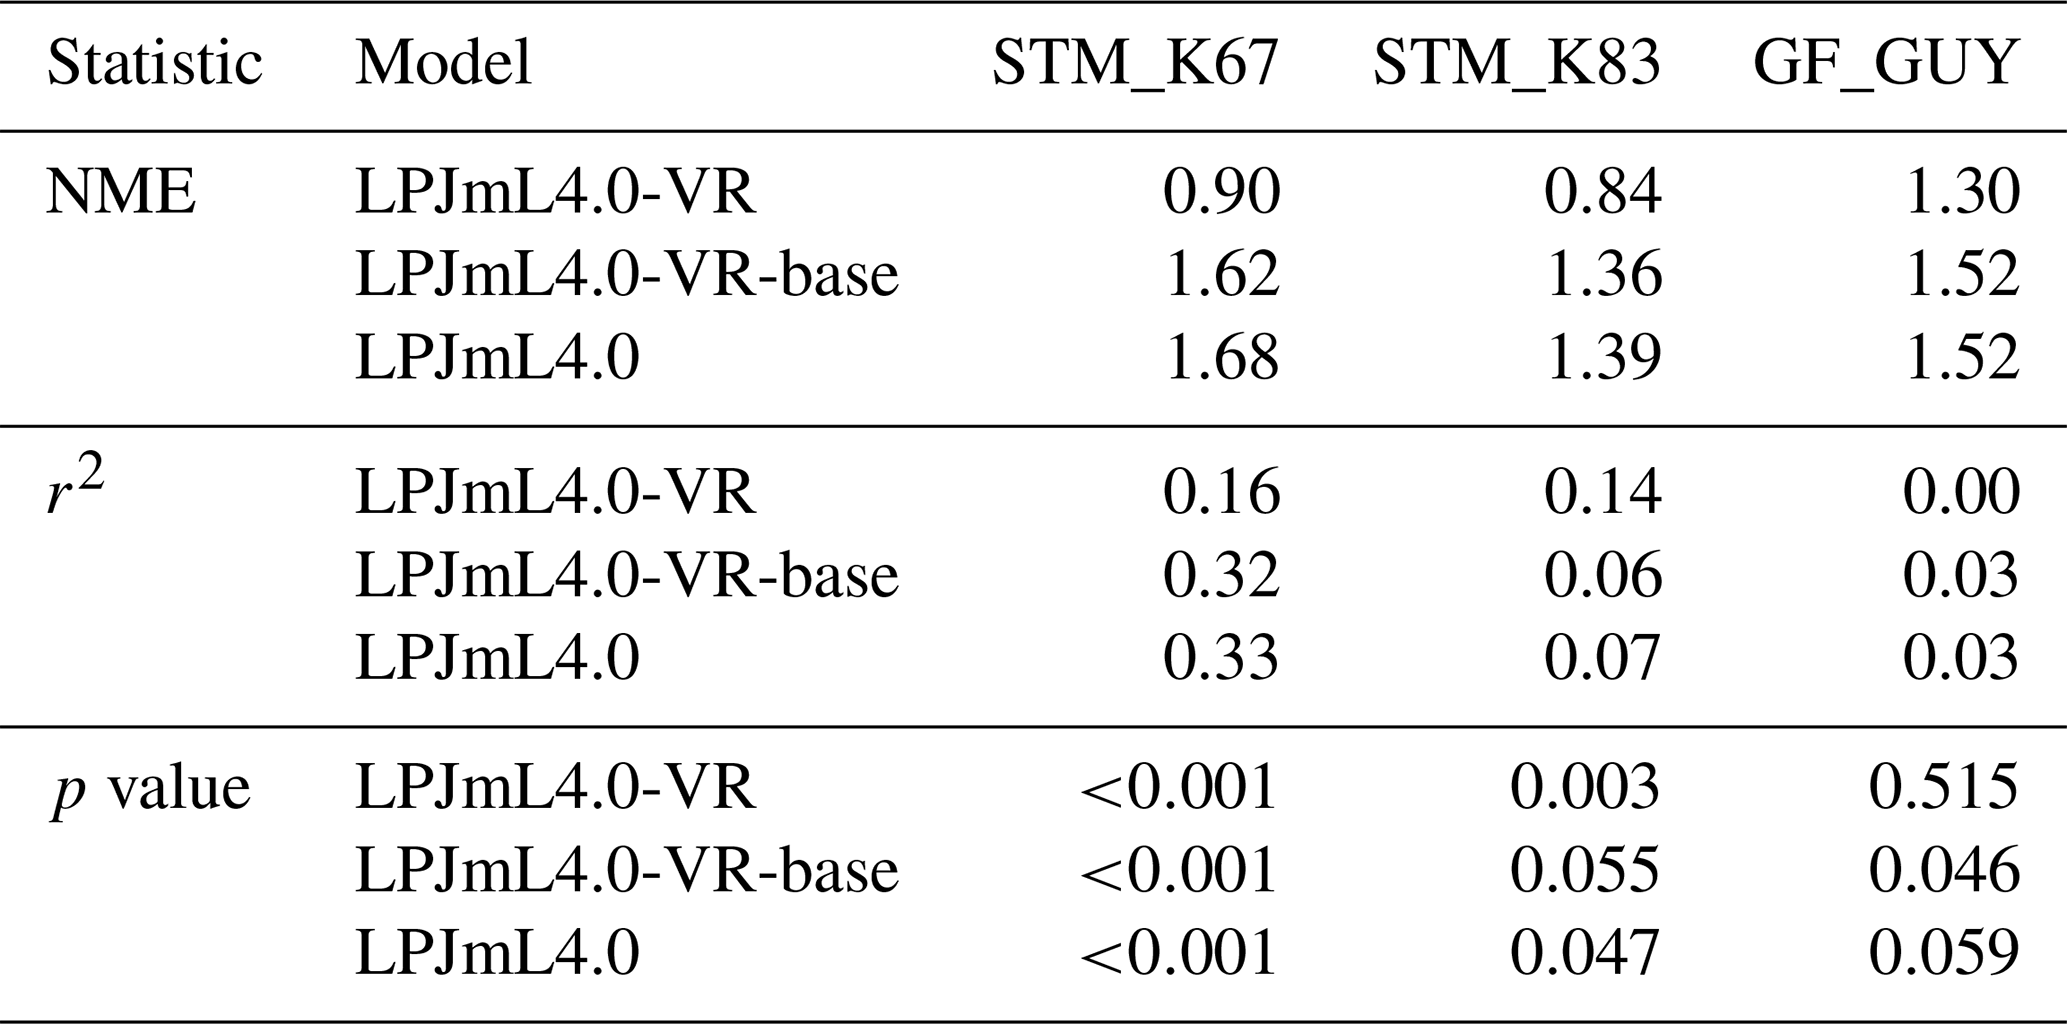
Table B3Normalized mean error (NME), coefficient of determination (r2) and p value of F statistic piecewise calculated for the simulated ET of the different LPJmL model versions used in this study and continental-scale gridded ET products within five regional climatological clusters. With respect to Fig. 3 comparisons are based on the monthly mean of corridors shown, i.e. (1) the monthly mean of all outputs produced by one LPJmL model version but forced with different climate inputs and (2) the monthly mean of all continental-scale gridded ET data products.

At STM_K77 (Fig. B6f) local circumstances show the influence of variable rooting strategies on ET in a different way. This former rainforest site was converted to pasture before eddy covariance measurements began. This local land use at STM_K77 is not representative of the respective 0.5∘ grid cell, and thus all three LPJmL model versions simulate mainly natural vegetation instead of pasture. Therefore, the shallow rooting systems of LPJmL4.0 and LPJmL4.0-VR-base show a better match to ET measurements at STM_K77. The site STM_K83 (Fig. B6g) is a selectively logged primary-forest site which shares the same model grid cell as STM_K77 due to their geographical proximity. Again, here only simulations with variable tree rooting strategies (LPJmL4.0-VR) reproduce increased ET and decreased NEE during the dry season. At sites with a weaker to no dry season (Fig. B6c, d, h) differences between model versions become less pronounced, as water availability is more stable throughout the year leading to less variable ET.
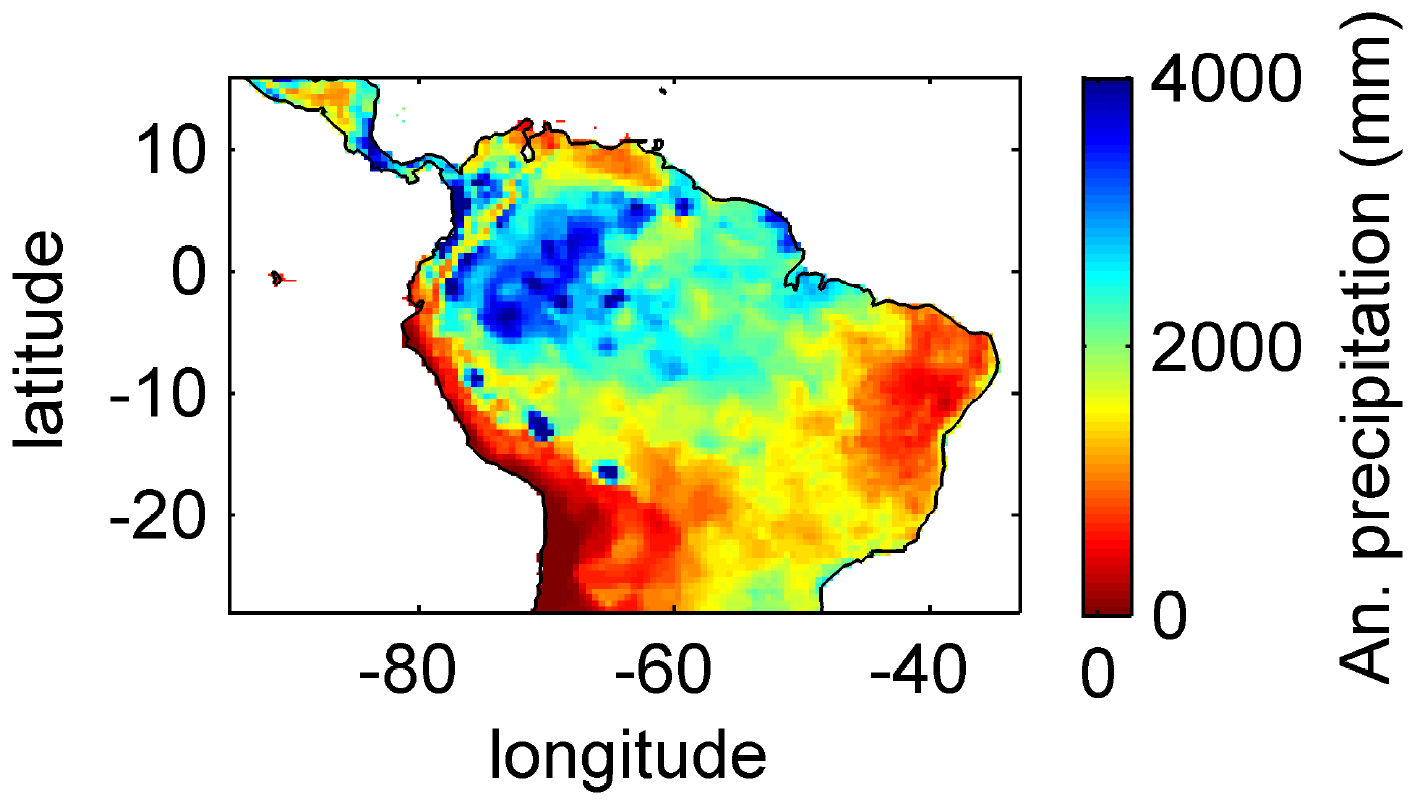
Figure B1Mean annual precipitation for 2001–2010 under CRU climate input.
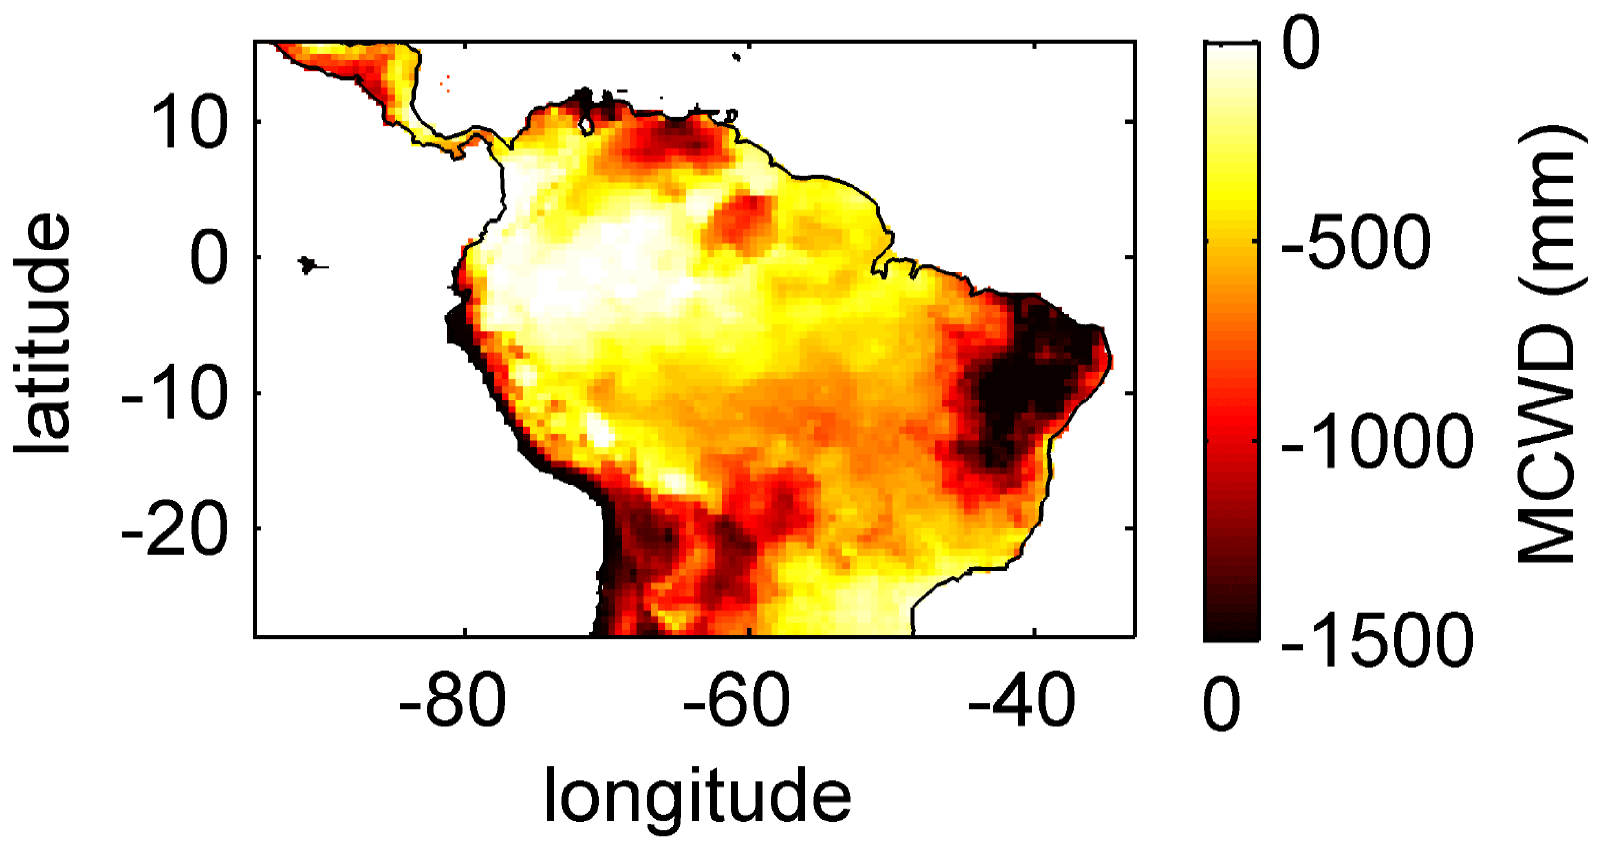
Figure B2Mean annual MCWD for 2001–2010 under CRU climate input.
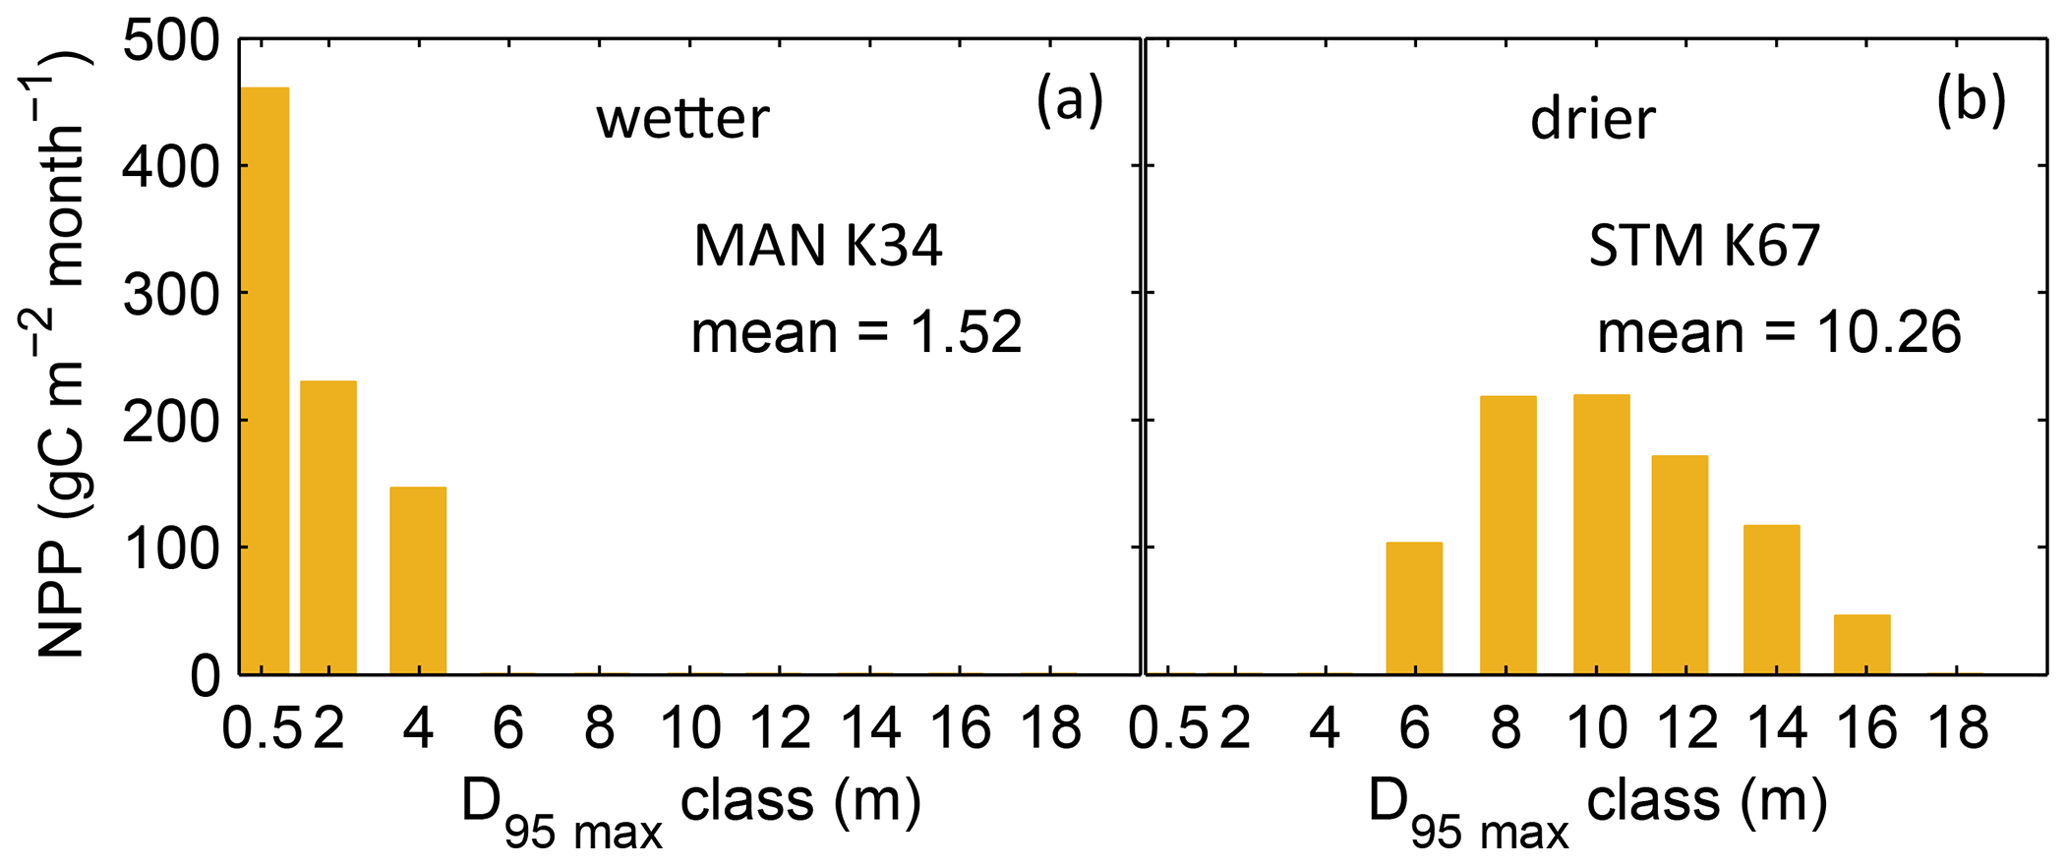
Figure B3Distributions of simulated mean monthly NPP for each D95_max class for 2001–2010 under CRU climate input at two FLUXNET sites. (a) Site MAN_K34 near the city of Manaus. (b) Site STM_K67 near the city of Santarem. For more site information, see Table A3 and Fig. B6a. At the FLUXNET site MAN_K34 (a), which exhibits a mean annual precipitation (MAP) of 2609 mm and a mean MCWD of −222 mm under CRU climate input (2001–2010), the sub-PFT with a maximum rooting depth D95_max of 0.5 m contributes most to overall NPP and the whole distribution of NPP-weighted D95_max classes shows a mean of 1.52 m. At the FLUXNET site STM_K67 (b), which exhibits a lower MAP of 2144 mm and a stronger dry season reflected in a mean MCWD of −465 mm, the NPP-weighted distribution of D95_max shows a peak at 10 m and a corresponding mean of 10.26 m. Since both sites have a soil depth of 20 m (according to the soil depth input; Sect. 2.3.2, Fig. A3) differences in rooting strategy compositions must emerge from the climatic differences in those sites. It is important to note that D95_max values (i.e. the bins on the x axes) do not necessarily reflect the true rooting depth achieved by each sub-PFT but their maximum value. For reasons of visual clarity, for this figure we kept the bins of the x axes as chosen in Table A2.
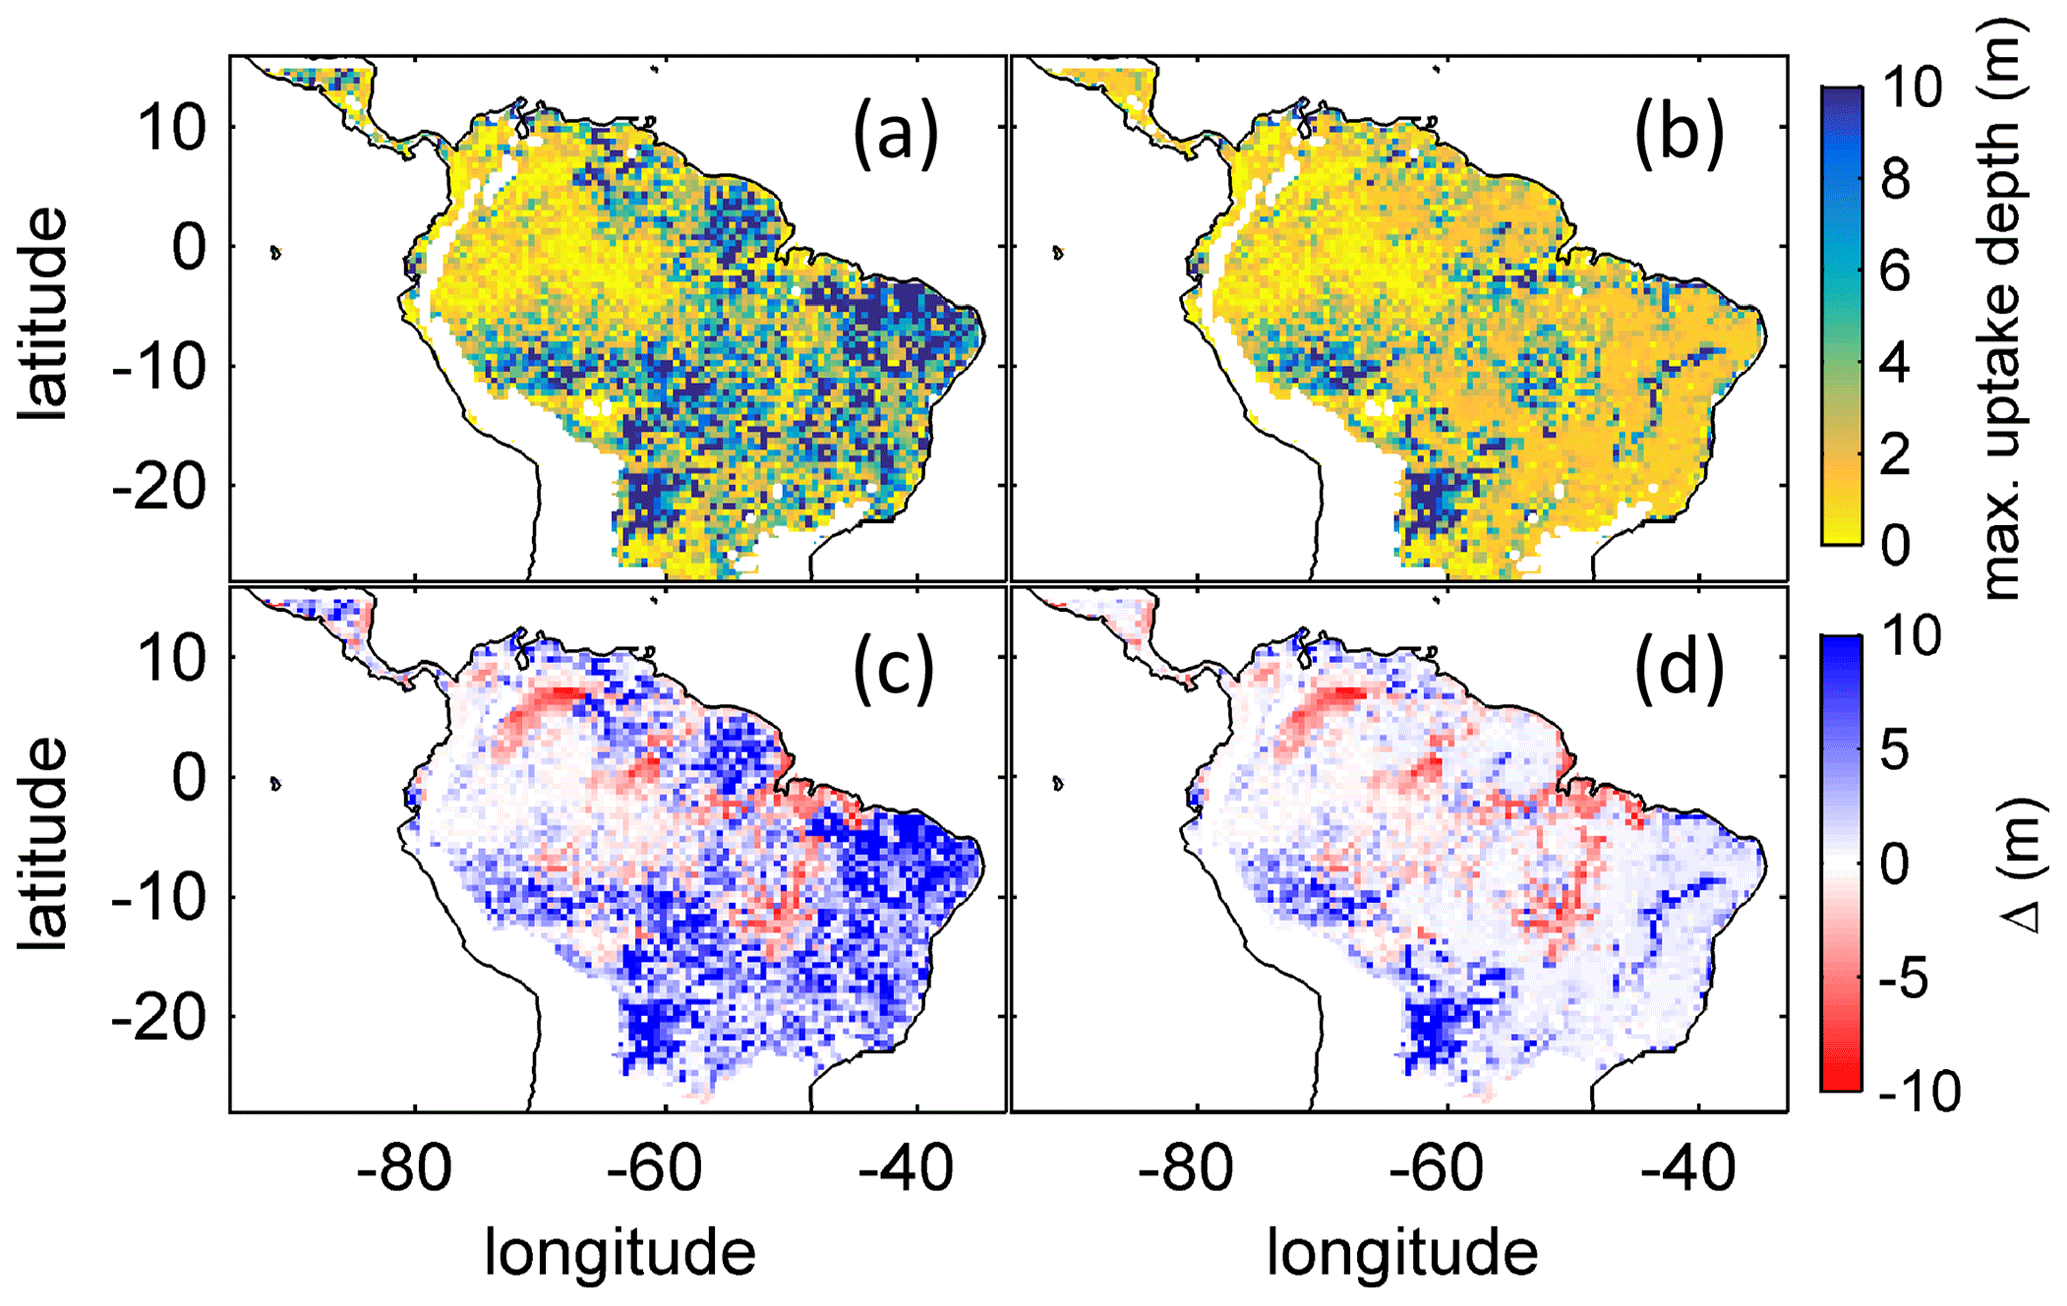
Figure B4Comparison of simulated to product of maximum tree root water uptake depth (MDRU). (a) Original (Fan et al., 2017) MDRU regridded to 0.5∘ × 0.5∘ resolution of LPJmL4.0-VR. (b) Same as (a) but adjusted to soil depth input used in this study (see Sect. 2.3.2), in cases where values of Fan et al. (2017) exceeded this soil depth. The colour-scale maximum for (a) and (b) is set to 10 m. (c) Difference between (a) and simulated with LPJmL4.0-VR under CRU climate forcing (Fig. 2a). (d) Difference between (b) and simulated with LPJmL4.0-VR under CRU climate forcing (Fig. 2a). Red/blue colours denote higher/lower rooting depths in LPJmL4.0-VR.
B2 Regional pattern of simulated above- and below-ground biomass
The simulated mean AGB pattern (2001–2010) of LPJmL4.0-VR (Fig. B10) shows that variable tree rooting strategies lead to contiguous high biomass over the Amazon region. Especially towards the borders of the south-eastern Amazon region in the climatological clusters EQ E and SAMz, AGB values appear rather homogenous in contrast to constant shallow tree rooting strategies simulated in the other two model versions (Fig. B10d, e). In connection with the significantly improved underlying vegetation composition (Fig. 4e, f), it is clear that LPJmL4.0-VR is the only model version capable of simulating high-AGB evergreen rainforests across the climatic gradient of the Amazon region (Figs. B1, B2). This pattern is also found by one satellite-derived AGB product chosen for the evaluation of our model results (Saatchi et al., 2011; Fig B10b) which yields a corresponding NME close to 0 (Table B6). However, compared to this product, low NME values are found for all model versions. Surprisingly, in comparison to the other AGB validation product (Avitabile et al., 2016; Fig. B9a) LPJmL4.0-VR-base yields a smaller NME than LPJmL4.0-VR. Considering the significantly less accurate underlying vegetation composition of LPJmL4.0-VR-base as well as of LPJmL4.0 (Fig. 4), we regard such comparisons as critical in this context.
Comparisons of AGB pattern between all model versions of this study and different biomass products are difficult, since only LPJmL4.0-VR shows a reasonable geographical distribution of underlying PFTs across the study area (Fig. 4, Table B4). Therefore, differences in biomass are not solely the consequence of different productivities directly related to diversity in tree rooting strategies but also the consequence of simulated PFT dominance; i.e. they are rather an indirect effect of diversity in tree rooting strategies. Concentrating on LPJmL4.0-VR only, the model matches substantially better with the gridded biomass product of Saatchi et al. (2011; Table B5) since this product shows generally higher biomass values across the Amazon region which are more similar to those of LPJmL4.0-VR. Therefore, the higher NME found in the comparison to the biomass product of Avitabile et al. (2016) is mainly caused by divergence of mean biomass values of the evergreen PFT across the whole study area rather than by pattern divergence. Thus, we argue that lowering overall biomass values in LPJmL4.0-VR would improve its match with Avitabile et al. (2016), which is a matter of adjusting overall maximum tree mortality rates (Appendix A, Sect. A1.7).
Simulating diverse tree rooting strategies in connection with investment in coarse-root structures in LPJmL4.0-VR allows for analysing carbon investment in the newly implemented root carbon pools (Appendix A, Sects. A1.4 and A2.2). As expected, below-ground biomass (BGB; Fig. B9) follows the simulated pattern (Fig. 2). The highest BGB is found at maximum values of and vice versa.
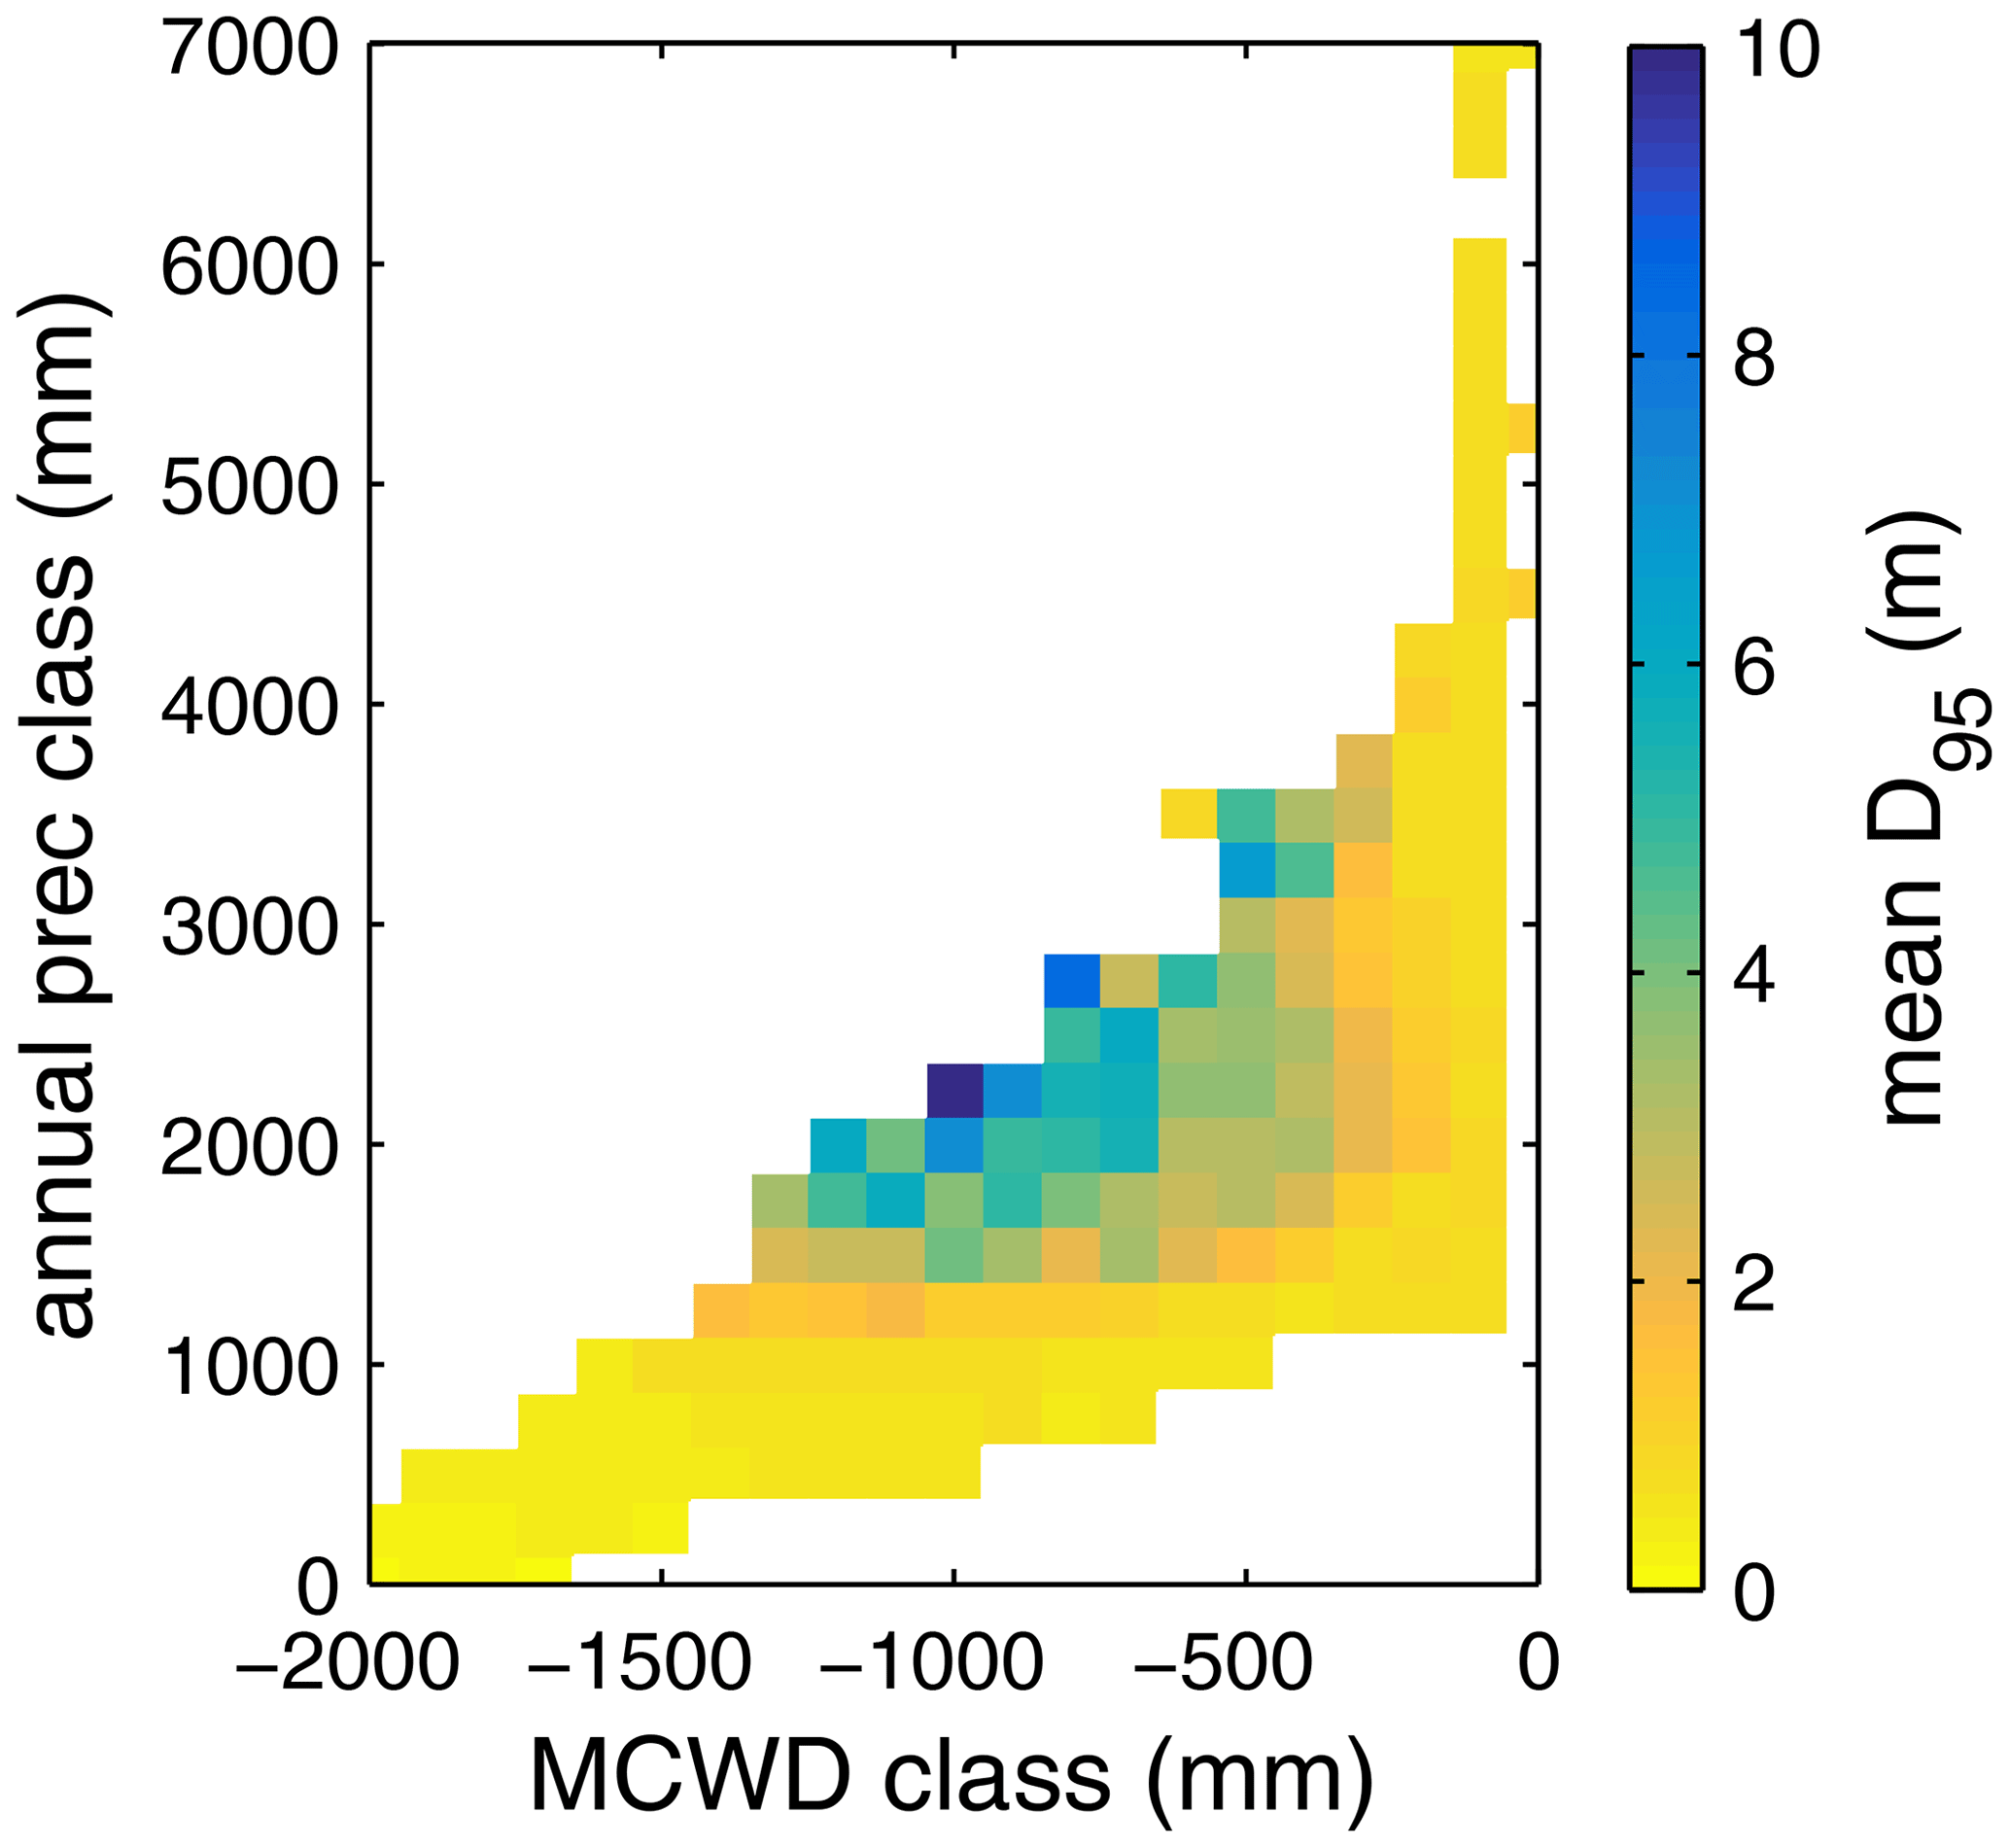
Figure B5Mean rooting depth depicted as mean over classes of MCWD and annual precipitation sums. Class step size for precipitation was set to 250 mm, and class size for MCWD was set to 50 mm. Regions with high amounts of annual rainfall and lower seasonality exclusively favour shallow-rooted forests (low ). increases with decreasing MCWD (increasing seasonal drought stress) and decreasing sums of annual precipitation. Below 1200 mm of annual rainfall or −1100 mm of MCWD, sharply decreases again. Note this figure does not consider soil depth. The colour-scale maximum is set to 10 m.
Table B4Normalized mean error (NME) of FPC comparison piecewise calculated between (1) the satellite-derived vegetation composition from ESA Land Cover CCI V2.0.7 (Li et al., 2018) reclassified to the PFTs of LPJmL as in Forkel et al. (2014) and (2) all LPJmL model versions used in this study forced with CRU climate data (in accordance with Fig. 4).
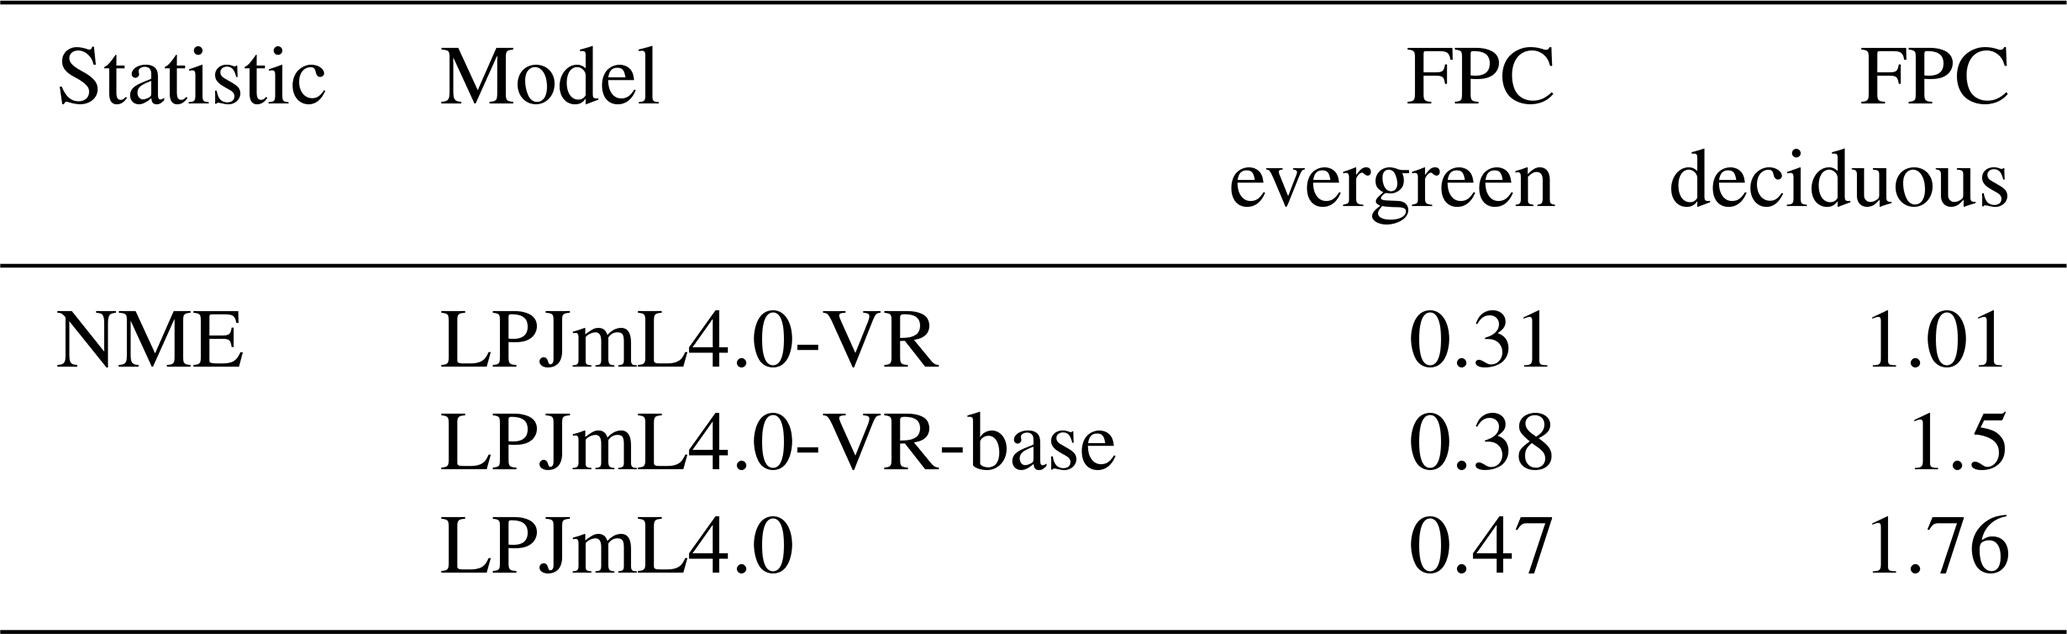
Table B5Normalized mean error (NME) of AGB comparison piecewise calculated between (1) the satellite-derived AGB validation products and (2) all LPJmL model versions used in this study forced with CRU climate data (in accordance with Fig. B10).
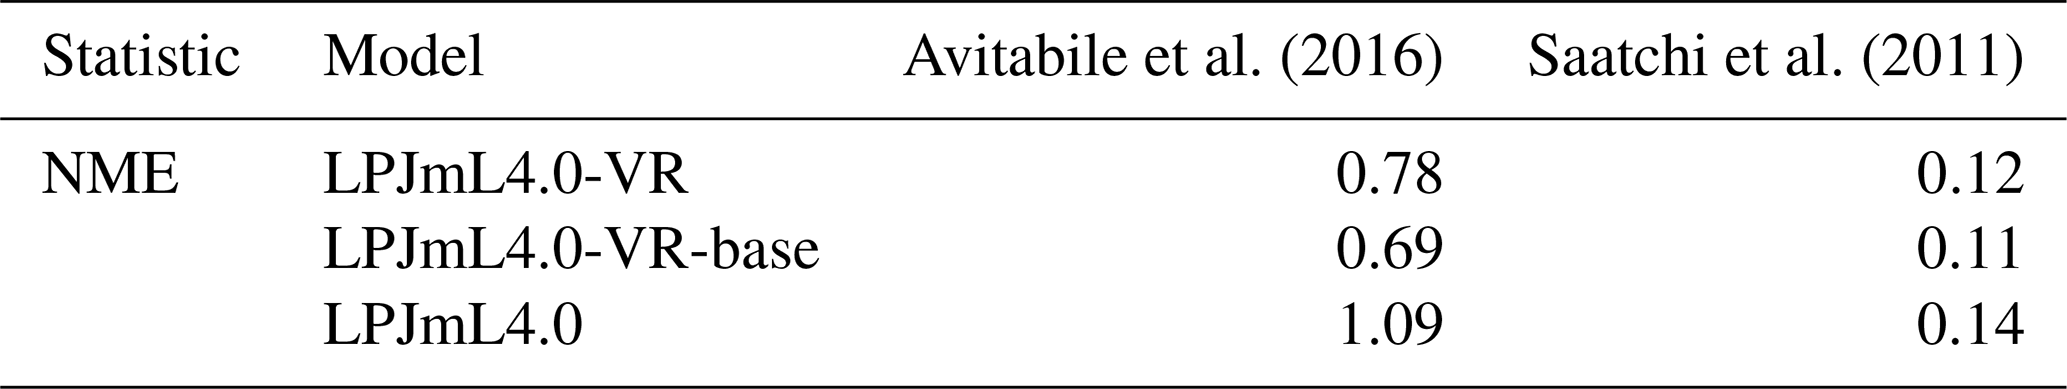

Figure B6Comparisons of monthly ET between different FLUXNET sites (Reference; see also Sect. 2.5.1) and respective simulation output of the different LPJmL model versions used in this study forced with CRU climate. (a) Geographical location of different FLUXNET sites (see also Table A3). For statistical measures of the individual comparison, see Table B1.
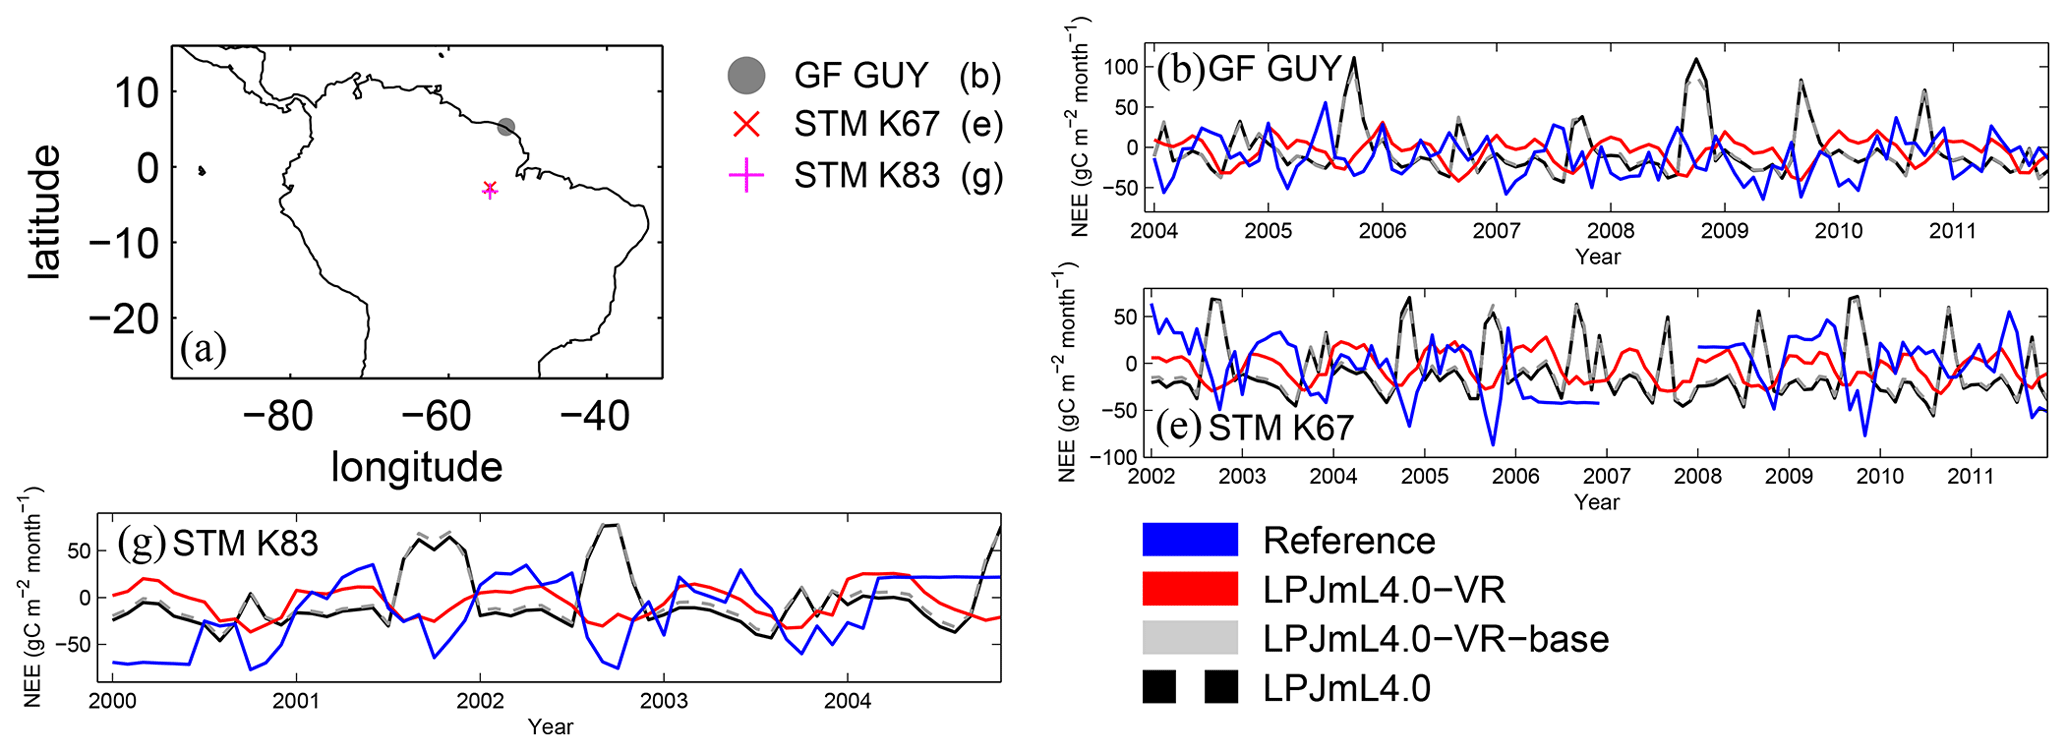
Figure B7Comparisons of monthly NEE between different FLUXNET sites (Reference; see also Sect. 2.5.1) and respective simulation output of the different LPJmL model versions used in this study forced with CRU climate. (a) Geographical location of different FLUXNET sites (see also Table A3). For statistical measures of the individual comparison, see Table B2. Note that due to data scarcity only three FLUXNET sites are shown. Plots of all sites are shown in Fig. B12. We kept panel labelling as in Fig. B6 to ensure easy comparability.
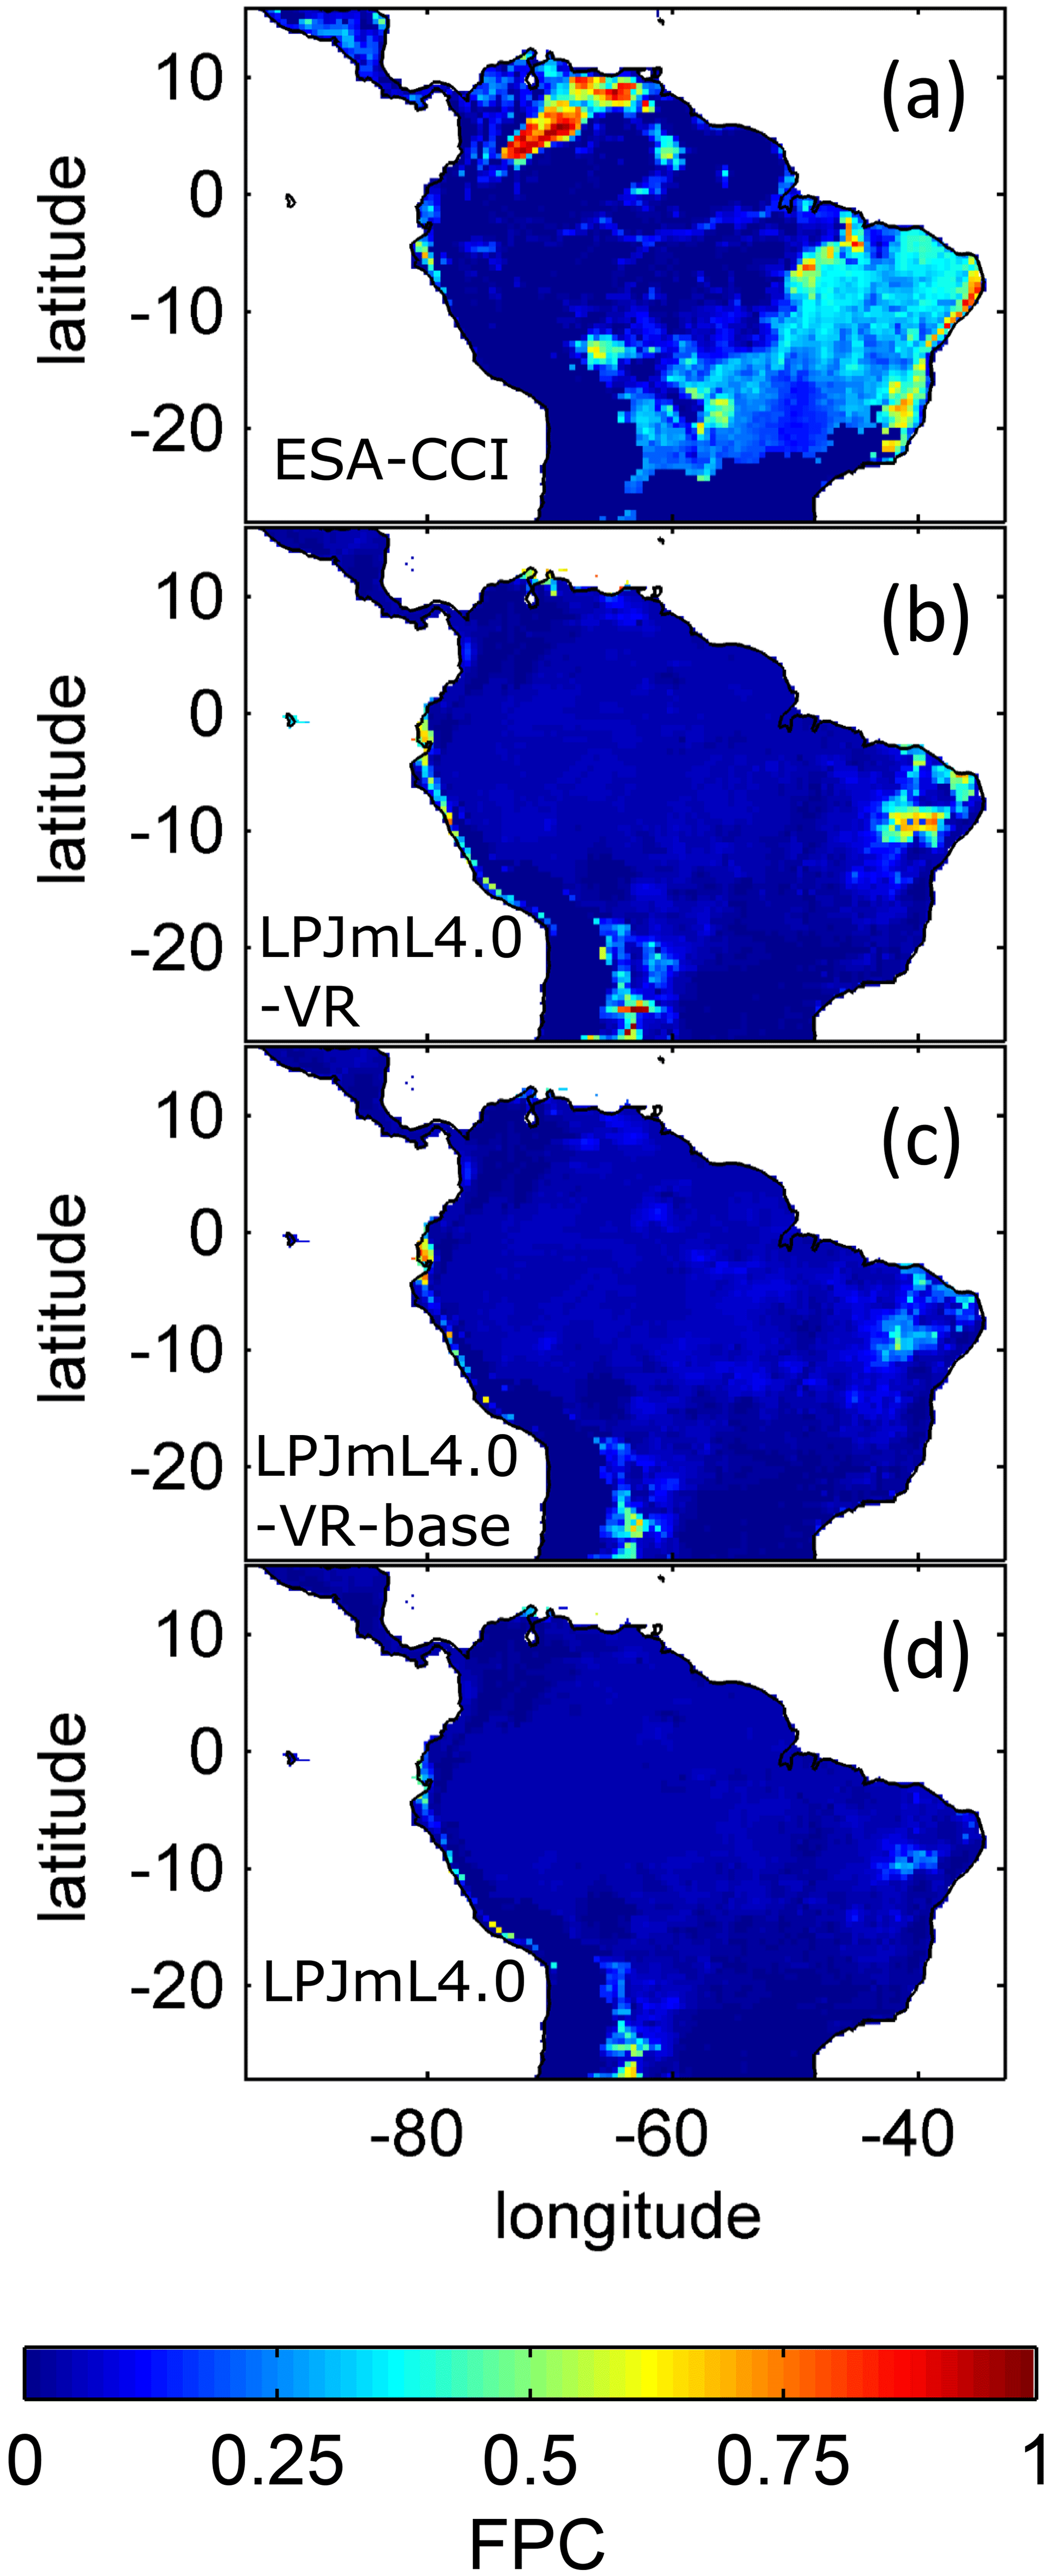
Figure B8Foliage projected cover (FPC) of the tropical herbaceous PFT over the study region. (a) Satellite-derived vegetation composition from ESA Land Cover CCI V2.0.7 (Li et al., 2018) reclassified to the PFTs of LPJmL as in Forkel et al. (2014). (b) LPJmL4.0-VR. (c) LPJmL4.0-VR-base. (d) LPJmL4.0. All LPJmL model versions were forced with CRU climate input. The FPC shown for all models refers to 2001–2010.
It is important to note that LPJmL4.0-VR appears to underestimate BGB compared to empirical findings in the Amazon region. While LPJmL4.0-VR shows BGB making up a range of 3.6 %–16.2 % of total biomass across the Amazon region, different site-specific empirical studies have found mean values at the upper end or significantly exceeding this range (Fearnside, 2016). The most plausible explanation for underestimating BGB is that LPJmL4.0-VR does not account for root structures needed for tree statics. Acknowledging tree statics would increase below-ground carbon investment and therefore BGB. Nevertheless, below-ground carbon investment for tree statics would apply for all sub-PFTs simultaneously and would therefore most likely not significantly change competition dynamics and the resulting distributions of tree rooting strategies found in this study.
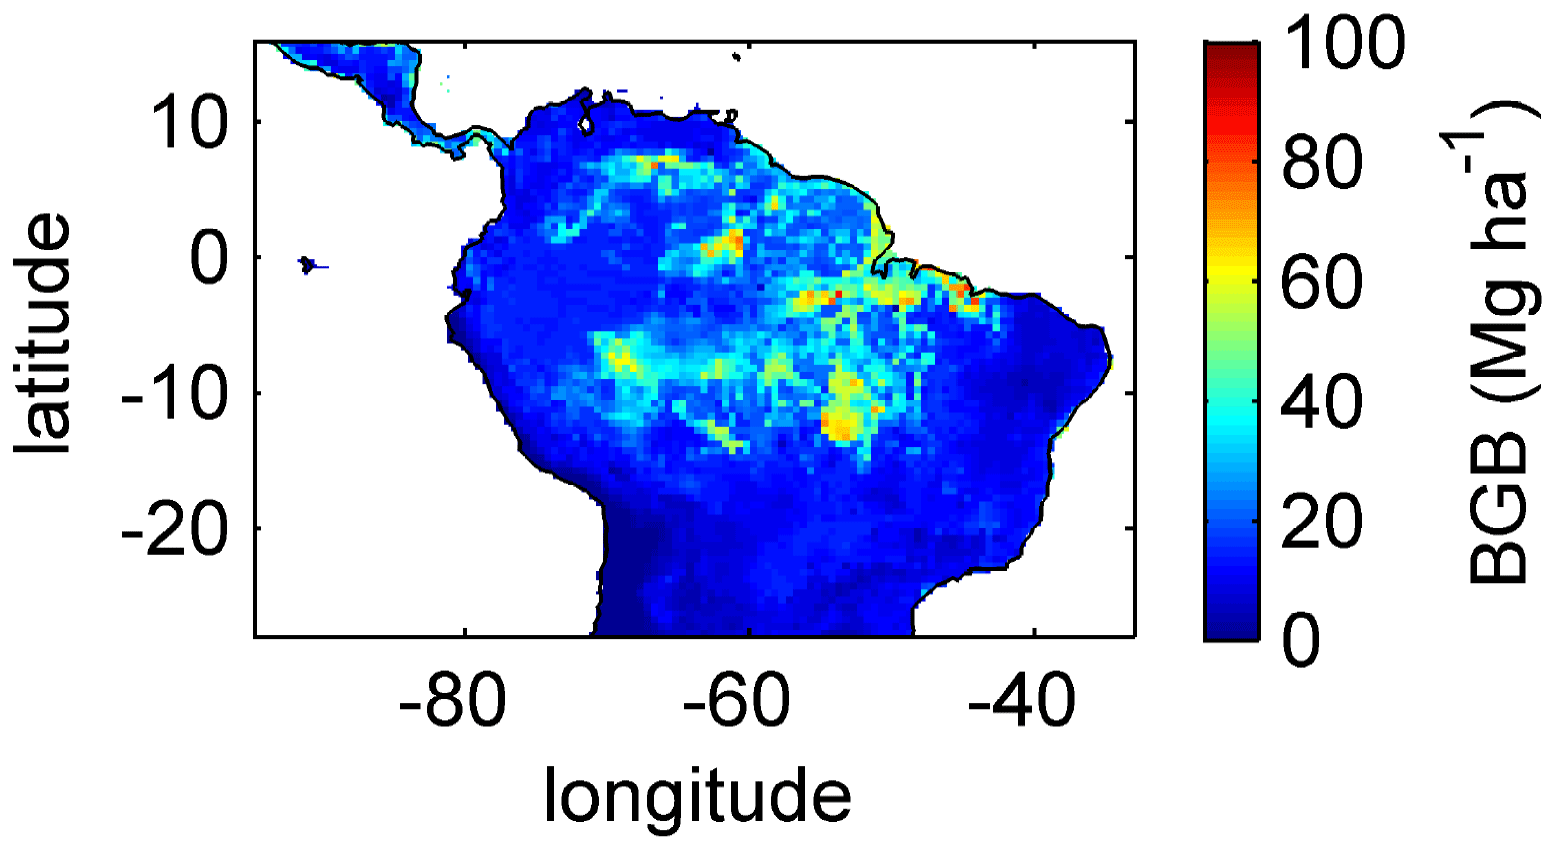
Figure B9Mean sum (2001–2010) of below-ground biomass (BGB; sum of tree coarse and fine roots) of evergreen and deciduous tree PFTs simulated with LPJmL4.0-VR under CRU climate forcing.
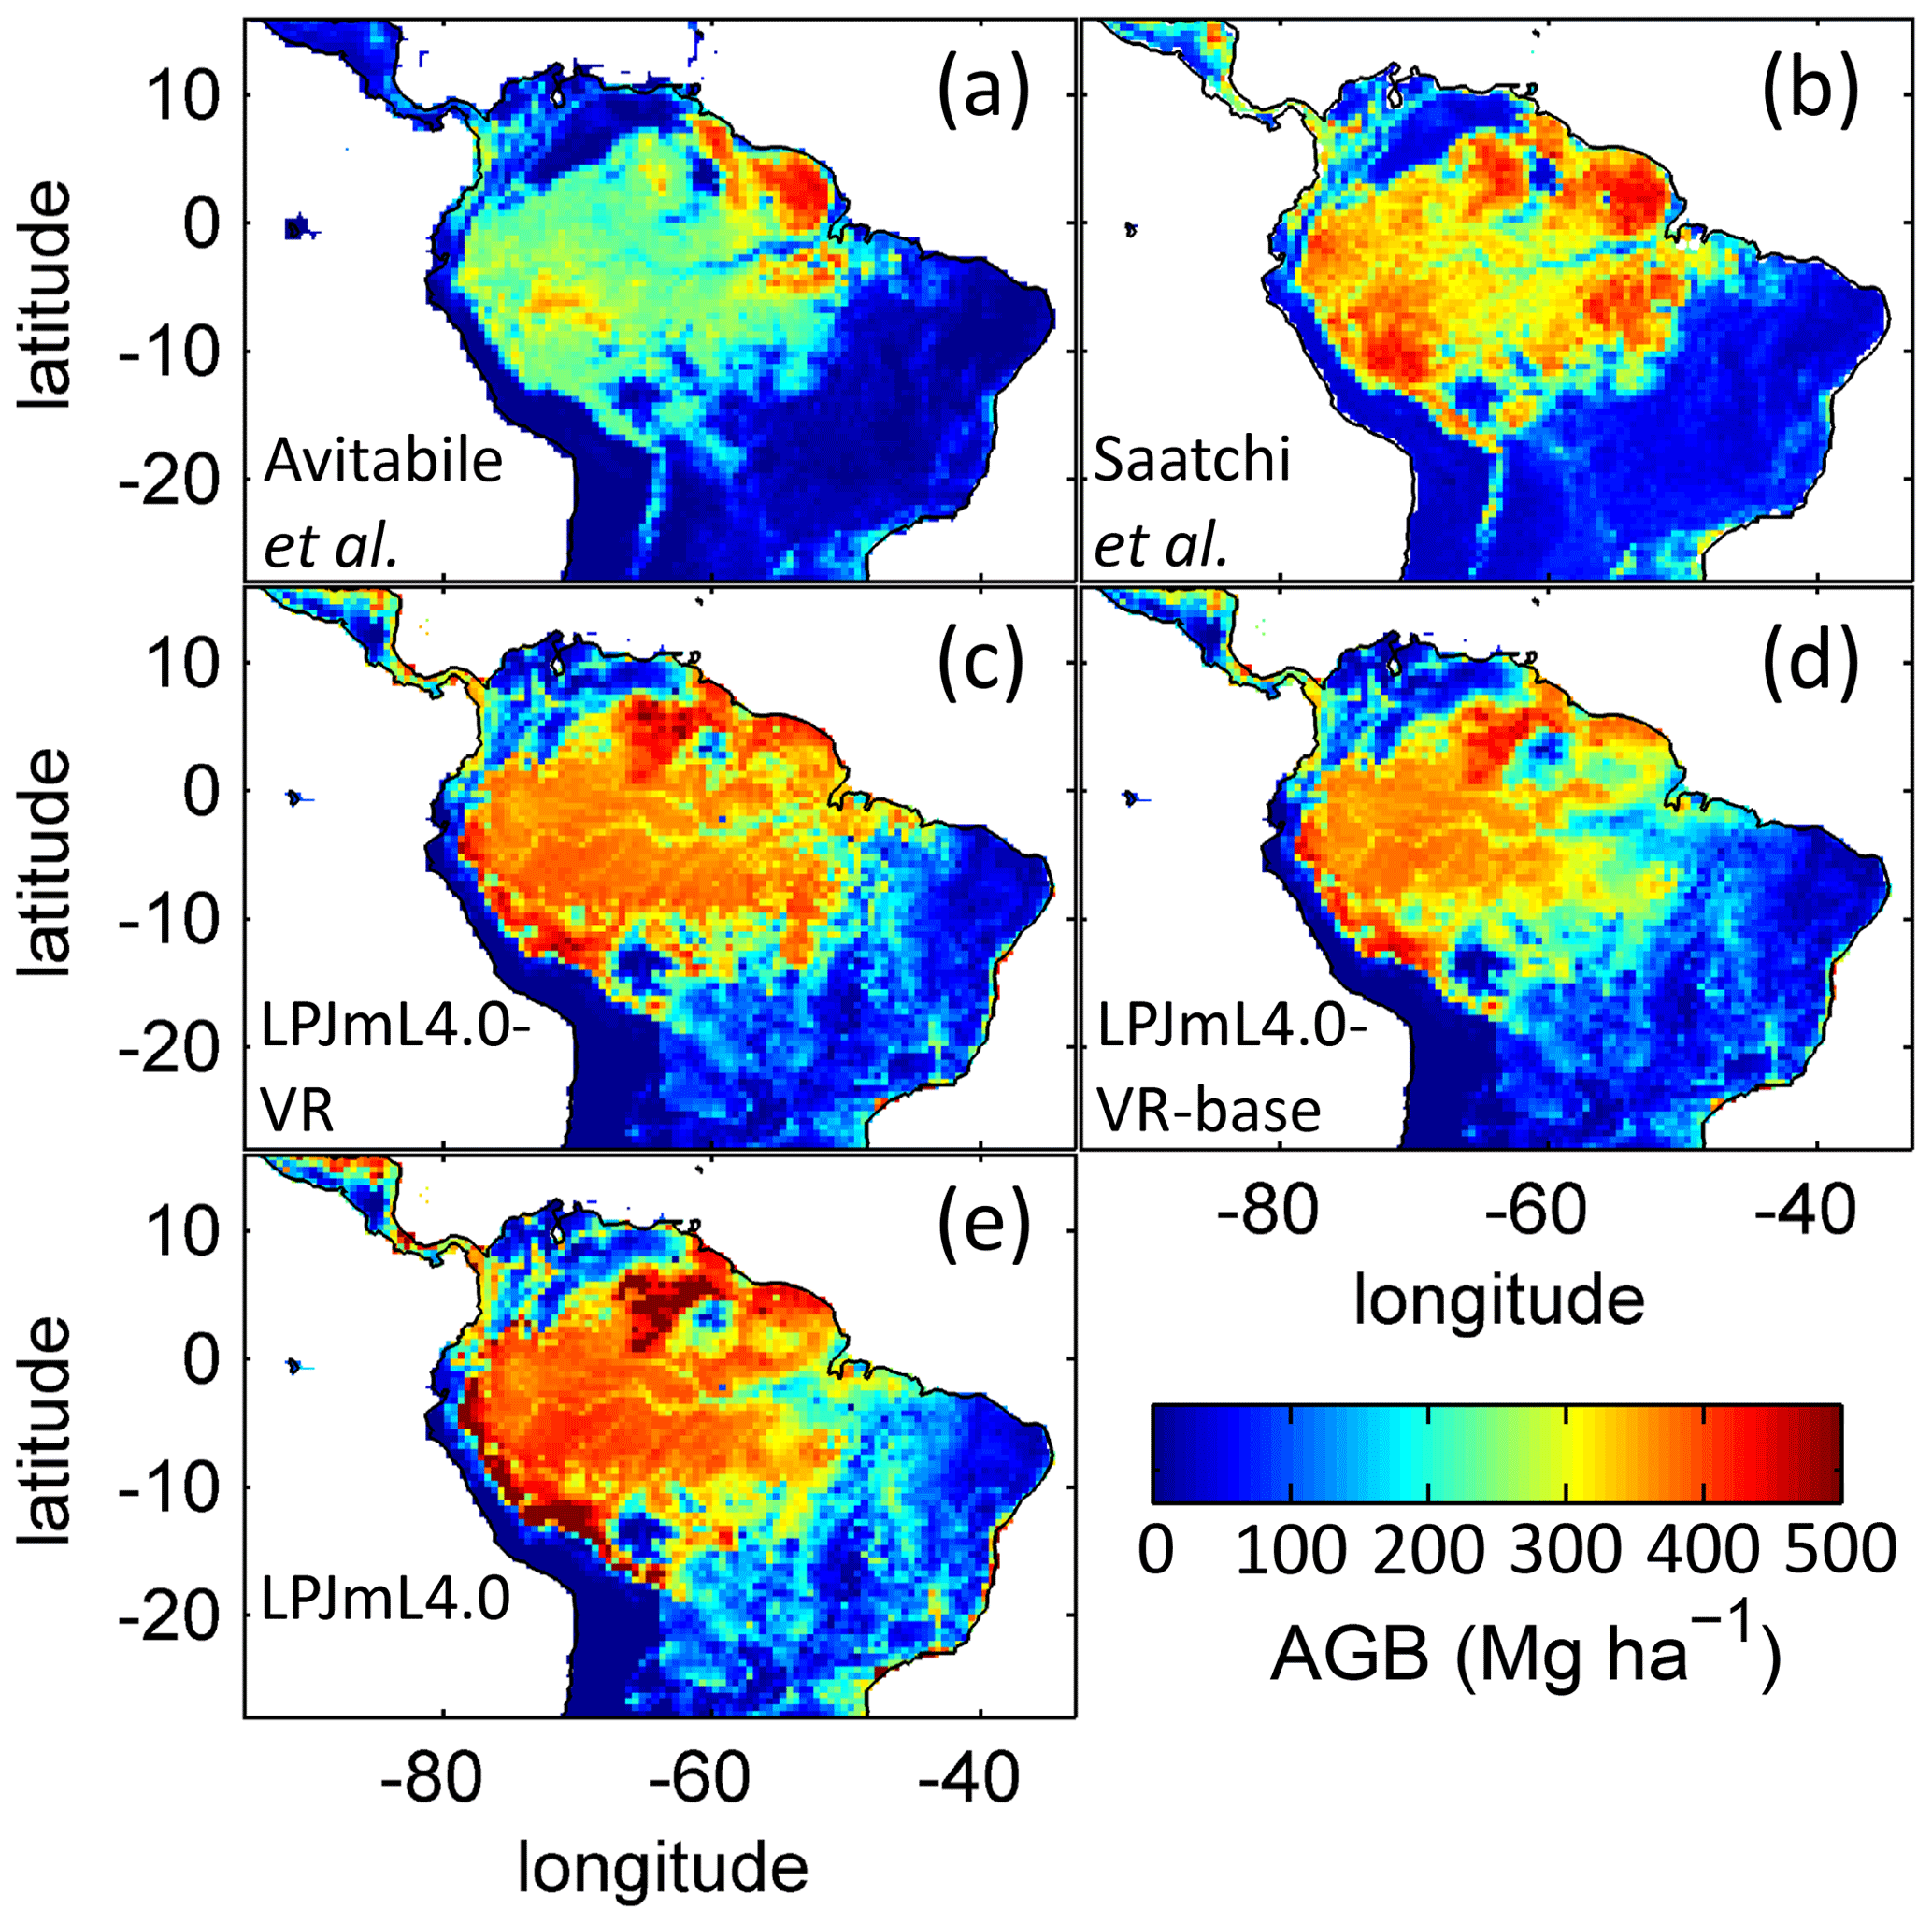
Figure B10Comparison of simulated AGB and satellite-derived AGB validation products regridded to the spatial resolution of LPJmL models. (a) Biomass validation product from Avitabile et al. (2016). (b) AGB validation product from Saatchi et al. (2011). (c–e) Mean AGB simulated for the time span 2001–2010 with (c) LPJmL4.0-VR, (d) LPJmL4.0-VR-base and (e) LPJmL4.0. For statistical measures of individual comparisons between model versions (c–e) and satellite-derived AGB evaluation products (a–b), see Table B5.

Figure B11Difference in soil water reaction to seasonal precipitation between LPJmL4.0-VR-base and LPJmL4.0-VR at FLUXNET site STM_KM67. (a) Mean monthly precipitation input from CRU for 2001–2010. (b) Difference in monthly relative soil water content between LPJmL4.0-VR-base and LPJmL4.0-VR forced with CRU climate for 2001–2010. The underlying model output variable “soil water content” of each model version is a number between 0 and 1 depicting the relative water saturation of the soil. Blue colours denote lower soil water content in LPJmL4.0-VR, and red colours denote a lower soil water content in LPJmL4.0-VR-base.
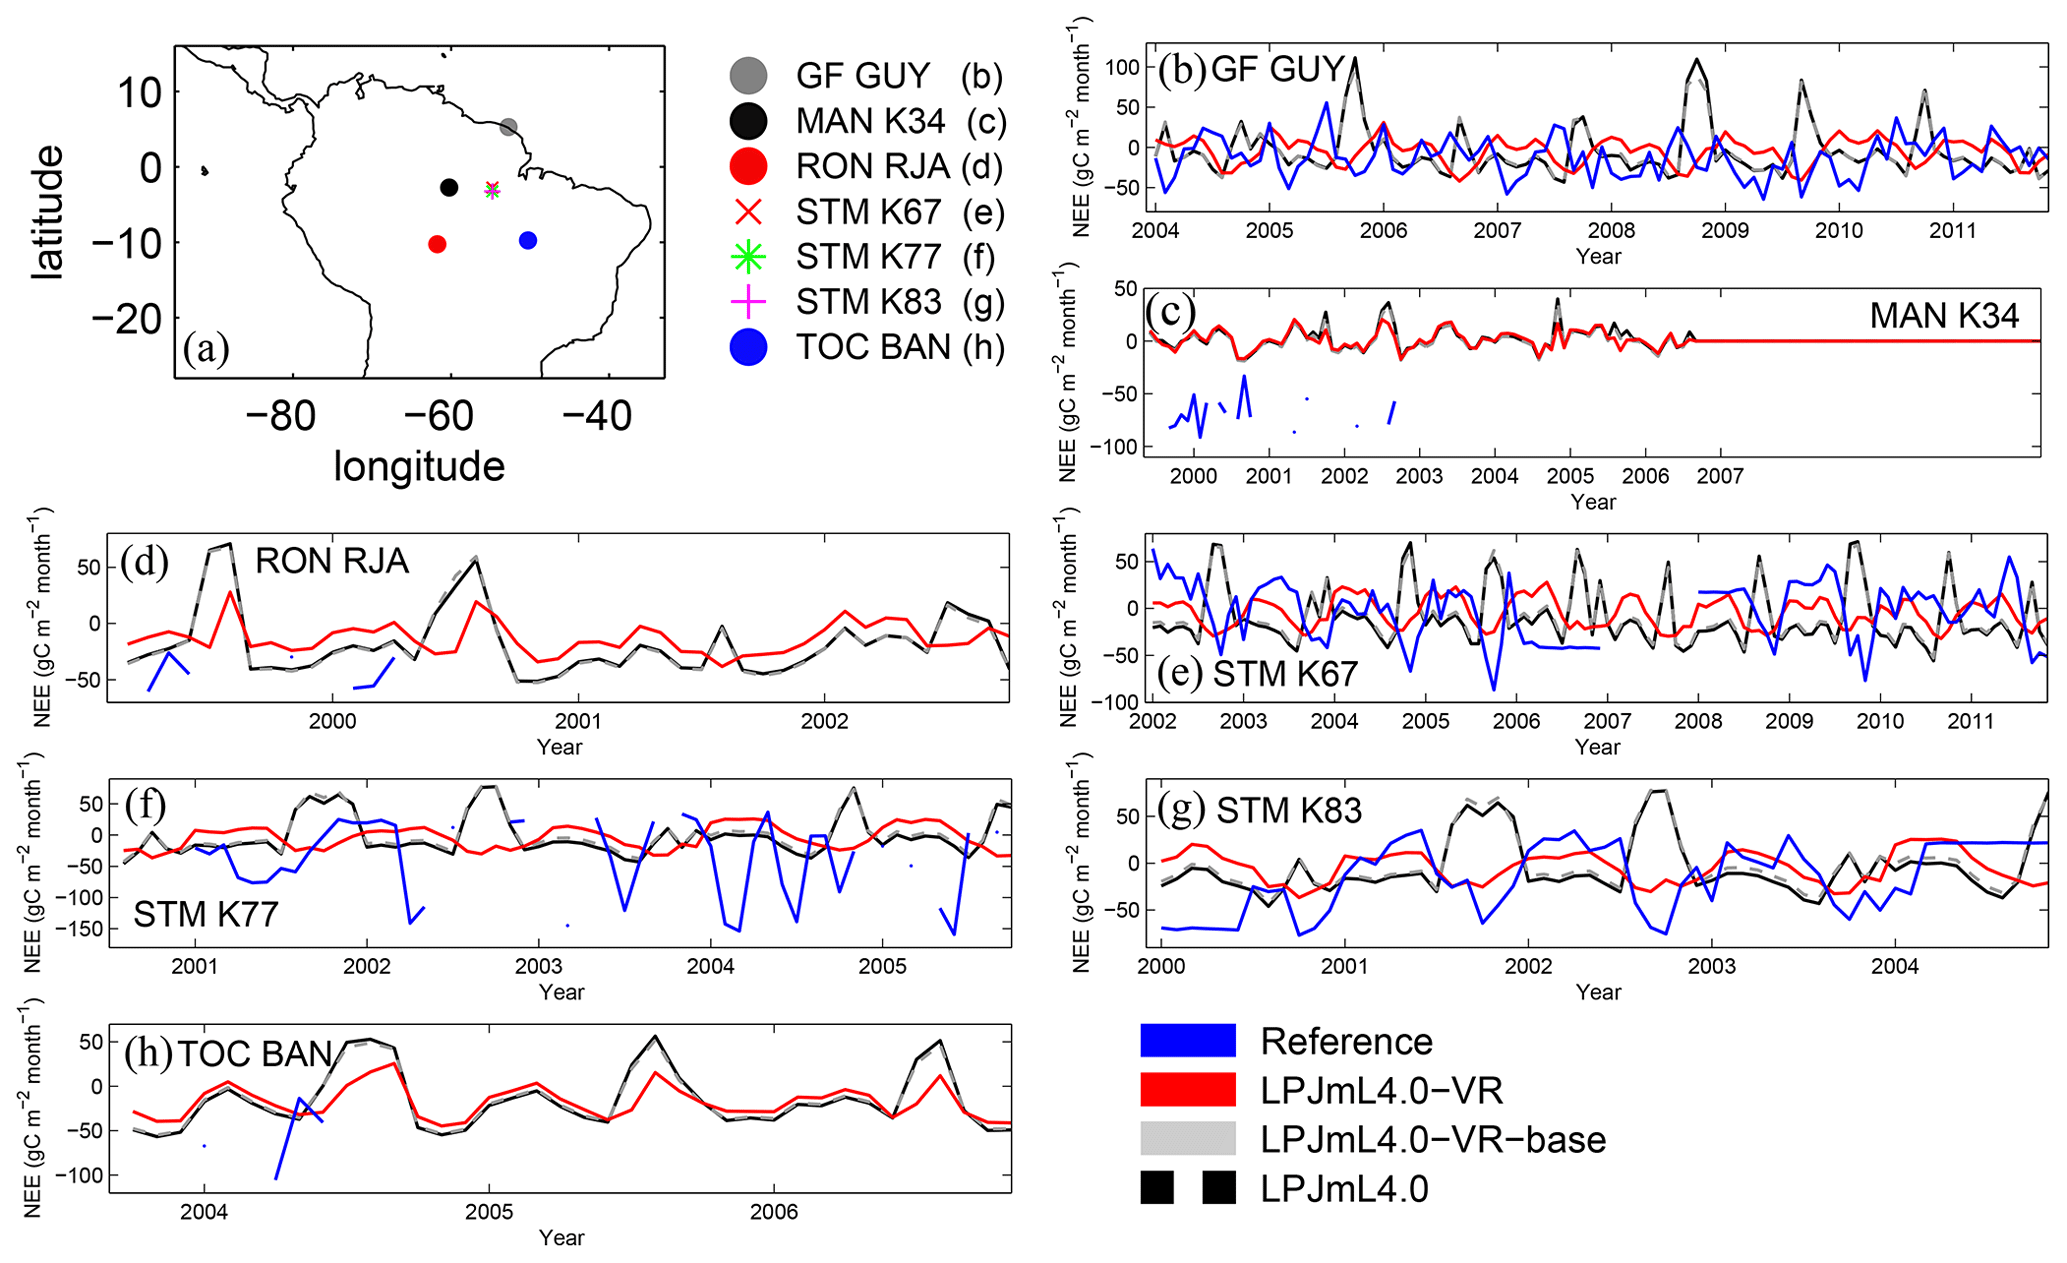
Figure B12Comparisons of monthly NEE between different FLUXNET sites (Reference; see also Sect. 2.5.1) and respective simulation output of the different LPJmL model versions used in this study forced with CRU climate. (a) Geographical location of different FLUXNET sites (see also Table A2).
The model code of LPJmL4.0-VR can be found under https://doi.org/10.5281/zenodo.4709250 and should be cited as Sakschewski et al. (2021a). The model code of standard LPJmL4.0 can be found under Schaphoff et al. (2018b).
All output data of LPJmL4.0-VR, LPJmL4.0-VR-base and LPJmL4.0 analysed in this study can be found under https://doi.org/10.5281/zenodo.4709166 and should be cited as Sakschewski et al. (2021b). All data sources used in this study to run and validate the model versions of LPJmL4.0 are referenced in the “Materials and methods” section (Sect. 2.3–2.5).
Animation of root growth in LPJmL4.0-VR is in accordance with Fig. 1. For description of panels please see description of Fig. 1. For reasons of visual clarity growth of tree stem and crown do not follow the true allometric functions of LPJmL4.0-VR. The video supplement is available at http://www.pik-potsdam.de/~borissa/LPJmL4_VR/Supplementary_Video_1.pptx.
All authors helped in conceptualizing the model. BS and WvB developed the model code. BS, WvB, MD, AS, RR, FL, MB, SB, MH, RO and KT conceived the simulation experiments, and BS carried them out. BS, MD, AS, RR and JH analysed model output data. BS prepared the manuscript with contributions from all co-authors.
The authors declare that they have no conflict of interest.
Boris Sakschewski and Kirsten Thonicke acknowledge funding from the BMBF- and Belmont-Forum-funded project “CLIMAX: Climate Services Through Knowledge Co-Production: A Euro-South American Initiative for Strengthening Societal Adaptation Response to Extreme Events”, FKZ 01LP1610A. Markus Drüke is funded by the DFG–FAPESP within the IRTG 1740/TRP 2015/50122-0. Marina Hirota is supported by a grant from Instituto Serrapilheira – Serra 1709-18983. Anna Amelia Sörensson and Romina Ruscica acknowledge support from PICT-2018-02511 (ANPCyT, Argentina). Maik Billing is funded by the European Union's Horizon 2020 Research and Innovation Programme under grant agreement No 641762 (ECOPOTENTIAL). This work used eddy covariance data acquired and shared by the FLUXNET community, including the following networks: AmeriFlux, AfriFlux, AsiaFlux, CarboAfrica, CarboEuropeIP, CarboItaly, CarboMont, ChinaFlux, Fluxnet-Canada, GreenGrass, ICOS, KoFlux, LBA, NECC, OzFlux-TERN, TCOS-Siberia and USCCC. The ERA-Interim reanalysis data are provided by ECMWF and processed by LSCE. The FLUXNET eddy covariance data processing and harmonization was carried out by the European Fluxes Database Cluster, Ameri- Flux Management Project and Fluxdata project of FLUXNET, with the support of CDIAC and the ICOS Ecosystem Thematic Centre and the OzFlux, ChinaFlux and AsiaFlux offices.
This research has been supported by the Bundesministerium für Bildung und Forschung (grant no. FKZ 01LP1610A), the Deutsche Forschungsgemeinschaft (grant no. IRTG 1740/TRP 2015/50122-0), the Instituto Serrapilheira – Serra (grant no. 1709-18983), the Agencia Nacional de Promoción de la Investigación, el Desarrollo Tecnológico y la Innovación (grant no. PICT-2018-02511) and the European Union's Horizon 2020 Research and Innovation Programme (grant no. 641762).
This paper was edited by Martin De Kauwe and reviewed by Daniel Falster and three anonymous referees.
Adler, R. F., Huffman, G. J., Chang, A., Ferrar, R., Xi, P., Janowiak, J., Rudolf, B., Schneider, U., Curtis, S., Bolvin, D., Gruber, A., Susskind, J., Arkin, P., and Nelkin, E.: The version 2 Global Precipitation Climatology Project (GPCP) monthly precipitation analysis (1979–present), J. Hydrometeor, 4, 1147–1167, https://doi.org/10.1175/1525-7541(2003)004<1147:TVGPCP>2.0.CO;2, 2003.
Allen, C. D., Breshears, D. D., and McDowell, N. G.: On underestimation of global vulnerability to tree mortality and forest die-off from hotter drought in the Anthropocene, Ecosphere, 6, 1–55, https://doi.org/10.1890/ES15-00203.1, 2015.
Aragão, L. E. O. C., Malhi, Y., Roman-Cuesta, R. M., Saatchi, S., Anderson, L. O., and Shimabukuro, Y. E.: Spatial patterns and fire response of recent Amazonian droughts, Geophys. Res. Lett., 34, L07701, https://doi.org/10.1029/2006GL028946, 2007.
Arnold, J. G., Williams, J. R., Nicks, A. D., and Sammons, N. B.: SWRRB: A Basin Scale Simulation Model for Soil and Water Resources Management, J. Environ. Qual., 20, 309, https://doi.org/10.2134/jeq1991.00472425002000010050x, 1990.
Avitabile, V., Herold, M., Heuvelink, G. B. M., Lewis, S. L., Phillips, O. L., Asner, G. P., Armston, J., Ashton, P. S., Banin, L., Bayol, N., Berry, N. J., Boeckx, P., de Jong, B. H. J., Devries, B., Girardin, C. A. J., Kearsley, E., Lindsell, J. A., Lopez-Gonzalez, G., Lucas, R., Malhi, Y., Morel, A., Mitchard, E. T. A., Nagy, L., Qie, L., Quinones, M. J., Ryan, C. M., Ferry, S. J. W., Sunderland, T., Laurin, G. V., Gatti, R. C., Valentini, R., Verbeeck, H., Wijaya, A., and Willcock, S.: An integrated pan-tropical biomass map using multiple reference datasets, Global Change Biol., 22, 1406–1420, https://doi.org/10.1111/gcb.13139, 2016.
Baker, I. T., Prihodko, L., Denning, A. S., Goulden, M., Miller, S., and Da Rocha, H. R.: Seasonal drought stress in the amazon: Reconciling models and observations, J. Geophys. Res.-Biogeo., 114, 1–10, https://doi.org/10.1029/2007JG000644, 2008.
Balsamo, G., Viterbo, P., Beijaars, A., van den Hurk, B., Hirschi, M., Betts, A. K., and Scipal, K.: A revised hydrology for the ECMWF model: Verification from field site to terrestrial water storage and impact in the integrated forecast system, J. Hydrometeorol., 10, 623–643, https://doi.org/10.1175/2008JHM1068.1, 2009.
Balsamo, G., Albergel, C., Beljaars, A., Boussetta, S., Brun, E., Cloke, H., Dee, D., Dutra, E., Muñoz-Sabater, J., Pappenberger, F., de Rosnay, P., Stockdale, T., and Vitart, F.: ERA-Interim/Land: a global land surface reanalysis data set, Hydrol. Earth Syst. Sci., 19, 389–407, https://doi.org/10.5194/hess-19-389-2015, 2015.
Beck, H. E., van Dijk, A. I. J. M., Levizzani, V., Schellekens, J., Miralles, D. G., Martens, B., and de Roo, A.: MSWEP: 3-hourly 0.25∘ global gridded precipitation (1979–2015) by merging gauge, satellite, and reanalysis data, Hydrol. Earth Syst. Sci., 21, 589–615, https://doi.org/10.5194/hess-21-589-2017, 2017.
Becker, A., Finger, P., Meyer-Christoffer, A., Rudolf, B., Schamm, K., Schneider, U., and Ziese, M.: A description of the global land-surface precipitation data products of the Global Precipitation Climatology Centre with sample applications including centennial (trend) analysis from 1901–present, Earth Syst. Sci. Data, 5, 71–99, https://doi.org/10.5194/essd-5-71-2013, 2013.
Best, M. J., Pryor, M., Clark, D. B., Rooney, G. G., Essery, R. L. H., Ménard, C. B., Edwards, J. M., Hendry, M. A., Porson, A., Gedney, N., Mercado, L. M., Sitch, S., Blyth, E., Boucher, O., Cox, P. M., Grimmond, C. S. B., and Harding, R. J.: The Joint UK Land Environment Simulator (JULES), model description – Part 1: Energy and water fluxes, Geosci. Model Dev., 4, 677–699, https://doi.org/10.5194/gmd-4-677-2011, 2011.
Bonal, D., Bosc, A., Ponton, S., Goret, J., Burban, B., Gross, P., Bonnefonds, J. M., Elbers, J. A., Longdoz, B., Epron, D., Guehl, J., and Granier, A.: Impact of severe dry season on net ecosystem exchange in the Neotropical rainforest of French Guiana, Global Change Biol., 14, 1917–1933, https://doi.org/10.1111/j.1365-2486.2008.01610.x, 2008.
Brum, M., Vadeboncoeur, M. A., Ivanov, V., Asbjornsen, H., Saleska, S., Alves, L. F., Penha, D., Dias, J. D., Aragão, L. E. O. C., Barros, F., Bittencourt, P., Pereira, L., and Oliveira, R. S.: Hydrological niche segregation defines forest structure and drought tolerance strategies in a seasonal Amazon forest, J. Ecol., 107, 318–333, https://doi.org/10.1111/1365-2745.13022, 2019.
Brunner, I., Herzog, C., Dawes, M. A., Arend, M., and Sperisen, C.: How tree roots respond to drought, Front. Plant Sci., 6, 547, https://doi.org/10.3389/fpls.2015.00547, 2015.
Canadell, J., Jackson, R. B., Ehleringer, J. R., Mooney, H. A., Sala, O. E., and Schulze, E.-D.: Max rooting depth of vegetation types at the global scale, Oecologica, 108, 583–595, https://doi.org/10.1007/s10705-016-9812-z, 1996.
Carvalhais, N., Forkel, M., Khomik, M., Bellarby, J., Jung, M., Migliavacca, M., Saatchi, S., Santoro, M., Thurner, M., and Weber, U.: Global covariation of carbon turnover times with climate in terrestrial ecosystems, Nature, 514, 213–217, 2014.
Ciemer, C., Boers, N., Hirota, M., Kurths, J., Müller-Hansen, F., Oliveira, R. S., and Winkelmann, R.: Higher resilience to climatic disturbances in tropical vegetation exposed to more variable rainfall, Nat. Geosci., 12, 174–179, https://doi.org/10.1038/s41561-019-0312-z, 2019.
Cosby, B. J., Hornberger, G. M., Clapp, R. B., and Ginn, T.: A statistical exploration of the relationships of soil moisture characteristics to the physical properties of soils, Water Resour. Res., 20, 682–690, 1984.
Costa, M. H., Biajoli, M. C., Sanches, L., Malhado, A. C. M., Hutyra, L. R., Da Rocha, H. R., Aguiar, R. G., and De Araújo, A. C.: Atmospheric versus vegetation controls of Amazonian tropical rain forest evapotranspiration: Are the wet and seasonally dry rain forests any different?, J. Geophys. Res.-Biogeo., 115, G04021, https://doi.org/10.1029/2009JG001179, 2010.
da Rocha, H. R., Goulden, M. L., Miller, S. D., Menton, M., Pinto, L. D. V. O., Freitas, H. C. De, and Figueira Silva, E. M. A.: Seasonality of water and heat fluxes over a tropical forest in eastern Amazonia, Ecol. Appl., 14, 22–32, https://doi.org/10.1890/02-6001, 2004.
Dee, D. P., Uppala, S. M., Simmons, A. J., Berrisford, P., Poli, P., Kobayashi, S., Andrae, U., Balmaseda, M. A., Balsamo, G., Bauer, P., Bechtold, P., Beljaars, A. C. M., van de Berg, L., Bidlot, J., Bormann, N., Delsol, C., Dragani, R., Fuentes, M., Geer, A. J., Haimberger, L., Healy, S. B., Hersbach, H., Hólm, E. V., Isaksen, L., Kållberg, P., Köhler, M., Matricardi, M., Mcnally, A. P., Monge-Sanz, B. M., Morcrette, J. J., Park, B. K., Peubey, C., de Rosnay, P., Tavolato, C., Thépaut, J. N., and Vitart, F.: The ERA-Interim reanalysis: Configuration and performance of the data assimilation system, Q. J. Roy. Meteor. Soc., 137, 553–597, https://doi.org/10.1002/qj.828, 2011.
Dirmeyer, P. A., Gao, X., Zhao, M., Guo, Z., Oki, T., and Hanasaki, N.: GSWP-2: Multimodel analysis and implications for our perception of the land surface, B. Am. Meteorol. Soc., 87, 1381–1398, https://doi.org/10.1175/BAMS-87-10-1381, 2006.
Ek, M. B., Mitchell, K. E., Lin, Y., Rogers, E., Grunmann, P., Koren, V., Gayno, G., and Tarpley, J. D.: Implementation of Noah land surface model advances in the National Centers for Environmental Prediction operational mesoscale Eta model, J. Geophys. Res.-Atmos., 108, 8851, https://doi.org/10.1029/2002jd003296, 2003.
Eshel, A. and Grünzweig, J. M.: Root-shoot allometry of tropical forest trees determined in a large-scale aeroponic system, Ann. Bot.-London, 112, 291–296, https://doi.org/10.1093/aob/mcs275, 2013.
Fan, Y., Miguez-Macho, G., Jobbágy, E. G., Jackson, R. B., and Otero-Casal, C.: Hydrologic regulation of plant rooting depth, P. Natl. Acad. Sci. USA, 114, 10572–10577, https://doi.org/10.1073/pnas.1712381114, 2017.
Fearnside, P. M.: Brazil's Amazonian forest carbon: the key to Southern Amazonia's significance for global climate, Reg. Environ. Change, 18, 47–61, https://doi.org/10.1007/s10113-016-1007-2, 2016.
Forkel, M., Carvalhais, N., Schaphoff, S., v. Bloh, W., Migliavacca, M., Thurner, M., and Thonicke, K.: Identifying environmental controls on vegetation greenness phenology through model–data integration, Biogeosciences, 11, 7025–7050, https://doi.org/10.5194/bg-11-7025-2014, 2014.
Guimberteau, M., Zhu, D., Maignan, F., Huang, Y., Yue, C., Dantec-Nédélec, S., Ottlé, C., Jornet-Puig, A., Bastos, A., Laurent, P., Goll, D., Bowring, S., Chang, J., Guenet, B., Tifafi, M., Peng, S., Krinner, G., Ducharne, A., Wang, F., Wang, T., Wang, X., Wang, Y., Yin, Z., Lauerwald, R., Joetzjer, E., Qiu, C., Kim, H., and Ciais, P.: ORCHIDEE-MICT (v8.4.1), a land surface model for the high latitudes: model description and validation, Geosci. Model Dev., 11, 121–163, https://doi.org/10.5194/gmd-11-121-2018, 2018.
Harris, I., Jones, P. D., Osborn, T. J., and Lister, D. H.: Updated high-resolution grids of monthly climatic observations – the CRU TS3.10 Dataset, Int. J. Climatol., 34, 623–642, https://doi.org/10.1002/joc.3711, 2014.
Hijmans, R. J. and van Etten, J.: raster: Geographic data analysis and modeling, R Packag. version 2 (8), 2016.
Hirota, M., Holmgren, M., Van New, E. H., and Scheffer, M.: Global Resilience of Tropical Forest, Science, 334, 232–235, https://doi.org/10.1126/science.1210657, 2011.
Huang, S., Titus, S. J., and Wiens, D. P.: Comparison of nonlinear height-diameter functions for major Alberta tree species, Can. J. Forest Res., 22, 1297–1304, 1992.
Ichii, K., Hashimoto, H., White, M. A., Potter, C., Hutyra, L. R., Huete, A. R., Myneni, R. B., and Nemani, R. R.: Constraining rooting depths in tropical rainforests using satellite data and ecosystem modeling for accurate simulation of gross primary production seasonality, Global Change Biol., 13, 67–77, https://doi.org/10.1111/j.1365-2486.2006.01277.x, 2007.
Jackson, R. B., Canadell, J., Ehleringer, J., Mooney, H., Sala, O., and Schulze, E.: A global analysis of root distributions for terrestrial biomes, Oecologica, 108, 389–411, 1996.
Jenik, J.: Roots and root systems in tropical trees, Trop. trees as living Syst., p. 323, 1978.
Johnson, D. M., Domec, J.-C., Berry, Z. C., Schwantes, A. M., McCulloh, K. A., Woodruff, D. R., Polley, H. W., Wortemann, R., Swenson, J. J., Mackay, D. S., McDowell, N. G., and Jackson, R. B.: Co-occurring woody species have diverse hydraulic strategies and mortality rates during an extreme drought, Plant Cell Environ., 41, 576–588, https://doi.org/10.1111/pce.13121, 2018.
Kattge, J., Bönisch, G., Díaz, S., Lavorel, S., Prentice, I. C., Leadley, P., Tautenhahn, S., Werner, G. D. A., Aakala, T., and Abedi, M.: TRY plant trait database – enhanced coverage and open access, Global Change Biol., 26, 119–188, https://doi.org/10.1111/gcb.14904, 2020.
Kelley, D. I., Prentice, I. C., Harrison, S. P., Wang, H., Simard, M., Fisher, J. B., and Willis, K. O.: A comprehensive benchmarking system for evaluating global vegetation models, Biogeosciences, 10, 3313–3340, https://doi.org/10.5194/bg-10-3313-2013, 2013.
Kim, Y., Knox, R. G., Longo, M., Medvigy, D., Hutyra, L. R., Pyle, E. H., Wofsy, S. C., Bras, R. L., and Moorcroft, P. R.: Seasonal carbon dynamics and water fluxes in an Amazon rainforest, Global Change Biol., 18, 1322–1334, https://doi.org/10.1111/j.1365-2486.2011.02629.x, 2012.
Kleidon, A. and Heimann, M.: A method of determining rooting depth from a terrestrial biosphere model and its impacts on the global water and carbon cycle, Global Change Biol., 4, 275–286, https://doi.org/10.1046/j.1365-2486.1998.00152.x, 1998.
Kleidon, A. and Heimann, M.: Deep-rooted vegetation, Amazonian deforestation, and climate: Results from a modelling study, Global Ecol. Biogeogr., 8, 397–405, https://doi.org/10.1046/j.1365-2699.1999.00150.x, 1999.
Kleidon, A. and Heimann, M.: Assessing the role of deep rooted vegetation in the climate system with model simulations: Mechanism, comparison to observations and implications for Amazonian deforestation, Clim. Dynam., 16, 183–199, https://doi.org/10.1007/s003820050012, 2000.
Krysanova, V., Müller-Wohlfeil, D.-I., and Becker, A.: Development and test of a spatially distributed hydrological/water quality model for mesoscale watersheds, Ecol. Model., 106, 261–289, 1998.
Langan, L., Higgins, S. I., and Scheiter, S.: Climate-biomes, pedo-biomes or pyro-biomes: which world view explains the tropical forest-savanna boundary in South America?, J. Biogeogr., 44, 2319–2330, https://doi.org/10.1111/jbi.13018, 2017.
Lawrence, D. M., Oleson, K. W., Flanner, M. G., Thornton, P. E., Swenson, S. C., Lawrence, P. J., Zeng, X., Yang, Z.-L., Levis, S., Sakaguchi, K., Bonan, G. B., and Slater, A. G.: Parameterization improvements and functional and structural advances in Version 4 of the Community Land Model, J. Adv. Model. Earth Sy., 3, M03001, https://doi.org/10.1029/2011MS00045, 2011.
Lee, J. E., Oliveira, R. S., Dawson, T. E., and Fung, I.: Root functioning modifies seasonal climate, P. Natl. Acad. Sci. USA, 102, 17576–17581, https://doi.org/10.1073/pnas.0508785102, 2005.
Leuschner, C., Moser, G., Bertsch, C., Röderstein, M., and Hertel, D.: Large altitudinal increase in tree root/shoot ratio in tropical mountain forests of Ecuador, Basic Appl. Ecol., 8, 219–230, 2007.
Lewis, S. L., Brando, P. M., Phillips, O. L., Van Der Heijden, G. M. F., and Nepstad, D.: The 2010 Amazon drought, Science, 331, p. 554, https://doi.org/10.1126/science.1200807, 2011.
Li, W., MacBean, N., Ciais, P., Defourny, P., Lamarche, C., Bontemps, S., Houghton, R. A., and Peng, S.: Gross and net land cover changes in the main plant functional types derived from the annual ESA CCI land cover maps (1992–2015), Earth Syst. Sci. Data, 10, 219–234, https://doi.org/10.5194/essd-10-219-2018, 2018.
Liu, Y. Y., Dorigo, W. A., Parinussa, R. M., De Jeu, R. A. M., Wagner, W., McCabe, M. F., Evans, J. P., and Van Dijk, A. I. J. M.: Trend-preserving blending of passive and active microwave soil moisture retrievals, Remote Sens. Environ., 123, 280–297, https://doi.org/10.1016/j.rse.2012.03.014, 2012.
Liu, Y. Y., van Dijk, A. I. J. M., McCabe, M. F., Evans, J. P., and de Jeu, R. A. M.: Global vegetation biomass change (1988–2008) and attribution to environmental and human drivers, Global Ecol. Biogeogr., 22, 692–705, https://doi.org/10.1111/geb.12024, 2013.
Malhi, Y., Aragao, L. E. O. C., Galbraith, D., Huntingford, C., Fisher, R., Zelazowski, P., Sitch, S., McSweeney, C., and Meir, P.: Exploring the likelihood and mechanism of a climate-change-induced dieback of the Amazon rainforest, P. Natl. Acad. Sci. USA, 106, 20610–20615, https://doi.org/10.1073/pnas.0804619106, 2009.
Markewitz, D., Devine, S., Davidson, E. A., Brando, P., and Nepstad, D. C.: Soil moisture depletion under simulated drought in the Amazon: Impacts on deep root uptake, New Phytol., 187, 592–607, https://doi.org/10.1111/j.1469-8137.2010.03391.x, 2010.
Martens, B., Miralles, D. G., Lievens, H., van der Schalie, R., de Jeu, R. A. M., Fernández-Prieto, D., Beck, H. E., Dorigo, W. A., and Verhoest, N. E. C.: GLEAM v3: satellite-based land evaporation and root-zone soil moisture, Geosci. Model Dev., 10, 1903–1925, https://doi.org/10.5194/gmd-10-1903-2017, 2017.
Masson, V., Champeaux, J. L., Chauvin, F., Meriguet, C., and Lacaze, R.: A global database of land surface parameters at 1 km resolution in meteorological and climate models, J. Climate, 16, 1261–1282, https://doi.org/10.1175/1520-0442(2003)16<1261:AGDOLS>2.0.CO;2, 2003.
Miralles, D. G., Holmes, T. R. H., De Jeu, R. A. M., Gash, J. H., Meesters, A. G. C. A., and Dolman, A. J.: Global land-surface evaporation estimated from satellite-based observations, Hydrol. Earth Syst. Sci., 15, 453–469, https://doi.org/10.5194/hess-15-453-2011, 2011.
Mokany, K., Raison, R. J., and Prokushkin, A. S.: Critical analysis of root: Shoot ratios in terrestrial biomes, Global Change Biol., 12, 84–96, https://doi.org/10.1111/j.1365-2486.2005.001043.x, 2006.
Nachtergaele, F., van Velthuizen, H. T., Verelst, L., Batjes, N., Dijkshoorn, K., van Engelen, V., Fischer, G., Jones, A., Montanarella, L., and Petri, M.: Harmonized world soil database, Food and Agriculture Organization of the United Nations, FAO, Rome, Italy and IIASA, Laxenburg, Austria, available at: http://www.fao.org/soils-portal/soil-survey/soil-maps-and-databases/harmonized-world-soil-database-v12/en/ (last access: 7 July 2021), 2009.
Nemani, R. R., Keeling, C. D., Hashimoto, H., Jolly, W. M., Piper, S. C., Tucker, C. J., Myneni, R. B., and Running, S. W.: Climate-driven increases in global terrestrial net primary production from 1982 to 1999, Science, 300, 1560–1563, https://doi.org/10.1126/science.1082750, 2003.
New, M., Hulme, M., and Jones, P.: Representing twentieth century space-time climate variability, Part II: development of a 1901–1996 monthly grids of terrestrial surface climate, J. Climate, 13, 2217–2238, 2000.
Nikolova, P. S., Zang, C., and Pretzsch, H.: Combining tree-ring analyses on stems and coarse roots to study the growth dynamics of forest trees: A case study on Norway spruce (Picea abies [L.] H. Karst), Trees-Struct. Funct., 25, 859–872, https://doi.org/10.1007/s00468-011-0561-y, 2011.
Ostle, N. J., Smith, P., Fisher, R., Woodward, F. I., Fisher, J. B., Smith, J. U., Galbraith, D., Levy, P., Meir, P., McNamara, N. P., and Bardgett, R. D.: Integrating plant-soil interactions into global carbon cycle models, J. Ecol., 97, 851–863, https://doi.org/10.1111/j.1365-2745.2009.01547.x, 2009.
Pelletier, J. D., Broxton, P. D., Hazenberg, P., Zeng, X., Troch, P. A., Niu, G.-Y., Williams, Z., Brunke, M. A., and Gochis, D.: A gridded global data set of soil, intact regolith, and sedimentary deposit thicknesses for regional and global land surface modeling, J. Adv. Model. Earth Sy., 8, 41–65, https://doi.org/10.1002/2017MS001065, 2016.
Poorter, H., Niklas, K. J., Reich, P. B., Oleksyn, J., Poot, P., and Mommer, L.: Biomass allocation to leaves, stems and roots: meta-analyses of interspecific variation and environmental control, New Phytol., 193, 30–50, 2012.
Prentice, I. C., Sykes, M. T., and Cramer, W.: A simulation model for the transient effects of climate change on forest landscapes, Ecol. Model., 65, 51–70, 1993.
R Core Team: A language and environment for statistical computing, R Foundatoin for Statistical Computing, available at: https://www.r-project.org/ (last access: 23 January 2020), 2019.
Rodell, M., Houser, P. R., Jambor, U., Gottschalck, J., Mitchell, K., Meng, C.-J., Arsenault, K., Cosgrove, B., Radakovich, J., Bosilovich, M., Entin, J. K., Walker, J. P., Lohmann, D., and Toll, D.: The Global Land Data Assimilation System, B. Am. Meteorol. Soc., 85, 381–394, 2004.
Saatchi, S. S., Harris, N. L., Brown, S., Lefsky, M., Mitchard, E. T. A., Salas, W., Zutta, B. R., Buermann, W., Lewis, S. L., Hagen, S., Petrova, S., White, L., Silman, M., and Morel, A.: Benchmark map of forest carbon stocks in tropical regions across three continents, P. Natl. Acad. Sci. USA, 108, 9899–9904, https://doi.org/10.1073/pnas.1019576108, 2011.
Sakschewski, B., von Bloh, W., Drüke, M., Sörensson, A. A., Ruscica, R., Langerwisch, F., Billing, M., Bereswill, S., Hirota, M., Oliveira, R. S., Heinke, J., and Thonicke, K.: LPJmL4.0-VR Model Code, Zenodo [code], https://doi.org/10.5281/zenodo.4709250, 2021a.
Sakschewski, B., von Bloh, W., Drüke, M., Sörensson, A. A., Ruscica, R., Langerwisch, F., Billing, M., Bereswill, S., Hirota, M., Oliveira, R. S., Heinke, J., and Thonicke, K.: LPJmL4.0-VR Model Output, Zenodo [code], https://doi.org/10.5281/zenodo.4709166, 2021b.
Saleska, S. R., Da Rocha, H. R., Huete, A. R., Nobre, A. D., Artaxo, P. E., and Shimabukuro, Y. E.: LBA-ECO CD-32 Flux Tower Network Data Compilation, Brazilian Amazon: 1999–2006, ORNL DAAC, Oak Ridge, Tennessee, USA, https://doi.org/10.3334/ORNLDAAC/1174, 2013.
Schaphoff, S., von Bloh, W., Rammig, A., Thonicke, K., Biemans, H., Forkel, M., Gerten, D., Heinke, J., Jägermeyr, J., Knauer, J., Langerwisch, F., Lucht, W., Müller, C., Rolinski, S., and Waha, K.: LPJmL4 – a dynamic global vegetation model with managed land – Part 1: Model description, Geosci. Model Dev., 11, 1343–1375, https://doi.org/10.5194/gmd-11-1343-2018, 2018a.
Schaphoff, S., von Bloh, W., Thonicke, K., Biemans, H., Forkel, M., Gerten, D., Heinke, J., Jägermeyr, J., Müller, C., Rolinski, S., Waha, K., Stehfest, E., de Waal, L., Heyder, U., Gumpenberger, M., and Beringer, T.: LPJmL4 Model Code, V. 4.0, GFZ Data Services [code], https://doi.org/10.5880/pik.2018.002, 2018b.
Schymanski, S. J., Sivapalan, M., Roderick, M. L., Beringer, J., and Hutley, L. B.: An optimality-based model of the coupled soil moisture and root dynamics, Hydrol. Earth Syst. Sci., 12, 913–932, https://doi.org/10.5194/hess-12-913-2008, 2008.
Sheffield, J., Goteti, G., and Wood, E. F.: Development of a 50-year high-resolution global dataset of meteorological forcings for land surface modeling, J. Climate, 19, 3088–3111, https://doi.org/10.1175/JCLI3790.1, 2006.
Shinozaki, K., Yoda, K., and Kira, T.: A quantitative analysis of plant form – The pipe model theory, Jpn. J. Ecol., 14, 133–139, https://doi.org/10.18960/seitai.14.4_133, 1964.
Smith, B., Wårlind, D., Arneth, A., Hickler, T., Leadley, P., Siltberg, J., and Zaehle, S.: Implications of incorporating N cycling and N limitations on primary production in an individual-based dynamic vegetation model, Biogeosciences, 11, 2027–2054, https://doi.org/10.5194/bg-11-2027-2014, 2014.
Sörensson, A. A. and Ruscica, R. C.: Intercomparison and Uncertainty Assessment of Nine Evapotranspiration Estimates Over South America, Water Resour. Res., 54, 2891–2908, https://doi.org/10.1002/2017WR021682, 2018.
Staal, A., Tuinenburg, O. A., Bosmans, J. H. C., Holmgren, M., Van Nes, E. H., Scheffer, M., Zemp, D. C., and Dekker, S. C.: Forest-rainfall cascades buffer against drought across the Amazon, Nat. Clim. Change, 8, 539–543, https://doi.org/10.1038/s41558-018-0177-y, 2018.
Staver, A. C., Archibald, S., and Levin, S. A.: The global extent and determinants of savanna and forest as alternative biome states, Science, 334, 230–232, https://doi.org/10.1126/science.1210465, 2011.
Tans, P. and Keeling, R.: Trends in Atmospheric Carbon Dioxide, NOAA Earth System Research Laboratories (ESRL), Boulder, Colorado, USA, available at: http://www.esrl.noaa.gov/gmd/ccgg/trends (last access: 7 July 2021), 2015.
Thonicke, K., Venevsky, S., Sitch, S., and Cramer, W.: The role of fire disturbance for global vegetation dynamics: Coupling fire into a dynamic global vegetation model, Global Ecol. Biogeogr., 10, 661–677, https://doi.org/10.1046/j.1466-822X.2001.00175.x, 2001.
Waring, R. H., Schroeder, P. E., and Oren, R.: Application of the pipe model theory to predict canopy leaf area, Can. J. Forest Res., 12, 556–560, https://doi.org/10.1139/x82-086, 1982.
Warren, J. M., Hanson, P. J., Iversen, C. M., Kumar, J., Walker, A. P., and Wullschleger, S. D.: Root structural and functional dynamics in terrestrial biosphere models – evaluation and recommendations, New Phytol., 205, 59–78, https://doi.org/10.1111/nph.13034, 2015.
Weedon, G. P., Gomes, S., Viterbo, P., Shuttleworth, W. J., Blyth, E., Österle, H., Adam, J. C., Bellouin, N., Boucher, O., and Best, M.: Creation of the WATCH Forcing Data and Its Use to Assess Global and Regional Reference Crop Evaporation over Land during the Twentieth Century, J. Hydrometeorol., 12, 823–848, https://doi.org/10.1175/2011jhm1369.1, 2011.
Weedon, G. P., Balsamo, G., Bellouin, N., Gomes, S., Best, M. J., and Viterbo, P.: Data methodology applied to ERA-Interim reanalysis data, Water Resour. Res., 50, 7505–7514, https://doi.org/10.1002/2014WR015638, 2014.
Wu, J., Albert, L. P., Lopes, A. P., Restrepo-Coupe, N., Hayek, M., Wiedemann, K. T., Guan, K., Stark, S. C., Christoffersen, B., Prohaska, N., Tavares, J. V., Marostica, S., Kobayashi, H., Ferreira, M. L., Campos, K. S., Da Silva, R., Brando, P. M., Dye, D. G., Huxman, T. E., Huete, A. R., Nelson, B. W., and Saleska, S. R.: Leaf development and demography explain photosynthetic seasonality in Amazon evergreen forests, Science, 351, 972–976, https://doi.org/10.1126/science.aad5068, 2016.
Wuyts, B., Champneys, A. R., and House, J. I.: Amazonian forest-savanna bistability and human impact, Nat. Commun., 8, 15519, https://doi.org/10.1038/ncomms15519, 2017.
Xiao, C. W., Yuste, J. C., Janssens, I. A., Roskams, P., Nachtergale, L., Carrara, A., Sanchez, B. Y., and Ceulemans, R.: Above- and belowground biomass and net primary production in a 73-year-old Scots pine forest, Tree Physiol., 23, 505–516, https://doi.org/10.1093/treephys/23.8.505, 2003.
Xiao, X., Hagen, S., Zhang, Q., Keller, M., and Moore, B.: Detecting leaf phenology of seasonally moist tropical forests in South America with multi-temporal MODIS images, Remote Sens. Environ., 103, 465–473, https://doi.org/10.1016/j.rse.2006.04.013, 2006.
Zemp, D. C., Schleussner, C. F., Barbosa, H. M. J., Hirota, M., Montade, V., Sampaio, G., Staal, A., Wang-Erlandsson, L., and Rammig, A.: Self-amplified Amazon forest loss due to vegetation-atmosphere feedbacks, Nat. Commun., 8, 14681, https://doi.org/10.1038/ncomms14681, 2017.