the Creative Commons Attribution 4.0 License.
the Creative Commons Attribution 4.0 License.
 | 12 Jul 2021
Reviews and syntheses: Ongoing and emerging opportunities to improve environmental science using observations from the Advanced Baseline Imager on the Geostationary Operational Environmental Satellites
Paul C. Stoy
James T. Douglas
Martha Anderson
George Diak
Jason A. Otkin
Christopher Hain
Elizabeth M. Rehbein
Joel McCorkel
Environmental science is increasingly reliant on remotely sensed observations of the Earth's surface and atmosphere. Observations from polar-orbiting satellites have long supported investigations on land cover change, ecosystem productivity, hydrology, climate, the impacts of disturbance, and more and are critical for extrapolating (upscaling) ground-based measurements to larger areas. However, the limited temporal frequency at which polar-orbiting satellites observe the Earth limits our understanding of rapidly evolving ecosystem processes, especially in areas with frequent cloud cover. Geostationary satellites have observed the Earth's surface and atmosphere at high temporal frequency for decades, and their imagers now have spectral resolutions in the visible and near-infrared regions that are comparable to commonly used polar-orbiting sensors like the Moderate Resolution Imaging Spectroradiometer (MODIS), Visible Infrared Imaging Radiometer Suite (VIIRS), or Landsat. These advances extend applications of geostationary Earth observations from weather monitoring to multiple disciplines in ecology and environmental science. We review a number of existing applications that use data from geostationary platforms and present upcoming opportunities for observing key ecosystem properties using high-frequency observations from the Advanced Baseline Imagers (ABI) on the Geostationary Operational Environmental Satellites (GOES), which routinely observe the Western Hemisphere every 5–15 min. Many of the existing applications in environmental science from ABI are focused on estimating land surface temperature, solar radiation, evapotranspiration, and biomass burning emissions along with detecting rapid drought development and wildfire. Ongoing work in estimating vegetation properties and phenology from other geostationary platforms demonstrates the potential to expand ABI observations to estimate vegetation greenness, moisture, and productivity at a high temporal frequency across the Western Hemisphere. Finally, we present emerging opportunities to address the relatively coarse resolution of ABI observations through multisensor fusion to resolve landscape heterogeneity and to leverage observations from ABI to study the carbon cycle and ecosystem function at unprecedented temporal frequency.


Modern environmental science would be unrecognizable without satellite remote sensing, which has revolutionized our field since its advent over a half-century ago (Kerr and Ostrovsky, 2003). The platforms by which we observe the Earth system are increasingly diverse and now include miniaturized satellites (CubeSats), sensors like the ECOsystem Spaceborne Thermal Radiometer Experiment on Space Station (ECOSTRESS) traveling on board the International Space Station (Hulley et al., 2017), and even lidar systems (Coyle et al., 2015; Qi et al., 2019), yet most environmental science applications employ polar-orbiting satellites, namely Landsat and the Moderate Resolution Imaging Spectroradiometer (MODIS). The Landsat and MODIS programs have radically improved the ability of ecologists to track vegetation change and its impacts on habitat, biogeochemical cycling, and other ecosystem services (De Araujo Barbosa et al., 2015). Like all remote sensing platforms, polar-orbiting satellites must make compromises with respect to spectral resolution, spatial scale, and temporal scale that limit their ability to measure all things, all the time. Notably, the 1 to 2 d cadence of MODIS and Visible Infrared Imaging Radiometer Suite (VIIRS) and 3 to 5 d cadence of the combined Landsat- and Sentinel-2-class sensors may be insufficient for tracking ecological phenomena that occur at shorter timescales, including the timing of rapid environmental change (White et al., 2009) and the diurnal behavior of land surface function, such as sub-hourly variations in ecosystem carbon and water fluxes (Chudnovsky et al., 2004; Grant et al., 2000).
As a part of the European Organisation for the Exploitation of Meteorological Satellites (EUMETSAT), the Satellite Application Facility for Land Surface Analysis (LSA SAF) has leveraged high frequency observations from the Spinning Enhanced Visible and Infrared Imager (SEVIRI) on board the Meteosat Second Generation (MSG) geostationary satellites to provide operational products relevant for studying vegetation, wildfires, the surface radiation budget, and the carbon and water cycle (Trigo et al., 2011) at sub-daily timescales. These opportunities are also available in the Western Hemisphere. Focusing on the Advanced Baseline Imager (ABI), a joint effort by the National Oceanic and Atmospheric Administration (NOAA) and the National Aeronautics and Space Association (NASA) on board the Geostationary Operational Environmental Satellites (GOES), we argue that the GOES constellation – commonly used as weather satellites – represents an underexplored opportunity for environmental science in situations where spatial resolution can be compromised in favor of more frequent imagery, especially now that ABI's spectral sensitivity has approached that of Landsat and MODIS (Table 1; Fig. 1). Given the constellation of geostationary satellites around the world, extending environmental science applications to ABI and generating relevant data products is crucial for achieving near-global coverage of satellite environmental data available at the timescale of minutes. Developing algorithms that can be applied to data from multiple geostationary satellites will be an important component for achieving near-global coverage.
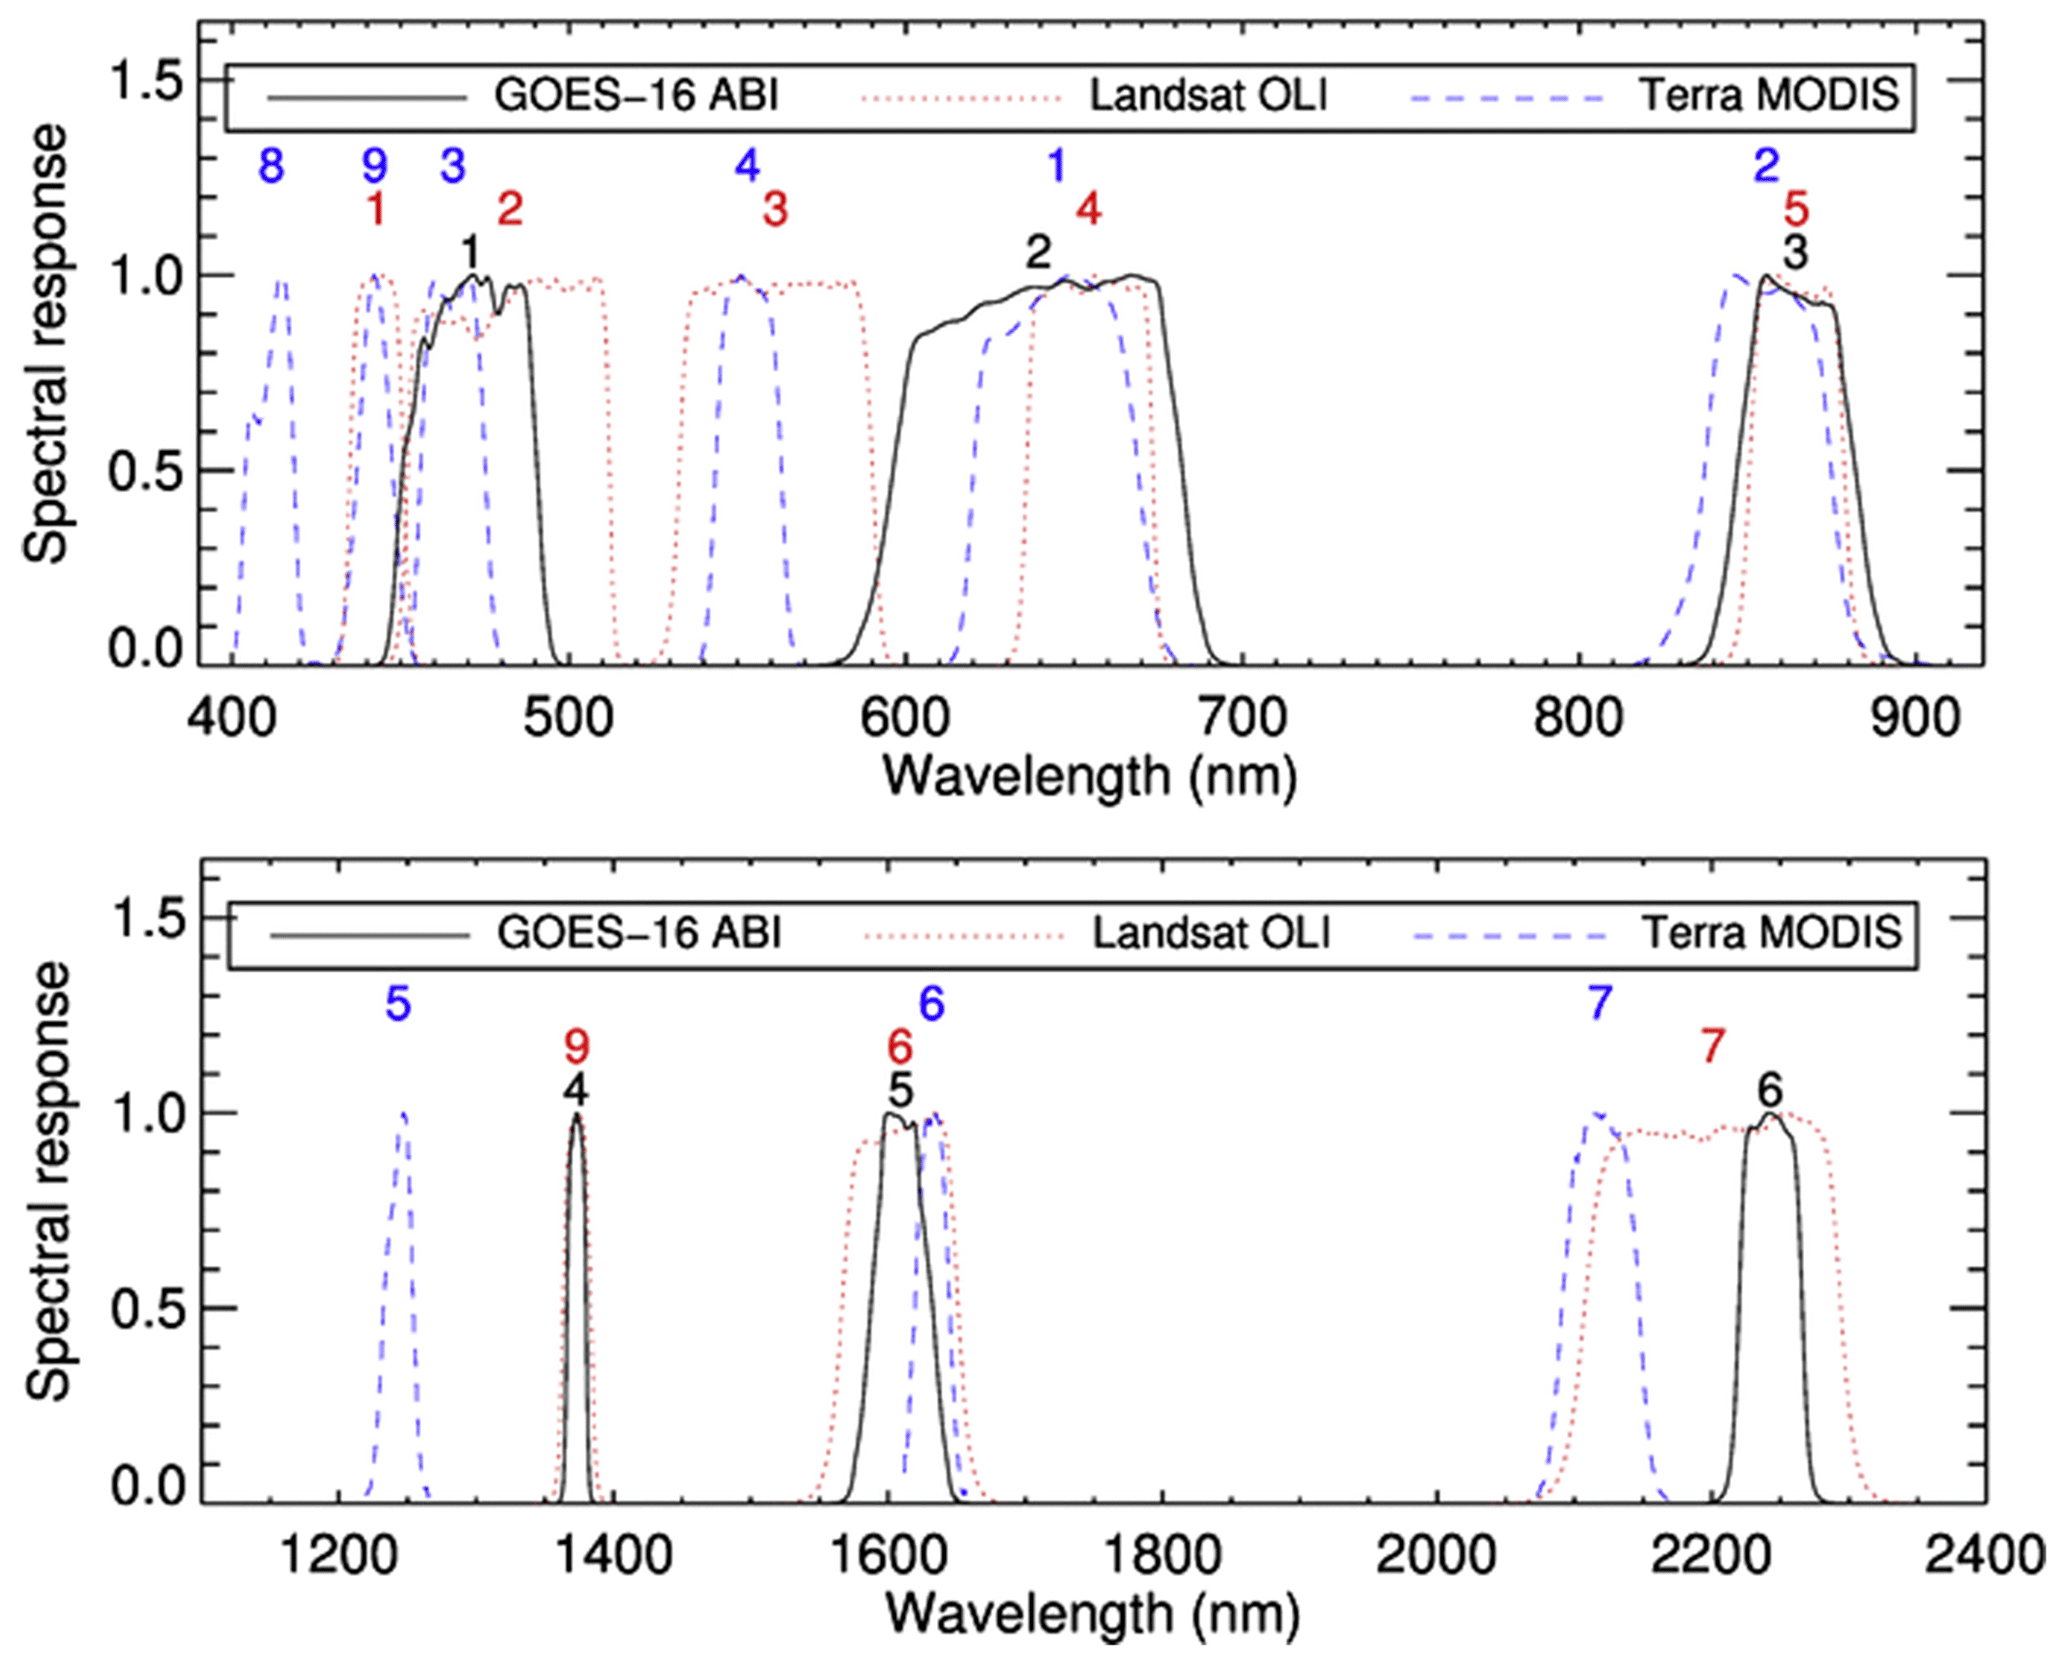
Figure 1A comparison of the spectral sensitivity of the Advanced Baseline Imager (ABI) with the Landsat Operational Land Imager (OLI) and MODIS Terra (McCorkel et al., 2020).
Here, we detail a number of applications by which GOES and other geostationary satellites have enhanced or could enhance our understanding of ecological phenomena that occur at timescales as short as minutes. We keep our focus on the GOES constellation, but we also discuss research and applications from various satellites in the global constellation of geostationary satellites to provide the larger context for emerging applications from GOES ABI. We outline the technical steps necessary to make imagery from ABI more useful for environmental science, with an eye toward near real-time monitoring of environmental phenomena across the globe. We also note complementarity between GOES and other geostationary platforms, including Japan's Himawari-, South Korea's GEO-KOMPSAT-2A, and European Union Meteosat satellites – especially the forthcoming third generation (Meteosat Third Generation, MTG) – all of which have similar spectral resolution that make near-global observation possible (Table 1). We first review the recent efforts regarding geolocation and atmospheric correction to produce surface reflectance from ABI and other geostationary imagers. We then describe new data products that can be created using state-of-the-art geostationary satellite data, with a brief description of existing data products that are providing key insight into Earth surface processes. Finally, we outline existing and emerging applications of observations from geostationary satellites that are ushering in the era of “hyper-temporal” remote sensing (Miura et al., 2019) for environmental science.
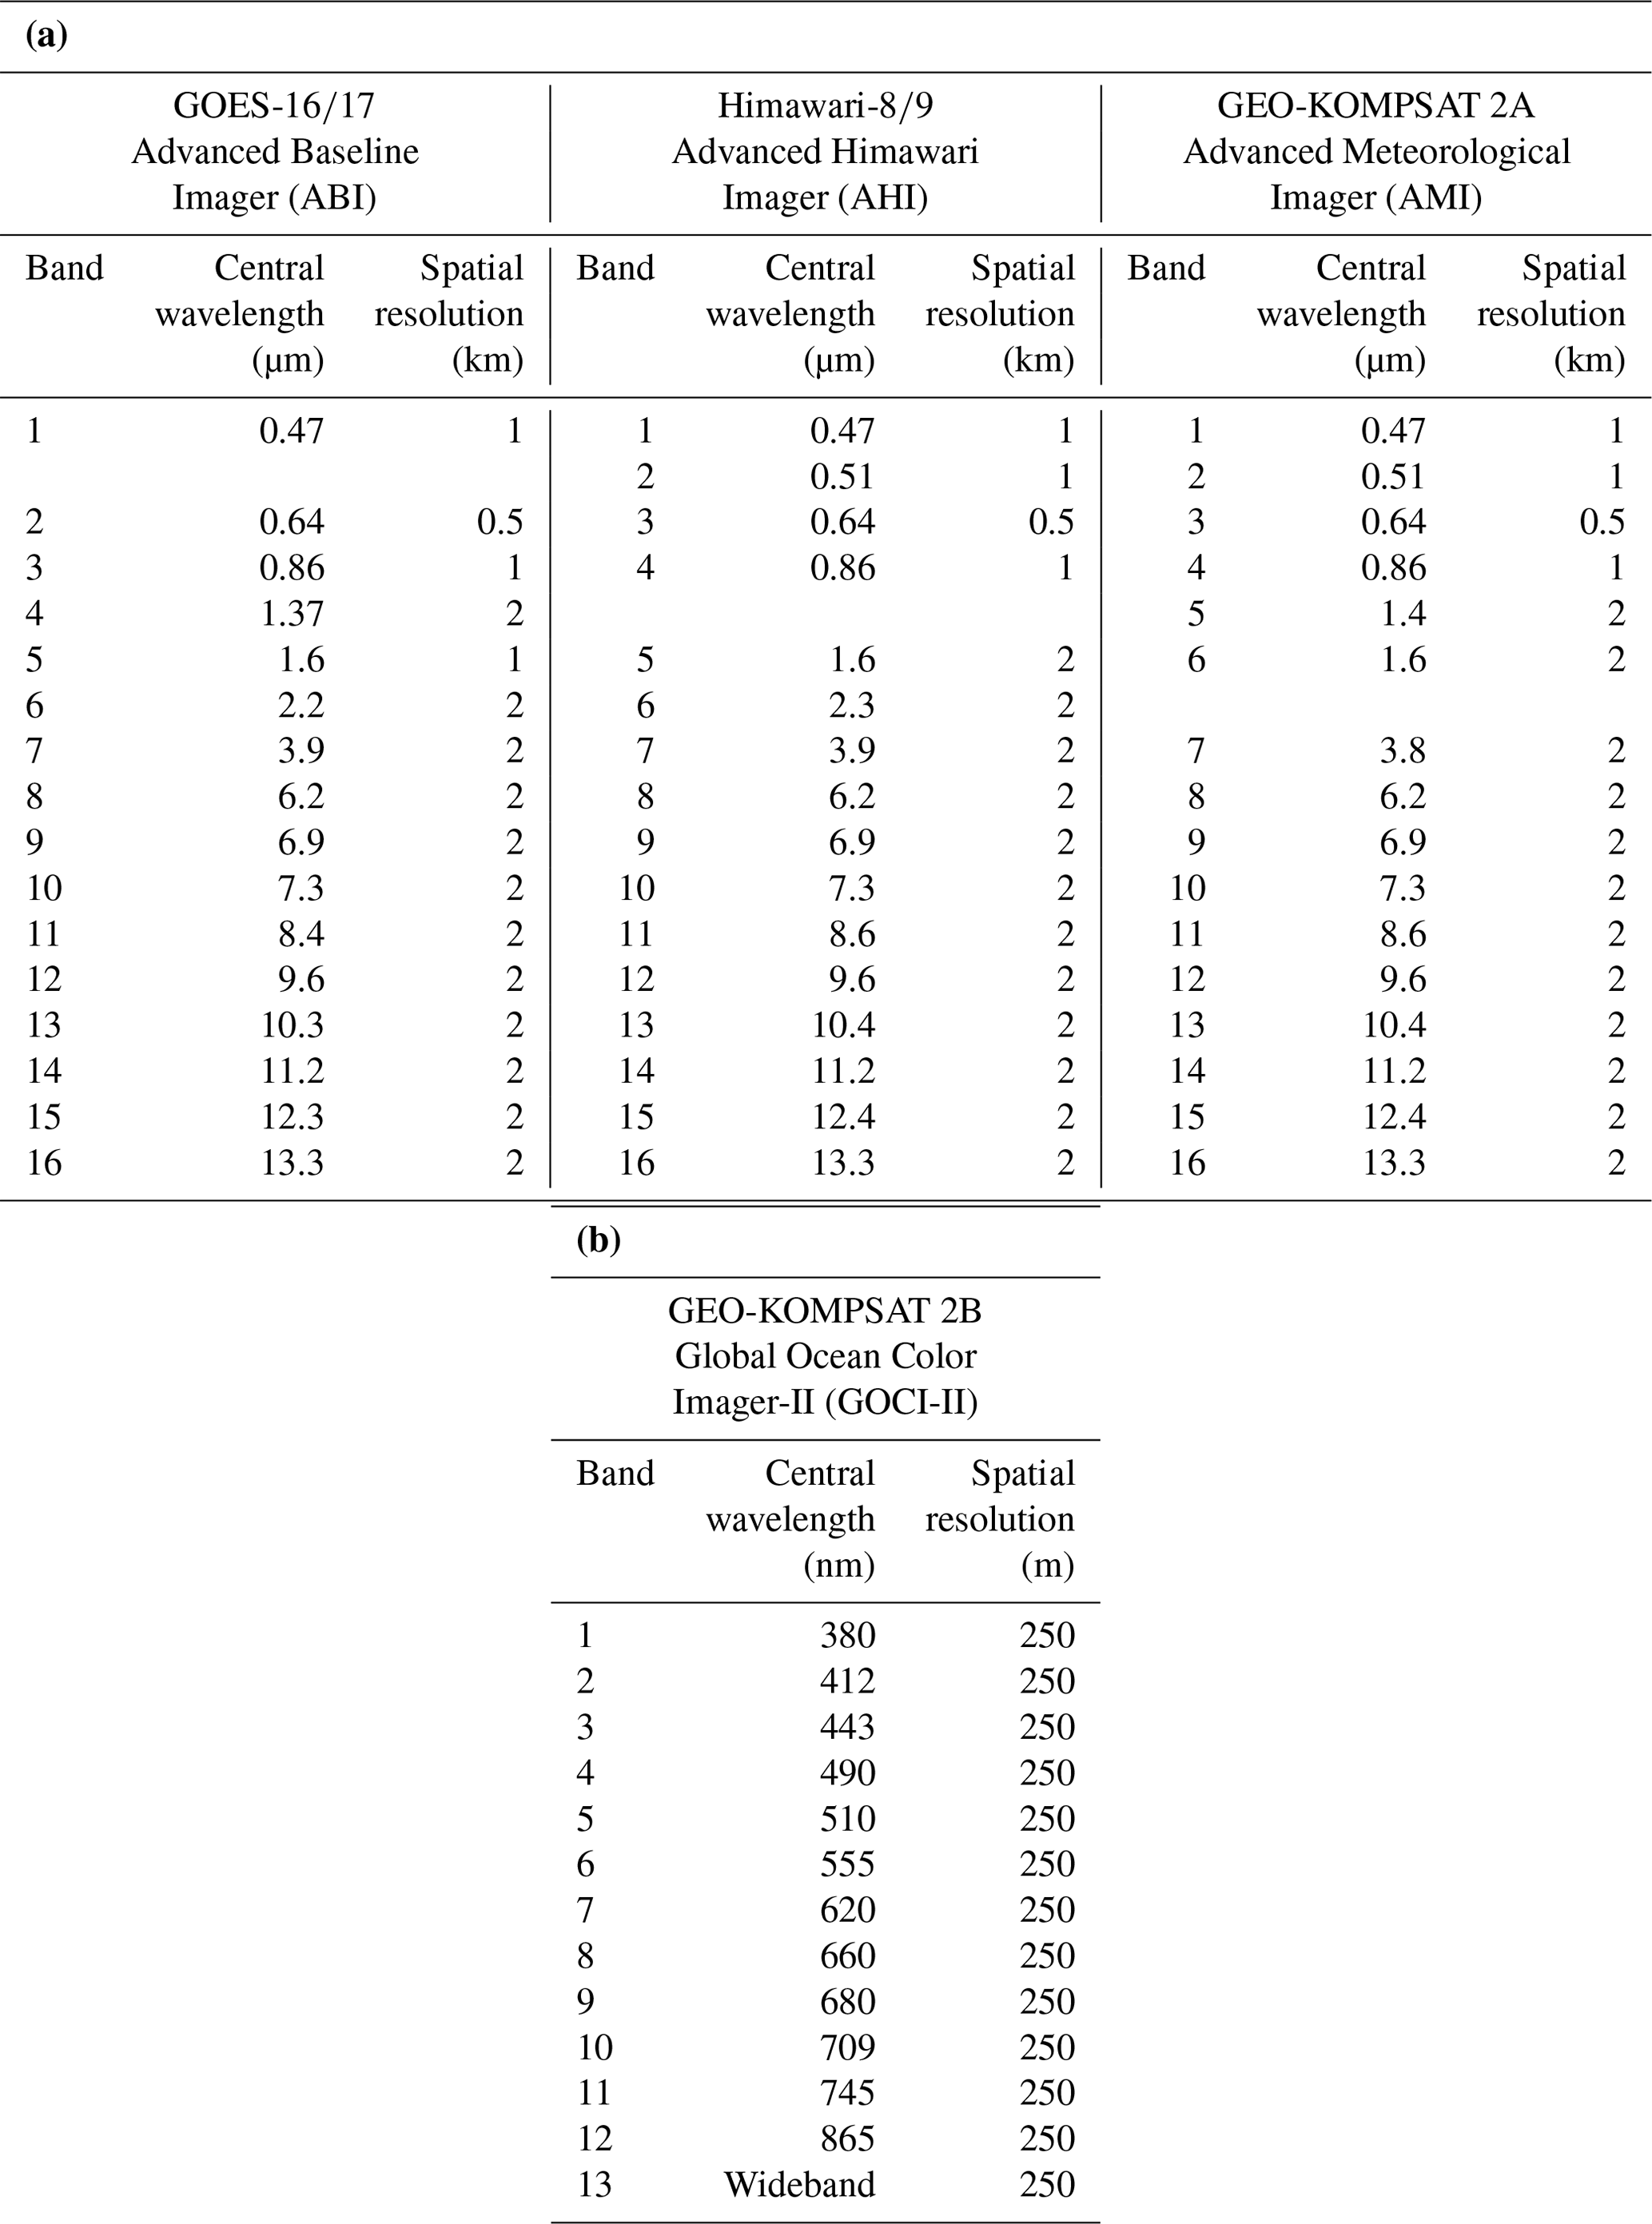
Table 1Instrument characteristics for the GOES-R Advanced Baseline Imager, Advanced Himawari Imager on Himawari-, and the Advanced Meteorological Imager on the Geostationary – Korea Multi-Purpose Satellite-2 (GEO-KOMPSAT-2A) (a) and the Global Ocean Color Imager-II (GOCI-II) on GEO-KOMPSAT-2B (b).
2.1 Geostationary satellites: past, present, and future
Geostationary remote sensing began with the launch of six Applications Technology Satellites (ATS), starting in 1966 (Suomi and Parent, 1968). The subsequent successful launches of the Synchronous Meteorological Satellites (SMSs) were the precursor to the GOES mission, which began in 1974 and continues to the present (Menzel, 2020). By 1979, the global constellation of geostationary satellites included the European Space Agency's Meteosat, the Japanese Geostationary Meteorological Satellite (GMS), and two GOES (Menzel, 2020). In total, 17 GOES have been successfully sent to space as of 2018, two of which – GOES-16, positioned at 75.2 W (currently GOES-East), and GOES-17, positioned at 137.2 W (currently GOES-West) – arise from the GOES-R series that include additional visible and near-IR channels that are commensurate with channels observed by Landsat and MODIS (Table 1; Fig. 1). The GOES-R series has an expected operational lifetime to 2036, which promises multiple years of continuous data availability. This will be followed by the Geostationary and Extended Orbits program, which is planned for operation in 2030–2050 and is anticipated to include “GOES-R-class” imagers (Sullivan et al., 2020).
2.2 Advanced Baseline Imager (ABI)
The ABI is the primary instrument on board GOES- and is designed for monitoring land and ocean surfaces, the atmosphere, and cloud formation (Schmit et al., 2017, 2018). The ABI has 16 spectral bands that measure solar reflected radiance in the visible and near-infrared wavelengths and emitted radiance at infrared wavelengths (Schmit and Gunshor, 2020). With multiple infrared bands positioned in atmospheric absorption regions and in atmospheric windows, the ABI can collect information from the Earth's surface and multiple levels in the atmosphere (Schmit and Gunshor, 2020). Multiple scan modes are used to provide near-hemispheric geographic coverage, with spatial resolutions between 0.5 and 2 km. The full disk scene consists of near-hemispheric coverage centered at the Equator and the longitude of the sensing satellite (DOC, NOAA, NESDIS, and NASA, 2019). The ABI also scans a scene of the contiguous United States (CONUS) and two mesoscale scenes (1000 km×1000 km). Operating in the flex mode, the ABI collected a full disk image every 15 min until April 2019 but now collects a full disk image every 10 min (with the exception of GOES-17 during parts of the year). The ABI also collects a CONUS scene every 5 min and two mesoscale scenes every minute in the flex mode (Schmit and Gunshor, 2020).
In late April 2018, an issue with the GOES 17 ABI cooling system was detected due to malfunctioning of the loop heat pipe which transfers heat from the ABI detectors and helps maintain adequate temperatures for proper functioning (Yu et al., 2019). This resulted in the loss of infrared data during some nighttime hours, around 13:30 UTC, during parts of the year due to the Sun heating the seven ABI detectors faster than they can be cooled, resulting in infrared emissions from the overheated detectors (NOAA and NASA, 2020; NOAA, 2020). This nighttime data loss can also fluctuate seasonally, depending on how much solar radiation the instrument absorbs (NOAA, 2020). A data quality flag in the metadata of the Level 1b Radiances and Level 2 Cloud and Moisture Imagery can identify the faulty nighttime data (NOAA and NASA, 2020). This malfunction will result in the loss of some nighttime data for data products that utilize the infrared bands and are relevant for observing the full diurnal cycle.
The ABI collects top-of-atmosphere (TOA) data from a given location at a constant view zenith angle (VZA) and varying solar zenith angles (SZA) throughout the day. While the increased sampling of SZA creates opportunities in surface bidirectional reflectance factor (BRF) modeling (Ma et al., 2020), the large VZA at off-nadir locations can present challenges for studying the land surface, including coarsened resolution, potentially degraded locational accuracy, and more complex atmospheric compensation due to longer slant paths. Below, we review the existing efforts to address these challenges and make ABI imagery more suitable for studying the land surface.
3.1 Geolocation
The geolocation accuracy of ABI on GOES-16 and GOES-17 has been tracked and improved throughout its provisional and operational stages using the Image Navigation and Registration (INR) Performance Assessment Tool Set (IPATS; Tan et al., 2018, 2019, 2020). IPATS quantifies the navigation error, i.e., the difference between the location of a pixel in ABI imagery and a reference location (Tan et al., 2020). Some of the largest navigation errors, calculated from correlations between subsets of ABI and Landsat 8 imagery concentrated along the coast of North and South America, were 10–13 µrad less than the mission requirement of 28 µrad (1 km at nadir) in October 2019 (Tan et al., 2020). In addition to IPATS, the Geostationary-NASA Earth Exchange (GeoNEX) processing chain adjusts the geolocation of ABI imagery using a reference map from the Shuttle Radar Topographic Mission (SRTM) digital elevation model (DEM) and more than 30 000 landmarks along coastlines (Wang et al., 2020). The shift in the geolocation of the red band (500 m at nadir) between IPATS and the GeoNEX algorithm was under 0.5 pixels for a majority of the time throughout the full disk scene but can be as large as 1–2 pixels for short periods of time (Wang et al., 2020).
3.2 Parallax
Geostationary satellites observe most of the hemisphere at an angle relative to the zenith, which introduces a challenge due to parallax, i.e., the effect of observing an object from a large VZA. Parallax can result in uncertainties in land surface observations in mountainous terrain and can introduce errors in the mapped location of clouds (Bieliński, 2020). These errors vary by VZA and the height of the feature and are largest for high VZA and high feature altitude relative to the surface (Bieliński, 2020; Zakšek et al., 2013). For example, the parallax shift at 49∘ latitude from GOES-16 ABI can be as large as 51 km for an object that is 15 km high (Whittaker, 2014). Since the mapped location of the clouds detected depends, in part, on the VZA, parallax shifts can also complicate comparing the location of clouds between sensors with different VZA (Zakšek et al., 2013). However, it is possible to correct for parallax shifts with knowledge of VZA and feature (cloud or surface) altitude (Kim et al., 2017; Yeom et al., 2020).
3.3 Atmospheric correction
3.3.1 Surface reflectance
Correcting for atmospheric attenuation of radiation to derive surface reflectance from TOA reflectance is a crucial prerequisite for studying surface processes from satellite platforms. Current efforts to estimate surface reflectance from the ABI, the Advanced Himawari Imager (AHI), and the Geostationary Ocean Color Imager (GOCI) on board the Communication, Ocean, and Meteorological Satellite (COMS) include generating lookup tables from the Second Simulation of the Satellite Signal in the Solar Spectrum (6S) radiative transfer model (He et al., 2019; Tian et al., 2010; Vermote et al., 1997; Yeom and Kim, 2015; Yeom et al., 2018, 2020). Optimal estimation methods that estimate surface BRF from SEVIRI have been extended to estimate surface broadband albedo and surface reflectance from the ABI and the AHI on Himawari-8 (Govaerts et al., 2010; He et al., 2019, 2012; Wagner et al., 2010). These algorithms estimate surface reflectance and broadband surface albedo by minimizing the difference between TOA BRF estimated through radiative transfer modeling and measured by the satellite (He et al., 2019, 2012). Unlike the surface reflectance algorithm currently used for SEVIRI, the algorithm for the ABI and the AHI takes the diurnal variation in aerosol optical depth into account (He et al., 2019). Originally developed for atmospheric correction of MODIS imagery, the Multi-Angle Implementation of Atmospheric Correction (MAIAC) has also been adapted to provide provisional daytime surface reflectance every 10 min for bands 1–6 of the AHI with plans to extend the algorithm to ABI (Li et al., 2019b). The surface reflectance from the AHI showed less variation compared to surface reflectance from MODIS and the differences in surface reflectance between the AHI and MODIS were smaller for the red, near-infrared (NIR), and shortwave infrared (SWIR) bands compared to the blue and green bands (Li et al., 2019b). ABI channels 1, 3, 5, and 6 are accurate to within 2 %, but channel 2 has a bias error of up to 5 % (McCorkel et al., 2020). With geolocation, parallax, atmospheric correction, and sensor accuracy taken into account, imagery from the ABI can provide sub-hourly estimates of various land surface variables.
3.3.2 Surface temperature
Atmospheric attenuation due to water vapor requires atmospheric correction of thermal data collected from satellites and also limits surface temperature retrieval to thermal bands that have the lowest atmospheric absorption (Sun and Pinker, 2003). A single-channel approach requires the use of one thermal channel within an atmospheric window at around 10 µm and radiative transfer modeling to simulate atmospheric transmittance and emission of longwave radiation (Li et al., 2013; Pinker et al., 2019). With known land surface emissivity and atmospheric profiles and simulated atmospheric transmittance/emission, surface temperature can be retrieved through the inversion of a radiative transfer equation that explains the different components of at-sensor radiance (Li et al., 2013). Since accurate atmospheric profiles over a study area can be difficult to obtain, a split-window technique can be used to correct atmospheric absorption to estimate surface temperature from at-sensor radiance in two thermal bands with differential water vapor absorption (Li et al., 2013; Ulivieri and Cannizzaro, 1985). Split-window techniques were used in earlier estimates of surface temperature from GOES thermal data, and they are based on the relationship between surface temperature and the difference in temperature between two adjacent thermal bands with high emissivity and low atmospheric absorption typically centered at 11 and 12 µm (Li et al., 2013; Sun and Pinker, 2003). The split-window techniques used to generate the GOES-R hourly land surface temperature (LST) product is discussed in Sect. 4.4, which further expands on surface temperature retrieval from GOES. In Sect. 4.4, we also discuss the importance of emissivity for estimating LST and current sources of emissivity estimates used in LST retrievals from geostationary satellites.
Similar to surface reflectances, the directional thermal radiation recorded by sensors on satellites can also be impacted by the VZA of the sensor (Diak and Whipple, 1995). Products that utilize diurnal thermal data from GOES have used the difference in surface radiometric temperature during the morning hours, which has shown to be less sensitive to changes in VZA compared to absolute surface radiometric temperature (Anderson et al., 1997; Diak and Whipple, 1995). Other methods that address the impacts of varying VZA include adding zenith angle correction terms to split-window algorithms in order to address the large path lengths at high VZA (Sun and Pinker, 2003; Yu et al., 2009).
Geostationary satellites can now measure a number of common vegetation indices used for ecological applications and make measurements that support derived products, including land surface temperature, as noted, incident solar radiation, and more. We describe these measurements with an eye toward explaining the benefits and challenges of using geostationary platforms such as the ABI for ecology and environmental science.
4.1 Incident solar radiation and photosynthetically active radiation (PAR)
Geostationary satellites are equipped to estimate incident solar radiation at the Earth's surface (Diak, 2017; Pinker et al., 2002), critical for the surface energy balance, photosynthesis, and solar power applications. Earlier efforts to do so include a simple physical model by Gautier et al. (1980), which estimated incident solar radiation during clear and cloudy conditions using the reflectance from the visible band of the Visible Infrared Spin-Scan Radiometer (VISSR) on GOES-2. The model included Rayleigh scattering and water vapor absorption of downwelling and reflected shortwave radiation. Cloud albedo and absorption were estimated from a linear relationship with the satellite-measured cloud reflectance, and estimates of incident solar radiation were subsequently improved by including ozone absorption of shortwave radiation in the atmosphere (Diak and Gautier, 1983; Diak, 2017). Continued improvements in both the physical model and the spatiotemporal resolution of the GOES imagery have resulted in higher accuracy of hourly and daily insolation estimates when compared to pyranometer measurements (Diak, 2017; Otkin et al., 2005). More recent models of the transmittance of direct and diffuse shortwave radiation through aerosol extinction by different aerosol components, gaseous absorption, and Rayleigh scattering have provided estimates of the surface shortwave radiation flux and its diffuse fraction from SEVIRI observations at 15 min resolution (Carrer et al., 2019) and could also be applied to ABI observations. Applying algorithms for estimating incident solar radiation to data from multiple geostationary satellites can lead to near-global coverage and be beneficial for near-global estimates of evapotranspiration and gross primary productivity that are driven, in part, by solar radiation.
Incident solar radiation in the wavelengths of photosynthetically active radiation (PAR; 400–700 nm) can also be estimated using the visible bands of geostationary satellites (Janjai and Wattan, 2011). Specifying a range of SZA, VZA, cloud types, aerosol types, cloud extinction coefficient, and atmospheric visibility, lookup tables generated from simulations of Moderate Resolution Atmospheric Transmission (MODTRAN) have been used to estimate downwelling PAR from at-sensor radiance (Zhang et al., 2014; Zheng et al., 2008). These methods have been extended to multiple geostationary satellites, including GOES-11 and GOES-12 and MODIS surface reflectance data, to generate global incident PAR estimates (Zhang et al., 2014).
Although these methods account for elevation, validation efforts have shown that satellite-derived PAR in high-altitude areas can be biased when compared to ground measurements, possibly due to the inaccurate specification of atmospheric profiles governing water vapor corrections (Zhang et al., 2014). Furthermore, PAR estimated from satellites has been reported to underestimate PAR measured on the ground when the model assumed urban aerosol absorption over areas where maritime aerosols were more dominant (Janjai and Wattan, 2011). Despite these limitations, frequent estimates of PAR and incident solar radiation from geostationary satellites may be uniquely suited to drive the land surface models that are operating at increasingly fine spatial and temporal resolutions, providing a natural link for using geostationary satellite observations to improve our understanding of the carbon, water, and energy cycles (Williams et al., 2009).
Terrestrial photosynthesis is particularly responsive to diffuse PAR, which penetrates plant canopies more efficiently than direct PAR (Emmel et al., 2020; Gu et al., 2003). The diffuse fraction of incoming PAR is well-described as a linear function of transmissivity, or a clearness index, through the atmosphere within certain inflection points (Erbs et al., 1982; Oliphant and Stoy, 2018; Weiss and Norman, 1985). Estimates of cloud height, optical depth, and particle size, along with aerosols from GOES, can be used to further partition incoming PAR into direct and diffuse beam fractions as currently provided by EUMETSAT at 15 min intervals (Carrer et al., 2019). Such observations could ultimately prove useful for analyses of the diurnal pattern of carbon cycling (see Sect. 6.1), given that the variability in terrestrial carbon cycling is often most sensitive to the variability in PAR at timescales from minutes to days (Stoy et al., 2005).
4.2 Vegetation greenness
The normalized difference vegetation index (NDVI) – the normalized difference between the reflectance in red and near-infrared wavelengths – is strongly correlated to chlorophyll content, green biomass, leaf area index (LAI), and the fraction of incoming PAR absorbed by leaves (fAPAR; Gamon et al., 1995; Jordan, 1969; Rouse et al., 1974; Running et al., 1986; Tucker, 1979; Tucker et al., 1985) and, therefore, is a critical variable for monitoring the land surface. The ABI also has the ability to measure the Enhanced Vegetation Index (EVI) which is beneficial in areas (and periods) of dense vegetation cover where, unlike NDVI, EVI does not saturate and in open canopy areas because of a correction factor applied for canopy background (Huete et al., 2002; Zhou et al., 2014). The near-infrared reflectance of vegetation (NIRv) is strongly correlated to the amount of incoming PAR absorbed by, plants and therefore, photosynthesis at half-hourly to annual timescales and has shown stronger relationships with photosynthesis compared to NDVI (Badgley et al., 2017, 2019; Baldocchi et al., 2020; Wu et al., 2020) and can also, in principle, be measured by GOES (Table 1).
LAI from SEVIRI is produced on a daily and 10 d basis through the LSA SAF program (Trigo et al., 2011). High temporal estimates of LAI from ABI will have widespread utility in the Western Hemisphere by providing an important variable needed for modeling seasonal vegetation dynamics and energy, water, and carbon fluxes (Anderson et al., 2011; Guan et al., 2014; Robinson et al., 2018). An ABI LAI product can provide harmony in temporal scales and data sources needed to estimate the fractional vegetation cover needed for a two-source energy balance model used for estimating evapotranspiration from GOES thermal data (further discussion in Sect. 5.1; Anderson et al., 2011). Similarly, the ABI LAI product can provide a data source for plant respiration modeling (see further discussion in Sect. 6.1; Robinson et al., 2018).
The increased temporal frequency of measurements available from geostationary satellites compared to polar-orbiting satellites provides more opportunities for measuring NDVI, EVI, LAI, and NIRv in areas with frequent cloud cover (Miura et al., 2019). However, the geostationary position captures reflected radiation at varying SZA throughout the day, and these novel Sun–sensor geometries, not previously captured by polar orbiting satellites, can cause diurnal variation in vegetation indices calculated from TOA reflectance (Tran et al., 2020). EVI shows less SZA-induced diurnal variation compared to NDVI and is less impacted by the midday hot spot effect during times of the year (spring and autumn equinox) when the SZA and AHI VZA are aligned (Tran et al., 2020). NDVI measurements can be normalized to a reference Sun–target–sensor geometry by estimating bidirectional reflectance distribution functions (BRDFs) to address the impacts of varying Sun–sensor geometry (Fensholt et al., 2006; Seong et al., 2020; Tian et al., 2010; Yeom and Kim, 2015; Yeom et al., 2018). Given the SZA sensitivity of NDVI measurements, Wheeler and Dietze (2019) demonstrated a Bayesian model to estimate a daily midday NDVI value from diurnal NDVI calculations using ABI observations.
4.3 Vegetation moisture
Liquid water absorption influences reflectance by plants in the atmospheric windows of shortwave infrared (SWIR) wavelengths (1.3–2.5 µm). Reflectance by plants in the SWIR has a negative relationship with leaf water content (Chen et al., 2005; Gao, 1996; Tucker, 1980), and multiple vegetation indices have been developed from bands in the SWIR wavelengths to capture these phenomena, especially in the 1.55–1.75 µm range (Fensholt and Sandholt, 2003; Tucker, 1980). Some notable vegetation indices that use SWIR wavelengths are the normalized difference infrared index (NDII) and the normalized difference water index (NDWI) which have been formulated from the difference in reflectance (ρ) in the NIR (0.76–0.9) and SWIR (1.55–2.5 µm) bands as (ρNIR–ρSWIR) (ρNIR + ρSWIR) (Chen et al., 2005; Fensholt and Sandholt, 2003; Gao, 1996; Hardisky et al., 1983; Tucker, 1980). NDII has been used to improve global estimates of canopy water content and has provided more realistic estimates of canopy water content in semiarid shrublands when compared to regression models without NDII (García-Haro et al., 2020). NDWI has been useful in estimating the water content of corn (maize) fields because it saturates at higher values than NDVI in response to changing vegetation water content during the growing season (Chen et al., 2005; Jackson et al., 2004). The shortwave infrared water stress indices derived from MODIS have stronger correlations with growing season soil moisture than NDVI in the semiarid grasses of northern Senegal, Africa (Fensholt and Sandholt, 2003). Many of these indices and their changes over time can now, in principle, be measured by geostationary satellites (Table 1).
The ABI, along with the Advanced Meteorological Imager (AMI) on GEO-KOMPSAT-2A, the AHI, and SEVIRI all offer bands in the SWIR regions, with ABI band 5 placed in the refined interval of 1.55–1.75 µm identified by Tucker (1980; Table 1). Atmospherically corrected surface reflectances from ABI, SEVIRI, AHI, and AMI can provide near-real-time and near-global coverage for vegetation water content. This remains a relatively unexplored opportunity given the potential benefits of near-real-time monitoring of vegetation status (Verger et al., 2014).
4.4 Land surface temperature
The ABI features three longwave infrared bands with spatial resolutions of about 2 km for measuring land surface temperature (LST) – the skin temperature of the uppermost layer of the land surface – including correction for atmospheric moisture (Yu et al., 2012). Since the emission from the land surface diverges from a blackbody, the knowledge of land surface emissivity is a crucial component for the retrieval of LST from at-sensor radiance (Li et al., 2013; Sun and Pinker, 2003). Global emissivity data may be gathered by consulting compiled tables of emissivities for various land covers along with land cover classifications of the landscape (Li et al., 2013). Land surface emissivity can also be estimated through its relationship with the NDVI. This method only applies to vegetation and soil and requires knowledge about the fractional cover of vegetation in a pixel (Li et al., 2013). Furthermore, land surface emissivities can be estimated by using surface temperature–emissivity separation techniques applied to multispectral thermal satellite observations (Li et al., 2013). Data sources for land surface emissivity in LST retrievals from geostationary satellites can include spectral libraries given a specific type of environmental surface (Peres and DaCamara, 2005), the MODIS operational land surface emissivity product (MOD11), or the Combined ASTER and MODIS Emissivity over Land (CAMEL) product (Pinker et al., 2019).
The hourly ABI LST product uses the difference between the brightness temperatures of ABI bands 14 (11.2 µm) and 15 (12.3 µm) in a split-window algorithm with an added term to correct for path length at high view zenith angles (Yu et al., 2009, 2012). These bands were chosen because they are placed in regions of maximum surface emission with low atmospheric absorption (Yu et al., 2009). However, water vapor absorption in a more moist atmosphere (e.g., a water vapor content greater than 2 g cm−2) at large view zenith angles (>45∘) remains an issue for the ABI LST algorithm (Yu et al., 2009).
For the generation of a consistent, long-term record of LST, a single channel approach has also been proposed for LST retrieval from GOES 12 channel 4 (10.7 µm) in order to develop an algorithm that can be applied to data from multiple GOES satellites, including for time periods from mid-2004–2017 when only one thermal channel was available (Pinker et al., 2019). Diurnal LST time series available from geostationary platforms have a wide range of applications in environmental monitoring, from mapping surface–atmosphere fluxes of heat, water, and carbon dioxide to tracking drought and fire dynamics. These and other applications are discussed further in the following sections.
5.1 Evapotranspiration, latent heat flux, and sensible heat flux
Diurnal observations from GOES provide multiple estimates of directional surface radiometric temperature and downwelling solar radiation each day to estimate water and energy fluxes from the soil and canopy (Diak and Stewart, 1989). One approach for estimating evapotranspiration (ET) that is well suited for geostationary implementation is the Atmosphere–Land Exchange Inverse (ALEXI) model (Anderson et al., 1997, 2007a; Mecikalski et al., 1999), which estimates the bulk surface energy balance (net radiation, sensible heat flux, latent heat flux, and soil heat flux) and the nominal partitioning of these fluxes between the soil and canopy. ALEXI is a time-integrated model based on the two-source (vegetation and soil) energy balance (TSEB) approach of Norman et al. (1995). ALEXI models the growth and sensible heating of the atmospheric boundary layer based on the morning rise in surface radiometric temperature that can be measured by GOES, estimating time-integrated latent heat flux (or ET, in units of mass flux) as a residual to the overall energy balance (Anderson et al., 1997). The model performs best when the insolation inputs are also derived from geostationary satellite data (Sect. 4.1), giving optimal spatial and temporal correspondence between net radiation forcings and surface temperature response signals. In comparison with other sources of insolation data, geostationary-based insolation could significantly improve ET retrievals, particularly in areas of frequent cloud cover where reanalysis estimates may not accurately capture the timing and spatial extents of clouds (Anderson et al., 2019; Wonsook et al., 2020).
ALEXI-based ET estimates are produced routinely at 4 km resolution for the United States (Anderson et al., 2020). Also, daily 2 km resolution ALEXI-based ET estimates have been generated from ABI observations as part of the GOES ET and Drought (GET-D) product system (Fang et al., 2019). A surface energy balance approach has also been used to estimate 30 min ET from albedo and downwelling radiation from MSG SEVIRI over the areas covered by MSG and 3 h ET in the Haihe River Basin in China from hourly LST observations from MTSAT (Multifunctional Transport Satellites), a Japanese geostationary satellite (Ghilain et al., 2011; Zhao et al., 2019). By measuring LST, geostationary satellites can estimate sensible heat flux and, therefore, also the Bowen ratio, which can give insight into atmospheric boundary layer heat and moisture transport, as well as plant water stress (Diak and Whipple, 1995). Applications of ALEXI-based ET and energy fluxes for drought monitoring and modeling carbon fluxes are discussed below.
5.2 Drought monitoring
Drought indicators based on remotely sensed thermal observations can improve the effectiveness of drought early warning systems due to their high spatial resolution and the tendency for large decreases in ET to precede visible reductions in vegetation biomass during early stages of drought development (Anderson et al., 2013a; Otkin et al., 2015). The Evaporative Stress Index (ESI; Anderson et al., 2013a) is a drought indicator based on standardized anomalies in the actual-to-reference ET ratio, where actual ET is retrieved with ALEXI using the morning LST rise signal, typically obtained from GOES. ESI has demonstrated the ability to provide early signals of developing vegetation stress (Anderson et al., 2007b, 2013a, 2016; Otkin et al., 2015, 2018a).
A recent prominent application of the ESI has been in the detection of flash droughts (Otkin et al., 2013). Flash drought conditions are characterized by a period of rapid drought intensification and typically include warm air temperature and low cloud cover anomalies, with dew point suppressions and high winds that can increase ET and hasten the removal of water from ecosystems (Gerken et al., 2018; Otkin et al., 2014, 2016, 2018b). ESI has proven to be an effective indicator of moisture stress in vegetation and the onset of flash drought conditions (Otkin et al., 2014, 2016, 2018b). For example, rapid temporal changes in the ESI toward increasing vegetation stress appeared several weeks earlier than the point at which the U.S. Drought Monitor (USDM) classified regions of the central United States to be experiencing moderate to exceptional drought in 2003 and 2012 (Otkin et al., 2014). The ESI was also able to capture the onset of vegetation stress and the subsequent vegetation recovery during the flash drought and flash recovery sequence of 2015 in the south central United States (Otkin et al., 2019).
Drought indices based on precipitation and atmospheric demand highlight areas with the potential for vegetation stress, but these stresses may not materialize due, for example, to beneficial rainfall, management (e.g., irrigation), or plant root access to groundwater. ESI uses LST to diagnose actual stress materializing on the ground and, therefore, has been used as a moisture stress indicator for estimating drought impacts on crop yields (Anderson et al., 2016; Mladenova et al., 2017). ESI is routinely generated at 4 km resolution over the CONUS, and 5 km globally, or can be downscaled to sub-field or stand scales (30 m) using higher resolution thermal data from Landsat (Yang et al., 2018, 2020). The ability of ESI to detect drought stress earlier than USDM and other indices is shown in Fig. 2 (adapted from Anderson et al., 2013b).
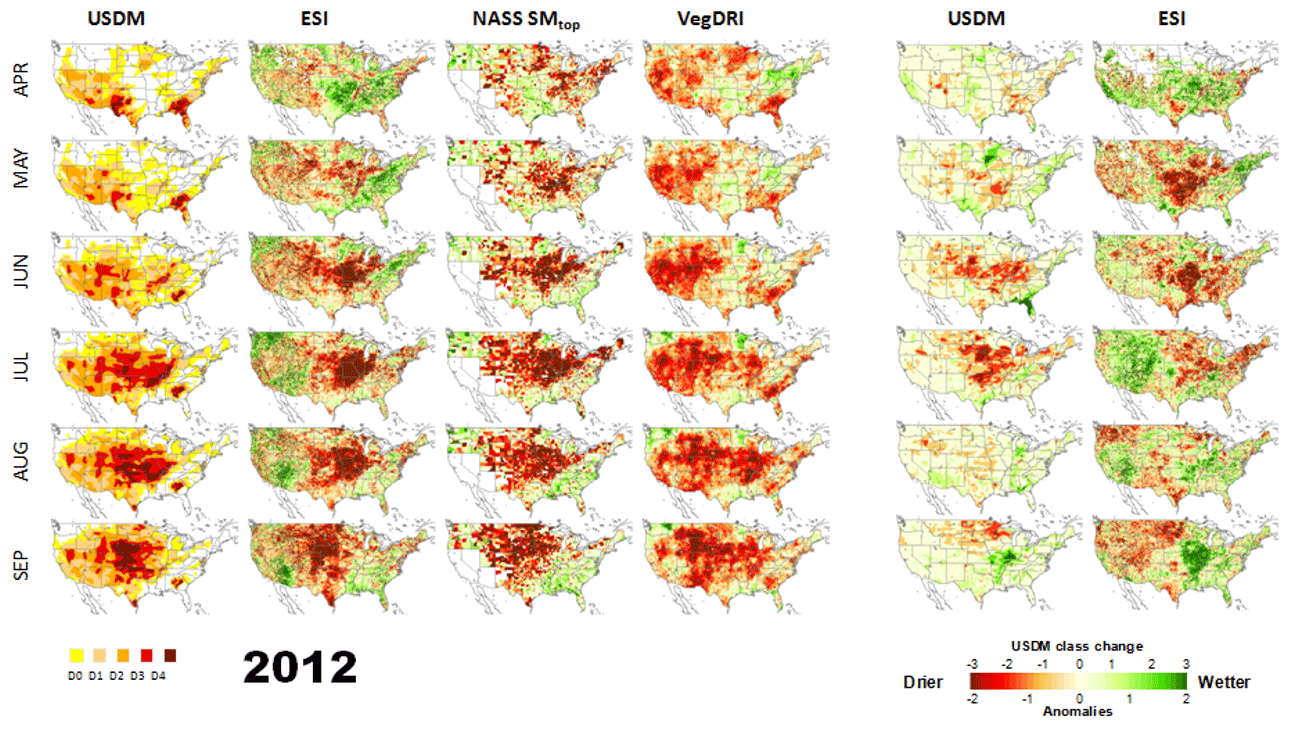
Figure 2Comparison of drought evolution between the U.S. Drought Monitor classification, the Evaporative Stress Index (ESI), and the Vegetation Drought Response Index (VegDRI). The figure is adapted from Anderson et al. (2013b) and distributed under a CC BY-NC-ND-3.0 license.
5.3 Wildfire detection and biomass burning emissions
The Automated Biomass Burning Algorithm (ABBA) was developed from the 4 and 11 µm bands of the GOES visible infrared spin-scan radiometer atmospheric sounder (VAS) to identify fire pixels (Prins and Menzel, 1994) based on the differential increases in emitted radiation, with increases in temperature between the two bands. The ABI fire algorithm has adapted ABBA to detect fires from differences in the brightness temperatures of the 3.9 and 11.2 µm bands and provides the location, sub-pixel size, temperature, and radiative power of fires (C. C. Schmidt et al., 2012; T. J. Schmit et al., 2015). Fire radiative power (FRP) is the rate at which radiation is emitted from a fire, and for a 600–1400 K temperature range, FRP is proportional to the difference between radiance in the middle infrared (MIR) at 3.9 µm and the regional background radiance in MIR (Schmidt et al., 2012; Wooster, 2003; Xu et al., 2010). Fire radiative energy (FRE) is the time-integrated FRP during the course of a fire. Emissions of trace gases and aerosols from biomass burning can be estimated using FRE, a biomass combustion rate, and an emission factor specific to land cover and emitted species (Zhang et al., 2012). The diurnal FRP cycles of various ecosystems have been estimated from GOES and from the fusion of FRP estimates from GOES and MODIS to provide biomass burning emissions at hourly, daily, and monthly scales (Li et al., 2019a; Zhang et al., 2012).
While GOES-R thermal observations can provide biomass burning emissions at a fine temporal scale, the coarse spatial resolution of GOES-R presents a challenge in detecting small sub-pixel fires and emissions. Differences between medium (20 m) and coarse resolution (500 m) imagery can result in substantial differences in total detected burned area, estimated emissions, and the length of the fire season (Ramo et al., 2021). Small fires can make up a great portion of total burned area and emissions, and they can result in a lengthening of the fire season in regions where anthropogenic fires are prevalent (Ramo et al., 2021). Similar to other coarse-spatial-scale emissions datasets, emissions from GOES-R should be considered conservative in areas with substantial undetected small fires (Ramo et al., 2021). Similar to Ramo et al. (2021), studies comparing biomass burning emissions from GOES-R with emissions from finer spatial resolution satellite imagery should reveal the magnitude of differences and trade-offs between high temporal and spatial resolution in estimating emissions.
5.4 Plant phenology
Plant canopies have unique and observable events that occur annually as a part of their phenology. The phenology of photosynthesis and plant growth is sensitive to temperature, precipitation, and photoperiod (Bauerle et al., 2012; Fu et al., 2017; Piao et al., 2019; P. C. Stoy et al., 2014), and shifts in the phenology of carbon uptake and plant growing season in response to changing climate have important implications for ecosystems (Bradley et al., 1999; Xu et al., 2020). These shifts often occur on timescales that cause uncertainty from polar-orbiting satellites, especially when cloudy conditions are present during spring in the temperate zone (Richardson et al., 2013) and dry-to-wet (and wet-to-dry) seasonal transitions in tropical forests (Ganguly et al., 2010). Research on land surface phenology to date has used a combination of satellite remote sensing and near-surface remote sensing via webcams to detect seasonal transitions in vegetation greenness and photosynthesis, such as the start, peak, and end of the growing season (Dannenberg et al., 2020; Gamon et al., 2016; Seyednasrollah et al., 2019; Wong et al., 2019; Zhang et al., 2003). These observations have varying spatial and temporal resolutions, depending on the method and instrumentation used (Brown et al., 2016; Filippa et al., 2018; Liu et al., 2017).
Geostationary satellites such as GOES have unique capabilities that could further enhance plant phenology research. Compared to polar-orbiting satellites, the large number of diurnal observations from geostationary satellites capture greater variation in sun-angle geometries. This increased variability allows for better BRDF adjustments and improved investigations about the impact of the SZA on the vegetation indices used for extracting phenological transitions (Ma et al., 2020). Time series of LAI, NDVI, and the two-band Enhanced Vegetation Index (EVI2) from SEVIRI, AHI, and GOCI show increased observations during cloudy conditions and improved estimates of phenological cycles and transitions (Guan et al., 2014; Miura et al., 2019; Yan et al., 2016; Yeom and Kim, 2015; Yeom et al., 2018). Figures of time series from various papers cited above demonstrate the value of geostationary imagers in capturing greenness trajectories as a complement to polar-orbiting satellites. NDVI from BRDF-adjusted reflectance from GOCI has demonstrated an improved ability to monitor the growth of rice paddies in North Korea and South Korea compared to MODIS NDVI from BRDF-adjusted reflectance, especially during the monsoon season which has frequent cloud cover that limits the ability of polar-orbiting sensors to observe the surface (Yeom et al., 2015, 2018). In the Congo Basin, the multiple annual phenological cycles of greenness in evergreen broadleaf forests were better captured by the increased observations from SEVIRI compared to MODIS (Yan et al., 2016). In Japan, the greenness trajectories from an EVI2 time series revealed differences in the length of seasonal transitions (timing between start of spring to end of spring) between AHI and MODIS (Yan et al., 2019).
GOES-R can also provide increased observations for the remote sensing of dryland phenology, which can include multiple growing cycles per year, and where phenological transitions can be triggered by pulses of rainfall and present an ongoing challenge for the remote sensing of land surface phenology (Smith et al., 2019). However, since drylands feature heterogeneous vegetation, studies will need to investigate whether increases in temporal resolution with coarse spatial resolution are enough to offer an improvement in dryland phenology (Smith et al., 2019). Leveraging diurnal observations from GOES to estimate greenness trajectories and phenological transitions (Hashimoto et al., 2021; Wheeler and Dietze, 2021) across the Western Hemisphere, coupled with the ability to extract these transitions from AHI, SEVIRI, and GOCI, can result in a near-global improvement in estimating seasonal vegetation growth and decline. The capacity of GOES to track events in plant phenology is shown in Figs. 3 and 4 for pixels within and outside of the Kincade fire scar, with notable increases in vegetation greenness and moisture during March and April at the end of the typical rainy season in California's Mediterranean ecosystems.
5.5 Ocean color
Geostationary satellites have been used for nearly a decade for monitoring the dynamics of ocean color. The ocean color signal can identify suspended particulate matter and phytoplankton (Neukermans et al., 2009; Ruddick et al., 2014), including harmful algal blooms (Choi et al., 2014; Noh et al., 2018), and may be a sentinel for the impacts of climate change on marine ecosystems (Dutkiewicz et al., 2019). Most research to date has involved the Geostationary Ocean Color Imager (GOCI), which has transmitted eight images per day since 2010 in six visible (412, 443, 490, 555, 660, and 680 nm) and two infrared channels (745 and 865 nm), with 20 nm bandwidth at 500 m spatial resolution centered around the Korean Peninsula at 128.2∘ E (Ahn et al., 2012; Choi et al., 2012; Ryu and Ishizaka, 2012; Ryu et al., 2012; Table 1). GOCI has been used to estimate ocean biogeochemical dynamics (Wang et al., 2013), including photosynthesis via chlorophyll-a absorption (Concha et al., 2019; Park et al., 2012) at diurnal timescales. Other geostationary sensors, including SEVIRI on the second generation of Meteosat (Schmetz et al., 2002) and (forthcoming) flexible combined imager (FCI) on the third generation of Meteosat (Ouaknine et al., 2013), are not designed explicitly for ocean color monitoring but have proven useful for monitoring marine suspended particulates and PAR attenuation in water (Neukermans et al., 2009; Ruddick et al., 2014), as has GOES (Jolliff et al., 2019). All of these sensors provide an important complement to ocean color monitoring from polar-orbiting satellites like MODIS-AQUA, Medium-Resolution Imaging Spectrometer (MERIS), and the Ocean Land Color Instrument (OLCI) on Sentinel-3 (Nieke et al., 2012; Peschoud et al., 2017). The persistent and consistent atmospheric characterization afforded by the geostationary sensors is critical for interpreting the relatively weak marine color signature (Ruddick et al., 2014).
6.1 Carbon cycle science
Estimates of surface–atmosphere carbon flux from polar-orbiting instruments like MODIS are usually produced on 8 d to annual time steps (Zhao et al., 2005). The impact of rapidly evolving meteorological conditions on terrestrial carbon uptake has gained recent attention, suggesting that more frequent observations will improve our understanding of the carbon cycle. Precipitation events and the resulting short-term changes in meteorological conditions on the order of days result in local anomalies in canopy photosynthesis and respiration that influence seasonal ecosystem exchange (Randazzo et al., 2020). Fluctuations in carbon uptake can result from upwind climate extremes through heat and moisture advection, revealing more complexity in how climate extremes impact ecosystem carbon fluxes (Schumacher et al., 2020). Smoke from large wildfires can result in a short-term decrease in incoming PAR but an increase in the diffuse fraction of incoming PAR which, under the right circumstances, can increase seasonal carbon uptake through changes in light-use efficiency (LUE; Hemes et al., 2020). The resulting daily anomalies in gross primary productivity (GPP) from sudden changes in limiting resources have been shown to disproportionately affect longer-term ecosystem carbon uptake (Kannenberg et al., 2020). Multiday positive anomalies in GPP are critical for explaining its interannual variation at ecosystem and global scales (Fu et al., 2019; Zscheischler et al., 2016). All of these recent findings point to the importance of more frequent observations of ecosystem carbon cycling to improve our understanding of global carbon cycling.
Now that geostationary satellite imagers, such as the ABI, measure similar spectral bands to MODIS (Fig. 1; Table 1), they can be used to monitor the carbon cycle in similar ways but at higher temporal frequency. Estimates of GPP often rely on LUE models, which are rooted in a linear relationship between absorbed PAR (APAR) and net primary production (Medlyn, 1998; Monteith, 1972). An ideal LUE in the absence of environmental stresses is specified and attenuated with the use of stress functions that describe the relationship between LUE and environmental stressors (Anderson et al., 2000; Mahadevan et al., 2008; Robinson et al., 2018; Running et al., 2004; Yuan et al., 2007; Zhang et al., 2016; Zhao et al., 2005). The most widely used environmental stressors include functions to describe temperature and moisture stress on LUE. Multiple approaches for estimating GPP from space exist based on the LUE approach, with differences arising from the spatiotemporal resolution of the inputs, the meteorological data used, incorporating the impacts of CO2 fertilization, environmental scalars used for adjusting LUE, and the treatment of LUE as a constant or specific to biome, plant functional type, or photosynthetic pathway (McCallum et al., 2009; Robinson et al., 2018; Sims et al., 2006; Xiao et al., 2019).
Vegetation indices calculated from GOES-R observations will provide spatiotemporal harmony with other GOES-R inputs, such as downwelling shortwave radiation, in estimating APAR. Various remotely sensed vegetation indices have been used for both estimating fAPAR to estimate APAR and in formulations of environmental stresses on LUE. The MODIS GPP algorithm uses NDVI and the MODIS fAPAR/LAI product to estimate APAR. The Vegetation Photosynthesis and Respiration Model (VPRM; Mahadevan et al., 2008) uses a similar approach and estimates the gross ecosystem exchange (GEE; similar to GPP) using the Enhanced Vegetation Index (EVI) instead of NDVI. The land surface water index (LSWI), the normalized difference between satellite-derived reflectance in near-infrared and shortwave infrared, is used to adjust LUE in response to water stress and leaf phenology (Mahadevan et al., 2008).

Figure 3Normalized difference vegetation index (NDVI) calculated using TOA reflectance factor from ABI on GOES-16 and Nadir Bidirectional Reflectance Distribution Function-Adjusted Reflectance (NBAR) from MODIS on the Terra and Aqua satellites for pixels inside and outside the Kincade fire (23 October 2019) perimeter in northern California for the period March 2019 to March 2020. The GOES Clear Sky Mask algorithm was applied to observations from GOES. MODIS NBAR with good quality flags were used. All observations are daytime, with a solar zenith angle of <70∘. The locations of the points inside and outside of the fire perimeter are displayed in Fig. 5.
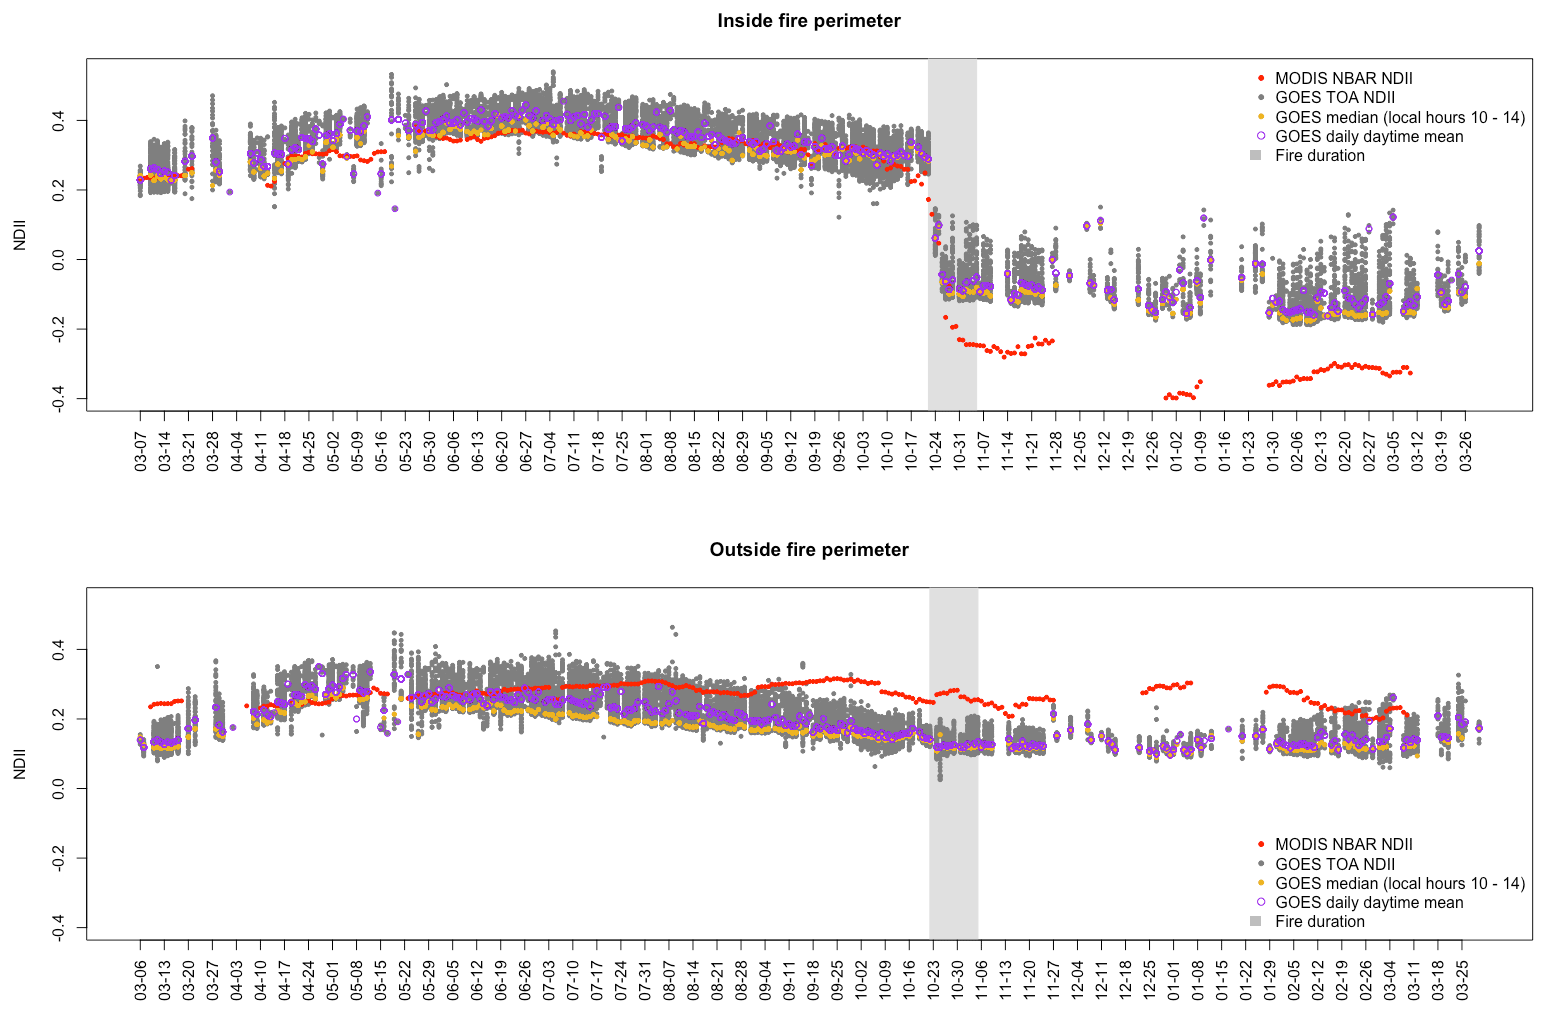
Figure 4NDII calculated using the TOA reflectance factor from ABI on GOES-16 and NBAR from MODIS on the Terra and Aqua satellites for pixels inside and outside the Kincade fire (23 October 2019) perimeter in northern California for the period March 2019 to March 2020. The GOES Clear Sky Mask algorithm was applied to observations from GOES. MODIS NBAR with good quality flags were used. All observations are daytime, with a solar zenith angle of <70∘. The locations of the points inside and outside of the fire perimeter are displayed in Fig. 5.
Implementing a model to estimate carbon uptake from ABI presents opportunities to improve LUE-based models by using emerging variables, as opposed to the commonly used air temperature and vapor pressure deficit, to represent environmental stressors on LUE such as soil moisture, diffuse radiation, LST, and the evaporative fraction (Anderson et al., 2000; Li et al., 2021; Yuan et al., 2007; Zhang et al., 2016). Ecosystem GPP increases with increases in diffuse radiation if light does not limit photosynthesis because diffuse radiation penetrates plant canopies more readily, resulting in a more even distribution of light among shaded and sunlit leaves (Hemes et al., 2020; Mercado et al., 2009). Incorporating the diffuse component of incoming PAR has been noted as a priority for improving LUE models (McCallum et al., 2009; Yuan et al., 2014). Recent attempts at incorporating diffuse radiation into LUE models as a stress on GPP have demonstrated an enhancement of LUE during overcast skies (Zhang et al., 2016). Fog events can be identified using GOES and increase both diffuse fraction of radiation and ecosystem water use efficiency (Baguskas et al., 2021). Partitioning estimates of PAR from ABI into diffuse and direct components, along with the ABI LST product and ALEXI-based estimates of sensible and latent heat flux, can provide harmony between inputs for environmental stressors on LUE, PAR, and vegetation indices by not having to rely on estimates from sources other than ABI. Furthermore, estimates of LAI from GOES can contribute to respiration modeling data needs for estimating net primary production (NPP) (Robinson et al., 2018).
Estimating GPP with ABI data can also benefit from various LUE model formulations that incorporate the coupling between carbon uptake and water loss through stomatal processes and water use efficiency (Anderson et al., 2000; Zhang et al., 2016). Estimates of APAR from ABI can be used in existing carbon–water coupled models through the ALEXI framework, which can estimate hourly fluxes which respond to diurnal variations in solar radiation and vapor pressure deficit (VPD) along with capturing the effect of soil moisture stress on LUE (Anderson et al., 2000). The ALEXI framework presents an opportunity to use both ABI thermal data, as previously mentioned in Sect. 5.1, and ABI reflectance data to estimate carbon, water, and energy fluxes simultaneously (Anderson et al., 2008). Diurnal estimates of carbon uptake and water loss from ABI will enhance our understanding of ecosystem water use efficiency and its response to environmental variation across geographic space. Furthermore, there are various opportunities to study the response of carbon fluxes estimated from ABI data to soil moisture variability with soil water content measured at various ground locations. This could be an important investigation considering the noted limitations of satellite GPP estimates in their ability to capture soil moisture effects on carbon uptake (Stocker et al., 2019). Observations from geostationary satellites could also, in principle, be used to assimilate instantaneous carbon flux observations from eddy covariance towers into ecosystem models (LeBauer et al., 2011).

Figure 5TOA NDVI calculated using the TOA reflectance factor from GOES-16 imagery for (a) day of the year (DOY) 295 (22 October 2019) at 21:00 UTC and (b) DOY 312 (8 November 2019) at 21:00 UTC, and their difference (c) for the Kincade fire perimeter in northern California (d) (23 October 2019; DOY 296). Gray pixels were identified as being cloudy from the GOES Clear Sky Mask algorithm. The points inside and outside of the fire perimeter correspond to the time series in Figs. 3 and 4.
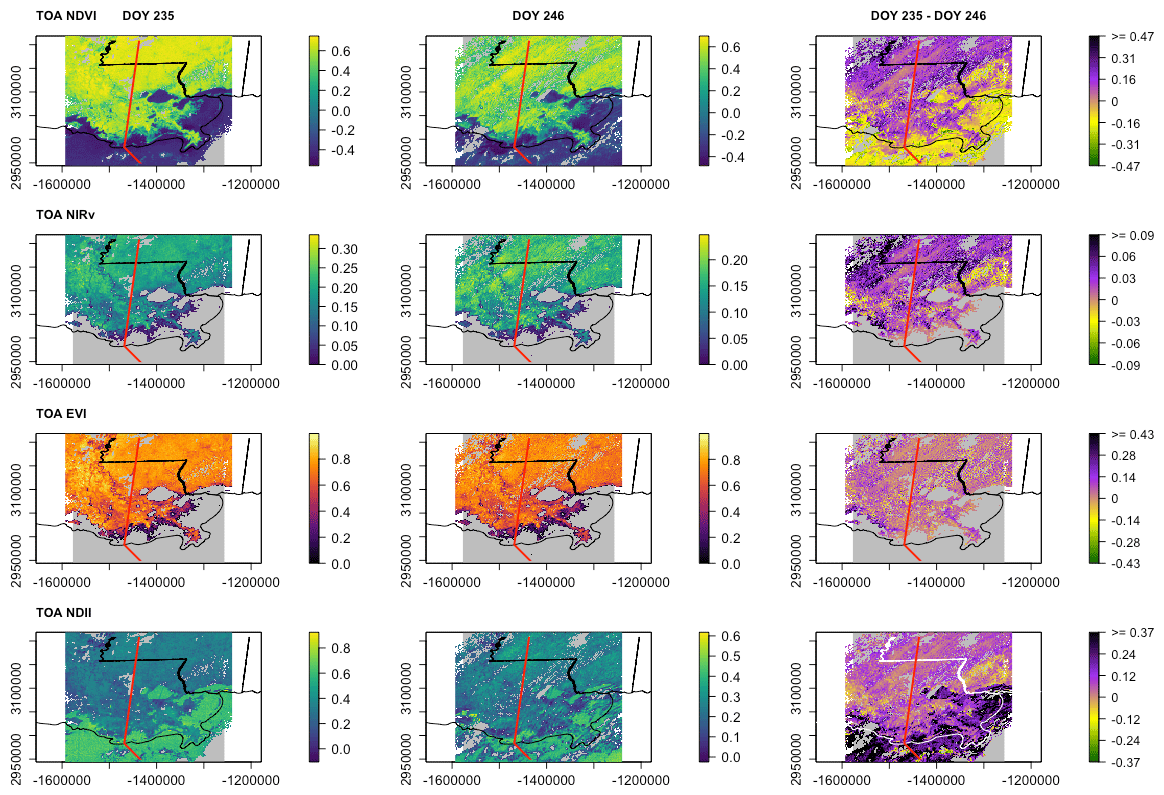
Figure 6TOA NDVI, near-infrared reflectance of vegetation (NIRv), Enhanced Vegetation Index (EVI), and NDII calculated using the TOA reflectance factors from GOES-16 imagery for DOY 235 (22 August 2020) at 16:00 UTC, DOY 246 (2 September 2019) at 16:00 UTC, and their difference around the advisory track for Hurricane Laura (red line) in southern Louisiana (26 August 2020; DOY 239). Gray pixels represent cloudy pixels from the GOES Clear Sky Mask algorithm or vegetation index values below 0 for NIRv and EVI.
6.2 Disturbance and recovery
Remotely sensed data have made it possible to map regional burn severity from wildfires, while time series of measures of greenness and primary productivity enable monitoring of vegetation disturbance and recovery (Bolton et al., 2017; Goetz et al., 2006; Meng et al., 2018). Mapping damage from hurricanes and the resulting impact to the carbon cycle has also been possible, using remotely sensed data, through the use of various vegetation indices related to greenness and moisture (Chambers et al., 2007; Wang et al., 2010). The difference in NDVI from pre- and post-fire imagery from GOES-16 shows the potential to detect variations in burn severity and recovery from wildfires, as demonstrated for the notable Kincade fire in 2019 in California (Fig. 5). High-frequency estimates of NDVI (Fig. 3) and NDII (Fig. 4) from GOES-16 can track vegetation disturbance and recovery from wildfire in a similar manner to MODIS, although the magnitude of the vegetation indices differs between the two due to the atmospheric corrections and BRDF adjustments of the MODIS TOA reflectance (Figs. 3 and 4). Variations in SZA and VZA can lead to differences in NDVI values between GOES, MODIS, and other sensors (Fensholt et al., 2006; Pinker and Ewing, 1985), with MODIS having the advantage of a low SZA during its overflight. These differences in viewing geometry need to be resolved to reconcile differences between sensors. Imagery from ABI also have the potential to estimate the regional decline in vegetation indices after hurricanes (Fig. 6), which can potentially be converted into the decline in GPP using methods described in Sect. 6.1. A recent review has also highlighted the use of geostationary imagers in monitoring landslides and flooding (Higuchi, 2021).
6.3 Ecosystem thermodynamics
Observations of the diurnal behavior of land surface attributes can also be used to improve our understanding of the thermal properties of ecosystems. Large-scale changes to ecosystems, such as logging, the conversion of grasslands or forests to farmland, and wildland fires alter the mechanisms by which ecosystems regulate their energy acquisition and heat exchange and are thought to be related to the degree of complexity of the system (Kay and Schneider, 1992). The process of ecological succession modifies the structure of an ecosystem over time by gradually increasing its complexity (Odum, 1969). Ecosystems should, therefore, develop an increasing ability to dissipate incoming solar radiation as succession proceeds (Schneider and Kay, 1994) and, due to a higher order of complex structures, will improve cooling by transferring solar radiation into latent heat and metabolic energy (Norris et al., 2011). Effective energy dissipation results in a cooler surface (with less waste heat) for biological processes to occur. Diurnal patterns of LST can be used to quantify ecological complexity (Lin et al., 2009) and entropy production (Brunsell et al., 2011; Holdaway et al., 2010; P. Stoy et al., 2014; Wiesner et al., 2019) and may be useful for monitoring the success of ecological restoration projects that seek to re-establish ecological function (Aerts et al., 2004).
6.4 Satellite data fusion products
One of the most promising applications of geostationary satellites for land surface science may simply be their ability to provide temporally dense observations that can be combined (fused) with spatially dense observations from polar-orbiting or other satellite platforms. Such fusion products take advantage of the best features of different platforms, for example, by exploiting the finer spatial resolution of observations from Landsat, Sentinel-2, MODIS, VIIRS, or the recently harmonized Landsat Sentinel-2 surface reflectance and the temporal resolution of GOES observations. Based on the assumption that changes in a Landsat pixel are equivalent or proportional to the changes in the co-located MODIS pixel between two dates, fusion algorithms are able to predict the surface reflectance of a Landsat pixel between acquisition dates using the change observed in MODIS pixels between the reference and prediction date (Gao et al., 2015). Multisensor fusion, using polar-orbiting and geostationary satellites, has provided higher spatiotemporal resolution for estimates of forest disturbance, NDVI, phenology, LST, and ET and water management, yield estimation, and fire radiative power (Cammalleri et al., 2013, 2014; Gao et al., 2015; Hilker et al., 2009; Knauer et al., 2016; Li et al., 2019a; Semmens et al., 2016; Wu et al., 2015; Yang et al., 2018; Zhao and Duan, 2020). Given the importance of considering landscape heterogeneity in using satellite data to estimate various ecosystem variables and model processes such as LUE, carbon flux and storage, phenology, and ET (Ahl et al., 2004; Cammalleri et al., 2014; Leitão et al., 2018; Zeng et al., 2020), multisensor data fusion offers a way to address the relatively coarse spatial scale of imagery from geostationary satellites as we expand their use in studying ecosystem function and surface–atmosphere exchange.
The recently increased spectral and spatial resolution of imagers on board geostationary satellites creates new opportunities to use remotely sensed observations in environmental science, especially when combined with ongoing and forthcoming improvements to the spectral sensitivity of other geostationary imagers. The increased diurnal sampling from the ABI can find cloud-free observations when polar-orbiting satellites may be hindered by cloud cover to improve time series of vegetation greenness, canopy water content, LST, and energy–water–carbon fluxes. Temporally dense geostationary observations have been crucial in detecting vegetation moisture stress and wildfires. Extending the use of these observations to measure more land surface variables can capture sudden changes in ecosystem fluxes due to changing atmospheric conditions and extreme events. Furthermore, estimations of vegetation phenological cycles can be improved using geostationary satellites, especially by taking advantage of short periods of clear skies occurring during times of otherwise persistent cloud cover. Studying ecosystem disturbance events should also benefit through increased availability of observations pre- and post-disturbance to estimate burned area and vegetation recovery. Multisensor fusion between relatively coarse geostationary satellite observations and observations from platforms with finer spatial resolution offers a way to resolve within-pixel spatial variability in heterogeneous landscapes.
The ongoing efforts to improve the geolocation and radiometric quality of imagery and to provide higher level collections of data with surface reflectance, similar to the MODIS or Landsat program, will be a crucial component of using imagery from geostationary sensors. Furthermore, increased collaboration between the National Science Foundation, NASA, and NOAA, with increased funding opportunities to pursue research utilizing imagery from geostationary sensors for investigations in the science topics we have detailed here, will help realize the potential of these data. Leveraging the high-frequency observations from geostationary sensors for investigations in environmental science where they have been largely untapped will expand the scope of hyper-temporal remote sensing of the environment.
The GOES-16 ABI Level 2 Cloud and Moisture Imagery (ABI-L2-MCMIPC) used to make the figures is available through https://registry.opendata.aws/noaa-goes/ (Schmit et al., 2012). The GOES-16 ABI Level 2 Clear Sky Mask (ABI-L2-ACMC) algorithm is available through NOAA's Comprehensive Large Array-data Stewardship System (CLASS) (Heidinger and Straka, 2012). The MODIS (Terra and Aqua) Nadir Bidirectional Reflectance Distribution Function-Adjusted Reflectance (NBAR) product (MCD43A4, Schaaf and Wang, 2015) was accessed thought the Level-1 Atmosphere Archive and Distribution System (LAADS) Distributed Active Archive Center (DAAC). The code for producing Figs. 3–6 is available at https://github.com/anmikhan/envirogoes.git.
AMK and PCS conceived the study, and all the authors contributed to writing the paper. AMK and PCS wrote Sects. 1 and 2.1. AMK wrote Sects. 2.2–5.4, 6.1–6.2, 6.4, and 7. PCS and GD contributed to Sect. 4.1. JAO, MA, and PCS contributed to Sects. 4.4–5.2. PCS wrote Sect. 5.5. JM and CH contributed to Sects. 1, 2, 3, and 7. PCS and EMR wrote Sect. 6.3. JTD contributed to Sect. 5.4. All the authors provided suggestions and edits. AMK made all the edits. AMK prepared Figs. 3–6 and Table 1.
The authors declare that they have no conflict of interest.
Publisher's note: Copernicus Publications remains neutral with regard to jurisdictional claims in published maps and institutional affiliations.
We thank Timothy J. Schmit and Scott Lindstrom, for the critical insight into the GOES mission, for the assistance with the data acquisition, and for the valuable comments on the paper. We also thank David Wood and Susi Wiesner, for the valuable comments on the paper.
Paul C. Stoy acknowledges contributions from the U.S. National Science Foundation and the University of Wisconsin – Madison.
This research has been supported by the National Science Foundation (grant nos. DEB 1552976 and EF 1702029).
This paper was edited by Alexandra Konings and reviewed by two anonymous referees.
Aerts, R., Wagendorp, T., November, E., Behailu, M., Deckers, J., and Muys, B.: Ecosystem thermal buffer capacity as an indicator of the restoration status of protected areas in the northern ethiopian highlands, Restor. Ecol., 12, 586–596, https://doi.org/10.1111/j.1061-2971.2004.00324.x, 2004.
Ahl, D. E., Gower, S. T., Mackay, D. S., Burrows, S. N., Norman, J. M., and Diak, G. R.: Heterogeneity of light use efficiency in a northern Wisconsin forest: implications for modeling net primary production with remote sensing, Remote Sens. Environ., 93, 168–178, https://doi.org/10.1016/j.rse.2004.07.003, 2004.
Ahn, J.-H., Park, Y.-J., Ryu, J.-H., Lee, B., and Oh, I. S.: Development of atmospheric correction algorithm for Geostationary Ocean Color Imager (GOCI), Ocean Sci. J., 47, 247–259, https://doi.org/10.1007/s12601-012-0026-2, 2012.
Anderson, M., Norman, J. M., Diak, G. R., Kustas, W. P., and Mecikalski, J. R.: A Two-Source Time-Integrated Model for Estimating Surface Fluxes Using Thermal Infrared Remote Sensing, Remote Sens. Environ., 60, 195–216, https://doi.org/10.1016/S0034-4257(96)00215-5, 1997.
Anderson, M., Norman, J., Kustas, W., Houborg, R., Starks, P., and Agam, N.: A thermal-based remote sensing technique for routine mapping of land-surface carbon, water and energy fluxes from field to regional scales, Remote Sens. Environ., 112, 4227–4241, https://doi.org/10.1016/j.rse.2008.07.009, 2008.
Anderson, M., Diak, G., Gao, F., Knipper, K., Hain, C., Eichelmann, E., Hemes, K., Baldocchi, D., Kustas, W., and Yang, Y.: Impact of Insolation Data Source on Remote Sensing Retrievals of Evapotranspiration over the California Delta, Remote Sens., 11, 216, https://doi.org/10.3390/rs11030216, 2019.
Anderson, M. C., Norman, J. M., Meyers, T. P., and Diak, G. R.: An analytical model for estimating canopy transpiration and carbon assimilation fluxes based on canopy light-use efficiency, Agr. Forest Meteorol., 101, 265–289, https://doi.org/10.1016/S0168-1923(99)00170-7, 2000.
Anderson, M. C., Norman, J. M., Mecikalski, J. R., Otkin, J. A., and Kustas, W. P.: A climatological study of evapotranspiration and moisture stress across the continental United States based on thermal remote sensing: 1. Model formulation, J. Geophys. Res., 112, D10117, https://doi.org/10.1029/2006JD007506, 2007a.
Anderson, M. C., Norman, J. M., Mecikalski, J. R., Otkin, J. A., and Kustas, W. P.: A climatological study of evapotranspiration and moisture stress across the continental United States based on thermal remote sensing: 2. Surface moisture climatology, J. Geophys. Res., 112, D11112, https://doi.org/10.1029/2006JD007507, 2007b.
Anderson, M. C., Kustas, W. P., Norman, J. M., Hain, C. R., Mecikalski, J. R., Schultz, L., González-Dugo, M. P., Cammalleri, C., d'Urso, G., Pimstein, A., and Gao, F.: Mapping daily evapotranspiration at field to continental scales using geostationary and polar orbiting satellite imagery, Hydrol. Earth Syst. Sci., 15, 223–239, https://doi.org/10.5194/hess-15-223-2011, 2011.
Anderson, M. C., Hain, C., Otkin, J., Zhan, X., Mo, K., Svoboda, M., Wardlow, B., and Pimstein, A.: An Intercomparison of Drought Indicators Based on Thermal Remote Sensing and NLDAS-2 Simulations with U.S. Drought Monitor Classifications, J. Hydrometeor., 14, 1035–1056, https://doi.org/10.1175/JHM-D-12-0140.1, 2013a.
Anderson, M. C., Cammalleri, C., Hain, C. R., Otkin, J., Zhan, X., and Kustas, W.: Using a Diagnostic Soil-Plant-Atmosphere Model for Monitoring Drought at Field to Continental Scales, Procedia Environ. Sci., 19, 47–56, https://doi.org/10.1016/j.proenv.2013.06.006, 2013b.
Anderson, M. C., Zolin, C., Sentelhas, P., Hain, C., Semmens, K., Yilmaz, M. T., Gao, F., Otkin, J., and Tetrault, R.: Assessing correlations of satellite-derived evapotranspiration, precipitation and leaf area index anomalies with yields of major Brazilian crop, Remote Sens. Environ., 174, 82–99, 2016.
Anderson, M. C., Yang, Y., Xue, J., Knipper, K. R., Yang, Y., Gao, F., Hain, C. R., Kustas, W. P., Cawse-Nicholson, K., Hulley, G., Fisher, J. B., Alfieri, J. G., Meyers, T. P., Prueger, J., Baldocchi, D. D., and Rey-Sanchez, C.: Interoperability of ECOSTRESS and Landsat for mapping evapotranspiration time series at sub-field scales, Remote Sens. Environ., 252, 112189, https://doi.org/10.1016/j.rse.2020.112189, 2020.
Badgley, G., Field, C. B., and Berry, J. A.: Canopy near-infrared reflectance and terrestrial photosynthesis, Sci. Adv., 3, e1602244, https://doi.org/10.1126/sciadv.1602244, 2017.
Badgley, G., Anderegg, L. D. L., Berry, J. A., and Field, C. B.: Terrestrial gross primary production: Using NIRV to scale from site to globe, Glob. Change Biol., 25, 3731–3740, https://doi.org/10.1111/gcb.14729, 2019.
Baguskas, S. A., Oliphant, A. J., Clemesha, R. E. S., and Loik, M. E.: Water and light-use efficiency are enhanced under summer coastal fog in a California agricultural system, J. Geophys. Res.-Biogeo., 126, e2020JG006193, https://doi.org/10.1029/2020JG006193, 2021.
Baldocchi, D. D., Ryu, Y., Dechant, B., Eichelmann, E., Hemes, K., Ma, S., Sanchez, C. R., Shortt, R., Szutu, D., Valach, A., Verfaillie, J., Badgley, G., Zeng, Y., and Berry, J. A.: Outgoing near-infrared radiation from vegetation scales with canopy photosynthesis across a spectrum of function, structure, physiological capacity, and weather, J. Geophys. Res.-Biogeo., 125, e2019JG005534, https://doi.org/10.1029/2019JG005534, 2020.
Bauerle, W. L., Oren, R., Way, D. A., Qian, S. S., Stoy, P. C., Thornton, P. E., Bowden, J. D., Hoffman, F. M., and Reynolds, R. F.: Photoperiodic regulation of the seasonal pattern of photosynthetic capacity and the implications for carbon cycling, P. Natl. Acad. Sci. USA, 109, 8612–8617, https://doi.org/10.1073/pnas.1119131109, 2012.
Bieliński, T.: A parallax shift effect correction based on cloud height for geostationary satellites and radar observations, Remote Sens., 12, 365, https://doi.org/10.3390/rs12030365, 2020.
Bolton, D. K., Coops, N. C., Hermosilla, T., Wulder, M. A., and White, J. C.: Assessing variability in post-fire forest structure along gradients of productivity in the Canadian boreal using multi-source remote sensing, J. Biogeogr., 44, 1294–1305, https://doi.org/10.1111/jbi.12947, 2017.
Bradley, N. L., Leopold, A. C., Ross, J., and Huffaker, W.: Phenological changes reflect climate change in Wisconsin, P. Natl. Acad. Sci. USA, 96, 9701–9704, https://doi.org/10.1073/pnas.96.17.9701, 1999.
Brown, T. B., Hultine, K. R., Steltzer, H., Denny, E. G., Denslow, M. W., Granados, J., Henderson, S., Moore, D., Nagai, S., SanClements, M., Sánchez-Azofeifa, A., Sonnentag, O., Tazik, D., and Richardson, A. D.: Using phenocams to monitor our changing Earth: toward a global phenocam network, Front. Ecol. Environ., 14, 84–93, https://doi.org/10.1002/fee.1222, 2016.
Brunsell, N. A., Schymanski, S. J., and Kleidon, A.: Quantifying the thermodynamic entropy budget of the land surface: is this useful?, Earth Syst. Dynam., 2, 87–103, https://doi.org/10.5194/esd-2-87-2011, 2011.
Cammalleri, C., Anderson, M. C., Gao, F., Hain, C. R., and Kustas, W. P.: A data fusion approach for mapping daily evapotranspiration at field scale, Water Resour. Res., 49, 4672–4686, https://doi.org/10.1002/wrcr.20349, 2013.
Cammalleri, C., Anderson, M. C., Gao, F., Hain, C. R., and Kustas, W. P.: Mapping daily evapotranspiration at field scales over rainfed and irrigated agricultural areas using remote sensing data fusion, Agr. Forest Meteorol., 186, 1–11, https://doi.org/10.1016/j.agrformet.2013.11.001, 2014.
Carrer, D., Ceamanos, X., Moparthy, S., Vincent, C., C. Freitas, S., and Trigo, I. F.: Satellite Retrieval of Downwelling Shortwave Surface Flux and Diffuse Fraction under All Sky Conditions in the Framework of the LSA SAF Program (Part 1: Methodology), Remote Sens., 11, 2532, https://doi.org/10.3390/rs11212532, 2019.
Chambers, J. Q., Fisher, J. I., Zeng, H., Chapman, E. L., Baker, D. B., and Hurtt, G. C.: Hurricane Katrina's carbon footprint on U.S. Gulf Coast forests, Science, 318, 1107, https://doi.org/10.1126/science.1148913, 2007.
Chen, D., Huang, J., and Jackson, T. J.: Vegetation water content estimation for corn and soybeans using spectral indices derived from MODIS near- and short-wave infrared bands, Remote Sens. Environ., 98, 225–236, https://doi.org/10.1016/j.rse.2005.07.008, 2005.
Choi, J.-K., Park, Y. J., Ahn, J. H., Lim, H.-S., Eom, J., and Ryu, J.-H.: GOCI, the world's first geostationary ocean color observation satellite, for the monitoring of temporal variability in coastal water turbidity, J. Geophys. Res., 117, C09004, https://doi.org/10.1029/2012JC008046, 2012.
Choi, J.-K., Min, J.-E., Noh, J. H., Han, T.-H., Yoon, S., Park, Y. J., Moon, J.-E., Ahn, J.-H., Ahn, S. M., and Park, J.-H.: Harmful algal bloom (HAB) in the East Sea identified by the Geostationary Ocean Color Imager (GOCI), Harmful Algae, 39, 295–302, https://doi.org/10.1016/j.hal.2014.08.010, 2014.
Chudnovsky, A., Ben-Dor, E., and Saaroni, H.: Diurnal thermal behavior of selected urban objects using remote sensing measurements, Energ. Build., 36, 1063–1074, https://doi.org/10.1016/j.enbuild.2004.01.052, 2004.
Concha, J., Mannino, A., Franz, B., and Kim, W.: Uncertainties in the Geostationary Ocean Color Imager (GOCI) Remote Sensing Reflectance for Assessing Diurnal Variability of Biogeochemical Processes, Remote Sens., 11, 295, https://doi.org/10.3390/rs11030295, 2019.
Coyle, D. B., Stysley, P. R., Poulios, D., Clarke, G. B., and Kay, R. B.: Laser transmitter development for NASA's Global Ecosystem Dynamics Investigation (GEDI) lidar, in: Lidar Remote Sensing for Environmental Monitoring XV, Vol. 9612, edited by: Singh, U. N., SPIE, 961208, https://doi.org/10.1117/12.2191569, 2015.
Dannenberg, M., Wang, X., Yan, D., and Smith, W.: Phenological characteristics of global ecosystems based on optical, fluorescence, and microwave remote sensing, Remote Sens., 12, 671, https://doi.org/10.3390/rs12040671, 2020.
De Araujo Barbosa, C. C., Atkinson, P. M., and Dearing, J. A.: Remote sensing of ecosystem services: A systematic review, Ecol. Ind., 52, 430–443, https://doi.org/10.1016/j.ecolind.2015.01.007, 2015.
Diak, G. R.: Investigations of improvements to an operational GOES-satellite-data-based insolation system using pyranometer data from the U.S. Climate Reference Network (USCRN), Remote Sens. Environ., 195, 79–95, https://doi.org/10.1016/j.rse.2017.04.002, 2017.
Diak, G. R. and Gautier, C.: Improvements to a Simple Physical Model for Estimating Insolation from GOES Data, J. Climate Appl. Meteor., 22, 505–508, https://doi.org/10.1175/1520-0450(1983)022<0505:ITASPM>2.0.CO;2, 1983.
Diak, G. R. and Stewart, T. R.: Assessment of surface turbulent fluxes using geostationary satellite surface skin temperatures and a mixed layer planetary boundary layer scheme, J. Geophys. Res., 94, 6357, https://doi.org/10.1029/JD094iD05p06357, 1989.
Diak, G. R. and Whipple, M. S.: Note on estimating surface sensible heat fluxes using surface temperatures measured from a geostationary satellite during FIFE 1989, J. Geophys. Res., 100, 25453, https://doi.org/10.1029/95JD00729, 1995.
Dutkiewicz, S., Hickman, A. E., Jahn, O., Henson, S., Beaulieu, C., and Monier, E.: Ocean colour signature of climate change, Nat. Commun., 10, 578, https://doi.org/10.1038/s41467-019-08457-x, 2019.
DOC, NOAA, NESDIS and NASA: Product Definition and User's Guide (PUG): Volume 3: Level 1b Products, available at: https://www.goes-r.gov/users/docs/PUG-L1b-vol3.pdf (last access: 7 August 2020), 2019.
Emmel, C., D'Odorico, P., Revill, A., Hörtnagl, L., Ammann, C., Buchmann, N., and Eugster, W.: Canopy photosynthesis of six major arable crops is enhanced under diffuse light due to canopy architecture, Glob. Change Biol., 26, 5164–5177, https://doi.org/10.1111/gcb.15226, 2020.
Erbs, D. G., Klein, S. A., and Duffie, J. A.: Estimation of the diffuse radiation fraction for hourly, daily and monthly-average global radiation, Sol. Energy, 28, 293–302, https://doi.org/10.1016/0038-092X(82)90302-4, 1982.
Fang, L., Zhan, X., Schull, M., Kalluri, S., Laszlo, I., Yu, P., Carter, C., Hain, C., and Anderson, M.: Evapotranspiration Data Product from NESDIS GET-D System Upgraded for GOES-16 ABI Observations, Remote Sens., 11, 2639, https://doi.org/10.3390/rs11222639, 2019.
Fensholt, R. and Sandholt, I.: Derivation of a shortwave infrared water stress index from MODIS near- and shortwave infrared data in a semiarid environment, Remote Sens. Environ., 87, 111–121, https://doi.org/10.1016/j.rse.2003.07.002, 2003.
Fensholt, R., Sandholt, I., Stisen, S., and Tucker, C.: Analysing NDVI for the African continent using the geostationary meteosat second generation SEVIRI sensor, Remote Sens. Environ., 101, 212–229, https://doi.org/10.1016/j.rse.2005.11.013, 2006.
Filippa, G., Cremonese, E., Migliavacca, M., Galvagno, M., Sonnentag, O., Humphreys, E., Hufkens, K., Ryu, Y., Verfaillie, J., Morra di Cella, U., and Richardson, A. D.: NDVI derived from near-infrared-enabled digital cameras: Applicability across different plant functional types, Agr. Forest Meteorol., 249, 275–285, https://doi.org/10.1016/j.agrformet.2017.11.003, 2018.
Fu, Z., Stoy, P. C., Luo, Y., Chen, J., Sun, J., Montagnani, L., Wohlfahrt, G., Rahman, A. F., Rambal, S., Bernhofer, C., Wang, J., Shirkey, G., and Niu, S.: Climate controls over the net carbon uptake period and amplitude of net ecosystem production in temperate and boreal ecosystems, Agr. Forest Meteorol., 243, 9–18, https://doi.org/10.1016/j.agrformet.2017.05.009, 2017.
Fu, Z., Stoy, P. C., Poulter, B., Gerken, T., Zhang, Z., Wakbulcho, G., and Niu, S.: Maximum carbon uptake rate dominates the interannual variability of global net ecosystem exchange, Glob. Change Biol., 25, 3381–3394, https://doi.org/10.1111/gcb.14731, 2019.
Gamon, J. A., Field, C. B., Goulden, M. L., Griffin, K. L., Hartley, A. E., Joel, G., Penuelas, J., and Valentini, R.: Relationships between NDVI, canopy structure, and photosynthesis in three californian vegetation types, Ecol. Appl., 5, 28–41, https://doi.org/10.2307/1942049, 1995.
Gamon, J. A., Huemmrich, K. F., Wong, C. Y. S., Ensminger, I., Garrity, S., Hollinger, D. Y., Noormets, A., and Peñuelas, J.: A remotely sensed pigment index reveals photosynthetic phenology in evergreen conifers, P. Natl. Acad. Sci. USA, 113, 13087–13092, https://doi.org/10.1073/pnas.1606162113, 2016.
Ganguly, S., Friedl, M. A., Tan, B., Zhang, X., and Verma, M.: Land surface phenology from MODIS: Characterization of the Collection 5 global land cover dynamics product, Remote Sens. Environ., 114, 1805–1816, https://doi.org/10.1016/j.rse.2010.04.005, 2010.
Gao, B.: NDWI – A normalized difference water index for remote sensing of vegetation liquid water from space, Remote Sens. Environ., 58, 257–266, https://doi.org/10.1016/S0034-4257(96)00067-3, 1996.
Gao, F., Hilker, T., Zhu, X., Anderson, M., Masek, J., Wang, P., and Yang, Y.: Fusing landsat and MODIS data for vegetation monitoring, IEEE Geosci. Remote Sens. Mag., 3, 47–60, https://doi.org/10.1109/MGRS.2015.2434351, 2015.
García-Haro, F. J., Campos-Taberner, M., Moreno, Á., Tagesson, H. T., Camacho, F., Martínez, B., Sánchez, S., Piles, M., Camps-Valls, G., Yebra, M., and Gilabert, M. A.: A global canopy water content product from AVHRR/Metop, ISPRS J. Photogramm., 162, 77–93, https://doi.org/10.1016/j.isprsjprs.2020.02.007, 2020.
Gautier, C., Diak, G., and Masse, S.: A Simple Physical Model to Estimate Incident Solar Radiation at the Surface from GOES Satellite Data, J. Appl. Meteor., 19, 1005–1012, https://doi.org/10.1175/1520-0450(1980)019<1005:ASPMTE>2.0.CO;2, 1980.
Gerken, T., Bromley, G. T., Ruddell, B. L., Williams, S., and Stoy, P. C.: Convective suppression before and during the United States Northern Great Plains flash drought of 2017, Hydrol. Earth Syst. Sci., 22, 4155–4163, https://doi.org/10.5194/hess-22-4155-2018, 2018.
Ghilain, N., Arboleda, A., and Gellens-Meulenberghs, F.: Evapotranspiration modelling at large scale using near-real time MSG SEVIRI derived data, Hydrol. Earth Syst. Sci., 15, 771–786, https://doi.org/10.5194/hess-15-771-2011, 2011.
Goetz, S. J., Fiske, G. J., and Bunn, A. G.: Using satellite time-series data sets to analyze fire disturbance and forest recovery across Canada, Remote Sens. Environ., 101, 352–365, https://doi.org/10.1016/j.rse.2006.01.011, 2006.
Govaerts, Y. M., Wagner, S., Lattanzio, A., and Watts, P.: Joint retrieval of surface reflectance and aerosol optical depth from MSG/SEVIRI observations with an optimal estimation approach: 1. Theory, J. Geophys. Res., 115, D02203, https://doi.org/10.1029/2009JD011779, 2010.
Grant, I. F., Prata, A. J., and Cechet, R. P.: The impact of the diurnal variation of albedo on the remote sensing of the daily mean albedo of grassland, J. Appl. Meteor., 39, 231–244, https://doi.org/10.1175/1520-0450(2000)039<0231:TIOTDV>2.0.CO;2, 2000.
Guan, K., Medvigy, D., Wood, E. F., Caylor, K. K., Li, S., and Jeong, S.-J.: Deriving vegetation phenological time and trajectory information over africa using SEVIRI daily LAI, IEEE Trans. Geosci. Remote Sens., 52, 1113–1130, https://doi.org/10.1109/TGRS.2013.2247611, 2014.
Gu, L., Baldocchi, D. D., Wofsy, S. C., Munger, J. W., Michalsky, J. J., Urbanski, S. P., and Boden, T. A.: Response of a deciduous forest to the Mount Pinatubo eruption: enhanced photosynthesis, Science, 299, 2035–2038, https://doi.org/10.1126/science.1078366, 2003.
Hardisky, M., Klemas, V., and Smart, R. M.: The influence of soil salinity, growth form, and leaf moisture on the spectral radiance of Spartina Alterniflora canopies, Photogramm. Engin. Remote Sens., 49, 77–83, 1983.
Hashimoto, H., Wang, W., Dungan, J. L., Li, S., Michaelis, A. R., Takenaka, H., Higuchi, A., Myneni, R. B., and Nemani, R. R.: New generation geostationary satellite observations support seasonality in greenness of the Amazon evergreen forests, Nat. Commun., 12, 684, https://doi.org/10.1038/s41467-021-20994-y, 2021.
Heidinger, A. and Straka, W. C.: Algorithm Theoretical Basis Document ABI Cloud Mask, NOAA NESDIS Center for Satellite Applications and Research, Version 3.0, available at: https://github.com/anmikhan/envirogoes.git (last access: 1 January 2021), 2012.
Hemes, K. S., Verfaillie, J., and Baldocchi, D. D.: Wildfire-smoke aerosols lead to increased light use efficiency among agricultural and restored wetland land uses in california's central valley, J. Geophys. Res.-Biogeo., 125, e2019JG005380, https://doi.org/10.1029/2019JG005380, 2020.
He, T., Liang, S., Wang, D., Wu, H., Yu, Y., and Wang, J.: Estimation of surface albedo and directional reflectance from Moderate Resolution Imaging Spectroradiometer (MODIS) observations, Remote Sens. Environ., 119, 286–300, https://doi.org/10.1016/j.rse.2012.01.004, 2012.
He, T., Zhang, Y., Liang, S., Yu, Y., and Wang, D.: Developing Land Surface Directional Reflectance and Albedo Products from Geostationary GOES-R and Himawari Data: Theoretical Basis, Operational Implementation, and Validation, Remote Sens., 11, 2655, https://doi.org/10.3390/rs11222655, 2019.
Higuchi, A.: Toward more integrated utilizations of geostationary satellite data for disaster management and risk mitigation, Remote Sens., 13, 1553, https://doi.org/10.3390/rs13081553, 2021.
Hilker, T., Wulder, M. A., Coops, N. C., Linke, J., McDermid, G., Masek, J. G., Gao, F., and White, J. C.: A new data fusion model for high spatial- and temporal-resolution mapping of forest disturbance based on Landsat and MODIS, Remote Sens. Environ., 113, 1613–1627, https://doi.org/10.1016/j.rse.2009.03.007, 2009.
Holdaway, R. J., Sparrow, A. D., and Coomes, D. A.: Trends in entropy production during ecosystem development in the Amazon Basin, Philos. T. R. Soc. Lond. B, 365, 1437–1447, https://doi.org/10.1098/rstb.2009.0298, 2010.
Huete, A., Didan, K., Miura, T., Rodriguez, E. P., Gao, X., and Ferreira, L. G.: Overview of the radiometric and biophysical performance of the MODIS vegetation indices, Remote Sens. Environ., 83, 195–213, https://doi.org/10.1016/S0034-4257(02)00096-2, 2002.
Hulley, G., Hook, S., Fisher, J., and Lee, C.: ECOSTRESS, A NASA Earth-Ventures Instrument for studying links between the water cycle and plant health over the diurnal cycle, in 2017 IEEE International Geoscience and Remote Sensing Symposium (IGARSS), IEEE, 5494–5496, https://doi.org/10.1109/IGARSS.2017.8128248, 2017.
Jackson, T. J., Chen, D., Cosh, M., Li, F., Anderson, M., Walthall, C., Doriaswamy, P., and Hunt, E. R.: Vegetation water content mapping using Landsat data derived normalized difference water index for corn and soybeans, Remote Sens. Environ., 92, 475–482, https://doi.org/10.1016/j.rse.2003.10.021, 2004.
Janjai, S. and Wattan, R.: Development of a model for the estimation of photosynthetically active radiation from geostationary satellite data in a tropical environment, Remote Sens. Environ., 115, 1680–1693, https://doi.org/10.1016/j.rse.2011.02.026, 2011.
Jolliff, J. K., Lewis, M. D., Ladner, S., and Crout, R. L.: Observing the Ocean Submesoscale with Enhanced-Color GOES-ABI Visible Band Data, Sensors, 19, 3900, https://doi.org/10.3390/s19183900, 2019.
Jordan, C. F.: Derivation of Leaf-Area Index from Quality of Light on the Forest Floor, Ecology, 50, 663–666, https://doi.org/10.2307/1936256, 1969.
Kannenberg, S. A., Bowling, D. R., and Anderegg, W. R. L.: Hot moments in ecosystem fluxes: High GPP anomalies exert outsized influence on the carbon cycle and are differentially driven by moisture availability across biomes, Environ. Res. Lett., 15, 054004, https://doi.org/10.1088/1748-9326/ab7b97, 2020.
Kay, J. J. and Schneider, E. D.: Thermodynamics and measures of ecological integrity, in: Ecological Indicators, edited by: McKenzie, D. H., Hyatt, D. E., and McDonald, V. J., Springer US, Boston, MA, 159–182, https://doi.org/10.1007/978-1-4615-4659-7_12, 1992.
Kerr, J. T. and Ostrovsky, M.: From space to species: ecological applications for remote sensing, Trends. Ecol. Evol., 18, 299–305, https://doi.org/10.1016/S0169-5347(03)00071-5, 2003.
Kim, H.-W., Yeom, J.-M., Shin, D., Choi, S., Han, K.-S., and Roujean, J.-L.: An assessment of thin cloud detection by applying bidirectional reflectance distribution function model-based background surface reflectance using Geostationary Ocean Color Imager (GOCI): A case study for South Korea, J. Geophys. Res.-Atmos., 122, 8153–8172, https://doi.org/10.1002/2017JD026707, 2017.
Knauer, K., Gessner, U., Fensholt, R., and Kuenzer, C.: An ESTARFM Fusion Framework for the Generation of Large-Scale Time Series in Cloud-Prone and Heterogeneous Landscapes, Remote Sens., 8, 425, https://doi.org/10.3390/rs8050425, 2016.
LeBauer, D., Wang, D., Feng, X., and Dietz, M.: PECAn: workflow management for data assimilation and forecasting, Nat. Prec., https://doi.org/10.1038/npre.2011.5533.1, 2011.
Leitão, P. J., Schwieder, M., Pötzschner, F., Pinto, J. R. R., Teixeira, A. M. C., Pedroni, F., Sanchez, M., Rogass, C., van der Linden, S., Bustamante, M. M. C., and Hostert, P.: From sample to pixel: multi-scale remote sensing data for upscaling aboveground carbon data in heterogeneous landscapes, Ecosphere, 9, e02298, https://doi.org/10.1002/ecs2.2298, 2018.
Lin, H., Cao, M., Stoy, P. C., and Zhang, Y.: Assessing self-organization of plant communities – A thermodynamic approach, Ecol. Modell., 220, 784–790, https://doi.org/10.1016/j.ecolmodel.2009.01.003, 2009.
Liu, Y., Hill, M. J., Zhang, X., Wang, Z., Richardson, A. D., Hufkens, K., Filippa, G., Baldocchi, D. D., Ma, S., Verfaillie, J., and Schaaf, C. B.: Using data from Landsat, MODIS, VIIRS and PhenoCams to monitor the phenology of California oak/grass savanna and open grassland across spatial scales, Agr. Forest Meteorol., 237/238, 311–325, https://doi.org/10.1016/j.agrformet.2017.02.026, 2017.
Li, F., Zhang, X., Roy, D. P., and Kondragunta, S.: Estimation of biomass-burning emissions by fusing the fire radiative power retrievals from polar-orbiting and geostationary satellites across the conterminous United States, Atmos. Environ., 211, 274–287, https://doi.org/10.1016/j.atmosenv.2019.05.017, 2019a.
Li, S., Wang, W., Hashimoto, H., Xiong, J., Vandal, T., Yao, J., Qian, L., Ichii, K., Lyapustin, A., Wang, Y., and Nemani, R.: First Provisional Land Surface Reflectance Product from Geostationary Satellite Himawari-8 AHI, Remote Sens., 11, 2990, https://doi.org/10.3390/rs11242990, 2019b.
Li, X., Xiao, J., Fisher, J. B., and Baldocchi, D. D.: ECOSTRESS estimates gross primary production with fine spatial resolution for different times of day from the International Space Station, Remote Sens. Environ., 258, 112360, https://doi.org/10.1016/j.rse.2021.112360, 2021.
Li, Z.-L., Tang, B.-H., Wu, H., Ren, H., Yan, G., Wan, Z., Trigo, I. F., and Sobrino, J. A.: Satellite-derived land surface temperature: Current status and perspectives, Remote Sens. Environ., 131, 14–37, https://doi.org/10.1016/j.rse.2012.12.008, 2013.
Mahadevan, P., Wofsy, S. C., Matross, D. M., Xiao, X., Dunn, A. L., Lin, J. C., Gerbig, C., Munger, J. W., Chow, V. Y., and Gottlieb, E. W.: A satellite-based biosphere parameterization for net ecosystem CO2 exchange: Vegetation Photosynthesis and Respiration Model (VPRM), Global Biogeochem. Cy., 22, GB2005, https://doi.org/10.1029/2006GB002735, 2008.
Ma, X., Huete, A., Tran, N. N., Bi, J., Gao, S., and Zeng, Y.: Sun-Angle Effects on Remote-Sensing Phenology Observed and Modelled Using Himawari-8, Remote Sens., 12, 1339, https://doi.org/10.3390/rs12081339, 2020.
McCallum, I., Wagner, W., Schmullius, C., Shvidenko, A., Obersteiner, M., Fritz, S., and Nilsson, S.: Satellite-based terrestrial production efficiency modeling, Carb. Balance Manag., 4, 8, https://doi.org/10.1186/1750-0680-4-8, 2009.
McCorkel, J., Efremova, B., Hair, J., Andrade, M., and Holben, B.: GOES-16 ABI solar reflective channel validation for earth science application, Remote Sens. Environ., 237, 111438, https://doi.org/10.1016/j.rse.2019.111438, 2020.
Mecikalski, J. R., Diak, G. R., Anderson, M. C., and Norman, J. M.: Estimating fluxes on continental scales using remotely sensed data in an atmospheric–land exchange model, J. Appl. Meteor., 38, 1352–1369, https://doi.org/10.1175/1520-0450(1999)038<1352:EFOCSU>2.0.CO;2, 1999.
Medlyn, B. E.: Physiological basis of the light use efficiency model, Tree Physiol., 18, 167–176, https://doi.org/10.1093/treephys/18.3.167, 1998.
Meng, R., Wu, J., Zhao, F., Cook, B. D., Hanavan, R. P., and Serbin, S. P.: Measuring short-term post-fire forest recovery across a burn severity gradient in a mixed pine-oak forest using multi-sensor remote sensing techniques, Remote Sens. Environ., 210, 282–296, https://doi.org/10.1016/j.rse.2018.03.019, 2018.
Menzel, W. P.: History of geostationary weather satellites, in: The GOES-R Series, Elsevier, 5–11, https://doi.org/10.1016/B978-0-12-814327-8.00002-0, 2020.
Mercado, L. M., Bellouin, N., Sitch, S., Boucher, O., Huntingford, C., Wild, M., and Cox, P. M.: Impact of changes in diffuse radiation on the global land carbon sink, Nature, 458, 1014–1017, https://doi.org/10.1038/nature07949, 2009.
Miura, T., Nagai, S., Takeuchi, M., Ichii, K., and Yoshioka, H.: Improved Characterisation of Vegetation and Land Surface Seasonal Dynamics in Central Japan with Himawari-8 Hypertemporal Data, Sci. Rep., 9, 15692, https://doi.org/10.1038/s41598-019-52076-x, 2019.
Mladenova, I. E., Bolten, J. D., Crow, W. T., Anderson, M. C., Hain, C. R., Johnson, D. M., and Mueller, R.: Intercomparison of soil moisture, evaporative stress, and vegetation indices for estimating corn and soybean yields over the U.S., IEEE J. Sel. Top. Appl. Earth Observ. Remote Sens., 10, 1328–1343, https://doi.org/10.1109/JSTARS.2016.2639338, 2017.
Monteith, J. L.: Solar radiation and productivity in tropical ecosystems, J. Appl. Ecol., 9, 747–766, https://doi.org/10.2307/2401901, 1972.
Neukermans, G., Ruddick, K., Bernard, E., Ramon, D., Nechad, B., and Deschamps, P.-Y.: Mapping total suspended matter from geostationary satellites: a feasibility study with SEVIRI in the Southern North Sea, Opt. Express, 17, 14029–14052, https://doi.org/10.1364/oe.17.014029, 2009.
Nieke, J., Borde, F., Mavrocordatos, C., Berruti, B., Delclaud, Y., Riti, J. B., and Garnier, T.: The Ocean and Land Colour Imager (OLCI) for the Sentinel 3 GMES Mission: status and first test results, in: Earth Observing Missions and Sensors: Development, Implementation, and Characterization II, Vol. 8528, edited by: Shimoda, H., Xiong, X., Cao, C., Gu, X., Kim, C., and Kiran Kumar, A. S., SPIE, 85280C, https://doi.org/10.1117/12.977247, 2012.
NOAA: Summary of the GOES-17 Cooling System Issue, GOES Image Viewer, available at: https://www.star.nesdis.noaa.gov/GOES/loopheatpipeanomaly.php, last access: 29 October 2020.
NOAA and NASA: GOES-17 ABI Performance, GOES-R, available at: https://www.goes-r.gov/users/GOES-17-ABI-Performance.html, last access: 4 November 2020.
Noh, J. H., Kim, W., Son, S. H., Ahn, J.-H., and Park, Y.-J.: Remote quantification of Cochlodinium polykrikoides blooms occurring in the East Sea using geostationary ocean color imager (GOCI), Harmful Algae, 73, 129–137, https://doi.org/10.1016/j.hal.2018.02.006, 2018.
Norman, J. M., Kustas, W. P., and Humes, K. S.: Source approach for estimating soil and vegetation energy fluxes in observations of directional radiometric surface temperature, Agr. Forest Meteorol., 77, 263–293, https://doi.org/10.1016/0168-1923(95)02265-Y, 1995.
Norris, C., Hobson, P., and Ibisch, P. L.: Microclimate and vegetation function as indicators of forest thermodynamic efficiency, J. Appl. Ecol. 49, 562–570, https://doi.org/10.1111/j.1365-2664.2011.02084.x, 2012.
Odum, E. P.: The Strategy of Ecosystem Development, Science, 164, 262–270, https://doi.org/10.1126/science.164.3877.262, 1969.
Oliphant, A. J. and Stoy, P. C.: An evaluation of semiempirical models for partitioning photosynthetically active radiation into diffuse and direct beam components, J. Geophys. Res.-Biogeo., 123, 889–901, https://doi.org/10.1002/2017JG004370, 2018.
Otkin, J. A., Anderson, M. C., Mecikalski, J. R., and Diak, G. R.: Validation of GOES-Based Insolation Estimates Using Data from the U.S. Climate Reference Network, J. Hydrometeor., 6, 460–475, https://doi.org/10.1175/JHM440.1, 2005.
Otkin, J. A., Anderson, M. C., Hain, C., Mladenova, I. E., Basara, J. B., and Svoboda, M.: Examining rapid onset drought development using the thermal infrared–based evaporative stress index, J. Hydrometeor., 14, 1057–1074, https://doi.org/10.1175/JHM-D-12-0144.1, 2013.
Otkin, J. A., Anderson, M. C., Hain, C., and Svoboda, M.: Examining the Relationship between Drought Development and Rapid Changes in the Evaporative Stress Index, J. Hydrometeor., 15, 938–956, https://doi.org/10.1175/JHM-D-13-0110.1, 2014.
Otkin, J. A., Shafer, M., Svoboda, M., Wardlow, B., Anderson, M. C., Hain, C., and Basara, J.: Facilitating the Use of Drought Early Warning Information through Interactions with Agricultural Stakeholders, Bull. Am. Meteorol. Soc., 96, 1073–1078, https://doi.org/10.1175/BAMS-D-14-00219.1, 2015.
Otkin, J. A., Anderson, M. C., Hain, C., Svoboda, M., Johnson, D., Mueller, R., Tadesse, T., Wardlow, B., and Brown, J.: Assessing the evolution of soil moisture and vegetation conditions during the 2012 United States flash drought, Agr. Forest Meteorol., 218/219, 230–242, https://doi.org/10.1016/j.agrformet.2015.12.065, 2016.
Otkin, J. A., Haigh, T., Mucia, A., Anderson, M. C., and Hain, C.: Comparison of Agricultural Stakeholder Survey Results and Drought Monitoring Datasets during the 2016 U.S. Northern Plains Flash Drought, Wea. Climate Soc., 10, 867–883, https://doi.org/10.1175/WCAS-D-18-0051.1, 2018a.
Otkin, J. A., Svoboda, M., Hunt, E. D., Ford, T. W., Anderson, M. C., Hain, C., and Basara, J. B.: Flash droughts: a review and assessment of the challenges imposed by rapid onset droughts in the united states, Bull. Am. Meteorol. Soc., 99, 911–915, https://doi.org/10.1175/BAMS-D-17-0149.1, 2018b.
Otkin, J. A., Zhong, Y., Hunt, E. D., Basara, J., Svoboda, M., Anderson, M. C., and Hain, C.: Assessing The Evolution Of Soil Moisture And Vegetation Conditions During A Flash Drought – Flash Recovery Sequence Over The South-Central United States, J. Hydrometeor., 20, 549–562, https://doi.org/10.1175/JHM-D-18-0171.1, 2019.
Ouaknine, J., Gode, S., Napierala, B., Viard, T., Foerster, U., Fray, S., Peacoke, P., Hartl, M., Hallibert, P., and Durand, Y.: MTG Flexible Combined Imager optical design and performances, in: Earth Observing Systems XVIII, vol. 8866, edited by: Butler, J. J., (Jack) Xiong, X., and Gu, X., SPIE, 88661A, https://doi.org/10.1117/12.2023078, 2013.
Park, K.-A., Woo, H.-J., and Ryu, J.-H.: Spatial scales of mesoscale eddies from GOCI Chlorophyll-a concentration images in the East/Japan Sea, Ocean Sci. J., 47, 347–358, https://doi.org/10.1007/s12601-012-0033-3, 2012.
Peres, L. F. and DaCamara, C. C.: Emissivity maps to retrieve land-surface temperature from MSG/SEVIRI, IEEE Trans. Geosci. Remote Sens., 43, 1834–1844, https://doi.org/10.1109/TGRS.2005.851172, 2005.
Peschoud, C., Minghelli, A., Mathieu, S., Lei, M., Pairaud, I., and Pinazo, C.: Fusion of Sun-Synchronous and Geostationary Images for Coastal and Ocean Color Survey Application to OLCI (Sentinel-3) and FCI (MTG), IEEE J. Sel. Top. Appl. Earth Observ. Remote Sens., 10, 45–56, https://doi.org/10.1109/JSTARS.2016.2558819, 2017.
Piao, S., Liu, Q., Chen, A., Janssens, I. A., Fu, Y., Dai, J., Liu, L., Lian, X., Shen, M., and Zhu, X.: Plant phenology and global climate change: Current progresses and challenges, Glob. Change Biol., 25, 1922–1940, https://doi.org/10.1111/gcb.14619, 2019.
Pinker, R. T. and Ewing, J. A.: Modeling surface solar radiation: model formulation and validation, J. Clim. Appl. Meteor., 24, 389–401, https://doi.org/10.1175/1520-0450(1985)024<0389:MSSRMF>2.0.CO;2, 1985.
Pinker, R. T., Laszlo, I., Tarpley, J. D., and Mitchell, K.: Geostationary satellite parameters for surface energy balance, Adv. Space Res., 30, 2427–2432, https://doi.org/10.1016/S0273-1177(02)80296-4, 2002.
Pinker, R. T., Ma, Y., Chen, W., Hulley, G., Borbas, E., Islam, T., Hain, C., Cawse-Nicholson, K., Hook, S., and Basara, J.: Towards a Unified and Coherent Land Surface Temperature Earth System Data Record from Geostationary Satellites, Remote Sens., 11, 1399, https://doi.org/10.3390/rs11121399, 2019.
Prins, E. M. and Menzel, W. P.: Trends in South American biomass burning detected with the GOES visible infrared spin scan radiometer atmospheric sounder from 1983 to 1991, J. Geophys. Res., 99, 16719, https://doi.org/10.1029/94JD01208, 1994.
Qi, W., Lee, S.-K., Hancock, S., Luthcke, S., Tang, H., Armston, J., and Dubayah, R.: Improved forest height estimation by fusion of simulated GEDI Lidar data and TanDEM-X InSAR data, Remote Sens. Environ., 221, 621–634, https://doi.org/10.1016/j.rse.2018.11.035, 2019.
Ramo, R., Roteta, E., Bistinas, I., van Wees, D., Bastarrika, A., Chuvieco, E., and van der Werf, G. R.: African burned area and fire carbon emissions are strongly impacted by small fires undetected by coarse resolution satellite data, P. Natl. Acad. Sci. USA, 118, e2011160118, https://doi.org/10.1073/pnas.2011160118, 2021.
Randazzo, N. A., Michalak, A. M., and Desai, A. R.: Synoptic meteorology explains temperate forest carbon uptake, J. Geophys. Res.-Biogeo., 125, e2019JG005476, https://doi.org/10.1029/2019JG005476, 2020.
Richardson, A. D., Keenan, T. F., Migliavacca, M., Ryu, Y., Sonnentag, O., and Toomey, M.: Climate change, phenology, and phenological control of vegetation feedbacks to the climate system, Agr. Forest Meteorol., 169, 156–173, https://doi.org/10.1016/j.agrformet.2012.09.012, 2013.
Robinson, N. P., Allred, B. W., Smith, W. K., Jones, M. O., Moreno, A., Erickson, T. A., Naugle, D. E., and Running, S. W.: Terrestrial primary production for the conterminous United States derived from Landsat 30 m and MODIS 250 m, Remote Sens. Ecol. Conserv., 4, 264–280, https://doi.org/10.1002/rse2.74, 2018.
Rouse, J. W., Haas, R. H. J., Schell, J. A., and Deering, D. W.: Monitoring vegetation systems in the great plains with ERTS, Vol. 1, edited by: Freden, S. C., Mercanti, E. P., and Becker, M. A., NASA Scientific and Technical Information Office, 309–317, available at: https://ntrs.nasa.gov/archive/nasa/casi.ntrs.nasa.gov/19740022614.pdf (last access: 4 May 2021), 1974.
Ruddick, K., Neukermans, G., Vanhellemont, Q., and Jolivet, D.: Challenges and opportunities for geostationary ocean colour remote sensing of regional seas: A review of recent results, Remote Sens. Environ., 146, 63–76, https://doi.org/10.1016/j.rse.2013.07.039, 2014.
Running, S. W., Peterson, D. L., Spanner, M. A., and Teuber, K. B.: Remote sensing of coniferous forest leaf area, Ecology, 67, 273–276, https://doi.org/10.2307/1938532, 1986.
Running, S. W., Nemani, R. R., Heinsch, F. A., Zhao, M., Reeves, M., and Hashimoto, H.: A Continuous Satellite-Derived Measure of Global Terrestrial Primary Production, Bioscience, 54, 547–560, https://doi.org/10.1641/0006-3568(2004)054[0547:ACSMOG]2.0.CO;2, 2004.
Ryu, J.-H. and Ishizaka, J.: GOCI data processing and ocean applications, Ocean Sci. J., 47, 221–221, https://doi.org/10.1007/s12601-012-0023-5, 2012.
Ryu, J.-H., Han, H.-J., Cho, S., Park, Y.-J., and Ahn, Y.-H.: Overview of geostationary ocean color imager (GOCI) and GOCI data processing system (GDPS), Ocean Sci. J., 47, 223–233, https://doi.org/10.1007/s12601-012-0024-4, 2012.
Schaaf, C. and Wang, Z.: MCD43A4 MODIS/Terra+Aqua BRDF/Albedo Nadir BRDF Adjusted Ref Daily L3 Global – 500m V006, distributed by NASA EOSDIS Land Processes DAAC, https://doi.org/10.5067/MODIS/MCD43A4.006 (last access: 1 April 2021), 2015.
Schmetz, J., Pili, P., Tjemkes, S., Just, D., Kerkmann, J., Rota, S., and Ratier, A.: An introduction to meteosat second generation (MSG), Bull. Am. Meteorol. Soc., 83, 977–992, https://doi.org/10.1175/1520-0477(2002)083<0977:AITMSG>2.3.CO;2, 2002.
Schmidt, C. C., Hoffman, J., Prins, E., and Lindstrom, S.: GOES-R Advanced Baseline Imager (ABI) Algorithm TheoreticalBasis Document For Fire/Hot Spot Characterization, Noaa Nesdis Center For Satellite Applications And Research, 2012.
Schmit, T. J. and Gunshor, M. M.: ABI Imagery from the GOES-R Series, in: The GOES-R Series, Elsevier, 23–34, https://doi.org/10.1016/B978-0-12-814327-8.00004-4, 2020.
Schmit, T., Gunshor, M., Fu, G., Rink, T., Bah, K., Zhang, W., and Wolf, W.: GOES-R Advanced Baseline Imager (ABI) Algorithm Theoretical Basis Document for Cloud and Moisture Imagery Product (CMIP), NOAA NESDIS Center for Satellite Applications and Research, Version 3.0, available at: https://registry.opendata.aws/noaa-goes/ (last access: 1 January 2021), 2012.
Schmit, T. J., Goodman, S. J., Gunshor, M. M., Sieglaff, J., Heidinger, A. K., Bachmeier, A. S., Lindstrom, S. S., Terborg, A., Feltz, J., Bah, K., Rudlosky, S., Lindsey, D. T., Rabin, R. M., and Schmidt, C. C.: Rapid refresh information of significant events: preparing users for the next generation of geostationary operational satellites, Bull. Am. Meteorol. Soc., 96, 561–576, https://doi.org/10.1175/BAMS-D-13-00210.1, 2015.
Schmit, T. J., Griffith, P., Gunshor, M. M., Daniels, J. M., Goodman, S. J., and Lebair, W. J.: A Closer Look at the ABI on the GOES-R Series, Bull. Am. Meteorol. Soc., 98, 681–698, https://doi.org/10.1175/BAMS-D-15-00230.1, 2017.
Schmit, T. J., Lindstrom, S. S., Gerth, J. J., and Gunshor, M. M.: Applications of the 16 spectral bands on the Advanced Baseline Imager (ABI), J. Operational Meteor., 6, 33–46, https://doi.org/10.15191/nwajom.2018.0604, 2018.
Schneider, E. D. and Kay, J. J.: Complexity and thermodynamics, Futures, 26, 626–647, https://doi.org/10.1016/0016-3287(94)90034-5, 1994.
Schumacher, D. L., Keune, J., and Miralles, D. G.: Atmospheric heat and moisture transport to energy- and water-limited ecosystems, Ann. N. Y. Acad. Sci., 1472, 123–138, https://doi.org/10.1111/nyas.14357, 2020.
Semmens, K. A., Anderson, M. C., Kustas, W. P., Gao, F., Alfieri, J. G., McKee, L., Prueger, J. H., Hain, C. R., Cammalleri, C., Yang, Y., Xia, T., Sanchez, L., Mar Alsina, M., and Vélez, M.: Monitoring daily evapotranspiration over two California vineyards using Landsat 8 in a multi-sensor data fusion approach, Remote Sens. Environ., 185, 155–170, https://doi.org/10.1016/j.rse.2015.10.025, 2016.
Seong, N.-H., Jung, D., Kim, J., and Han, K.-S.: Evaluation of NDVI Estimation Considering Atmospheric and BRDF Correction through Himawari-8/AHI, Asia-Pacific J. Atmos. Sci., 56, 265–274, https://doi.org/10.1007/s13143-019-00167-0, 2020.
Seyednasrollah, B., Young, A. M., Hufkens, K., Milliman, T., Friedl, M. A., Frolking, S., and Richardson, A. D.: Tracking vegetation phenology across diverse biomes using Version 2.0 of the PhenoCam Dataset, Sci. Data, 6, 222, https://doi.org/10.1038/s41597-019-0229-9, 2019.
Sims, D. A., Rahman, A. F., Cordova, V. D., El-Masri, B. Z., Baldocchi, D. D., Flanagan, L. B., Goldstein, A. H., Hollinger, D. Y., Misson, L., Monson, R. K., Oechel, W. C., Schmid, H. P., Wofsy, S. C., and Xu, L.: On the use of MODIS EVI to assess gross primary productivity of North American ecosystems, J. Geophys. Res., 111, G04015, https://doi.org/10.1029/2006JG000162, 2006.
Smith, W. K., Dannenberg, M. P., Yan, D., Herrmann, S., Barnes, M. L., Barron-Gafford, G. A., Biederman, J. A., Ferrenberg, S., Fox, A. M., Hudson, A., Knowles, J. F., MacBean, N., Moore, D. J. P., Nagler, P. L., Reed, S. C., Rutherford, W. A., Scott, R. L., Wang, X., and Yang, J.: Remote sensing of dryland ecosystem structure and function: Progress, challenges, and opportunities, Remote Sens. Environ., 233, 111401, https://doi.org/10.1016/j.rse.2019.111401, 2019.
Stocker, B. D., Zscheischler, J., Keenan, T. F., Prentice, I. C., Seneviratne, S. I., and Peñuelas, J.: Drought impacts on terrestrial primary production underestimated by satellite monitoring, Nat. Geosci., 12, 264–270, https://doi.org/10.1038/s41561-019-0318-6, 2019.
Stoy, P., Lin, H., Novick, K., Siqueira, M., and Juang, J.-Y.: The role of vegetation on the ecosystem radiative entropy budget and trends along ecological succession, Entropy, 16, 3710–3731, https://doi.org/10.3390/e16073710, 2014.
Stoy, P. C., Katul, G. G., Siqueira, M. B. S., Juang, J.-Y., McCarthy, H. R., Kim, H.-S., Oishi, A. C., and Oren, R.: Variability in net ecosystem exchange from hourly to inter-annual time scales at adjacent pine and hardwood forests: a wavelet analysis, Tree Physiol., 25, 887–902, https://doi.org/10.1093/treephys/25.7.887, 2005.
Stoy, P. C., Trowbridge, A. M., and Bauerle, W. L.: Controls on seasonal patterns of maximum ecosystem carbon uptake and canopy-scale photosynthetic light response: contributions from both temperature and photoperiod, Photosyn. Res., 119, 49–64, https://doi.org/10.1007/s11120-013-9799-0, 2014.
Sullivan, P., Gallagher, F. W., Boukabara, S. A., Lindsey, D. T., and Grigsby, E.: What Follows GOES-R?, available at: https://ams.confex.com/ams/2020Annual/meetingapp.cgi/Paper/370685, last access: 24 August 2020.
Sun, D. and Pinker, R. T.: Estimation of land surface temperature from a Geostationary Operational Environmental Satellite (GOES-8), J. Geophys. Res., 108, 4326, https://doi.org/10.1029/2002JD002422, 2003.
Suomi, V. E. and Parent, R. J.: a color view of planet Earth, Bull. Am. Meteorol. Soc., 49, 74–75, https://doi.org/10.1175/1520-0477-49.2.74, 1968.
Tan, B., Dellomo, J., Wolfe, R. E., and Reth, A. D.: GOES-16 ABI navigation assessment, in: Earth Observing Systems XXIII, edited by: Butler, J. J., (Jack) Xiong, X., and Gu, X., SPIE, p. 15, https://doi.org/10.1117/12.2321170, 2018.
Tan, B., Dellomo, J. J., Wolfe, R. E., and Reth, A. D.: GOES-16 and GOES-17 ABI INR assessment, in: Earth Observing Systems XXIV, edited by: Butler, J. J., (Jack) Xiong, X., and Gu, X., SPIE, p. 49, https://doi.org/10.1117/12.2529336, 2019.
Tan, B., Dellomo, J. J., Folley, C. N., Grycewicz, T. J., Houchin, S., Isaacson, P. J., Johnson, P. D., Porter, B. C., Reth, A. D., Thiyanaratnam, P., and Wolfe, R. E.: GOES-R series image navigation and registration performance assessment tool set, J. Appl. Remote Sens., 14, 032405, https://doi.org/10.1117/1.JRS.14.032405, 2020.
Tian, Y., Romanov, P., Yu, Y., Xu, H., and Tarpley, D.: Analysis of vegetation index NDVI anisotropy to improve the accuracy of the GOES-R green vegetation fraction product, in 2010 IEEE International Geoscience and Remote Sensing Symposium, IEEE, 2091–2094, https://doi.org/10.1109/IGARSS.2010.5651925, 2010.
Tran, N. N., Huete, A., Nguyen, H., Grant, I., Miura, T., Ma, X., Lyapustin, A., Wang, Y., and Ebert, E.: Seasonal Comparisons of Himawari-8 AHI and MODIS Vegetation Indices over Latitudinal Australian Grassland Sites, Remote Sens., 12, 2494, https://doi.org/10.3390/rs12152494, 2020.
Trigo, I. F., Dacamara, C. C., Viterbo, P., Roujean, J.-L., Olesen, F., Barroso, C., Camacho-de-Coca, F., Carrer, D., Freitas, S. C., García-Haro, J., Geiger, B., Gellens-Meulenberghs, F., Ghilain, N., Meliá, J., Pessanha, L., Siljamo, N., and Arboleda, A.: The satellite application facility for land surface analysis, Int. J. Remote Sens., 32, 2725–2744, https://doi.org/10.1080/01431161003743199, 2011.
Tucker, C. J.: Red and photographic infrared linear combinations for monitoring vegetation, Remote Sens. Environ., 8, 127–150, https://doi.org/10.1016/0034-4257(79)90013-0, 1979.
Tucker, C. J.: Remote sensing of leaf water content in the near infrared, Remote Sens. Environ., 10, 23–32, https://doi.org/10.1016/0034-4257(80)90096-6, 1980.
Tucker, C. J., Townshend, J. R., and Goff, T. E.: African land-cover classification using satellite data, Science, 227, 369–375, https://doi.org/10.1126/science.227.4685.369, 1985.
Ulivieri, C. and Cannizzaro, G.: Land surface temperature retrievals from satellite measurements, Acta Astronaut., 12, 977–985, https://doi.org/10.1016/0094-5765(85)90026-8, 1985.
Verger, A., Baret, F., and Weiss, M.: Near Real-Time Vegetation Monitoring at Global Scale, IEEE J. Sel. Top. Appl. Earth Observ. Remote Sens., 7, 3473–3481, https://doi.org/10.1109/JSTARS.2014.2328632, 2014.
Vermote, E. F., Tanre, D., Deuze, J. L., Herman, M., and Morcette, J. J.: Second Simulation of the Satellite Signal in the Solar Spectrum, 6S: an overview, IEEE Trans. Geosci. Remote Sens., 35, 675–686, https://doi.org/10.1109/36.581987, 1997.
Wagner, S. C., Govaerts, Y. M., and Lattanzio, A.: Joint retrieval of surface reflectance and aerosol optical depth from MSG/SEVIRI observations with an optimal estimation approach: 2. Implementation and evaluation, J. Geophys. Res., 115, D02204, https://doi.org/10.1029/2009JD011780, 2010.
Wang, M., Ahn, J.-H., Jiang, L., Shi, W., Son, S., Park, Y.-J., and Ryu, J.-H.: Ocean color products from the Korean Geostationary Ocean Color Imager (GOCI), Opt. Express, 21, 3835–3849, https://doi.org/10.1364/OE.21.003835, 2013.
Wang, W., Qu, J. J., Hao, X., Liu, Y., and Stanturf, J. A.: Post-hurricane forest damage assessment using satellite remote sensing, Agr. Forest Meteorol., 150, 122–132, https://doi.org/10.1016/j.agrformet.2009.09.009, 2010.
Wang, W., Li, S., Hashimoto, H., Takenaka, H., Higuchi, A., Kalluri, S., and Nemani, R.: An Introduction to the Geostationary-NASA Earth Exchange (GeoNEX) Products: 1. Top-of-Atmosphere Reflectance and Brightness Temperature, Remote Sens., 12, 1267, https://doi.org/10.3390/rs12081267, 2020.
Weiss, A. and Norman, J. M.: Partitioning solar radiation into direct and diffuse, visible and near-infrared components, Agr. Forest Meteorol., 34, 205–213, https://doi.org/10.1016/0168-1923(85)90020-6, 1985.
Wheeler, K. I. and Dietze, M. C.: A Statistical Model for Estimating Midday NDVI from the Geostationary Operational Environmental Satellite (GOES) 16 and 17, Remote Sens., 11, 2507, https://doi.org/10.3390/rs11212507, 2019.
Wheeler, K. I. and Dietze, M. C.: Improving the monitoring of deciduous broadleaf phenology using the Geostationary Operational Environmental Satellite (GOES) 16 and 17, Biogeosciences, 18, 1971–1985, https://doi.org/10.5194/bg-18-1971-2021, 2021.
White, M. A., de BEURS, K. M., Didan, K., Inouye, D. W., Richardson, A. D., Jensen, O. P., O'Keefe, J., Zhang, G., Nemani, R. R., van LEEUWEN, W. J. D., Brown, J. F., de WIT, A., Schaepman, M., Lin, X., Dettinger, M., Bailey, A. S., Kimball, J., Schwartz, M. D., Baldocchi, D. D., Lee, J. T., and Lauenroth, W. K.: Intercomparison, interpretation, and assessment of spring phenology in North America estimated from remote sensing for 1982–2006, Glob. Change Biol., 15, 2335–2359, https://doi.org/10.1111/j.1365-2486.2009.01910.x, 2009.
Whittaker, T.: Explore the effects of parallax, available at: http://cimss.ssec.wisc.edu/goes/webapps/parallax/goes16_conus.html (last access: 5 May 2021), 2014.
Wiesner, S., Staudhammer, C. L., Stoy, P. C., Boring, L. R., and Starr, G.: Quantifying energy use efficiency via entropy production: a case study from longleaf pine ecosystems, Biogeosciences, 16, 1845–1863, https://doi.org/10.5194/bg-16-1845-2019, 2019.
Williams, M., Richardson, A. D., Reichstein, M., Stoy, P. C., Peylin, P., Verbeeck, H., Carvalhais, N., Jung, M., Hollinger, D. Y., Kattge, J., Leuning, R., Luo, Y., Tomelleri, E., Trudinger, C. M., and Wang, Y. P.: Improving land surface models with FLUXNET data, Biogeosciences, 6, 1341–1359, https://doi.org/10.5194/bg-6-1341-2009, 2009.
Wong, C. Y. S., D'Odorico, P., Bhathena, Y., Arain, M. A., and Ensminger, I.: Carotenoid based vegetation indices for accurate monitoring of the phenology of photosynthesis at the leaf-scale in deciduous and evergreen trees, Remote Sens. Environ., 233, 111407, https://doi.org/10.1016/j.rse.2019.111407, 2019.
Wonsook, S. H., R. Diak, G., and F. Krajewski, W.: Estimating Near Real-Time Hourly Evapotranspiration Using Numerical Weather Prediction Model Output and GOES Remote Sensing Data in Iowa, Remote Sens., 12, 2337, https://doi.org/10.3390/rs12142337, 2020.
Wooster, M.: Fire radiative energy for quantitative study of biomass burning: derivation from the BIRD experimental satellite and comparison to MODIS fire products, Remote Sens. Environ., 86, 83–107, https://doi.org/10.1016/S0034-4257(03)00070-1, 2003.
Wu, G., Guan, K., Jiang, C., Peng, B., Kimm, H., Chen, M., Yang, X., Wang, S., Suyker, A. E., Bernacchi, C. J., Moore, C. E., Zeng, Y., Berry, J. A., and Cendrero-Mateo, M. P.: Radiance-based NIRv as a proxy for GPP of corn and soybean, Environ. Res. Lett., 15, 034009, https://doi.org/10.1088/1748-9326/ab65cc, 2020.
Wu, P., Shen, H., Zhang, L., and Göttsche, F.-M.: Integrated fusion of multi-scale polar-orbiting and geostationary satellite observations for the mapping of high spatial and temporal resolution land surface temperature, Remote Sens. Environ., 156, 169–181, https://doi.org/10.1016/j.rse.2014.09.013, 2015.
Xiao, J., Chevallier, F., Gomez, C., Guanter, L., Hicke, J. A., Huete, A. R., Ichii, K., Ni, W., Pang, Y., Rahman, A. F., Sun, G., Yuan, W., Zhang, L., and Zhang, X.: Remote sensing of the terrestrial carbon cycle: A review of advances over 50 years, Remote Sens. Environ., 233, 111383, https://doi.org/10.1016/j.rse.2019.111383, 2019.
Xu, W., Wooster, M. J., Roberts, G., and Freeborn, P.: New GOES imager algorithms for cloud and active fire detection and fire radiative power assessment across North, South and Central America, Remote Sens. Environ., 114, 1876–1895, https://doi.org/10.1016/j.rse.2010.03.012, 2010.
Xu, X., Riley, W. J., Koven, C. D., Jia, G., and Zhang, X.: Earlier leaf-out warms air in the north, Nat. Clim. Change, 10, 370–375, https://doi.org/10.1038/s41558-020-0713-4, 2020.
Yang, Y., Anderson, M. C., Gao, F., Wardlow, B., Hain, C. R., Otkin, J. A., Alfieri, J., Yang, Y., Sun, L., and Dulaney, W.: Field-scale mapping of evaporative stress indicators of crop yield: An application over Mead, NE, USA, Remote Sens. Environ., 210, 387–402, https://doi.org/10.1016/j.rse.2018.02.020, 2018.
Yang, Y., Anderson, M., Gao, F., Hain, C., Noormets, A., Sun, G., Wynne, R., Thomas, V., and Sun, L.: Investigating impacts of drought and disturbance on evapotranspiration over a forested landscape in North Carolina, USA using high spatiotemporal resolution remotely sensed data, Remote Sens. Environ., 238, 111018, https://doi.org/10.1016/j.rse.2018.12.017, 2020.
Yan, D., Zhang, X., Yu, Y., and Guo, W.: A Comparison of Tropical Rainforest Phenology Retrieved From Geostationary (SEVIRI) and Polar-Orbiting (MODIS) Sensors Across the Congo Basin, IEEE Trans. Geosci. Remote Sens., 54, 4867–4881, https://doi.org/10.1109/TGRS.2016.2552462, 2016.
Yan, D., Zhang, X., Nagai, S., Yu, Y., Akitsu, T., Nasahara, K. N., Ide, R., and Maeda, T.: Evaluating land surface phenology from the Advanced Himawari Imager using observations from MODIS and the Phenological Eyes Network, Int. J. Appl. Earth Obs., 79, 71–83, https://doi.org/10.1016/j.jag.2019.02.011, 2019.
Yeom, J.-M. and Kim, H.-O.: Comparison of NDVIs from GOCI and MODIS Data towards Improved Assessment of Crop Temporal Dynamics in the Case of Paddy Rice, Remote Sens., 7(9), 11326–11343, https://doi.org/10.3390/rs70911326, 2015.
Yeom, J.-M., Ko, J., and Kim, H.-O.: Application of GOCI-derived vegetation index profiles to estimation of paddy rice yield using the GRAMI rice model, Comput. Electron. Agr., 118, 1–8, https://doi.org/10.1016/j.compag.2015.08.017, 2015.
Yeom, J.-M., Jeong, S., Jeong, G., Ng, C. T., Deo, R. C., and Ko, J.: Monitoring paddy productivity in North Korea employing geostationary satellite images integrated with GRAMI-rice model, Sci. Rep., 8, 16121, https://doi.org/10.1038/s41598-018-34550-0, 2018.
Yeom, J.-M., Roujean, J.-L., Han, K.-S., Lee, K.-S., and Kim, H.-W.: Thin cloud detection over land using background surface reflectance based on the BRDF model applied to Geostationary Ocean Color Imager (GOCI) satellite data sets, Remote Sens. Environ., 239, 111610, https://doi.org/10.1016/j.rse.2019.111610, 2020.
Yu, F., Wu, X., Yoo, H., Wang, Z., Qian, H., and Shao, X.: Radiometric calibration performance of GOES-17 Advanced Baseline Imager (ABI), in: Earth Observing Systems XXIV, edited by: Butler, J. J., (Jack) Xiong, X., and Gu, X., SPIE, p. 48, https://doi.org/10.1117/12.2531407, 2019.
Yu, Y., Tarpley, D., Privette, J. L., Goldberg, M. D., Rama Varma Raja, M. K., Vinnikov, K. Y., and Hui Xu: Developing Algorithm for Operational GOES-R Land Surface Temperature Product, IEEE Trans. Geosci. Remote Sens., 47, 936–951, https://doi.org/10.1109/TGRS.2008.2006180, 2009.
Yu, Y., Tarpley, D., and Xu, H.: GOES-R Advanced Baseline Imager (ABI) Algorithm Theoretical Basis Document For Land Surface Temperature (Version 2.5), Noaa Nesdis Center For Satellite Applications And Research, 2012.
Yuan, W., Liu, S., Zhou, G., Zhou, G., Tieszen, L. L., Baldocchi, D., Bernhofer, C., Gholz, H., Goldstein, A. H., Goulden, M. L., Hollinger, D. Y., Hu, Y., Law, B. E., Stoy, P. C., Vesala, T., and Wofsy, S. C.: Deriving a light use efficiency model from eddy covariance flux data for predicting daily gross primary production across biomes, Agr. Forest Meteorol., 143, 189–207, https://doi.org/10.1016/j.agrformet.2006.12.001, 2007.
Yuan, W., Cai, W., Xia, J., Chen, J., Liu, S., Dong, W., Merbold, L., Law, B., Arain, A., Beringer, J., Bernhofer, C., Black, A., Blanken, P. D., Cescatti, A., Chen, Y., Francois, L., Gianelle, D., Janssens, I. A., Jung, M., Kato, T., and Wohlfahrt, G.: Global comparison of light use efficiency models for simulating terrestrial vegetation gross primary production based on the LaThuile database, Agr. Forest Meteorol., 192/193, 108–120, https://doi.org/10.1016/j.agrformet.2014.03.007, 2014.
Zakšek, K., Hort, M., Zaletelj, J., and Langmann, B.: Monitoring volcanic ash cloud top height through simultaneous retrieval of optical data from polar orbiting and geostationary satellites, Atmos. Chem. Phys., 13, 2589–2606, https://doi.org/10.5194/acp-13-2589-2013, 2013.
Zeng, L., Wardlow, B. D., Xiang, D., Hu, S., and Li, D.: A review of vegetation phenological metrics extraction using time-series, multispectral satellite data, Remote Sens. Environ., 237, 111511, https://doi.org/10.1016/j.rse.2019.111511, 2020.
Zhang, X., Friedl, M. A., Schaaf, C. B., Strahler, A. H., Hodges, J. C. F., Gao, F., Reed, B. C., and Huete, A.: Monitoring vegetation phenology using MODIS, Remote Sens. Environ., 84, 471–475, https://doi.org/10.1016/S0034-4257(02)00135-9, 2003.
Zhang, X., Kondragunta, S., Ram, J., Schmidt, C., and Huang, H.-C.: Near-real-time global biomass burning emissions product from geostationary satellite constellation, J. Geophys. Res., 117, D14201, https://doi.org/10.1029/2012JD017459, 2012.
Zhang, X., Liang, S., Zhou, G., Wu, H., and Zhao, X.: Generating Global LAnd Surface Satellite incident shortwave radiation and photosynthetically active radiation products from multiple satellite data, Remote Sens. Environ., 152, 318–332, https://doi.org/10.1016/j.rse.2014.07.003, 2014.
Zhang, Y., Song, C., Sun, G., Band, L. E., McNulty, S., Noormets, A., Zhang, Q., and Zhang, Z.: Development of a coupled carbon and water model for estimating global gross primary productivity and evapotranspiration based on eddy flux and remote sensing data, Agr. Forest Meteorol., 223, 116–131, https://doi.org/10.1016/j.agrformet.2016.04.003, 2016.
Zhao, J., Chen, X., Zhang, J., Zhao, H., and Song, Y.: Higher temporal evapotranspiration estimation with improved SEBS model from geostationary meteorological satellite data, Sci. Rep., 9, 14981, https://doi.org/10.1038/s41598-019-50724-w, 2019.
Zhao, M., Heinsch, F. A., Nemani, R. R., and Running, S. W.: Improvements of the MODIS terrestrial gross and net primary production global data set, Remote Sens. Environ., 95, 164–176, https://doi.org/10.1016/j.rse.2004.12.011, 2005.
Zhao, W. and Duan, S.-B.: Reconstruction of daytime land surface temperatures under cloud-covered conditions using integrated MODIS/Terra land products and MSG geostationary satellite data, Remote Sens. Environ., 247, 111931, https://doi.org/10.1016/j.rse.2020.111931, 2020.
Zheng, T., Liang, S., and Wang, K.: Estimation of Incident Photosynthetically Active Radiation from GOES Visible Imagery, J. Appl. Meteor. Climatol., 47, 853–868, https://doi.org/10.1175/2007JAMC1475.1, 2008.
Zhou, Y., Zhang, L., Xiao, J., Chen, S., Kato, T., and Zhou, G.: A Comparison of Satellite-Derived Vegetation Indices for Approximating Gross Primary Productivity of Grasslands, Rangeland Ecol. Manag., 67, 9–18, https://doi.org/10.2111/REM-D-13-00059.1, 2014.
Zscheischler, J., Fatichi, S., Wolf, S., Blanken, P. D., Bohrer, G., Clark, K., Desai, A. R., Hollinger, D., Keenan, T., Novick, K. A., and Seneviratne, S. I.: Short-term favorable weather conditions are an important control of interannual variability in carbon and water fluxes, J. Geophys. Res.-Biogeo., 121, 2186–2198, https://doi.org/10.1002/2016JG003503, 2016.
- Abstract
- Introduction
- Background
- ABI top-of-atmosphere data to surface reflectance and surface temperature
- Data products
- Existing applications of geostationary satellites for environmental science
- Emerging applications
- Conclusions
- Code and data availability
- Author contributions
- Competing interests
- Disclaimer
- Acknowledgements
- Financial support
- Review statement
- References