the Creative Commons Attribution 4.0 License.
the Creative Commons Attribution 4.0 License.
 | 13 Jul 2021
A novel representation of biological nitrogen fixation and competitive dynamics between nitrogen-fixing and non-fixing plants in a land model (GFDL LM4.1-BNF)
Sergey Malyshev
Isabel Martínez Cano
Stephen W. Pacala
Elena Shevliakova
Thomas A. Bytnerowicz
Duncan N. L. Menge
Representing biological nitrogen fixation (BNF) is an important challenge for coupled carbon (C) and nitrogen (N) land models. Initial representations of BNF in land models applied simplified phenomenological relationships. More recent representations of BNF are mechanistic and include the dynamic response of symbiotic BNF to N limitation of plant growth. However, they generally do not include the competitive dynamics between N-fixing and non-fixing plants, which is a key ecological mechanism that determines ecosystem-scale symbiotic BNF. Furthermore, asymbiotic BNF is generally not included in land models. Here, we present LM4.1-BNF, a novel representation of BNF (asymbiotic and symbiotic) and an updated representation of N cycling in the Geophysical Fluid Dynamics Laboratory Land Model 4.1 (LM4.1). LM4.1-BNF incorporates a mechanistic representation of asymbiotic BNF by soil microbes, a representation of the competitive dynamics between N-fixing and non-fixing plants, and distinct asymbiotic and symbiotic BNF temperature responses derived from corresponding observations. LM4.1-BNF makes reasonable estimations of major carbon (C) and N pools and fluxes and their temporal dynamics, in comparison to the previous version of LM4.1 with N cycling (LM3-SNAP) and to previous representations of BNF in land models generally (phenomenological representations and those without competitive dynamics between N-fixing and non-fixing plants and/or asymbiotic BNF) at a temperate forest site. LM4.1-BNF effectively reproduces asymbiotic BNF rate (13 ) in comparison to observations (11 ). LM4.1-BNF effectively reproduces the temporal dynamics of symbiotic BNF rate: LM4.1-BNF simulates a symbiotic BNF pulse in early succession that reaches 73 at 15 years and then declines to ∼0 at 300 years, similarly to observed symbiotic BNF, which reaches 75 at 17 years and then declines to ∼0 in late successional forests. As such, LM4.1-BNF can be applied to project the dynamic response of vegetation to N limitation of plant growth and the degree to which this will constrain the terrestrial C sink under elevated atmospheric CO2 concentration and other global change factors.
Please read the corrigendum first before continuing.
-
Notice on corrigendum
The requested paper has a corresponding corrigendum published. Please read the corrigendum first before downloading the article.
-
Article
(5216 KB)
-
The requested paper has a corresponding corrigendum published. Please read the corrigendum first before downloading the article.
- Article
(5216 KB) - Full-text XML
- Corrigendum
- BibTeX
- EndNote


The terrestrial carbon (C) sink is controlled by the availability of nitrogen (N) for plant growth (Elser et al., 2007; LeBauer and Treseder, 2008; Wright et al., 2018). Land models are applied to project the terrestrial C sink (Arora et al., 2020) and are progressively incorporating representations of N cycling and N limitation of plant growth (Goll et al., 2017; Lawrence et al., 2019; Medvigy et al., 2009; Smith et al., 2014; Wang et al., 2010; Yang et al., 2009; Zaehle and Friend, 2010). However, the degree to which N limitation of plant growth will constrain the terrestrial C sink under elevated atmospheric CO2 concentration is unresolved (Terrer et al., 2019), as there is substantial variation between different land models (Wieder et al., 2015b).
The representation of biological N fixation (BNF), the primary natural input of N to terrestrial ecosystems (Fowler et al., 2013; Vitousek et al., 2013), is a key challenge to incorporating N cycling into land models because of its complexity (Davies-Barnard et al., 2020; Meyerholt et al., 2020; Stocker et al., 2016; Thomas et al., 2015; Wieder et al., 2015a). BNF occurs in multiple niches across terrestrial ecosystems: by symbioses between N-fixing bacteria living in root nodules of plants (hereafter, symbiotic BNF) and by a host of other organisms such as soil microbes, bryophytes, and lichens (hereafter, asymbiotic BNF for simplicity although some of these organisms are symbiotic associations; see Reed et al., 2011). Symbiotic BNF and asymbiotic BNF are regulated by a myriad of abiotic and biotic controls, which vary temporally, spatially, and among different niches (Zheng et al., 2019). In particular, symbiotic BNF responds dynamically to N limitation of plant growth: it is up-regulated under N limitation of plant growth and down-regulated under non-N limitation of plant growth (Vitousek et al., 2013). BNF could, as such, be pivotal to overcoming N limitation of plant growth under elevated atmospheric CO2 concentration (Liang et al., 2016; Terrer et al., 2016, 2018).
Many coupled C–N land models use the empirical relationship of BNF with either net primary production (NPP; Goll et al., 2017) or evapotranspiration (ET; B. Smith et al., 2014; Yang et al., 2009; Zaehle and Friend, 2010) to represent BNF. However, these are simplified phenomenological relationships that are not based on the ecological mechanisms underlying BNF (Cleveland et al., 1999). Furthermore, implementing and comparing a NPP-based and ET-based representation of BNF within a land model (CLM5) resulted in projections of the terrestrial C sink that differed by 50 Pg C in 2100 under the Representative Concentration Pathway 8.5 (RCP8.5; Wieder et al., 2015a). Finally, a recent meta-analysis of BNF found no evidence for the empirical relationship of BNF with either NPP or ET (Davies-Barnard and Friedlingstein, 2020).
Recent coupled C–N land models have simulated symbiotic BNF mechanistically rather than phenomenologically as responding dynamically to N limitation of plant growth. The Geophysical Fluid Dynamics Laboratory (GFDL) Land Model 3 (LM3) can include the Symbiotic Nitrogen Acquisition by Plants (SNAP) model (Sulman et al., 2019), in which plant C allocation to N-fixing bacteria is optimized to maximize plant growth. However, LM3-SNAP and other land models that have implemented a mechanistic representation of symbiotic BNF, such as CLM5 (Lawrence et al., 2019), CABLE (Haverd et al., 2018; Peng et al., 2020; Wang et al., 2010), and E3SM (Zhu et al., 2019), represent a single general plant C pool capable of BNF and cannot represent community dynamics. In observed ecosystems, symbiotic BNF responds dynamically to N limitation of plant growth at both the population scale (via individual-scale regulation of symbiotic BNF rate; Menge et al., 2015) and at the community scale (via competitive dynamics between N-fixing and non-fixing plants; Boring and Swank, 1984; Chapin III et al., 1994; Menge and Hedin, 2009). Under strong N limitation, N-fixing plants up-regulate symbiotic BNF rate and have a competitive advantage over non-fixing plants, but, under weak N limitation, N-fixing plants down-regulate symbiotic BNF rate and are competitively excluded by non-fixing plants because of the high C cost of symbiotic BNF (Gutschick, 1981; Sheffer et al., 2015). As such, the competitive dynamics between N-fixing and non-fixing plants is a key ecological mechanism that could determine ecosystem-scale symbiotic BNF. Finally, the abundance of N-fixing trees is spatially variable (Menge et al., 2019; Staccone et al., 2020), but its representation is not possible in land models that represent a single general plant C pool capable of BNF, although it is necessary to accurately estimate regional symbiotic BNF.
Asymbiotic BNF is generally not included in coupled C–N land models. However, asymbiotic BNF is an important natural input of N to terrestrial ecosystems: in some terrestrial ecosystems, asymbiotic BNF is on par with symbiotic BNF, and asymbiotic BNF has been suggested to account for a substantial proportion of global BNF (Reed et al., 2011). Phenomenological representations of BNF merge asymbiotic and symbiotic BNF, although they are regulated by different controls (Zheng et al., 2019). Mechanistic representations of BNF merge asymbiotic and symbiotic BNF (e.g., LM3-SNAP; Sulman et al., 2019), represent asymbiotic BNF as a constant from averaged observations (e.g., CABLE; Wang and Houlton, 2009), or represent asymbiotic BNF phenomenologically as a function of ET (e.g., CLM5; Lawrence et al., 2019). Importantly, although asymbiotic and symbiotic BNF exhibit different temperature responses (Bytnerowicz et al., 2021), the symbiotic BNF temperature response is, when included, derived primarily from asymbiotic BNF observations (Houlton et al., 2008), and the asymbiotic BNF temperature response is omitted.
Here, we present LM4.1-BNF, a novel representation of BNF and an updated representation of N cycling in the GFDL land model 4.1 (LM4.1; Shevliakova et al., 2021). LM4.1 includes height-structured competition for light and water between plant cohorts using the perfect plasticity approximation (Martinez Cano et al., 2020; Purves et al., 2008; Strigul et al., 2008; Weng et al., 2015). LM4.1-BNF builds on the framework of LM4.1, including competition for light, water, and N between plant cohorts that associate with N-fixing bacteria and non-fixer plant cohorts. LM4.1-BNF introduces several improvements to the representation of N cycling in LM3-SNAP by incorporating novel representations of the following ecological mechanisms.
-
Symbiotic BNF and competitive dynamics between N-fixing and non-fixing plants. Plant cohorts with a N-fixer vegetation type conduct symbiotic BNF and compete with plant cohorts with a non-fixer vegetation type.
-
Asymbiotic BNF. Soil microbes conduct asymbiotic BNF, as well as decomposition, nitrification, and denitrification.
-
BNF temperature response. Asymbiotic and symbiotic BNF have different temperature responses derived from asymbiotic BNF observations (Houlton et al., 2008) and symbiotic BNF observations (Bytnerowicz et al., 2021) respectively.
-
N limitation. N limitation is determined by current stored non-structural N relative to the demand for non-structural N. N limitation increases active root uptake of inorganic N and decreases root N exudation following observations (Canarini et al., 2019; Nacry et al., 2013).
-
Dynamic plant C allocation to growth and N uptake. N limitation decreases the growth of leaves, sapwood, and seeds, proportionally increasing the growth of fine roots following observations (Poorter et al., 2012). N limitation stimulates C allocation to N uptake (including symbiotic BNF) relative to growth. C limitation, which is determined by current stored non-structural C relative to the demand for non-structural C, stimulates C allocation to growth relative to N uptake. Thereby, plant C allocation is optimized to maximize growth following observations (Rastetter and Shaver, 1992).
We focus our analysis on temperate forests which are generally N-limited (Elser et al., 2007; LeBauer and Treseder, 2008). We parameterize a N-fixer vegetation type based on Robinia pseudoacacia (black locust), which is the most abundant N-fixing tree species in the coterminous United States, accounting for 64 % of tree-associated BNF in the coterminous United States (Staccone et al., 2020). We compare Robinia to a non-fixer vegetation type based on Acer rubrum (red maple), which is the most abundant non-fixing tree species in the north region of the coterminous United States (Oswalt et al., 2019). We evaluate LM4.1-BNF at Coweeta Hydrologic Laboratory in North Carolina, United States, which has observations on symbiotic BNF by Robinia (Boring and Swank, 1984).
We conduct three analyses to assess the performance of LM4.1-BNF in estimating major C and N pools and fluxes in comparison to previous representations of BNF in land models generally. In the first analysis, we compare mechanistic and phenomenological representations of BNF. We compare LM4.1-BNF (with BNF represented mechanistically as described above) to LM4.1-BNF with BNF represented as a function of NPP and to LM4.1-BNF with BNF represented as a function of ET. In the second analysis, we examine the role of competitive dynamics between N-fixing and non-fixing plants. We compare LM4.1-BNF simulations with both Robinia and Acer to LM4.1-BNF simulations with only Acer and LM4.1-BNF simulations with only Acer that can associate with N-fixing bacteria, which are representative of land models that represent a single general plant C pool capable of BNF and cannot represent community dynamics. In the third analysis, we examine the role of asymbiotic BNF. We compare LM4.1-BNF simulations with asymbiotic BNF to LM4.1-BNF simulations without asymbiotic BNF, which is representative of land models that do not include asymbiotic BNF.
2.1 Overview of a land tile and vegetation types
We provide an overview of LM4.1-BNF with a focus on the novel elements relative to LM4.1 (Shevliakova et al., 2021) and LM3-SNAP (Sulman et al., 2019). A complete description of LM4.1-BNF is available in Appendix A. Note that LM4.1 can be coupled with the GFDL atmosphere model to serve as a base for the GFDL climate and Earth system models (Zhao et al., 2018a, b).
LM4.1-BNF consists of a grid, in which grid cells are approximately 100 km by 100 km. LM4.1-BNF represents the heterogeneity of the land surface as a mosaic of land tiles within a grid cell. Each land tile represents a fraction of the grid cell area and does not have an associated location within the grid cell. A land tile may represent natural vegetation at a given stage of recovery post-disturbance, urban area, pastureland, rangeland, or cropland. Land tiles are created dynamically due to a disturbance, such as human land use, fire, or natural mortality of vegetation.
A land tile contains multiple plant cohorts that compete for light and water following the perfect plasticity approximation (Martinez Cano et al., 2020; Purves et al., 2008; Strigul et al., 2008; Weng et al., 2015) and compete for N (presented below). Plant cohorts consist of identical individual trees belonging to a vegetation type that occupy a given canopy layer and that have a spatial density (determined by recruitment and mortality). A vegetation type can be associated with exclusively arbuscular mycorrhizae (AM), exclusively ectomycorrhizae (EM), both AM and N-fixing bacteria, or both EM and N-fixing bacteria. A land tile can contain multiple plant cohorts of the same or of different vegetation types. As such, there is intraspecific competition (among plant cohorts of the same vegetation type within a tile) and interspecific competition (among plant cohorts of different vegetation types within a tile). Growth is based on allometric equations (Eqs. A40–A42) and is modulated by N availability. Recruitment and mortality follow Weng et al. (2015) and Martinez Cano et al. (2020) and are not directly influenced by N availability but are indirectly influenced by N availability via its effect on growth.
Table 1Key parameter differences between vegetation types. See Table D1 for remaining vegetation-type-specific parameters.

There are six plant tissue C and N pools: leaf, fine root, sapwood, heartwood, seed, and non-structural C or N. The C:N ratios of the leaf, fine root, sapwood, heartwood, and seed tissue pools are fixed (for a given vegetation type) (Tables 1, D1, and D2). There are three soil organic C and N pools (labile plant-derived, labile microbe-derived, and recalcitrant) and two soil inorganic N pools (ammonium () and nitrate ()) in each soil layer. There are 20 soil layers of varying thickness to a total depth of 10 m. Soil C and N are transferred between soil layers via leaching. The soil C:N ratio is not fixed. Figure 1 displays a diagram of key C and N pools and fluxes.
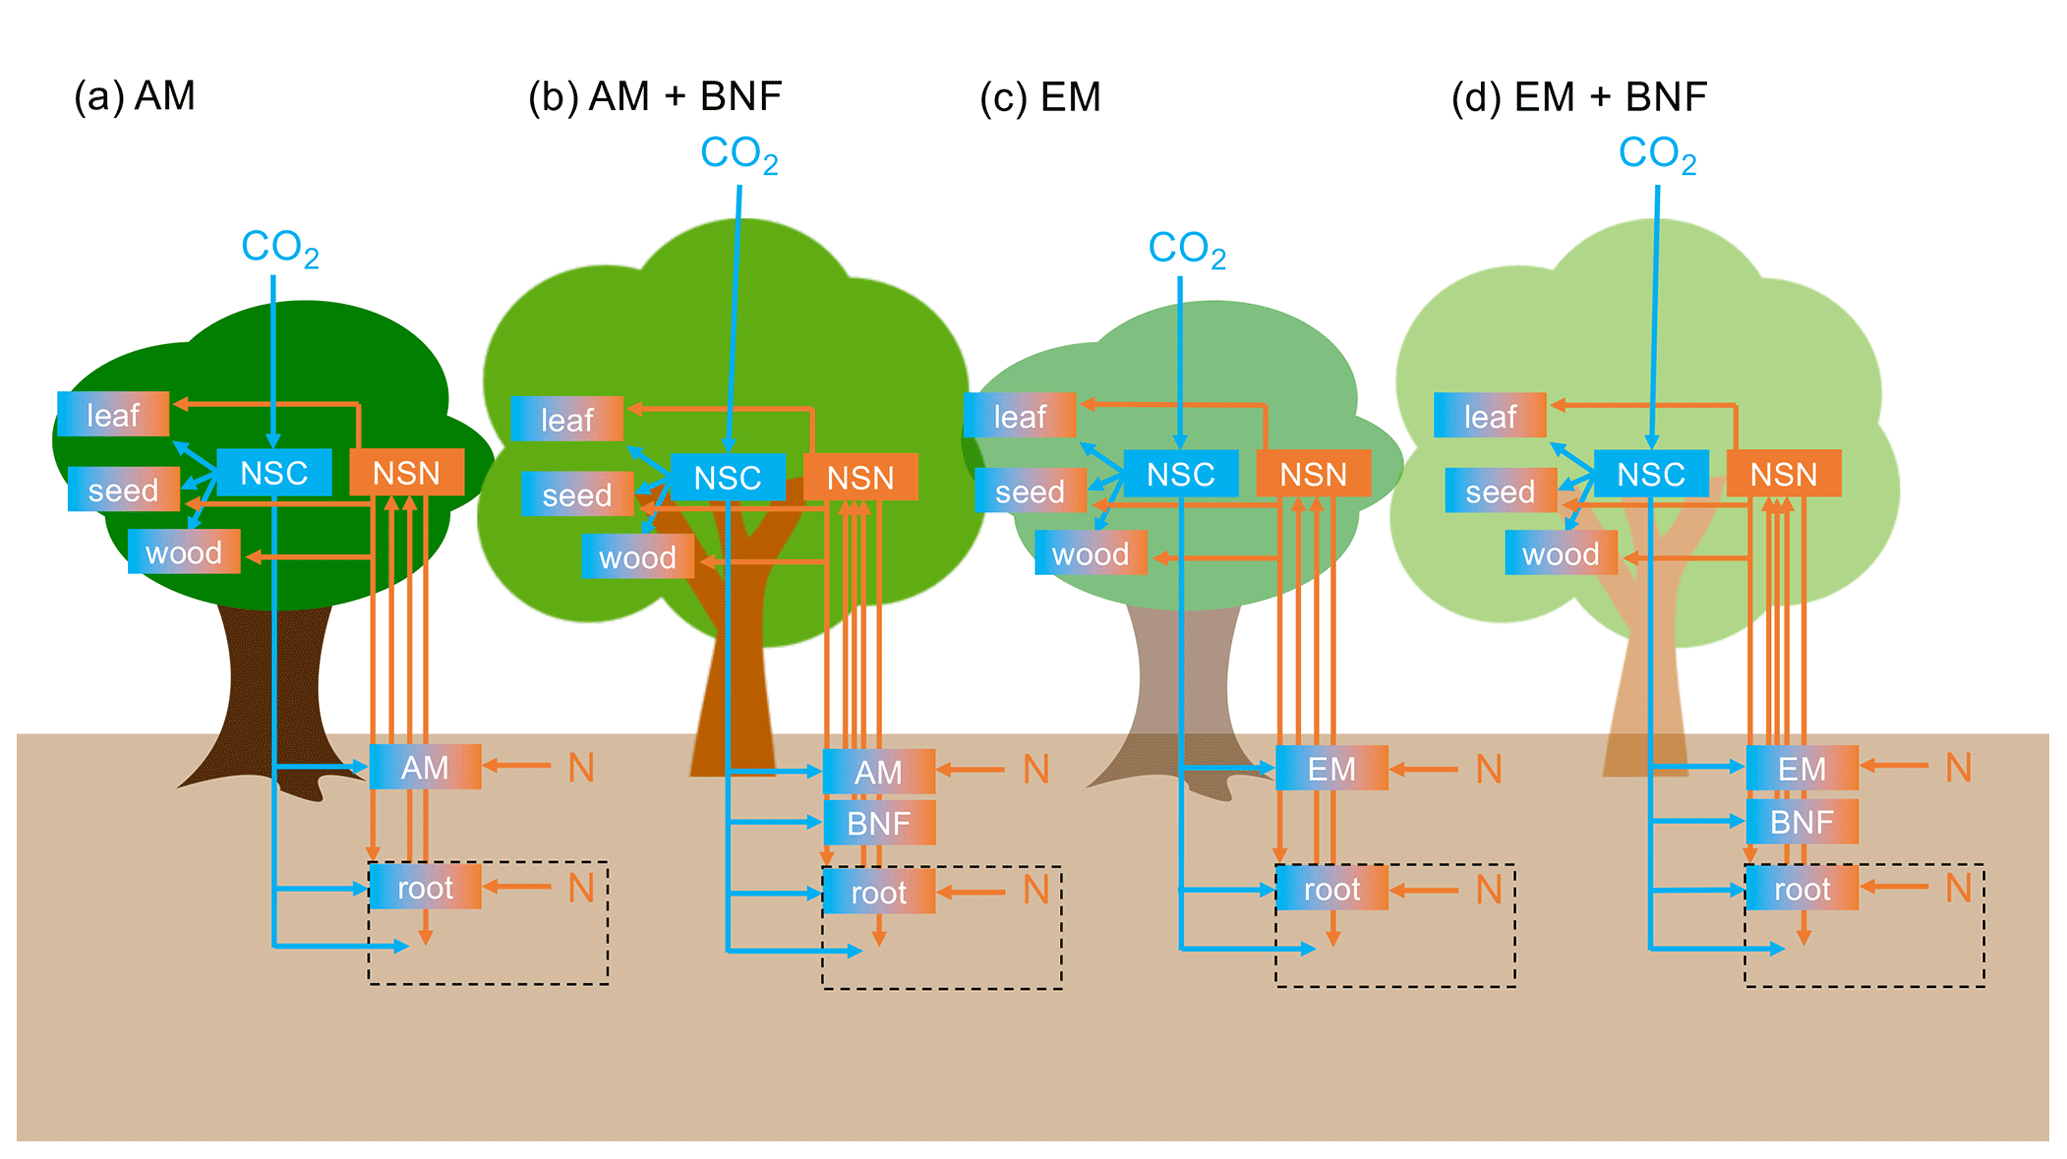
Figure 1Diagram of key C and N pools (boxes) and fluxes (arrows). C pools and fluxes are indicated in blue. N pools and fluxes are indicated in orange. NSC represents non-structural C and NSN represents non-structural N. Orange and blue boxes have a fixed C:N ratio. Plant turnover, symbiont turnover, and soil C and N pools and fluxes are not displayed for visual clarity. The black dashed box represents the rhizosphere. (a) Vegetation type that associates with arbuscular mycorrhizae (AM). (b) Vegetation type that associates with AM and N-fixing bacteria. (c) Vegetation type that associates with ectomycorrhizae (EM). (d) Vegetation type that associates with EM and N-fixing bacteria.
We define a N-fixer vegetation type with a parameterization based on Robinia pseudoacacia and a non-fixer vegetation type with a parameterization based on Acer rubrum. Both Acer and Robinia associate with AM. We used the US Forest Inventory and Analysis (FIA) database (US Forest Service, 2020a), the US FIA Forest Health Monitoring database (US Forest Service, 2020b), and the Biomass and Allometry Database (BAAD; Falster et al., 2015) to parameterize the allometries of these vegetation types (Eqs. A40–A42; Appendices B and C). The vegetation types also differed in other key traits (Table 1). In particular, the C:N ratio of leaves differed between vegetation types that associated with AM, EM, and N-fixing bacteria (Adams et al., 2016; Averill et al., 2019). See Table D1 for all vegetation-type-specific parameters. Other model parameters are from Weng et al. (2015) or Sulman et al. (2019) or are derived from published observations (Appendix C). Some parameters were not well constrained by available observations and were tuned to fit to observed patterns of C and N cycling in temperate forests (Appendix C). See Table D2 for general parameters.
2.2 Symbiotic BNF and N uptake by roots, AM, and EM
All vegetation types take up inorganic N via passive and active root uptake. Passive root uptake of inorganic N follows LM3-SNAP (Eq. A1). Active root uptake of inorganic N follows LM3-SNAP but is modified to increase with N stress following observations (Nacry et al., 2013) (described in further detail below; Eq. 16). AM takes up inorganic N following LM3-SNAP (Eq. A4). EM decomposes and takes up organic C and N following LM3-SNAP but is modified to additionally take up inorganic N following observations (Phillips et al., 2013) (Eq. A8).
The symbiotic BNF rate by N-fixing bacteria (NNfix; []) is
where rNfix is a rate constant, BNfix is the biomass C of the nodule (includes both plant and N-fixing bacteria tissue) [kg N indiv−1], and fs(T) is the soil temperature dependence function. For Robinia,
where T is the average soil temperature across soil layers [K]. This function reaches its maximum at 31.9 ∘C (Fig. 2). It is a modified beta distribution function (Yan and Hunt, 1999) and is derived from Bytnerowicz et al. (2021).
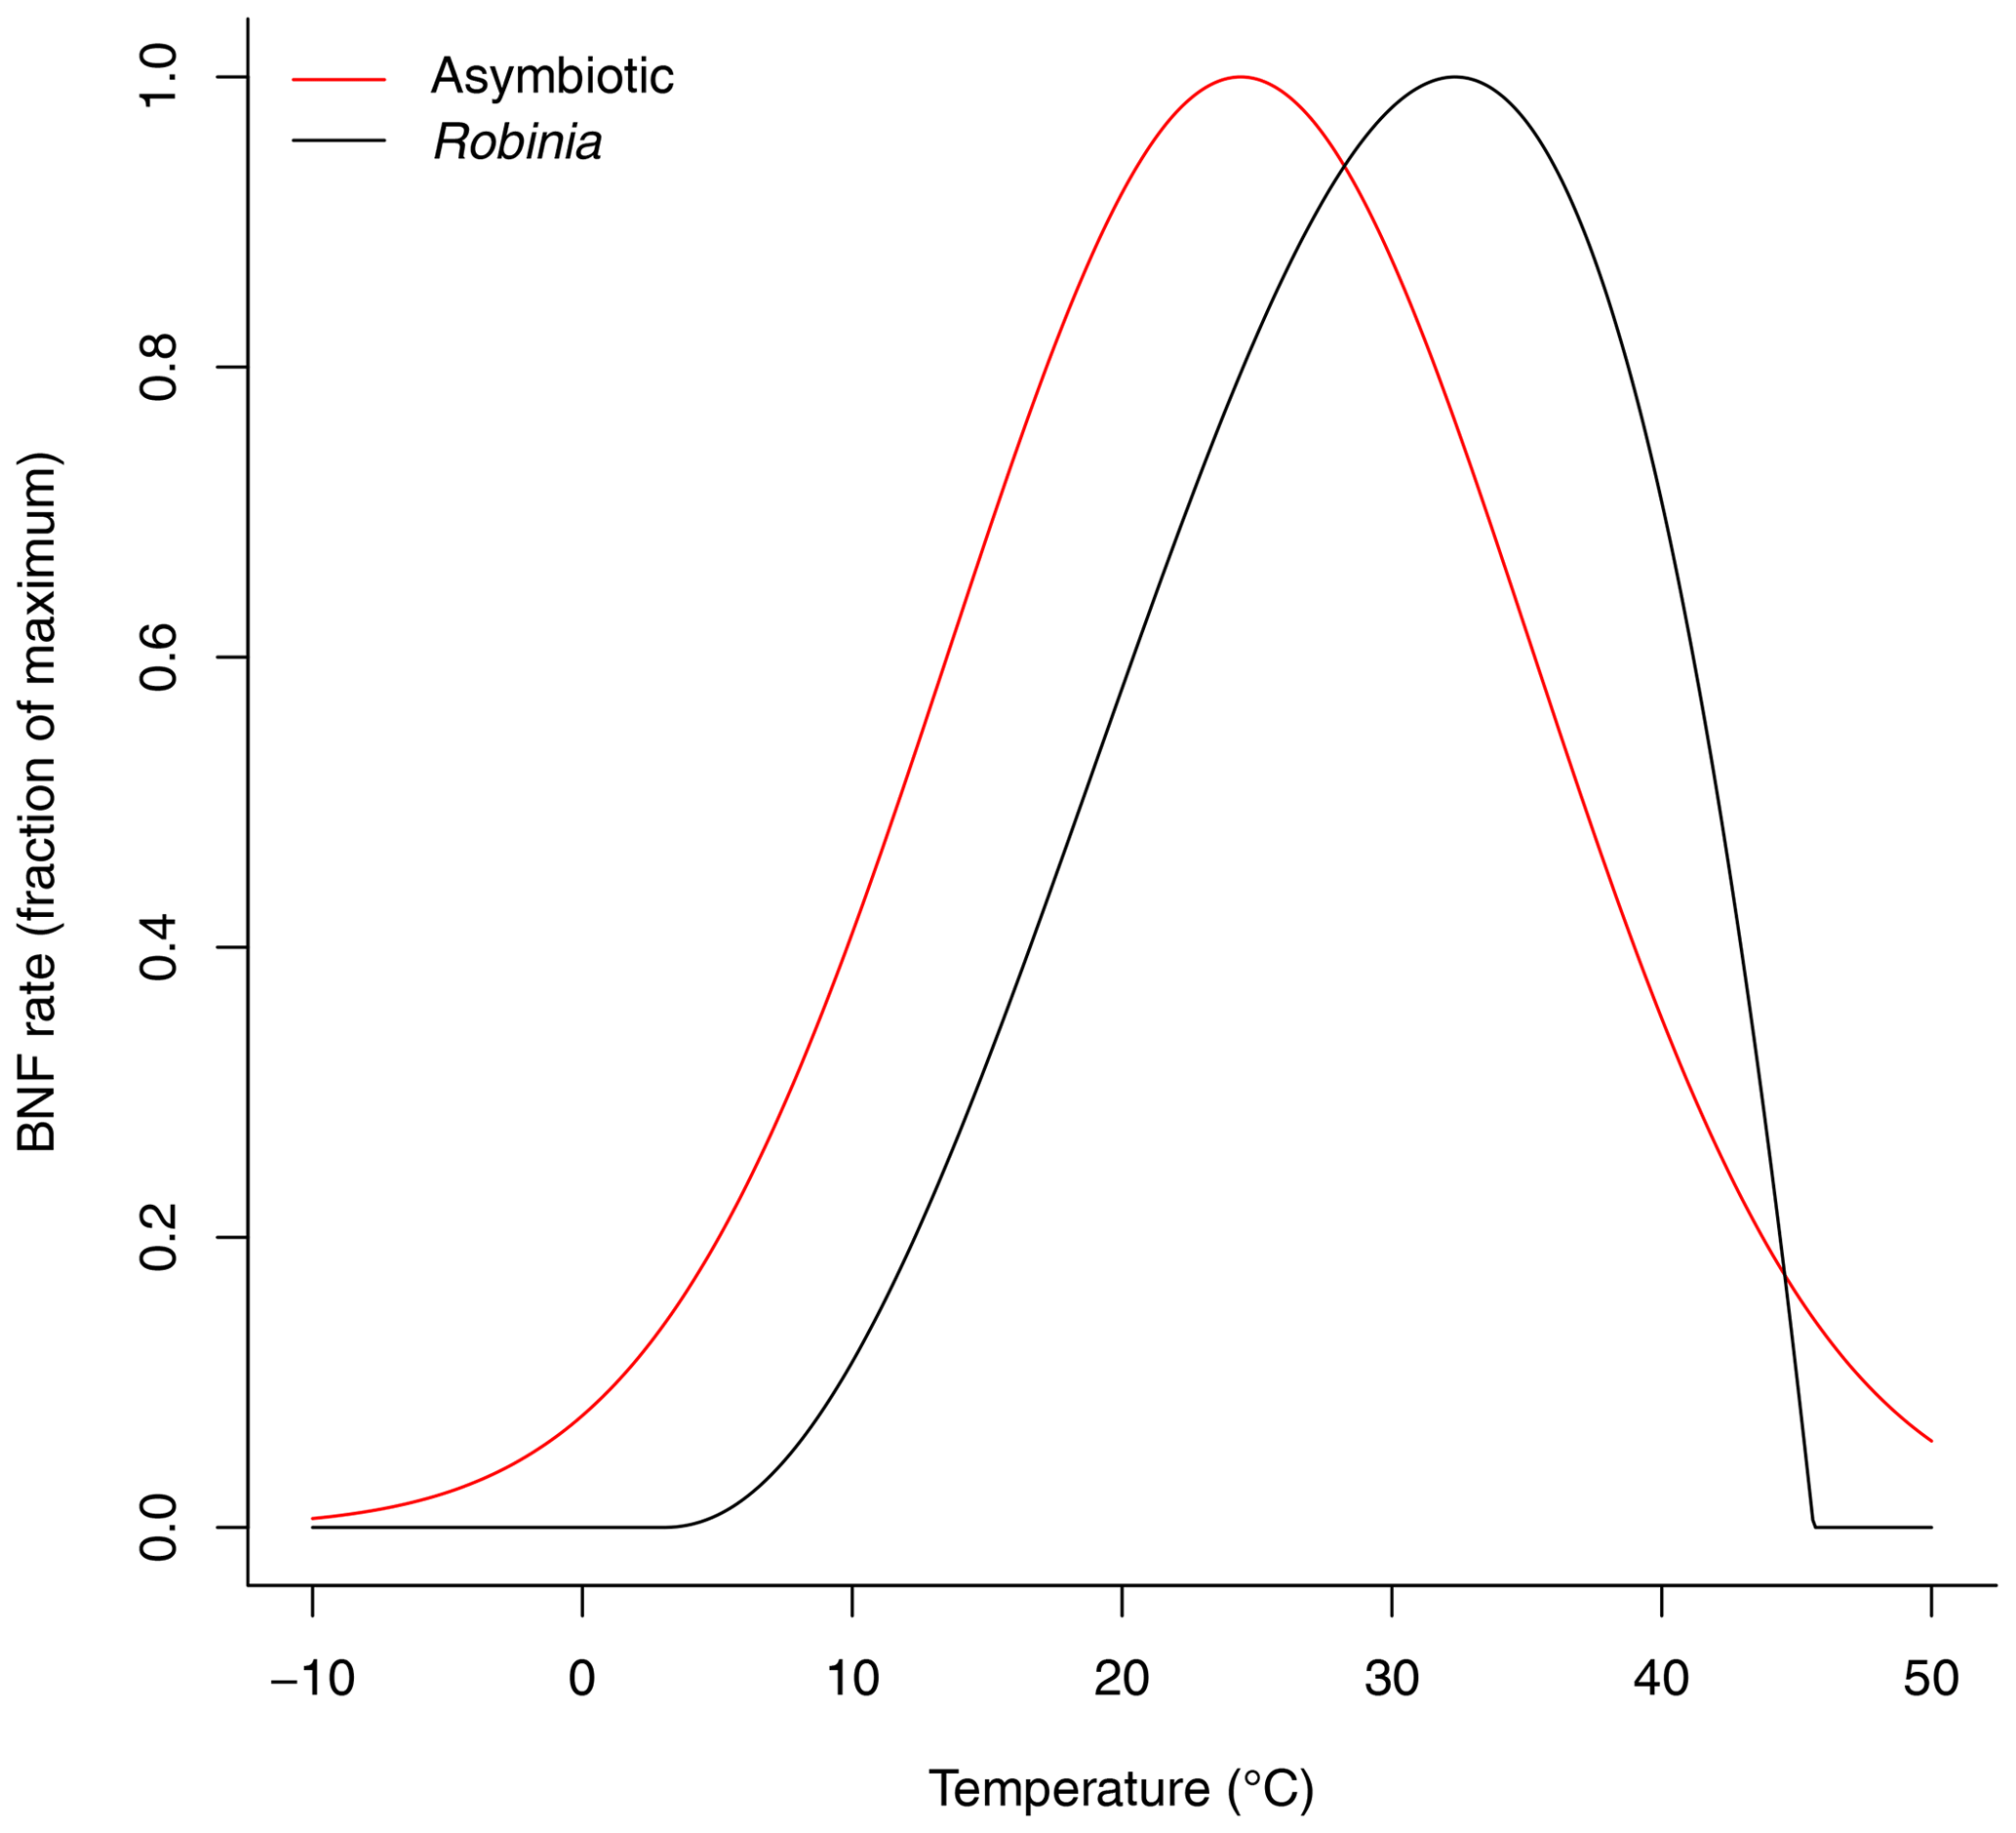
Figure 2Soil temperature dependence function of asymbiotic BNF and symbiotic BNF by Robinia. Asymbiotic BNF reaches its maximum at 24.4 ∘C and is derived from Houlton et al. (2008). Symbiotic BNF by Robinia reaches its maximum at 31.9 ∘C and is derived from Bytnerowicz et al. (2021).
Respiration associated with symbiotic BNF is costNfixNNfix, where costNfix is the C cost of symbiotic BNF per unit N (Eq. A52).
Note that the description of EM is included although both Acer and Robinia associate with AM.
2.3 Asymbiotic BNF
Soil microbes are represented as a single C pool that conducts decomposition, nitrification, denitrification, and asymbiotic BNF. The rates of C and N decomposition, rates of C and N decomposition during denitrification, rates of change of biomass C and N, and maintenance respiration rate of soil microbes follow LM3-SNAP (Eqs. A11–A19). The N surplus or deficit of soil microbes and C and N growth rates of soil microbes are modified to include asymbiotic BNF (Eqs. A22–A24).
The asymbiotic BNF rate of soil microbes in soil layer k (NNfix asymb(k); []) is
where rNfix asymb is a rate constant, CM(k) is the biomass C of soil microbes in soil layer k [kg C m−2], and fa(T(k)) is the soil temperature dependence function.
This function reaches its maximum at 24.4 ∘C (Fig. 2). It is a modified normal distribution function and is derived from the observations compiled by Houlton et al. (2008) with the study of symbiotic BNF removed (Schomberg and Weaver, 1992) and is normalized to a maximum of 1.
2.4 N limitation, plant C allocation to growth, and plant C allocation to rhizosphere priming
The non-structural C pool (NSC; [kg C indiv−1]) gains C from photosynthesis. NSC loses C to respiration and C allocation to growth, symbionts, and root C exudation. The rate of change of NSC (; []) is
where P is the photosynthesis rate [], R is the respiration rate (maintenance and growth) [], GC,l is the growth rate of the leaf C pool (Cl; [kg C indiv−1]) [], GC,r is the growth rate of the fine-root C pool (Cr; [kg C indiv−1]) [], Csw is the growth rate of the sapwood C pool (Csw; [kg C indiv−1]) [], GC,seed is growth rate of the seed C pool (Cseed; [kg C indiv−1]) [], Calloc is the rate of C allocation to symbionts (Eqs. A43–A46), and LC,exudate is the rate of root C exudation (Eq. A38). Note that sapwood is converted to heartwood following Martinez Cano et al. (2020).
The non-structural N pool (NSN; [kg N indiv−1]) gains N from N uptake via roots and symbionts. NSN loses N to N allocation to growth, symbionts, and root N exudation. The rate of change of NSN (; []) is
where U is the N uptake rate via roots and symbionts (Eq. A55) [], C:Nl is the fixed C:N ratio of leaves, C:Nr is the fixed C:N ratio of fine roots, C:Nsw is the fixed C:N ratio of sapwood, C:Nseed is the fixed C:N ratio of seeds, Nalloc is the rate of N allocation to symbionts (Eq. A47), and LN,exudate is the rate of root N exudation (Eq. A39).
Non-N-limited growth is calculated according to Weng et al. (2015) and Martinez Cano et al. (2020). The total allocation of NSC to growth is determined by the target NSC (NSCtarget; [kg C indiv−1]) and minimizes the deviation between NSC and NSCtarget. NSCtarget is a multiple of the target Cl (Cl,target; [kg C indiv−1]), which reflects the ability of a plant to refoliate after defoliation (Hoch et al., 2003; Richardson et al., 2013), and is calculated as
where q is a proportionality constant. The allocation of NSC to the growth of each tissue depends on the total allocation of NSC to growth and the target C pool of each tissue and minimizes the deviation between the C pool of each tissue and the target C pool of each tissue. The target C pool of each tissue is dynamic and is determined by allometry (Eqs. A40–A42), canopy position, and phenology.
In LM4.1-BNF, GC,l, GC,r, GC,sw, and GC,seed are adjusted to include N limitation and are calculated as
where Nstress is N stress [unitless] and Δl, Δr, Δsw, and Δseed are the non-N-limited growth rates of Cl, Cr, Csw, and Cseed respectively [] following Weng et al. (2015) and Martinez Cano et al. (2020). Because plants increase C allocation to fine roots relative to other tissues when N-limited (Poorter et al., 2012), GC,r is not adjusted to include N limitation.
In LM4.1-BNF, Nstress is the relative difference between NSN and NSNtarget and is calculated as
where NSNtarget is the target NSN [kg N indiv−1]. Nstress is smoothed with a low-pass filter over 30 d to reflect the persisting influence of N stress (Mooney et al., 1991). NSNtarget is calculated as
This is similar to LM3-SNAP, which compared the target leaf and root N pools to NSN, but is modified to reflect the treatment of NSCtarget in LM4.1 by including the target sapwood and seed N pools.
Plant turnover decreases Cl, Cr, and Csw and from Nl, Nr, and Nsw at a constant tissue-specific rate. A fraction of the turnover of Cl and Nl is retranslocated into NSC and NSN respectively.
Under N limitation, plants increase root C exudation to stimulate N mineralization in the rhizosphere (rhizosphere priming; Cheng et al., 2014; Finzi et al., 2015). LC,exudate increases with Nstress and is calculated as
where rleakage,C is a rate constant.
Under N limitation, plants decrease root N exudation (Canarini et al., 2019). LN,exudate decreases with Nstress and is calculated as
where rleakage,N is a rate constant.
Under N limitation, plants increase active root uptake of inorganic N (Nacry et al., 2013). The rate of active root uptake of inorganic N in soil layer k (Nactive(k); []) increases with Nstress and is calculated as
where is a function of the pool in soil layer k (NH4(k); [kg N m−2]), the pool in soil layer k (NO3(k); [kg N m−2]), and the rhizosphere volume fraction of soil layer k (frhiz(k); [m3 m−3]) and is given in Eq. (A3).
2.5 Plant C allocation to symbionts (AM, EM, and N-fixing bacteria)
The rate of C allocation to AM (Calloc,AM; []) is
where falloc,AM is the fraction of NSC allocated to AM per unit time. Calloc,AM is not related to Nstress because, although AM increases N uptake, AM is maintained by the plant primarily for phosphorus uptake (Smith and Smith, 2011).
The rate of C allocation to EM (Calloc,EM; []) is
where falloc,EM is the maximum fraction of NSC allocated to EM per unit time. Calloc,EM is a function of Nstress because biomass C of EM increases with N limitation (Phillips et al., 2013).
Plants that associate with N-fixing bacteria can regulate symbiotic BNF to different extents, termed their BNF strategy (Menge et al., 2015). For plants with a perfectly facultative BNF strategy, symbiotic BNF increases with N limitation. For plants with an incomplete BNF strategy, symbiotic BNF increases with N limitation but is maintained at a minimum. For plants with an obligate BNF strategy, symbiotic BNF is constant. For plants with either a facultative or an incomplete BNF strategy, the rate of C allocation by the plant to N-fixing bacteria (Calloc,Nfix; []) is
where falloc,Nfix is the fraction of NSC allocated to N-fixing bacteria per unit time, and is the minimum fraction of NSC allocated to N-fixing bacteria per unit time. For plants with a perfectly facultative BNF strategy , and for plants with an incomplete down-regulator BNF strategy . Robinia has an incomplete down-regulator BNF strategy.
For plants with an obligate BNF strategy, Calloc,Nfix is
Additionally, plants allocate a small quantity of N to symbionts such that symbiont growth can be initiated. The rate of N allocation by the plant to symbionts (Nalloc,j; j=AM, EM, N-fixing bacteria; []) is
where C:Nalloc is the C:N ratio of C and N allocated to symbionts by the plant.
Plant C allocation to symbionts increases biomass C of symbionts, which increases plant N uptake via symbionts (Appendices A1 and A6).
2.6 Dynamic plant C allocation to growth and N uptake
The order of plant C allocation to growth, symbionts, and rhizosphere priming is determined by C limitation relative to N limitation (Cheng et al., 2014; Finzi et al., 2015; Poorter et al., 2012; Treseder, 2004; Zheng et al., 2019). If a plant is more C-limited than N-limited, , the plant allocates C to growth, then to N-fixing bacteria (if associated) and EM (if associated), and then to rhizosphere priming, and finally to AM. If a plant is more N-limited than C-limited, , the plant allocates C to N-fixing bacteria (if associated) and EM (if associated), then to rhizosphere priming, then to growth, and finally to AM.
2.7 Soil N2O and NO emissions
Soil N2O and NO emissions occur during nitrification (aerobic oxidation of with oxygen as an electron acceptor, which produces N2O and NO as by-products) and denitrification (anaerobic oxidation of organic C with as an electron acceptor, which produces N2O as a by-product).
Following LM3V-N (Huang and Gerber, 2015), soil N2O emission rate in soil layer k (N2O(k); []) is
where nit(k) is nitrification rate in soil layer k [] (Eq. A56), HR(k) is heterotrophic respiration in soil layer k [], θ(k) is volumetric soil water content of soil layer k [m3 m−3], θsat is saturation volumetric soil water content, and denit(k) is denitrification rate in soil layer k [] (Eq. A57).
Following LM3V-N (Huang and Gerber, 2015), soil NO emission rate in soil layer k (NO(k); []) is
2.8 Phenomenological representations of BNF (LM4.1-BNFNPP and LM4.1-BNFET)
To compare mechanistic and phenomenological representations of BNF in our first analysis, we developed LM4.1-BNFNPP and LM4.1-BNFET which have phenomenological representations of BNF. In LM4.1-BNFNPP, BNF is represented as a function of NPP in LM4.1-BNF. BNF rate (BNFNPP; [kg N m−2]) is
where NPP is net primary production [], and aNPP and bNPP are constants from Meyerholt et al. (2016).
In LM4.1-BNFET, BNF is represented as a function of ET in LM4.1-BNF. BNF rate (BNFET; [kg N m−2]) is
where ET is evapotranspiration [mm yr−1], and aET and bET are constants from Meyerholt et al. (2016).
BNFNPP and BNFET enter NH4(k) (distributed across all soil layers proportional to thickness). In LM4.1-BNFNPP and LM4.1-BNFET, growth and turnover of symbionts and plant C allocation to symbionts do not occur, and asymbiotic BNF does not occur. All other components of C and N cycling in LM4.1-BNFNPP and LM4.1-BNFET are the same as LM4.1-BNF.
3.1 Numerical experiments description
We ran numerical experiments for the grid cell containing Coweeta Hydrological Laboratory (CHL) in North Carolina, United States (35.05∘ N, 83.45∘ W), which is part of the Long-Term Ecological Research Network and has observations on symbiotic BNF by Robinia (Boring and Swank, 1984).
We ran the LM4.1-BNF spin-up for 1000 years at pre-industrial atmospheric CO2 concentration (284.26 ppm) to allow the soil C and N pools to reach an approximate steady state. Then, we initialized LM4.1-BNF, LM4.1-BNFNPP, and LM4.1-BNFET numerical experiments with seedlings (removed vegetation C and N pools from the LM4.1-BNF spin-up) and the LM4.1-BNF spin-up soil C and N pools. We ran numerical experiments for another 300 years at current atmospheric CO2 concentration (324.53 ppm). See Table D3 for a summary of atmospheric CO2 concentration (Dlugokencky and Tans, 2020; Meinshausen et al., 2017), meteorological forcings (Sheffield et al., 2006), and N deposition rates (Dentener, 2006) used in the spin-up and numerical experiments. We initialized the LM4.1-BNF spin-up with Acer seedlings, and we initialized LM4.1-BNF numerical experiments with both Acer and Robinia seedlings.
Table 2Description of numerical experiments. In the first analysis, we compare mechanistic and phenomenological representations of BNF. In the second analysis, we examine the role of competitive dynamics between N-fixing and non-fixing plants. In the third analysis, we examine the role of asymbiotic BNF. Note that the same six numerical experiments were examined in both the second and third analyses.
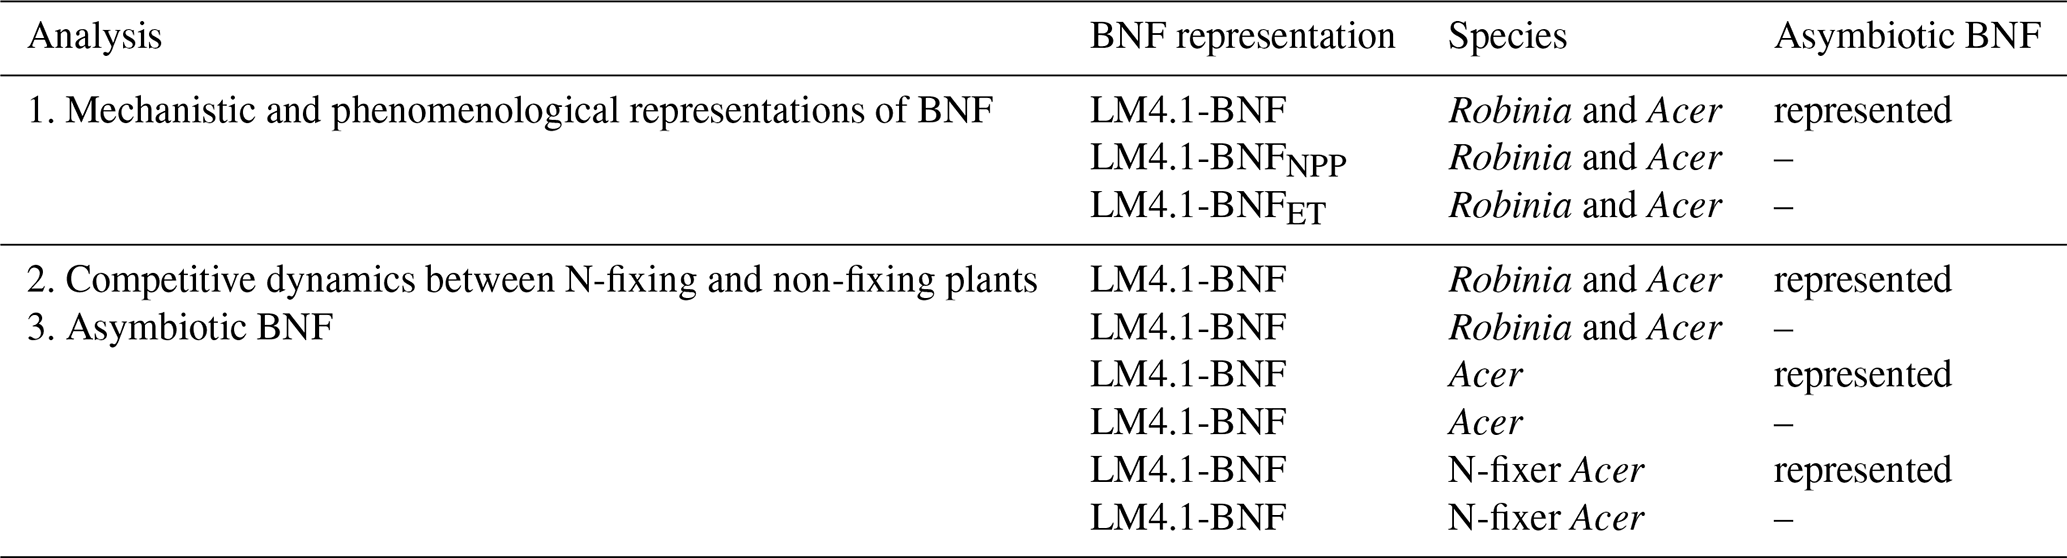
To compare mechanistic and phenomenological representations of BNF in our first analysis (Table 2), we initialized LM4.1-BNFNPP and LM4.1-BNFET numerical experiments with only Acer seedlings. To examine the role of competitive dynamics between N-fixing and non-fixing plants in our second analysis (Table 2), we initialized LM4.1-BNF numerical experiments with both Acer and Robinia seedlings, only Acer seedlings, or only Acer seedlings that can associate with N-fixing bacteria (N-fixer Acer). To examine the role of asymbiotic BNF in our third analysis (Table 2), we initialized LM4.1-BNF numerical experiments with both Acer and Robinia seedlings, only Acer seedlings, or only N-fixer Acer seedlings. LM4.1-BNF, LM4.1-BNFNPP, and LM4.1-BNFET simulations are initialized such that all plant cohorts have the same height (0.5 m; Table D4), and dbh is determined from height by allometry (Eq. A41; Table D4). See Table D4 for a summary of initial density, height, and dbh of seedlings in numerical experiments.
We ran the LM3-SNAP spin-up for 1000 years at pre-industrial atmospheric CO2 concentration to allow the soil C and N pools to reach an approximate steady state. Then, we initialized LM3-SNAP numerical experiments with seedlings and the LM3-SNAP spin-up soil C and N pools. We ran numerical experiments for another 300 years at current atmospheric CO2 concentration. See Table D3 for a summary of atmospheric CO2 concentration, meteorological forcings, and N deposition rates used in the spin-up and numerical experiments. We initialized the LM3-SNAP spin-up and the LM3-SNAP numerical experiments with a temperate deciduous vegetation type.
3.2 Evaluation description
To evaluate the performance of LM4.1-BNF in representing symbiotic BNF, we compared symbiotic BNF rate from the numerical experiments of LM4.1-BNF and LM3-SNAP to site observations from CHL (Fig. 3a; Boring and Swank, 1984). To evaluate the performance of LM4.1-BNF in representing asymbiotic BNF, we compared asymbiotic BNF rate from the numerical experiments of LM4.1-BNF to site observations from CHL (Fig. 3b; Todd et al., 1978). To evaluate the performance of LM4.1-BNF in representing the competitive dynamics between N-fixing and non-fixing plants, we compared the basal area fraction of each vegetation type (Acer and Robinia) over time from the numerical experiments of LM4.1-BNF to US FIA database tree data (Fig. 4; US Forest Service, 2020a).
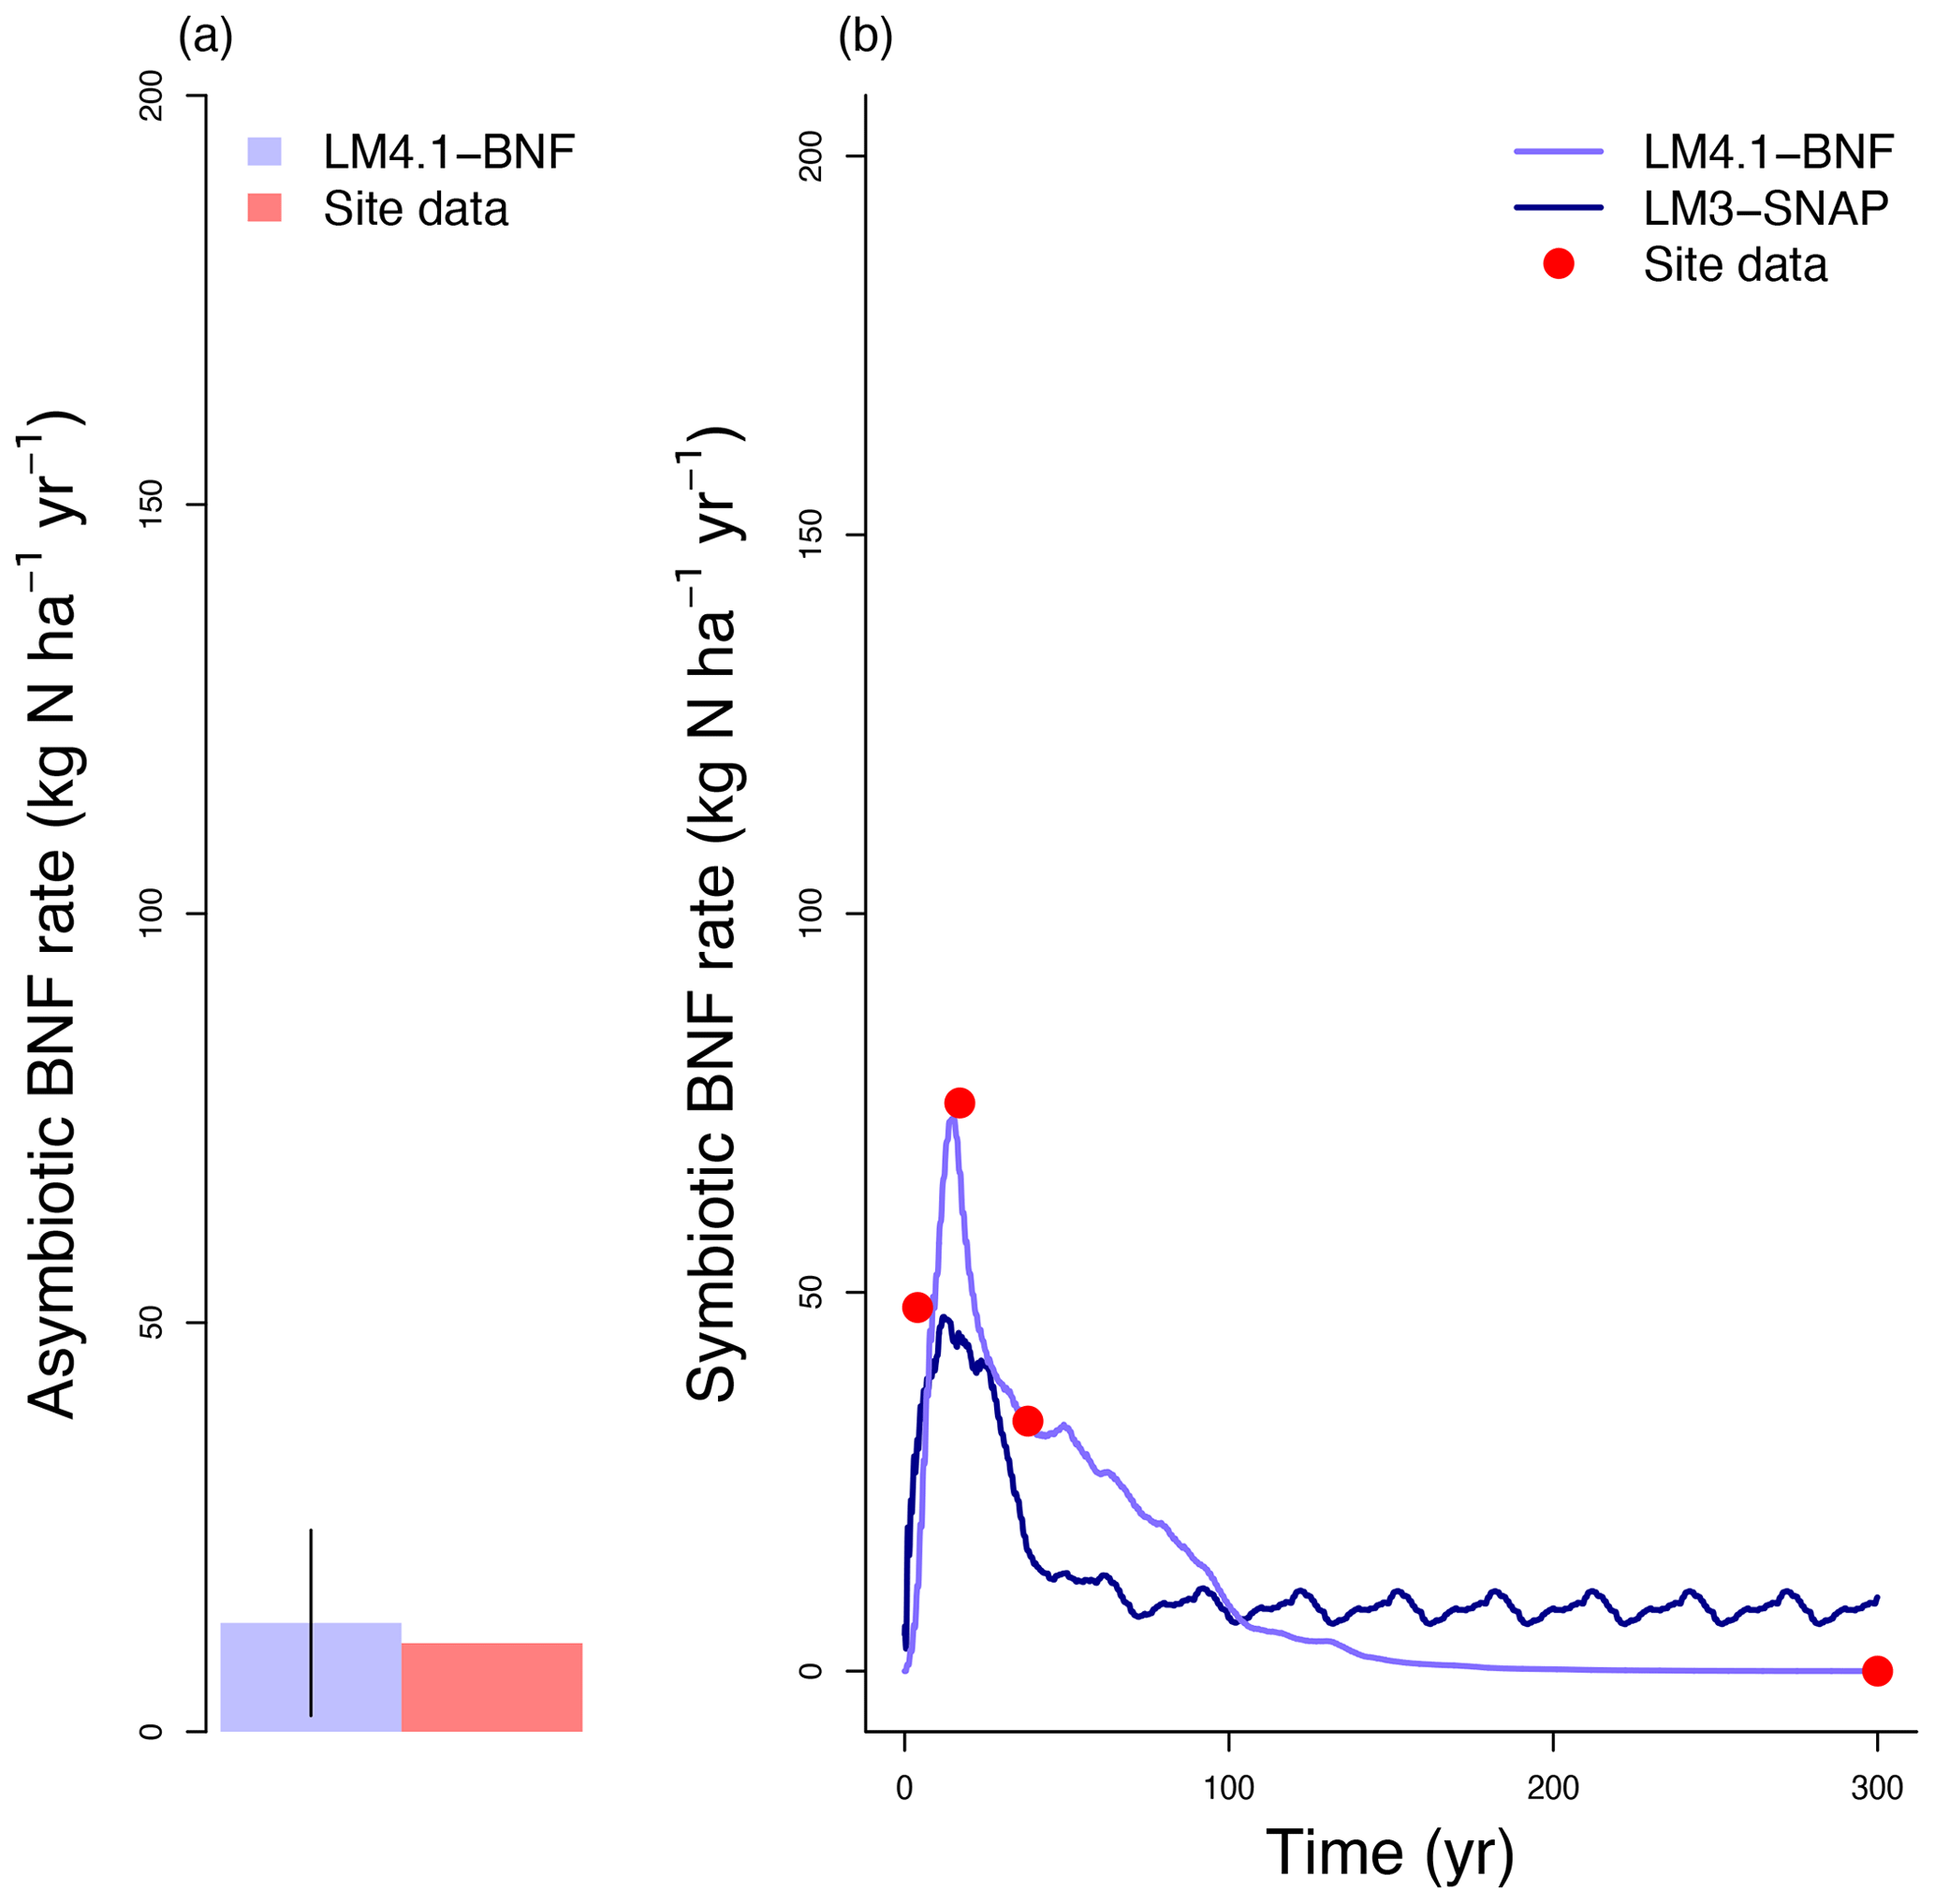
Figure 3Simulated BNF rate by LM4.1-BNF and LM3-SNAP. (a) Simulated asymbiotic BNF rate compared to CHL site data. Simulated data are averaged over the last 100 years of the 300 years of simulation to reflect the site data which are from mature forests. Error bars indicate 2 standard deviations. (b) Simulated symbiotic BNF rate over time compared to CHL site data for a 4, 17, and 38 years and mature forest (plotted at 300 years).
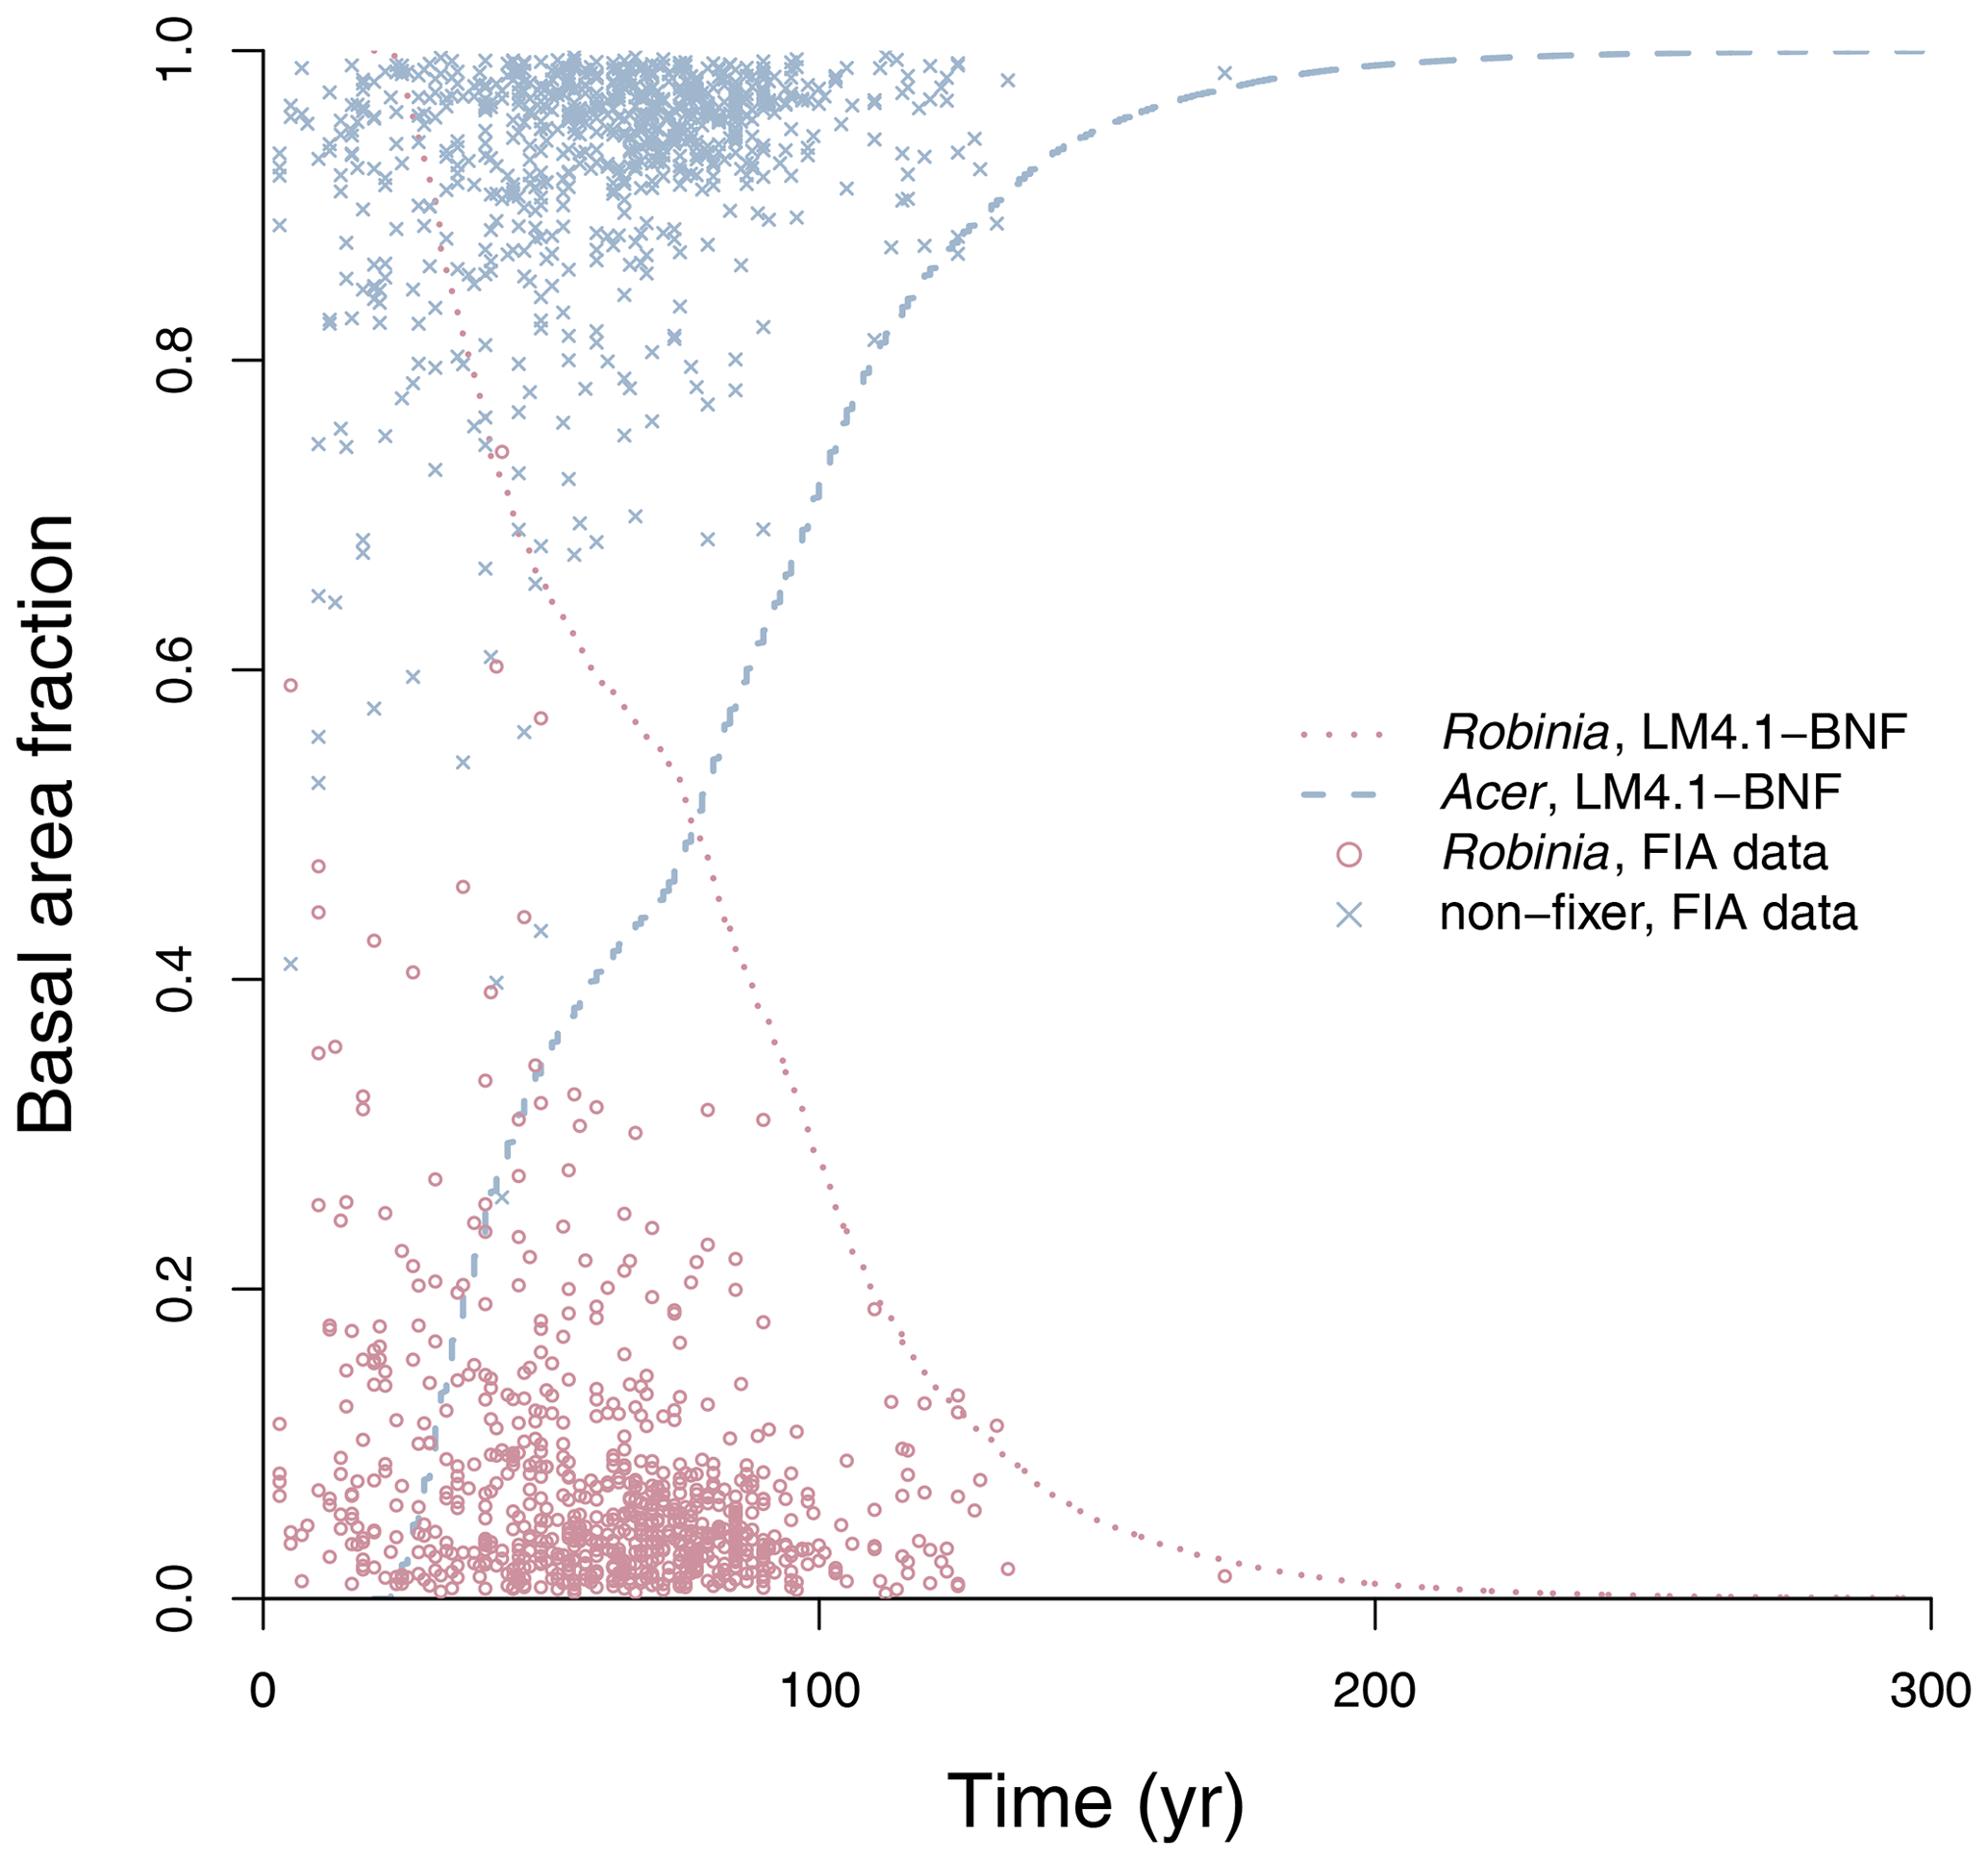
Figure 4Simulated relative basal area of Acer and Robinia over time compared to FIA data (in North Carolina). Simulated data are trees with dbh>12.7 cm to reflect the dbh range of FIA data. FIA data of all non-fixing trees are aggregated to represent Acer. Each point represents an FIA plot. See Fig. D9 for absolute basal area.
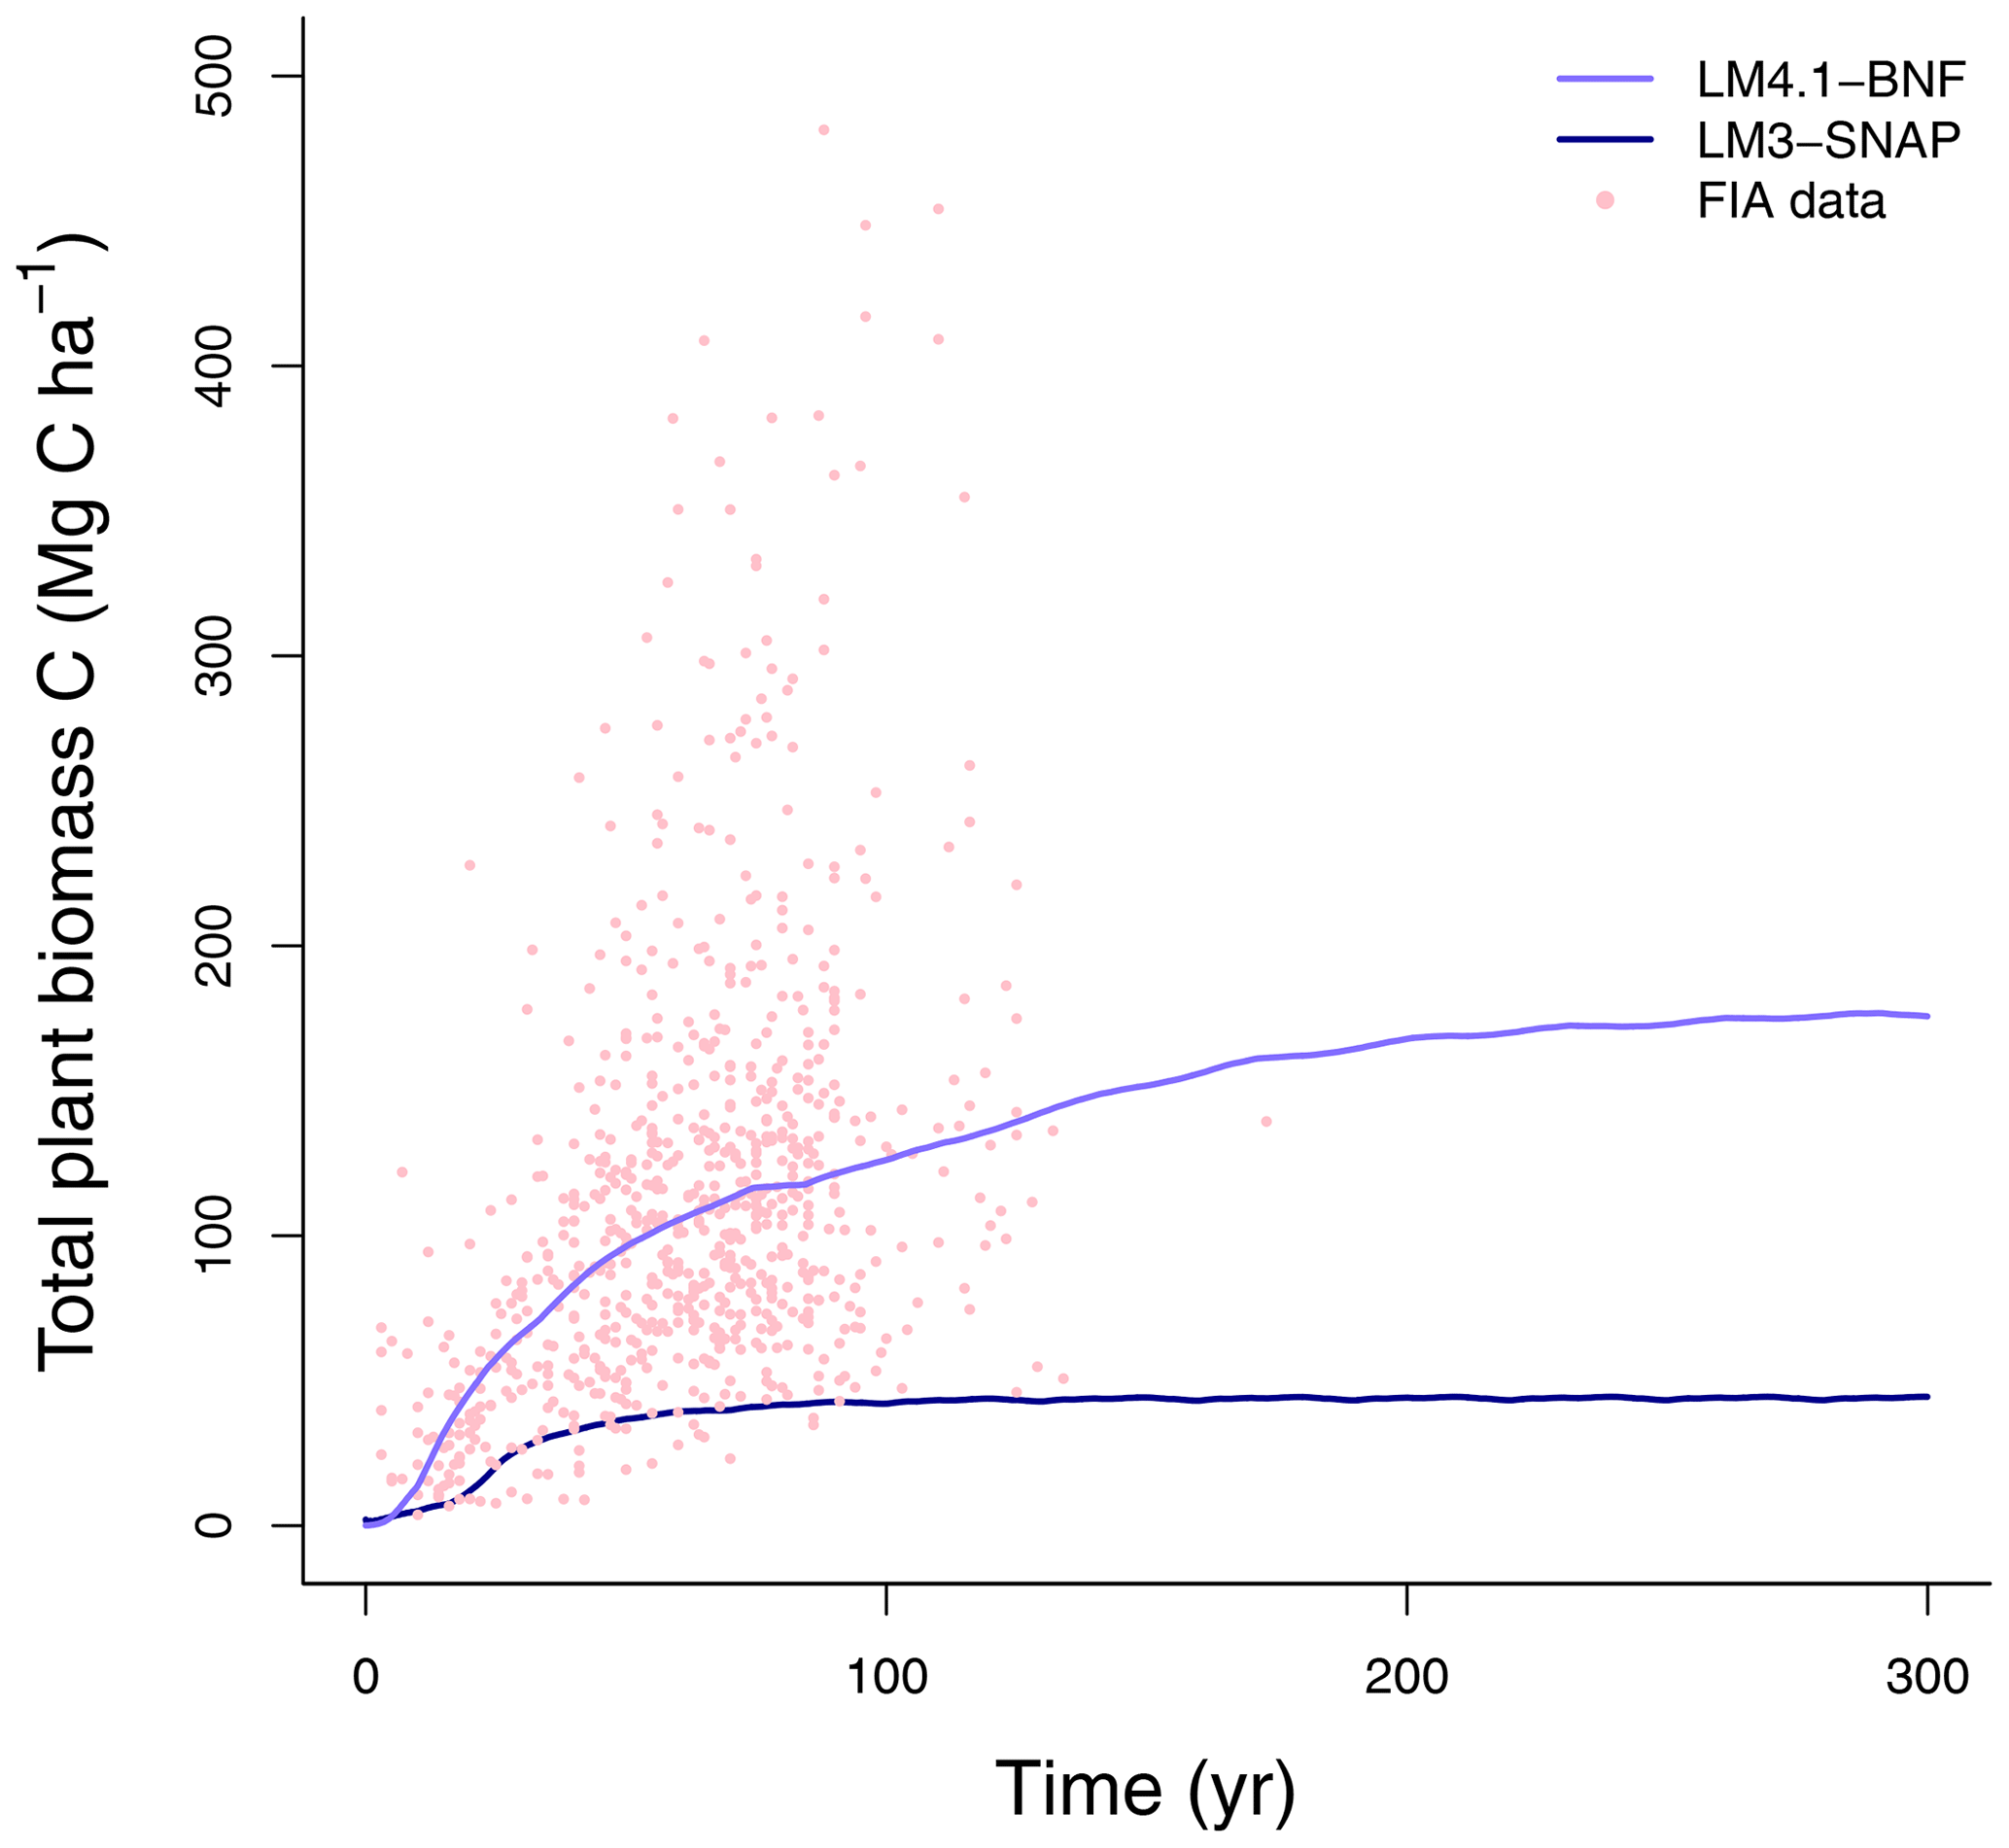
Figure 5Simulated total plant biomass C over time by LM4.1-BNF and LM3-SNAP compared to FIA data (in North Carolina). Each point represents an FIA plot.

Figure 6Simulated soil C and N pools, soil N fluxes, and soil N loss rates by LM4.1-BNF and LM3-SNAP. (a) Simulated total soil C (depth 0–10 cm) compared to FIA data (in North Carolina) and CHL site data. (b) Simulated total soil N (depth 0–10 cm) compared to FIA data (in North Carolina) and CHL site data. (c) Simulated soil and (depth 0–10 cm) compared to CHL site data. (d) Simulated N mineralization rate and net nitrification rate (depth 0–10 cm) compared to CHL site data. (e) Simulated N2O and NO emission rates compared to a meta-analysis estimate for temperate forests and simulated dissolved organic N (DON), , and leaching rate compared to CHL site data. Simulated data are averaged over the last 100 of the 300 years of simulation to reflect the site data which are from mature forests. Error bars indicate 2 standard deviations. NA indicates that LM3-SNAP cannot estimate N2O or NO emissions.
To evaluate the performance of LM4.1-BNF in representing ecosystem C and N pools and fluxes, we (1) compared total plant biomass C from the numerical experiments of LM4.1-BNF and LM3-SNAP to US FIA database tree data (Fig. 5; US Forest Service, 2020a); (2) compared soil C and N pools and fluxes from the numerical experiments of LM4.1-BNF and LM3-SNAP to US FIA database soil data (Fig. 6; US Forest Service, 2020a), site observations from CHL (Fig. 6; Knoepp, 2009a, b, 2018; Swank and Waide, 1988), and a meta-analysis of temperate forests (Fig. 6; Stehfest and Bouwman, 2006); (3) compared ecosystem C fluxes from the numerical experiments of LM4.1-BNF and LM3-SNAP to eddy covariance observations from CHL at the hourly timescale (Fig. 7; Oishi, 2020); and (4) compared ecosystem C fluxes from the numerical experiments of LM4.1-BNF and LM3-SNAP to a meta-analysis of temperate forests (Fig. 8; Anderson-Teixeira et al., 2018). We also compared dbh growth rates and the dbh distribution from the numerical experiments of LM4.1-BNF to US FIA database tree data (Figs. D1 and D2; US Forest Service, 2020a). See Appendix B for data availability and processing. See Table D5 for a summary of the validated variables and data sources.
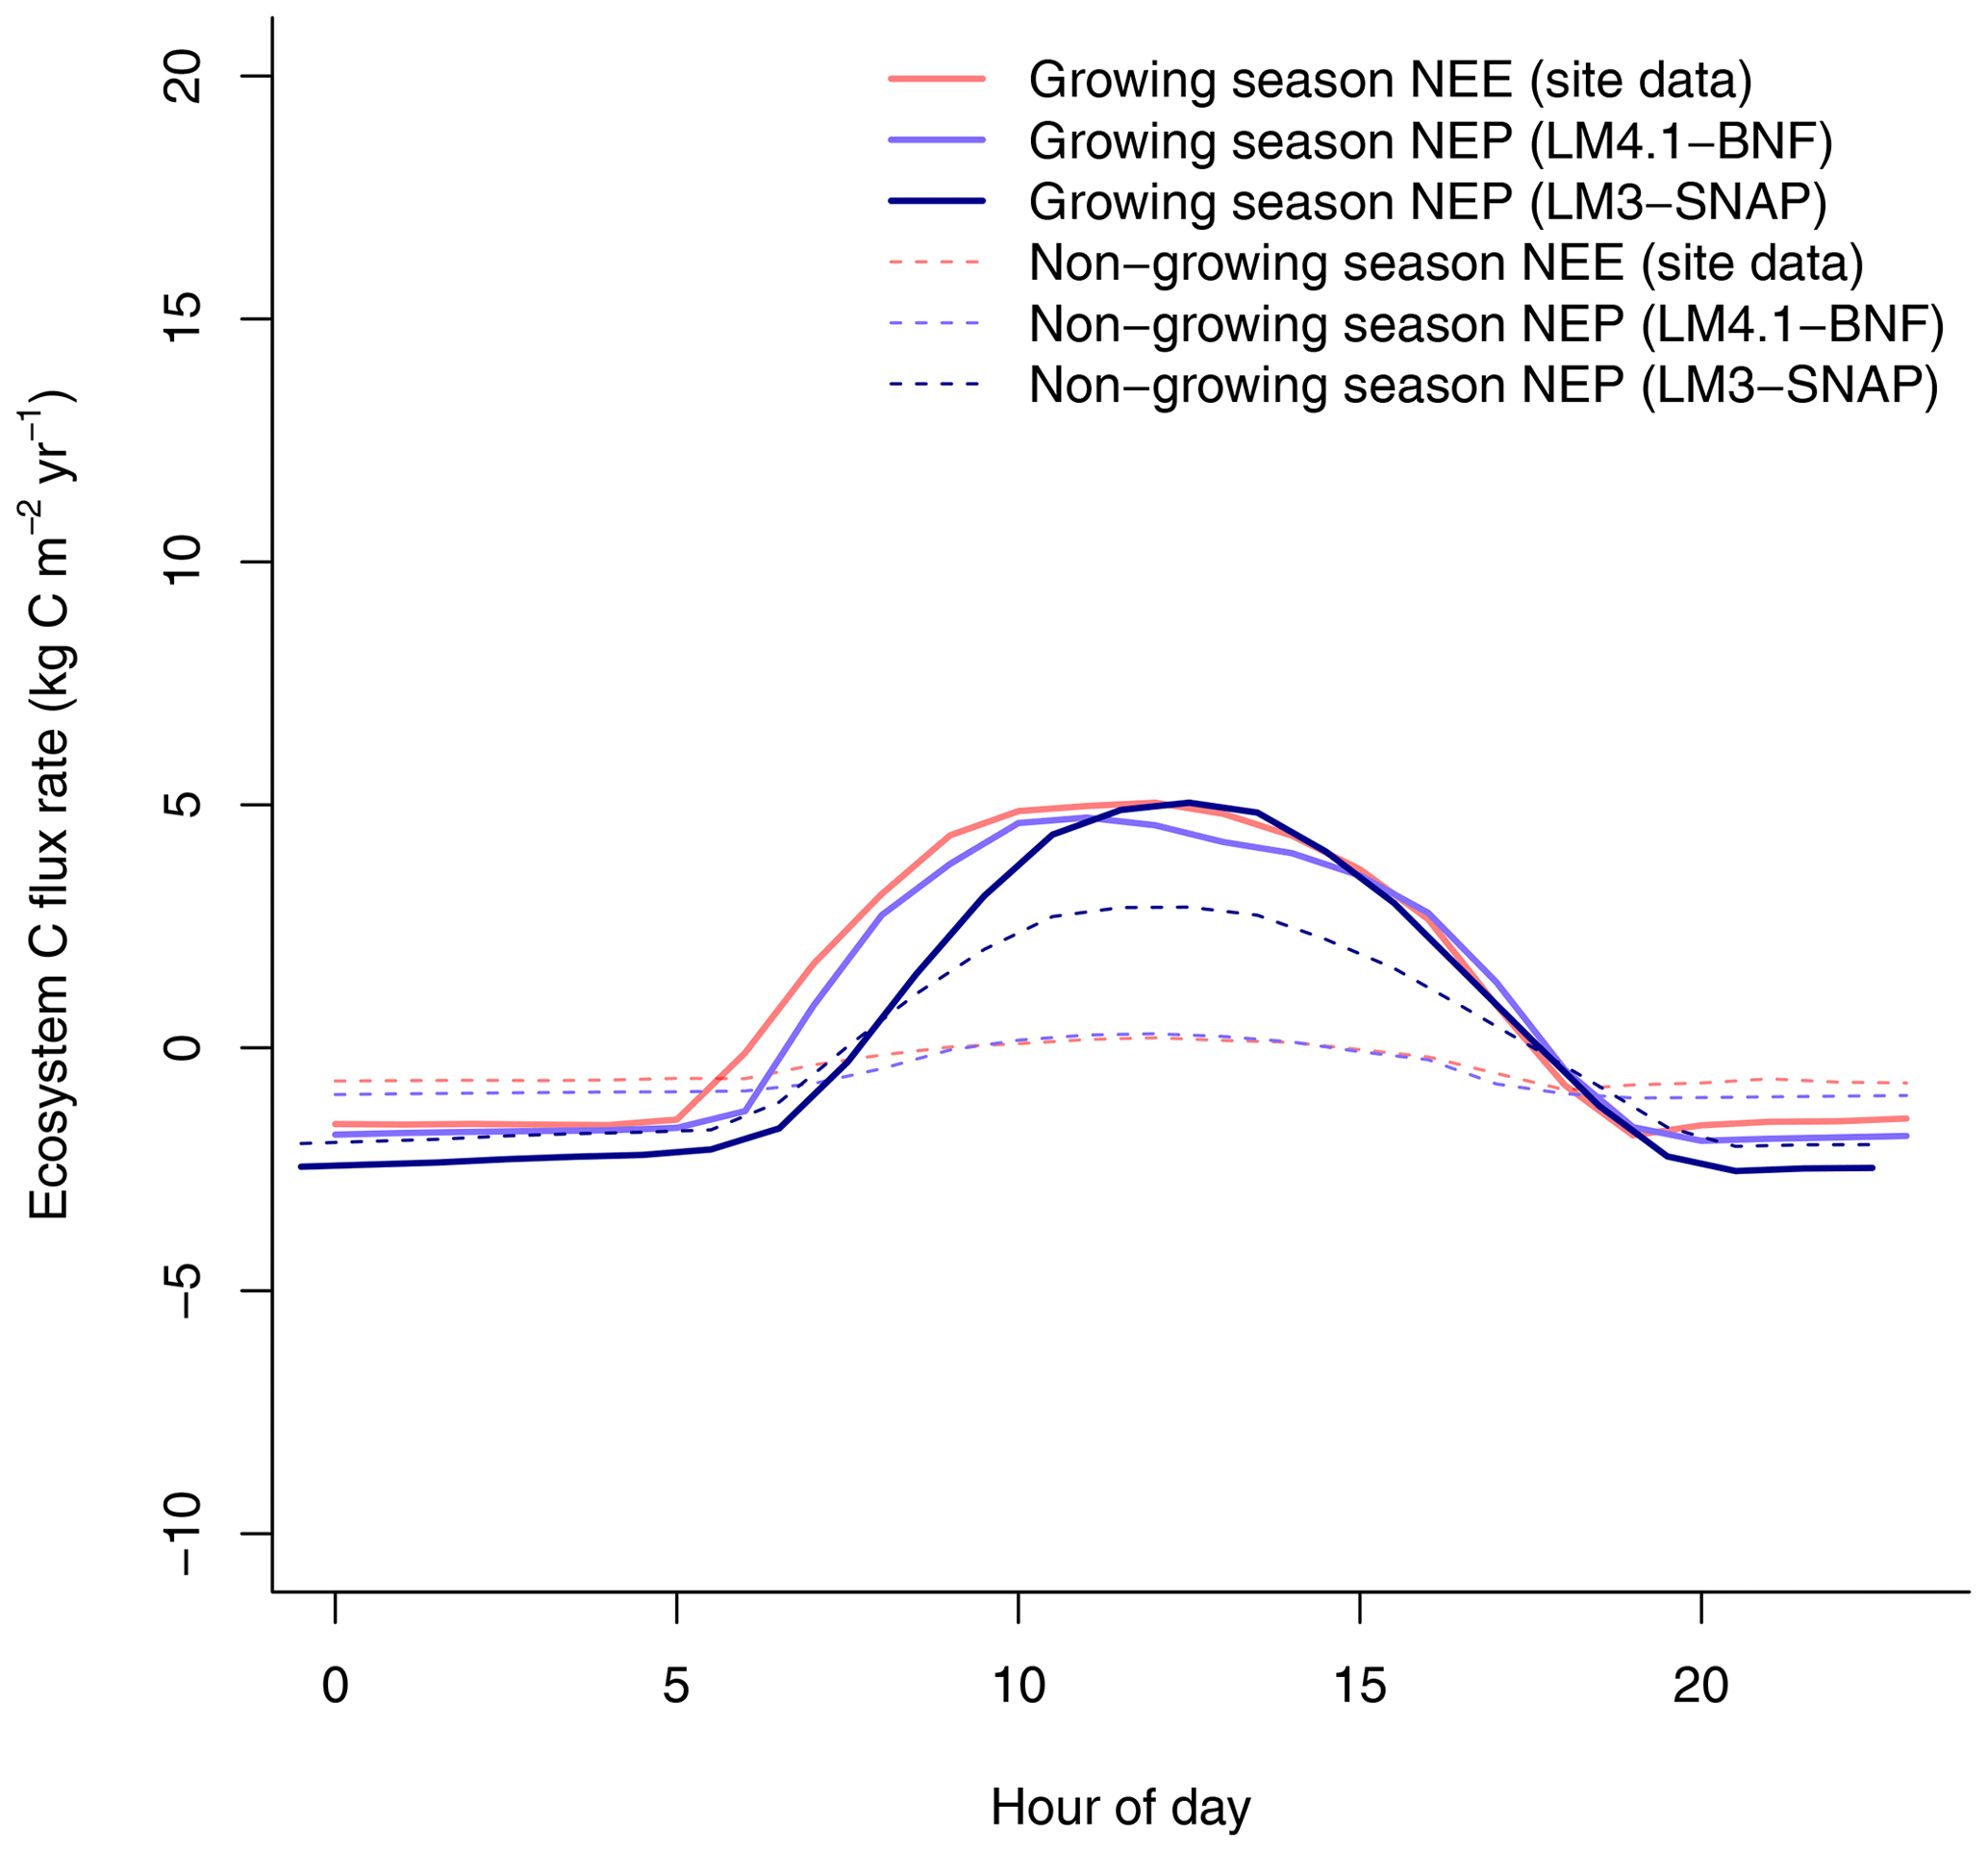
Figure 7Simulated net ecosystem production (NEP) by LM4.1-BNF and LM3-SNAP compared to net ecosystem exchange (NEE) CHL site data at the hourly timescale. Simulated data are averaged over the last 100 of the 300 years of simulation to reflect the data which are from mature forests.
4.1 Evaluation results
Here we describe the evaluation of LM4.1-BNF, in which we compare LM4.1-BNF simulations to observations and to LM3-SNAP simulations (which represents a single general plant C pool capable of BNF and cannot represent community dynamics (i.e., competitive dynamics between N-fixing and non-fixing plants) and does not represent asymbiotic BNF). LM4.1-BNF captures observed symbiotic BNF, asymbiotic BNF, successional dynamics, and the major pools and fluxes of C and N.
LM4.1-BNF effectively reproduces asymbiotic BNF rate (mean 13 over the final 100 years), which is not represented in LM3-SNAP (Fig. 3a), in comparison to observations from CHL (11 ). LM4.1-BNF effectively reproduces the temporal dynamics of symbiotic BNF rate: LM4.1-BNF simulates a symbiotic BNF rate pulse in early succession that reaches 73 at 15 years and then declines to ∼0 at 300 years (Fig. 3b). LM3-SNAP simulates high symbiotic BNF rate in late succession (mean 8 over the final 100 years; Fig. 3b). Observations from CHL suggest that symbiotic BNF which reaches 75 at 17 years then declines to ∼0 in late successional forests. Note that asymbiotic BNF is directly controlled by soil microbe biomass C (Eq. 3) and peripherally controlled by soil microbe biomass N, total soil C, and total soil N (Fig. D3), and symbiotic BNF is directly controlled by nodule biomass C (Eq. 1) and peripherally controlled by non-structural C and N stress (Fig. D4).
LM4.1-BNF effectively reproduces the successional dynamics of Robinia and Acer (Fig. 4): Robinia is competitively excluded by Acer at approximately the same timescale as observations (∼5 % basal area fraction at 150 years).
At the ecosystem scale, LM4.1-BNF effectively reproduces the temporal dynamics of total plant biomass C in comparison to observations (mean 173 vs. 160 Mg C ha−1 over the final 100 years; Fig. 5), whereas LM3-SNAP substantially underestimates total plant biomass C in comparison to observations (mean 44 vs. 160 Mg C ha−1 over the final 100 years; Fig. 5). LM4.1-BNF makes reasonable estimates for soil C and N pools and fluxes, which are comparable to those of LM3-SNAP. LM4.1-BNF underestimates total soil C and N (mean 13.4 vs. 33.0 Mg C ha−1 and 0.2 vs. 1.8 Mg N ha−1 respectively; Fig. 6a and b) and overestimates soil and (mean 4.7 vs. 1.0 and 1.6 vs. 0.1 kg N ha−1 respectively; Fig. 6c) in comparison to observations. LM4.1-BNF underestimates N mineralization rate and net nitrification rate in comparison to observations (mean 14.9 vs. 39.5 and 7.2 vs. 12.8 respectively; Fig. 6d). LM4.1-BNF overestimates N2O emission rate (mean 5.1 vs. 0.9 ) and underestimates NO emission rate (mean 0.2 vs. 0.8 ; Fig. 6e) in comparison to observations. Note that LM3-SNAP cannot simulate N2O and NO emission rates. LM4.1-BNF underestimates dissolved organic N (DON) leaching rate (mean ∼0 vs. 0.6 ) and leaching rate (mean ∼0 vs. 0.05 ) in comparison to observations and reasonably estimates leaching rate (mean 0.1 vs. 0.1 ; Fig. 6e) in comparison to observations. LM3-SNAP substantially overestimates leaching rate in comparison to observations (mean 8.3 vs. 0.1 ; Fig. 6e).
Finally, LM4.1-BNF makes reasonable estimates for ecosystem C fluxes, particularly in comparison to LM3-SNAP. LM4.1-BNF effectively reproduces net ecosystem production (NEP) in both the growing and non-growing seasons at the hourly timescale, especially in comparison to LM3-SNAP, which overestimates NEP in the non-growing season (Fig. 7). LM4.1-BNF effectively reproduces gross primary production (GPP) and NPP, especially in comparison to LM3-SNAP, which substantially overestimates both GPP and NPP (Fig. 8). LM4.1-BNF overestimates GPP and NPP in comparison to observations (mean 15.4 vs. 13.1 and 8.1 vs. 7.5 respectively). LM4.1-BNF overestimates HR (mean 7.5 vs. 4.7 ) and consequentially underestimates net ecosystem production (NEP) (mean 0.6 vs. 4.8 ) in comparison to observations.

Figure 8Simulated gross primary production (GPP), net primary production (NPP), heterotrophic respiration (HR), and net ecosystem production (NEP) by LM4.1-BNF and LM3-SNAP compared to the ForC database. Simulated data are averaged over the last 100 of the 300 years of simulation to reflect the data which are from mature forests. Error bars indicate 2 standard deviations.
4.2 Evaluation discussion
LM4.1-BNF effectively reproduces asymbiotic BNF and symbiotic BNF, i.e., its peak in early succession followed by its decline to zero in late succession (Fig. 3). In LM3-SNAP, asymbiotic BNF is not represented, and symbiotic BNF is sustained in late succession (Fig. 3). This occurs because there is no competitive exclusion of N-fixing plants by non-fixing plants in LM3-SNAP, which represents a single general plant C pool capable of BNF and cannot represent community dynamics (Fig. 4). In observed ecosystems, N-fixing plants are competitively excluded by non-fixing plants due to weak N limitation of plant growth in late succession (Menge et al., 2010; Sheffer et al., 2015), and symbiotic BNF is effectively zero (Boring and Swank, 1984).
This overestimation of symbiotic BNF in late succession by LM3-SNAP causes several problems. First, LM3-SNAP simulates lower total plant biomass C than LM4.1-BNF (mean 44 vs. 173 Mg C ha−1 over the final 100 years; Fig. 5) because of the sustained high C cost of symbiotic BNF. Second, LM3-SNAP overestimates N losses in comparison to LM4.1-BNF, especially leaching rate (mean 8.3 vs. 0.1 over the final 100 years; Fig. 6). Accurately estimating N leaching rates is important given its downstream consequences such as eutrophication and acidification (Fowler et al., 2013; Tian and Niu, 2015).
Here we describe the three analyses we conducted to identify LM4.1-BNF improvements to estimating major C and N pools and fluxes. First, we compare LM4.1-BNF to LM4.1-BNF with BNF represented as a function of NPP (LM4.1-BNFNPP) and LM4.1-BNF with BNF represented as a function of ET (LM4.1-BNFET) to compare mechanistic and phenomenological representations of BNF. Second, we compare LM4.1-BNF simulations with both Robinia and Acer to LM4.1-BNF simulations with only Acer and LM4.1-BNF simulations with only Acer that can associate with N-fixing bacteria (hereafter, N-fixer Acer) to examine the role of competitive dynamics between N-fixing and non-fixing plants. Third, we compare LM4.1-BNF simulations with asymbiotic BNF to LM4.1-BNF simulations without asymbiotic BNF to examine the role of asymbiotic BNF.
5.1 Mechanistic and phenomenological representations of BNF
In our first analysis (Table 2), we compare mechanistic and phenomenological representations of BNF, and their implications for C and N cycling. LM4.1-BNF, LM4.1-BNFNPP, and LM4.1-BNFET simulations estimate different total plant biomass C (Fig. 9a). LM4.1-BNF predicts the largest total plant biomass C (mean 170 Mg C ha−1 over the final 100 years), followed by LM4.1-BNFET (mean 70 Mg C ha−1 over the final 100 years) and LM4.1-BNFNPP (mean 0 Mg C ha−1 over the final 100 years). This is because, in LM4.1-BNF, BNF responds dynamically to strong N limitation of plant growth in early succession and BNF (mean 36 over the initial 100 years) supports total plant biomass C accumulation. Conversely, in LM4.1-BNFNPP and LM4.1-BNFET, BNF does not respond dynamically to strong N limitation of plant growth in early succession, and BNF is not sufficient (mean 22 and ∼0 over the initial 100 years for LM4.1-BNFET and LM4.1-BNFNPP respectively) to support total plant biomass C accumulation (Fig. 9b). As such, LM4.1-BNF effectively reproduces the temporal dynamics of symbiotic BNF rate, whereas LM4.1-BNFET and LM4.1-BNFNPP predicted relatively constant symbiotic BNF rates. In observed ecosystems, strong N limitation of plant growth occurs in early succession. N-fixing trees are generally important pioneer species and can relieve strong N limitation of plant growth in early succession (Chapin III et al., 1994; Cierjacks et al., 2013; Menge et al., 2010). Consequently, symbiotic BNF is highest in early succession (Batterman et al., 2013; Boring and Swank, 1984; Menge and Hedin, 2009; Sullivan et al., 2014). Simulated soil C and N pools, soil N fluxes, soil N loss rates, and ecosystem C fluxes are relatively similar between simulations and are displayed in Figs. D5 and D6.
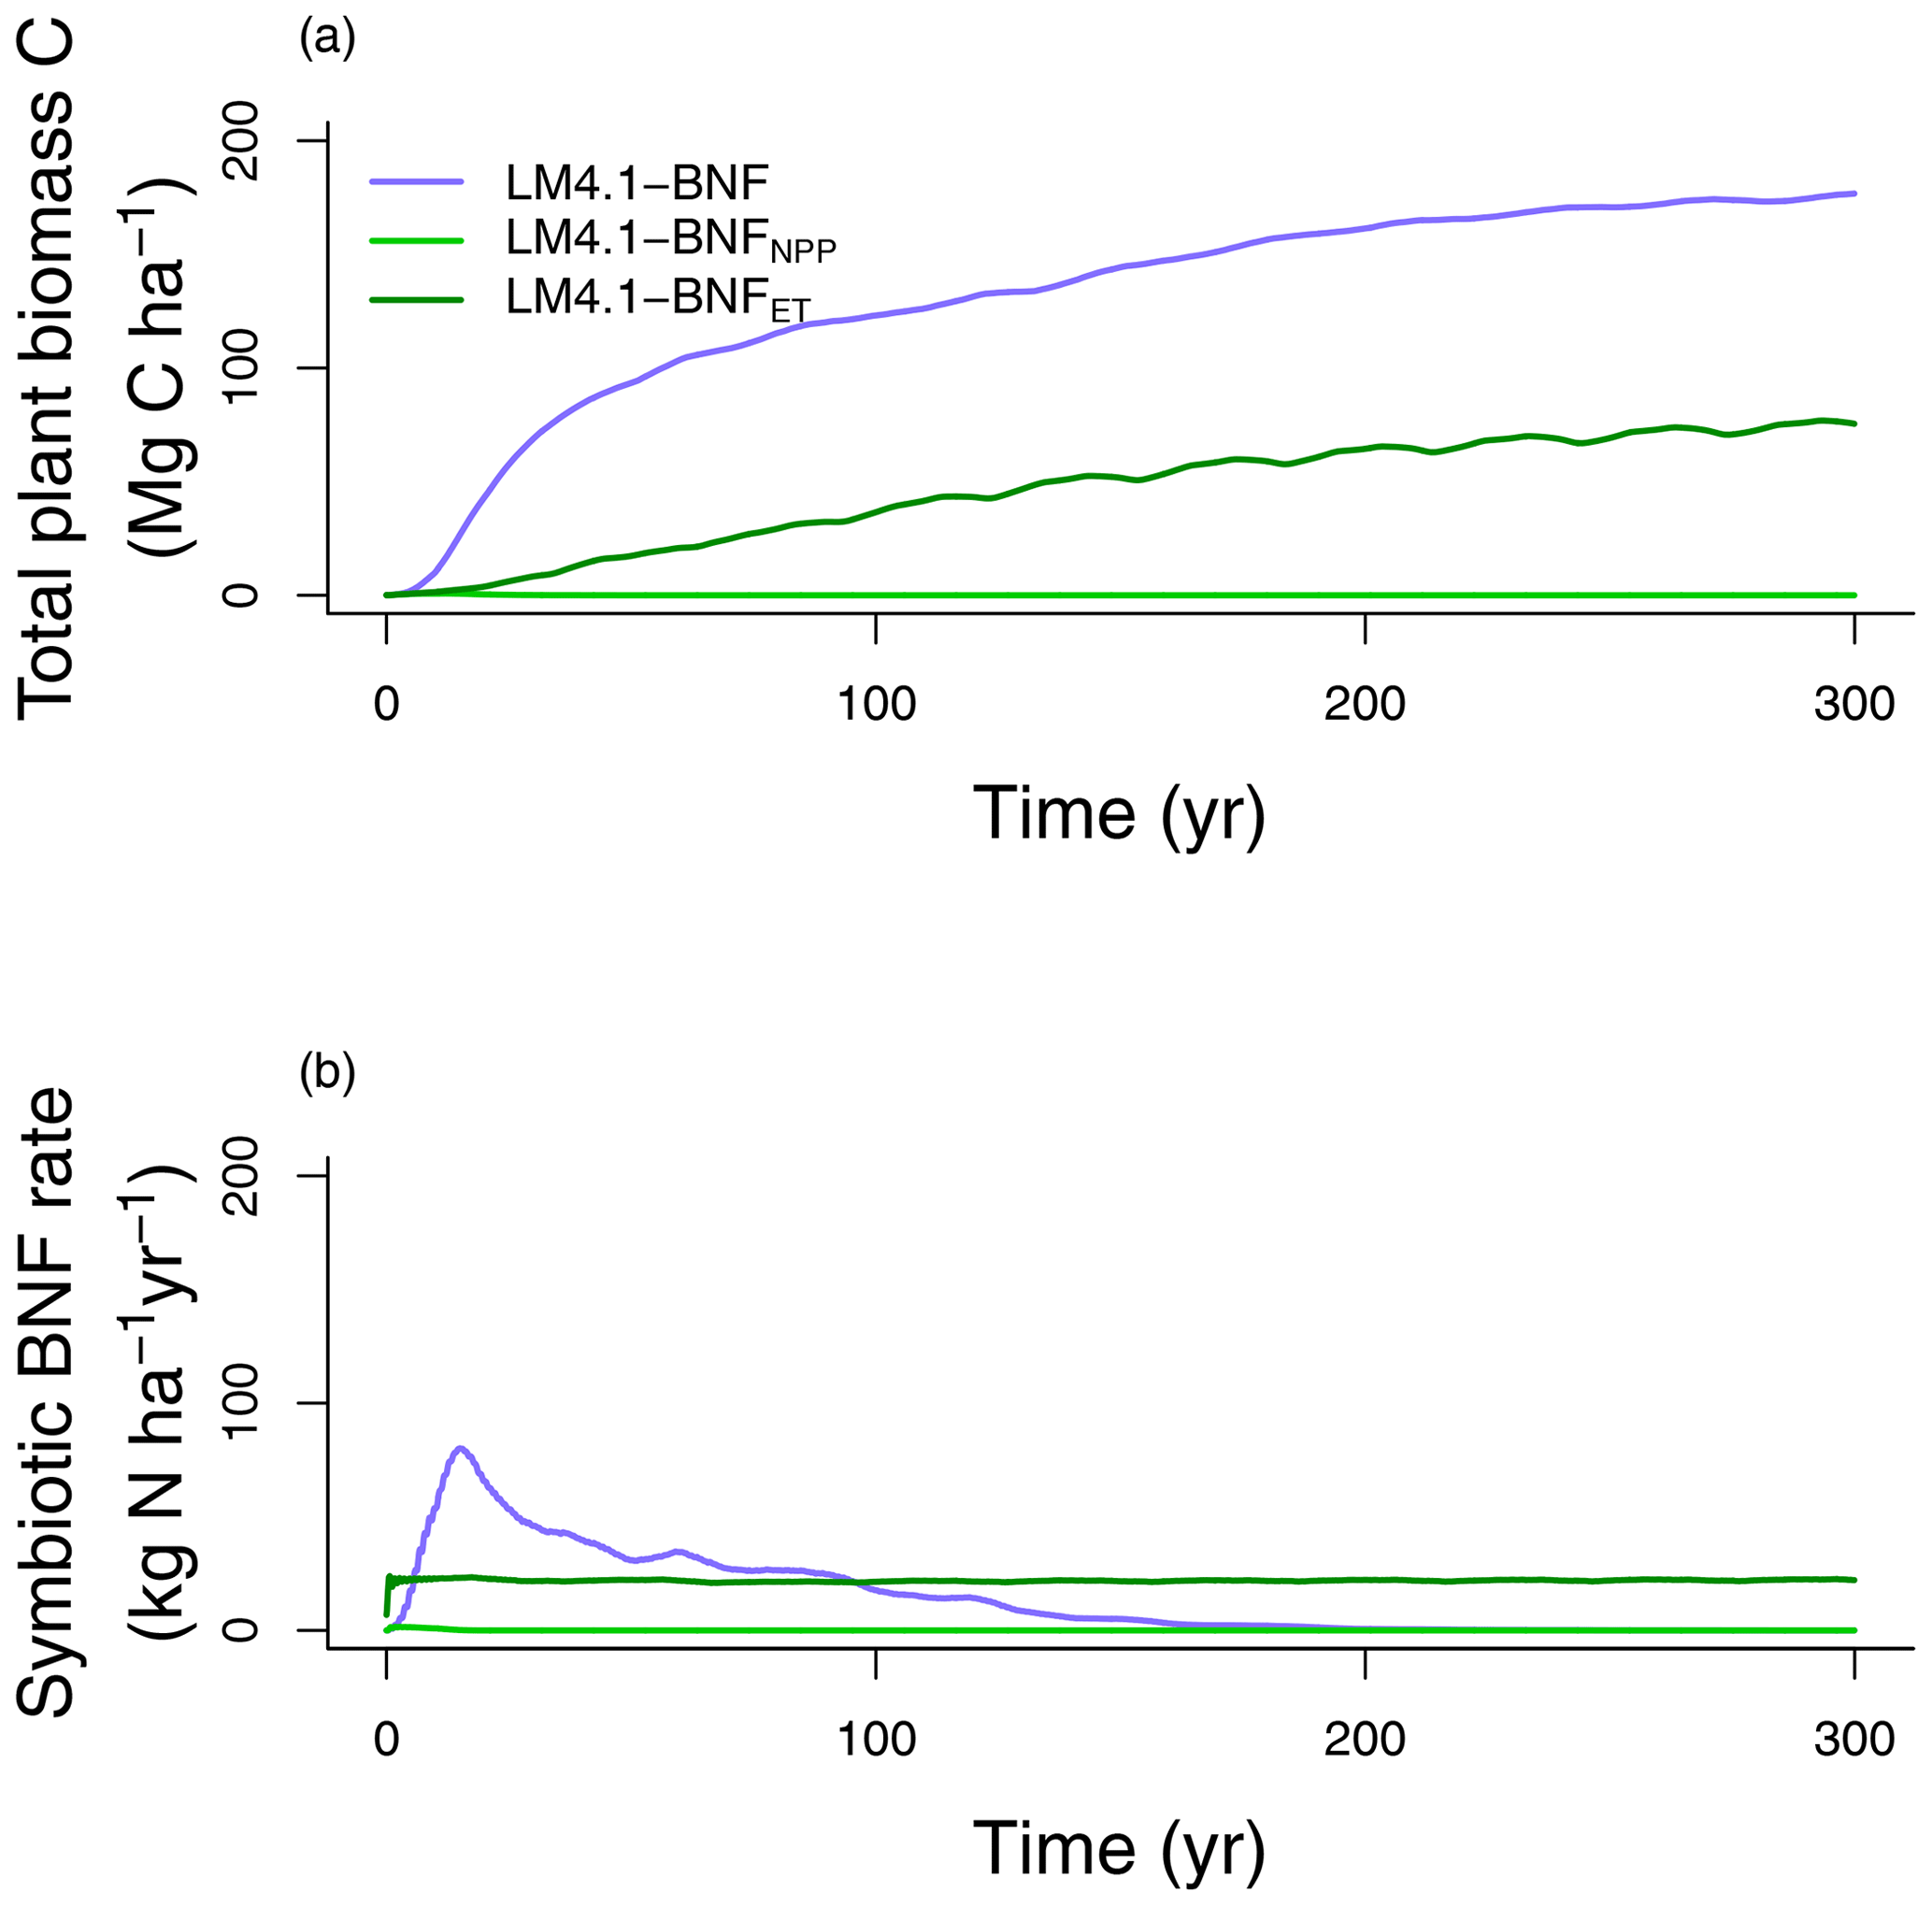
Figure 9Simulated (a) total plant biomass C and (b) symbiotic BNF rate over time from LM4.1-BNF, LM4.1-BNFNPP, and LM4.1-BNFET.
A similar result was found by Meyerholt et al. (2020), who compared five alternative representations of BNF within the O–CN model, including a BNF representation based on NPP, a BNF representation based on ET, and a BNF representation responding dynamically to N limitation of plant growth. As with our results, they found that the BNF representation responding dynamically to N limitation of plant growth predicted the largest total plant biomass C. However, their study did not compare these results to simulations that include competitive dynamics between N-fixing and non-fixing plants because O–CN represents a single general plant C pool capable of BNF and cannot represent community dynamics.
5.2 Competitive dynamics between N-fixing and non-fixing plants
In our second analysis (Table 2), we examine the role of competitive dynamics between N-fixing and non-fixing plants and its implication for C and N cycling. LM4.1-BNF simulations initialized with only Acer seedlings accumulate total plant biomass C slower than LM4.1-BNF simulations initialized with both Robinia and Acer seedlings (mean 48.6 vs. 80.9 Mg C ha−1 over the initial 100 years respectively; Fig. 10a). In LM4.1-BNF simulations initialized with only Acer seedlings, stronger N limitation of plant growth in early succession due to the absence of a N-fixer vegetation type slows total plant biomass C accumulation. Nevertheless, total plant biomass C accumulates due to asymbiotic BNF and high N deposition at CHL (13.9 ), reaching a similar level to LM4.1-BNF simulations initialized with both Robinia and Acer seedlings after 100 years.

Figure 10Simulated (a) total plant biomass C and (b) symbiotic BNF rate over time from LM4.1-BNF initialized with both Robinia and Acer, only Acer, and only N-fixer Acer, with and without asymbiotic BNF. aBNF indicates asymbiotic BNF.
LM4.1-BNF simulations initialized with only N-fixer Acer seedlings accumulate total plant biomass C similarly to LM4.1-BNF simulations initialized with both Robinia and Acer seedlings (mean 86.2 vs. 80.9 Mg C ha−1 over the initial 100 years respectively; Fig. 10a). However, in LM4.1-BNF simulations initialized with only N-fixer Acer seedlings, a higher symbiotic BNF rate persists throughout succession in comparison to LM4.1-BNF simulations initialized with both Robinia and Acer seedlings (mean 23.6 vs. 0.2 over the final 100 years respectively; Fig. 10b). This occurs because there is no competitive exclusion of N-fixing plants by non-fixing plants due to weak N limitation of plant growth in late succession, which occurs in LM4.1-BNF simulations initialized with both Robinia and Acer seedlings. Simulated soil C and N pools, soil N fluxes, soil N loss rates, and ecosystem C fluxes are relatively similar between simulations and are displayed in Figs. D7 and D8.
Levy-Varon et al. (2019) conducted a similar study, in which a N-fixer vegetation type was included in the ED2 model. Similarly, they found that simulations without a N-fixer vegetation type accumulate total plant biomass C slower than simulations with a N-fixer vegetation type. However, ED2 differs from LM4.1-BNF in a multitude of processes. In particular, ED2 does not include representations of asymbiotic BNF, mycorrhizae, or rhizosphere priming. Furthermore, the representation of BNF in ED2 assumes instantaneous down-regulation of symbiotic BNF rate in comparison to the time lag in down-regulation of symbiotic BNF rate in LM4.1-BNF (due to the time between plant C allocation to symbiotic BNF, the growth of N-fixing bacteria, and symbiotic BNF) following observations (Bytnerowicz et al., 2021).
5.3 Asymbiotic BNF
In our third analysis (Table 2), we examine the role of asymbiotic BNF and its implications for C and N cycling. LM4.1-BNF simulations initialized with Acer without asymbiotic BNF accumulate total plant biomass C slower than LM4.1-BNF simulations initialized with Acer with asymbiotic BNF (30.4 vs. 48.6 Mg C ha−1 over the initial 100 years; Fig. 10a). In LM4.1-BNF simulations initialized with Acer without asymbiotic BNF, stronger N limitation of plant growth in early succession due to the absence of both asymbiotic BNF and a N-fixer vegetation type (i.e., symbiotic BNF) substantially slows total plant biomass C accumulation. Nevertheless, total plant biomass C accumulates due to high N deposition at CHL (13.9 ), reaching a similar level to LM4.1-BNF simulations initialized with both Robinia and Acer seedlings and asymbiotic BNF after 300 years. Simulated soil C and N pools, soil N fluxes, soil N loss rates, and ecosystem C fluxes are relatively similar between simulations and are displayed in Figs. D7–8.
6.1 Limitations
LM4.1-BNF captures the major pools and fluxes of C and N and their temporal dynamics. Importantly, LM4.1-BNF is novel in that it captures both the competitive dynamics between N-fixing and non-fixing plants and asymbiotic BNF. However, LM4.1-BNF has limitations.
LM4.1-BNF does not explicitly include asymbiotic BNF by bryophytes, lichens, and other organisms beyond soil microbes. This is regulated differently from asymbiotic BNF by soil microbes, specifically by light (Reed et al., 2011). In particular, in boreal forests and arctic tundra, asymbiotic BNF by bryophytes is a significant N flux (DeLuca et al., 2002). Additionally, herbaceous symbiotic BNF in the forest understory could be significant, but few studies have quantified its magnitude and controls (Cleveland et al., 1999).
The asymbiotic BNF temperature response is heavily biased towards high latitudes; the studies we used in its derivation had a mean latitude of 60∘ (Chan, 1991; Chapin et al., 1991; Coxson and Kershaw, 1983; Liengen and Olsen, 1997; Roper, 1985). More studies on the asymbiotic BNF temperature response at lower latitudes are necessary.
The symbiotic BNF temperature response could acclimate to changing temperature (Bytnerowicz et al., 2021). The C cost of symbiotic BNF, which we assumed to be constant per unit N, could depend on temperature or other factors. These issues could influence the simulated response of symbiotic BNF and consequently total plant biomass C to increasing temperatures due to climate change. Thus, further empirical work on the effect of temperature on symbiotic BNF is necessary.
Finally, more observations of N cycling in general are necessary to validate N cycling representations in land models (Stocker et al., 2016; Thomas et al., 2015; Vicca et al., 2018). Global observations on N limitation of plant growth, soil N, N gas emission rates, N leaching rates, and, in particular, asymbiotic and symbiotic BNF rates are limited. Constraining these N pools and fluxes is critical to rigorously validating novel N cycling representations in land models.
6.2 Extensions
Robinia pseudoacacia is the most abundant N-fixing tree species in the coterminous United States (Staccone et al., 2020) and is also a common N-fixing tree across temperate forests; it is also found in Africa, Asia, Australia, Europe, and South America (Cierjacks et al., 2013). As such, Robinia pseudoacacia is representative of temperate N-fixing tree species.
The LM4.1-BNF representation of BNF, while implemented and validated in a temperate forest, can be expanded to other terrestrial ecosystems, such as tropical and boreal forests. This will require parameterization of representative N-fixing and non-fixing tree species but will not require re-structuring the model equations. Furthermore, the LM4.1-BNF representation of BNF could be incorporated into other land models.
Although N-fixing trees are generally important pioneer species and can relieve strong N limitation of plant growth in early succession (Chapin III et al., 1994), N-fixing trees can also be strong competitors. As such, in addition to having a facilitative effect on neighbouring plant growth (Hulvey et al., 2013), they can also have no effect on neighbouring plant growth (Lai et al., 2018; Xu et al., 2020) or an inhibitory effect on neighbouring plant growth (Chapin III et al., 2016; Taylor et al., 2017). This depends on abiotic and biotic factors (Staccone et al., 2021) and could be explored further with LM4.1-BNF.
Here we present LM4.1-BNF: an updated representation of BNF and other aspects of N cycling in LM4.1, which is the land component of the GFDL Earth System Model (Zhao et al., 2018a, b). LM4.1-BNF is the first land model to include a representation of the competitive dynamics between N-fixing and non-fixing plants, a mechanistic representation of asymbiotic BNF, and distinct asymbiotic and symbiotic BNF temperature responses derived from corresponding observations. Comparisons of simulations with observations show that LM4.1-BNF captures observed forest growth, successional dynamics, and major pools and fluxes of C and N and their temporal dynamics at population, community, and ecosystem scales. Furthermore, LM4.1-BNF represents these more accurately than previous representations of BNF in land models. By incorporating both the competitive dynamics between N-fixing and non-fixing plants, which is a key ecological mechanism that determines ecosystem-scale symbiotic BNF, and asymbiotic BNF, LM4.1-BNF yields accurate ecosystem-scale estimates of BNF and its temporal dynamics. Furthermore, the novel representation of soil NO and N2O emissions in LM4.1-BNF enables the estimation of the magnitude of the terrestrial NO and N2O source, which can be driven by BNF (Kou-Giesbrecht and Menge, 2021).
The representation of BNF in LM4.1-BNF is general and could be incorporated into other land models. Extending LM4.1-BNF to other biomes and incorporating LM4.1-BNF within the GFDL Earth System Model would allow a more accurate assessment of the response of BNF and the terrestrial C sink to elevated atmospheric CO2 concentration, which intensifies N limitation of plant growth (Terrer et al., 2019; Zheng et al., 2020), and elevated N deposition, which relieves N limitation of plant growth (Reay et al., 2008; Schulte-Uebbing and de Vries, 2018; Zheng et al., 2020). In particular, such an endeavour could address whether BNF and N deposition will provide sufficient N to sustain CO2 sequestration by terrestrial ecosystems under elevated atmospheric CO2 concentration.
A1 N uptake by roots and symbionts
All vegetation types take up inorganic N via passive and active root uptake. Processes in Sect. A1 occur on the fast timescale (30 min).
A2 Passive root uptake of inorganic N
The rate of passive root uptake of inorganic N in soil layer k (Npassive(k); []) is
where is the water uptake flux in soil layer k [], NO3(k) is the pool in soil layer k [kg N m−2], NH4(k) is the pool in soil layer k [kg N m−2], and H2O(k) is the soil water content of soil layer k [kg H2O m−2]. Note that the solubility of and differs, reflecting a higher cation exchange capacity than anion exchange capacity.
A2.1 Active root uptake of inorganic N
The rate of active root uptake of inorganic N in soil layer k (Nactive(k); []) is
where and are rate constants, frhiz(k) is the rhizosphere volume fraction of soil layer k [m3 m−3], Δz(k) is the thickness of soil layer k, and are half-saturation constants, and nindiv is the spatial density [indiv m−2]. frhiz(k) is calculated as
where rrhiz is the radius of the rhizosphere around fine roots, rroot is the radius of fine roots, Cr(k) is the biomass C of fine roots in soil layer k [kg C indiv−1], and SRL is the specific root length. N stress of the plant (Nstress; [unitless]) is given in Eq. (A34). This follows LM3-SNAP but is modified to increase with N stress.
A2.2 Inorganic N uptake by arbuscular mycorrhizae
The rates of and uptake by AM in soil layer k ( and respectively; []) are
where and are rate constants, and are half-saturation constants, BAM(k) is the biomass C of AM in soil layer k [kg C indiv−1], and kAM is a half-saturation constant. This follows LM3-SNAP.
A2.3 Organic and inorganic N uptake by ectomycorrhizae
The rates of C and N decomposition by EM in soil layer k of organic matter type i, where i=labile plant-derived, labile microbe-derived, or recalcitrant ( and respectively; [] and []), are
where is the maximum decomposition rate of organic matter type i, Ea,i is the activation energy of the decomposition of organic matter type i, R is the ideal gas constant, Tref is reference temperature, T(k) is soil temperature of soil layer k [K], θ(k) is volumetric soil water content of soil layer k [m3 m−3], θsat is saturation volumetric soil water content [m3 m−3], fθ,max is a factor normalizing the dependence on θ(k) to a maximum value of 1 [unitless], BEM(k) is the biomass C of EM in soil layer k [kg C indiv−1], CU,i(k) is the soil C pool of type i in soil layer k [kg C m−2], NU,i(k) is the soil N pool type i in soil layer k [kg C m−2], and kM.EM is a half-saturation constant. This follows LM3-SNAP.
The rates of C and N uptake by EM in soil layer k (CEM(k) and NEM(k) respectively; [] and []) are
where is the C uptake efficiency of soil C type i by EM, is the N uptake efficiency of soil N type i by EM, and are rate constants, and are half-saturation constants, and kEM is a half-saturation constant. is released as CO2. enters NH4(k). This follows LM3-SNAP but is modified to additionally take up inorganic N.
A2.4 Symbiotic BNF by N-fixing bacteria
The symbiotic BNF rate by N-fixing bacteria (NNfix; []) is
where rNfix is a rate constant, BNfix is the biomass C of the nodule (includes both plant and N-fixing bacteria tissue) [kg C indiv−1], and fs(T) is the soil temperature dependence function. For Robinia,
where T is the average soil temperature across soil layers [K]. This reaches its maximum at 31.9 ∘C (Fig. 2). This is derived from Bytnerowicz et al. (2021).
A3 Asymbiotic BNF
Soil microbes are represented as a single C pool that conducts decomposition, nitrification, denitrification, and asymbiotic BNF. The rates of C and N decomposition by soil microbes in soil layer k of organic matter type i, where i=labile plant-derived, labile microbe-derived, or recalcitrant, (DC,i(k) and DN,i(k) respectively; [] and []), are
where is the maximum decomposition rate of organic matter type i, CM(k) is the biomass C of soil microbes in soil layer k [kg C m−2], and kM is the half-saturation constant. This follows LM3-SNAP.
The potential rates of C and N decomposition during denitrification by soil microbes in soil layer k of organic matter type i ( and respectively; [] and []) are
where is the maximum decomposition rate of organic matter type i during denitrification and kM,denit is the half-saturation constant. This follows LM3-SNAP.
The rates of C and N decomposition during denitrification by soil microbes in soil layer k of organic matter type i ( and respectively; [] and []) are
where kdenit is the half-saturation constant, and fdenit is the stoichiometric ratio of demand for C decomposition. and include limitation of denitrification. This follows LM3-SNAP.
The rate of change of biomass C of soil microbes in soil layer k (; []) is
where GM,C(k) is the C growth rate of soil microbes in soil layer k (Eq. A23) and τM is the combined maintenance respiration and turnover time of soil microbes. This follows LM3-SNAP.
The rate of change of biomass N of soil microbes in soil layer k (; []) is
where GM,N(k) is the N growth rate of soil microbes in soil layer k (Eq. A24), εt,M is the fraction of maintenance respiration in combined maintenance respiration and turnover, and C:NM is the C:N ratio of soil microbes. This follows LM3-SNAP.
The maintenance respiration rate of soil microbes in soil layer k (Rmaint(k); []) is
This is released as CO2. This follows LM3-SNAP.
The asymbiotic BNF rate of soil microbes in soil layer k (NNfix asymb(k); []) is
where rNfix asymb is a rate constant and fa(T(k)) is the soil temperature dependence function.
which reaches its maximum at 24.4 ∘C (Fig. 2). This is derived from the observations compiled by Houlton et al. (2008) with the study of symbiotic BNF removed (Schomberg and Weaver, 1992) and is normalized to a maximum of 1.
The N surplus or deficit of soil microbes in soil layer k (ϕN(k); []) is
where εN,i is the N uptake efficiency of soil N type i by soil microbes, and εC,i is the C uptake efficiency of soil C type i by soil microbes. ϕN(k)>0 indicates net N mineralization (N surplus), and ϕN(k)<0 indicates net N immobilization (N deficit) by soil microbes in soil layer k. is released as CO2. enters NH4(k). This follows LM3-SNAP but was modified to include asymbiotic BNF.
GM,C(k) and GM,N(k) depend on whether growth of soil microbes is C-limited ( or N-limited ( and are calculated as follows.
This follows LM3-SNAP but was modified to include asymbiotic BNF.
The maximum N immobilization rate of soil microbes in soil layer k (Immmax(k); []) is
where is the maximum immobilization rate, is the activation energy of immobilization, is the maximum immobilization rate, and is the activation energy of immobilization. This follows LM3-SNAP.
When growth of soil microbes in soil layer k is N-limited (, there is overflow respiration of excess C. The overflow respiration of excess C in soil layer k (Roverflow(k); []) is
This is released as CO2.
If ϕN(k)>0, the net N mineralization flux in soil layer k is ϕN(k). If , the net N immobilization flux in soil layer k is −ϕN(k). If , the net N immobilization flux in soil layer k is −Immmax(k). The fraction of the net N immobilization flux in soil layer k that is immobilization is
The fraction of the net N immobilization flux in soil layer k that is immobilization is
This follows LM3-SNAP.
Processes in Sect. A2 occur on the fast timescale (30 min).
A4 Plant growth and N limitation
The non-structural C pool (NSC; [kg C indiv−1]) gains C from photosynthesis. NSC loses C to respiration and C allocation to growth, symbionts, and root C exudation. The rate of change of NSC (; []) is
where P is the photosynthesis rate [], R is the respiration rate (maintenance and growth) [], GC,l is the growth rate of the leaf C pool (Cl; [kg C indiv−1]) [], GC,r is the growth rate of the fine-root C pool (Cr; [kg C indiv−1]) [], GC,sw is the growth rate of the sapwood C pool (Csw; [kg C indiv−1]) [], GC,seed is the growth rate of the seed C pool (Cseed; [kg C indiv−1]) [], Calloc is the rate of C allocation to symbionts (Eqs. A43–A46), and LC,exudate is the rate of root C exudation (Eq. A38). Note that sapwood is converted to heartwood following Martinez Cano et al. (2020).
The non-structural N pool (NSN; [kg N indiv−1]) gains N from N uptake via roots and symbionts. NSN loses N to N allocation to growth, symbionts, and root N exudation. The rate of change of NSN (; []) is
where U is the N uptake rate via roots and symbionts (Eq. A55) [], C:Nl is the fixed C:N ratio of leaves, C:Nr is the fixed C:N ratio of fine roots, C:Nsw is the fixed C:N ratio of sapwood, C:Nseed is the fixed C:N ratio of seeds, Nalloc is the rate of N allocation to symbionts (Eq. A47), and LN,exudate is the rate of root N exudation (Eq. A39).
Non-N-limited growth is calculated according to Weng et al. (2015). The total allocation of NSC to growth is determined by the target NSC (NSCtarget; [kg C indiv−1]) and minimizes the deviation between NSC and NSCtarget. NSCtarget is a multiple of the target Cl (Cl,target; [kg C indiv−1]), which reflects the ability of a plant to refoliate after defoliation (Hoch et al., 2003; Richardson et al., 2013), and is calculated as
where q is a proportionality constant. The allocation of NSC to the growth of each tissue depends on the total allocation of NSC to growth and the target C pool of each tissue and minimizes the deviation between the C pool of each tissue and the target C pool of each tissue. The target C pool of each tissue is dynamic and is determined by allometry (Eqs. A40–A42).
In LM4.1-BNF, GC,l, GC,r, GC,sw, and GC,seed are adjusted to include N limitation and are calculated as
where Nstress is N stress [unitless] and Δl, Δr, Δsw, and Δseed are the non-N-limited growth rates of Cl, Cr, Csw, and Cseed respectively [] following Weng et al. (2015). Because plants increase C allocation to fine roots relative to other tissues when N-limited (Poorter et al., 2012), GC,r is not adjusted to include N limitation.
In LM4.1-BNF, Nstress is the relative difference between NSN and NSNtarget and is calculated as
where NSNtarget is the target NSN [kg N indiv−1]. Nstress is smoothed with a low-pass filter over 30 d to reflect the persisting influence of N stress (Mooney et al., 1991). NSNtarget is calculated as
This is similar to LM3-SNAP, which compared the target leaf and root N pools to NSN, but is modified to reflect the treatment of NSCtarget in LM4.1 by including the target sapwood and seed N pools.
N demand for plant growth (Ndemand; [kg N indiv−1]) is
If Ndemand>0.5NSN, , and GC,seed are reduced to prevent Ndemand from depleting NSN
where t=leaf, root, sapwood, or seed, and 0.5 was set to maintain a baseline NSN.
Plant turnover decreases Cl, Cr, and Csw and from Nl, Nr, and Nsw at a constant tissue-specific rate and enters CU,labile plant-derived or CU,recalcitrant and NU,labile plant-derived or NU,recalcitrant respectively. A fraction of the turnover of Cl and Nl is retranslocated into NSC and NSN respectively.
Under N limitation, plants increase root C exudation to stimulate N mineralization in the rhizosphere (rhizosphere priming; Cheng et al., 2014; Finzi et al., 2015). LC,exudate increases with Nstress and is calculated as
where rleakage,C is a rate constant. LC,exudate enters the rhizosphere CU,labile plant-derived.
Under N limitation, plants decrease root N exudation (Canarini et al., 2019). LN,exudate decreases with Nstress and is calculated as
where rleakage,N is a rate constant. LN,exudate enters the rhizosphere NU,labile plant-derived.
Plant growth occurs during the growing season. Plant maintenance respiration and plant turnover occur throughout the year. After the transition from the growing season to the non-growing season, turnover of Cl and Nl occur at an elevated rate until Cl=0 and Nl=0. Plant C allocation to symbionts occurs during the growing season. Root exudation occurs during the growing season. Symbiont growth, maintenance respiration, and turnover occur throughout the year. N uptake by roots and symbionts occurs throughout the year.
Photosynthesis and respiration occur on the fast timescale (30 min). Plant turnover occurs on the fast timescale (30 min). Plant growth, plant C allocation to symbionts, and root exudation occur on the daily timescale.
A5 Plant allometry
Plant allometry follows Martinez Cano et al., 2020. Crown area (CA; [m2]) is a function of diameter at breast height (power function):
where D is diameter at breast height [m], and αCA and θCA are allometry parameters.
Height (H; [m]) is a function of diameter at breast height (generalized Michaelis–Menten equation)
where αHT, θHT, and γHT are allometry parameters.
Wood mass (W; [kg C]) is a function of diameter at breast height and height:
where αBM is an allometry parameter and ρwood is wood density.
A6 Plant C allocation to symbionts (AM, EM, and N-fixing bacteria)
The rate of C allocation to AM (Calloc,AM; []) is
where falloc,AM is the fraction of NSC allocated to AM per unit time. Calloc,AM is not related to Nstress because, although AM increases N uptake, AM is maintained by the plant primarily for phosphorus uptake (Smith and Smith, 2011).
The rate of C allocation to EM (Calloc,EM; []) is
where falloc,EM is the maximum fraction of NSC allocated to EM per unit time. Calloc,EM is a function of Nstress because biomass C of EM increases with N limitation (Phillips et al., 2013).
Plants that associate with N-fixing bacteria can regulate symbiotic BNF to different extents, termed their BNF strategy (Menge et al., 2015). For plants with a perfectly facultative BNF strategy, symbiotic BNF increases with N limitation. For plants with an incomplete BNF strategy, symbiotic BNF increases with N limitation but is maintained at a minimum. For plants with an obligate BNF strategy, symbiotic BNF is constant. For plants with either a facultative or an incomplete BNF strategy, the rate of C allocation by the plant to N-fixing bacteria (Calloc,Nfix; []) is
where falloc,Nfix is the fraction of NSC allocated to N-fixing bacteria per unit time and is the minimum fraction of NSC allocated to N-fixing bacteria per unit time. For plants with a perfectly facultative BNF strategy , and for plants with an incomplete down-regulator BNF strategy . We model Robinia with an incomplete down-regulator BNF strategy.
For plants with an obligate BNF strategy, Calloc,Nfix is
Additionally, plants allocate a small quantity of N to symbionts such that symbiont growth can be initiated. The rate of N allocation by the plant to symbionts (Nalloc,j; EM, N-fixing bacteria; []) is
where C:Nalloc is the C:N ratio of C and N allocated to symbionts by the plant.
Processes in Sect. A5 occur on the daily timescale.
A7 Growth and turnover of symbionts
Plant C allocation to symbionts is transferred to an intermediate C pool (Cint,j; j=AM, EM, or N-fixing bacteria; [kg C indiv−1]). The rate of change of Cint,j (; []) is
where εsymb is the proportion of C uptake by a symbiont from Cint,j that is assimilated. The C growth rate of a symbiont with strategy j (Gj; j=AM or N-fixing bacteria; []) is
where rgrowth is the growth rate of a symbiont.
The growth rate of EM (GEM; []) is
(j=AM, EM, or N-fixing bacteria) is released as CO2 (growth respiration).
The rate of change of biomass C of a symbiont with strategy j (; j=AM or EM; []) is
where ξj is rate of maintenance respiration of a symbiont with strategy j, and τj is the turnover time of a symbiont with strategy j. ξjBj is released as CO2 (maintenance respiration). enters CU,labile microbe-derived and enters NU,labile microbe-derived, where C:Nj is the C:N ratio of a symbiont with strategy j.
The rate of change of biomass C of N-fixing bacteria (; []) is
where ξNfix is rate of maintenance respiration of N-fixing bacteria, costNfix is the C cost of symbiotic BNF per unit N, and τNfix is the turnover time of N-fixing bacteria. ξNfixBNfix is released as CO2 (maintenance respiration), and costNfixNNfix is released as CO2 (respiration associated with symbiotic BNF). enters CU,labile microbe-derived, and enters NU,labile microbe-derived, where C:NNfix is the C:N ratio of N-fixing bacteria.
N acquired by symbionts is transferred to an intermediate N pool (Nint,j; [kg N indiv−1]). The rate of change of Nint,j (; j=AM or EM; []) is
where rup,veg is the rate of plant N uptake from Nint,j.
The rate of change of Nint,Nfix (; []) is
U is calculated as
Processes in Sect. A6 occur on the fast timescale (30 min). The purpose of Cint,j and Nint,j is to translate between the fast timescale (30 min) and the daily timescale. Plant C allocation to symbionts occurs on the daily timescale (alongside plant growth), but plant N uptake occurs on the fast timescale.
A8 Dynamic plant C allocation to N uptake relative to plant growth
The order of plant C allocation to growth, symbionts, and rhizosphere priming is determined by C limitation relative to N limitation (Cheng et al., 2014; Finzi et al., 2015; Poorter et al., 2012; Treseder, 2004; Zheng et al., 2019). If a plant is more C-limited than N-limited, . The plant allocates C to growth, then to N-fixing bacteria (if associated) and EM (if associated), then to rhizosphere priming, and finally to AM. If a plant is more N-limited than C-limited, . The plant allocates C to N-fixing bacteria (if associated) and EM (if associated), then to rhizosphere priming, then to growth, and finally to AM.
A9 Soil N2O and NO emissions
Soil N2O and NO emissions occur during nitrification (aerobic oxidation of with oxygen as an electron acceptor, which produces N2O and NO as by-products) and denitrification (anaerobic oxidation of organic C with as an electron acceptor, which produces N2O as a by-product).
Nitrification rate in soil layer k (nit(k); []) is
where is the maximum nitrification rate, and Ea,nit is the activation energy of nitrification. This follows LM3-SNAP.
Denitrification rate in soil layer k (denit(k); []) is
This follows LM3-SNAP.
Soil N2O emission rate in soil layer k (N2O(k); []) is
where and HR(k) is heterotrophic respiration in soil layer k (summation of maintenance respiration, overflow respiration, and decomposition respiration) []. This follows LM3V-N (Huang and Gerber, 2015).
Soil NO emission rate in soil layer k (NO(k); []) is
This follows LM3V-N (Huang and Gerber, 2015).
Processes in Sect. A8 occur on the fast timescale (30 min).
A10 Additional N sources
N deposition enters NU,labile plant-derived, NH4, and NO3. Processes in Sect. A9 occur on the fast timescale (30 min).
The US Forest Inventory and Analysis (FIA) database (US Forest Service, 2020a) was downloaded in 2019 from https://apps.fs.usda.gov/fia/datamart/CSV/datamart_csv.html, last access: 7 November 2019. For tree data, plots with Plot Design Code 1 (national plot design) were selected, dead and cut trees were excluded, trees measured at the root collar were excluded, trees with visually estimated or modelled heights were excluded, and accessible forest land was selected (excludes agriculture and urban areas). Canopy trees had crown class code open grown, dominant, or codominant. Understory trees had crown class code intermediate or overtopped. For soil data, mineral soil layers were selected. For seedling data, plots with Plot Design Code 1 (national plot design) were selected, and accessible forest land was selected (excludes agriculture and urban areas).
The US FIA Forest Health Monitoring database (US Forest Service, 2020b) was downloaded in 2019 from https://www.fia.fs.fed.us/tools-data/other_data/index.php, last access: November 2019. Dead trees and trees with damaged crowns were excluded. Timberland and woodland land uses were selected.
The Biomass and Allometry Database (BAAD; Falster et al., 2015) was downloaded from https://esajournals.onlinelibrary.wiley.com/doi/abs/10.1890/14-1889.1, last access: November 2019. Field/wild plants were selected. Temperate forest plants were selected.
TRY database data (Kattge et al., 2020) were downloaded in 2019 from https://www.try-db.org/TryWeb/Prop0.php, last access: November 2019.
Total soil C, total soil N, soil , soil nitrate , N mineralization rate, net nitrification rate, and bulk density from CHL (Knoepp, 2009a, b, 2018) were downloaded from https://coweeta.uga.edu/ResearchData.html, last access: November 2019.
Soil N2O and NO emissions are from Stehfest and Bouwman (2006). Data from deciduous temperate forests were selected.
Net ecosystem production at the hourly timescale (Oishi, 2020) were downloaded from https://ameriflux.lbl.gov/doi/AmeriFlux/US-Cwt, last access: November 2019. Growing season was May through October.
Gross primary production, net primary production, heterotrophic respiration and net ecosystem production are from the ForC database (Anderson-Teixeira et al., 2018). Data from deciduous temperate broadleaf forests were selected.
Equation (A40) was fit using nonlinear least squares with the US FIA Forest Health Monitoring database (US Forest Service, 2020b) for each species to calculate αCA and θCA (Figs. D10 and D11). Equation (A41) was fit using nonlinear least squares with the US FIA database tree data (US Forest Service, 2020a) for each species to calculate αHT, θHT, and γHT (Figs. D12 and D13). Equation (A42) was fit using nonlinear least squares with the US FIA database tree data (US Forest Service, 2020a) for each species to calculate αBM (Figs. D14 and 15). Note that wood mass (aboveground and belowground) is calculated by the US FIA using allometric equations of dbh.
The following equations from Weng et al. (2015) were utilized with the US FIA database tree data from consecutive censuses for each species (US Forest Service, 2020a) to calculate canopy tree background mortality rate (μC) and understory tree background mortality rate (μU):
where ndead,C is the mean number of dead canopy individuals in a given year [indiv m−2], nC is the mean number of canopy individuals in a given year [indiv m−2], ndead,U is the mean number of dead understory individuals in a given year [indiv m−2], nU is the mean number of understory individuals in a given year [indiv m−2], and DU is the mean diameter at breast height of an understory individual in a given year [m].
The following equation from Martinez Cano et al. (2020) was fit using nonlinear least squares with BAAD (Falster et al., 2015) to calculate the proportionality constant between crown area and cross-sectional sapwood area (φCSA) (Figs. D16 and D17):
where SAsw is the cross-sectional sapwood area at breast height [m2], and D is the diameter [m] from BAAD (for deciduous angiosperm).
The following equation from Weng et al. (2015) was utilized with BAAD (Falster et al., 2015) to calculate the proportionality constant between root area and leaf area (φRL):
where 0.43 is from BAAD (for deciduous angiosperm), 0.0375 kg C m−2 is from Poorter et al. (2009) (for deciduous trees), and 45 m2 kg C is from Jackson et al. (1997) (for temperate deciduous forests).
The following equation from Martinez Cano et al. (2020) was utilized with BAAD (Falster et al., 2015) to calculate the fraction of sapwood in branches (fbr)
where 0.255 is from BAAD. Note that we did not distinguish between deciduous angiosperm and evergreen gymnosperm due to insufficient data.
The following equation (from Eq. A20) was used to calculate rNfix asymb:
where 12 is from Reed et al. (2011), 50 000 kg C ha−1 is from Scharlemann et al. (2014), and 1 % (0.01) is from Chapin et al. (2011).
The following equation (from Eq. A38) was used to calculate rleakage,C:
where 0.05 is from Jones et al. (2009), 13 050 is from the ForC database (Anderson-Teixeira et al., 2018), 3.2 kg C indiv−1 is from BAAD (Falster et al., 2015), and ∼390 indiv ha−1 is from Crowther et al. (2015) (for temperate forests). Note that we did not distinguish between deciduous angiosperm and evergreen gymnosperm in BAAD because other data are from all temperate forests.
rgrowth from LM3-SNAP was adapted to the units of LM4.1:
where 0.3 is from LM3-SNAP; 8, 106, and 4 kg ha−1 are from Boring and Swank (1984); and 250 is from Binkley et al. (1992).
rNfix was calculated with data from Bytnerowicz et al. (2021), which measured nodule biomass % C and symbiotic BNF rate per unit nodule biomass using 15N2 incorporation.
Parameters related to plant C allocation to symbionts (falloc,AM, falloc,EM, and falloc,Nfix) were estimated by examining a range of values (0.01, 0.02, 0.05, 0.10, 0.20, 0.50, and 1.00). Symbiont biomass C was compared to literature observations (that were not used for model parameterization) from Boring and Swank (1984) for nodule biomass C and Zhu and Miller (2003) for mycorrhizal biomass C. Parameter values were chosen such that simulated symbiont biomass C was most similar to observed symbiont biomass C.
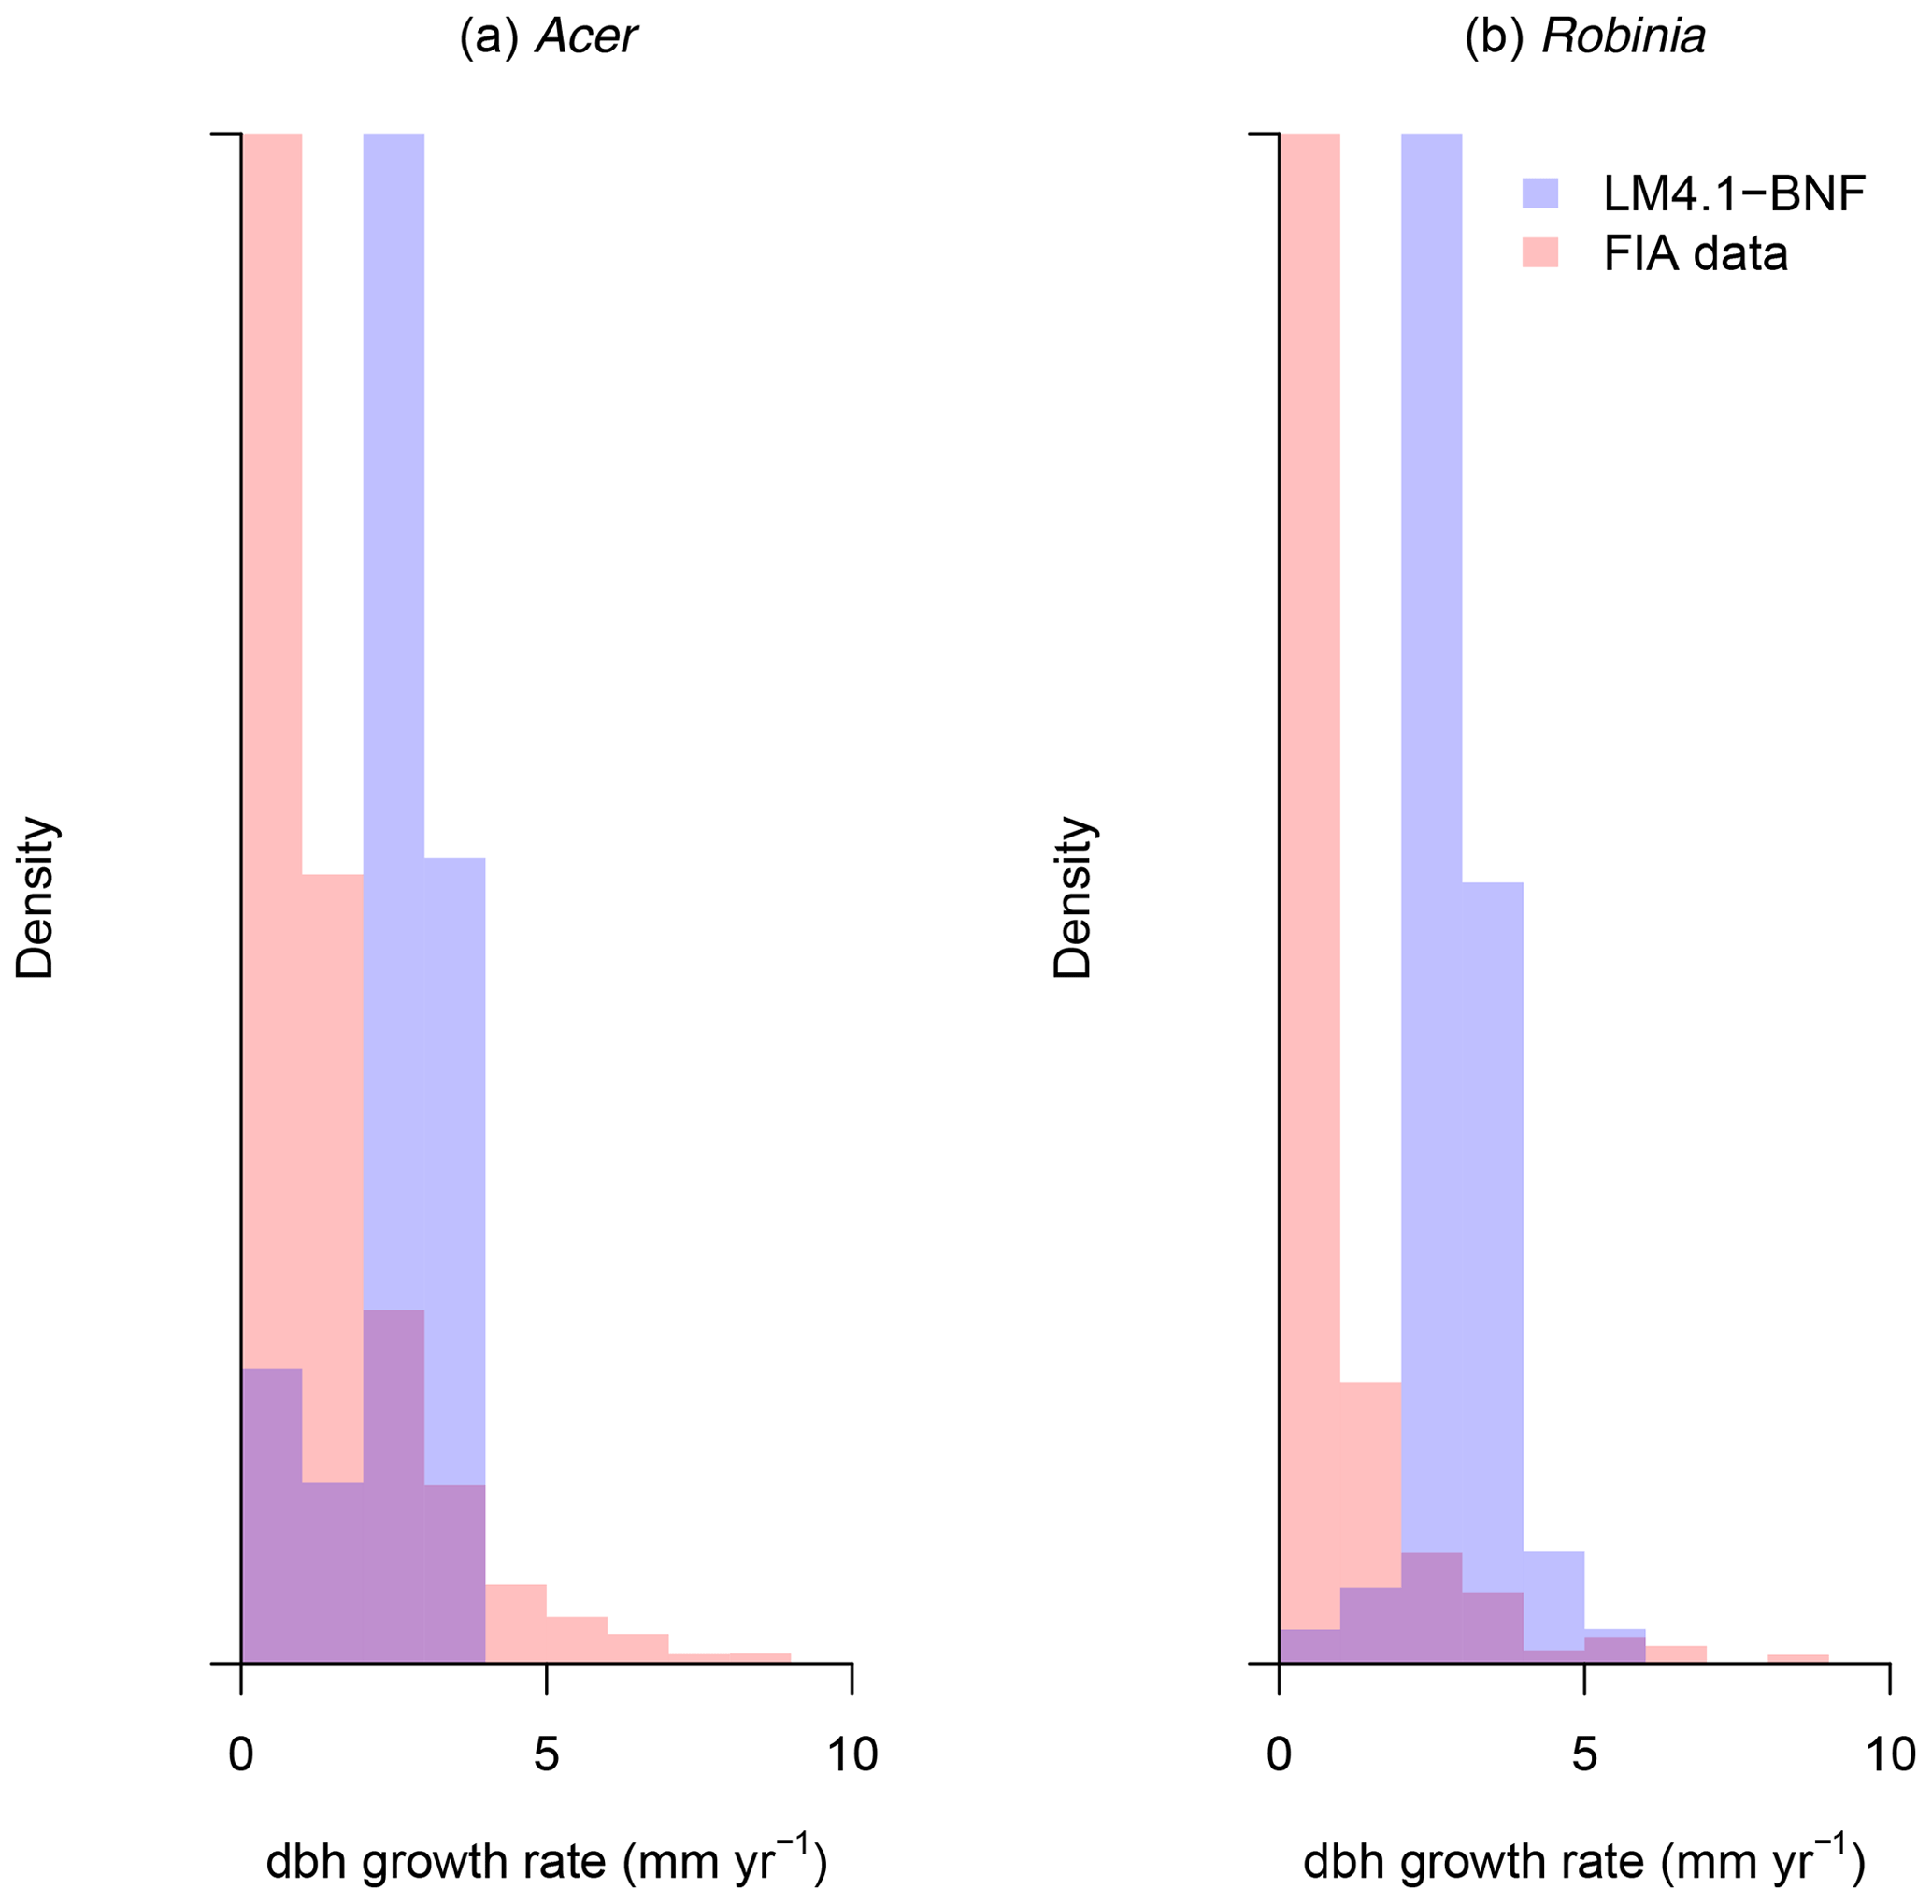
Figure D1Simulated dbh growth rate for (a) Acer/non-fixer and (b) Robinia compared to FIA data (in North Carolina). Simulated data are trees with dbh>12.7 cm to reflect the dbh range of FIA data and are weighted by the stand age distribution of FIA data (Fig. D18). Simulated and FIA data are scaled to display an equal maximum density. LM3-SNAP cannot distinguish between plant cohorts with different dbh's or distinguish between Robinia and Acer.
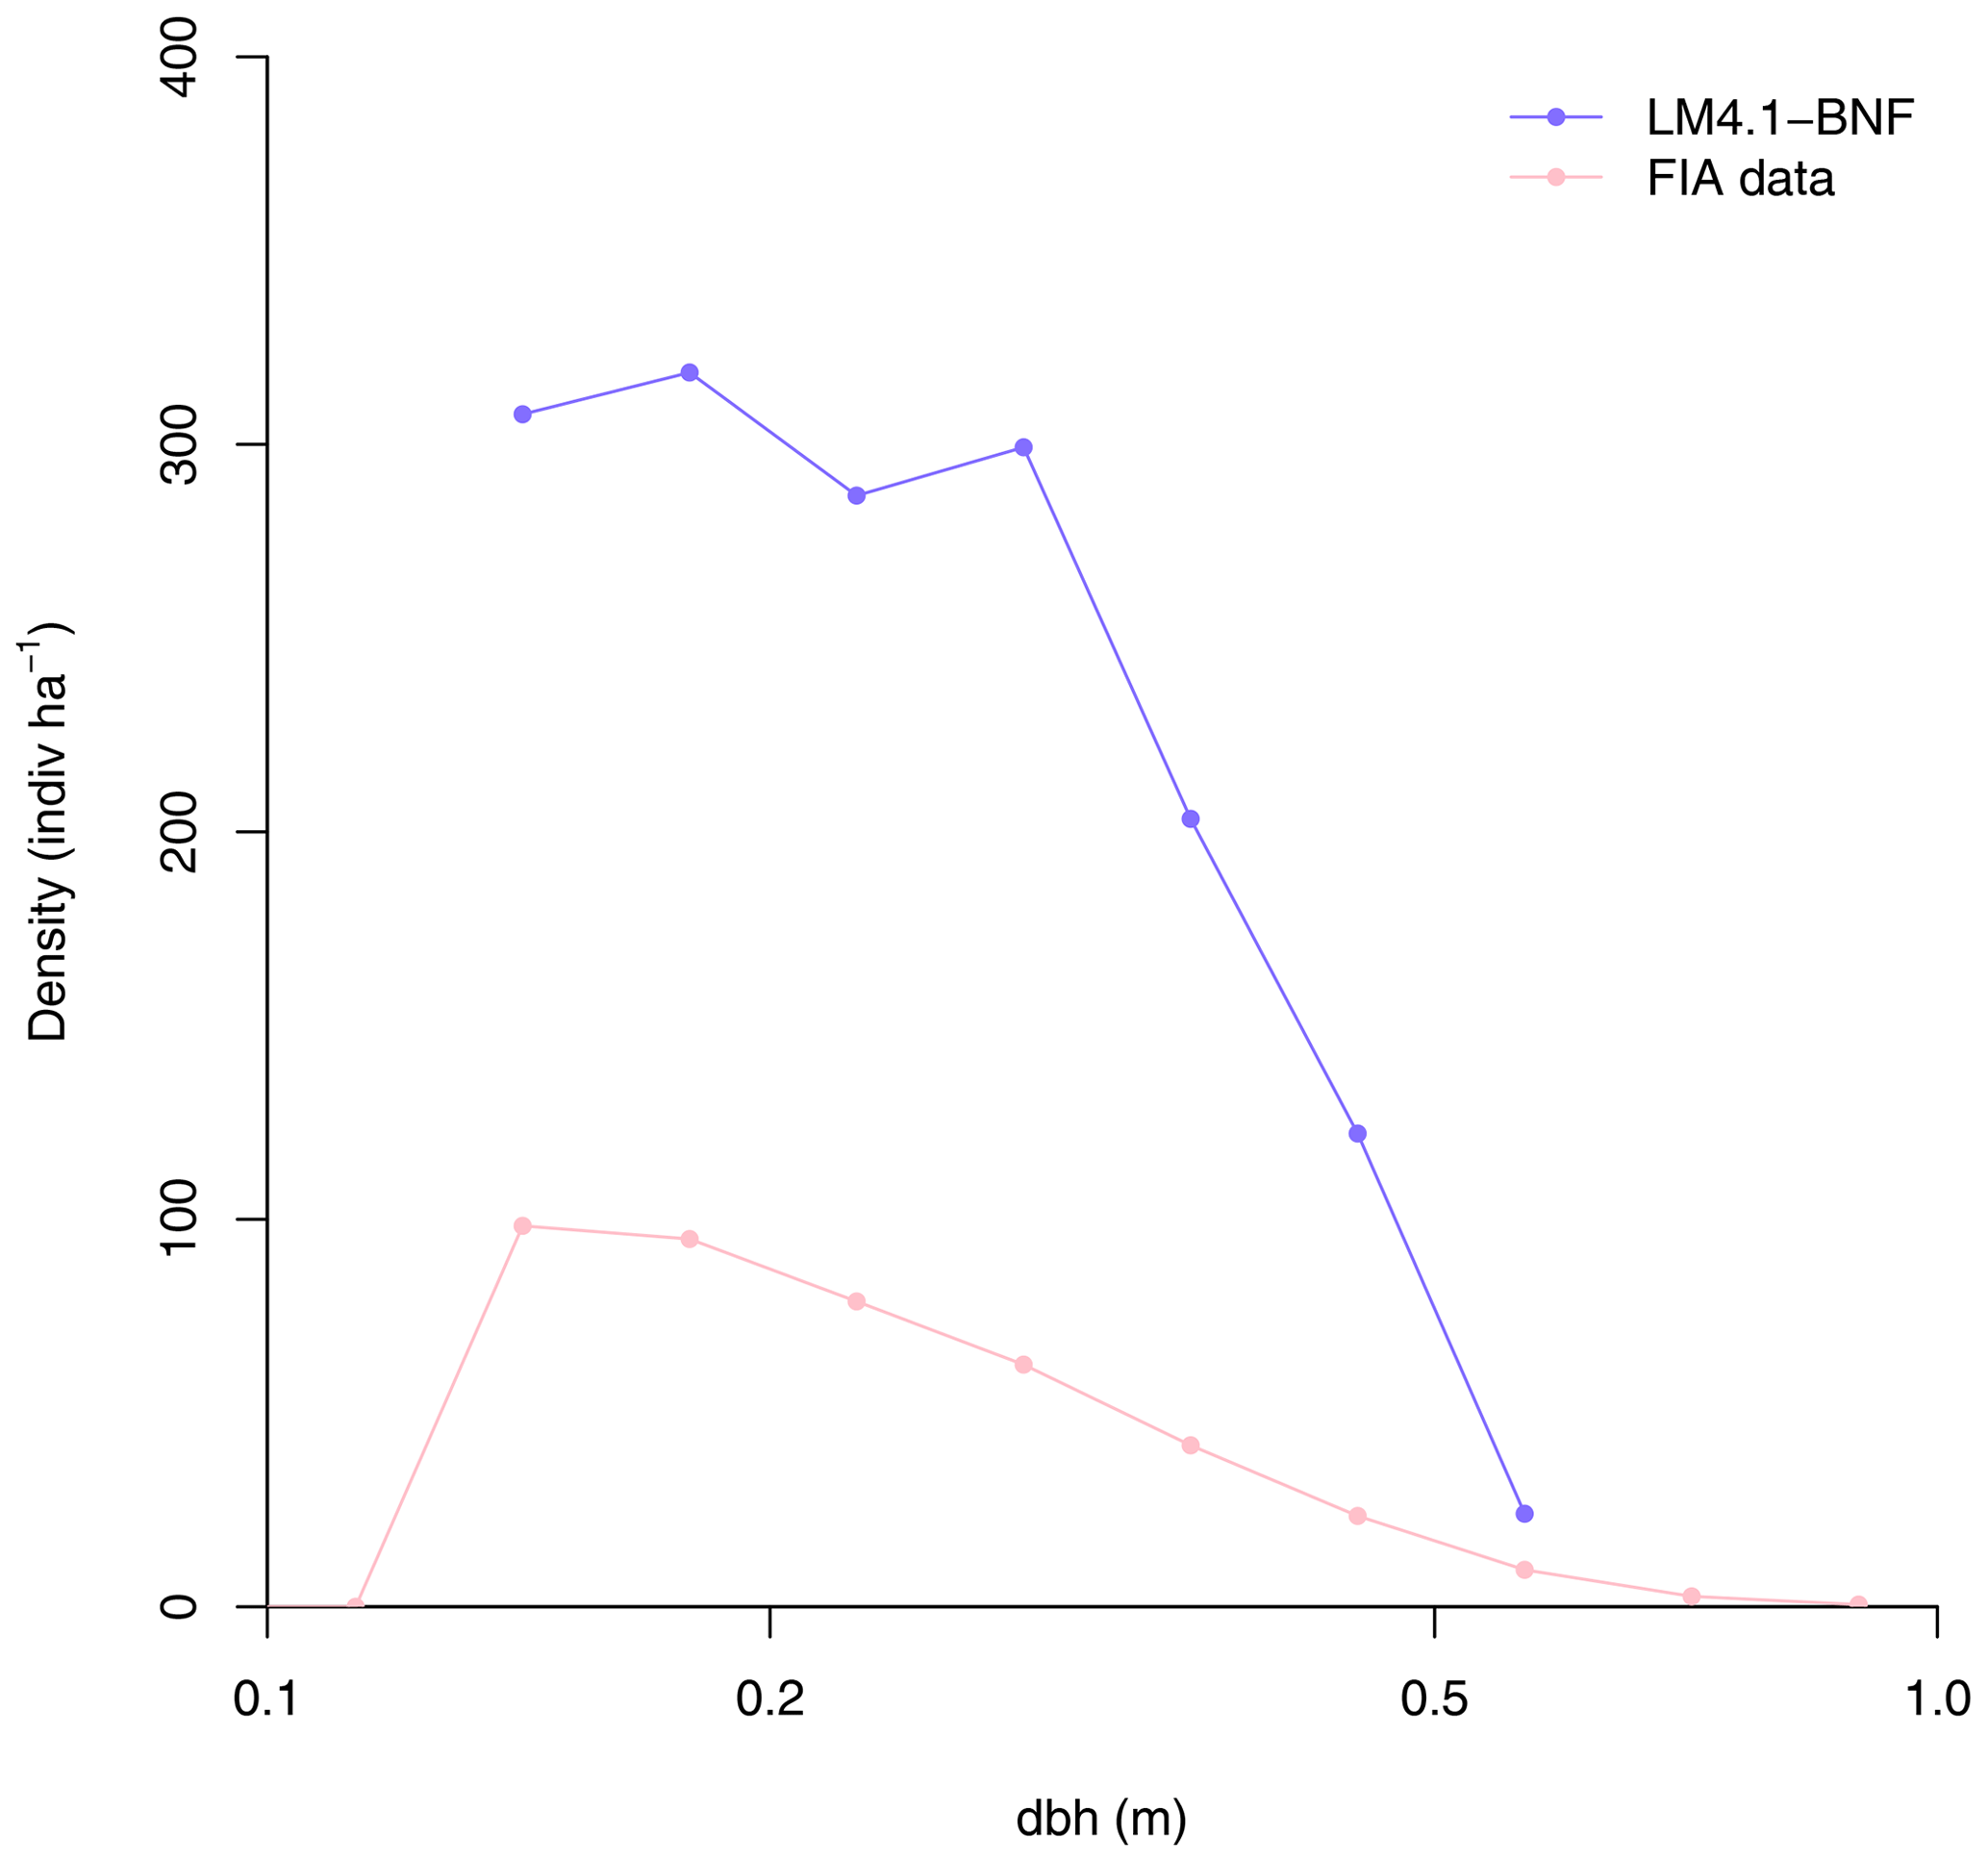
Figure D2Simulated dbh distribution compared to FIA data (in North Carolina). Simulated data are trees with dbh>12.7 cm to reflect the dbh range of FIA data and are weighted by the stand age distribution of FIA data (Fig. D18). LM3-SNAP cannot distinguish between plant cohorts with different dbh's or distinguish between Robinia and Acer.
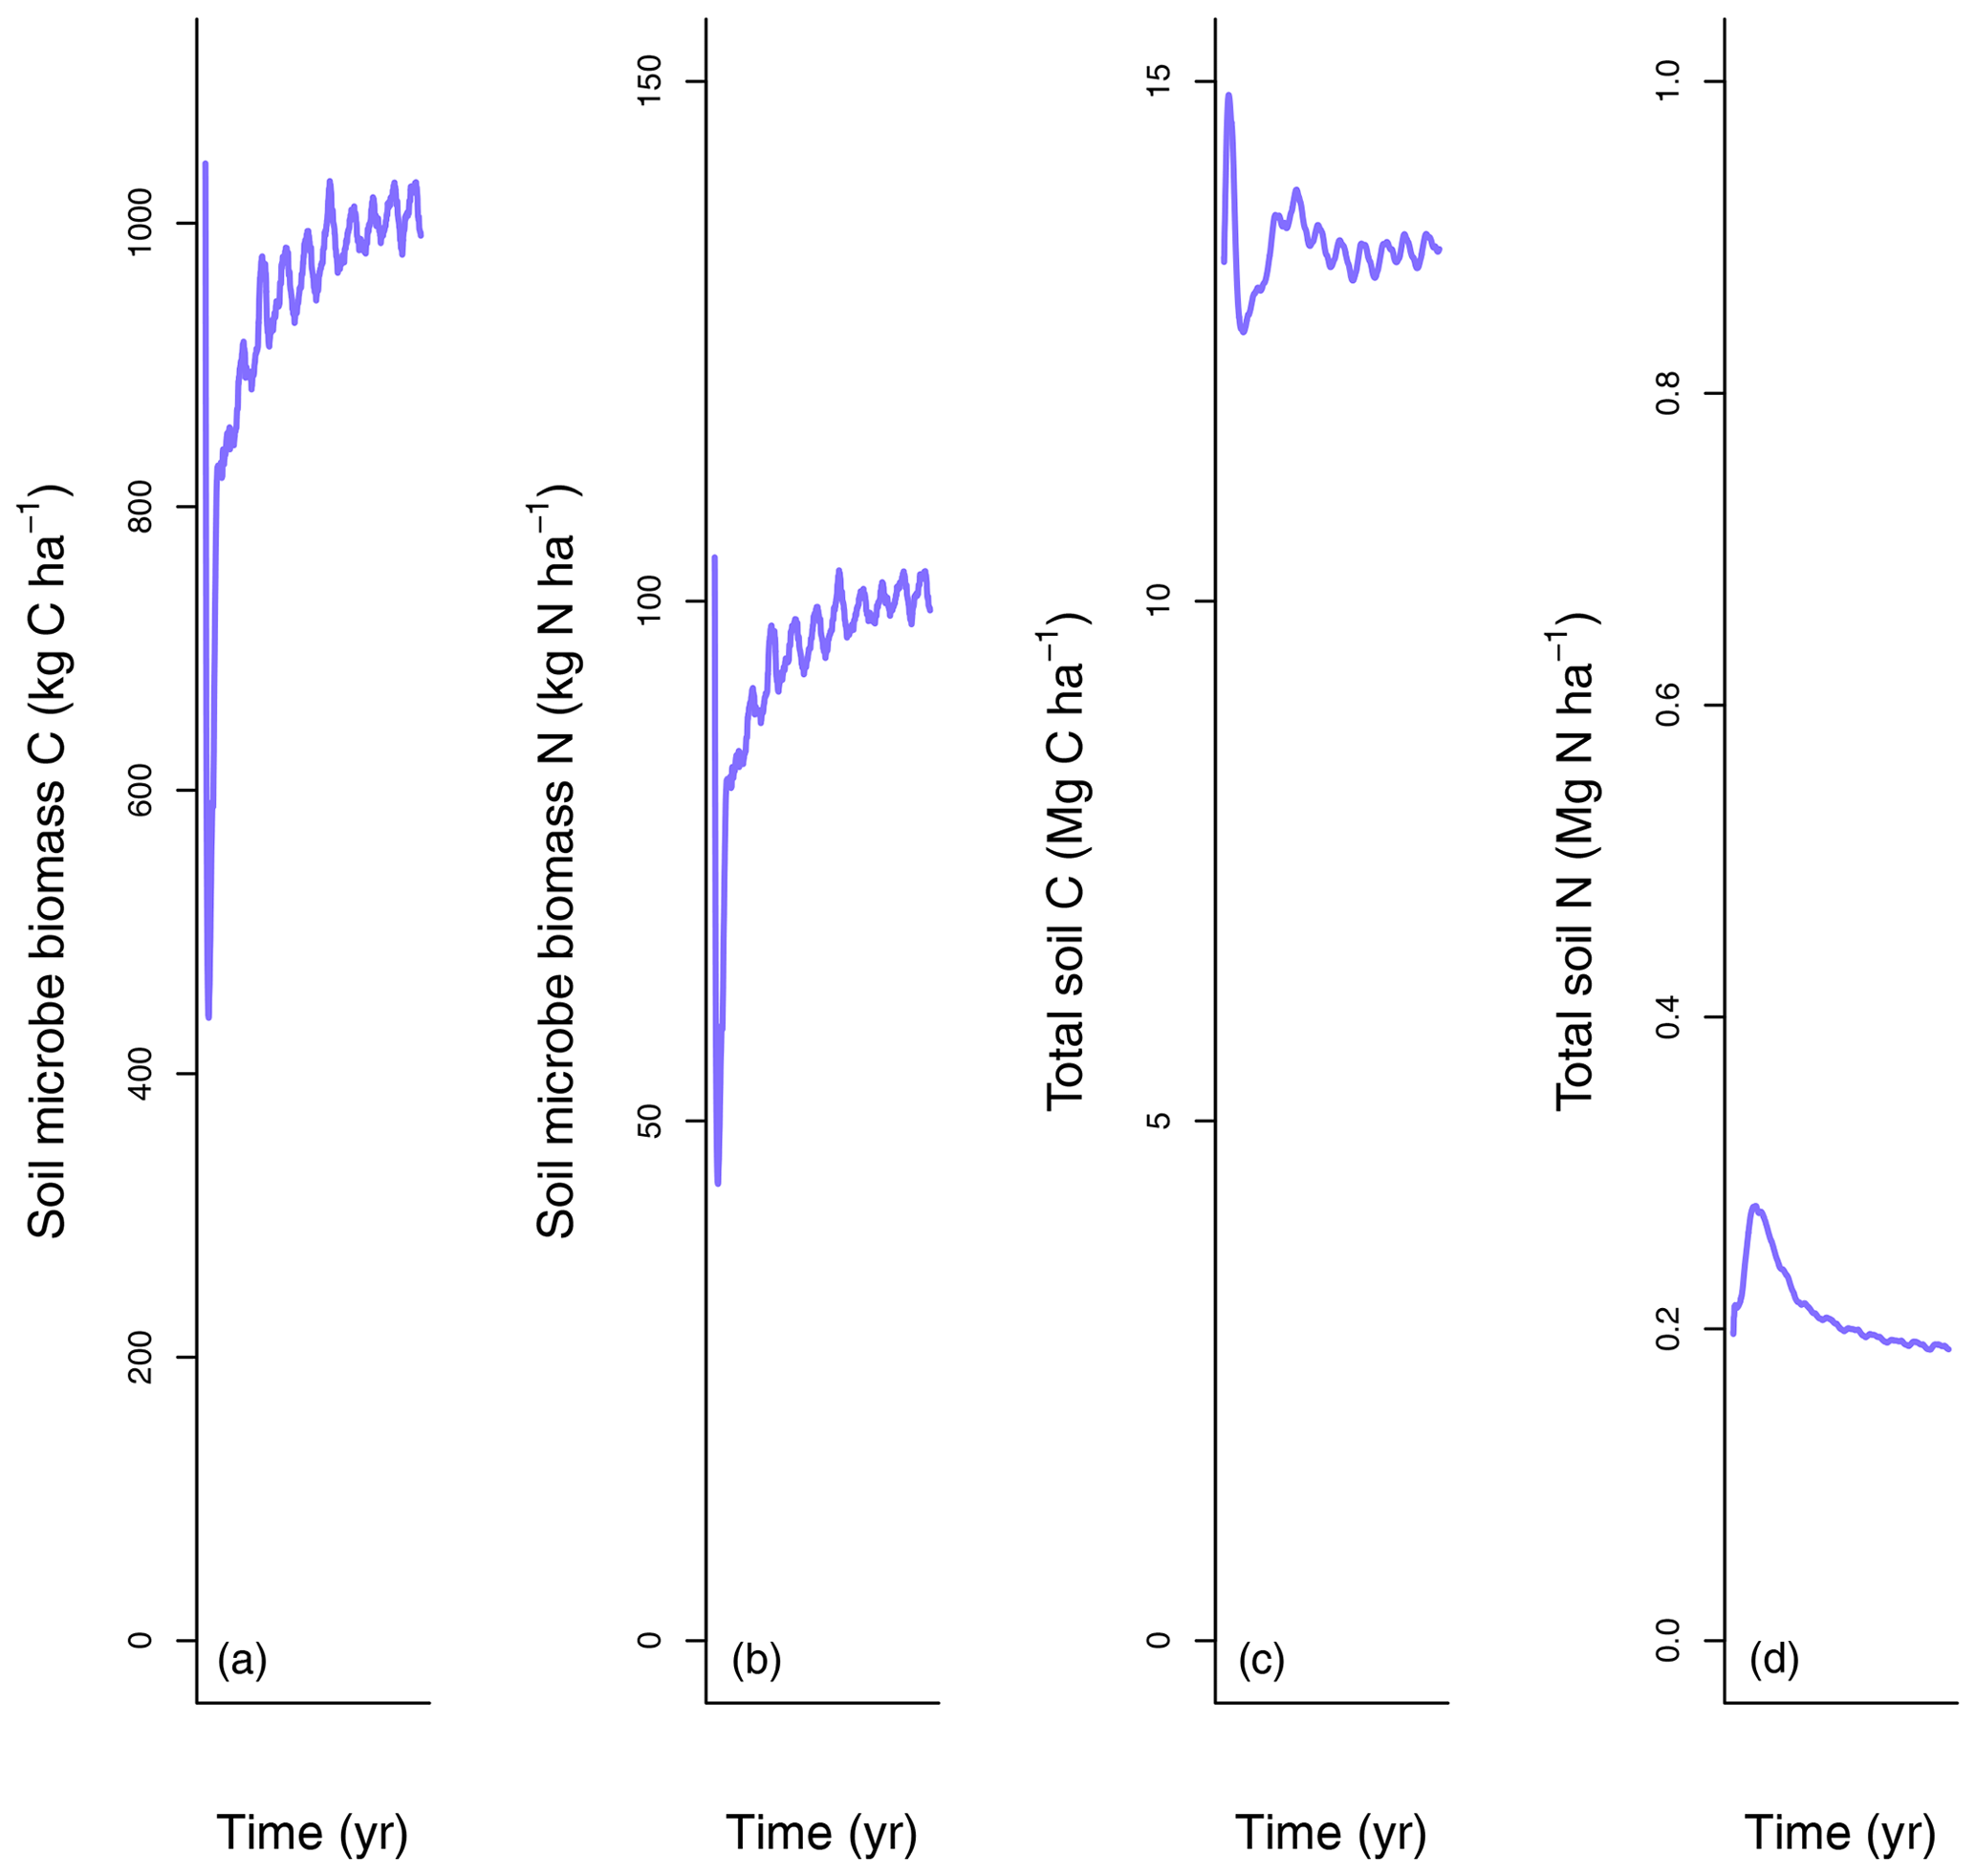
Figure D3Controls of asymbiotic BNF. (a) Soil microbe biomass C, (b) soil microbe biomass N, (c) total soil C, and (d) total soil N.

Figure D4Controls of symbiotic BNF. (a) Nodule biomass C, (b) non-structural C, and (c) N stress.
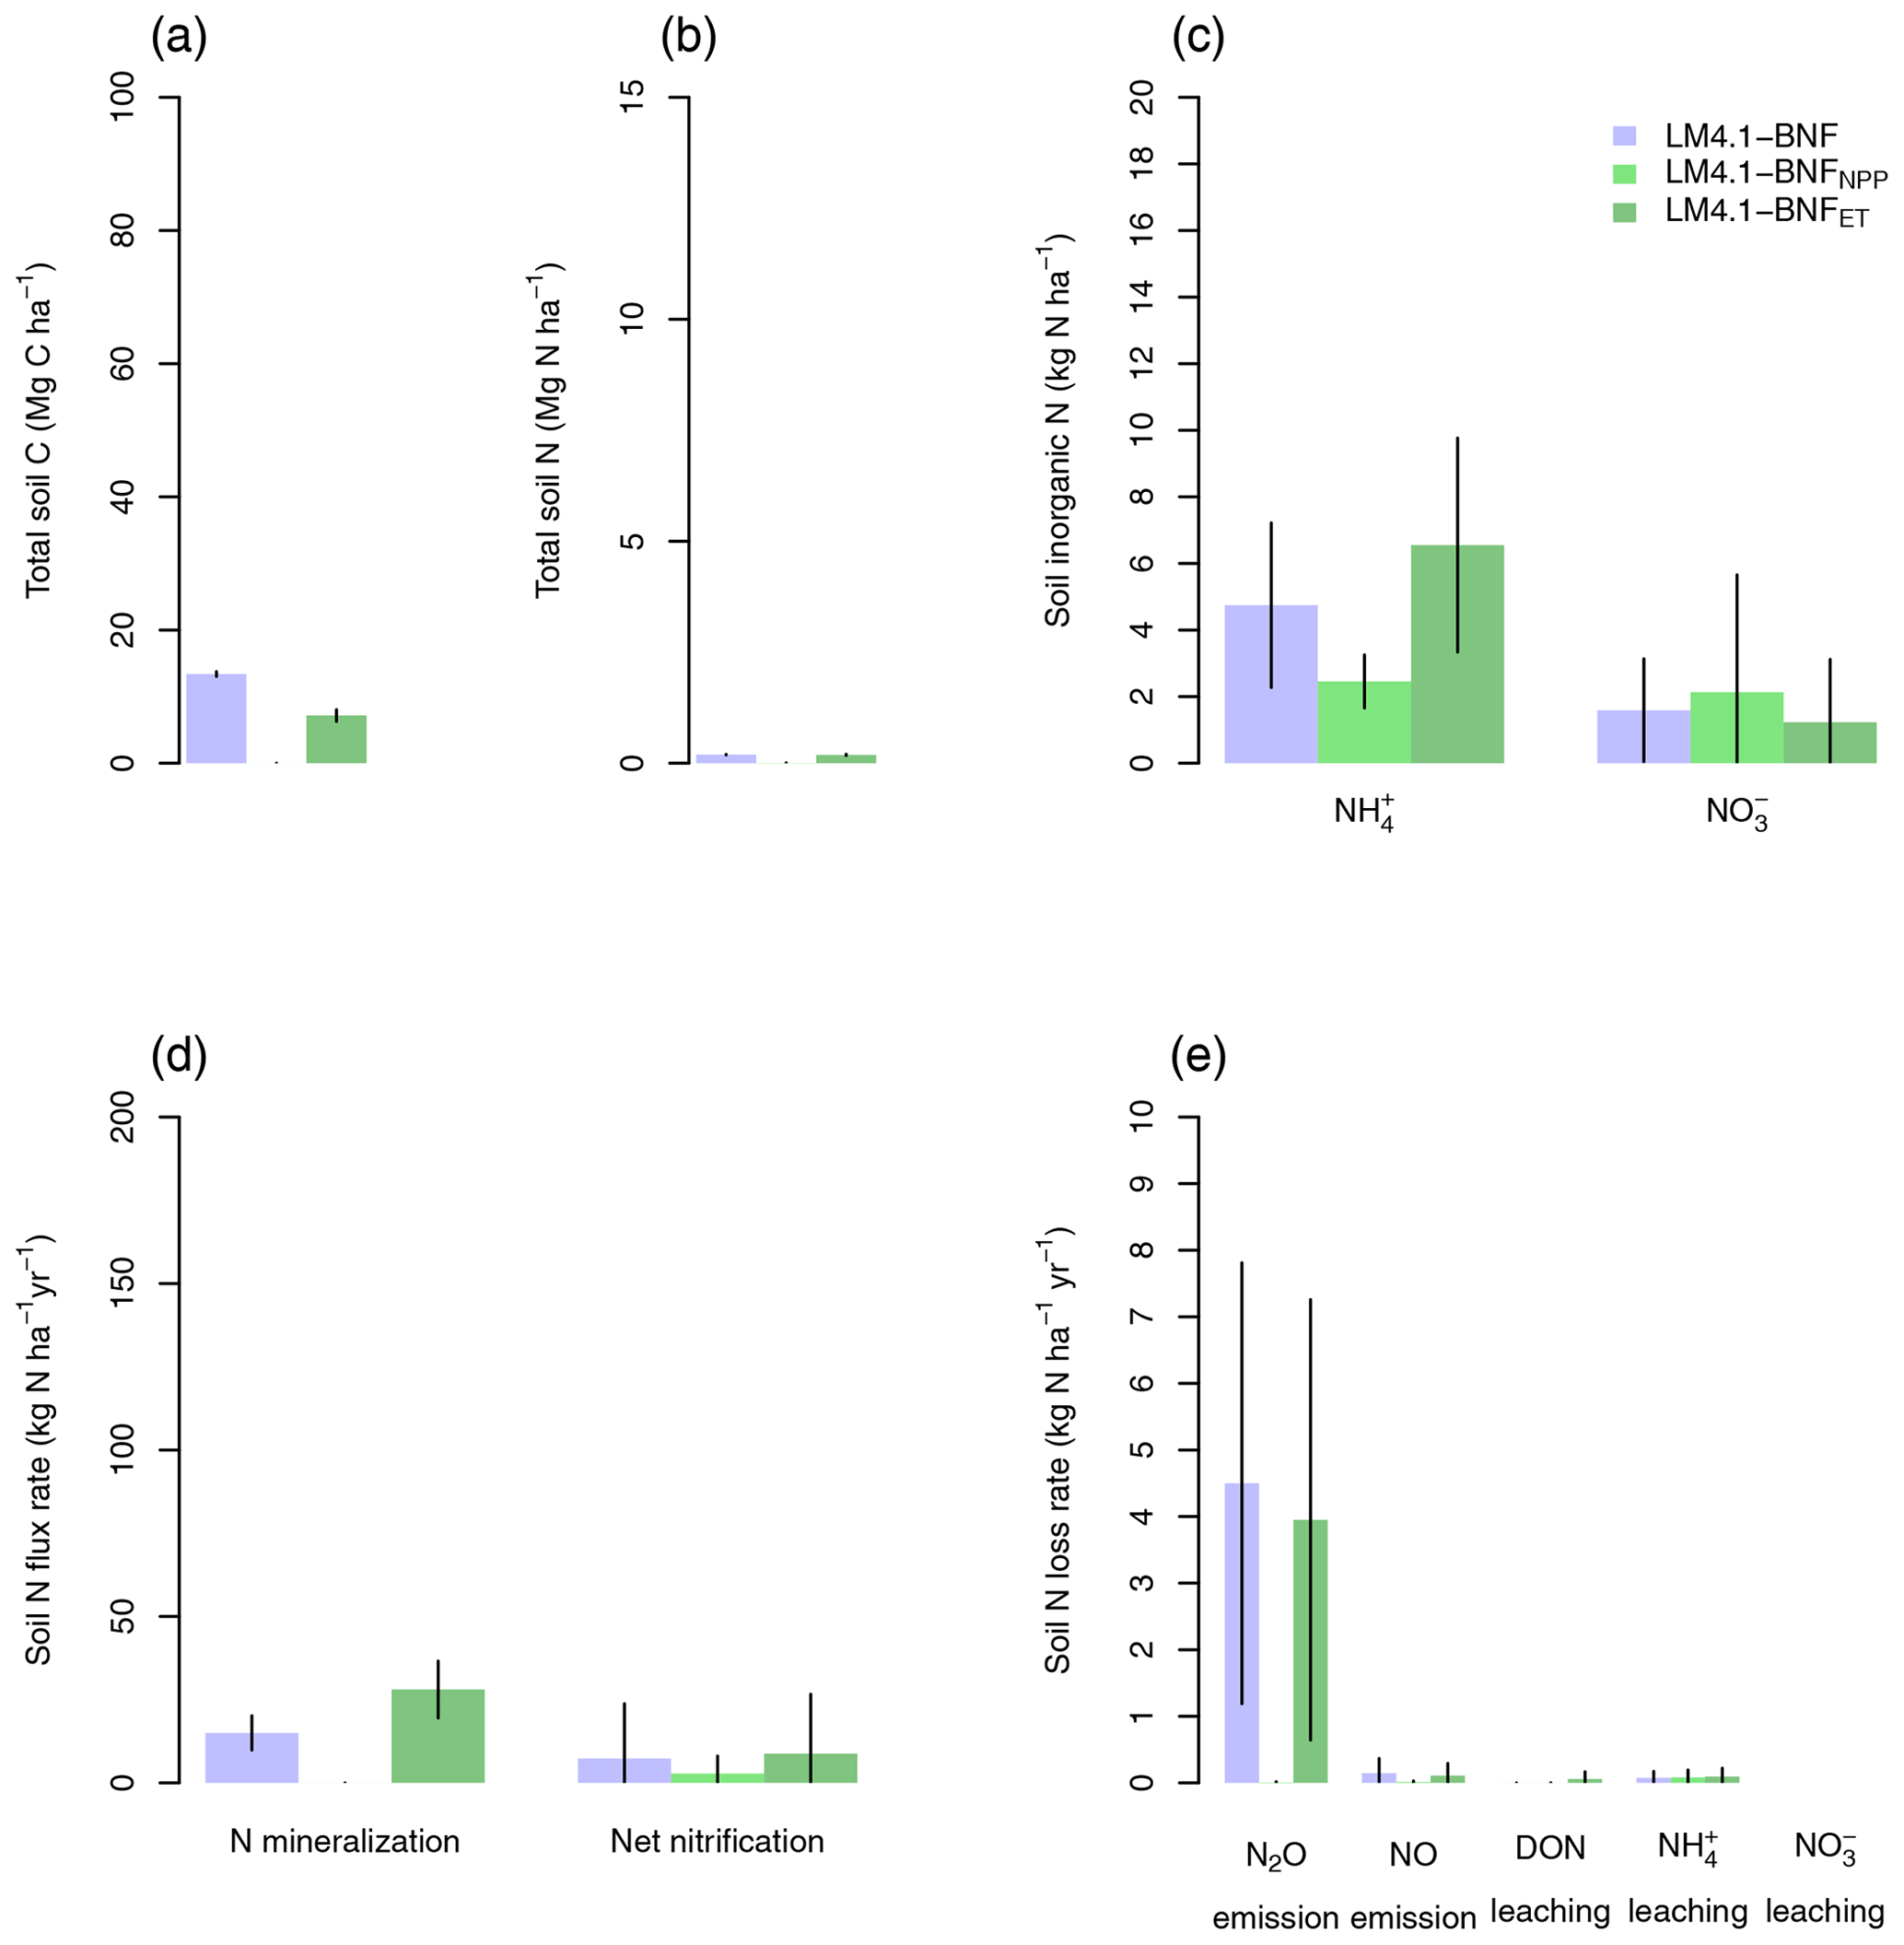
Figure D5Simulated soil C and N pools, soil N fluxes, and soil N loss rates from LM4.1-BNF, LM4.1-BNFNPP, and LM4.1-BNFET. (a) Simulated total soil C (depth 0–10 cm). (b) Simulated total soil N (depth 0–10 cm). (c) Simulated soil and (depth 0–10 cm). (d) N mineralization rate and net nitrification rate (depth 0–10 cm). (e) Simulated N2O and NO emission rate and simulated dissolved organic N (DON), , and leaching rate. Simulated data are averaged over the last 100 of the 300 years of simulation to reflect the site data which are from mature forests. Error bars indicate 2 standard deviations.

Figure D6Simulated gross primary production (GPP), net primary production (NPP), heterotrophic respiration (HR), and net ecosystem production (NEP) from LM4.1-BNF, LM4.1-BNFNPP, and LM4.1-BNFET. Simulated data are averaged over the last 100 of the 300 years of simulation to reflect the data which are from mature forests. Error bars indicate 2 standard deviations.

Figure D7Simulated soil C and N pools, soil N fluxes, and soil N loss rates from LM4.1-BNF initialized with both Robinia and Acer, only Acer, and only N-fixer Acer, with and without asymbiotic BNF. (a) Simulated total soil C (depth 0–10 cm). (b) Simulated total soil N (depth 0–10 cm). (c) Simulated soil and (depth 0–10 cm). (d) N mineralization rate and net nitrification rate (depth 0–10 cm). (e) Simulated N2O and NO emission rate and simulated dissolved organic N (DON), , and leaching rate. Simulated data are averaged over the last 100 of the 300 years of simulation to reflect the site data which are from mature forests. Error bars indicate 2 standard deviations.
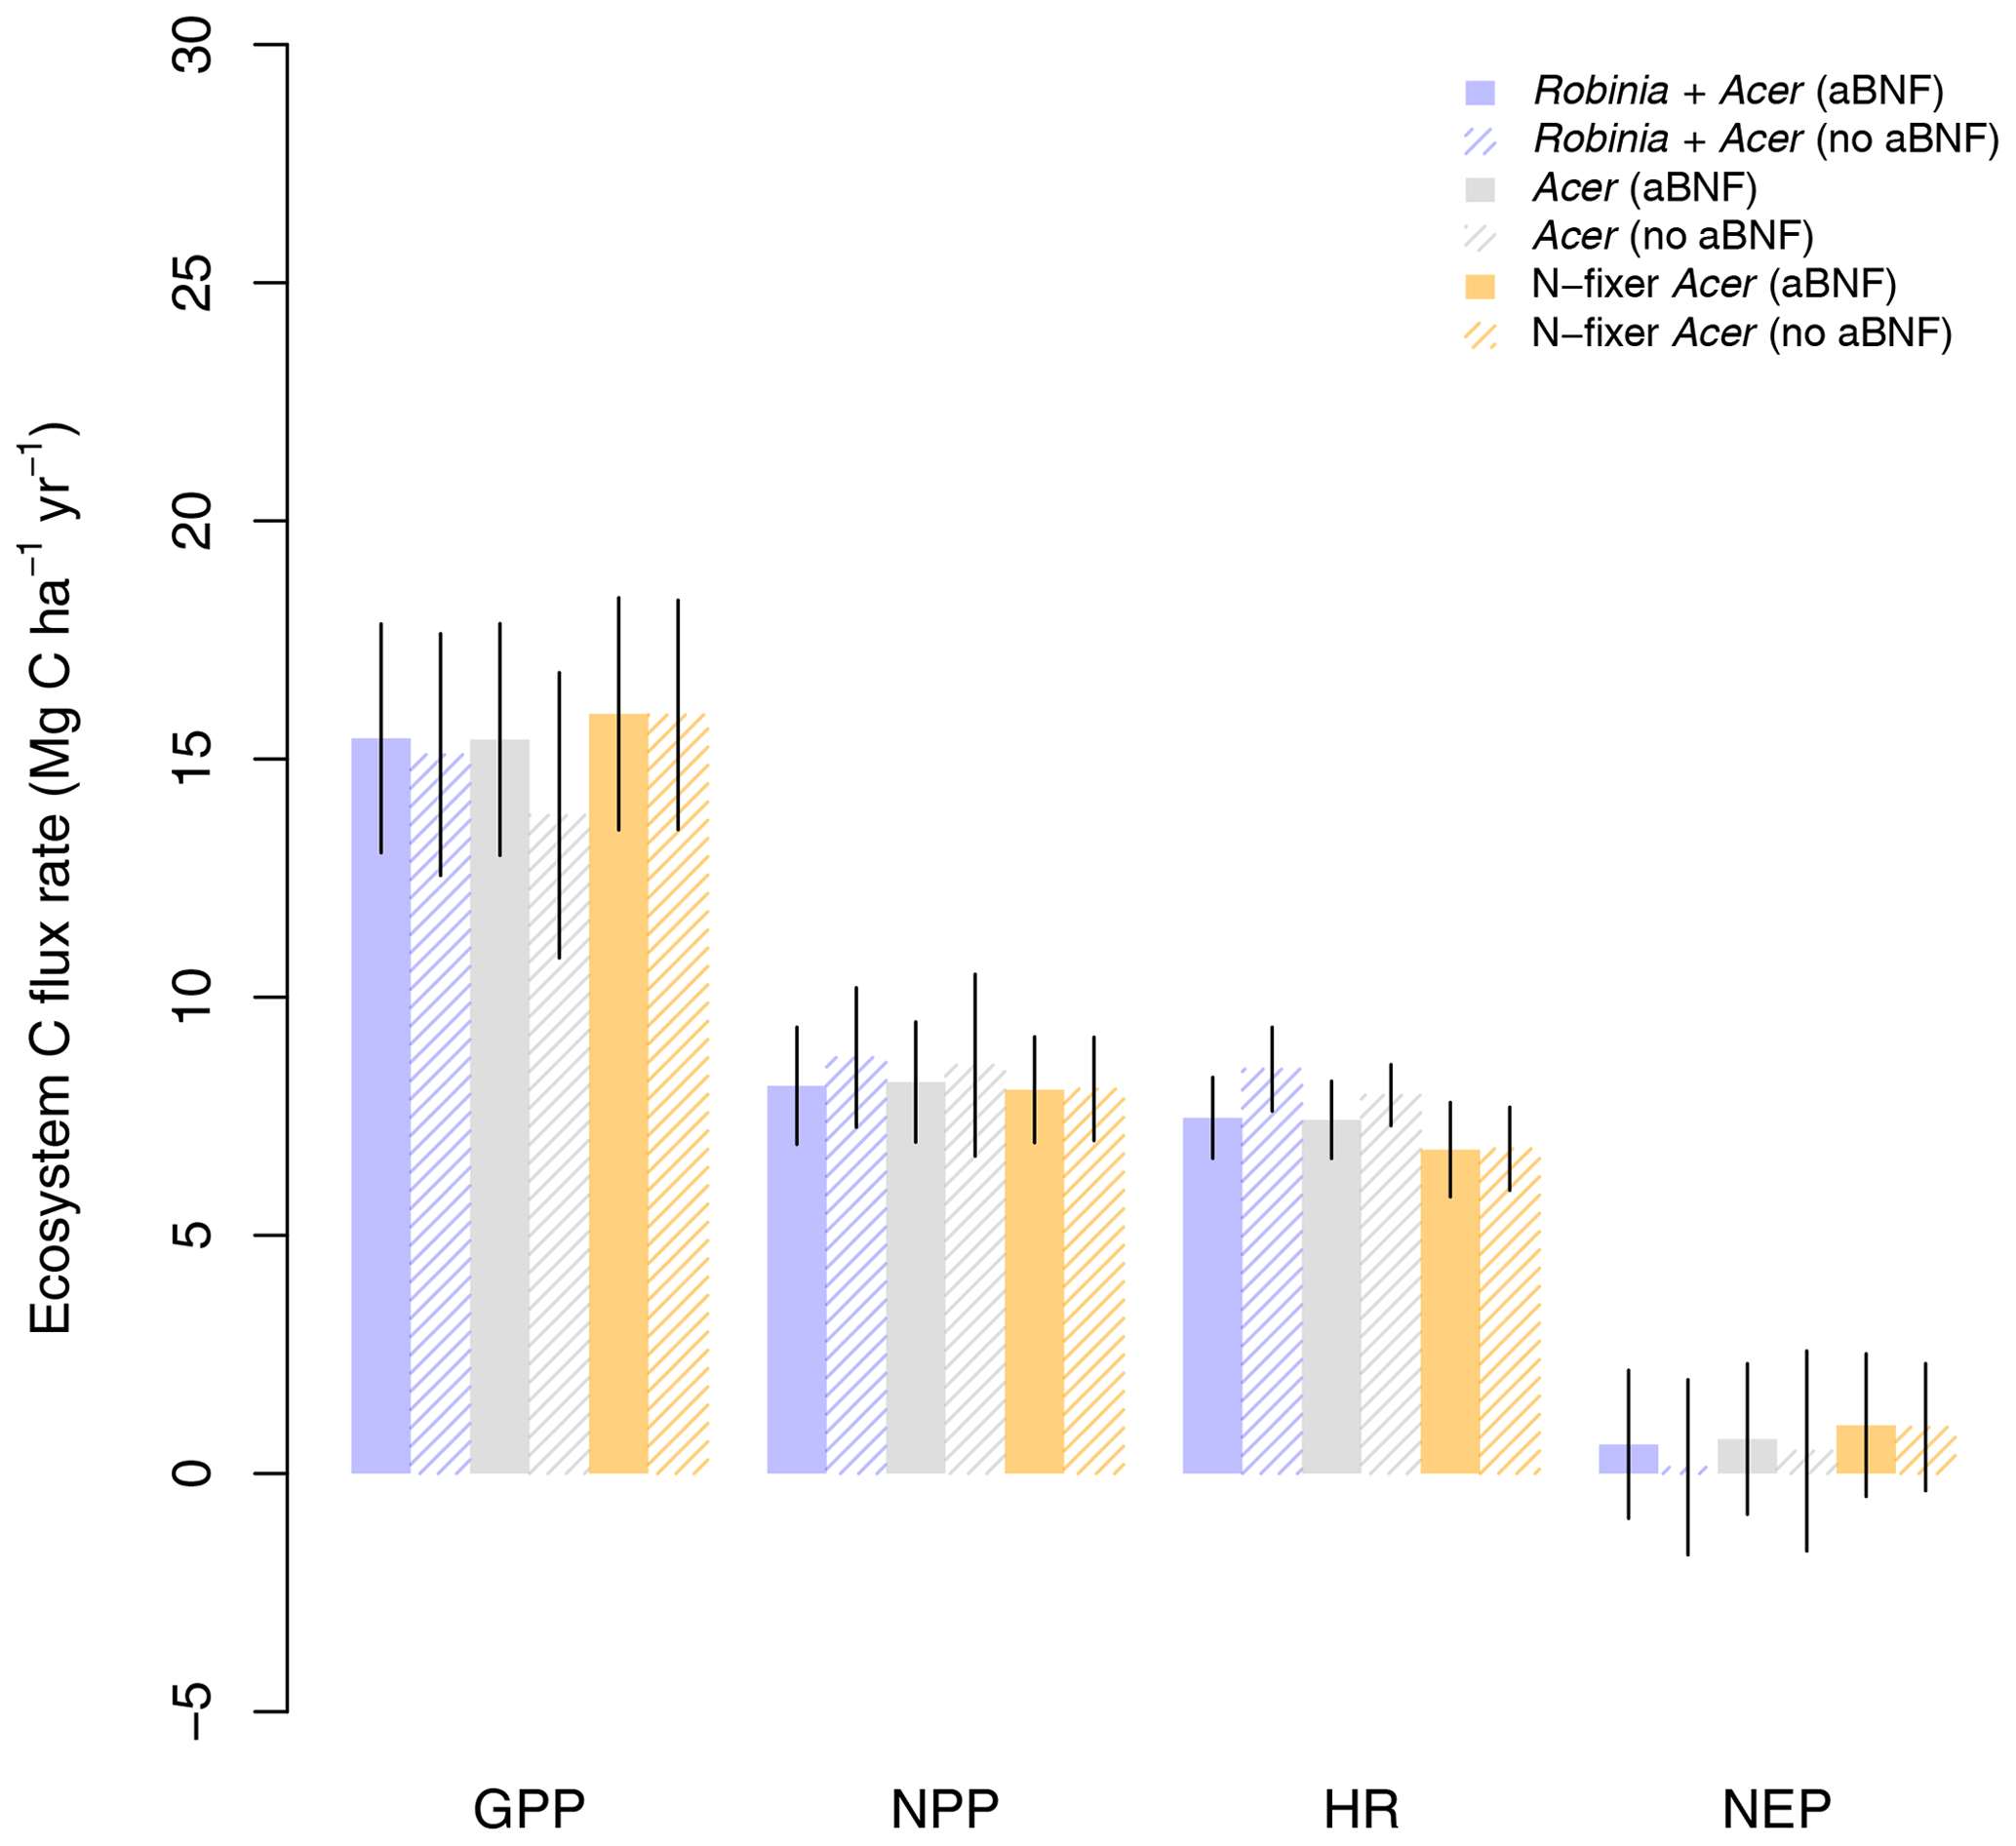
Figure D8Simulated gross primary production (GPP), net primary production (NPP), heterotrophic respiration (HR), and net ecosystem production (NEP) from LM4.1-BNF initialized with both Robinia and Acer, only Acer, and only N-fixer Acer, with and without asymbiotic BNF. Simulated data are averaged over the last 100 of the 300 years of simulation to reflect the data which are from mature forests. Error bars indicate 2 standard deviations.
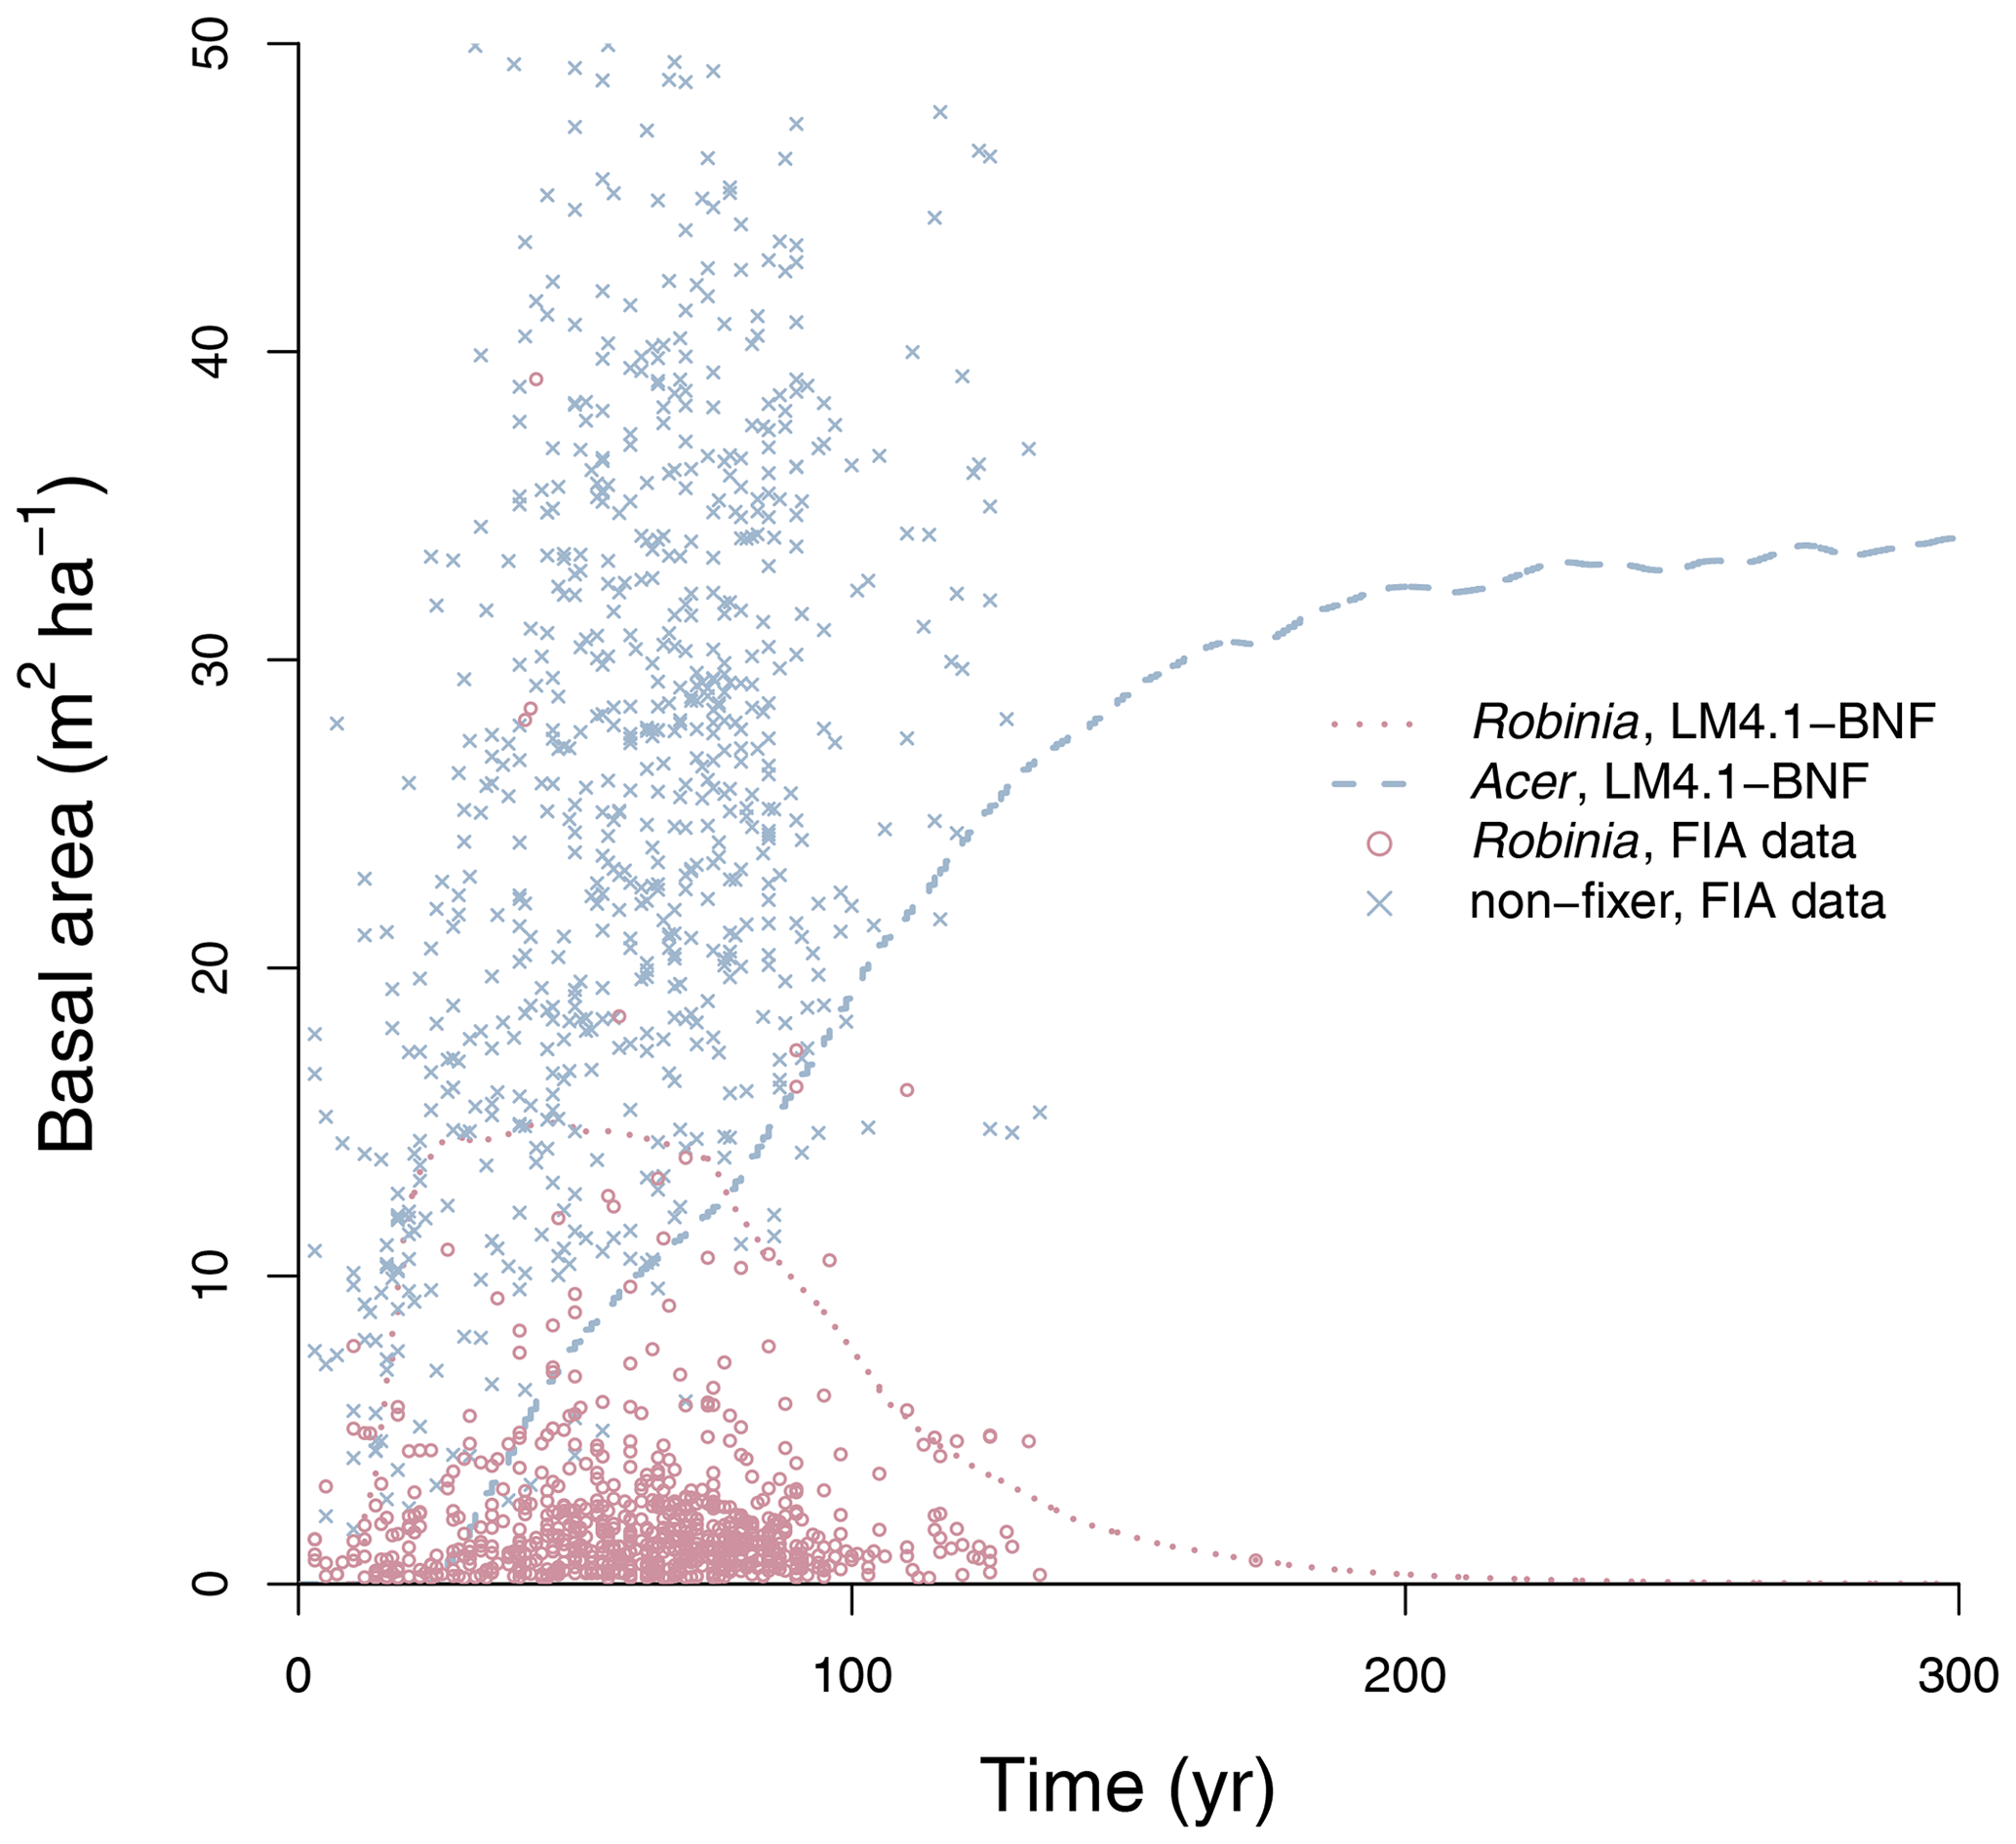
Figure D9Simulated absolute basal area of Acer and Robinia over time compared to FIA data (in North Carolina). Simulated data are trees with dbh>12.7 cm to reflect the dbh range of FIA data. FIA data of all non-fixing trees are aggregated to represent Acer. Each point represents an FIA plot.
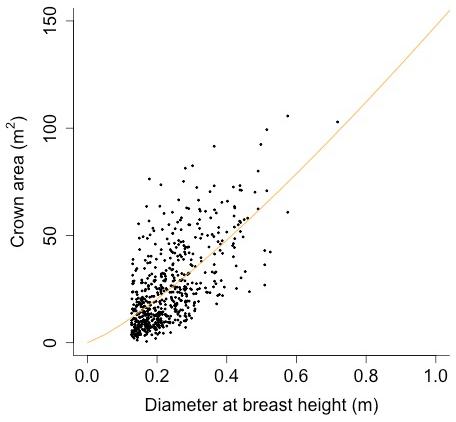
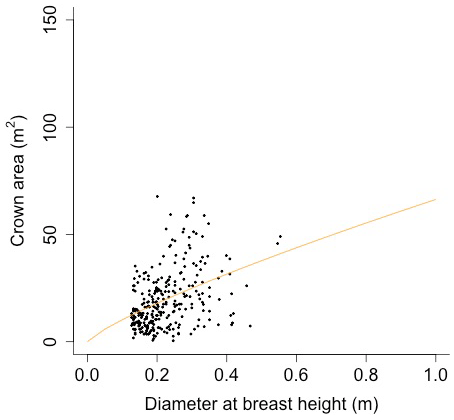
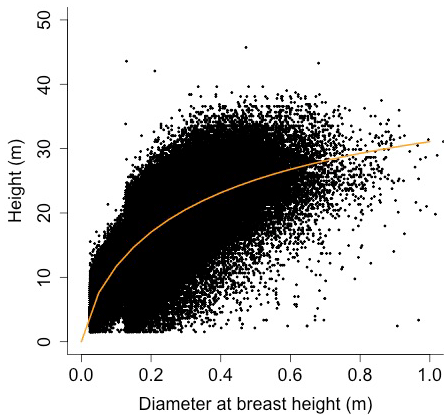
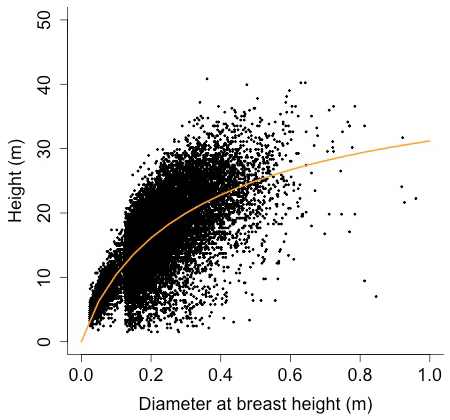
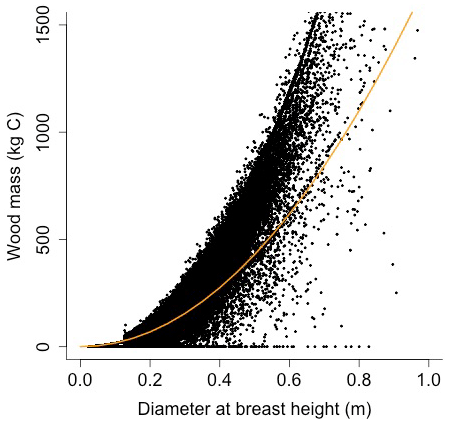
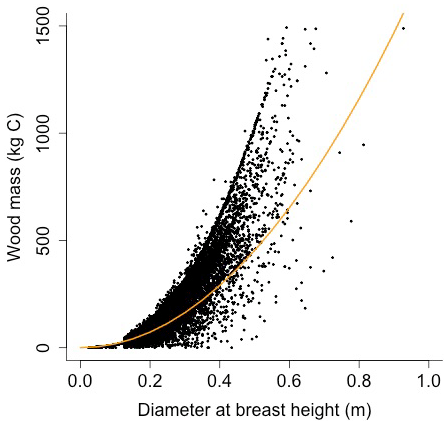
Figure D15Wood mass model fit to FIA data for Robinia (displayed at mean height of Robinia).
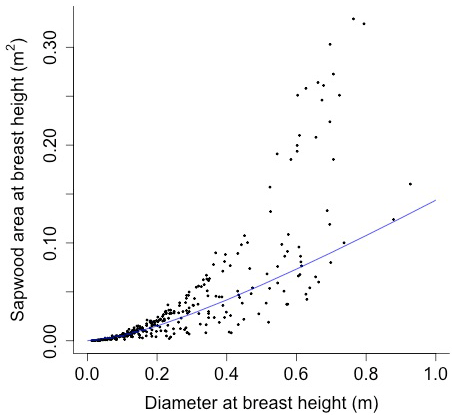
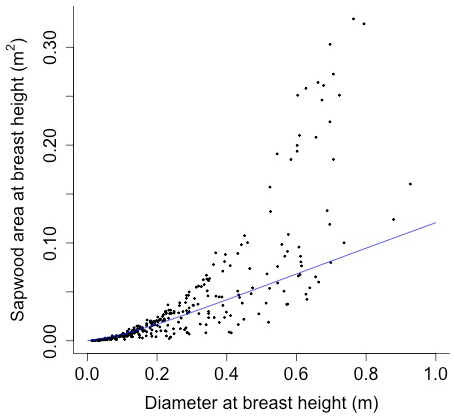

Figure D18Histogram of FIA stand age for FIA plots in North Carolina. These distributions were used to weigh the data displayed in Figs. 2 and 3.
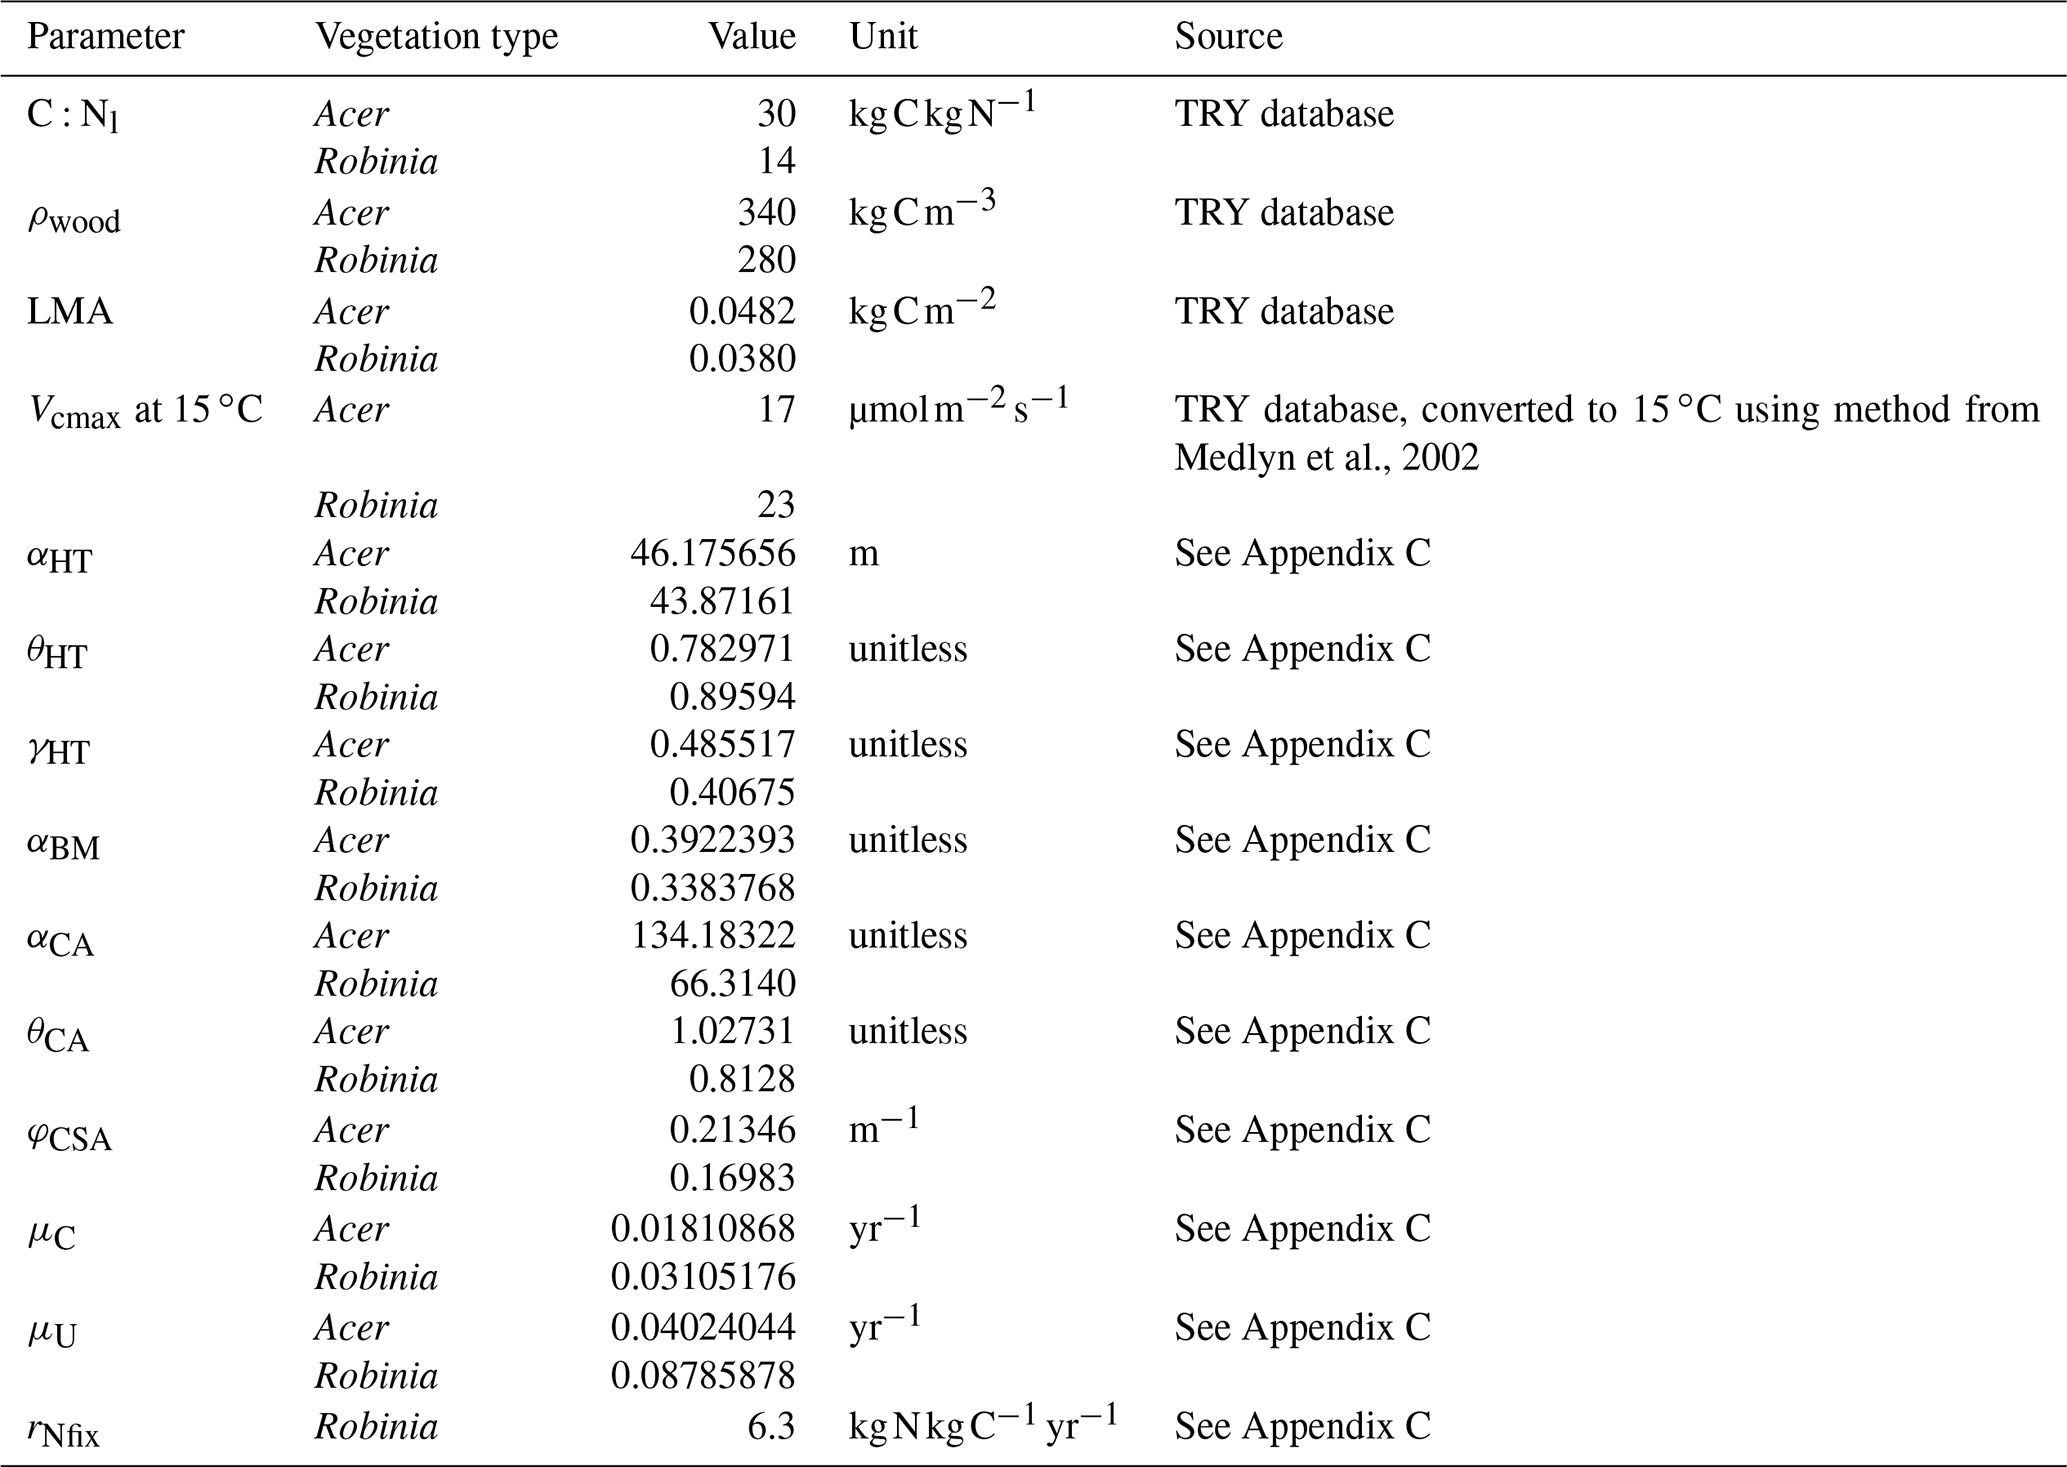
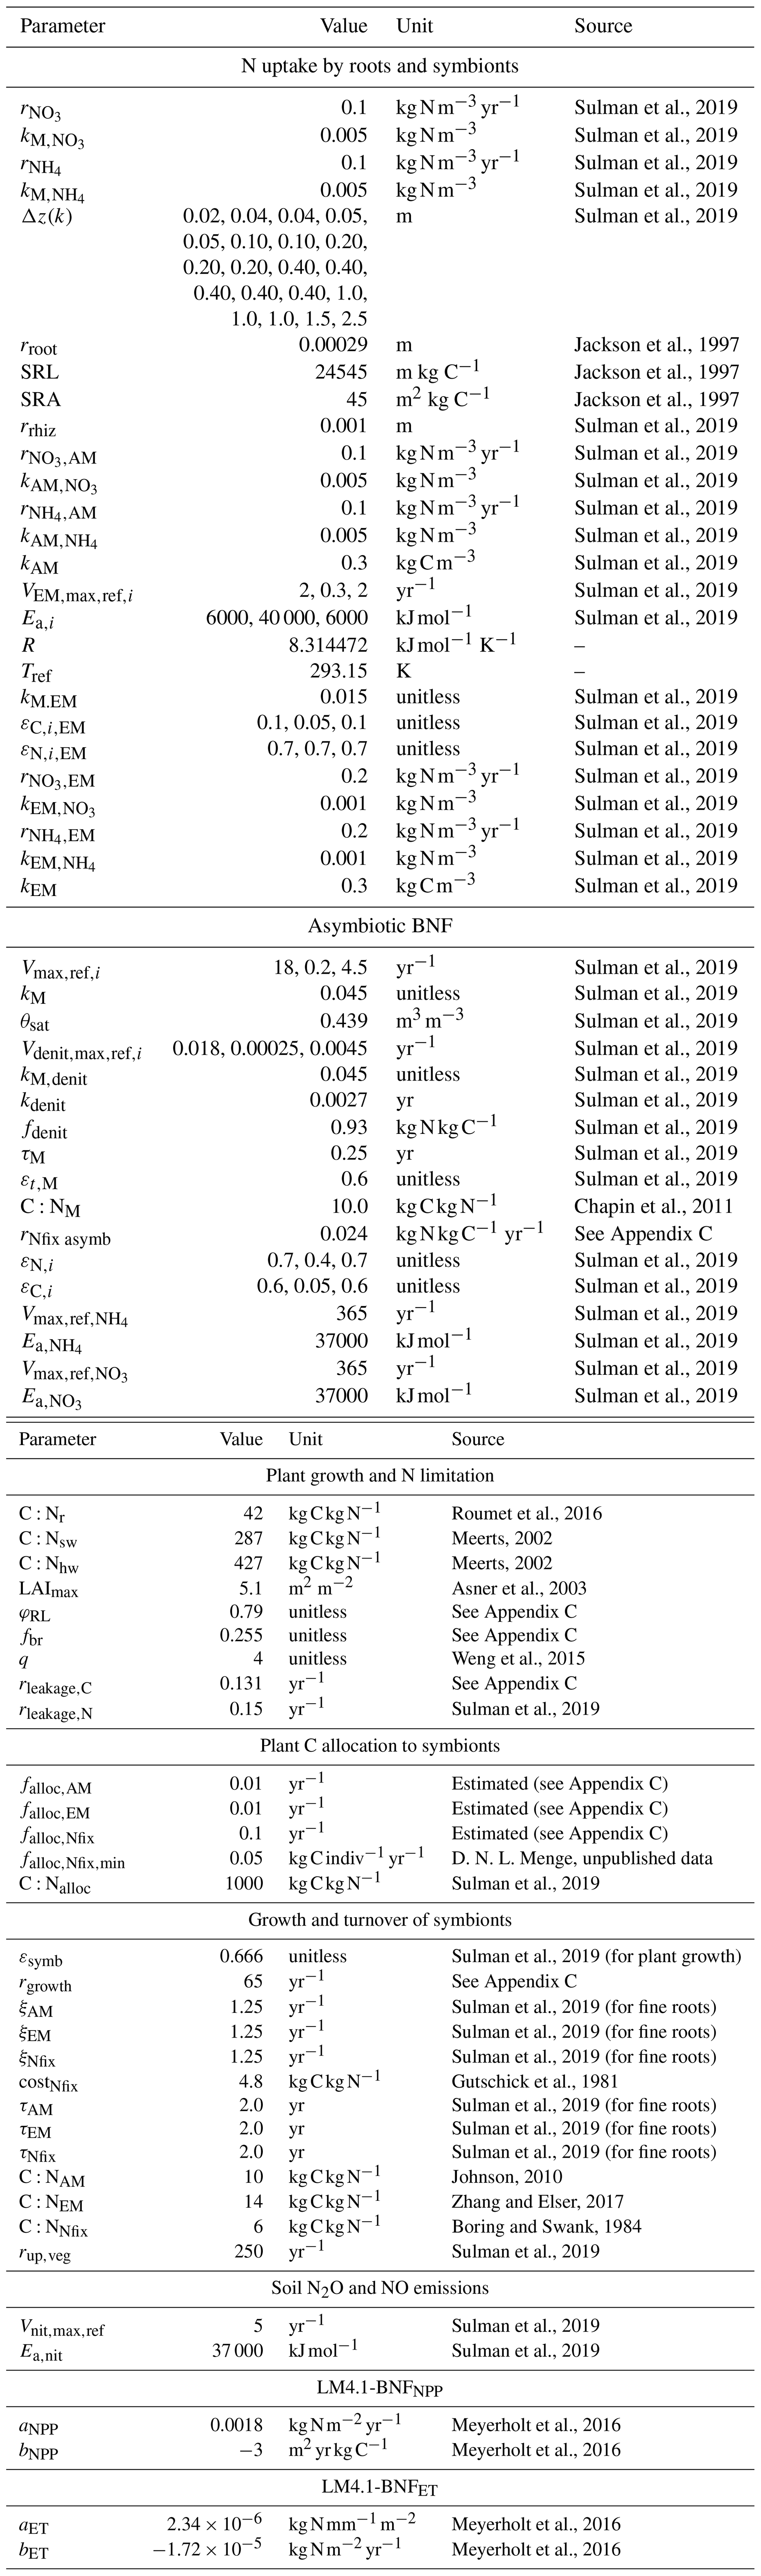
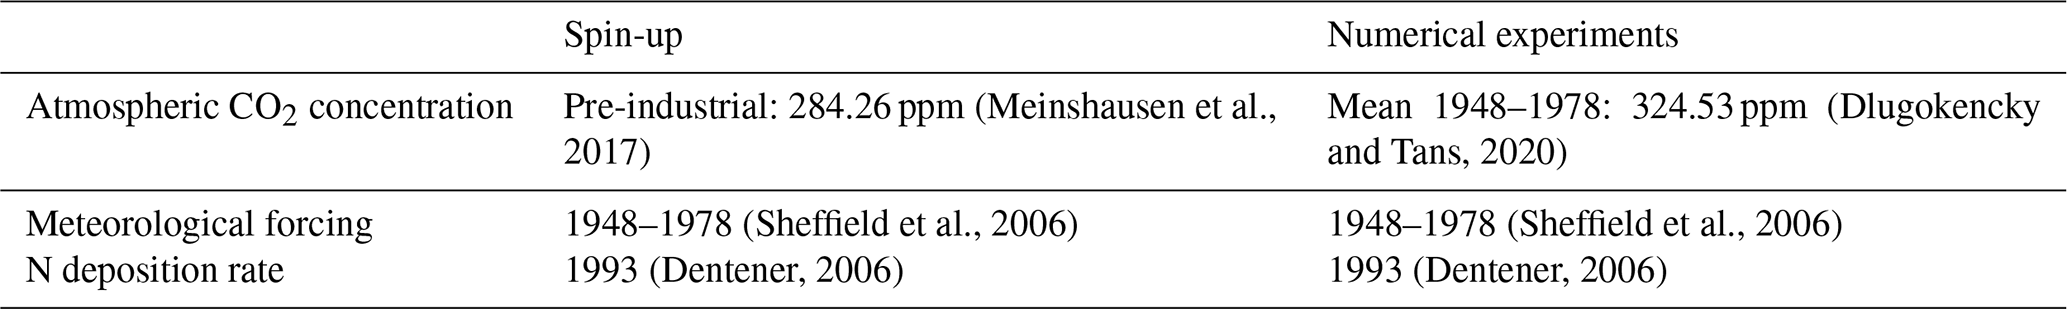
Table D4Initial densities and heights for simulations. The initial densities of Robinia and Acer were derived from the US FIA database seedling data for plots with at least one Robinia individual in North Carolina. Diameter at breast height is determined from height by allometry (Eq. A41).
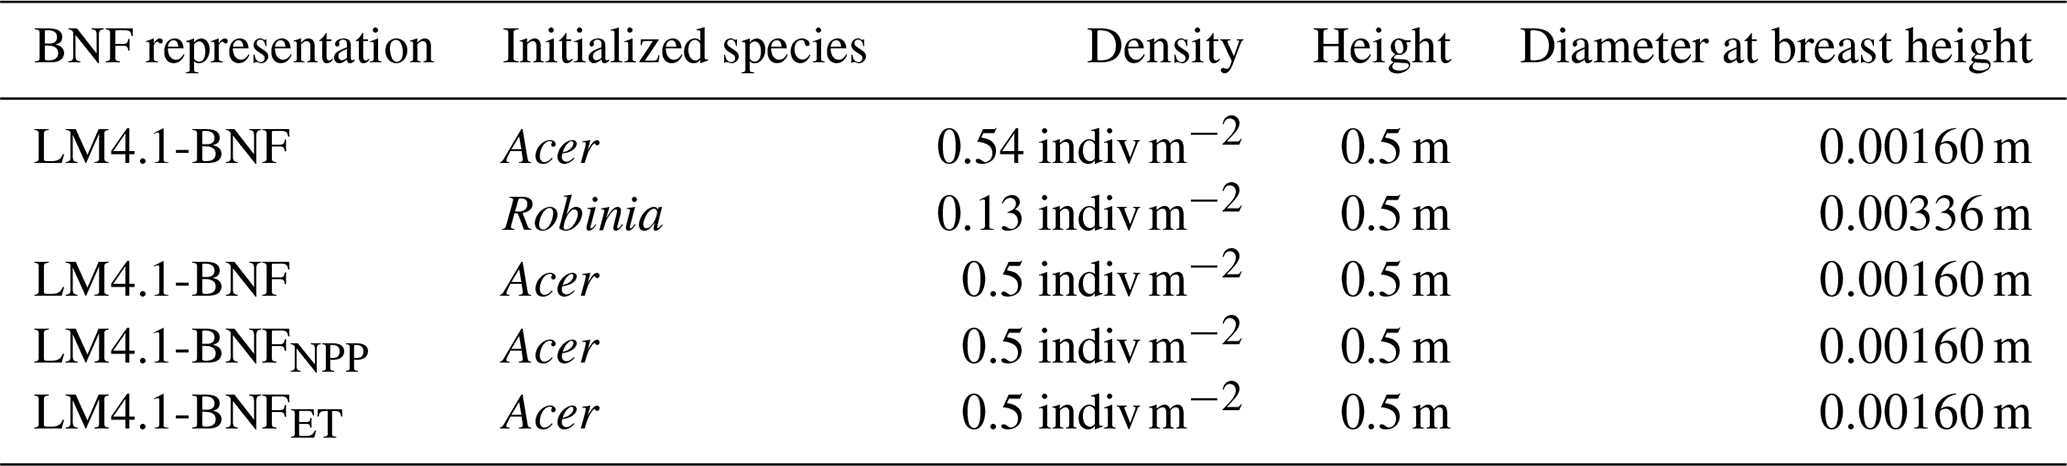

Please contact sk4220@columbia.edu for the code. Full GFDL land model code is available upon request through the GFDL.
Data sets are described and listed in Appendix B.
SKG designed and implemented LM4.1-BNF in collaboration with DNLM, SM, and ES. IMC, SWP, and TAB advised on the new model. SM and ES developed the initial implementation of LM4.1 with LM3-SNAP-based N cycling. SKG conducted the analysis and wrote the initial draft. All authors contributed to the writing.
The authors declare that they have no conflict of interest.
Publisher's note: Copernicus Publications remains neutral with regard to jurisdictional claims in published maps and institutional affiliations.
We thank Ben Sulman for initial assistance with the model. We thank Anika Staccone for assistance with the US FIA database. We thank the Menge lab and the Soper lab for their comments on the manuscript. We acknowledge the support of the Natural Sciences and Engineering Research Council of Canada. Cette recherche a été financée par le Conseil de recherches en sciences naturelles et en génie du Canada.
This research has been supported by the National Science Foundation (grant no. DEB-1457650).
This paper was edited by Trevor Keenan and reviewed by two anonymous referees.
Adams, M. A., Turnbull, T. L., Sprent, J. I., and Buchmann, N.: Legumes are different: Leaf nitrogen, photosynthesis, and water use efficiency, P. Natl. Acad. Sci. USA, 113, 4098–4103, https://doi.org/10.1073/pnas.1523936113, 2016.
Anderson-Teixeira, K. J., Wang, M. M. H., McGarvey, J. C., Herrmann, V., Tepley, A. J., Bond-Lamberty, B., and LeBauer, D. S.: ForC: a global database of forest carbon stocks and fluxes, Ecology, 99, 1507, https://doi.org/10.1002/ecy.2229, 2018.
Arora, V. K., Katavouta, A., Williams, R. G., Jones, C. D., Brovkin, V., Friedlingstein, P., Schwinger, J., Bopp, L., Boucher, O., Cadule, P., Chamberlain, M. A., Christian, J. R., Delire, C., Fisher, R. A., Hajima, T., Ilyina, T., Joetzjer, E., Kawamiya, M., Koven, C. D., Krasting, J. P., Law, R. M., Lawrence, D. M., Lenton, A., Lindsay, K., Pongratz, J., Raddatz, T., Séférian, R., Tachiiri, K., Tjiputra, J. F., Wiltshire, A., Wu, T., and Ziehn, T.: Carbon–concentration and carbon–climate feedbacks in CMIP6 models and their comparison to CMIP5 models, Biogeosciences, 17, 4173–4222, https://doi.org/10.5194/bg-17-4173-2020, 2020.
Asner, G. P., Scurlock, J. M. O., and Hicke, J. A.: Global synthesis of leaf area index observations: implications for ecological and remote sensing studies, Global Ecol. Biogeogr., 12, 191–205, 2003.
Averill, C., Bhatnagar, J. M., Dietze, M. C., Pearse, W. D., and Kivlin, S. N.: Global imprint of mycorrhizal fungi on whole-plant nutrient economics, P. Natl. Acad. Sci. USA, 116, 23163–23168, https://doi.org/10.1073/pnas.1906655116, 2019.
Batterman, S. A., Hedin, L. O., van Breugel, M., Ransijn, J., Craven, D. J., and Hall, J. S.: Key role of symbiotic dinitrogen fixation in tropical forest secondary succession, Nature, 502 , 224–227, https://doi.org/10.1038/nature12525, 2013.
Binkley, D., Sollins, P., Bell, R., Sachs, D., and Myrold, D.: Biogeochemistry of adjacent conifer and alder‐conifer stands, Ecology, 73, 2022–2033, 1992.
Boring, L. R. and Swank, W. T.: The Role of Black Locust (Robinia Pseudo-Acacia) in Forest Succession, J. Ecol., 72, 749–766, 1984.
Bytnerowicz, T. A., Akana, P. R., Griffin, K. L., and Menge, D. N. L.: The temperature sensitivity of woody dinitrogen fixation across species and growing temperatures, in review, 2021.
Canarini, A., Kaiser, C., Merchant, A., Richter, A., and Wanek, W.: Root exudation of primary metabolites: Mechanisms and their roles in plant responses to environmental stimuli, Front. Plant Sci., 10, 1–19, https://doi.org/10.3389/fpls.2019.00157, 2019.
Chan, Y. K.: Temperature response of an associative N2-fixing Pseudomonas species in pure culture, Can. J. Microbiol., 37, 715–718, https://doi.org/10.1139/m91-122, 1991.
Chapin, D. M., Bliss, L. C., and Bledsoe, L. J.: Environmental regulation of nitrogen fixation in a high arctic lowland ecosystem, Can. J. Botany, 69, 2744–2755, https://doi.org/10.1139/b91-345, 1991.
Chapin, F. S., Matson, P. A., and Vitousek, P. M.: Principles of Terrestrial Ecosystem Ecology, Springer Science & Business Media, New York, NY, 2011.
Chapin III, F. S., Walker, L. R., Fastie, C. L., and Sharman, L. C.: Mechanisms of Primary Succession Following Deglaciation at Glacier Bay, Alaska, Ecol. Monogr., 64, 149–175, 1994.
Chapin III, F. S., Conway, A. J., Johnstone, J. F., Hollingsworth, T. N., and Hollingsworth, J.: Absence of net long-term successional facilitation by alder in a boreal Alaska floodplain, Ecology, 97, 2986–2997, https://doi.org/10.1002/ecy.1529, 2016.
Cheng, W., Parton, W. J., Gonzalez-Meler, M. A., Phillips, R., Asao, S., Mcnickle, G. G., Brzostek, E., and Jastrow, J. D.: Synthesis and modeling perspectives of rhizosphere priming, New Phytol., 201, 31–44, https://doi.org/10.1111/nph.12440, 2014.
Cierjacks, A., Kowarik, I., Joshi, J., Hempel, S., Ristow, M., von der Lippe, M., and Weber, E.: Biological flora of the british isles: Robinia pseudoacacia, J. Ecol., 101, 1623–1640, https://doi.org/10.1111/1365-2745.12162, 2013.
Cleveland, C. C., Townsend, A. R., Schimel, D. S., Fisher, H., Hedin, L. O., Perakis, S., Latty, E. F., Von Fischer, C., Elseroad, A., and Wasson, M. F.: Global patterns of terrestrial biological nitrogen (N2) fixation in natural ecosystems, Global Biochem. Cy., 13, 623–645, https://doi.org/10.1029/1999GB900014, 1999.
Coxson, D. S. and Kershaw, K. A.: Rehydration response of nitrogenase activity and carbon fixation in terrestrial Nostoc commune from Stipa-Bouteola grassland, Can. J. Botany, 61, 2658–2668, https://doi.org/10.1139/b83-293, 1983.
Crowther, T. W., Glick, H. B., Covey, K. R., Bettigole, C., Maynard, D. S., Thomas, S. M., Smith, J. R., Hintler, G., Duguid, M. C., Amatulli, G., Tuanmu, M.-N., Jetz, W., Salas, C., Stam, C., Piotto, D., Tavani, R., Green, S., Bruce, G., Williams, S. J., Wiser, S. K., Huber, M. O., Hengeveld, G. M., Nabuurs, G.-J., Tikhonova, E., Borchardt, P., Li, C.-F., Powrie, L. W., Fischer, M., Hemp, A., Homeier, J., Cho, P., Vibrans, A. C., Umunay, P. M., Piao, S. L., Rowe, C. W., Ashton, M. S., Crane, P. R., and Bradford, M. A.: Mapping tree density at a global scale, Nature, 525, 201–205, https://doi.org/10.1038/nature14967, 2015.
Davies-Barnard, T. and Friedlingstein, P.: The Global Distribution of Biological Nitrogen Fixation in Terrestrial Natural Ecosystems, Global Biogeochem. Cy., 34, 1–17, https://doi.org/10.1029/2019GB006387, 2020.
Davies-Barnard, T., Meyerholt, J., Zaehle, S., Friedlingstein, P., Brovkin, V., Fan, Y., Fisher, R. A., Jones, C. D., Lee, H., Peano, D., Smith, B., Wårlind, D., and Wiltshire, A. J.: Nitrogen cycling in CMIP6 land surface models: progress and limitations, Biogeosciences, 17, 5129–5148, https://doi.org/10.5194/bg-17-5129-2020, 2020.
DeLuca, T. H., Zackrisson, O., Nilsson, M.-C., and Sellstedt, A.: Quantifying nitrogen-fixation in feather moss carpets of boreal forests, Nature, 419, 917–920, https://doi.org/10.1038/nature01051, 2002.
Dentener, F. J.: Global Maps of Atmospheric Nitrogen Deposition, 1860, 1993, and 2050, ORNL DAAC, Oak Ridge, Tennessee, USA, https://doi.org/10.3334/ORNLDAAC/830, 2006.
Dlugokencky, E. and Tans, P.: Trends in atmospheric carbon dioxide, online, available at: https://www.esrl.noaa.gov/gmd/ccgg/trends/gl_data.html (last access: November 2019), 2020.
Elser, J. J., Bracken, M. E. S., Cleland, E. E., Gruner, D. S., Harpole, W. S., Hillebrand, H., Ngai, J. T., Seabloom, E. W., Shurin, J. B., and Smith, J. E.: Global analysis of nitrogen and phosphorus limitation of primary producers in freshwater, marine and terrestrial ecosystems, Ecol. Lett., 10, 1135–1142, https://doi.org/10.1111/j.1461-0248.2007.01113.x, 2007.
Falster, D. S., Duursma, R. A., Ishihara, M. I., Barneche, D. R., FitzJohn, R. G., Vårhammar, A., Aiba, M., Ando, M., Anten, N., Aspinwall, M. J., Baltzer, J. L., Baraloto, C., Battaglia, M., Battles, J. J., Lamberty, B. B., Van Breugel, M., Camac, J., Claveau, Y., Coll, L., Dannoura, M., Delagrange, S., Domec, J. C., Fatemi, F., Feng, W., Gargaglione, V., Goto, Y., Hagihara, A., Hall, J. S., Hamilton, S., Harja, D., Hiura, T., Holdaway, R., Hutley, L. B., Ichie, T., Jokela, E. J., Kantola, A., Kelly, J. W. G., Kenzo, T., King, D., Kloeppel, B. D., Kohyama, T., Komiyama, A., Laclau, J. P., Lusk, C. H., Maguire, D. A., Le Maire, G., Mäkelä, A., Markesteijn, L., Marshall, J., McCulloh, K., Miyata, I., Mokany, K., Mori, S., Myster, R. W., Nagano, M., Naidu, S. L., Nouvellon, Y., O'Grady, A. P., O'Hara, K. L., Ohtsuka, T., Osada, N., Osunkoya, O. O., Peri, P. L., Petritan, A. M., Poorter, L., Portsmuth, A., Potvin, C., Ransijn, J., Reid, D., Ribeiro, S. C., Roberts, S. D., Rodríguez, R., Acosta, A. S., Santa-Regina, I., Sasa, K., Selaya, N. G., Sillett, S. C., Sterck, F., Takagi, K., Tange, T., Tanouchi, H., Tissue, D., Umehara, T., Utsugi, H., Vadeboncoeur, M. A., Valladares, F., Vanninen, P., Wang, J. R., Wenk, E., Williams, R., De Aquino Ximenes, F., Yamaba, A., Yamada, T., Yamakura, T., Yanai, R. D., and York, R. A.: BAAD: a Biomass And Allometry Database for woody plants, Ecology, 96, 1445, https://doi.org/10.1890/14-1889.1, 2015.
Finzi, A. C., Abramoff, R. Z., Spiller, K. S., Brzostek, E. R., Darby, B. A., Kramer, M. A., and Phillips, R. P.: Rhizosphere processes are quantitatively important components of terrestrial carbon and nutrient cycles, Glob. Change Biol., 21, 2082–2094, https://doi.org/10.1111/gcb.12816, 2015.
Fowler, D., Coyle, M., Skiba, U., Sutton, M. A., Cape, J. N., Reis, S., Sheppard, L. J., Jenkins, A., Grizzetti, B., Galloway, J. N., Vitousek, P., Leach, A., Bouwman, A. F., Butterbach-Bahl, K., Dentener, F., Stevenson, D., Amann, M., and Voss, M.: The global nitrogen cycle in the twenty-first century, Philos. T. R. Soc. B, 368, 20130164, https://doi.org/10.1098/rstb.2013.0164, 2013.
Goll, D. S., Winkler, A. J., Raddatz, T., Dong, N., Prentice, I. C., Ciais, P., and Brovkin, V.: Carbon–nitrogen interactions in idealized simulations with JSBACH (version 3.10), Geosci. Model Dev., 10, 2009–2030, https://doi.org/10.5194/gmd-10-2009-2017, 2017.
Gutschick, V. P.: Evolved Strategies in Nitrogen Acquisition by Plants, Am. Nat., 118, 607–637, 1981.
Haverd, V., Smith, B., Nieradzik, L., Briggs, P. R., Woodgate, W., Trudinger, C. M., Canadell, J. G., and Cuntz, M.: A new version of the CABLE land surface model (Subversion revision r4601) incorporating land use and land cover change, woody vegetation demography, and a novel optimisation-based approach to plant coordination of photosynthesis, Geosci. Model Dev., 11, 2995–3026, https://doi.org/10.5194/gmd-11-2995-2018, 2018.
Hoch, G., Richter, A., and Körner, C.: Non-structural carbon compounds in temperate forest trees, Plant Cell Environ., 26, 1067–1081, https://doi.org/10.1046/j.0016-8025.2003.01032.x, 2003.
Houlton, B. Z., Wang, Y. P., Vitousek, P. M., and Field, C. B.: A unifying framework for dinitrogen fixation in the terrestrial biosphere, Nature, 454, 327–330, https://doi.org/10.1038/nature07028, 2008.
Huang, Y. and Gerber, S.: Global soil nitrous oxide emissions in a dynamic carbon-nitrogen model, Biogeosciences, 12, 6405–6427, https://doi.org/10.5194/bg-12-6405-2015, 2015.
Hulvey, K. B., Hobbs, R. J., Standish, R. J., Lindenmayer, D. B., Lach, L., and Perring, M. P.: Benefits of tree mixes in carbon plantings, Nat. Clim. Change, 3, 869–874, https://doi.org/10.1038/nclimate1862, 2013.
Jackson, R. B., Mooney, H. A., and Schulze, E.-D.: A global budget for fine root biomass, surface area, and nutrient contents, P. Natl. Acad. Sci. USA, 94, 7362–7366, 1997.
Johnson, N. C.: Resource Stoichiometry Elucidates the Structure and Function of Arbuscular Mycorrhizas across Scales, New Phytol., 185, 631–647, https://doi.org/10.1111/j.1469-8137.2009.03110.x, 2010.
Jones, D. L., Nguyen, C., and Finlay, R. D.: Carbon flow in the rhizosphere: Carbon trading at the soil-root interface, Plant Soil, 321, 5–33, https://doi.org/10.1007/s11104-009-9925-0, 2009.
Kattge, J., Bönisch, G., Díaz, S., et al.: TRY plant trait database–enhanced coverage and open access, Glob. Change Biol., 26, 119–188, 2020.
Knoepp, J.: Measurements of Soil Bulk Density at the Coweeta Terrestrial Gradient Sites, online, available at: https://coweeta.uga.edu/ResearchData.html (last access: November 2019), 2009a.
Knoepp, J.: Measurements of Soil Nitrogen Transformations at the Coweeta Terrestrial Gradient Sites, online, available at: https://coweeta.uga.edu/ResearchData.html (last access: November 2019), 2009b.
Knoepp, J.: Measurements of Soil %C and %N at the Coweeta Terrestrial Gradient Sites, online, available at: https://coweeta.uga.edu/ResearchData.html (last access: November 2019), 2018.
Kou-Giesbrecht, S. and Menge, D. N. L.: Nitrogen-fixing trees increase soil nitrous oxide emissions: a meta-analysis, Ecology, accepted, https://doi.org/10.1002/ecy.3415, 2021.
Lai, H. R., Hall, J. S., Batterman, S. A., Turner, B. L., and van Breugel, M.: Nitrogen fixer abundance has no effect on biomass recovery during tropical secondary forest succession, J. Ecol., 106, 1415–1427, https://doi.org/10.1111/1365-2745.12979, 2018.
Lawrence, D. M., Fisher, R. A., Koven, C. D., Oleson, K. W., Swenson, S. C., Bonan, G., Collier, N., Ghimire, B., van Kampenhout, L., Kennedy, D., Kluzek, E., Lawrence, P. J., Li, F., Li, H., Lombardozzi, D., Riley, W. J., Sacks, W. J., Shi, M., Vertenstein, M., Wieder, W. R., Xu, C., Ali, A. A., Badger, A. M., Bisht, G., van den Broeke, M., Brunke, M. A., Burns, S. P., Buzan, J., Clark, M., Craig, A., Dahlin, K., Drewniak, B., Fisher, J. B., Flanner, M., Fox, A. M., Gentine, P., Hoffman, F., Keppel-Aleks, G., Knox, R., Kumar, S., Lenaerts, J., Leung, L. R., Lipscomb, W. H., Lu, Y., Pandey, A., Pelletier, J. D., Perket, J., Randerson, J. T., Ricciuto, D. M., Sanderson, B. M., Slater, A., Subin, Z. M., Tang, J., Thomas, R. Q., Val Martin, M., and Zeng, X.: The Community Land Model Version 5: Description of New Features, Benchmarking, and Impact of Forcing Uncertainty, J. Adv. Model. Earth Sy., 11, 4245–4287, https://doi.org/10.1029/2018MS001583, 2019.
LeBauer, D. S. and Treseder, K. K.: Nitrogen Limitation of Net Primary Productivity in Terrestrial Ecosystems is Globally Distributed, Ecology, 89, 371–379, https://doi.org/10.1016/j.agee.2013.04.020, 2008.
Levy-Varon, J. H., Batterman, S. A., Medvigy, D., Hall, J. S., Van Breugel, M., and Hedin, L. O.: Tropical carbon sink accelerated by symbiotic dinitrogen fixation, Nat. Commun., 10, 1–8, https://doi.org/10.1038/s41467-019-13656-7, 2019.
Liang, J., Qi, X., Souza, L., and Luo, Y.: Processes regulating progressive nitrogen limitation under elevated carbon dioxide: a meta-analysis, Biogeosciences, 13, 2689–2699, https://doi.org/10.5194/bg-13-2689-2016, 2016.
Liengen, T. and Olsen, R. A.: Seasonal and site-specific variations in nitrogen fixation in a high arctic area, Ny-Alesund, Spitsbergen, Can. J. Microbiol., 43, 759–769, https://doi.org/10.1139/m97-109, 1997.
Martinez Cano, I., Shevliakova, E., Malyshev, S., Wright, S. J., Detto, M., Pacala, S. W., and Muller-Landau, H. C.: Allometric constraints and competition enable the simulation of size structure and carbon fluxes in a dynamic vegetation model of tropical forests (LM3PPA-TV), Glob. Change Biol., 26, 4478–4494, https://doi.org/10.1111/gcb.15188, 2020.
Medlyn, B. E., Dreyer, E., Ellsworth, D., Forstreuter, M., Harley, P. C., Kirschbaum, M. U. F., Le Roux, X., Montpied, P., Strassemeyer, J., Walcroft, A., Wang, K., and Loustau, D.: Temperature response of parameters of a biochemically based model of photosynthesis. II. A review of experimental data, Plant Cell Environ., 25, 1167–1179, https://doi.org/10.1046/j.1365-3040.2002.00891.x, 2002.
Medvigy, D., Wofsy, S. C., Munger, J. W., Hollinger, D. Y., and Moorcroft, P. R.: Mechanistic scaling of ecosystem function and dynamics in space and time: Ecosystem Demography model version 2, J. Geophys. Res.-Biogeo., 114, G01002, https://doi.org/10.1029/2008JG000812, 2009.
Meerts, P.: Mineral nutrient concentrations in sapwood and heartwood: a literature review, Ann. For. Sci., 59, 713–722, 2002.
Meinshausen, M., Vogel, E., Nauels, A., Lorbacher, K., Meinshausen, N., Etheridge, D. M., Fraser, P. J., Montzka, S. A., Rayner, P. J., Trudinger, C. M., Krummel, P. B., Beyerle, U., Canadell, J. G., Daniel, J. S., Enting, I. G., Law, R. M., Lunder, C. R., O'Doherty, S., Prinn, R. G., Reimann, S., Rubino, M., Velders, G. J. M., Vollmer, M. K., Wang, R. H. J., and Weiss, R.: Historical greenhouse gas concentrations for climate modelling (CMIP6), Geosci. Model Dev., 10, 2057–2116, https://doi.org/10.5194/gmd-10-2057-2017, 2017.
Menge, D. N. L. and Hedin, L. O.: Nitrogen Fixation in Different Biogeochemical Niches along a 120 000-Year Chronosequence in New Zealand, Ecology, 90, 2190–2201, 2009.
Menge, D. N. L., Denoyer, J. L., and Lichstein, J. W.: Phylogenetic constraints do not explain the rarity of nitrogen-fixing trees in late-successional temperate forests, PLoS One, 5, e12056, https://doi.org/10.1371/journal.pone.0012056, 2010.
Menge, D. N. L., Wolf, A. A., and Funk, J. L.: Diversity of nitrogen fixation strategies in Mediterranean legumes, Nat. Plants, 1, 1–5, https://doi.org/10.1038/nplants.2015.64, 2015.
Menge, D. N. L., Chisholm, R. A., Davies, S. J., Abu Salim, K., Allen, D., Alvarez, M., Bourg, N., Brockelman, W. Y., Bunyavejchewin, S., Butt, N., Cao, M., Chanthorn, W., Chao, W. C., Clay, K., Condit, R., Cordell, S., da Silva, J. B., Dattaraja, H. S., de Andrade, A. C. S., de Oliveira, A. A., den Ouden, J., Drescher, M., Fletcher, C., Giardina, C. P., Savitri Gunatilleke, C. V., Gunatilleke, I. A. U. N., Hau, B. C. H., He, F., Howe, R., Hsieh, C. F., Hubbell, S. P., Inman-Narahari, F. M., Jansen, P. A., Johnson, D. J., Kong, L. S., Král, K., Ku, C. C., Lai, J., Larson, A. J., Li, X., Li, Y., Lin, L., Lin, Y. C., Liu, S., Lum, S. K. Y., Lutz, J. A., Ma, K., Malhi, Y., McMahon, S., McShea, W., Mi, X., Morecroft, M., Myers, J. A., Nathalang, A., Novotny, V., Ong, P., Orwig, D. A., Ostertag, R., Parker, G., Phillips, R. P., Abd. Rahman, K., Sack, L., Sang, W., Shen, G., Shringi, A., Shue, J., Su, S. H., Sukumar, R., Sun, I. F., Suresh, H. S., Tan, S., Thomas, S. C., Toko, P. S., Valencia, R., Vallejo, M. I., Vicentini, A., Vrška, T., Wang, B., Wang, X., Weiblen, G. D., Wolf, A., Xu, H., Yap, S., Zhu, L., and Fung, T.: Patterns of nitrogen-fixing tree abundance in forests across Asia and America, J. Ecol., 107, 2598–2610, https://doi.org/10.1111/1365-2745.13199, 2019.
Meyerholt, J., Zaehle, S., and Smith, M. J.: Variability of projected terrestrial biosphere responses to elevated levels of atmospheric CO2 due to uncertainty in biological nitrogen fixation, Biogeosciences, 13, 1491–1518, https://doi.org/10.5194/bg-13-1491-2016, 2016.
Meyerholt, J., Sickel, K., and Zaehle, S.: Ensemble projections elucidate effects of uncertainty in terrestrial nitrogen limitation on future carbon uptake, Glob. Change Biol., 26, 3978–3996, https://doi.org/10.1111/gcb.15114, 2020.
Mooney, H. A., Winner, W. E., and Pell, E. J.: Response of plants to multiple stresses, Academic Press, 1991.
Nacry, P., Bouguyon, E., and Gojon, A.: Nitrogen acquisition by roots: Physiological and developmental mechanisms ensuring plant adaptation to a fluctuating resource, Plant Soil, 370, 1–29, https://doi.org/10.1007/s11104-013-1645-9, 2013.
Oishi, A. C.: AmeriFlux US-Cwt Coweeta, Ver. 1-5., https://doi.org/10.17190/AMF/1671890, 2020.
Oswalt, S. N., Smith, W. B., Miles, P. D., and Pugh, S. A.: Forest Resources of the United States, 2017, 2019.
Peng, J., Wang, Y. P., Houlton, B. Z., Dan, L., Pak, B., and Tang, X.: Global Carbon Sequestration Is Highly Sensitive to Model-Based Formulations of Nitrogen Fixation, Global Biogeochem. Cy., 34, e2019GB006296, https://doi.org/10.1029/2019GB006296, 2020.
Phillips, R. P., Brzostek, E., and Midgley, M. G.: The mycorrhizal-associated nutrient economy: A new framework for predicting carbon-nutrient couplings in temperate forests, New Phytol., 199, 41–51, https://doi.org/10.1111/nph.12221, 2013.
Poorter, H., Niinemets, Ü., Poorter, L., Wright, I. J., and Villar, R.: Causes and consequences of variation in leaf mass per area (LMA): a meta-analysis, New Phytol., 182, 565–588, https://doi.org/10.1111/j.1469-8137.2008.02681.x, 2009.
Poorter, H., Niklas, K. J., Reich, P. B., Oleksyn, J., Poot, P., and Mommer, L.: Biomass allocation to leaves, stems and roots: Meta-analyses of interspecific variation and environmental control, New Phytol., 193, 30–50, https://doi.org/10.1111/j.1469-8137.2011.03952.x, 2012.
Purves, D. W., Lichstein, J. W., Strigul, N., and Pacala, S. W.: Predicting and understanding forest dynamics using a simple tractable model, P. Natl. Acad. Sci. USA, 105, 17018–17022, https://doi.org/10.1073/pnas.0807754105, 2008.
Rastetter, E. B. and Shaver, G. R.: A model of multiple-element limitation for acclimating vegetation, Ecology, 73, 1157–1174, https://doi.org/10.2307/1940666, 1992.
Reay, D. S., Dentener, F. J., Smith, P., Grace, J., and Feely, R. A.: Global nitrogen deposition and carbon sinks, Nat. Geosci., 1, 430–437, https://doi.org/10.1038/ngeo230, 2008.
Reed, S. C., Cleveland, C. C., and Townsend, A. R.: Functional Ecology of Free-Living Nitrogen Fixation: A Contemporary Perspective, Annu. Rev. Ecol. Evol. S., 42, 489–512, https://doi.org/10.1146/annurev-ecolsys-102710-145034, 2011.
Richardson, A. D., Carbone, M. S., Keenan, T. F., Czimczik, C. I., Hollinger, D. Y., Murakami, P., Schaberg, P. G., and Xu, X.: Seasonal dynamics and age of stemwood nonstructural carbohydrates in temperate forest trees, New Phytol., 197, 850–861, https://doi.org/10.1111/nph.12042, 2013.
Roper, M. M.: Straw decomposition and nitrogenase activity (C2H2 reduction): Effects of soil moisture and temperature, Soil Biol. Biochem., 17, 65–71, https://doi.org/10.1016/0038-0717(85)90091-4, 1985.
Roumet, C., Birouste, M., Picon-Cochard, C., Ghestem, M., Osman, N., Vrignon-Brenas, S., Cao, K. F., and Stokes, A.: Root structure-function relationships in 74 species: Evidence of a root economics spectrum related to carbon economy, New Phytol., 210, 815–826, https://doi.org/10.1111/nph.13828, 2016.
Scharlemann, J. P. W., Tanner, E. V. J., Hiederer, R., and Kapos, V.: Global soil carbon: Understanding and managing the largest terrestrial carbon pool, Carbon Manag., 5, 81–91, https://doi.org/10.4155/cmt.13.77, 2014.
Schomberg, H. H. and Weaver, R. W.: Nodulation, Nitrogen Fixation, and Early Growth of Arrowleaf Clover in Response to Root Temperature and Starter Nitrogen, Agron. J., 84, 1046–1050, https://doi.org/10.2134/agronj1992.00021962008400060026x, 1992.
Schulte-Uebbing, L. and de Vries, W.: Global-scale impacts of nitrogen deposition on tree carbon sequestration in tropical, temperate, and boreal forests: A meta-analysis, Glob. Change Biol., 24, e416–e431, https://doi.org/10.1111/gcb.13862, 2018.
Sheffer, E., Batterman, S. A., Levin, S. A., and Hedin, L. O.: Biome-scale nitrogen fixation strategies selected by climatic constraints on nitrogen cycle, Nat. Plants, 1, 1–6, https://doi.org/10.1038/nplants.2015.182, 2015.
Sheffield, J., Goteti, G., and Wood, E. F.: Development of a 50-Year High-Resolution Global Dataset of Meteorological Forcings for Land Surface Modeling, J. Clim., 19, 3088–3111, https://doi.org/10.1175/JCLI3790.1, 2006.
Shevliakova, E., Malyshev, S., Martinez-Cano, I., Milly, P. C. D., Pacala, S. W., Ginoux, P., Dunne, K. A., Dunne, J. P., Dupuis, C., Findell, K., Ghannam, K., Horowitz, L. W., John, J. G., Knutson, T. R., Krasting, P. J., Naik, V., Zadeh, N., Zeng, F., and Zeng, Y.: The land component LM4.1 of the GFDL Earth System Model ESM4.1: biophysical and biogeochemical processes and interactions with climate, in preparation, 2021.
Smith, B., Wårlind, D., Arneth, A., Hickler, T., Leadley, P., Siltberg, J., and Zaehle, S.: Implications of incorporating N cycling and N limitations on primary production in an individual-based dynamic vegetation model, Biogeosciences, 11, 2027–2054, https://doi.org/10.5194/bg-11-2027-2014, 2014.
Smith, S. E. and Smith, F. A.: Roles of Arbuscular Mycorrhizas in Plant Nutrition and Growth: New Paradigms from Cellular to Ecosystem Scales, Annu. Rev. Plant Biol., 62, 227–250, https://doi.org/10.1146/annurev-arplant-042110-103846, 2011.
Staccone, A., Liao, W., Perakis, S., Compton, J., Clark, C., and Menge, D.: A spatially explicit, empirical estimate of tree-based biological nitrogen fixation in forests of the United States, Global Biogeochem. Cy., 34, e2019GB006241, https://doi.org/10.1029/2019gb006241, 2020.
Staccone, A. P., Kou-Giesbrecht, S., Taylor, B. N., and Menge, D. N. L.: Nitrogen-fixing trees have no net effect on forest growth in the coterminous United States, J. Ecol., 109, 877–887, https://doi.org/10.1111/1365-2745.13513, 2021.
Stehfest, E. and Bouwman, L.: N2O and NO emission from agricultural fields and soils under natural vegetation: Summarizing available measurement data and modeling of global annual emissions, Nutr. Cycl. Agroecosy., 74, 207–228, https://doi.org/10.1007/s10705-006-9000-7, 2006.
Stocker, B. D., Prentice, I. C., Cornell, S. E., Davies-Barnard, T., Finzi, A. C., Franklin, O., Janssens, I., Larmola, T., Manzoni, S., Näsholm, T., Raven, J. A., Rebel, K. T., Reed, S., Vicca, S., Wiltshire, A., and Zaehle, S.: Terrestrial nitrogen cycling in Earth system models revisited, New Phytol., 210, 1165–1168, https://doi.org/10.1111/nph.13997, 2016.
Strigul, N., Pristinski, D., Purves, D., Dushoff, J., and Pacala, S.: Scaling from trees to forests: Tractable macroscopic equations for forest dynamics, Ecol. Monogr., 78, 523–545, https://doi.org/10.1890/08-0082.1, 2008.
Sullivan, B. W., Smith, W. K., Alan, R., Nasto, M. K., Reed, S. C., and Chazdon, R. L.: Spatially robust estimates of biological nitrogen (N) fixation imply substantial human alteration of the tropical N cycle, P. Natl. Acad. Sci. USA, 111, 8101–8106, https://doi.org/10.1073/pnas.1511978112, 2014.
Sulman, B. N., Shevliakova, E., Brzostek, E. R., Kivlin, S. N., Malyshev, S., Menge, D. N. L., and Zhang, X.: Diverse mycorrhizal associations enhance terrestrial C storage in a global model, Global Biogeochem. Cy., 33, 501–523, https://doi.org/10.1029/2018GB005973, 2019.
Swank, W. T. and Waide, J. B.: Characterization of Baseline Precipitation and Stream Chemistry and Nutrient Budgers for Control Watersheds, in: Forest Hydrology and Ecology at Coweeta, 1988.
Taylor, B. N., Chazdon, R. L., Bachelot, B., and Menge, D. N. L.: Nitrogen-fixing trees inhibit growth of regenerating Costa Rican rainforests, P. Natl. Acad. Sci. USA, 114, 8817–8822, https://doi.org/10.1073/pnas.1707094114, 2017.
Terrer, C., Vicca, S., Hungate, B. A., Phillips, R. P., and Prentice, I. C.: Mycorrhizal association as a primary control of the CO2 fertilization effect., Science, 353, 72–74, https://doi.org/10.1126/science.aaf4610, 2016.
Terrer, C., Vicca, S., Stocker, B. D., Hungate, B. A., Phillips, R. P., Reich, P. B., Finzi, A. C., and Prentice, I. C.: Ecosystem responses to elevated CO2 governed by plant-soil interactions and the cost of nitrogen acquisition, New Phytol., 217, 507–522, https://doi.org/10.1111/nph.14872, 2018.
Terrer, C., Prentice, I., Jackson, R., Keenan, T., Kaiser, C., Vicca, S., Fisher, J., Reich, P., Stocker, B., Hungate, B., Penuelos, J., McCallum, I., Soudzilovskala, N., Cernusak, L., Talhelm, A., Van, S. K., Piao, S., Newton, P., Hovenden, M., Blumenthal, D., Liu, Y., Muller, C., Winter, K., Field, C., Viechtbauer, W., Van, L. C., Hoosbeek, M., Watanabe, M., Koike, T., Leshyk, V., Polley, W., and Franklin, O.: Nitrogen and phosphorus constrain the CO2 fertilization of global plant biomass, Nat. Clim. Change, 9, 684–689, https://doi.org/10.1038/s41558-019-0545-2, 2019.
Thomas, R. Q., Brookshire, E. N. J., and Gerber, S.: Nitrogen limitation on land: How can it occur in Earth system models?, Glob. Change Biol., 21, 1777–1793, https://doi.org/10.1111/gcb.12813, 2015.
Tian, D. and Niu, S.: A global analysis of soil acidification caused by nitrogen addition, Environ. Res. Lett., 10, 24019, https://doi.org/10.1088/1748-9326/10/2/024019, 2015.
Todd, R. L., Meyer, R. D., and Waide, J. B.: Nitrogen Fixation in a Deciduous Forest in the South-Eastern United States, Ecol. Bull., 26, 172–177, 1978.
Treseder, K. K.: A meta-analysis of mycorrhizal responses to nitrogen, phosphorus, and atmospheric CO2 in field studies, New Phytol., 164, 347–355, https://doi.org/10.1111/j.1469-8137.2004.01159.x, 2004.
US Forest Service: US Forest Inventory and Analysis Database, available at: http://apps.fs.fed.us/fiadb-downloads/datamart.html (last access: 7 November 2019), 2020a.
US Forest Service: US Forest Inventory and Analysis Forest Health Monitoring Database, available at: http://apps.fs.fed.us/fiadb-downloads/datamart.html (last access: 7 November 2019), 2020b.
Vicca, S., Stocker, B. D., Reed, S., Wieder, W. R., Bahn, M., Fay, P. A., Janssens, I. A., Lambers, H., Peñuelas, J., Piao, S., Rebel, K. T., Sardans, J., Sigurdsson, B. D., Van Sundert, K., Wang, Y. P., Zaehle, S., and Ciais, P.: Using research networks to create the comprehensive datasets needed to assess nutrient availability as a key determinant of terrestrial carbon cycling, Environ. Res. Lett., 13, 125006, https://doi.org/10.1088/1748-9326/aaeae7, 2018.
Vitousek, P. M., Menge, D. N., Reed, S. C., and Cleveland, C. C.: Biological nitrogen fixation: rates, patterns and ecological controls in terrestrial ecosystems, Philos. T. R. Soc. B, 368, 20130119, https://doi.org/10.1098/rstb.2013.0119, 2013.
Wang, Y. P. and Houlton, B. Z.: Nitrogen constraints on terrestrial carbon uptake: Implications for the global carbon-climate feedback, Geophys. Res. Lett., 36, 1–5, https://doi.org/10.1029/2009GL041009, 2009.
Wang, Y. P., Law, R. M., and Pak, B.: A global model of carbon, nitrogen and phosphorus cycles for the terrestrial biosphere, Biogeosciences, 7, 2261–2282, https://doi.org/10.5194/bg-7-2261-2010, 2010.
Weng, E. S., Malyshev, S., Lichstein, J. W., Farrior, C. E., Dybzinski, R., Zhang, T., Shevliakova, E., and Pacala, S. W.: Scaling from individual trees to forests in an Earth system modeling framework using a mathematically tractable model of height-structured competition, Biogeosciences, 12, 2655–2694, https://doi.org/10.5194/bg-12-2655-2015, 2015.
Wieder, W. R., Cleveland, C. C., Lawrence, D. M., and Bonan, G. B.: Effects of model structural uncertainty on carbon cycle projections: biological nitrogen fixation as a case study, Environ. Res. Lett., 10, 044016, https://doi.org/10.1088/1748-9326/10/4/044016, 2015a.
Wieder, W. R., Cleveland, C. C., Smith, W. K., and Todd-Brown, K.: Future productivity and carbon storage limited by terrestrial nutrient availability, Nat. Geosci., 8, 441–444, https://doi.org/10.1038/ngeo2413, 2015b.
Wright, S. J., Turner, B. L., Yavitt, J. B., Harms, K. E., Kaspari, M., Tanner, E. V. J., Bujan, J., Griffin, E. A., Mayor, J. R., Pasquini, S. C., Sheldrake, M., and Garcia, M. N.: Plant responses to fertilization experiments in lowland, species-rich, tropical forests, Ecology, 99, 1129–1138, https://doi.org/10.1002/ecy.2193, 2018.
Xu, H., Detto, M., Fang, S., Chazdon, R. L., Li, Y., Hau, B. C. H., Fischer, G. A., Weiblen, G. D., Hogan, J. A., Zimmerman, J. K., Uriarte, M., Thompson, J., Lian, J., Cao, K., Kenfack, D., Alonso, A., Bissiengou, P., Memiaghe, H. R., Valencia, R., Yap, S. L., Davies, S. J., Mi, X., and Yao, T. L.: Soil nitrogen concentration mediates the relationship between leguminous trees and neighbor diversity in tropical forests, Communications Biology, 3, 1–8, https://doi.org/10.1038/s42003-020-1041-y, 2020.
Yan, W. and Hunt, L. A.: An equation for modelling the temperature response of plants using only the cardinal temperatures, Ann. Bot.-London, 84, 607–614, https://doi.org/10.1006/anbo.1999.0955, 1999.
Yang, X., Wittig, V., Jain, A. K., and Post, W.: Integration of nitrogen cycle dynamics into the Integrated Science Assessment Model for the study of terrestrial ecosystem responses to global change, Global Biogeochem. Cy., 23, 1–18, GB4029, https://doi.org/10.1029/2009GB003474, 2009.
Zaehle, S. and Friend, A. D.: Carbon and nitrogen cycle dynamics in the O–CN land surface model: 1. Model description, site-scale evaluation, and sensitivity to parameter estimates, Global Biogeochem. Cy., 24, 1–13, GB1006, https://doi.org/10.1029/2009GB003521, 2010.
Zhang, J. and Elser, J. J.: stoichiometry in fungi: A meta-analysis, Front. Microbiol., 8, 1–9, https://doi.org/10.3389/fmicb.2017.01281, 2017.
Zhao, M., Golaz, J.-C., Held, I. M., Guo, H., Balaji, V., Benson, R., Chen, J.-H., Chen, X., Donner, L. J., Dunne, J. P., Dunne, K., Durachta, J., Fan, S.-M., Freidenreich, S. M., Garner, S. T., Ginoux, P., Harris, L. M., Horowitz, L. W., Krasting, J. P., Langenhorst, A. R., Liang, Z., Lin, P., Lin, S.-J., Malyshev, S. L., Mason, E., Milly, P. C. D., Ming, Y., Naik, V., Paulot, F., Paynter, D., Phillipps, P., Radhakrishnan, A., Ramaswamy, V., Robinson, T., Schwarzkopf, D., Seman, C. J., Shevliakova, E., Shen, Z., Shin, H., Silvers, L. G., Wilson, J. R., Winton, M., Wittenberg, A. T., Wyman, B., and Xiang, B.: The GFDL Global Atmosphere and Land Model AM4.0/LM4.0: 1. Simulation Characteristics With Prescribed SSTs, J. Adv. Model. Earth Sy., 10, 691–734, https://doi.org/10.1002/2017MS001208, 2018a.
Zhao, M., Golaz, J.-C., Held, I. M., Guo, H., Balaji, V., Benson, R., Chen, J.-H., Chen, X., Donner, L. J., Dunne, J. P., Dunne, K., Durachta, J., Fan, S.-M., Freidenreich, S. M., Garner, S. T., Ginoux, P., Harris, L. M., Horowitz, L. W., Krasting, J. P., Langenhorst, A. R., Liang, Z., Lin, P., Lin, S.-J., Malyshev, S. L., Mason, E., Milly, P. C. D., Ming, Y., Naik, V., Paulot, F., Paynter, D., Phillipps, P., Radhakrishnan, A., Ramaswamy, V., Robinson, T., Schwarzkopf, D., Seman, C. J., Shevliakova, E., Shen, Z., Shin, H., Silvers, L. G., Wilson, J. R., Winton, M., Wittenberg, A. T., Wyman, B., and Xiang, B.: The GFDL Global Atmosphere and Land Model AM4.0/LM4.0: 2. Model Description, Sensitivity Studies, and Tuning Strategies, J. Adv. Model. Earth Sy., 10, 735–769, https://doi.org/10.1002/2017MS001209, 2018b.
Zheng, M., Zhou, Z., Luo, Y., Zhao, P., and Mo, J.: Global pattern and controls of biological nitrogen fixation under nutrient enrichment: A meta-analysis, Glob. Change Biol., 25, 3018–3030, https://doi.org/10.1111/gcb.14705, 2019.
Zheng, M., Zhou, Z., Zhao, P., Luo, Y., Ye, Q., Zhang, K., Song, L., and Mo, J.: Effects of human disturbance activities and environmental change factors on terrestrial nitrogen fixation, Glob. Change Biol., 26, 6203–6217, https://doi.org/10.1111/gcb.15328, 2020.
Zhu, Q., Riley, W. J., Tang, J., Collier, N., Hoffman, F. M., Yang, X., and Bisht, G.: Representing Nitrogen, Phosphorus, and Carbon Interactions in the E3SM Land Model: Development and Global Benchmarking, J. Adv. Model. Earth Sy., 11, 2238–2258, https://doi.org/10.1029/2018MS001571, 2019.
Zhu, Y.-G. and Miller, R. M.: Carbon cycling by arbuscular mycorrhizal fungi in soil–plant systems, Trends Plant Sci., 8, 407–409, https://doi.org/10.1016/S1360-1385(03)00192-4, 2003.
- Abstract
- Introduction
- Model description
- Numerical experiments and evaluation description
- Evaluation: comparison of LM4.1-BNF to observations and to LM3-SNAP
- LM4.1.-BNF performance relative to previous BNF representations
- Discussion
- Conclusions
- Appendix A: Model description
- Appendix B: Data availability and processing
- Appendix C: Model parameterization
- Appendix D: Appendix D figures and tables
- Code availability
- Data availability
- Author contributions
- Competing interests
- Disclaimer
- Acknowledgements
- Financial support
- Review statement
- References
The requested paper has a corresponding corrigendum published. Please read the corrigendum first before downloading the article.
- Article
(5216 KB) - Full-text XML
- Abstract
- Introduction
- Model description
- Numerical experiments and evaluation description
- Evaluation: comparison of LM4.1-BNF to observations and to LM3-SNAP
- LM4.1.-BNF performance relative to previous BNF representations
- Discussion
- Conclusions
- Appendix A: Model description
- Appendix B: Data availability and processing
- Appendix C: Model parameterization
- Appendix D: Appendix D figures and tables
- Code availability
- Data availability
- Author contributions
- Competing interests
- Disclaimer
- Acknowledgements
- Financial support
- Review statement
- References