the Creative Commons Attribution 4.0 License.
the Creative Commons Attribution 4.0 License.
 | 12 Aug 2021
Comparing modified substrate-induced respiration with selective inhibition (SIRIN) and N2O isotope approaches to estimate fungal contribution to denitrification in three arable soils under anoxic conditions
Traute-Heidi Anderson
Heinz Flessa
Anette Goeske
Dominika Lewicka-Szczebak
Nicole Wrage-Mönnig
Reinhard Well
The coexistence of many N2O production pathways in soil hampers differentiation of microbial pathways. The question of whether fungi are significant contributors to soil emissions of the greenhouse gas nitrous oxide (N2O) from denitrification has not yet been resolved. Here, three approaches to independently investigate the fungal fraction contributing to N2O from denitrification were used simultaneously for, as far as we know, the first time (modified substrate-induced respiration with selective inhibition (SIRIN) approach and two isotopic approaches, i.e. end-member mixing approach (IEM) using the 15N site preference of N2O produced () and the SP/δ18O mapping approach (SP/δ18O Map)). This enabled a comparison of methods and a quantification of the importance of fungal denitrification in soil.
Three soils were incubated in four treatments of the SIRIN approach under anaerobic conditions to promote denitrification. While one treatment without microbial inhibition served as a control, the other three treatments were amended with inhibitors to selectively inhibit bacterial, fungal, or bacterial and fungal growth. These treatments were performed in three variants. In one variant, the 15N tracer technique was used to estimate the effect of N2O reduction on the N2O produced, while two other variants were performed under natural isotopic conditions with and without acetylene.
All three approaches revealed a small contribution of fungal denitrification to N2O fluxes (fFD) under anaerobic conditions in the soils tested. Quantifying the fungal fraction with modified SIRIN was not successful due to large amounts of uninhibited N2O production. In only one soil could fFD be estimated using modified SIRIN, and this resulted in 28 ± 9 %, which was possibly an overestimation, since results obtained by IEM and SP/δ18O Map for this soil resulted in fFD of below 15 % and 20 %, respectively. As a consequence of the unsuccessful SIRIN approach, estimation of fungal values was impossible.
While all successful methods consistently suggested a small or missing fungal contribution, further studies with stimulated fungal N2O fluxes by adding fungal C substrates and an improved modified SIRIN approach, including alternative inhibitors, are needed to better cross-validate the methods.
- Article
(511 KB) - Full-text XML
-
Supplement
(968 KB) - BibTeX
- EndNote


The greenhouse gas nitrous oxide (N2O) contributes to global warming and to the depletion of the ozone layer in the stratosphere (Crutzen, 1970; IPCC, 2013). The largest anthropogenic N2O emissions originate from agricultural soils and are mainly produced during microbial nitrification, nitrifier denitrification and denitrification (Firestone and Davidson, 1989; Bremner, 1997; IPCC, 2013; Wrage-Mönnig et al., 2018). In order to find mitigation strategies for N2O emissions from arable soils, it is important to understand N2O sources and sinks and thus improve knowledge about the production pathways and the microorganisms involved.
Denitrification describes the stepwise reduction of nitrate () to dinitrogen (N2), with the intermediates nitrite (), nitric oxide (NO) and N2O (Knowles, 1982). For a long time, it was believed that solely bacteria are involved in N2O formation during denitrification (Firestone and Davidson, 1989); however, several fungi are also capable of denitrification (Bollag and Tung, 1972; Shoun et al., 1992). Pure culture studies have indicated that although only some fungal species (e.g. Fusarium strains) are performing respiratory denitrification, these may produce substantial amounts of N2O (Higgins et al., 2018; Keuschnig et al., 2020). N2O produced by fungi may thus contribute largely to N2O from denitrification in soil, since fungi dominate the biomass in soil (up to 96 %) compared to bacteria in general (Ruzicka et al., 2000; Braker and Conrad, 2011). A respiratory fungal-to-bacterial (F:B) ratio of 4 is typical of arable soils (Anderson and Domsch, 1975; Blagodatskaya and Anderson, 1998). Secondly, due to a lacking N2O reductase (Nos) (Shoun et al., 1992, 2012; Higgins et al., 2018), N2O is the major end product of fungal denitrification. However, although there are methodological approaches to disentangling sources of N2O, it is still challenging to clearly attribute N2O emitted from soil to bacterial or fungal denitrification.
One approach to differentiate between N2O produced by fungi and bacteria during denitrification comprises the addition of two antibiotics to soil incubation experiments, i.e. streptomycin and cycloheximide to inhibit bacterial or fungal protein biosynthesis, i.e. growth, respectively. This method is known as substrate-induced respiration with selective inhibition (SIRIN) and was originally developed to determine the bacterial or fungal contribution to CO2 respiration (Anderson and Domsch, 1975). A few studies used a modification of this method for N2O analysis (Laughlin and Stevens, 2002; Crenshaw et al., 2008; Blagodatskaya et al., 2010; Long et al., 2013) and found a greater decrease in N2O production with fungal than with bacterial growth inhibition (i.e. 89 % vs. 23 % decrease, respectively; Laughlin and Stevens, 2002). This indicated that fungi might dominate N2O production (Laughlin and Stevens, 2002; McLain and Martens, 2006; Crenshaw et al., 2008; Blagodatskaya et al., 2010; Long et al., 2013; Chen et al., 2014, 2015). However, difficulties of this method may be to achieve complete inhibition of selective groups (Ladan and Jacinthe, 2016) and to avoid shifts in the structure of microbial communities as a response to pre-incubation or the duration of experiments. Another opportunity to distinguish between N2O from bacterial and fungal denitrification and other pathways is the analysis of the isotopic composition of N2O. Especially the isotopomer ratios of N2O (i.e. N2O molecules with the same bulk 15N isotopic enrichment but different positions of 15N in the linear N2O molecule; Ostrom and Ostrom, 2017) in pure culture studies showed differences in N2O of bacterial and fungal denitrification (Sutka et al., 2006, 2008; Frame and Casciotti, 2010; Rohe et al., 2014a, 2017). Isotopomer ratios of N2O can be expressed as 15N site preference (), i.e. the difference between δ15N of the central and terminal N position of the asymmetric N2O molecule (Toyoda and Yoshida, 1999). The values of N2O of six pure fungal cultures was between 16 ‰ and 37 ‰ (Sutka et al., 2008; Rohe et al., 2014a, 2017; Maeda et al., 2015), whereas several bacterial cultures produced N2O with values between −7.5 ‰ and +3.5 ‰ during denitrification (Toyoda et al., 2005; Sutka et al., 2006; Rohe et al., 2017). While it is generally assumed that values of N2O produced by pure fungal cultures during denitrification are transferable to N2O produced by fungal soil communities, this has not yet been proven. Until now, studies reporting possible ranges of fungal contributions to N2O fluxes from soil have been based on values of pure cultures (Köster et al., 2013b; Zou et al., 2014; Lewicka-Szczebak et al., 2017, 2014; Senbayram et al., 2018, 2020), but uncertainty in this approach has arisen from the large ranges of fungal values (Sutka et al., 2008; Maeda et al., 2015; Rohe et al., 2017). It would thus be useful to constrain fungal values for a specific soil or soil type.
The value of N2O produced by pure bacterial cultures during nitrification is approximately 33 ‰ and thus interferes with that of fungal denitrification (Sutka et al., 2006, 2008; Rohe et al., 2014a). This demonstrates the difficulty of using solely values as an indicator for different organism groups contributing to N2O production from soil, where different pathways may co-occur. Based on the above-cited ranges for the isotopomer end-members of fungal and bacterial denitrification and assuming that only fungal and bacterial denitrification are responsible for N2O production, the fraction of fungal N2O can be calculated using the isotope end-member mixing approach (IEM) with values of N2O produced in soil (SPprod), provided N2O reduction does not occur (Ostrom et al., 2010; Ostrom and Ostrom, 2011). If there is a N2O reduction, and also δ15N and δ18O values of produced N2O ( and , respectively) are affected by isotopic fractionation (Ostrom et al., 2007; Ostrom and Ostrom, 2011). This means that the 14N16O bond of N2O is preferentially broken compared to 14N18O or 15N16O, resulting in N2O that is isotopically enriched in 15N and 18O and shows larger values compared to N2O from denitrification without the reduction step (Popp et al., 2002; Ostrom et al., 2007).
In controlled laboratory experiments, the N2O reduction to N2 can be inhibited using acetylene (C2H2) during anaerobic incubation experiments (Yoshinari and Knowles, 1976; Groffman et al., 2006; Well and Flessa, 2009; Nadeem et al., 2013). Hence, C2H2 inhibition might be suitable to quantify SPprod values in soils exhibiting significant N2O reduction and would thus allow quantification of fungal N2O fluxes based on SPprod values. However, problems due to incomplete inhibition of N2O reduction and unwanted inhibition of other pathways may occur (Wrage et al., 2004a, b). Another possibility of quantifying N2O reduction to N2 during denitrification is also possible with 15N-tracing experiments using 15N-enriched substrates and analysing 15N2 fluxes (Well et al., 2006; Lewicka-Szczebak et al., 2014). The 15N tracer approach also enables us to distinguish between N2O from fungal denitrification and co-denitrification; i.e. a hybrid N2O is formed using one N atom from and one N atom from compounds like azide or ammonium () for N2O production (Tanimoto et al., 1992; Laughlin and Stevens, 2002; Rohe et al., 2017; Spott et al., 2011).
N2O reduction can be quantified using N2O natural abundance isotopic signatures, which also enables simultaneous differentiation of selected pathways. Here, the isotope mapping approach uses isotope fractionation factors together with δ15N values of precursors () as well as and values of N2O produced (Toyoda et al., 2011). Recently, this isotope mapping approach was further developed (SP/δ18O Map) using and values and δ18O values of precursors (Lewicka-Szczebak et al., 2017) and different slopes of N2O reduction and mixing lines in the δ18O–SP isotope plot. While values are independent of isotopic signatures of the precursors, and result from the isotopic signature of the precursor and isotopic fractionation during N2O production (Toyoda et al., 2005; Frame and Casciotti, 2010). Regarding , a complete exchange of oxygen (O) between and soil water can be assumed, and consequently, one can use the δ18O values of soil water for interpretation of values (Kool et al., 2009; Snider et al., 2009; Lewicka-Szczebak et al., 2016). However, interpretation of values from different microbial groups may be more complex due to incomplete O exchange because variations in the extent of O exchange between water and N oxides affect the final value (Garber and Hollocher, 1982; Aerssens et al., 1986; Kool et al., 2007; Rohe et al., 2014b, 2017). Importantly, fungal and bacterial N2O showed different ranges for values; hence this isotopic signature may also be helpful in differentiation of these pathways (Lewicka-Szczebak et al., 2016). This SP/δ18O Map approach thus allows for an estimation of the contributions of N2O reduction and admixture of fungal N2O.
So far, the described methods for distinguishing between fungal and bacterial N2O emission have not been compared in the same soil, and their accuracy and possible bias remain unknown. A better knowledge of the comparability of the methods would enable comparison of results of studies using different methods and thus further improve our understanding of processes of N2O production. It would also reveal weaknesses of approaches and might lead to the development of better methods.
Therefore, this study aims at (i) determining the fungal contribution to N2O production by denitrification under anoxic conditions and glucose addition using three arable soils and three approaches (modified SIRIN, IEM and the Map) and to assess their usefulness in soil studies and thus assess factors of potential bias of the methods and (ii) estimating the values from fungal soil communities and thus evaluating the transferability of the pure culture range of the fungal end-member values. We hypothesized that the fungal fraction contributing to N2O from denitrification in different soils using a modified SIRIN approach and isotopic methods will be correlated but not exactly matched due to limited inhibitability of microbial communities and variability in end-member values. Furthermore, successful application of the modified SIRIN approach with the determined fungal fraction contributing to N2O from denitrification will yield fungal end-member values within the range of values previously reported in the literature.
Table 1Soil characteristics of three arable soils from Germany used for incubation experiments (Soil) (standard deviation in brackets). Except for and , soil characteristics (C, N, pH, and ) of loamy sand were only analysed once for samples collected in 2012. WRB: World Reference Base for Soil Resources.

a Experimental station of the Friedrich-Löffler Institute, Braunschweig, Germany. b Private agricultural field north of Hanover, water protection area Fuhrberger Feld, Germany. c Reinshof Experimental Farm, University of Göttingen, Göttingen, Germany. d Not detectable (i.e. below detection limit of 0.06 mg kg−1 of -N). e Isotopic values of natural soil using the denitrifier method (Casciotti et al., 2002). f Respiratory fungal-to-bacterial (F:B) ratio analysed by SIRIN method (Anderson and Domsch, 1973, 1975) in a pre-experiment in 2010. g Respiratory biomass analysed by CO2 production from substrate-induced respiration (SIR) method (Anderson and Domsch, 1978) in a pre-experiment in 2010.
2.1 Soil samples
All experiments were conducted with three arable soils differing in texture, Corg content, C N ratio and pH. Thus it was assumed that the soils harbour different denitrifying communities, i.e. different fractions of bacteria and fungi contributing to denitrification. One of the soils was sampled during a second season to evaluate if the fungal fraction contributing to N2O production is soil-specific or can be subject to seasonal change in microbial communities. As this soil was sampled at two different time points, we conducted four experiments and named the different experiments “Soil 1.1”, “Soil 1.2”, “Soil 2” and “Soil 3”: Soil 1.1 and Soil 1.2 with loamy sand (Soil 1) sampled in June 2011 and in December 2012, respectively; Soil 2 with sand sampled in January 2013; and Soil 3 with silt loam sampled in December 2012 (Table 1).
Soil samples of the upper 30 cm were collected in plastic bags aerated via cotton wool stoppers and stored at 6 ∘C for maximally 2 months. To obtain information about the initial soil status, the mineral nitrogen content (Nmin) of soil samples was determined before and after fertilization by extracting and with 0.01 M calcium chloride dihydrate (CaCl2 ⋅ 2 H2O) according to ISO 14255 and analysing and concentrations in the extracts with a continuous-flow analyser (Skalar, Germany) directly after sample collection. Other soil characteristics (C and N content, soil pH value, isotopic values of soil and ) were analysed with samples of Soil 1.2, Soil 2 and Soil 3. Total contents of C and N in soil samples were analysed by dry combustion of ground samples (LECO TruSpec, Germany). The soil pH was measured in 0.01 M CaCl2. The δ15N and δ18O values of and ( and , respectively) in soil extracts (with 0.01 M calcium chloride dihydrate; CaCl2 ⋅ 2 H2O) were analysed by the bacterial denitrifier method (Casciotti et al., 2002) (Table 1).
The three soils were also sampled in summer 2010 for pre-experiments to gain information on the respiratory biomass by analysing the substrate-induced respiration (SIR) according to Anderson and Domsch (1978), and the respiratory F:B ratio was analysed with substrate-induced respiration with selective inhibition (SIRIN) by a computer-generated selectivity analysis: SIR-SBA 4.00 (Heinemeyer, copyright MasCo Analytik, Hildesheim, Germany) (Anderson and Domsch, 1975) (Table 1). The scheme of glucose and growth inhibitor combinations is listed below in Sect. 2.2. The characteristics of the soils are listed in Table 1.

Figure 1The methodical approach comprised a pre-experiment with substrate-induced respiration (SIR) to estimate the optimal glucose concentration (copt(glucose)) and the fungal-to-bacterial ratio in the soil (F:B ratio) and the substrate-induced respiration with selective inhibition approach (SIRIN) to determine the optimal inhibitor concentration (copt(streptomycin and copt(cycloheximide)). The initial soil status, i.e. ammonium and nitrate concentration of the soil (c() and c(), respectively), was measured in Nmin extracts, and the isotopic signature of soil was analysed by the denitrifier method. The incubation experiment comprised the SIRIN approach with three experimental variants: without acetylene (−C2H2), with C2H2 (+C2H2) and without C2H2 but with 15N labelled (traced), while with natural isotopic composition was added to the other two variants. Produced gas was analysed for its concentration (c(CO2) and c(N2O)) using gas chromatography (GC), and N2O was further analysed by isotope ratio mass spectrometry (IRMS) for its isotopic composition. Please refer to Sect. 2 for more information.
2.2 Methodical approach
The experimental setup comprising pre-experiments, four treatments in three variants and measured parameters is presented in the following sections and illustrated in Fig. 1. Important terms used and their descriptions are listed in Table S1 in the Supplement.
2.2.1 SIRIN pre-experiment
As in most studies applying the SIRIN method to N2O emissions (e.g. Laughlin and Stevens, 2002; Chen et al., 2014; Ladan and Jacinthe, 2016), a pre-experiment was conducted with samples collected in 2010 in order to obtain information about optimal substrate and inhibitor concentrations for substrate-induced respiration with growth inhibition. The pre-experiments of the present study were conducted in two steps as described in the original methods, i.e. CO2 production under oxic conditions was analysed to estimate the substrate-induced respiration by the SIR method (Anderson and Domsch, 1978) and the substrate-induced respiration with selective inhibition by the SIRIN method (Anderson and Domsch, 1975), as follows.
In a first pre-experiment (Fig. 1), the SIR method (Anderson and Domsch, 1978) was used to obtain information about the amount of respiratory biomass in soil under oxic conditions. In this pre-experiment glucose served as substrate to initiate microbial growth (Anderson and Domsch, 1975). To this end, we added different concentrations of glucose (0.50, 0.75, 1.0, 1.5, 2.0, 3.0, 4.0, 5.0, 6.0 mg g−1 dry weight (dw) soil) to find the optimal glucose concentration (copt(glucose)), which is the glucose concentration that causes maximum initial respiration rates by analysing CO2 production (Anderson and Domsch, 1978). copt(glucose) was 1.0 mg g−1 for Soil 2 (sand) and 1.5 mg g−1 for soils 1 and 3 (loamy sand and silt loam).
In a second pre-experiment (Fig. 1), the SIRIN method was used according to Anderson and Domsch (1975) for determining the respiratory F:B ratio. The copt(glucose) determined in the first pre-experiment was used, while selectivity of the inhibitor combinations of streptomycin (bacterial respiratory inhibitor) and cycloheximide (fungal respiratory inhibitor) was tested with three concentrations (0.75, 1.0, 1.5 mg g−1 dw, respectively). The optimal concentration for inhibition of fungal respiration was 0.75 mg g−1 dw soil of cycloheximide (copt(cycloheximide)), and for bacterial respiratory inhibition it was 1.0 mg g−1 dw soil of streptomycin (copt(streptomycin)). As in the first pre-experiment, CO2 production under oxic conditions was analysed. The determined optimal concentrations of glucose, streptomycin and cycloheximide were used in the modified SIRIN approach, on the assumption that concentrations optimal for CO2 respiration also allow denitrification. Examples of respiration curves derived from SIR and SIRIN pre-experiments are represented in Figs. S1 and S2 in the Supplement, respectively.
2.2.2 Soil incubation with selective inhibition to determine N2O-forming processes
The experimental design included two approaches, (i) microbial inhibition by fungal and/or bacterial inhibitors and (ii) activity of N2O reductase analysed by either inhibition with C2H2 or quantification by 15N tracing (Fig. 1). To address the microbial inhibition approach (i), the SIRIN method for determination of the respiratory F:B ratio based on CO2 emission was modified to determine N2O production by microbial groups. However, in contrast to previous studies by Laughlin and Stevens (2002), McLain and Martens (2006), Blagodatskaya et al. (2010), and Long et al. (2013), we did not pre-incubate the soil with the growth inhibitors, as this could result in changes in the microbial community (e.g. preferential growth of selected organisms). We intended to disturb microbial communities as little as possible.
The soil was sieved (2 mm) and pre-incubated at 22 ∘C for 5 to 7 d in the dark with cotton wool stoppers to allow respiration and aerobic conditions in soil bags. Four microbial inhibitor treatments (each in triplicate) with copt(glucose) for each soil were established:
- A.
control, without growth inhibitors;
- B.
with streptomycin sulfate (C42H84N14O36S3) to inhibit bacterial growth;
- C.
with cycloheximide (C15H23NO4) to inhibit fungal growth;
- D.
with streptomycin and cycloheximide, to inhibit bacterial and fungal growth.
To address the other approach (ii), all microbial inhibitor treatments were conducted in three variants, i.e.: with 15N-NO3 fertilizer (variant “traced”) to quantify N2O reduction to N2; with natural abundance and 10 kPa C2H2 in the headspace (variant “+C2H2”) to block N2O reductase; and with natural abundance but without blocking N2O reductase, i.e. no C2H2 added (variant “−C2H2”) (Fig. 1). In total, there were 48 experimental treatments and 144 vessels (four soils with four inhibitor treatments (A, B, C, D) and three variants (traced, +C2H2 and −C2H2), each in triplicate).
The soil was adjusted to 80 % water-filled pore space (WFPS) with distilled water. Simultaneously, the soil was fertilized with (variants −C2H2, +C2H2 and traced). The soil sample used with Soil 1.1 was incubated prior to the other soils and was amended with 60 mg N kg−1 of NaNO3, while in agreement with other experiments conducted in our laboratory, 50 mg N kg−1 of KNO3 was used with Soil 1.2, 2 and 3. In variant traced, with a 15N enrichment of 50 at. % (atom%) was used. For each treatment, we incubated 100 g dw soil in 850 mL preserving jars (J. WECK GmbH u. Co. KG, Wehr, Germany) with the gas inlet and outlet equipped with three-port luer lock plastic stopcocks (Braun, Melsungen, Germany). According to the original SIRIN method (Anderson and Domsch, 1973, 1978) a mixture of copt(glucose) and carrier material talcum (5 mg talcum g−1 dw) was added to soil of treatment A and together with the growth inhibitors to the soil of treatments B, C and D. The soil and additives of each treatment were mixed for 90 s with a handheld electric mixer. During packing, the soil density was adjusted to an expected target soil density of 1.6 g cm−3 in Soil 1.1, 1.2 and 2 and of 1.3 g cm−3 in Soil 3 to imitate field conditions. To ultimately achieve denitrifying conditions in all treatments and to avoid catalytic NO decomposition in the +C2H2 variant (Nadeem et al., 2013), the headspace of the closed jars was flushed with N2 to exchange the headspace 10 times. Directly following this, 85 mL of the gas in the headspace in variant +C2H2 was exchanged with pure C2H2 resulting in 10 kPa C2H2 in the headspace. The manual sample collection of 14 mL gas in duplicates with a plastic syringe was performed after 6, 8 and 10 h (Soil 1.2, 2 and 3) or 2, 4 and 8 h (Soil 1.1) of incubation time, respectively. The removed gas was replaced by the same amount of N2.
2.3 Gas analysis
Gas samples were analysed for N2O and CO2 concentrations (c(N2O) and c(CO2)) with gas chromatography (GC, Agilent 7890A, Agilent, Böblingen, Germany) (Fig. 1). The analytical precision of measurements was derived from analysing laboratory standards of different concentrations (0.5–1000 ppm N2O and 340–10 000 ppm CO2) and resulted in a measurement precision of 1 % for N2O and 0.5 % for CO2. The instrumental detection limit of N2O was 4 and of CO2 it was 137 . As a control, N2 and O2 concentrations in the samples were analysed with GC to ensure anaerobic conditions during the incubation for N2O production from denitrification. CO2 and N2O production rates were calculated by averaging the measured N2O production, i.e. between the time point of flushing with N2 (t=0) and 6, 8 or 10 h (or 2, 4 and 8 h with Soil 1.1).
The N2O isotopic analysis of the gas samples of variants −C2H2 and +C2H2 (Fig. 1) was performed on a pre-concentrator (PreCon, Thermo Finnigan, Bremen, Germany) interfaced with a gas chromatograph (TRACE Ultra Gas, Thermo Scientific, Bremen, Germany) and analysed by isotope ratio mass spectrometry (IRMS; Delta V, Thermo Fisher Scientific, Bremen, Germany) (Brand, 1995; Toyoda and Yoshida, 1999; Köster et al., 2013b). A laboratory standard N2O gas was used for calibration, having , and values of −1.06 ‰, 40.22 ‰ and −2.13 ‰, respectively, in three concentrations (5, 10 and 20 ppm). The analytical precision was 0.1 ‰, 0.2 ‰ and 1.5 ‰ for , and values, respectively. H2O and CO2 were trapped with magnesium perchlorate and ascarite, respectively, to prevent any interference with N2O analysis.
The gas samples of variant traced from Soil 1.2, 2 and 3 were analysed for the and ratios of N2 according to Lewicka-Szczebak et al. (2013) using a modified GasBench II preparation system coupled to an isotope ratio mass spectrometer (MAT 253, Thermo Scientific, Bremen, Germany). The gas samples of variant traced from Soil 1.1 were analysed at the Centre for Stable Isotope Research and Analysis (University of Göttingen, Germany). The N2 produced was analysed using an elemental analyser (Carlo Erba ANA 1500) that was coupled to a dual-inlet isotope ratio mass spectrometer (Finnigan MAT 251) (Well et al., 1998, 2006). Isotopic values of N2O of Soil 1.1 (variant traced) were analysed in the same lab using a pre-concentration unit coupled to an isotope ratio mass spectrometer (PreCon–DeltaXP, Thermo Scientific, Bremen, Germany) (Well et al., 2006). Isotope ratios were used applying the non-random distribution approach to calculate the fraction of N2 and N2O originating from the 15N-labelled N pool as well as the 15N enrichment of that N pool (ap) (Bergsma et al., 2001; Spott et al., 2006).
2.4 Inhibitor effects
For interpretation of N2O or CO2 production, the validity of the experimental results with respect to fungal and bacterial N2O fluxes was checked using a flux balance comparing the sum of bacterial and fungal inhibition effects (treatments B and C) to the dual inhibition effect (treatment D):
with A, B, C and D representing the N2O production rates of the last sampling time of treatment A, B, C and D, respectively. Assuming that in the other three treatments (A, B and C) non-inhibitable N2O production was equal to treatment D, N2O produced by bacteria and fungi should show the following relation between the four treatments:
The fungal contribution to N2O production during denitrification with microbial inhibition (fFDmi) can be calculated, when N2O production of treatment D is significantly smaller than N2O production of treatments A, B and C, by
A detailed discussion of inhibitor effects and difficulties with organisms that were not inhibited or abiotic sources (treatment D) is presented in Sect. 4.1.
2.5 Isotope methods
2.5.1 Isotope end-member mixing approach (IEM)
The fungal fraction (fFD) contributing to N2O production from denitrification in soil samples was calculated according to the isotope mixing model (IEM) proposed by Ostrom et al. (2010), which was established for calculating the bacterial fraction (fBD) of N2O production. Assuming that bacteria (BD) and fungi (FD) are the only sources of N2O in soil, the 15N site preference values of produced N2O (SPprod) result from the mixing balance:
where fFD and fBD represent the fraction of N2O produced by fungi and N2O sources other than fungal denitrification, respectively, and SPFD and SPBD are the respective end-member values (Ostrom et al., 2010; Ostrom and Ostrom, 2011). This calculation was based on the assumption that the sum of fBD and fFD equals 1 and that N2O reduction to N2 is negligible. The mean SPFD value was assumed to be 33.6 ‰ (Sutka et al., 2008; Maeda et al., 2015; Rohe et al., 2014a, 2017), and the SPBD value from heterotrophic denitrification was assumed with minimum and maximum values from −7.5 ‰ to +3.7 ‰ (Yu et al., 2020). For this IEM, only results from variant +C2H2 could be used to calculate the fungal fraction contributing to N2O production (fFD_SP), as microorganisms of this variant produce N2O that is not affected by reduction to N2. The fFD_SP contributing to N2O production during denitrification was calculated using the measured value of variant +C2H2 as the SPprod value in Eq. (4) that was solved for fFD (fFD = ). By applying this equation, a range for fFD_SP is received when using minimum and maximum SPBD values.
Based on values from the −C2H2 variant, it was possible to solve Eq. (4) to also estimate the maximum potential fungal contribution to denitrification (fFD_SPpot) assuming that there was no contribution of N2O reduction. While bacterial denitrification and nitrifier denitrification would result in low values ( is −10.7 ‰ to +3.7 ‰; Frame and Casciotti, 2010; Yu et al., 2020), large values would be expected from fungal denitrification and nitrification ( is 16 ‰ to 37 ‰; Sutka et al., 2008; Decock and Six, 2013; Rohe et al., 2014a, 2017; Maeda et al., 2015). N2O reduction could have further increased the SPprod values. If the contribution of this process to SPprod values cannot be precisely estimated, by neglecting these effects we can determine the maximal potential fungal contribution. fFD calculated from Eq. (4) (variant −C2H2) would thus be lower if N2O reduction had occurred. However, assuming the impact of N2O reduction on was negligible, this IEM enabled us to calculate the maximum potential fFD as fFD_SPpot = .
2.5.2 Product ratio [N2O (N2 + N2O)] of denitrification
The variant traced served to assess N2O reduction during denitrification in each experiment. The product ratio of denitrification as given by the variant traced () was calculated as
with and representing N2O and N2 produced in the 15N-labelled fertilizer pool. To check the effectiveness of C2H2 in blocking the N2O reduction, was compared with , where the latter can be calculated from N2O production rates of variants −C2H2 and +C2H2:
with and representing the N2O produced in variants −C2H2 and +C2H2, respectively.
It was possible to assess the completeness of blockage of N2O reduction by C2H2 with the experimental setup as follows. If and were in agreement, a complete blockage of N2O reduction could be assumed. This enabled us to estimate reduction effects on the isotopic signatures of N2O by comparing the δ0 values, i.e. isotopic values of N2O produced without N2O reduction effects of variant +C2H2, with isotopic values of N2O of variant −C2H2.
The information on the product ratio was used as an additional possibility of also calculating the fFD for variant −C2H2. The Rayleigh-type model presented by Lewicka-Szczebak et al. (2017) and Senbayram et al. (2018) for similar closed-system incubations was used to calculate the 15N site preference values of the originally produced N2O of variant −C2H2 (SPprod). SP values of emitted N2O, i.e. after partial reduction in produced N2O (), were corrected with the net isotope effect of N2O reduction (ηr) and the as follows:
According to Yu et al. (2020) the ηr was assumed to be −6 ‰. Subsequently, Eq. (4) was used to calculate the fFD by using SPprod values of variant −C2H2 (fFD_SPcalc) obtained from Eq. (7).
2.5.3 SP/δ18O isotope mapping approach (SP/δ18O Map)
The fFD contributing to N2O production from denitrification in soil samples was also estimated with the SP/δ18O Map (fFD_MAP) (Lewicka-Szczebak et al., 2017, 2020). This method allows for estimating both the fFD and N2O product ratio (rMAP). For precise estimations, the δ18O values of soil water () applied in the experiments are needed, and these values were not determined. However, since we have independent information on the N2O product ratio from the traced variant (), we can calculate the possible values of soil to obtain the nearest N2O product ratios in natural and 15N treatments. The fitting of values was performed for mean, minimal and maximal values of SPBD (−1.9 ‰, −7.5 ‰ and 3.7 ‰, respectively) and aimed at obtaining the minimal difference between rMAP and that measured in the traced variant, i.e. the minimal value of (according to least-squares method) variant (for explanation of the product ratio see Sect. 2.5.2). This further allows calculation of the possible ranges for fFD for particular fitted values (Table 4) based on the SP/δ18O mapping approach (Lewicka-Szczebak et al., 2017, 2020). Namely, the fitted values are applied to properly correct the values of the mixing end-members (BD and FD), which depend on the ambient water. Afterwards, the corrected values of mixing end-members are applied to calculate the fFD values. The calculations with this approach may be performed assuming two different scenarios of the interplay between N2O mixing and reduction (Lewicka-Szczebak et al., 2017, 2020), but for this study both scenarios yielded almost identical results (maximal differences of 0.02 in N2O product ratio and 2 % for fFD were found), due to fBD being near 100 %. Hence, we only provide the results assuming the reduction of bacterial N2O followed by mixing with fungal N2O. In the following, all calculated fractions are presented in percent (%).
2.6 Other sources of N2O
Assuming that denitrification was the only source of N2O in the incubation experiment, the expected 15N enrichment in N2O produced () was given by
with Nsoil, Nfert and Nbulk describing the amount of N [mg] in unfertilized soil samples (Table 1), fertilizer and fertilized soil samples, respectively, and 15Nnat and 15Nfert describing the 15N enrichment under natural conditions (0.3663 at. %) and in fertilizer (50 at. %), respectively. Comparison of measured 15N enrichment in N2O and gave information about the contribution of processes other than denitrification to N2O production.
Table 2Average CO2 and N2O production rates and N2O isotopic values of N2O of the last sample collection with and without C2H2 application in the headspace (variants −C2H2 and +C2H2) of each soil (Soil 1 to 3) for treatments A without growth inhibition, B with bacterial growth inhibition, C with fungal growth inhibition, and D with bacterial and fungal growth inhibition, respectively (standard deviation in brackets; n = 3).
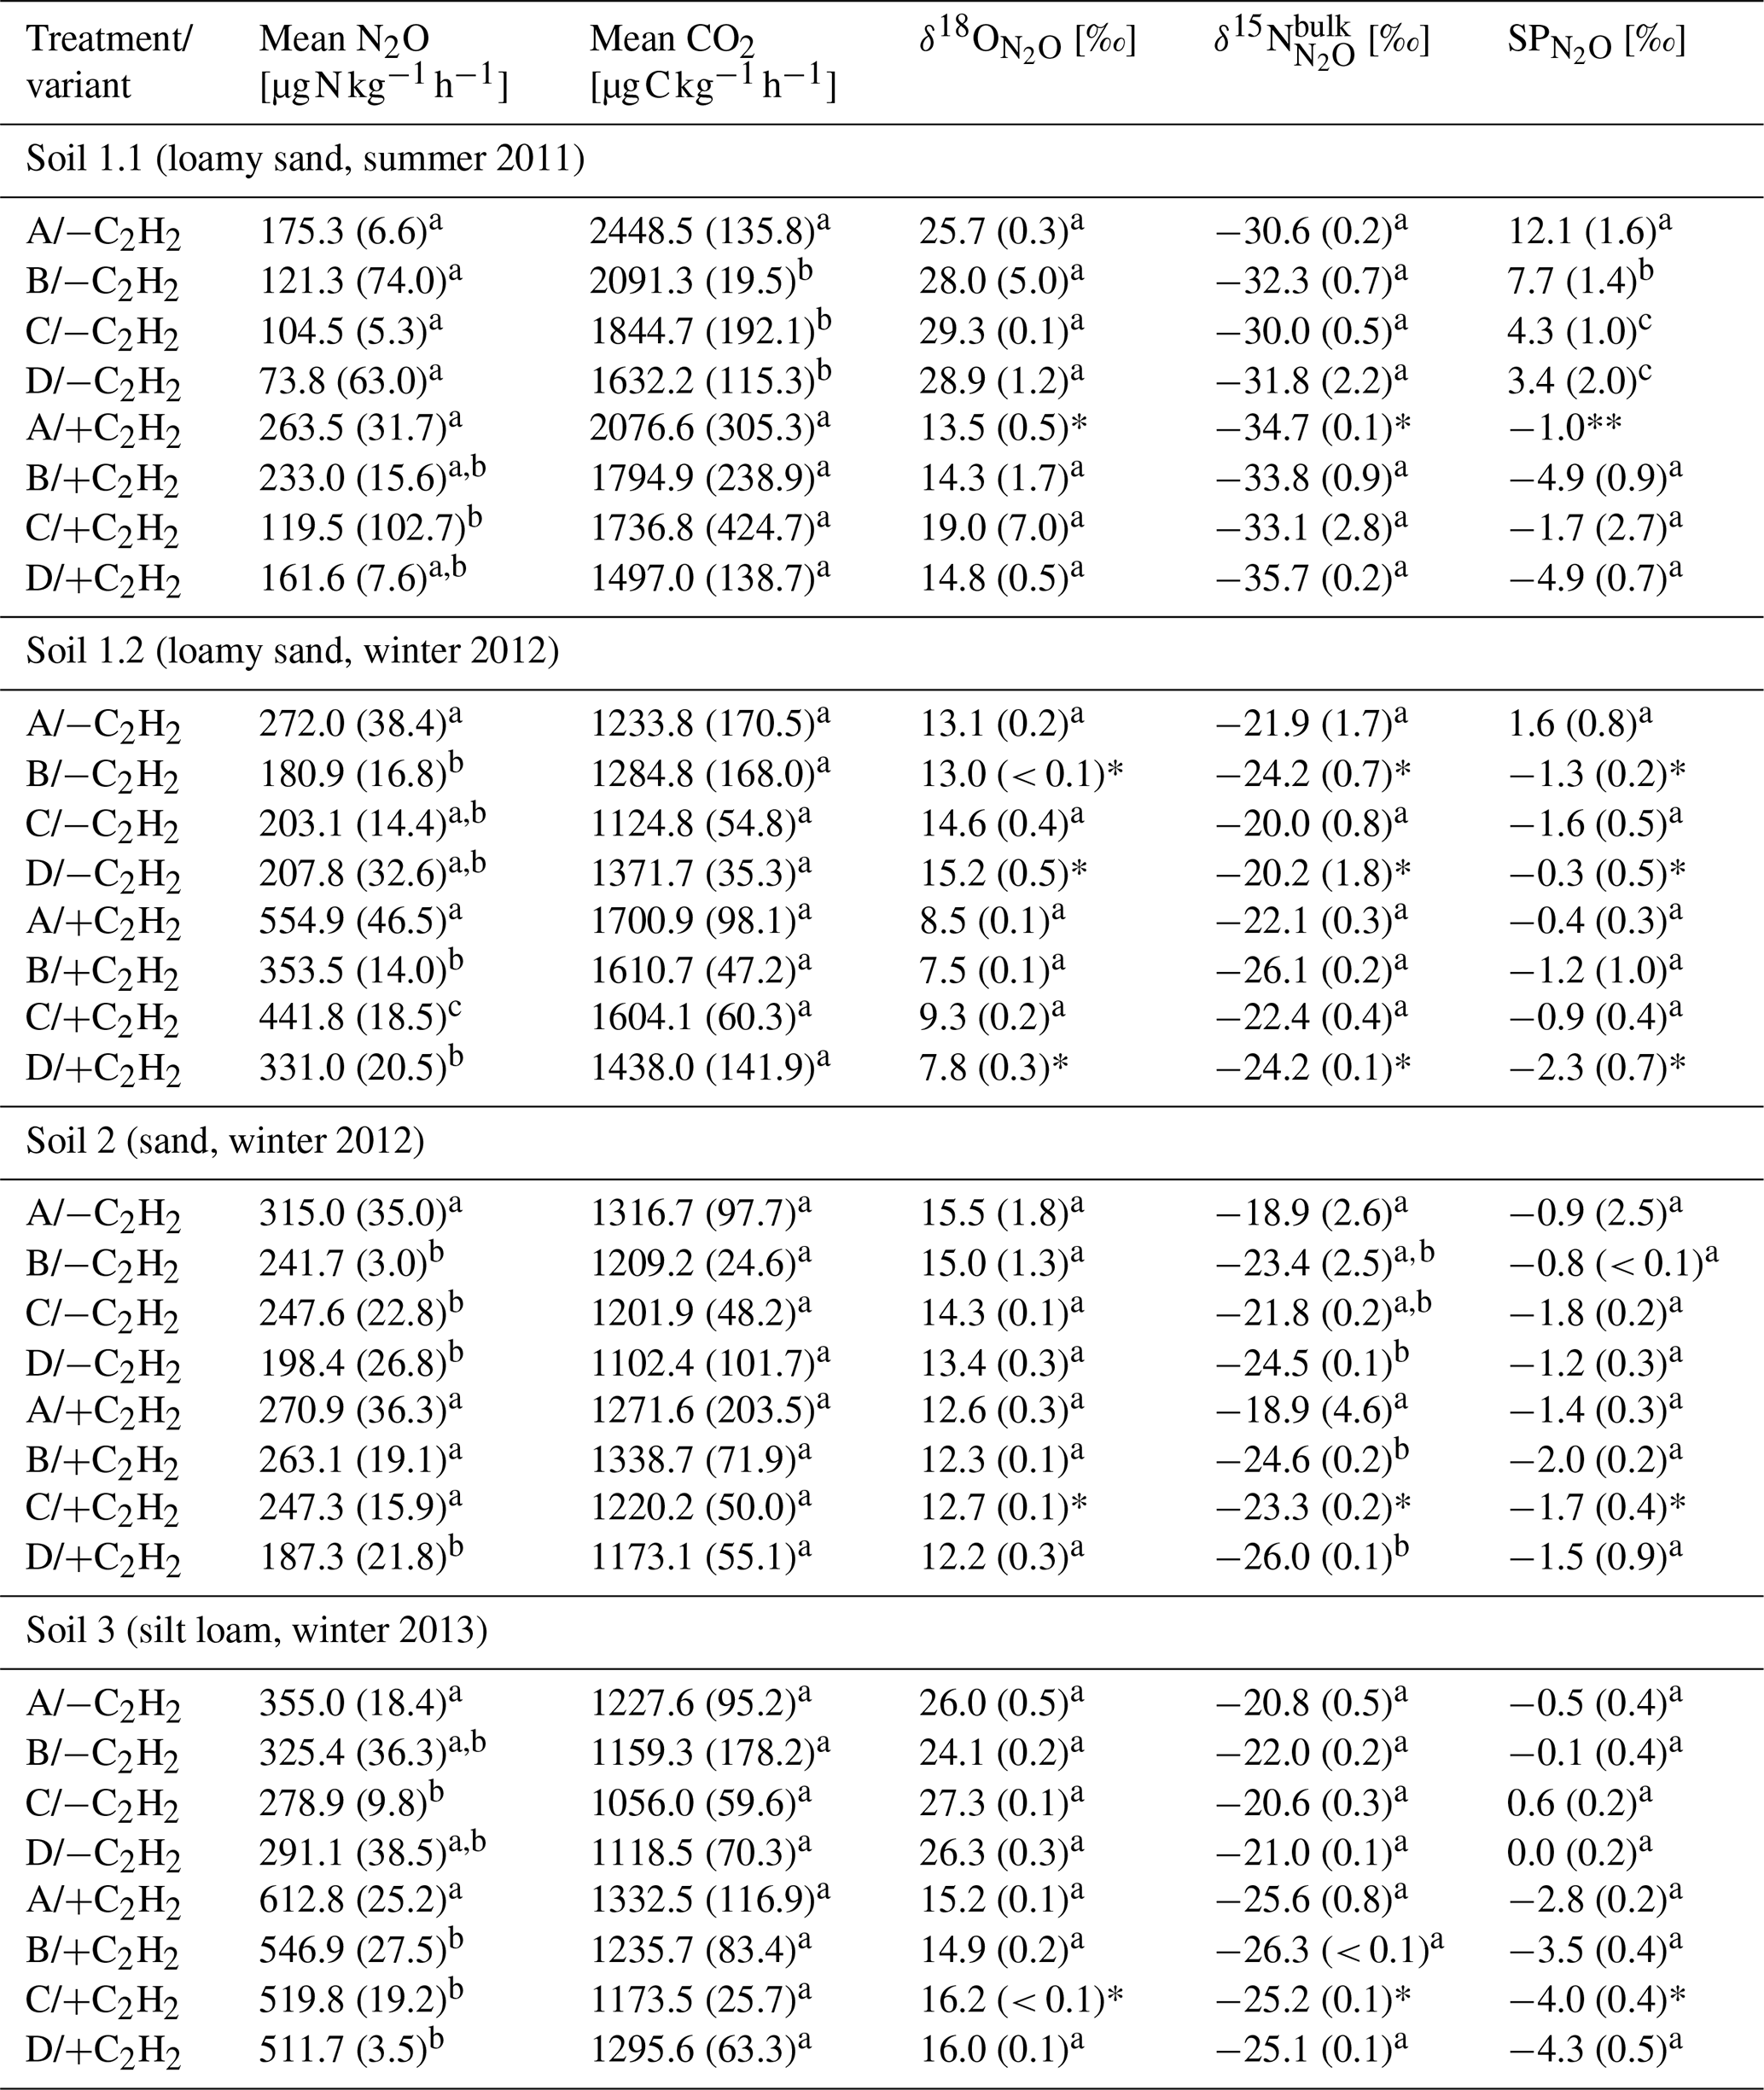
Letters denote significant differences (P < 0.05) among treatments and variants within a soil. Asterisks indicate that only two samples (*) or one sample (**) of triplicates were analysable due to logistical difficulties.
Table 3Average CO2 and N2O production rates of the last sample collection after 10 or 8 h of variant traced, respectively, with 15N labelling in N2O () and the calculated of variant traced and calculated from N2O production rates of variant −C2H2 and +C2H2 of each soil (Soil 1 to 3) for treatments A without growth inhibition, B with bacterial growth inhibition, C with fungal growth inhibition, and D with bacterial and fungal growth inhibition, respectively (standard deviation in brackets; n = 3).
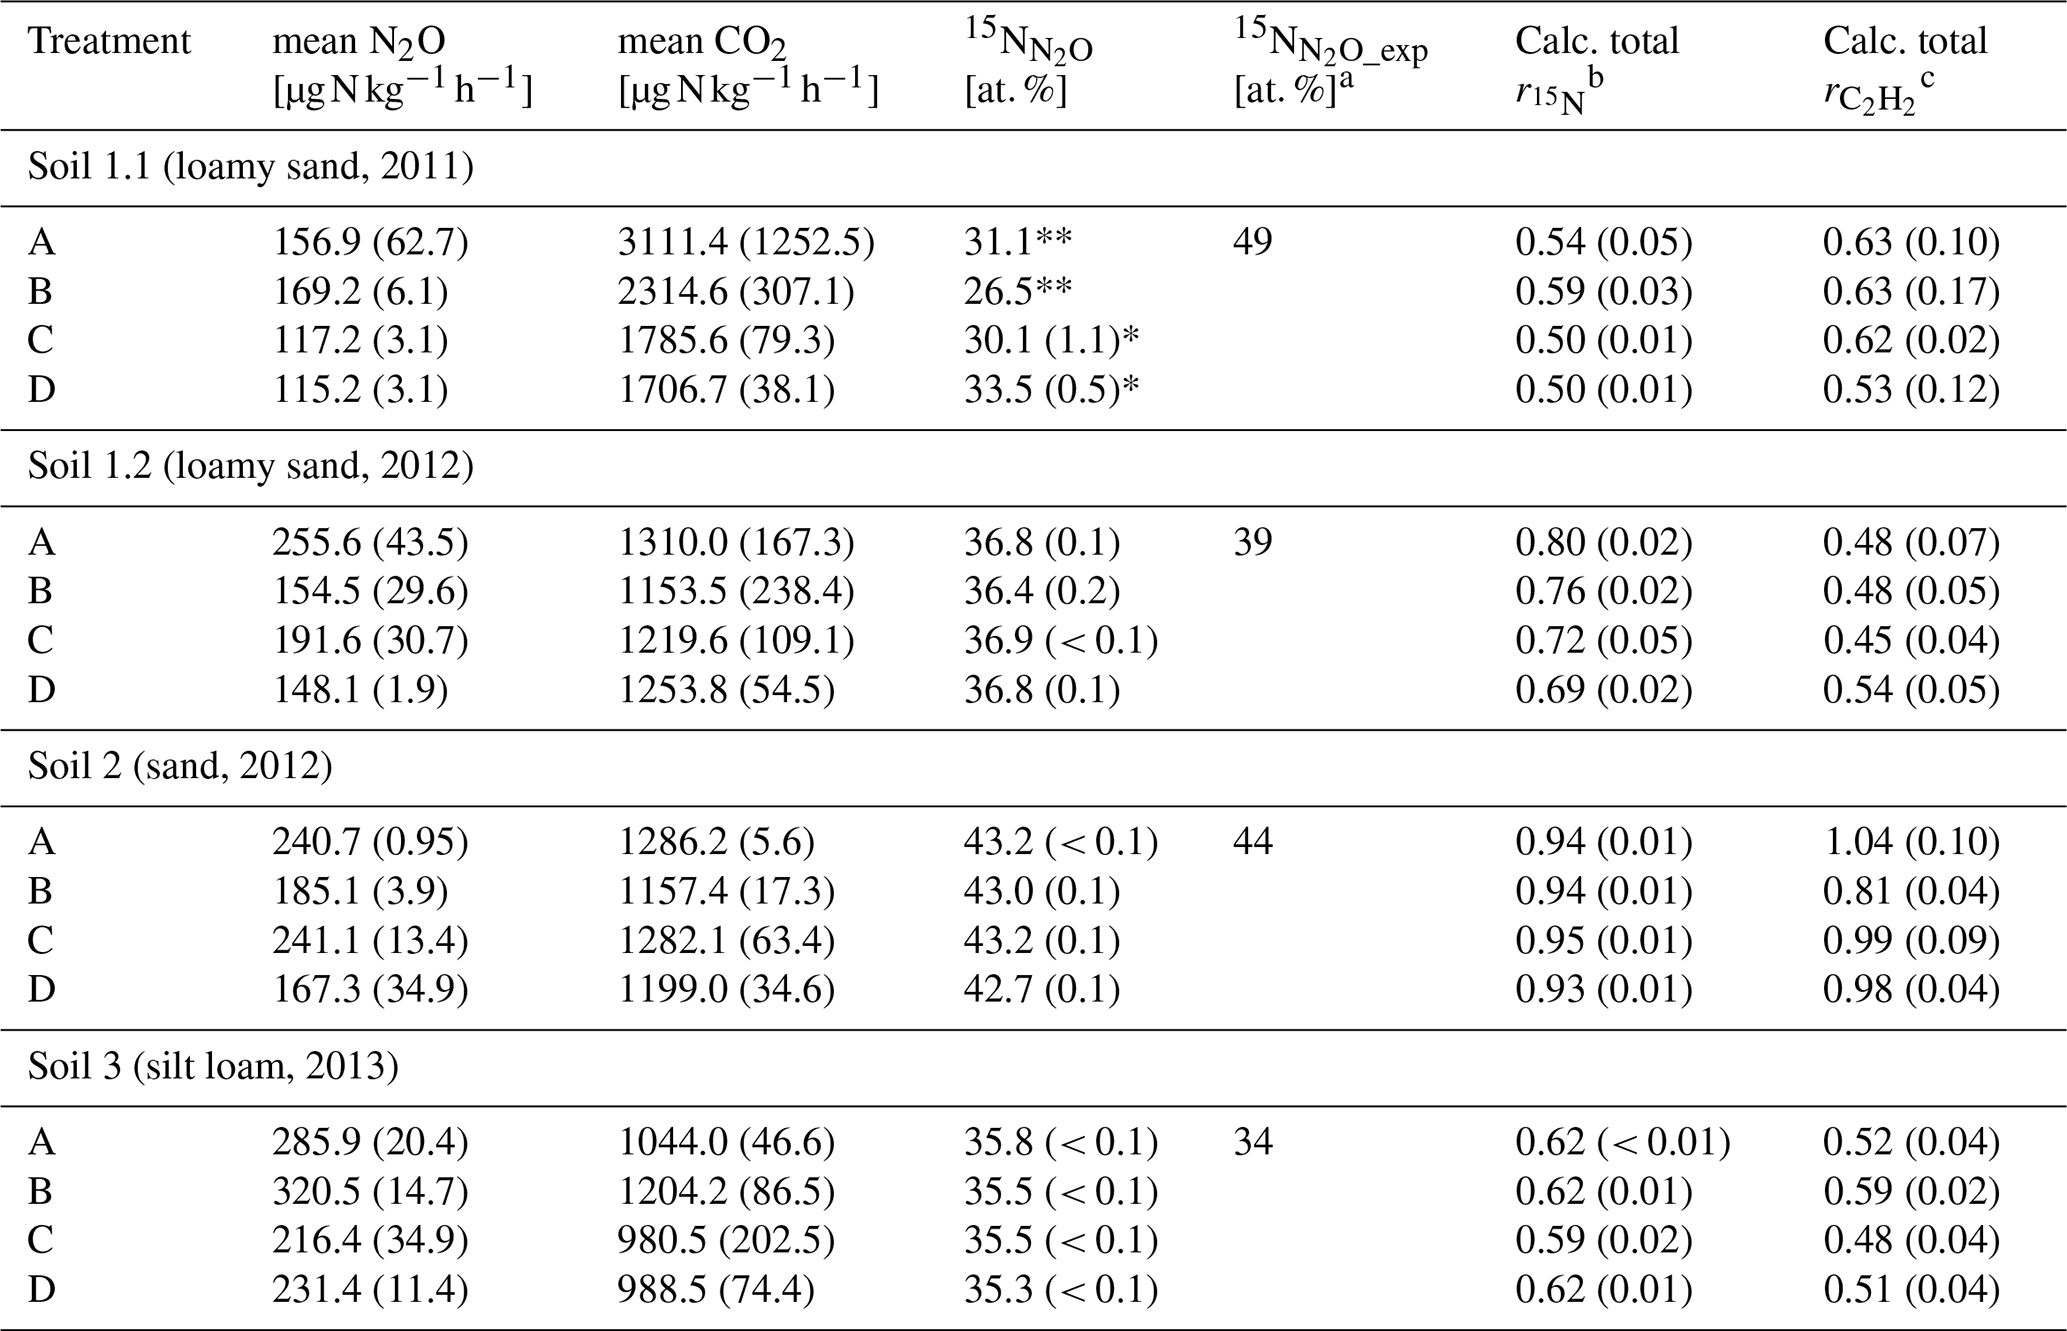
Asterisks indicate that only two samples (*) or one sample (**) were analysed due to logistical difficulties. a [at. %] was calculated from Eq. (8). b = , with N2O or N2 production rates from variant traced; see Eq. (5). c = , with N2O production rate from variants −C2H2 and +C2H2; see Eq. (6); cf. Table 2.
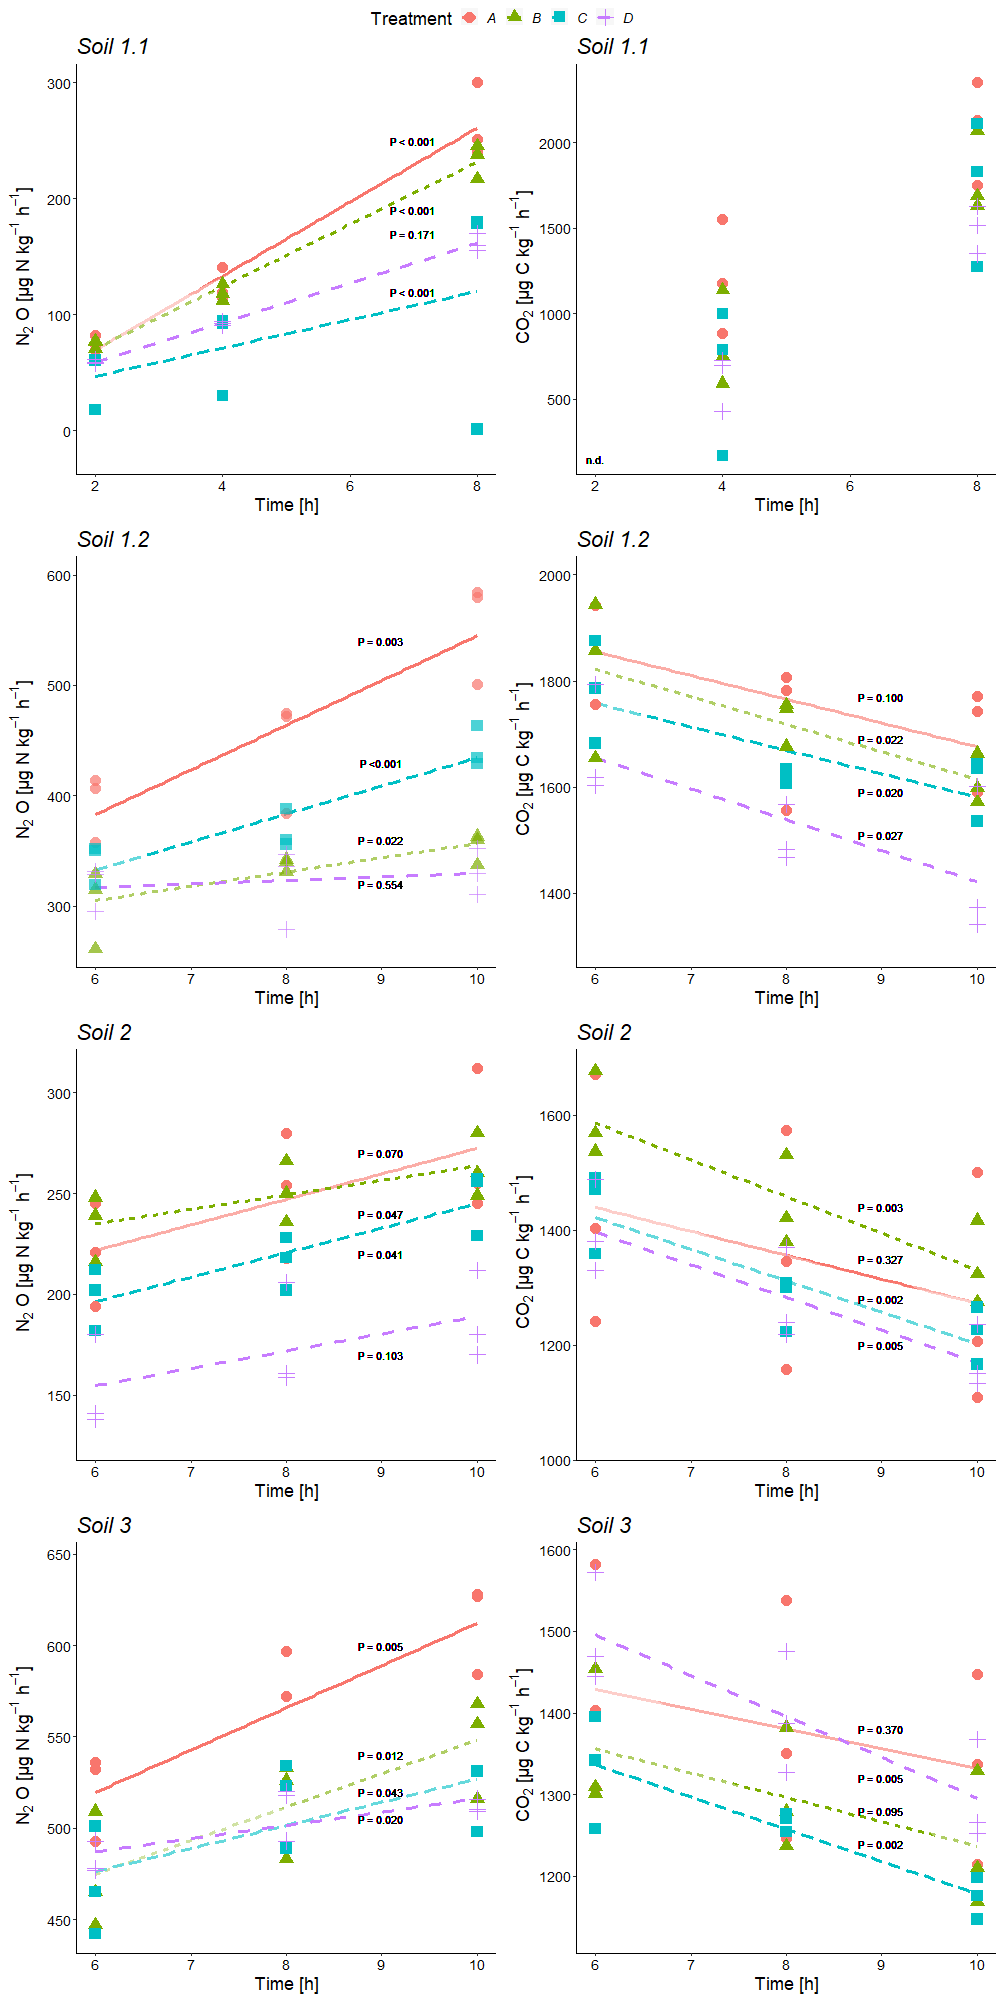
Figure 2Time series of average N2O and CO2 production rates during incubation of variant +C2H2 at the three sample collection times of each soil (Soil 1 to 3) for treatment A without growth inhibitors, B with bacterial growth inhibition, C with fungal growth inhibition, and D with bacterial and fungal growth inhibition; P values for linear regressions (significance level α≤ 0.05). For all significant regressions, R2 values were ≥ 0.46, and in the case of non-significance, R2 values were ≤ 0.40. n.d.: there was no detectable CO2 production in Soil 1.1 at the first sampling time after 2 h.
Table 4Summary of the results provided by SP/δ18O Map for fraction of fungal denitrification (fFD_MAP) and N2O product ratio (rMAP) in the acetylated (+C2H2) and non-acetylated (−C2H2) variants for three possible values from bacterial denitrification (SPBD): mean (−1.9 ‰), maximal (3.7 ‰) and minimal (−7.5 ‰). The δ18O values of soil water () were fitted to obtain the lowest difference (Diff) between product ratio determined with 15N treatment () and SP/δ18O Map (rMAP). The most plausible fittings are shown in bold (see discussion for reasons for this choice).
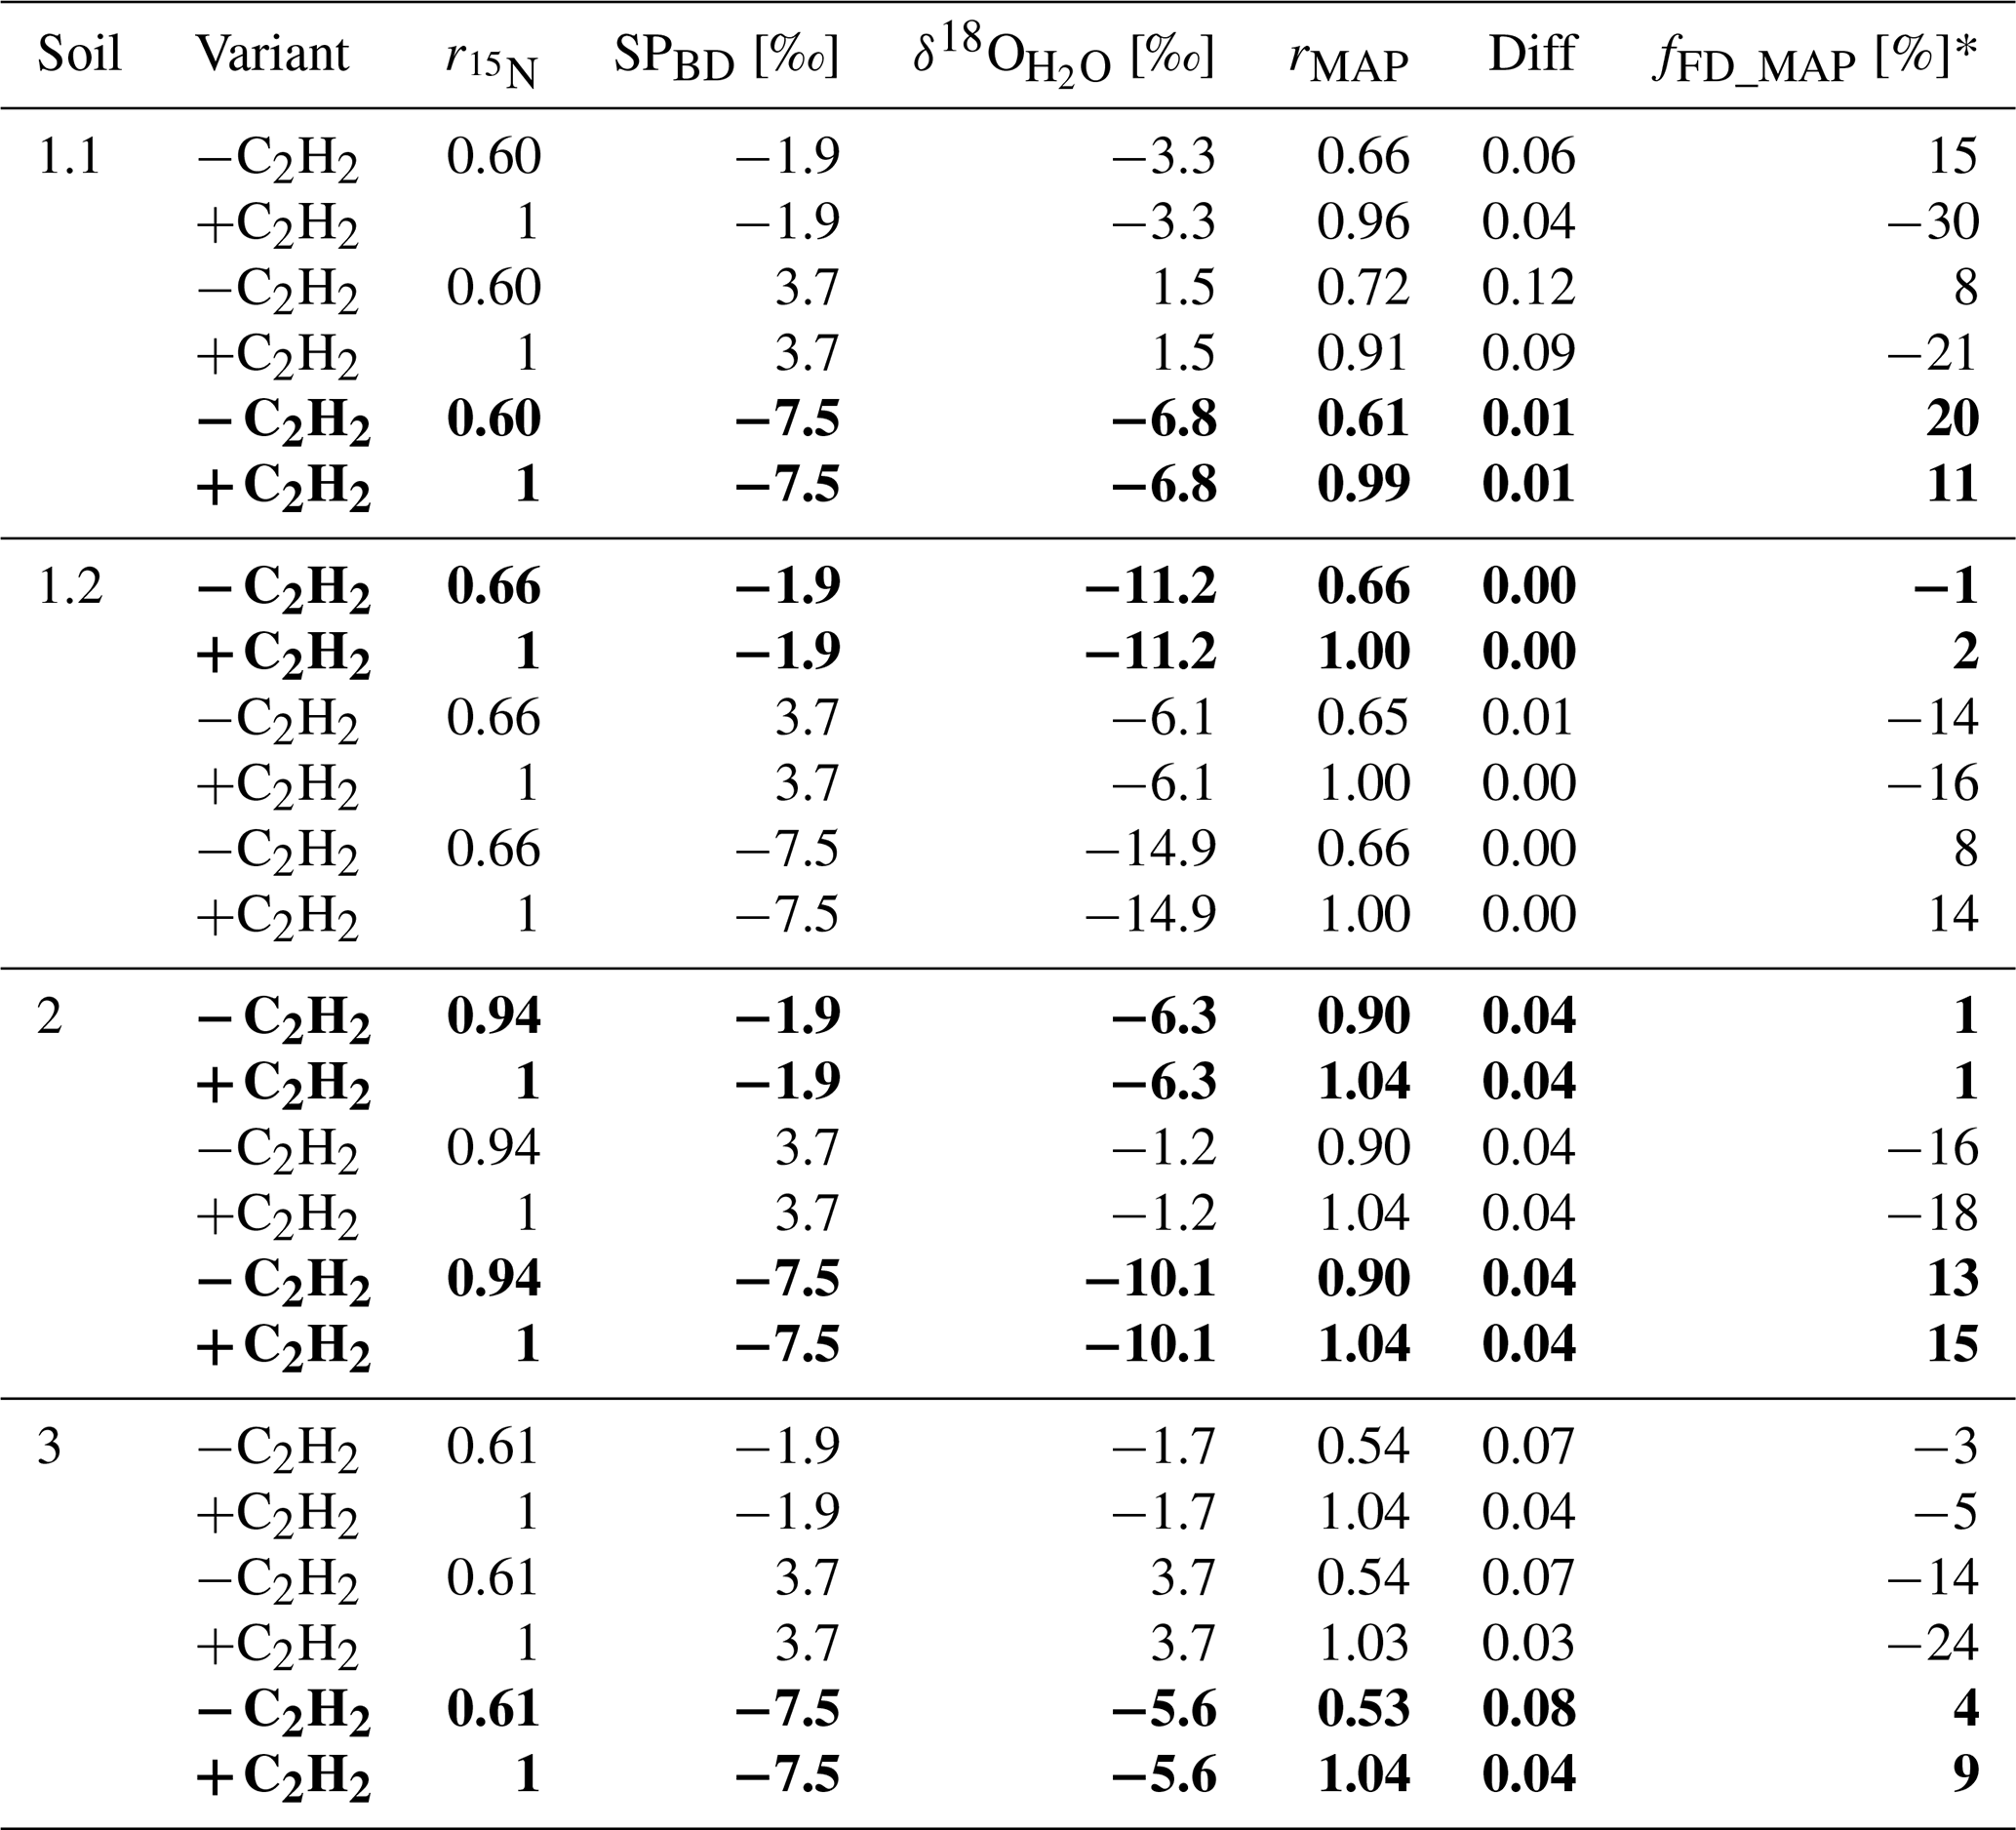
* Negative values for fFD_MAP are non-realistic and therefore discarded in further interpretation.
2.7 Statistical analysis
We conducted several three-way analyses of variance (ANOVAs) to test significant effects of the soil, experimental variant and treatment on N2O production; CO2 production; and , and values. The pairwise comparison with Tukey's HSD test allowed us to find differences between soils, variants and treatments influencing N2O production, CO2 production and isotopic values. Significant effects of soils and treatments on and were tested by two-way ANOVA, while differences between soils and treatments influencing the product ratios were tested with pairwise comparison with Tukey's HSD test. Effects of variants −C2H2 and traced on N2O and CO2 production were tested by ANOVA. For this ANOVA, the N2O production rate had to be log 10-transformed to achieve homogeneity of variance and normality. The significance level α was 0.05 for every ANOVA. For some ANOVAs treatments were excluded, when replicates were n < 3. This was the case when only one or two samples out of three replicates could be analysed. This is denoted in the footnotes of tables (Tables 2 and 3). The N2O or CO2 production rates of variant +C2H2 were followed over three sampling times by regression. For statistical analysis, we used the program R (R Core Team, 2013). The Excel Solver tool was used to determine the values in the application of SP/δ18O Map calculations.
3.1 N2O production rates
N2O and CO2 production rates of all treatments were similar in magnitude in almost all cases and mostly indistinguishable (Table 2, Fig. 2). CO2 production rates were determined to obtain additional information about the denitrifying process. N2O production rates exhibited increasing trends with ongoing incubation time for every soil with large variations within the treatments (Fig. 2). Contrary to that, CO2 production rates showed decreasing trends (Fig. 2, exemplarily shown for data of variant +C2H2). Calculations of inhibitor effects were based on average N2O and CO2 production rates of the entire incubation period, i.e. 10 h of incubation time for Soil 1.2, 2 and 3 and 8 h for Soil 1.1.
N2O and CO2 production rates of all +C2H2 variants differed significantly among soils (P < 0.001), and N2O production rates also differed significantly among treatments (P < 0.001). The largest N2O production rates of about 555 to 613 were obtained in Soil 1.2 and 3, respectively, while in Soil 2 and 1.1 N2O production rates were smaller (271 and 264 , respectively). N2O and CO2 production rates were significantly larger in variant +C2H2 than in variant −C2H2 of Soil 1.1, 1.2 and 3 (P < 0.001, P < 0.001 and P = 0.002 for the N2O production rate and P = 0.008, P < 0.001 and P = 0.027 for the CO2 production rate, respectively) (Table 2), while −C2H2 and +C2H2 variants of Soil 2 did not differ in N2O and CO2 production rates (P = 0.640 and P = 0.342, respectively).
Without blockage of N2O reductase (variant −C2H2), N2O production rates of treatment A varied significantly among soils with mean values between 175 and 355 (P < 0.001) (Table 2). In Soil 1.2, the N2O production rate was significantly larger (272 ) than in Soil 1.1 (175 ) (P = 0.028) in variant −C2H2. In most cases of the three variants (−C2H2, +C2H2 and traced) treatment A (without growth inhibitors) produced most N2O, followed by either treatment B (bacterial growth inhibitor; more N2O compared to treatment C in soils 1.1, 2 and 3) or treatment C (fungal growth inhibitor; more N2O compared to treatment B in Soil 1.2). The smallest N2O production rates were in most cases found in treatment D (non-inhibitable N2O production) (except for variant traced of Soil 1.1, variant −C2H2 of Soil 1.2, and variants −C2H2 and traced of Soil 3). Microbial inhibitor treatments differed significantly in N2O fluxes of variant +C2H2 of each soil (always P ≤ 0.042), while this was not the case for inhibitor treatments of variants −C2H2 and traced of Soil 1.1 (P = 0.154 and P = 0.154, respectively). Significant deviations of treatments without inhibition (A) or with full inhibition (D) were found in the following cases (Table 2): the N2O production rate of treatment A was significantly larger compared to the other three treatments of Soil 1.2 (+C2H2 and −C2H2), Soil 2 (−C2H2) and Soil 3 (+C2H2); treatment D was significantly smaller compared to the other three treatments in Soil 2 (+C2H2) only and compared to treatments A and C in Soil 1.2 (+C2H2). A detailed discussion of inhibitor effects and difficulties with organisms that were not inhibited or abiotic sources is presented in Sect. 4.1. Comparing variants −C2H2 and traced, N2O and CO2 rates did not differ (P = 0.991 for N2O production rate and P = 0.490 for CO2 production rate, respectively), confirming that 15N labelling did not affect N2O and CO2 processes.
3.2 Isotopologues of N2O produced in different variants and treatments
3.2.1 Variant −C2H2
values of all soils and inhibitor treatments of variant −C2H2 were within a range of −1.8 ‰ to 12.1 ‰ (Table 2) and differed among inhibitor treatments (P = 0.037). values in variant −C2H2 of Soil 1.1 were particularly large (3.4 ‰ to 12.1 ‰) compared to the other soils (1.6 ‰ to −1.6 ‰). values of variant −C2H2 were significantly larger than values of variant +C2H2 (P < 0.001) (up to 4.1 ‰, 2.4 ‰, 1.5 ‰ and 4.6 ‰ in Soil 1.1, 1.2, 2 and 3, respectively). Generally, most SPprod values of variant −C2H2 (Eq. 7) were smaller than values of variant −C2H2 but still larger than values of variant +C2H2 and are presented in Table S2 in the Supplement.
3.2.2 Variant +C2H2
values of all soils and all treatments of variant +C2H2 were within a narrow range between −4.9 ‰ and −0.4 ‰ (Table 2). In general, there were only small differences among treatments: values of treatment A in variant +C2H2 differed significantly among soils (P < 0.001), with the largest values in Soil 1.2 (−0.4 ‰) and smallest values in Soil 3 (−2.8 ‰). values of treatment D in variant +C2H2 of all soils varied between −1.5 ‰ and −4.9 ‰, but only values of Soil 2 differed significantly from values of the other soils (P = 0.006). For treatment B of variant +C2H2, values differed only significantly between Soil 1.1 and 1.2, 2 and 1.1, and 1.2 and 3 (each P = 0.002). values from treatment C in variant +C2H2 did not differ significantly (P = 0.600). For every soil, we found significantly larger , and values in variant −C2H2 than in variant +C2H2 (P < 0.001), except for Soil 2, where values of variant −C2H2 were indistinguishable from those of variant +C2H2 (P = 0.400). However, only in a few variants were there significant differences in , or values between treatments with fungal and bacterial inhibition (B and C, respectively) (Table 2). As explained in Sect. 3.3, N2O reduction blockage in variants +C2H2 was successful in most cases (Soil 1.1, 2 and 3). values of this variant are thus assumed to be valid estimates of δ0, i.e. SPprod values of N2O production, and can thus be used for applying the IEM.
3.2.3 Variant traced
The 15N labelling of N2O () or N2 produced () gave information about the incorporated N from 15N-labelled into N2O or N2 as well as about the N2O reduction to N2. Microorganisms in each treatment used the 15N-labelled in variant traced (Table 3) and expected depended on the initial N abundance in of unfertilized soil (Eq. 7). Soil 1.1 is the only one showing a large discrepancy between measured (about 30 at. %) and calculated (49 at. %) in N2O, whereas the other soils showed close agreement (Table 3).
3.3 Product ratios of denitrification and efficiency of N2O reductase blockage by C2H2
and determined with Soil 2 were significantly larger than with the other soils (P ≤ 0.001) (Table 3). of treatment B was significantly larger than those of treatment C and D of Soil 1.1 (P = 0.032), while all other treatments of other soils did not differ. did not differ significantly among treatments (P = 0.400). In order to test the efficiency of blockage of N2O reduction by C2H2 application, (Eq. 5) was compared with (Eq. 6). In Soil 1.2, was by far smaller than , while both calculated product ratios were in similar ranges in the other three soils, and thus a successful blockage of N2O reduction was assumed for those soils.
Table 5Ranges of the fraction of N2O produced by fungi (fFD) from four soils using different approaches: fungal fraction was calculated using the microbial inhibitor approach (modified SIRIN) (fFDmi) (footnote a), the isotopomer end-member mixing approach (IEM) by SP isotope mixing balance using variant +C2H2 (fFD_SP) (footnote b) and fFD_SPpot (footnote c) for results from variant −C2H2 assuming the SP effect of N2O reduction was negligible and for results from variant −C2H2 with reduction correction to calculate the values (fFD_SPcalc) (footnote d), and the δ18O/SP Map (fFD_MAP) (footnote e) with and values from variant −C2H2 and variant +C2H2.
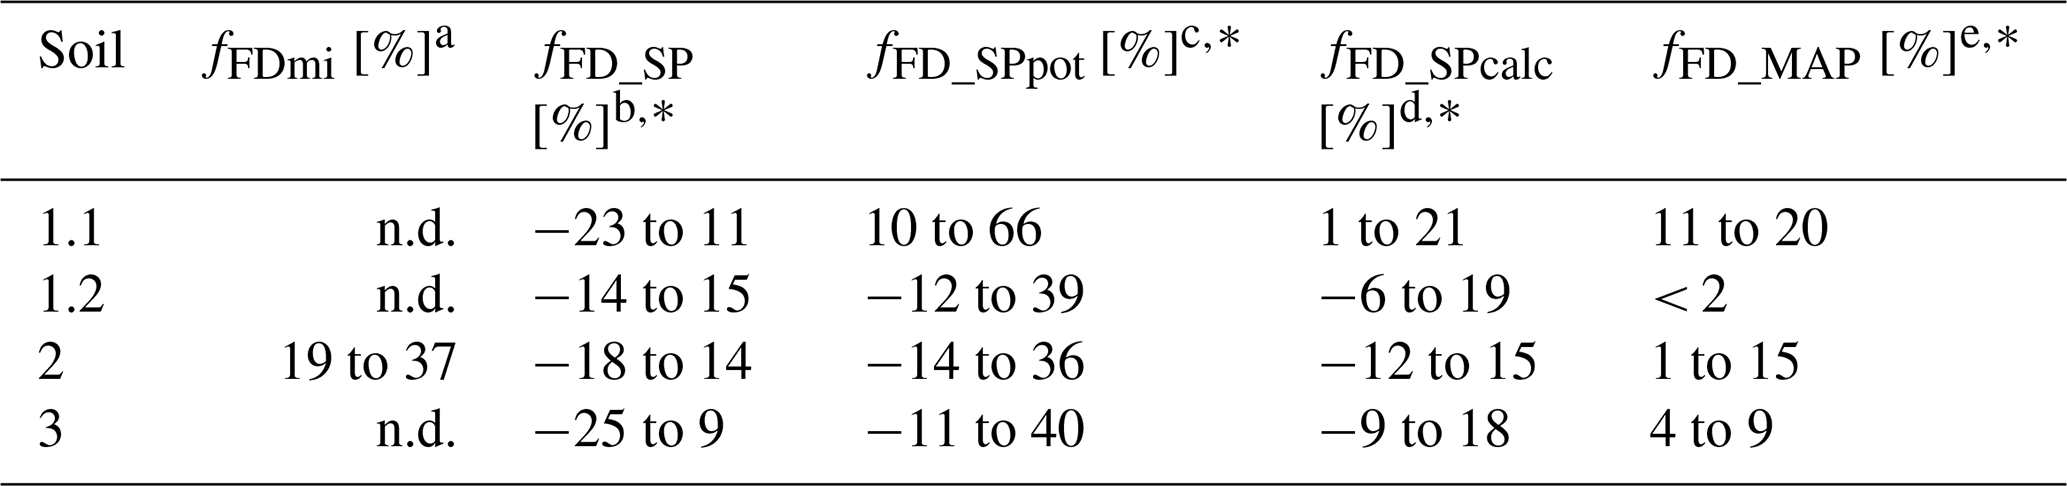
a Fungal fraction of N2O production calculated by Eq. (3) taking variations in three replicates into account. b Fungal fraction of N2O production calculated by Eq. (4) for variant +C2H2 assuming values of N2O produced by bacteria were 3.7 ‰ or −7.5 ‰ (Yu et al., 2020) and by fungi were on average 33.6 ‰ (Sutka et al., 2008; Rohe et al., 2014a, 2017; Maeda et al., 2015). Using the minimum and maximum values known for bacteria resulted in an fFD_SP range. c Maximum potential fungal fraction of N2O production calculated by Eq. (4) as an average range for all treatments of variant −C2H2 assuming values of N2O produced by bacterial denitrification or nitrifier denitrification were between 3.7 ‰ and −10.7 ‰ (Frame and Casciotti, 2010; Yu et al., 2020) or produced by fungal denitrification or nitrification were between 16 ‰ and 37 ‰ (Sutka et al., 2008; Decock and Six, 2013; Rohe et al., 2014a, 2017; Maeda et al., 2015). Using the minimum and maximum values known from pure cultures resulted in the given fFD_SPpot range. Here, the effect of partial reduction of N2O on values was assumed to be negligible. d Equation (4) to solve for fungal fraction in variant −C2H2 assuming values of N2O produced by bacteria was 3.7 (resulting in a negative fraction and therefore set to zero) or −7.5 ‰ and using reduction correction with ηr = −6 ‰ to calculate SPprod values (Senbayram et al., 2018; Yu et al., 2020). Using the minimum and maximum values known for bacteria resulted in an fFD_SPcalc range. e Fungal fraction of N2O production calculated by SP/δ18O Map assuming the most probable values from bacterial denitrification (according to Table 4). Using the minimum and maximum values known for bacteria and ranges of fitted values (the fitting is also based on results obtained in 15N treatment) resulted in an fFD_MAP range. * Negative values for fFD_SP, fFD_SPpot, fFD_SPcalc and fFD_MAP are non-realistic and therefore discarded in further interpretation. n.d.: not determined because of insufficient inhibition.
3.4 Fungal contribution to N2O production from denitrification by microbial inhibitor approach (modified SIRIN)
When calculating fFDmi, N2O production rates of treatment D must be significantly smaller compared to the other three treatments and the flux balance according to Eqs. (1) and (2) must be consistent. Taking the large ranges of N2O production rates of each treatment (minimum and maximum values) into account, for each soil the difference in treatment A and D (A − D) was indistinguishable from ((B − D) + (C − D)) (Eq. 2), showing good agreement between Eqs. (1) and (2). However, N2O production in treatment D was large within all variants. Only with Soil 2 of the variant +C2H2 were the N2O production rates of treatment D significantly smaller than those of the other three treatments. Thus, for Soil 2, fFDmi could be calculated (Eq. 3) and amounted to 28 ± 9 % (Table 5) with a corresponding fungal N2O production rate of 23.7 ± 1.8 . Although the N2O production rate of treatment D was smaller than that of treatment A (Soil 2), it must be pointed out that due to the large amount of non-inhibitable production (treatment D), even the result for Soil 2 is actually very uncertain. For all other soils, calculation of fFDmi was not possible; i.e. SIRIN was not successful.
3.5 Fungal contribution to N2O production from denitrification by the SP end-member mixing approach (IEM) and SP/δ18O isotope mapping approach (SP/δ18O Map)
The IEM revealed that fFD_SP was small in all soils (≤ 11 %, ≤ 15 %, ≤ 14 % and ≤ 9 % with Soil 1 to 3, respectively) (Table 5). Regardless of the influence of N2O reduction on values, only in Soil 1.1 could fFD_SPpot have reached 66 %, while fungal denitrification could not have dominated with the other three soils (Table 5).
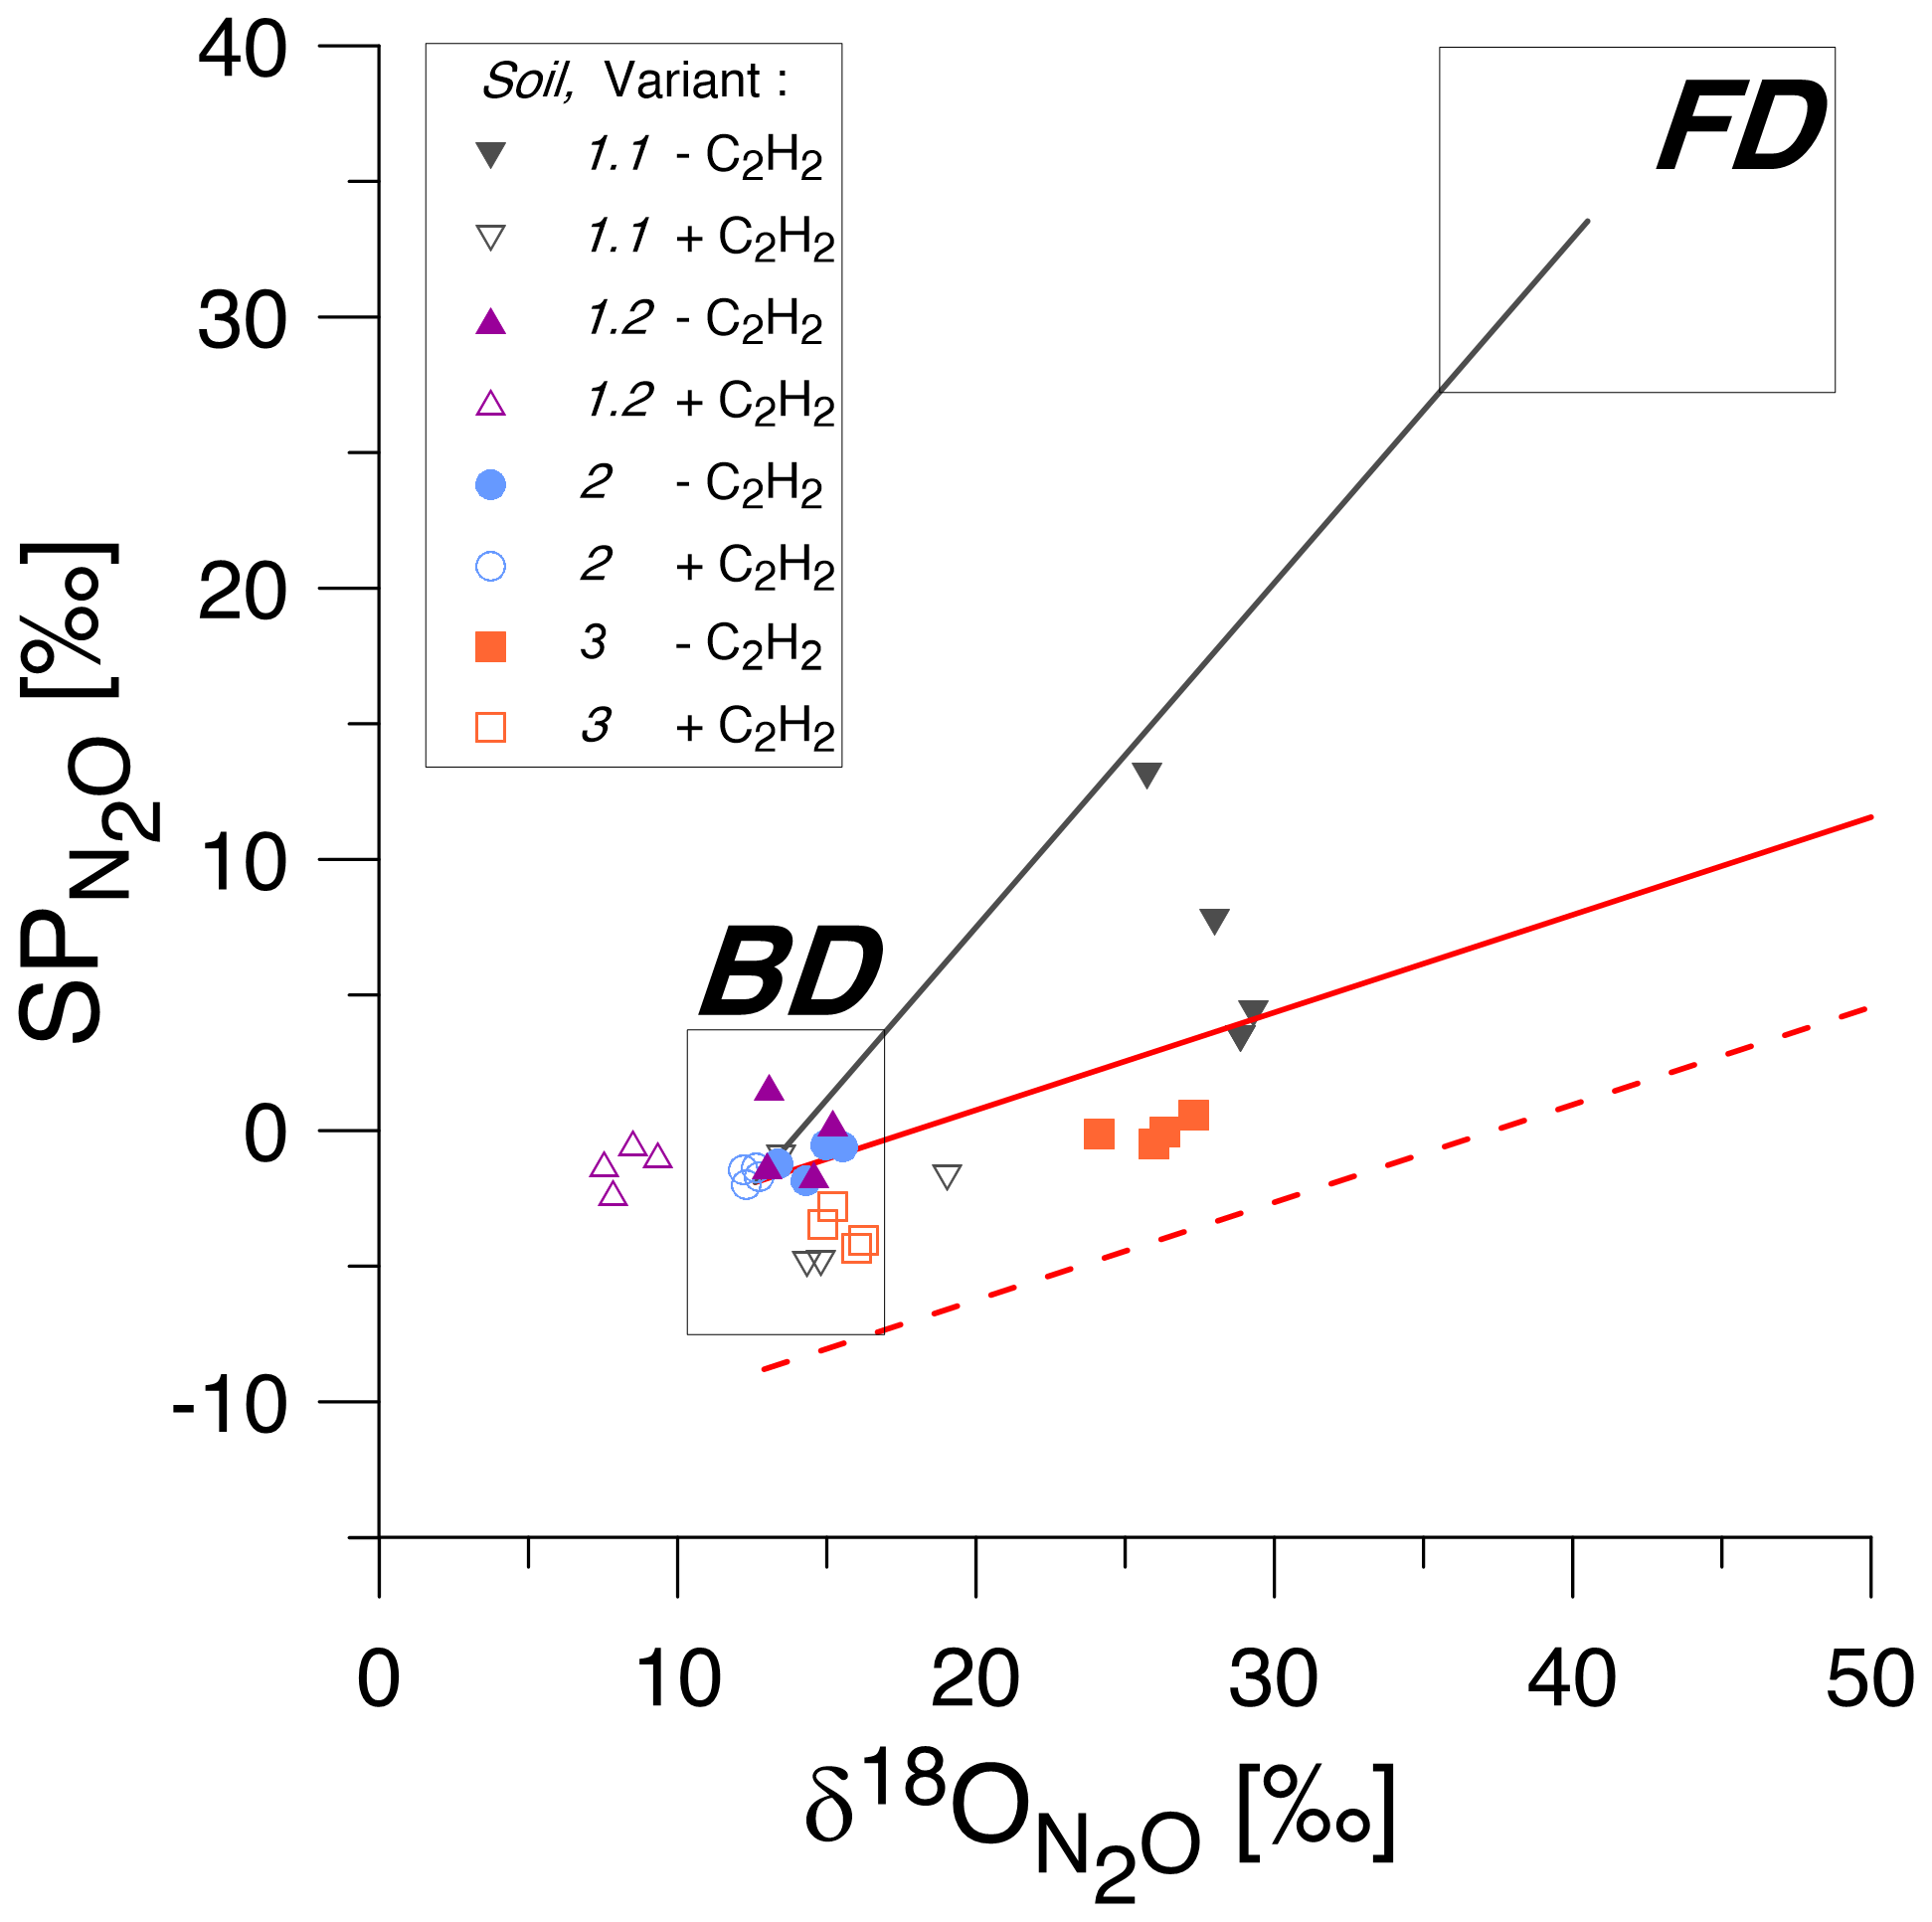
Figure 3SP/δ18O isotope mapping approach (SP/δ18O Map) to estimate the contribution of bacteria or fungi to N2O produced according to Lewicka-Szczebak et al. (2017, 2020). The isotopic values for natural abundance treatments with acetylene addition (+C2H2, empty symbols) and without acetylene addition (−C2H2, corresponding filled symbols) are shown for four soils (1 to 3). The grey rectangles indicate expected ranges of isotopic signatures for heterotrophic bacterial denitrification (BD) and fungal denitrification (FD) (Yu et al., 2020). The solid black line is the mixing line connecting the average expected values for BD and FD, while the solid red line is the mean reduction (for the mean SP values for BD) line and the dashed red line is the minimum reduction line (for the minimal values for BD).
When applying SP/δ18O Map, we can assess the plausibility of the determined fFD values based on the values obtained from the fitting ( value in Table 4) and the fitting outcome, i.e. the difference between and rMAP (Diff; see Table 4). The most probable value for our soils can be assumed based on the fact that Braunschweig tap water was used, and the original soil water also represents the isotope characteristics typical of this region, which is about −7.4 ‰ (long-term mean Braunschweig precipitation water; Stumpp et al., 2014). Thus, in the presented application of SP/δ18O Map, values were fitted, and it has to be pointed out that the precision of such calculations can be improved by measuring instead. Depending on the season and evaporative losses, may slightly vary and the most possible range of soil water in our soils may vary from about −11 ‰ to −4 ‰ as observed in other experiments used in our laboratory experiments with similar conditions (Lewicka-Szczebak et al., 2014, 2017; Rohe et al., 2014a, 2017). Taking this into account, we can say that for Soil 1.2, the fungal contribution must be below 2 % because to obtain any larger fFD values, unrealistically small values (of −14.9 ‰) must be fitted (see Table 4). For Soil 2, both the smaller fFD_MAP values of 1 % and the larger ones up to 15 % are possible, since they are associated with very realistic values (of −6.3 and −10.1, respectively) and an identical Diff of 0.04 (Table 4). For Soil 3, the only plausible fitting can be obtained for the smallest SPBD values, which are associated with a value of −5.6 ‰ (Table 4). Although the Diff for this fitting is slightly higher, the other fittings must be rejected due to unrealistic values (of −1.7 ‰ and +3.7 ‰); hence fFD_MAP values must be between 4 % and 9 %. Similarly, for Soil 1.1, the only plausible fitting can be obtained for the smallest SPBD values, which are associated with a value of −6.8 ‰ (Table 4) and indicate fFD_MAP values from 11 % to 20 %. Here this fitting also shows clearly the smallest Diff of only 0.01 (Table 4). However, except for Soil 1.1, where the Diff is smallest for the last fitting, the Diff values for other soils are very similar for different fittings with the largest values in Soil 3. A better fit (showing smaller Diff values) was not possible with any other combination of SPBD and values. Since the precision of (expressed as standard deviation in Table 3) was always ≤ 0.05, this uncertainty in did not reduce the precision of the fitting (compare large ranges of and rMAP values, respectively, in Table 4). The fFD_SP ranged between 0 % and approximately 15 % (Table 5). The results obtained from SP/δ18O Map show fFD_MAP reaching up to 20 %, 2 %, 15 % and 9 % for soils 1.1, 1.2, 2 and 3, respectively (Fig. 3, Tables 4 and 5). Importantly, due to the fitting procedure applied, the estimations of fFD_MAP values are based not only on and values but also on the results obtained in the 15N treatment ( values).
To our knowledge, this was the first attempt to determine values by fungi or bacteria from soil communities using microbial growth inhibitors with a modification of SIRIN and comparing microbial inhibitor and isotopic approaches (IEM and SP/δ18O Map) to estimate fungal contribution to N2O production from denitrification in anoxic incubation. The isotopic approaches revealed that the fungal contribution to N2O production was small (fFD_SP ≤ 15 % or fFD_MAP ≤ 20 %) in the soils tested (Table 5). A dominant contribution of fungi over bacteria was also excluded by the potential maximum fungal denitrification for Soil 1.2, 2 and 3 (fFD_SPpot between 37 % and 40 %, Table 5), even though effects of N2O reduction were not included. The modified SIRIN approach was not successful because large amounts of non-inhibitable N2O production were observed with all four soils (Tables 2 and 3). The fungal fraction producing N2O during denitrification (fFDmi) was only estimated for Soil 2, where significantly smaller N2O production in treatment D was observed compared to that of treatment A and resulted in a range of 19 % to 37 %, which was probably overestimated due to uncertainties resulting from the large N2O production of non-inhibitable sources. While the three approaches coincided in showing dominance of bacterial denitrification, the isotopic approaches yielded small estimates for fFD (≤ 20 %) and thus did not confirm the largest fFDmi of Soil 2. The strict application of the SIRIN method prescribes proof of selectivity of the inhibitors (i.e. streptomycin should not inhibit fungi and cycloheximide should not inhibit bacteria). All SIRIN results obtained with respect to N2O production by the fungal or bacterial fraction were unsatisfactory; thus fungal values could not be assessed, and the overall results led to unsolved questions, which are discussed in the following sections.
4.1 Experimental setup and inhibitor effects
In accordance with other studies, N2O production was analysed after the addition of glucose as substrate (Laughlin and Stevens, 2002; McLain and Martens, 2006; Blagodatskaya et al., 2010; Long et al., 2013). Glucose initiates the growth of active heterotrophic organisms. Since pure cultures have been shown to synthesize enzymes capable of denitrification within 2 to 3 h (USEPA, 1993), pre-incubation of soil under anaerobic conditions is not needed. Thus, when gas sample collection started, organisms should have produced denitrifying enzymes and microbial growth of initially active organisms should have started too. However, in accordance with Anderson and Domsch (1975), the experimental duration should be as short as possible to ensure the CO2 production by initially active organisms only. Thus, short incubation is recommended when conducting a modified SIRIN approach, as the incubation period should cause changes in conditions for microorganisms and initiate growth on the one hand while it should avoid the consumption of inhibitors as C sources on the other.
With incubation time, production rates of CO2 decreased, probably because experimental incubation conditions provoked unfavourable conditions and physiological changes, e.g. due to anaerobic conditions or local substrate depletion (e.g. C supplied as glucose). Decreasing CO2 fluxes might also be explained by CO2 accumulation in pore space as this effect is shown by modelled diffusive fluxes from soil in closed systems (Well et al., 2019).
Previous studies found much larger inhibitor effects (Laughlin and Stevens, 2002; Blagodatskaya et al., 2010; Long et al., 2013; Chen et al., 2014). It is therefore important to discuss considerable differences among the experimental design of the present study compared to that of other studies (e.g. Laughlin and Stevens, 2002; Blagodatskaya et al., 2010).
The conventional practice of SIRIN implies determination of copt(glucose), copt(streptomycin) or copt(cycloheximide) with an ULTRAGAS 3 CO2 analyser (Wösthoff GmbH & Co. KG, Bochum) (Anderson and Domsch, 1973) with continuous gas flow. We used this method to determine optimal concentrations for SIRIN in the pre-experiment and used these concentrations for the modified SIRIN approach as well. This optimization procedure was not used in other studies (Laughlin and Stevens, 2002; Blagodatskaya et al., 2010; Long et al., 2013). We supposed that optimal concentrations for CO2 respiration should work as well for denitrification if both inhibitors inhibit the denitrification process as well. However, although SIRIN has so far been tested with isolated cultures and soils for microbial growth for CO2 production only (Anderson and Domsch, 1973, 1975), information on N2O-producing processes, especially denitrification, is still lacking and should be investigated in further studies. In addition, as presented by Ladan and Jacinthe (2016), the bactericide bronopol and the fungicide captan were more effective inhibitors than streptomycin or cycloheximide and should be included when evaluating inhibition approaches and isotopic end-member approaches.
Previous studies that found much larger inhibitor effects were conducted after pre-incubating the soil with selective inhibitors (Laughlin and Stevens, 2002; Blagodatskaya et al., 2010; Long et al., 2013; Chen et al., 2014). In contrast to that, the experimental design of our incubation setup was without soil pre-incubation with selective inhibitors to minimize disturbance of the soil microbial community. Thus, our approach was in agreement with the original SIRIN method for respiration (Anderson and Domsch, 1973, 1975, 1978). Another study performing similar experiments without pre-incubation with inhibitors did not find effectiveness in the application of both antibiotics during long-term application (up to 48 h) (Ladan and Jacinthe, 2016), although streptomycin and cycloheximide are commonly used to inhibit denitrification of selective groups. Nevertheless, as we expected that pre-incubation with selective inhibitors would induce changes in the F:B ratio of soil, we decided to conduct the modified SIRIN approach without a pre-incubation step. This assumption was supported by findings of Blagodatskaya et al. (2010), where pre-incubation of about 1 to 20 h with cycloheximide resulted in increasing inhibitor efficiency with time, while this was not the case when pre-incubating with streptomycin. This suggests that microbial communities might change after exposition to cycloheximide.
In the present study, even with both growth inhibitors (treatment D), N2O production was large in all experiments, i.e. in most cases not significantly smaller than in treatments A, B or C. Thus, we suppose similar contributions of non-inhibitable organisms and processes in all treatments. Non-inhibitable organisms could be, for example, bacteria or fungi that are not in a growth stage or may be not affected by inhibitors. Recently, Pan et al. (2019) summarized findings of other studies and pointed out that some microorganisms can use inhibitors as growth substrates, that dead organisms may serve as energy sources for others and that interactions of microbial species may change due to non-inhibitable organisms occurring in soil communities. Non-inhibitable organisms could be archaea as well, which are also known to be capable of denitrification (Philippot et al., 2007; Hayatsu et al., 2008). It is known that archaea are not affected by streptomycin or cycloheximide (Seo and DeLaune, 2010). However, effects of archaeal occurrence in soil or secondary effects on fungi or bacteria were not tested in this study. In addition, abiotic N2O production cannot be quantified with the experimental setup but might be contributing to each inhibitor treatment.
In summary, the present experimental setup without pre-incubating soil samples with selective inhibitors was not successful in the complete inhibition of bacterial or fungal denitrifiers. Although pre-incubation with selective inhibitors may lead to more successful inhibition, we do not recommend this due to induced changes in soil communities. For further studies focusing on application of modified SIRIN to determine the fraction of bacterial or fungal N2O derived from denitrification, a method validation also using different inhibitors is recommended.
4.2 Is C2H2 application a suitable and necessary treatment for examining the fungal contribution to N2O production in soil?
In order to determine values without alteration by partial reduction of N2O to N2, C2H2 was used to quantitatively block N2O reduction during denitrification. We found the expected effect of C2H2 application, i.e. larger N2O production rates in variant +C2H2 compared to variant −C2H2. Calculated product ratios varied between 0.5 and 0.95 () in all soils, showing that N2O reduction can have significant effects on measured N2O production and isotopic values.
The calculated was within the same range as in Soil 1.1, 2 and 3 (maximal 9 % difference), indicating effective blockage of N2O reductase in variant +C2H2 in these soils. Only in Soil 1.2, did and differ by about 34 % with larger calculated reduction in the traced variant, which might point to incomplete inhibition by the C2H2 method. Artefacts with C2H2 were found in previous studies, resulting in smaller N2O production rates due to NO oxidation accelerated by C2H2 application in the presence of very small O amounts (Bollmann and Conrad, 1997a, b; Nadeem et al., 2013). Moreover, incomplete C2H2 diffusion into denitrifying aggregates might also lead to incomplete N2O reductase blockage (Groffman et al., 2006). Both potential methodological errors cannot be excluded for Soil 1.2.
For the other three soils (1.1, 2 and 3), it can be supposed that the isotopic signature of N2O of variant +C2H2 showed isotopic signatures of produced N2O without influences of N2O reduction (SPprod). By comparing variants −C2H2 and +C2H2, isotopologue values of all these soils (except values of Soil 2) of variant −C2H2 were significantly larger than those of variant +C2H2. The enrichment of residual N2O in heavy isotopes results from the isotope effect associated with N2O reduction (Jinuntuya-Nortman et al., 2008; Well and Flessa, 2009; Lewicka-Szczebak et al., 2014). This explains why C2H2 application is essential for analysing N2O produced by different microbial groups from soil. This has particular relevance for experiments with modified SIRIN approaches. Although the modified SIRIN approach presented here was not successful, it should be noted that comparable soil incubation experiments without quantifying N2O reduction potentially overestimate fungal denitrification due to the impact of SIRIN inhibitors on N2O reduction.
Of course, N2O fluxes represent net N2O production, i.e. the difference between gross N2O production by the microbial community and N2O reduction, mainly by heterotrophic bacterial denitrifiers (Müller and Clough, 2014). It has been shown that N2O released by microorganisms to air-filled pore space can be partially consumed by denitrifiers before being emitted (Clough et al., 1998). This means that fungal N2O can also be subject to reduction by bacterial denitrifiers. Consequently, successful inhibition of bacterial denitrification by SIRIN would enhance the measured flux of fungal N2O. Until now, this effect has not been considered in SIRIN papers on fungal N2O (e.g. Laughlin and Stevens, 2002; Ladan and Jacinthe, 2016; Chen et al., 2014). This effect can only be evaluated by measuring N2O reduction in all inhibitor treatments. If true, the N2O reduction with bacterial inhibition should be smaller than that of the treatments without inhibition or with fungal inhibition. However, with fungal inhibition, N2O reduction is also assumed to be smaller than without inhibition because N2O produced by fungi is missed for bacterial reduction.
As the product ratio in soil denitrification exhibited the full range from 0 to 1, this effect can be quite relevant and must thus be considered in future studies. Therefore, we recommend estimating the effectiveness of C2H2 in blocking the N2O reductase by performing parallel 15N approaches with and without C2H2 in studies using the modified SIRIN to determine the fraction of bacterial or fungal N2O production.
4.3 values of N2O produced by microbial communities
As discussed above, all N2O fluxes of modified SIRIN treatments of Soil 1.1, 1.2 and 3 were dominated by N2O from non-inhibitable organisms or processes. This made it impossible to calculate values for active bacteria or fungi (modified SIRIN B and C), also with Soil 2, where a relatively large N2O production was observed with treatment D (see Sect. 3.4).
Despite this, the values from +C2H2 variant as well as SPprod values (i.e. reduction-corrected values of −C2H2 variant) of each soil, represented by treatment A of modified SIRIN, indicated predominantly bacteria to be responsible for N2O production during denitrification, assuming that results of values of denitrification by pure bacterial cultures are transferable to bacteria of soil communities contributing to denitrification. Also in many soil incubation studies, values (without reduction effects) within the range of pure cultures of bacterial denitrifiers have been found (Lewicka-Szczebak et al., 2015, 2017; Senbayram et al., 2018). Therefore, there has so far been no unequivocal evidence of fungi contributing to N2O production during denitrification in soils, although here, the isotopic approaches were consistent with a fungal contribution of up to 20 % of N2O production during denitrification.
The values of variant +C2H2 within treatment A are not affected by reduction effects and therefore might give evidence of the microbial community contributing to N2O production (Sutka et al., 2006, 2008; Frame and Casciotti, 2010; Rohe et al., 2014a). However, variations in values of treatments A of variant +C2H2 were very small and do not give clear evidence of any differences in microbial soil communities producing N2O. Lewicka-Szczebak et al. (2014) analysed values of denitrification with blockage of N2O reduction by C2H2 for the same soils as those used in the present study (Soil 1.1 and 1.2 as well as Soil 3) and revealed values between −3.6 ‰ and −2.1 ‰, which is similar to the respective values of the present study from −4.9 ‰ to −0.4 ‰. This reinforces the conclusion that bacteria dominated gross N2O production under anoxic conditions in both studies.
SPprod values (variant −C2H2) differed from values (variant +C2H2), which may result from deviations between the actual fractionation factor that was not estimated in the present study and the used fractionation factor of −6 ‰ adapted from the literature (Yu et al., 2020). If so, we could assume smaller fractionation effects in the present study as decreasing this average fractionation factor would lead to increasing SPprod values, which in turn would result in values more similar to values of variant −C2H2.
4.4 Potential influence of hybrid N2O
When one N atom in N2O originates from labelled and the other one from an unlabelled N source, this results in ap values and 15N enrichment of produced N2O smaller than the respective enrichment of the pool. The 15N enrichment of N2O in Soil 1.1 was about 60 % smaller than the 15N enrichment in soil , leading to the assumption that N2O was produced not only by denitrification. We also calculated ap values of the other three soils (data not shown) which coincided with the 15N enrichment of N2O (Table 3), showing no indication of hybrid N2O. Since ap would not be affected by contributions of unlabelled N2O, we can exclude the possibility that this smaller enrichment could be caused by dilution of enriched N2O from denitrification by N2O production from an unknown N source and thus verify that this was due to formation of hybrid N2O, potentially via co-denitrification (Spott et al., 2011). So far, there has been no study on values of N2O produced by co-denitrification. But since values of the acetylated treatments of Soil 1.1 coincided with the value range of bacterial denitrification and also with values of the other soils, our data give no indication that the values of hybrid N2O, potentially produced during co-denitrification, differed from that of bacterial denitrification. It was, however, remarkable that the maximum potential contribution of fungal denitrification to N2O (fFD_SPpot) was higher for Soil 1.1 compared to that of Soil 1.2 from the winter period. Soil 1.1 was the only soil where fFD_SPpot exceeded 50 %; thus fungi may potentially dominate N2O emissions only in this soil.
4.5 Steps towards quantifying the fungal fraction contributing to N2O production
Due to the inefficiency of the inhibition of microbial N2O production in most cases, calculation of fFDmi contributing to N2O production was possible for Soil 2 only, although even this calculated value included inaccuracies. The isotopic approaches, however, which are independent of modified SIRIN results, yielded similar estimates of fFD for all soils. As recently published (Wu et al., 2019), uncertainty analysis is a complex issue, and large uncertainties in the results from the SP/δ18O Map approach can be assumed when all the possible sources of errors are taken into account. Regarding the presented application of SP/δ18O Map, calculation would be more precise when measuring rather than using the fitted values. Still, the analysis of values can give information about O exchange between water and denitrification intermediates by various microorganisms (Aerssens et al., 1986; Kool et al., 2007; Rohe et al., 2014b, 2017). The range of values in our study for variant +C2H2 (7.5 ‰ to 19.0 ‰) was quite similar to the range found by Lewicka-Szczebak et al. (2014) for the same soils (4.8 ‰ to 16.3 ‰), where almost complete O exchange with soil water was documented. Hence, for this study the O exchange was probably also very high. There were also no remarkable differences in values among treatments within one variant and soil and therefore we assume no differences in O exchange among the treatments. The information on values combined with known values is also valuable information for differentiation between N2O mixing and reduction processes (Lewicka-Szczebak et al., 2017). Due to parallel traced variant experiments, possible values for the particular values of bacterial denitrification mixing end-members could be determined (Table 4). Since the value for the particular geographic region can be assessed based on the known isotopic signatures of meteoric waters (Lewicka-Szczebak et al., 2014, 2017; Stumpp et al., 2014; Buchen et al., 2018), the most plausible ranges of values can be used to indicate the plausible ranges of fFD_MAP values. Here we showed that in the case of missing values but a known product ratio, the SP/δ18O Map can also provide information on N2O production pathway contributions. Comparing the modified SIRIN with the isotopic approaches revealed that the fungal contribution to N2O production was consistently estimated to be smaller (about 28 % in modified SIRIN, ≤ 15 % with IEM, ≤ 20 % with SP/δ18O Map) than the bacterial fraction. This was supported by estimates for maximum potential contribution of fungal denitrification to N2O in variant −C2H2 (fFD_SPpot) for Soil 1.2, 2 and 3. In some soil studies using helium incubations, the SPprod values obtained by correction for the reduction effect on values showed significantly larger values than values of bacterial denitrification (Köster et al., 2013a; Lewicka-Szczebak et al., 2017, 2014; Senbayram et al., 2018, 2020). However, those results were obtained in an experimental setup with ambient oxygen concentration. Short incubations under static conditions as presented here may, however, promote bacterial over fungal growth, which may also be transferable to denitrification activity by both organism groups (Lewicka-Szczebak et al., 2014, 2017). Obviously, based on the estimations from isotopic approaches, soils may largely differ in the microbial community that contributes to N2O from denitrification.
However, all our tested soils seemed to contain a microbial community where fungi have minor contributions to N2O emissions from denitrification compared to bacteria. This may also have been due to the applied experimental setup favouring bacterial denitrification by static and strictly anoxic conditions. Additionally, the use of glucose as substrate in the selected concentration may further promote bacteria compared to fungi (Koranda et al., 2014; Reischke et al., 2014). Senbayram et al. (2018) could show in an incubation experiment with sufficient supply that fungal contribution to denitrification was larger with straw addition compared to a control without straw addition. Thus, experimental conditions need to be carefully set and more information is needed here in order to obtain a good representation of soil conditions in incubation experiments.
The isotopic approaches should be further investigated with soils where fungi are presumed to contribute largely to N2O production (e.g. acid forest soils or litter-amended arable soils) (Senbayram et al., 2018) and using SIRIN with more suitable inhibitors (Ladan and Jacinthe, 2016). The critical question of whether the isotopic signatures of fungal N2O determined in pure culture studies are transferable to natural soil conditions could not be answered with this study due to large uncertainties associated with the results of the SIRIN method. The latter precluded determination of values of N2O from fungal denitrification. Further experiments would be needed with improved selective inhibition to assure that values known from a few pure cultures or soil isolates (Sutka et al., 2008; Rohe et al., 2014a; Maeda et al., 2015) are true for fungal soil communities as well. This could be accompanied by studies mixing various fungal species known to occur in soil or by isolating fungal communities from soil and conducting similar experiments under anoxic conditions with supply of electron acceptors and C sources to investigate denitrification. In such incubations, parallel 15N-tracing experiments should be conducted to assure denitrification is the dominating process for N2O production and quantify the possible contribution of co-denitrification.
Based on the presented results we conclude that the modified SIRIN approach in the form presented here is not appropriate to estimate the contribution of selected communities (bacteria or fungi) to denitrification from soil. The quantification of the fungal fraction of N2O production with modified SIRIN could be performed with one soil only and possibly overestimated the fungal fraction when compared with the results of isotopic approaches. Both isotope approaches (IEM and SP/δ18O Map) revealed similar results of the fungal fraction contributing to denitrification and thus could be recommended as equally suitable for future studies. The present study shows that consideration of N2O reduction for calculation of the fungal fraction is indispensable. It has to be pointed out, however, that the fungal fraction estimate applies only to the soil under the experimental conditions of this study, i.e. anaerobic conditions and with glucose amendment, and not to the investigated soil in general.
Further studies are needed to cross-validate methods, e.g. with improved inhibitor approaches or molecular-based methods. Due to the mentioned difficulties, the values of fungal N2O could not be calculated from the modified SIRIN approach. Several potential artefacts in the modified SIRIN approach should be further investigated, e.g. the effectiveness of inhibitors, changes in microbial community during pre-incubation with inhibitors and effects of bacterial consumption of N2O produced by fungi.
Gas emission and isotopic data are available from the authors on request.
The supplement related to this article is available online at: https://doi.org/10.5194/bg-18-4629-2021-supplement.
HF, NWM, RW and THA designed the experiment. LR carried out the experiment at the Thünen Institute of Climate-Smart Agriculture in Braunschweig. AG, DLS and RW helped with isotopic analysis, and DLS performed the δ18O/SP mapping. LR, RW and DLS prepared the manuscript with contributions from all co-authors.
The authors declare that they have no conflict of interest.
Publisher's note: Copernicus Publications remains neutral with regard to jurisdictional claims in published maps and institutional affiliations.
Many thanks are due to Jens Dyckmans for 15N analysis and to Martina Heuer for N2O isotopic analyses. This joint research project was financially supported by the state of Lower Saxony and the Volkswagen Foundation, Hanover, Germany. Further financial support was provided by the German Research Foundation (grant LE 3367/1-1 to Dominika Lewicka-Szczebak, grant WE 1904/8-1 to Lena Rohe and Reinhard Well, and the research unit 2337 – Denitrification in Agricultural Soils: Integrated Control and Modelling at Various Scales (DASIM) – grants WE 1904/10-1 to Reinhard Well and WR 211/1-2 to Nicole Wrage-Mönnig).
This research has been supported by the Volkswagen Foundation (grant no. 11-76251-99-27/09 (ZN 2552)) and the Deutsche Forschungsgemeinschaft through grants LE 3367/1-1 and WE 1904/8-1 as well as through the research unit DFG-FOR 2337: Denitrification in Agricultural Soils: Integrated Control and Modelling at Various Scales (DASIM) (grant nos. WE 1904/10-1 and WR 211/1-2).
The article processing charges for this open-access publication were covered by the Helmholtz Centre for Environmental Research – UFZ.
This paper was edited by Nicolas Brüggemann and reviewed by Eliza Harris and two anonymous referees.
Aerssens, E., Tiedje, J. M., and Averill, B. A.: Isotope labeling studies on the mechanisms of N-bond formation in denitrification, J. Biol. Chem., 261, 9652–9656, 1986.
Anderson, J. P. E. and Domsch, K. H.: Quantification of bacterial and fungal contributions to soil respiration, Arch Mikrobiol., 93, 113–127, https://doi.org/10.1007/BF00424942, 1973.
Anderson, J. P. E. and Domsch, K. H.: Measurement of bacterial and fungal contributions to respiration of selected agricultural and forest soil, Can. J. Microbiol., 21, 314–322, https://doi.org/10.1139/m75-045, 1975.
Anderson, J. P. E. and Domsch, K. H.: Physiological method for quantitative measurement of microbial biomass in soils, Soil Biol. Biochem., 10, 215–221, https://doi.org/10.1016/0038-0717(78)90099-8, 1978.
Bergsma, T. T., Ostrom, N. E., Emmons, M., and Robertson, G. P.: Measuring simultaneous fluxes from soil of N2O and N2 in the field using the 15N-Gas “nonequilihrium” technique, Environ. Sci. Technol., 35, 4307–4312, https://doi.org/10.1021/es010885u, 2001.
Blagodatskaya, E. V. and Anderson, T.-H.: Interactive effects of pH and substrate quality on the fungal-to-bacterial ratio and qCO2 of microbial communities in forest soils, Soil Biol. Biochem., 30, 1269–1274, https://doi.org/10.1016/S0038-0717(98)00050-9, 1998.
Blagodatskaya, E., Dannenmann, M., Gasche, R., and Butterbach-Bahl, K.: Microclimate and forest management alter fungal-to-bacterial ratio and N2O-emission during rewetting in the forest floor and mineral soil of mountainous beech forests, Biogeochemistry, 97, 55–70, https://doi.org/10.1007/s10533-009-9310-3, 2010.
Bollag, J. M. and Tung, G.: Nitrous oxide release by soil fungi, Soil Biol. Biochem., 4, 271–276, https://doi.org/10.1016/0038-0717(72)90021-1, 1972.
Bollmann, A. and Conrad, R.: Enhancement by acetylene of the decomposition of nitric oxide in soil, Soil Biol. Biochem., 29, 1057–1066, 1997a.
Bollmann, A. and Conrad, R.: Acetylene blockage technique leads to underestimation of denitrification rates in oxic soils due to scavenging of intermediate nitric oxide, Soil Biol. Biochem., 29, 1067–1077, 1997b.
Braker, G. and Conrad, R.: Diversity, structure, and size of N2O-producing microbial communities in soils–what matters for their functioning?, Adv. Appl. Microbiol., 33–70, 2011.
Brand, W. A.: Precon: A fully automated interface for the pre-GC concentration of trace gases in air for isotopic analysis, Isot. Environ. Healt. S., 31, 277–284, https://doi.org/10.1080/10256019508036271, 1995.
Bremner, J.: Sources of nitrous oxide in soils, Nutr. Cycl. Agroecosys., 49, 7–16, https://doi.org/10.1023/A:1009798022569, 1997.
Buchen, C., Lewicka-Szczebak, D., Flessa, H., and Well, R.: Estimating N2O processes during grassland renewal and grassland conversion to maize cropping using N2O isotopocules, Rapid Commun. Mass Sp., 32, 1053–1067, https://doi.org/10.1002/rcm.8132, 2018.
Casciotti, K. L., Sigman, D. M., Hastings, M. G., Böhlke, J. K., and Hilkert, A.: Measurement of the oxygen isotopic composition of nitrate in seawater and freshwater using the denitrifier method, Anal. Chem., 74, 4905–4912, https://doi.org/10.1021/ac020113w, 2002.
Chen, H., Mothapo, N. V., and Shi, W.: The significant contribution of fungi to soil N2O production across diverse ecosystems, Appl. Soil Ecol., 73, 70–77, https://doi.org/10.1016/j.apsoil.2013.08.011, 2014.
Chen, H. H., Mothapo, N. V., and Shi, W.: Soil Moisture and pH Control Relative Contributions of Fungi and Bacteria to N2O Production, Microb. Ecol., 69, 180–191, https://doi.org/10.1007/s00248-014-0488-0, 2015.
Clough, T. J., Jarvis, S. C., Dixon, E. R., Stevens, R. J., Laughlin, R. J., and Hatch, D. J.: Carbon induced subsoil denitrification of 15N-labelled nitrate in 1 m deep soil columns, Soil Biol. Biochem., 31, 31–41, https://doi.org/10.1016/S0038-0717(98)00097-2, 1998.
Crenshaw, C. L., Lauber, C., Sinsabaugh, R. L., and Stavely, L. K.: Fungal control of nitrous oxide production in semiarid grassland, Biogeochemistry, 87, 17–27, https://doi.org/10.1007/s10533-007-9165-4, 2008.
Crutzen, P. J.: The influence of nitrogen oxides on the atmospheric ozone content, Q. J. Roy. Meteor. Soc., 96, 320–325, https://doi.org/10.1002/qj.49709640815, 1970.
Decock, C. and Six, J.: How reliable is the intramolecular distribution of 15N in N2O to source partition N2O emitted from soil?, Soil Biol. Biochem., 65, 114–127, https://doi.org/10.1016/j.soilbio.2013.05.012, 2013.
Firestone, M. K. and Davidson, E. A.: Microbiological Basis of NO and N2O Production and Consumption in Soils, in: Exchange of Trace Gases between Terrestrial Ecosystems and the Atmosphere, edited by: Andreae, M. O. and Schimel, D. S., John Willey and Sons, New York, 7–21, 1989.
Frame, C. H. and Casciotti, K. L.: Biogeochemical controls and isotopic signatures of nitrous oxide production by a marine ammonia-oxidizing bacterium, Biogeosciences, 7, 2695–2709, https://doi.org/10.5194/bg-7-2695-2010, 2010.
Garber, E. A. and Hollocher, T. C.: 15N, 18O tracer studies on the activation of nitrite by denitrifying bacteria. Nitrite/water-oxygen exchange and nitrosation reactions as indicators of electrophilic catalysis, J. Biol. Chem., 257, 8091–8097, https://doi.org/10.1007/BF00399539, 1982.
Groffman, P. M., Altabet, M. A., Bohlke, J. K., Butterbach-Bahl, K., David, M. B., Firestone, M. K., Giblin, A. E., Kana, T. M., Nielsen, L. P., and Voytek, M. A.: Methods for measuring denitrification: Diverse approaches to a difficult problem, Ecol. Appl., 16, 2091–2122, 2006.
Hayatsu, M., Tago, K., and Saito, M.: Various players in the nitrogen cycle: Diversity and functions of the microorganisms involved in nitrification and denitrification, Soil Sci. Plant Nutr., 54, 33–45, https://doi.org/10.1111/j.1747-0765.2007.00195.x, 2008.
Higgins, S. A., Schadt, C. W., Matheny, P. B., and Löffler, F. E.: Phylogenomics reveal the dynamic evolution of fungal nitric oxide reductases and their relationship to secondary metabolism, Genome Biol. Evol., 10, 2474–2489, https://doi.org/10.1093/gbe/evy187, 2018.
IPCC: Climate Change 2013: The Physical Science Basis. Contribution of Working Group I to the Fifth Assessment Report of the Intergovernmental Panel on Climate Change, Cambridge, UK and New York, NY, USA, 1535 pp., 2013.
Jinuntuya-Nortman, M., Sutka, R. L., Ostrom, P. H., Gandhi, H., and Ostrom, N. E.: Isotopologue fractionation during microbial reduction of N2O within soil mesocosms as a function of water-filled pore space, Soil Biol. Biochem., 40, 2273–2280, https://doi.org/10.1016/j.soilbio.2008.05.016, 2008.
Keuschnig, C., Gorfer, M., Li, G., Mania, D., Frostegård, Å., Bakken, L., and Larose, C.: NO and N2O transformations of diverse fungi in hypoxia: evidence for anaerobic respiration only in Fusarium strains, Environ. Microbiol., 22, 2182–2195, https://doi.org/10.1111/1462-2920.14980, 2020.
Knowles, R.: Denitrification, Microbiol. Rev., 46, 43–70, 1982.
Kool, D. M., Wrage, N., Oenema, O., Dolfing, J., and Van Groenigen, J. W.: Oxygen exchange between (de)nitrification intermediates and H2O and its implications for source determination of and N2O: a review, Rapid Commun. Mass Sp., 21, 3569–3578, https://doi.org/10.1002/rcm.3249, 2007.
Kool, D. M., Wrage, N., Oenema, O., Harris, D., and Van Groenigen, J. W.: The 18O signature of biogenic nitrous oxide is determined by O exchange with water, Rapid Commun. Mass Sp., 23, 104–108, https://doi.org/10.1002/rcm.3859, 2009.
Koranda, M., Kaiser, C., Fuchslueger, L., Kitzler, B., Sessitsch, A., Zechmeister-Boltenstern, S., and Richter, A.: Fungal and bacterial utilization of organic substrates depends on substrate complexity and N availability, FEMS Microbiol. Ecol., 87, 142–152, https://doi.org/10.1111/1574-6941.12214, 2014.
Köster, J. R., Well, R., Dittert, K., Giesemann, A., Lewicka-Szczebak, D., Muehling, K.-H., Herrmann, A., Lammel, J., and Senbayram, M.: Soil denitrification potential and its influence on N2O reduction and N2O isotopomer ratios, Rapid Commun. Mass Sp., 27, 2363–2373, https://doi.org/10.1002/rcm.6699, 2013a.
Köster, J. R., Well, R., Tuzson, B., Bol, R., Dittert, K., Giesemann, A., Emmenegger, L., Manninen, A., Cárdenas, L., and Mohn, J.: Novel laser spectroscopic technique for continuous analysis of N2O isotopomers – application and intercomparison with isotope ratio mass spectrometry, Rapid Commun. Mass Sp., 27, 216–222, https://doi.org/10.1002/rcm.6434, 2013b.
Ladan, S. and Jacinthe, P.-A.: Evaluation of antibacterial and antifungal compounds for selective inhibition of denitrification in soils, Environ. Sci.-Proc. Imp., 18, 1519–1529, https://doi.org/10.1039/C6EM00456C, 2016.
Laughlin, R. J. and Stevens, R. J.: Evidence for fungal dominance of denitrification and codenitrification in a grassland soil, Soil Sci. Soc. Am. J., 66, 1540–1548, https://doi.org/10.2136/sssaj2002.1540, 2002.
Lewicka-Szczebak, D., Well, R., Giesemann, A., Rohe, L., and Wolf, U.: An enhanced technique for automated determination of 15N signatures of N2, (N2+N2O) and N2O in gas samples, Rapid Commun. Mass Sp., 27, 1548–1558, https://doi.org/10.1002/rcm.6605, 2013.
Lewicka-Szczebak, D., Well, R., Köster, J. R., Fuß, R., Senbayram, M., Dittert, K., and Flessa, H.: Experimental determinations of isotopic fractionation factors associated with N2O production and reduction during denitrification in soils, Geochim. Cosmochim. Ac., 134, 55–73, https://doi.org/10.1016/j.gca.2014.03.010, 2014.
Lewicka-Szczebak, D., Well, R., Bol, R., Gregory, A. S., Matthews, G. P., Misselbrook, T., Whalley, W. R., and Cardenas, L. M.: Isotope fractionation factors controlling isotopocule signatures of soil-emitted N2O produced by denitrification processes of various rates, Rapid Commun. Mass Sp., 29, 269–282, https://doi.org/10.1002/rcm.7102, 2015.
Lewicka-Szczebak, D., Dyckmans, J., Kaiser, J., Marca, A., Augustin, J., and Well, R.: Oxygen isotope fractionation during N2O production by soil denitrification, Biogeosciences, 13, 1129–1144, https://doi.org/10.5194/bg-13-1129-2016, 2016.
Lewicka-Szczebak, D., Augustin, J., Giesemann, A., and Well, R.: Quantifying N2O reduction to N2 based on N2O isotopocules – validation with independent methods (helium incubation and 15N gas flux method), Biogeosciences, 14, 711–732, https://doi.org/10.5194/bg-14-711-2017, 2017.
Lewicka-Szczebak, D., Lewicki, M. P., and Well, R.: N2O isotope approaches for source partitioning of N2O production and estimation of N2O reduction – validation with the 15N gas-flux method in laboratory and field studies, Biogeosciences, 17, 5513–5537, https://doi.org/10.5194/bg-17-5513-2020, 2020.
Long, A., Heitman, J., Tobias, C., Philips, R., and Song, B.: Co-occurring anammox, denitrification, and codenitrification in agricultural soils, Applied and Environ. Microbiol., 79, 168–176, https://doi.org/10.1128/aem.02520-12, 2013.
Maeda, K., Spor, A., Edel-Hermann, V., Heraud, C., Breuil, M.-C., Bizouard, F., Toyoda, S., Yoshida, N., Steinberg, C., and Philippot, L.: N2O production, a widespread trait in fungi, Sci. Rep.-UK, 5, 9697, https://doi.org/10.1038/srep09697, 2015.
McLain, J. E. T. and Martens, D. A.: N2O production by heterotrophic N transformations in a semiarid soil, Appl. Soil Ecol., 32, 253–263, 2006.
Müller, C. and Clough, T. J.: Advances in understanding nitrogen flows and transformations: gaps and research pathways, J. Agr. Sci., 152, S34-S44, https://doi.org/10.1017/s0021859613000610, 2014.
Nadeem, S., Dorsch, P., and Bakken, L. R.: Autoxidation and acetylene-accelerated oxidation of NO in a 2-phase system: Implications for the expression of denitrification in ex situ experiments, Soil Biol. Biochem., 57, 606–614, https://doi.org/10.1016/j.soilbio.2012.10.007, 2013.
Ostrom, N. and Ostrom, P.: The Isotopomers of Nitrous Oxide: Analytical Considerations and Application to Resolution of Microbial Production Pathways, in: Handbook of Environmental Isotope Geochemistry, edited by: Baskaran, M., Advances in Isotope Geochemistry, Springer Berlin Heidelberg, 453–476, 2011.
Ostrom, N. E. and Ostrom, P. H.: Mining the isotopic complexity of nitrous oxide: a review of challenges and opportunities, Biogeochemistry, 132, 359–372, https://doi.org/10.1007/s10533-017-0301-5, 2017.
Ostrom, N. E., Pitt, A., Sutka, R., Ostrom, P. H., Grandy, A. S., Huizinga, K. M., and Robertson, G. P.: Isotopologue effects during N2O reduction in soils and in pure cultures of denitrifiers, J. Geophys. Res.-Biogeo., 112, G02005, https://doi.org/10.1029/2006jg000287, 2007.
Ostrom, N. E., Sutka, R., Ostrom, P. H., Grandy, A. S., Huizinga, K. M., Gandhi, H., von Fischer, J. C., and Robertson, G. P.: Isotopologue data reveal bacterial denitrification as the primary source of N2O during a high flux event following cultivation of a native temperate grassland, Soil Biol. Biochem., 42, 499–506, https://doi.org/10.1016/j.soilbio.2009.12.003, 2010.
Pan, Y. S., Wu, Y. C., Li, X. Z., Zeng, J., and Lin, X. G.: Continuing Impacts of Selective Inhibition on Bacterial and Fungal Communities in an Agricultural Soil, Microb. Ecol., 78, 927–935, https://doi.org/10.1007/s00248-019-01364-0, 2019.
Philippot, L., Hallin, S., and Schloter, M.: Ecology of denitrifying prokaryotes in agricultural soil, Adv. Agron., 96, 249–305, 2007.
Popp, B. N., Westley, M. B., Toyoda, S., Miwa, T., Dore, J. E., Yoshida, N., Rust, T. M., Sansone, F. J., Russ, M. E., Ostrom, N. E., and Ostrom, P. H.: Nitrogen and oxygen isotopomeric constraints on the origins and sea-to-air flux of N2O in the oligotrophic subtropical North Pacific gyre, Global Biogeochem. Cy., 16, 1064, https://doi.org/10.1029/2001gb001806, 2002.
R Core Team: R: A Language and Environment for Statistical Computing, R Foundation for Statistical Computing, Vienna, available at: https://www.R-project.org/ (last access: 11 May 2021), 2013.
Reischke, S., Rousk, J., and Bååth, E.: The effects of glucose loading rates on bacterial and fungal growth in soil, Soil Biol. Biochem., 70, 88–95, https://doi.org/10.1016/j.soilbio.2013.12.011, 2014.
Rohe, L., Anderson, T.-H., Braker, G., Flessa, H., Giesemann, A., Lewicka-Szczebak, D., Wrage-Mönnig, N., and Well, R.: Dual isotope and isotopomer signatures of nitrous oxide from fungal denitrification – a pure culture study, Rapid Commun. Mass Sp., 28, 1893–1903, https://doi.org/10.1002/rcm.6975, 2014a.
Rohe, L., Anderson, T.-H., Braker, G., Flessa, H., Giesemann, A., Wrage-Mönnig, N., and Well, R.: Fungal oxygen exchange between denitrification intermediates and water, Rapid Commun. Mass Sp., 28, 377–384, https://doi.org/10.1002/rcm.6790, 2014b.
Rohe, L., Well, R., and Lewicka-Szczebak, D.: Use of oxygen isotopes to differentiate between nitrous oxide produced by fungi or bacteria during denitrification, Rapid Commun. Mass Sp., 31, 1297–1312, https://doi.org/10.1002/rcm.7909, 2017.
Ruzicka, S., Edgerton, D., Norman, M., and Hill, T.: The utility of ergosterol as a bioindicator of fungi in temperate soils, Soil Biol. Biochem., 32, 989–1005, https://doi.org/10.1016/S0038-0717(00)00009-2, 2000.
Senbayram, M., Well, R., Bol, R., Chadwick, D. R., Jones, D. L., and Wu, D.: Interaction of straw amendment and soil content controls fungal denitrification and denitrification product stoichiometry in a sandy soil, Soil Biol. Biochem., 126, 204–212, https://doi.org/10.1016/j.soilbio.2018.09.005, 2018.
Senbayram, M., Well, R., Shan, J., Bol, R., Burkart, S., Jones, D. L., and Wu, D.: Rhizosphere processes in nitrate-rich barley soil tripled both N2O and N2 losses due to enhanced bacterial and fungal denitrification, Plant Soil, 448, 509–522, https://doi.org/10.1007/s11104-020-04457-9, 2020.
Seo, D. C. and DeLaune, R. D.: Fungal and bacterial mediated denitrification in wetlands: Influence of sediment redox condition, Water Res., 44, 2441–2450, https://doi.org/10.1016/j.watres.2010.01.006, 2010.
Shoun, H., Kim, D.-H., Uchiyama, H., and Sugiyama, J.: Denitrification by fungi, FEMS Microbiol. Lett., 94, 277–281, 1992.
Shoun, H., Fushinobu, S., Jiang, L., Kim, S. W., and Wakagi, T.: Fungal denitrification and nitric oxide reductase cytochrome P450nor, Philos. Trans. R. Soc. Lond. B. Biol. Sci., 367, 1186–1194, https://doi.org/10.1098/rstb.2011.0335, 2012.
Snider, D. M., Schiff, S. L., and Spoelstra, J.: and stable isotope ratios of nitrous oxide produced during denitrification in temperate forest soils, Geochim. Cosmochim. Ac., 73, 877–888, https://doi.org/10.1016/j.gca.2008.11.004, 2009.
Spott, O., Russow, R., Apelt, B., and Stange, C. F.: A 15N-aided artificial atmosphere gas flow technique for online determination of soil N2 release using the zeolite Köstrolith SX6®, Rapid Commun. Mass Sp., 20, 3267–3274, https://doi.org/10.1002/rcm.2722, 2006.
Spott, O., Russow, R., and Stange, C. F.: Formation of hybrid N2O and hybrid N2 due to codenitrification: First review of a barely considered process of microbially mediated N-nitrosation, Soil Biol. Biochem., 43, 1995–2011, https://doi.org/10.1016/j.soilbio.2011.06.014, 2011.
Stumpp, C., Klaus, J., and Stichler, W.: Analysis of long-term stable isotopic composition in German precipitation, J. Hydrol., 517, 351–361, https://doi.org/10.1016/j.jhydrol.2014.05.034, 2014.
Sutka, R. L., Ostrom, N. E., Ostrom, P. H., Breznak, J. A., Gandhi, H., Pitt, A. J., and Li, F.: Distinguishing nitrous oxide production from nitrification and denitrification on the basis of isotopomer abundances, Appl. Environ. Microb., 72, 638–644, https://doi.org/10.1128/aem.72.1.638-644.2006, 2006.
Sutka, R. L., Adams, G. C., Ostrom, N. E., and Ostrom, P. H.: Isotopologue fractionation during N2O production by fungal denitrification, Rapid Commun. Mass Sp., 22, 3989–3996, https://doi.org/10.1002/rcm.3820, 2008.
Tanimoto, T., Hatano, K., Kim, D. H., Uchiyama, H., and Shoun, H.: Co-denitrification by the denitrifying system of fungus Fusarium oxysporum, FEMS Microbiol. Lett., 93, 177–180, 1992.
Toyoda, S. and Yoshida, N.: Determination of nitrogen isotopomers of nitrous oxide on a modified isotope ratio mass spectrometer, Anal. Chem., 71, 4711–4718, https://doi.org/10.1021/ac9904563, 1999.
Toyoda, S., Mutobe, H., Yamagishi, H., Yoshida, N., and Tanji, Y.: Fractionation of N2O isotopomers during production by denitrifier, Soil Biol. Biochem., 37, 1535–1545, https://doi.org/10.1016/j.soilbio.2005.01.009, 2005.
Toyoda, S., Yano, M., Nishimura, S.-i., Akiyama, H., Hayakawa, A., Koba, K., Sudo, S., Yagi, K., Makabe, A., Tobari, Y., Ogawa, N. O., Ohkouchi, N., Yamada, K., and Yoshida, N.: Characterization and production and consumption processes of N2O emitted from temperate agricultural soils determined via isotopomer ratio analysis, Global Biogeochem. Cy., 25, GB2008, https://doi.org/10.1029/2009gb003769, 2011.
USEPA: Manuel: Nitrogen Control, Office of Water, Washington, D.C., EPA/625/R-93 /010, 1993.
Well, R. and Flessa, H.: Isotopologue signatures of N2O produced by denitrification in soils, J. Geophys. Res.-Biogeo., 114, G02020, https://doi.org/10.1029/2008jg000804, 2009.
Well, R., Becker, K.-W., Meyer, B., Langel, R., and Reineking, A.: Continuous flow equilibration for mass spectrometric analysis of dinitrogen emissions, Soil Sci. Soc. Am. J., 62, 906–910, https://doi.org/10.2136/sssaj1998.03615995006200040008x, 1998.
Well, R., Kurganova, I., de Gerenyu, V. L., and Flessa, H.: Isotopomer signatures of soil-emitted N2O under different moisture conditions – A microcosm study with arable loess soil, Soil Biol. Biochem., 38, 2923–2933, https://doi.org/10.1016/j.soilbio.2006.05.003, 2006.
Well, R., Burkart, S., Giesemann, A., Grosz, B., Köster, J. R., and Lewicka-Szczebak, D.: Improvement of the 15N gas flux method for in situ measurement of soil denitrification and its product stoichiometry, Rapid Commun. Mass Sp., 33, 437–448, https://doi.org/10.1002/rcm.8363, 2019.
Wrage, N., Velthof, G. L., Laanbroek, H. J., and Oenema, O.: Nitrous oxide production in grassland soils: assessing the contribution of nitrifier denitrification, Soil Biol. Biochem., 36, 229–236, https://doi.org/10.1016/j.soilbio.2003.09.009, 2004a.
Wrage, N., Velthof, G. L., Oenema, O., and Laanbroek, H. J.: Acetylene and oxygen as inhibitors of nitrous oxide production in Nitrosomonas europaea and Nitrosospira briensis: a cautionary tale, FEMS Microbiol. Ecol., 47, 13–18, https://doi.org/10.1016/s0168-6496(03)00220-4, 2004b.
Wrage-Mönnig, N., Horn, M. A., Well, R., Müller, C., Velthof, G., and Oenema, O.: The role of nitrifier denitrification in the production of nitrous oxide revisited, Soil Biol. Biochem., 123, A3–A16, https://doi.org/10.1016/j.soilbio.2018.03.020, 2018.
Wu, D., Well, R., Cárdenas, L. M., Fuß, R., Lewicka-Szczebak, D., Köster, J. R., Brüggemann, N., and Bol, R.: Quantifying N2O reduction to N2 during denitrification in soils via isotopic mapping approach: Model evaluation and uncertainty analysis, Environ. Res., 179, 108806, https://doi.org/10.1016/j.envres.2019.108806, 2019.
Yoshinari, T. and Knowles, R.: Acetylene inhibition of nitrous-oxide reduction by denitrifying bacteria, Biochem. Bioph. Res. Co., 69, 705–710, https://doi.org/10.1016/0006-291x(76)90932-3, 1976.
Yu, L., Harris, E., Lewicka-Szczebak, D., Barthel, M., Blomberg, M. R. A., Harris, S. J., Johnson, M. S., Lehmann, M. F., Liisberg, J., Müller, C., Ostrom, N. E., Six, J., Toyoda, S., Yoshida, N., and Mohn, J.: What can we learn from N2O isotope data? - Analytics, processes and modelling, Rapid Commun. Mass Sp., e8858, https://doi.org/10.1002/rcm.8858, 2020.
Zou, Y., Hirono, Y., Yanai, Y., Hattori, S., Toyoda, S., and Yoshida, N.: Isotopomer analysis of nitrous oxide accumulated in soil cultivated with tea (Camellia sinensis) in Shizuoka, central Japan, Soil Biol. Biochem., 77, 276–291, https://doi.org/10.1016/j.soilbio.2014.06.016, 2014.