the Creative Commons Attribution 4.0 License.
the Creative Commons Attribution 4.0 License.
 | 29 Oct 2021
Fast local warming is the main driver of recent deoxygenation in the northern Arabian Sea
Zouhair Lachkar
Michael Mehari
Muchamad Al Azhar
Marina Lévy
Shafer Smith
The Arabian Sea (AS) hosts one of the most intense oxygen minimum zones (OMZs) in the world. Observations suggest a decline in O2 in the northern AS over the recent decades accompanied by an intensification of the suboxic conditions there. Over the same period, the local sea surface temperature has risen significantly, particularly over the Arabian Gulf (also known as Persian Gulf, hereafter the Gulf), while summer monsoon winds may have intensified. Here, we simulate the evolution of dissolved oxygen in the AS from 1982 through 2010 and explore its controlling factors, with a focus on changing atmospheric conditions. To this end, we use a set of eddy-resolving hindcast simulations forced with winds and heat and freshwater fluxes from an atmospheric reanalysis. We find a significant deoxygenation in the northern AS, with O2 inventories north of 20∘ N dropping by over 6 % per decade between 100 and 1000 m. These changes cause an expansion of the OMZ volume north of 20∘ N at a rate of 0.6 % per decade as well as an increase in the volume of suboxia and the rate of denitrification by 14 and 15 % per decade, respectively. We also show that strong interannual and decadal variability modulate dissolved oxygen in the northern AS, with most of the O2 decline taking place in the 1980s and 1990s. Using a set of sensitivity simulations we demonstrate that deoxygenation in the northern AS is essentially caused by reduced ventilation induced by the recent fast warming of the sea surface, including in the Gulf, with a contribution from concomitant summer monsoon wind intensification. This is because, on the one hand, surface warming enhances vertical stratification and increases Gulf water buoyancy, thus inhibiting vertical mixing and ventilation of the thermocline. On the other hand, summer monsoon wind intensification causes a rise in the thermocline depth in the northern AS that lowers O2 levels in the upper ocean. Our findings confirm that the AS OMZ is strongly sensitive to upper-ocean warming and concurrent changes in the Indian monsoon winds. Finally, our results also demonstrate that changes in the local climatic forcing play a key role in regional dissolved oxygen changes and hence need to be properly represented in global models to reduce uncertainties in future projections of deoxygenation.
- Article
(14069 KB) - Full-text XML
-
Supplement
(19830 KB) - BibTeX
- EndNote


Rising ocean temperatures decrease O2 solubility in seawater, increase respiration-driven oxygen consumption and enhance vertical stratification, thus reducing interior ocean ventilation (Oschlies et al., 2018). These changes collectively cause the ocean to lose oxygen as it warms up, a process termed ocean deoxygenation. Observational and modeling evidence suggest that the majority of the observed oxygen decline is caused by changes in ocean ventilation and biogeochemistry (Bindoff et al., 2019). Over the last 5 to 6 decades, the global ocean oxygen content has dropped by 2 % (Ito et al., 2017; Schmidtko et al., 2017), a tendency predicted to accelerate in the future in response to ocean warming. In the upper 1000 m, a growing consensus points towards a loss of O2 of 0.5 %–3.3 % between 1970–2010 (Bindoff et al., 2019). However, the analysis of local time series suggests much stronger trends at particular sites (Whitney et al., 2007; Bograd et al., 2015). Ocean deoxygenation can cause the expansion of naturally occurring low-O2 water bodies known as oxygen minimum zones (OMZs) (Stramma et al., 2008; Breitburg et al., 2018; Bindoff et al., 2019). This can increase the frequency and intensity of hypoxic events, stressing sensitive organisms and causing loss of marine biodiversity and shifts in the food web structure (Rabalais et al., 2002; Vaquer-Sunyer and Duarte, 2008; Laffoley and Baxter, 2019).
The Arabian Sea (AS) hosts one of the world's largest and most extreme OMZs, with suboxia (O2<4 mmol m−3) prevailing across most of the intermediate ocean (from 150 down to 1250 m) in its northern and northeastern parts, turning it into a global hotspot of denitrification (Bange et al., 2005; Codispoti et al., 2001). Because of the challenges associated with data sparsity, the previously documented O2 changes in the AS depict a complex picture with no consistent trends across the entire region (Laffoley and Baxter, 2019; Bindoff et al., 2019). Yet, there is mounting evidence for a decline in O2 concentrations in the northern AS over the last few decades. For example, the global analysis of historical oxygen observations by Ito et al. (2017) reveals a moderate drop in O2 levels in the subsurface of the AS between 1960 and 2010. The analysis of available O2 observations by Schmidtko et al. (2017) similarly indicates a decline in oxygen in the northern and western AS as well as along the west coast of India between 1960 and 2010. In an analysis of over 2000 O2 profiles collected during 53 oceanographic expeditions that took place between 1960 and 2008 off the coast of Oman, Piontkovski and Al-Oufi (2015) documented a decline in O2 in the upper 300 m in the northern and northwestern AS that they attributed to increased thermal stratification and a shoaling of the oxycline between the 1960s and 2000s. Banse et al. (2014) analyzed discrete historical O2 measurements collected in the central and southern AS in the 150–500 m layer between 1959 and 2004. They found no clear systematic trend across the entire AS, although O2 was found to decline in most of the central AS and slightly increase in the southern AS (between 8–12∘ N). Because of the sparsity of observations, these trends were generally based on a small number of samples and not always statistically significant. Authors in this study also analyzed trends in subsurface nitrite (NO) concentrations, typically used as a proxy for the presence of suboxia and denitrification at depth. They found both positive and negative trends in different locations, with a larger number of profiles indicating an increase in nitrite concentrations over time, suggesting an overall intensification of the OMZ over the study period. do Rosário Gomes et al. (2014) reported a radical shift in the winter-bloom-dominant phytoplankton species from diatoms to large dinoflagellate, Noctiluca scintillans, which they linked to a decline in O2 concentrations in the region. More recently, using sea glider data and historical observations, Queste et al. (2018) showed an intensification of the suboxic conditions at depth in the Gulf of Oman over the last 3 decades. Although there has been little work done on documenting potential deoxygenation in the Arabian marginal seas (i.e., the Red Sea and the Gulf), preliminary observations suggest ongoing deoxygenation in the Gulf with recent emergence of summertime hypoxia documented there (Al-Ansari et al., 2015; Al-Yamani and Naqvi, 2019).
In addition to changes in O2, the AS has undergone major environmental changes over the recent decades that may intensify in the future. In particular, the AS has experienced a strong warming throughout most of the 20th century that has accelerated since the early 1990s (Kumar et al., 2009; Gopika et al., 2020). The warming has been particularly fast in the two Arabian marginal seas (i.e., the Red Sea and the Gulf) over the last 3 decades, with warming rates reaching up to 0.17 ± 0.07 and 0.6 ± 0.3 ∘C per decade in the two semi-enclosed seas, respectively (Chaidez et al., 2017; Strong et al., 2011; Al-Rashidi et al., 2009). The AS warming has been linked to important physical and biogeochemical changes. For instance, using satellite observations and a set of historical simulations of the northern Indian Ocean, Roxy et al. (2016) found a drop in summer productivity of up to 20 % between 1950 and 2005 in the western AS that they linked to surface warming and increased stratification. Goes et al. (2020) reported an increase in winter stratification associated with a weakening of winter convective mixing in the northern AS. These authors also presented observational evidence of a strong loss of inorganic nitrogen in the AS over the recent decades that they linked to enhanced denitrification driven by OMZ intensification. These changes have been suggested to favor winter blooms of the mixotroph Noctiluca scintillans at the expense of diatoms (Goes et al., 2020). The Gulf warming has also been associated with important ecological and biogeochemical changes such as recent frequent mass coral bleaching events (Burt et al., 2019) as well as a potential reduction in the ventilation of the AS OMZ (Lachkar et al., 2019). Finally, important changes in the summer monsoon winds have also been reported. For instance, Sandeep and Ajayamohan (2015) described a poleward shift in the monsoon low-level jet stream over the recent decades that is expected to intensify in the future. This would lead to an intensification (weakening) of summer monsoon winds off the coast of Oman (Somalia). Praveen et al. (2016) suggested that the Oman coast is to experience a future increase in summer upwelling accompanied by an enhancement of summer productivity, whereas deCastro et al. (2016) predicted a future strengthening of the Somali coastal upwelling based on an ensemble of global and regional model simulations for the 21st century. Yet, other studies reported a decline in the intensity of summer monsoon winds. For instance, Swapna et al. (2017) suggested a weakening of the summer monsoon circulation over the recent decades. The analysis of a selected set of CMIP5 models by Sooraj et al. (2015) also suggests a future weakening of the Asian summer monsoon circulation south of 10∘ N. However, this study also projects an intensification of the summer monsoon circulation north of 10∘ N associated with a northward shift in the monsoon circulation in agreement with previous CMIP5 model analyses.
While these environmental perturbations may have contributed to the observed O2 decline in the northern AS, their potential interactions and the mechanisms through which they act to modulate O2 remain poorly understood. In particular, the respective roles of recent surface warming on the one hand and summer monsoon wind intensification on the other hand are yet to be quantified. Moreover, the potential contribution of the recent fast warming of the Gulf to the declining O2 levels in the northern AS has not yet been investigated. Here we reconstruct the trends in O2 over the period between 1982 and 2010 using a high-resolution hindcast simulation of the Indian Ocean and examine their physical and biogeochemical drivers using a set of sensitivity experiments. We show that recent deoxygenation in the northern AS has been caused essentially by surface warming, with a significant contribution from the Gulf warming, bringing about a reduction in the ventilation of the subsurface and intermediate layers. We also show that summer monsoon intensification enhanced oxygenation of the upper ocean south of 20∘ N but has contributed to deoxygenation in the northern AS. These changes are likely to have important ecological and biogeochemical consequences.
2.1 Models
The circulation model is the Regional Ocean Modeling System (ROMS)_AGRIF version (http://www.croco-ocean.org, last access: 1 January 2018) configured for the Indian Ocean. It uses the free-surface, hydrostatic, primitive equations in a rotating environment and has a terrain-following vertical coordinate system (Shchepetkin and McWilliams, 2005). To limit diapycnal mixing errors, the diffusive component of the rotated, split, upstream-biased, third-order (RSUP3) tracer advection scheme is rotated along geopotential surfaces (Marchesiello et al., 2009). The non-local K-profile parameterization (KPP) scheme is used to parametrize subgrid vertical mixing (Large et al., 1994). The model domain covers the full Indian Ocean from 31∘ S to 31∘ N and 30 to 120∘ E with a ∘ horizontal resolution and 32σ coordinate vertical layers with enhanced resolution near the surface. The biogeochemical model is a nitrogen-based nutrient–phytoplankton–zooplankton–detritus (NPZD) model (Gruber et al., 2006). It is based on a system of ordinary differential equations representing the time evolution of seven state variables: two nutrients (nitrate and ammonium), one phytoplankton class, one zooplankton class, two classes of detritus (small and large sizes) and a dynamic chlorophyll-to-carbon ratio. The model has a module describing the cycling of oxygen as well as a parameterization of water column and benthic denitrification (Lachkar et al., 2016).
2.2 Experimental design
The hindcast simulation is forced with ECMWF ERA-Interim 6-hourly heat fluxes, air temperature, pressure, humidity, precipitation and winds over the period from January 1982 to December 2010. Sea surface temperature (SST) is restored to AVHRR Pathfinder and Aqua MODIS observations, and surface salinity is restored to the Simple Ocean Data Assimilation (SODA) reanalysis data using kinematic heat and freshwater flux corrections proposed by Barnier et al. (1995). Initial and lateral boundary conditions for temperature, salinity, currents and sea surface height are computed from the SODA reanalysis (Carton and Giese, 2008). The initial and lateral boundary conditions for nitrate and oxygen are extracted from the World Ocean Atlas (WOA) 2013 (Garcia et al., 2014a, b). Finally, we used a monthly climatological runoff and annual river nutrient discharge from major rivers in the northern Indian Ocean (including the Indus and Narmada rivers flowing into the Arabian Sea) derived from available observations and a global hydrological model (Ramesh et al., 1995; Dai and Trenberth, 2002; Krishna et al., 2016). We restrict our analysis to the AS region extending from 3.5∘ S to 30∘ N in latitude and from 32 to 76∘ E in longitude (Fig. S1, Supplement).
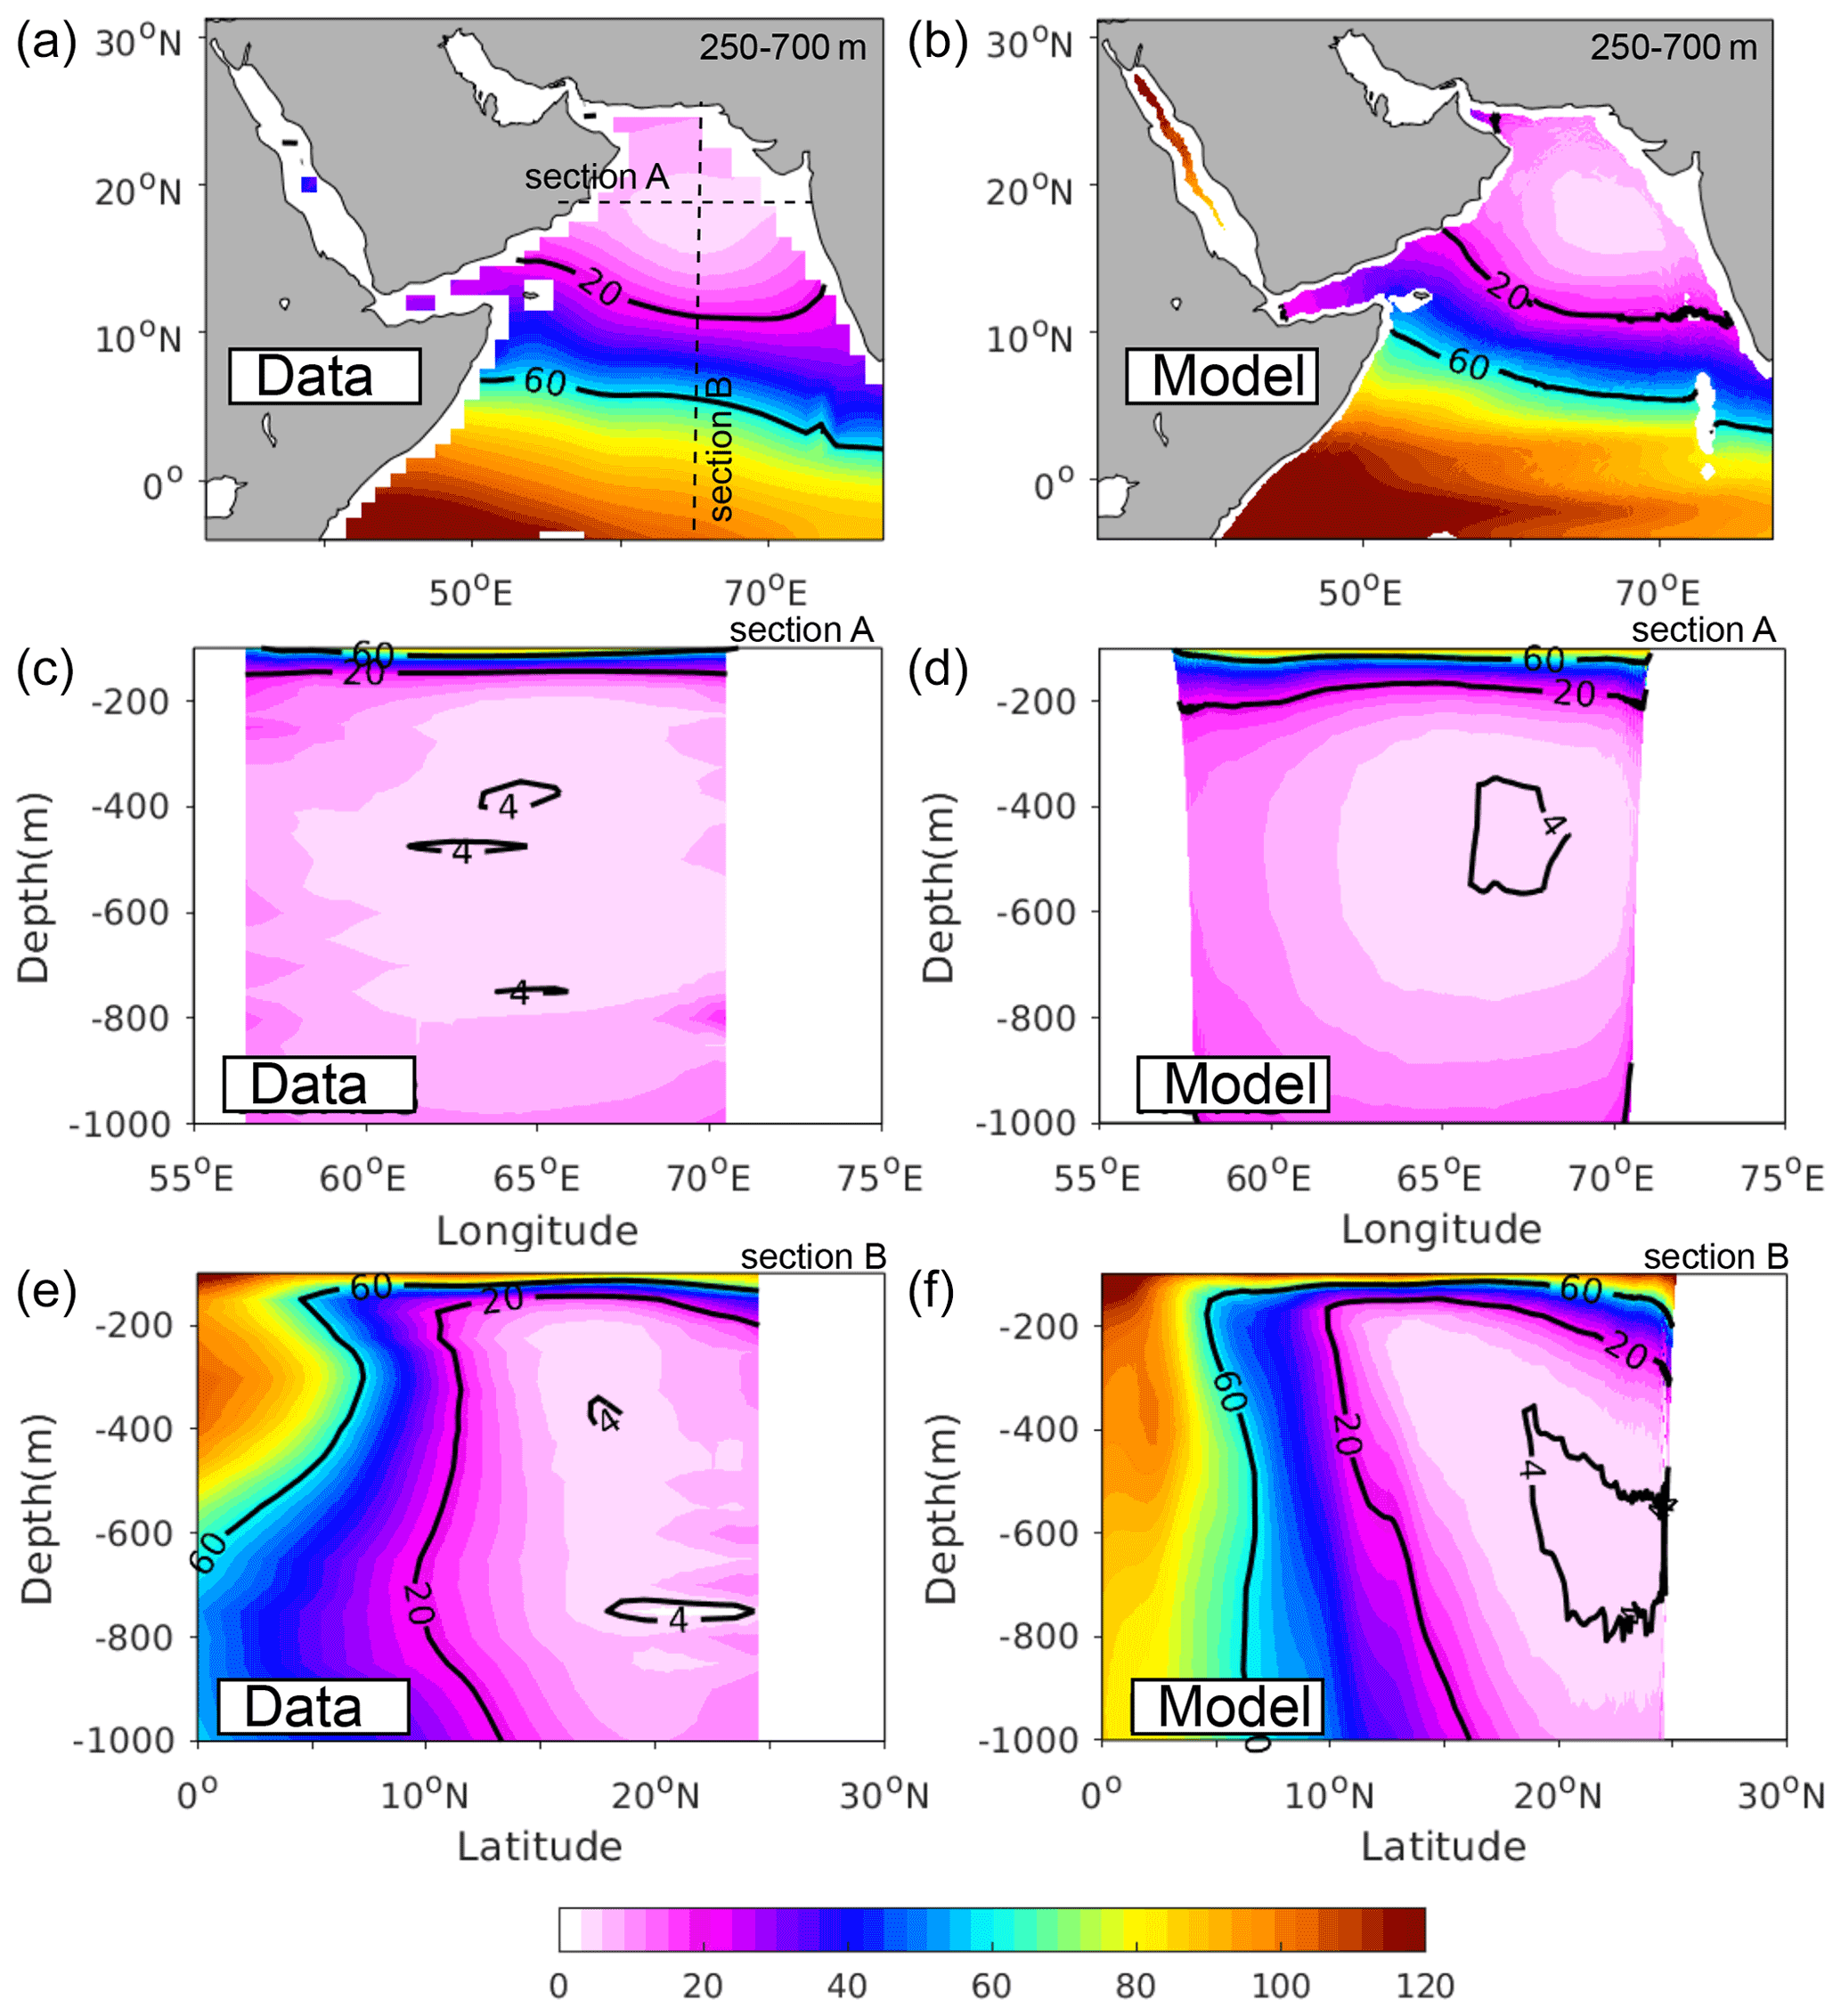
Figure 1Evaluation of simulated oxygen. Annual mean O2 (in mmol m−3) (a, b) averaged between 250 and 700 m and along (c, d) zonal section A at 18∘ N and (e, f) meridional section B at 65∘ E as simulated in the model (a, c, e) and from the WOA-2018 dataset (b, d, f).
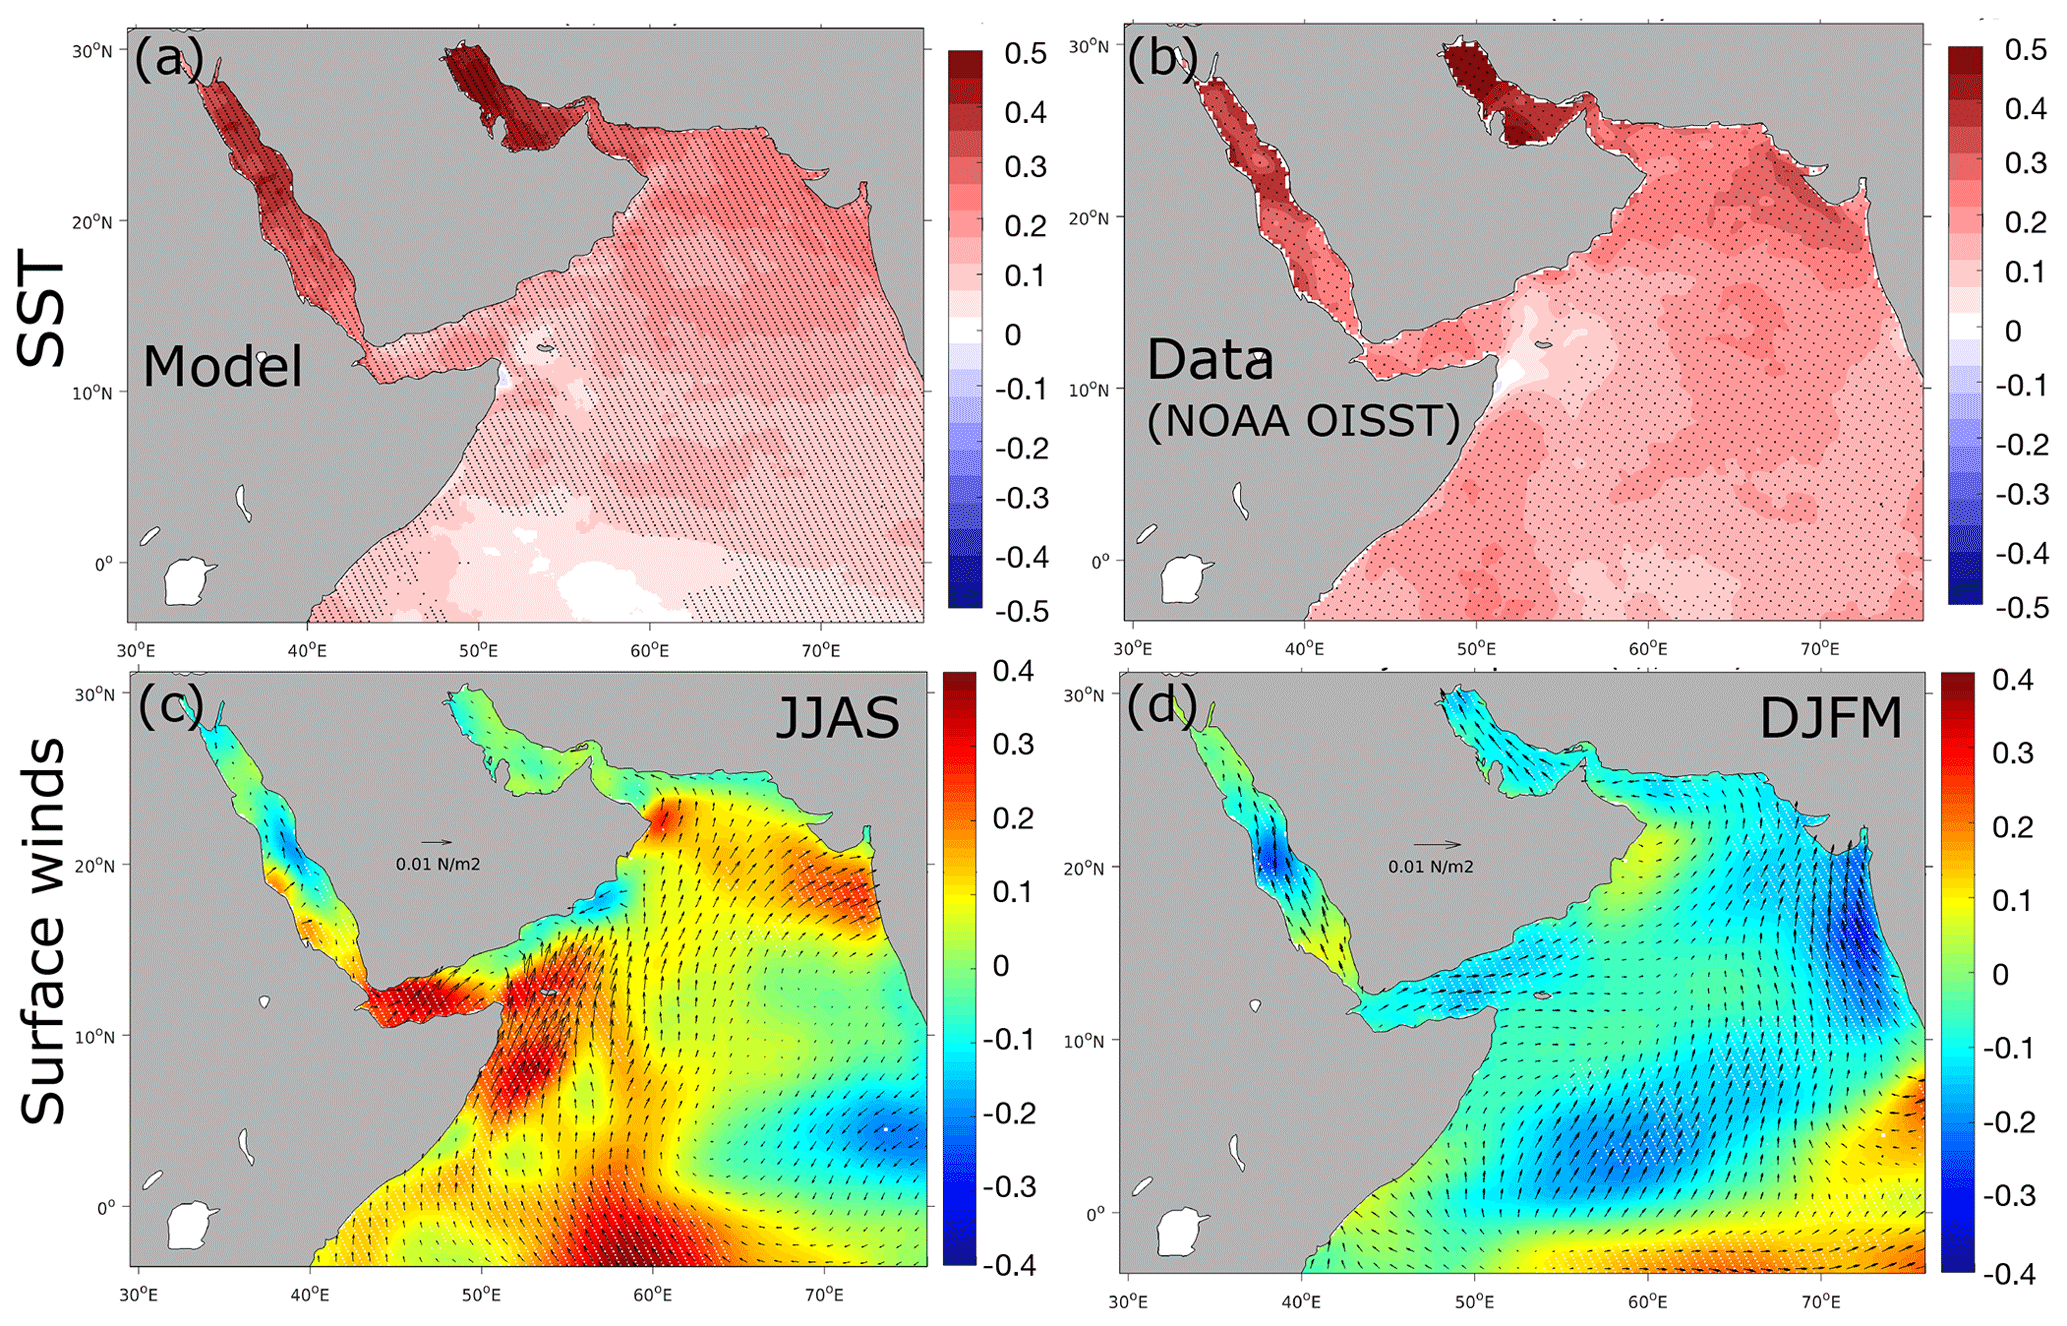
Figure 2Warming and surface wind trends. (a, b) Linear trends in sea surface temperature (in degrees Celsius per decade) as simulated by the model (a) and from the NOAA OISST data product (b). (c, d) Trends in ERA-Interim surface winds in summer (c) and winter (d). Color shading indicates trends in wind speed (in m s−1 per decade), whereas arrows show trends in wind stress vector. Statistically significant trends at the 95 % confidence interval following a Mann–Kendall (MK) test are represented by stippling.
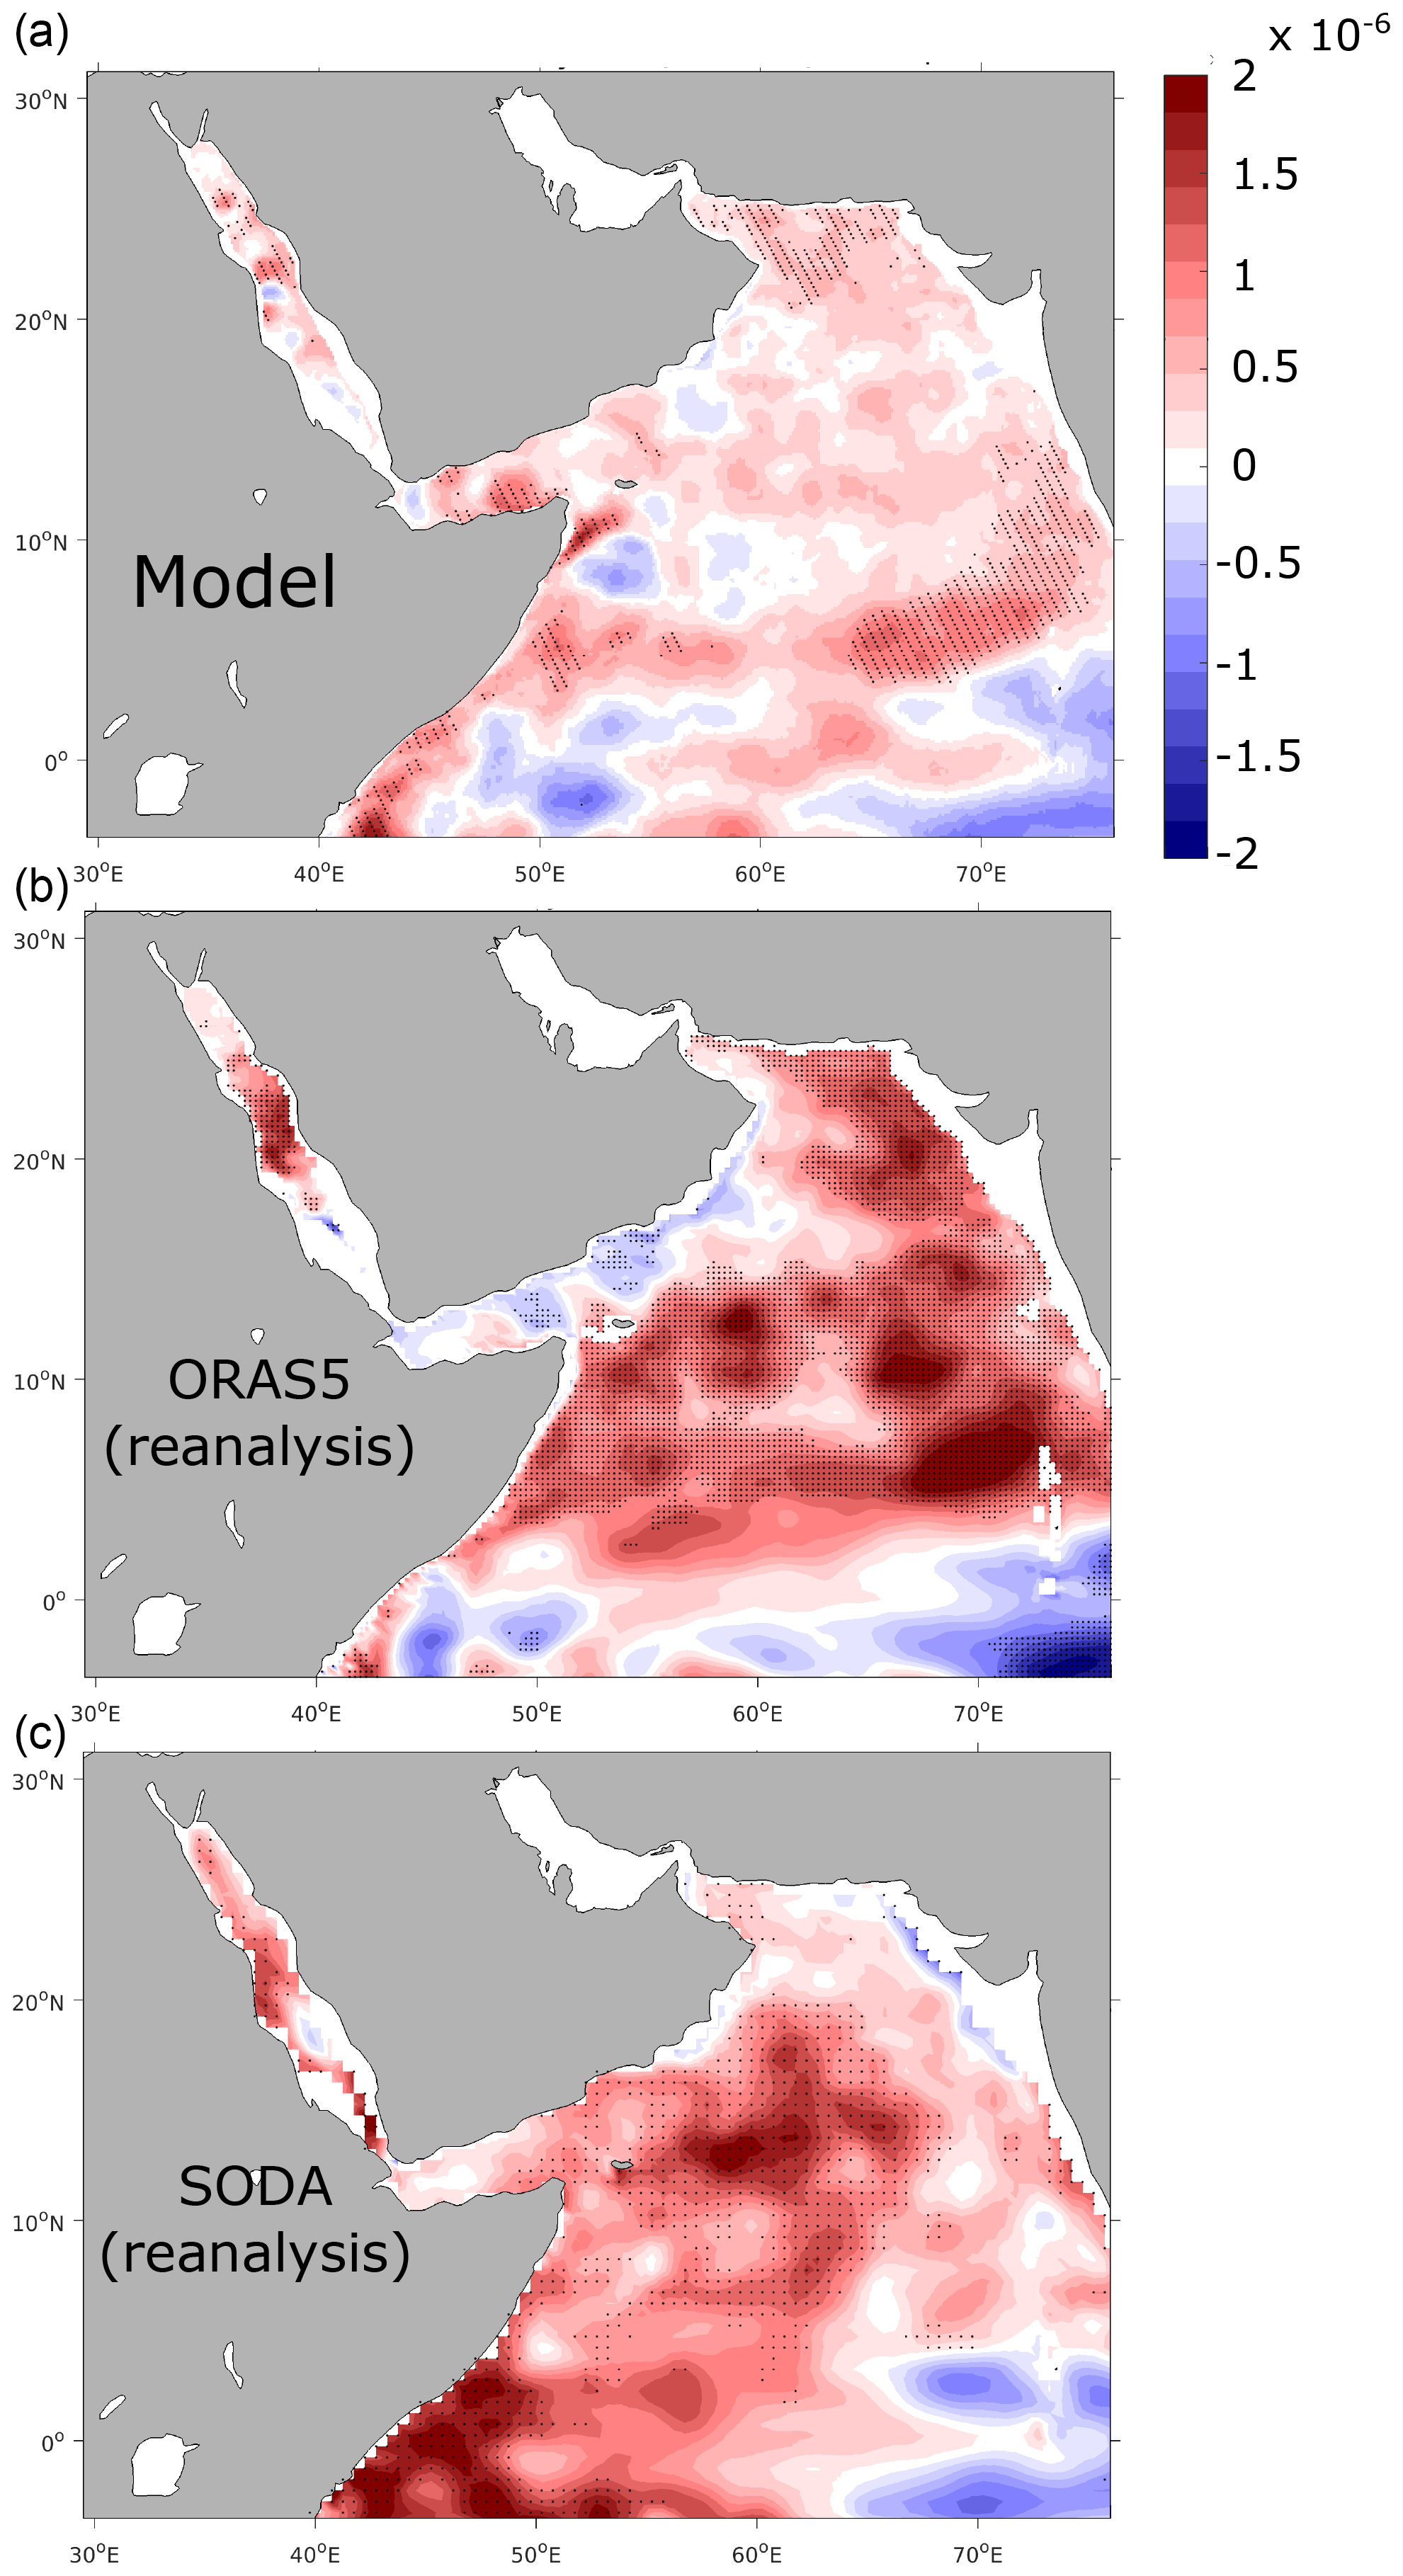
Figure 3Trends in upper-ocean vertical stratification. Linear trends in static stability (with σ the density of the water and z the depth) at 100 m (in m−1 per decade) between 1982 and 2010 as simulated in ROMS (a) and from ORAS5 (b) and SODA (c) reanalyses. Statistically significant trends at the 95 % confidence interval following a Mann–Kendall (MK) test are represented by stippling.
The model is spun-up using climatological forcing during 58 years and is then run for four 29-year (1982–2010) repeating forcing cycles, with the first three cycles used as a part of the spin-up period (i.e., the total duration of the spin-up phase is 145 years) and the fourth cycle used for analysis (similar to the forcing protocol used in the Ocean Model Intercomparison Project; Griffies et al., 2016). The climatological run is extended for an additional 29 years to quantify the artificial trends purely driven by the model drift and contrast them to trends estimated in our hindcast run. The analysis of model drift indicates a very negligible drift in salinity by the end of the climatological forcing period (Fig. S2, Supplement). For O2, the model drift decreases but remains positive (ocean oxygenation) by the end of the climatological forcing spin-up period, suggesting that the estimated deoxygenation rates extracted from our hindcast simulation are rather conservative (Figs. S3–S5, Supplement). A detailed description of the model drift is presented in the Supplement.
2.3 Model evaluation
We use available in situ and satellite-based observations to evaluate the performance of the model in capturing the spatial patterns as well as the seasonal variability in key physical and biogeochemical properties. We evaluate the mean state by contrasting a model climatology computed over the (1982–2010) study period to available observation-based climatologies. The details of this evaluation are presented in the Supplement. Despite a few identified biases, the model exhibits reasonable skill in reproducing the mean seasonal climatological state for both physical (i.e., temperature, salinity, currents) and biogeochemical properties (i.e., nitrate, chlorophyll; see Figs. S6–S10, Supplement). Furthermore, the model reproduces fairly well the size, intensity and vertical structure of the AS oxygen minimum zone (Fig. 1).
We also evaluate the model performance in reproducing observed long-term changes. To this end, we evaluate the model-simulated long-term evolution of temperature and salinity at multiple depths as well as the changes in the upper-ocean vertical stratification and surface chlorophyll a concentration. More specifically, we contrast simulated trends in SST to trends based on four observational SST products: AVHRR (used to force the model), ERA5 (Merchant et al., 2014), HadlSST (Rayner et al., 2003) and the NOAA OISST blended product (Huang et al., 2021). This comparison reveals that the model-simulated warming agrees relatively well with that from the different SST products, despite differences in the magnitude of warming, with ERA5 (HadlSST) displaying the strongest (weakest) rates of warming (Figs. 2 and S11, Supplement). Furthermore, we also contrast the interannual anomalies in temperature and salinity in the northern AS in the model to those from WOD2018 observations at different depths (Figs. S12 and S13, Supplement). This comparison reveals that in the northern AS the simulated and observed trends in upper-ocean temperature agree well. Indeed, the linear trends in temperature amount to +0.11 ∘C per decade at the surface (+0.12 ∘C per decade at 100 m) in the model and +0.11 ∘C per decade at the surface (+0.14 ∘C per decade at 100 m) in the WOD2018 dataset (Boyer et al., 2019) (all trends are statistically significant at both depths (p<0.01)). In contrast, temperature trends at 200 m are very weak and statistically non-significant in both the model and WOD2018. For salinity, both the model and the WOD2018 observations suggest a slight increase in the upper-ocean salinity over the study period (Fig. S13, Supplement). Yet, the highly sparse observational coverage (most of the observations coming from the last decade of the simulation) precludes extracting meaningful trends from the data to validate the simulated salinity long-term changes (Fig. S14, Supplement). Finally, we also evaluate the evolution of vertical stratification and static stability in the AS in the model. As salinity observations are very sparse over the region during the study period we contrast simulated vertical stratification to that from reanalysis products such as SODA and ECMWF Ocean Reanalysis System 5 (ORAS5) (Figs. 3 and S15, Supplement). This comparison reveals that overall the simulated increase in vertical stratification in the AS is comparable to similar trends derived from the ORAS5 and SODA reanalyses, although with local differences in their magnitude and regional patterns. For instance, our model underestimates the magnitude of stratification increase for most of the AS domain relative to ORAS5 and in the central and western AS in comparison to SODA. For biological variables, we only evaluate interannual variability in surface chlorophyll as O2 (and NO) observations are extremely limited in the area during the study period (Fig. S14, Supplement). As satellite chlorophyll data are available only from September 1997, we contrast simulated chlorophyll to observations over the common period from September 1997 to the end of the year 2010. The 13-year period is too short to extract meaningful long-term trends. Yet, this comparison is still useful as it reveals a decent agreement between the model and observations over the study period, with a moderate correlation of 0.48 between the modeled and observed interannual anomalies in the northern AS (Fig. S16, Supplement). In summary, the model reproduces the observed warming trends in the upper ocean of the northern AS and captures relatively well the observed large-scale changes in vertical stratification in the region. Finally, the model also shows a decent skill at capturing the observed interannual variability in surface chlorophyll.
2.4 Trends and oxygen diagnostics
To investigate long-term changes in O2 time series and other environmental properties (SST, winds, stratification, etc.), data were deseasonalized by removing monthly climatologies from the original time series. Furthermore, to identify significant trends in O2 and other environmental factors we used the non-parametric Mann–Kendall (MK) test (Mann, 1945; Kendall, 1948) that does not assume normality of data distribution and hence is less sensitive to outliers and skewed distributions. Linear trends were computed from the slope of the least squares regression line. To separate oxygen trends driven by changes in solubility (thermal effect) from those caused by changes in ocean ventilation and respiration of organic matter, we decompose the oxygen anomaly ΔO2 as
where O is the oxygen saturation concentration (in mmol m−3) computed at 1 atm pressure from temperature and salinity following Garcia and Gordon (1992). It corresponds to the maximum O2 concentration in seawater at equilibrium for a given temperature and salinity; AOU (apparent oxygen utilization) is the difference between oxygen saturation O and the actual O2 concentration (AOU = O). It is a measure of O2 utilization through biological activity since the water parcel was last at equilibrium in contact with the atmosphere. Therefore it is sensitive to both biological productivity and circulation (ventilation).
2.5 Quantification of the effects of changes in atmospheric forcing
The analysis of long-term trends in atmospheric forcing reveals a widespread warming of the sea surface by between 0.5 and 1 ∘C in the northern AS and by up to 1.5 ∘C in the Gulf and in the northern part of the Red Sea, between 1982 and 2010 (Fig. 2). In addition to surface warming, surface winds have undergone important changes, with an intensification of upwelling-favorable winds off Somalia and Oman, in particular during the summer monsoon season (Figs. 2 and S17, Supplement). To quantify the contributions of surface warming and wind changes to deoxygenation in the AS, we performed four additional sensitivity experiments. In the first simulation, Shclim, all atmospheric and lateral boundary conditions were set to vary interannually like in the control run except the heat fluxes that were extracted from a normal year (neutral with respect to major climate variability modes), 1986, and repeated every year (i.e., climatological heat fluxes across the domain). This approach allows us to filter out interannual variability while maintaining the high-frequency variability in the forcing (e.g., Large and Yeager, 2004; Stewart et al., 2020). In the second sensitivity run, Shclim_AG, the heat fluxes were similarly extracted from the year 1986 and repeated annually but only over the Gulf region (i.e., climatological heat fluxes over the Gulf only). In a third simulation, Swclim_JJAS, all atmospheric and lateral boundary conditions were set to vary interannually like in the control run except summer monsoon winds that were extracted from the year 1986 and repeated every year (i.e., climatological summer winds across the domain). Finally, in a fourth sensitivity simulation, Swclim_DJFM, all atmospheric and lateral boundary conditions were set to vary interannually like in the control run except winter monsoon winds that were extracted from the year 1986 and repeated every year (i.e., climatological winter winds across the domain).
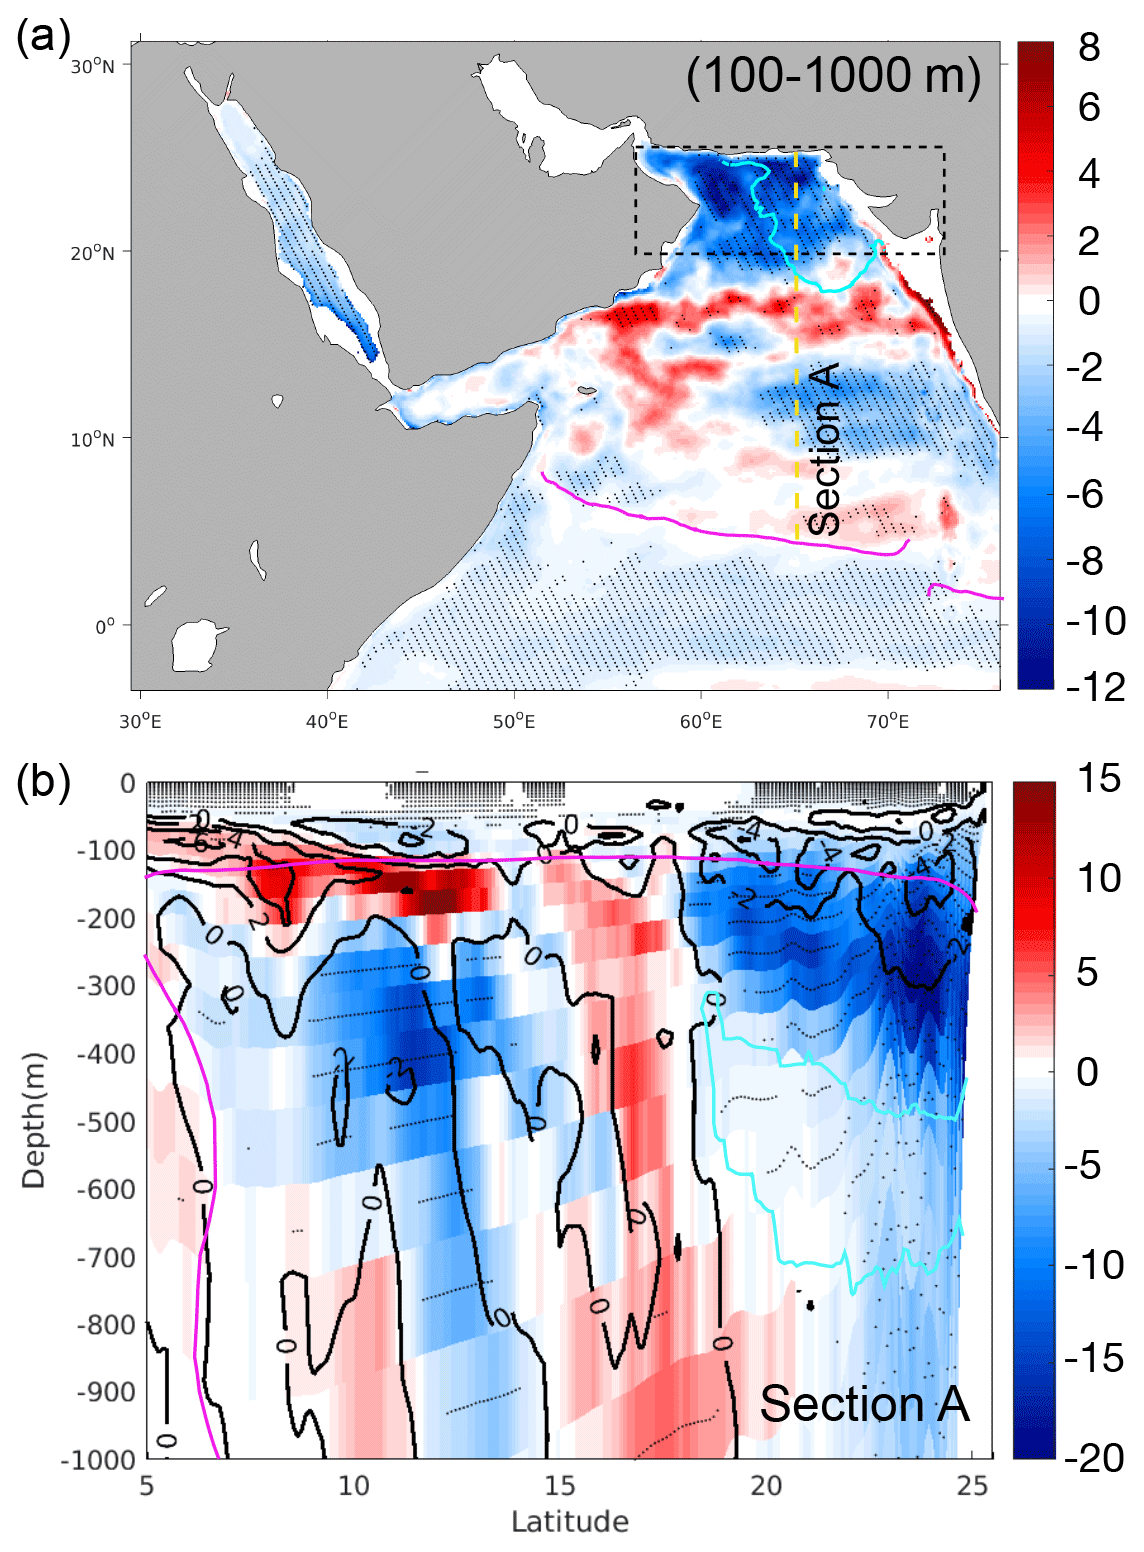
Figure 4Deoxygenation rates in the AS between 1982 and 2010. (a) Trends in O2 inventories (in percent per decade) in the 100–1000 m layer. The dashed black rectangle indicates the location of the northern AS box. The dashed yellow line indicates section A. (b) Trends (color shading; in percent per decade) and changes between the first 5 years (1982–1986) and the last 5 years (2006–2010) (contour lines; in mmol m−3 per decade) in O2 in the upper 1000 m along section A at 65∘ E (in percent per decade). Statistically significant trends at the 95 % confidence interval following a Mann–Kendall (MK) test are represented by hatching (a) and stippling (b). The purple and cyan lines indicate the average positions of the hypoxic (O2<60 mmol m−3) and suboxic (O2<4 mmol m−3) boundaries, respectively, at (a) 500 m and (b) along section A. Relative trends (in percent per decade) were obtained by dividing the absolute trends by the local mean O2 inventory (a) or concentration (b).
3.1 Deoxygenation trends in the Arabian Sea
The analysis of oxygen trends between 1982 and 2010 shows a decline in O2 concentrations in a large portion of the AS between 100 and 1000 m (Fig. 4). O2 drops locally by more than 10 % per decade in the northern AS, where the suboxic core of the OMZ is located (Fig. 4). A vertical transect at 65∘ E indicates that most of the O2 decline is concentrated north of 20∘ N between 100 and 300 m (Fig. 4). This deoxygenation results in a significant intensification of the OMZ over the 3-decade study period, with the volume of suboxic (O2<4 mmol m−3) water increasing by nearly 14 % per decade north of 20∘ N and by around 10 % per decade when considering the entire Arabian Sea domain (Figs. 5 and S18). This causes an amplification of denitrification in the region with an increase in denitrification rates of around 15 % per decade over the same period (Fig. 5). The evolution of the suboxic volume and denitrification also reveals strong interannual and decadal fluctuations with a strong rate of intensification of the OMZ during the 1980s and 1990s and a relative stabilization in the last decade of the simulation. Indeed, the changes in the suboxic volume and denitrification are largest between the early 1980s and early 2000s (Fig. 5). Despite deoxygenation trends dominating in the northern and southern AS, local oxygenation patches are simulated in the central AS (Fig. 4). This results in the net hypoxic volume (O2<60 mmol m−3) that defines the OMZ volume to change little over the study period (Fig. S18). When considering the northern Arabian Sea only, the hypoxic volume shows a statistically significant increase, yet at a modest rate of 1.7 % over the 3 decades of the simulation (Fig. 5). To put these numbers in a broader context, observations suggest that the volume of the world ocean OMZs has expanded in a range of 3 %–8 % between 1970 and 2010 (Bindoff et al., 2019). The stronger trends simulated for the suboxic volume relative to the hypoxic volume are also consistent with previous studies. For instance, it has been suggested that the volume of anoxic waters in the global ocean has quadrupled since 1960 (Schmidtko et al., 2017). Moreover, using numerical simulations, Deutsch et al. (2011) have shown that the amplitude of variations in the volume of low-oxygen conditions in the global ocean increases between 1959 and 2005 from 10 % for strong hypoxia (O2<40 mmol m−3) to nearly 100 % for suboxia. Next, we focus on the northern AS (north of 20∘ N), where simulated deoxygenation and its impacts on the OMZ are the most prominent.
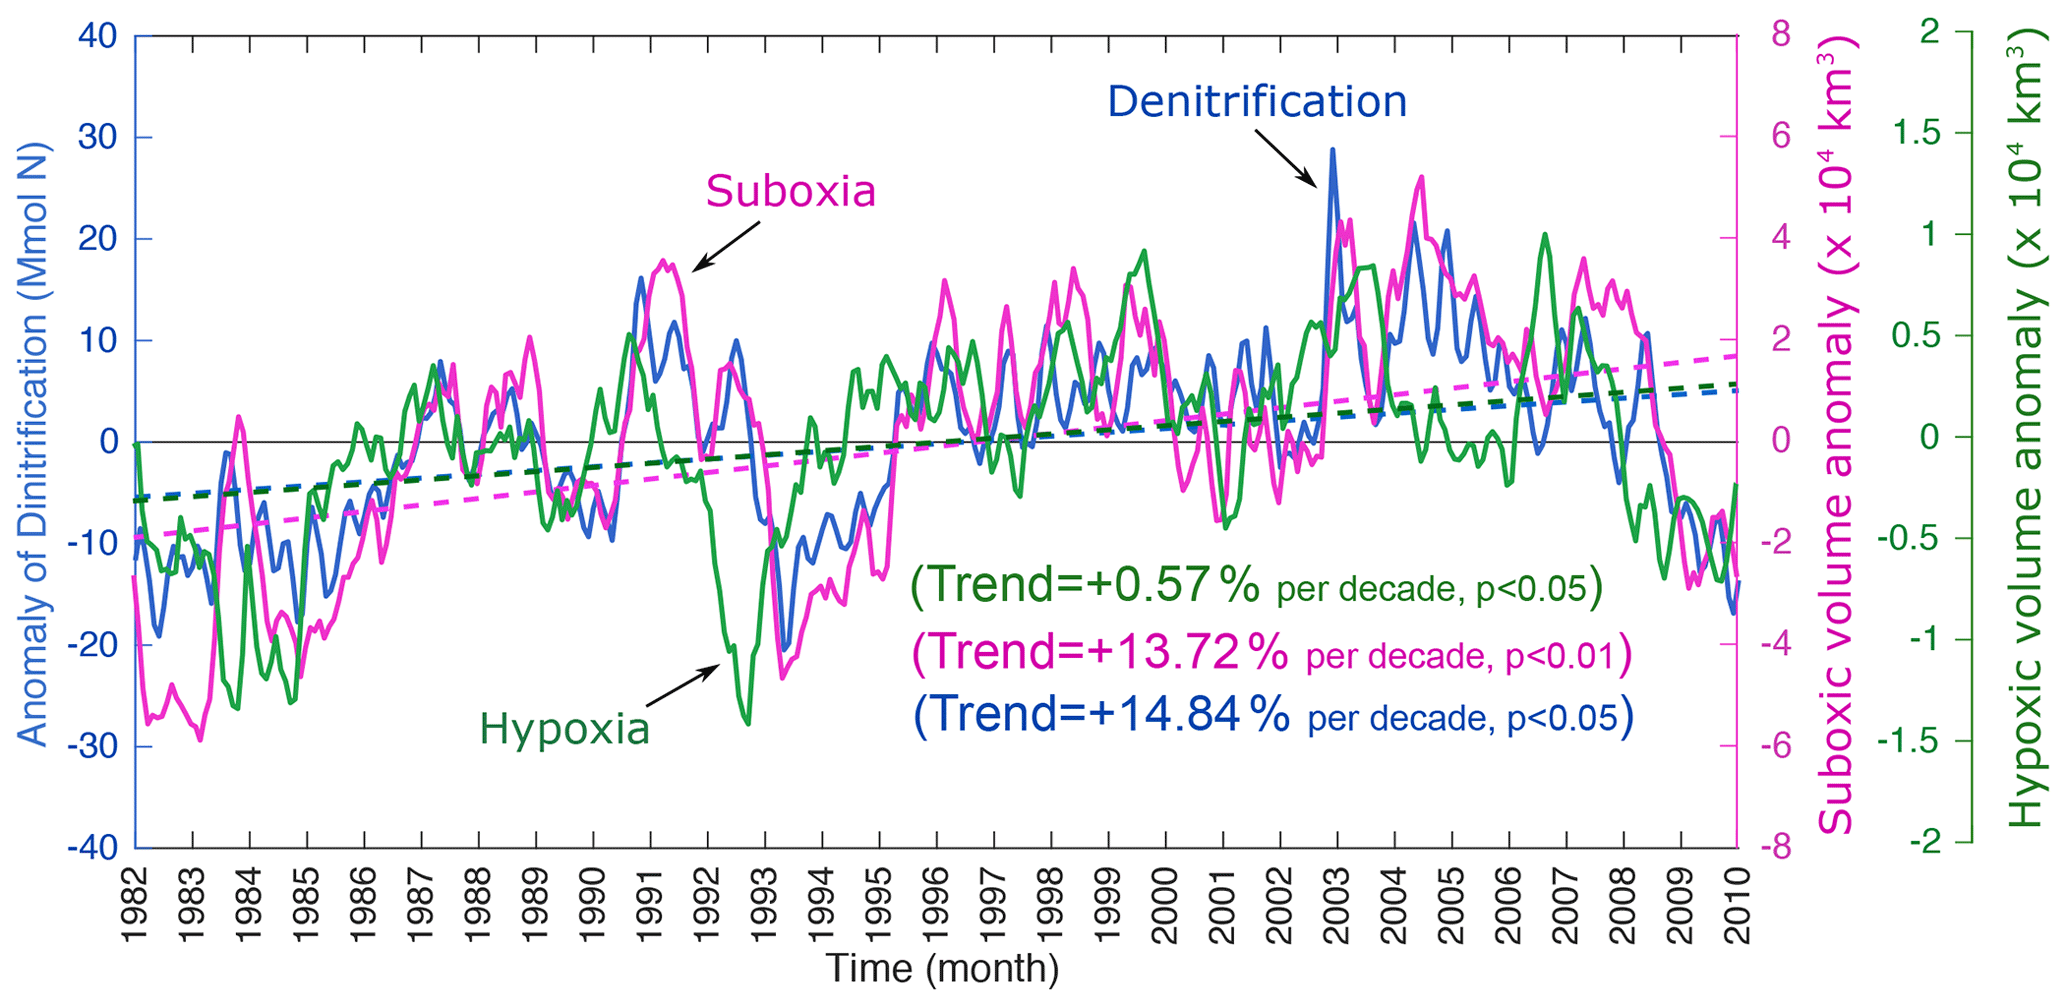
Figure 5Changes in oxygen minimum zone and denitrification in the northern AS. Interannual anomalies in the volume of suboxia (purple), hypoxia (green) and water column denitrification (blue) in the upper 1000 m north of 20∘ N over the study period. The dashed lines indicate the trend lines. The location of the northern AS box is shown in Fig. 4a.
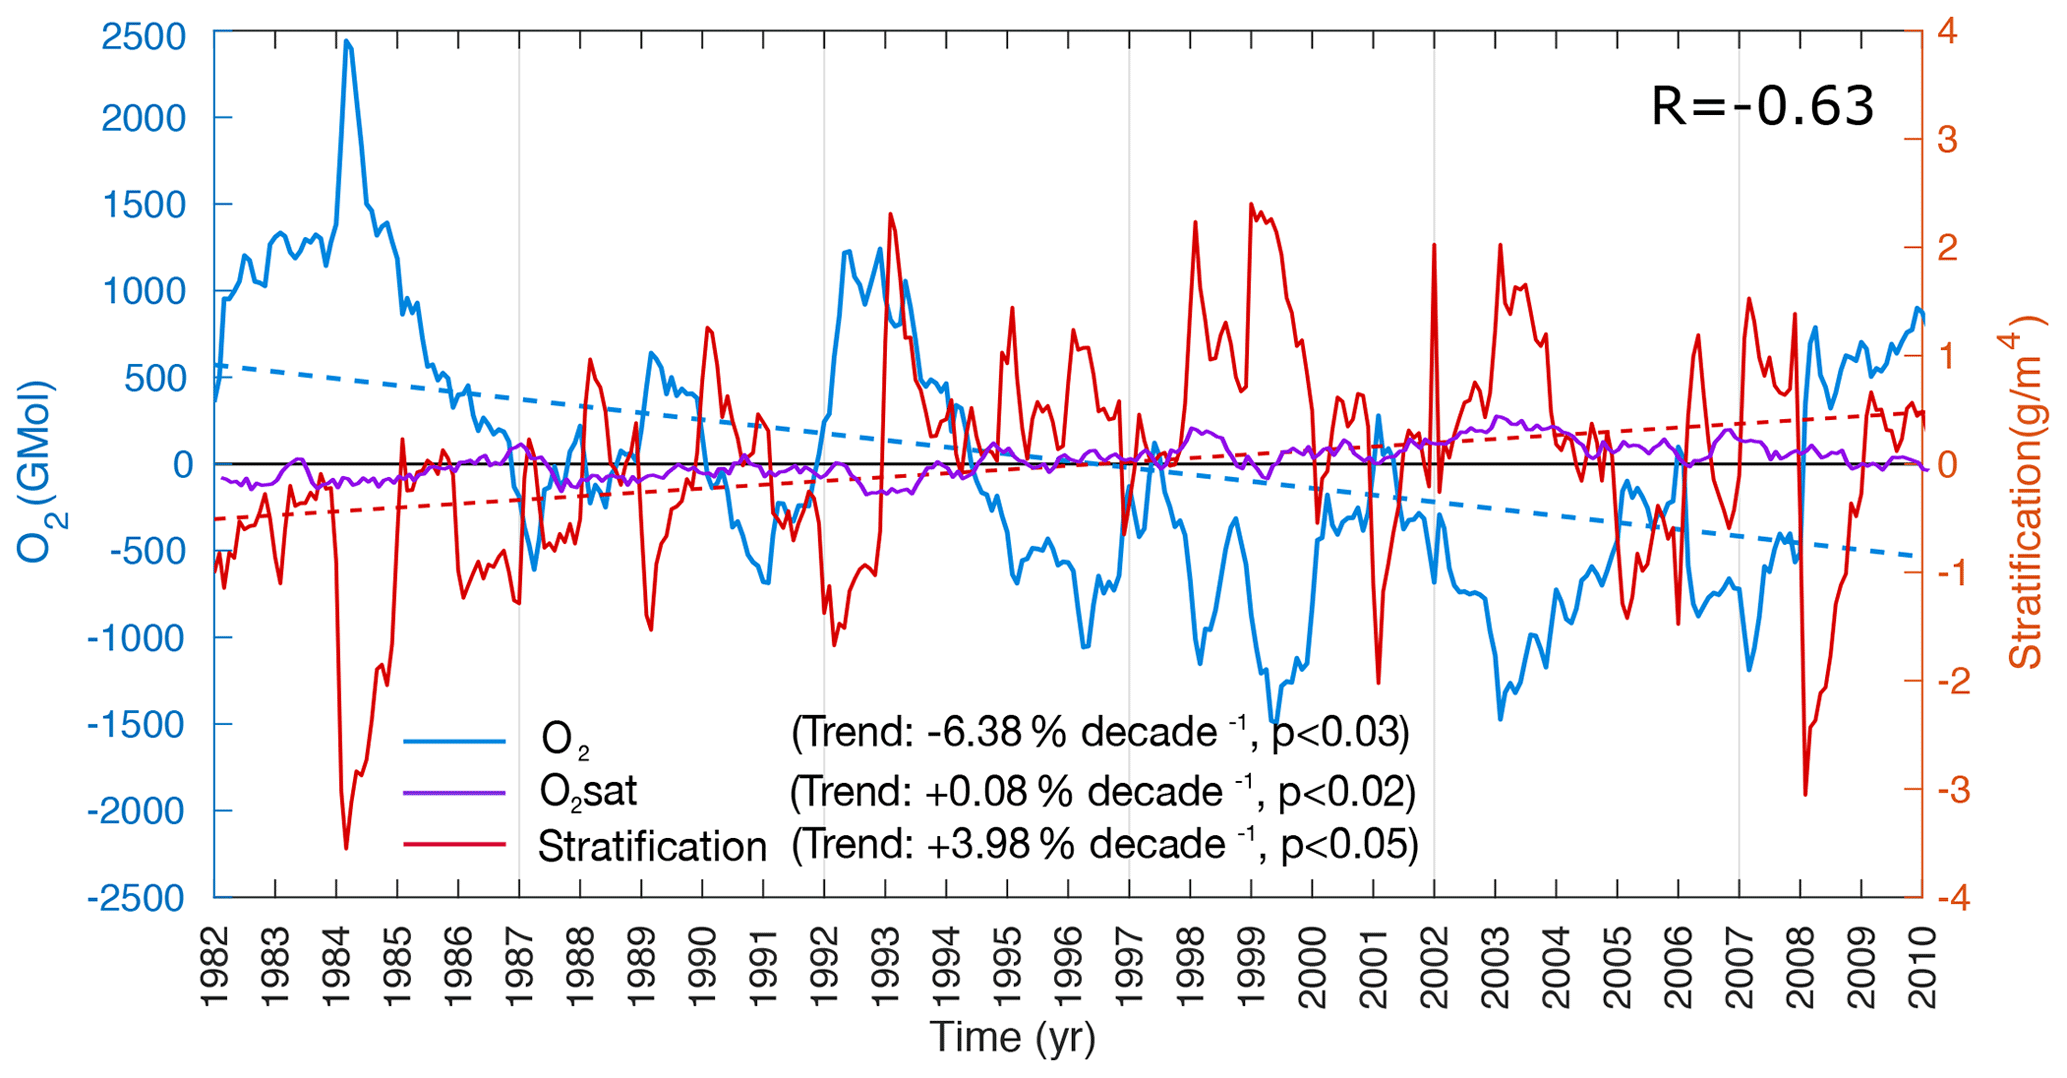
Figure 6Drivers of northern AS deoxygenation between 1982 and 2010. O2 content (blue) and O2 saturation (purple) anomalies between 100 and 1000 m and anomalies of vertical stratification at 100 m (red) in the northern AS box as a function of time. The dashed blue and red lines indicate the trend lines in O2 inventory and vertical stratification at 100 m (estimated as the local vertical density gradient at 100 m). Note the strong anticorrelation between O2 anomalies and stratification anomalies (). The location of the northern AS box is shown in Fig. 4a.
3.2 Drivers of northern AS ocean deoxygenation
As oxygen equilibrates relatively rapidly at the air–sea interface relative to ocean circulation timescales, observed surface oxygen concentrations are generally close to their saturation levels (O). In the ocean interior, oxygen is depleted because of biological respiration. Therefore, changes in dissolved oxygen concentrations in the ocean interior express either changes in oxygen saturation levels (solubility effect) or changes in the accumulated oxygen deficits associated with respiration. The latter term, measured by AOU (AOU = O), depends on both biological activity and ventilation. Here, we explore how these different components contribute to the simulated oxygen changes. In the northern AS (north of 20∘ N), oxygen inventory drops by over 6 % per decade between 100 and 1000 m (Fig. 6). We found this trend to be statistically significant at the 95 % confidence interval. The deoxygenation trend seems to emerge mostly from changes in the apparent oxygen utilization (AOU) as O shows no similar decline and even slightly increases during the study period (Fig. 6). This is in contrast to the surface ocean (top 30 m), where the drop in O explains the majority (over 70 %) of the simulated O2 decline (Fig. S19, Supplement). To further explore the drivers of ocean deoxygenation in the northern AS, we performed an O2 budget analysis north of 20∘ N in the 100–1000 m layer (Fig. 7). To this end, we quantified in the same layer the cumulative O2 anomalies associated with the transport and the biology sources-minus-sinks terms (see the details of the O2 mass balance equation in the Supplement). This analysis indicates that most of O2 decline in the northern region is associated with a drop in ventilation (transport), with O2 anomalies driven by biological consumption showing no such drop over the study period (Fig. 7). The ventilation anomalies appear to also dominate the strong interannual and decadal variability in O2 (Fig. 7). The reduction in ventilation in the northern AS is particularly strong in the 1980s and 1990s. In contrast, no such decline can be seen in the last decade of the simulation despite an important modulation by interannual fluctuations. Splitting the ventilation contribution into vertical-mixing- and advection-driven parts reveals that the decline in O2 is primarily caused by a reduction in vertical mixing (Fig. 7). Next, we explore how changes in atmospheric forcing may have contributed to the ventilation reduction evidenced by the O2 budget analysis.
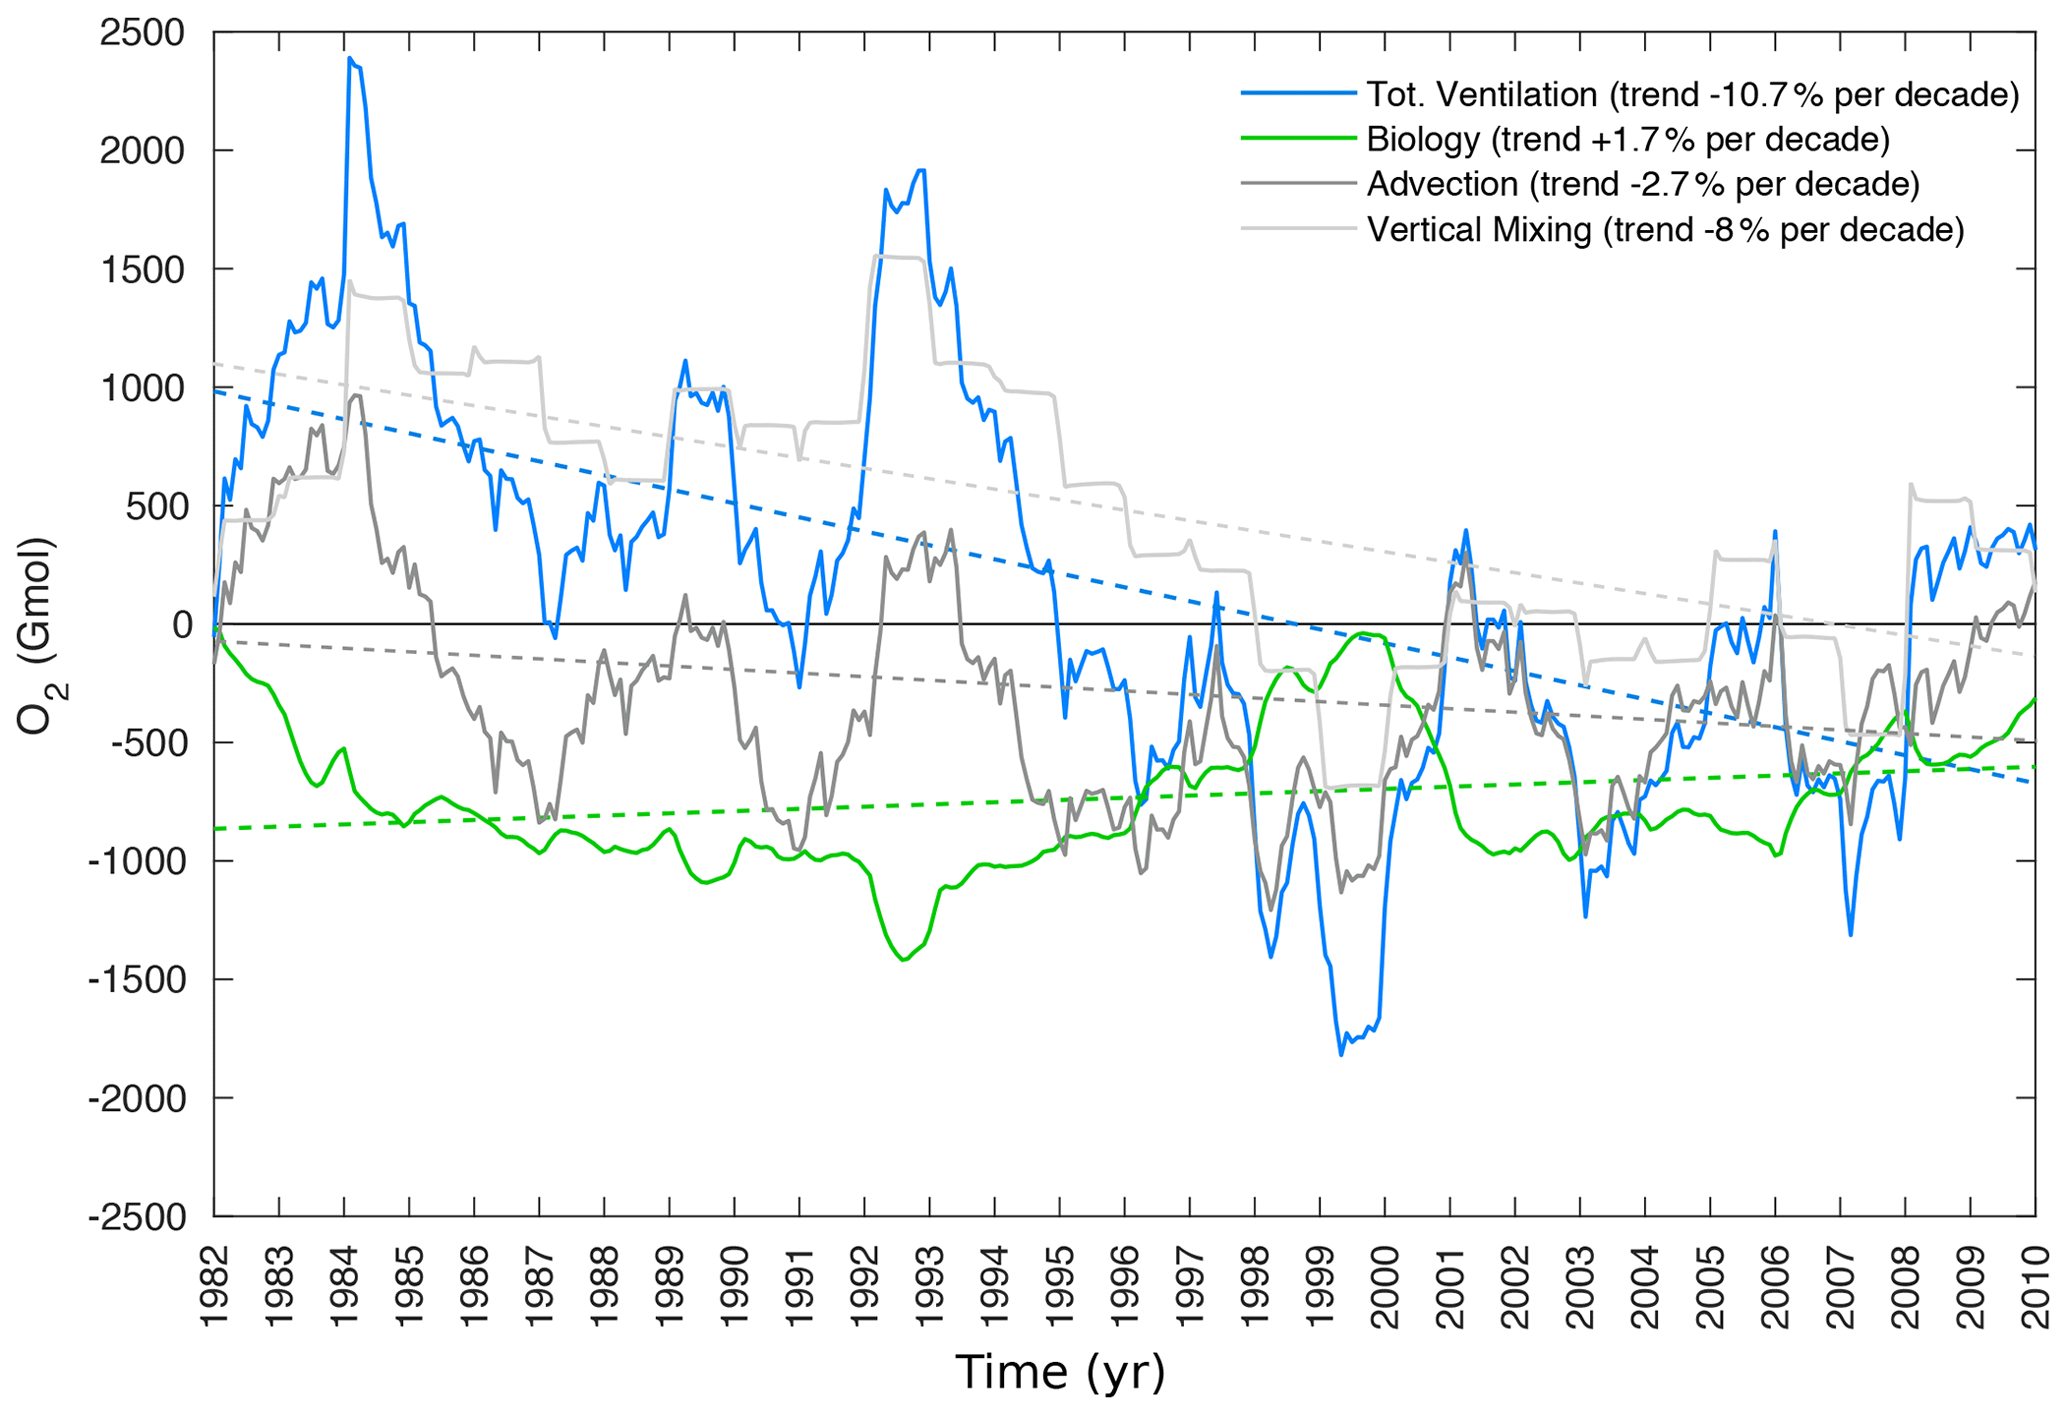
Figure 7Role of ventilation and biology in northern AS deoxygenation. Cumulative O2 anomalies associated with ventilation (blue) and biological (green) changes between 100 and 1000 m in the northern AS (location indicated in Fig. 4a). The contributions of advection and subgrid vertical mixing are shown in dark gray and light gray, respectively. The dashed lines indicate the trend lines associated with the different sources.
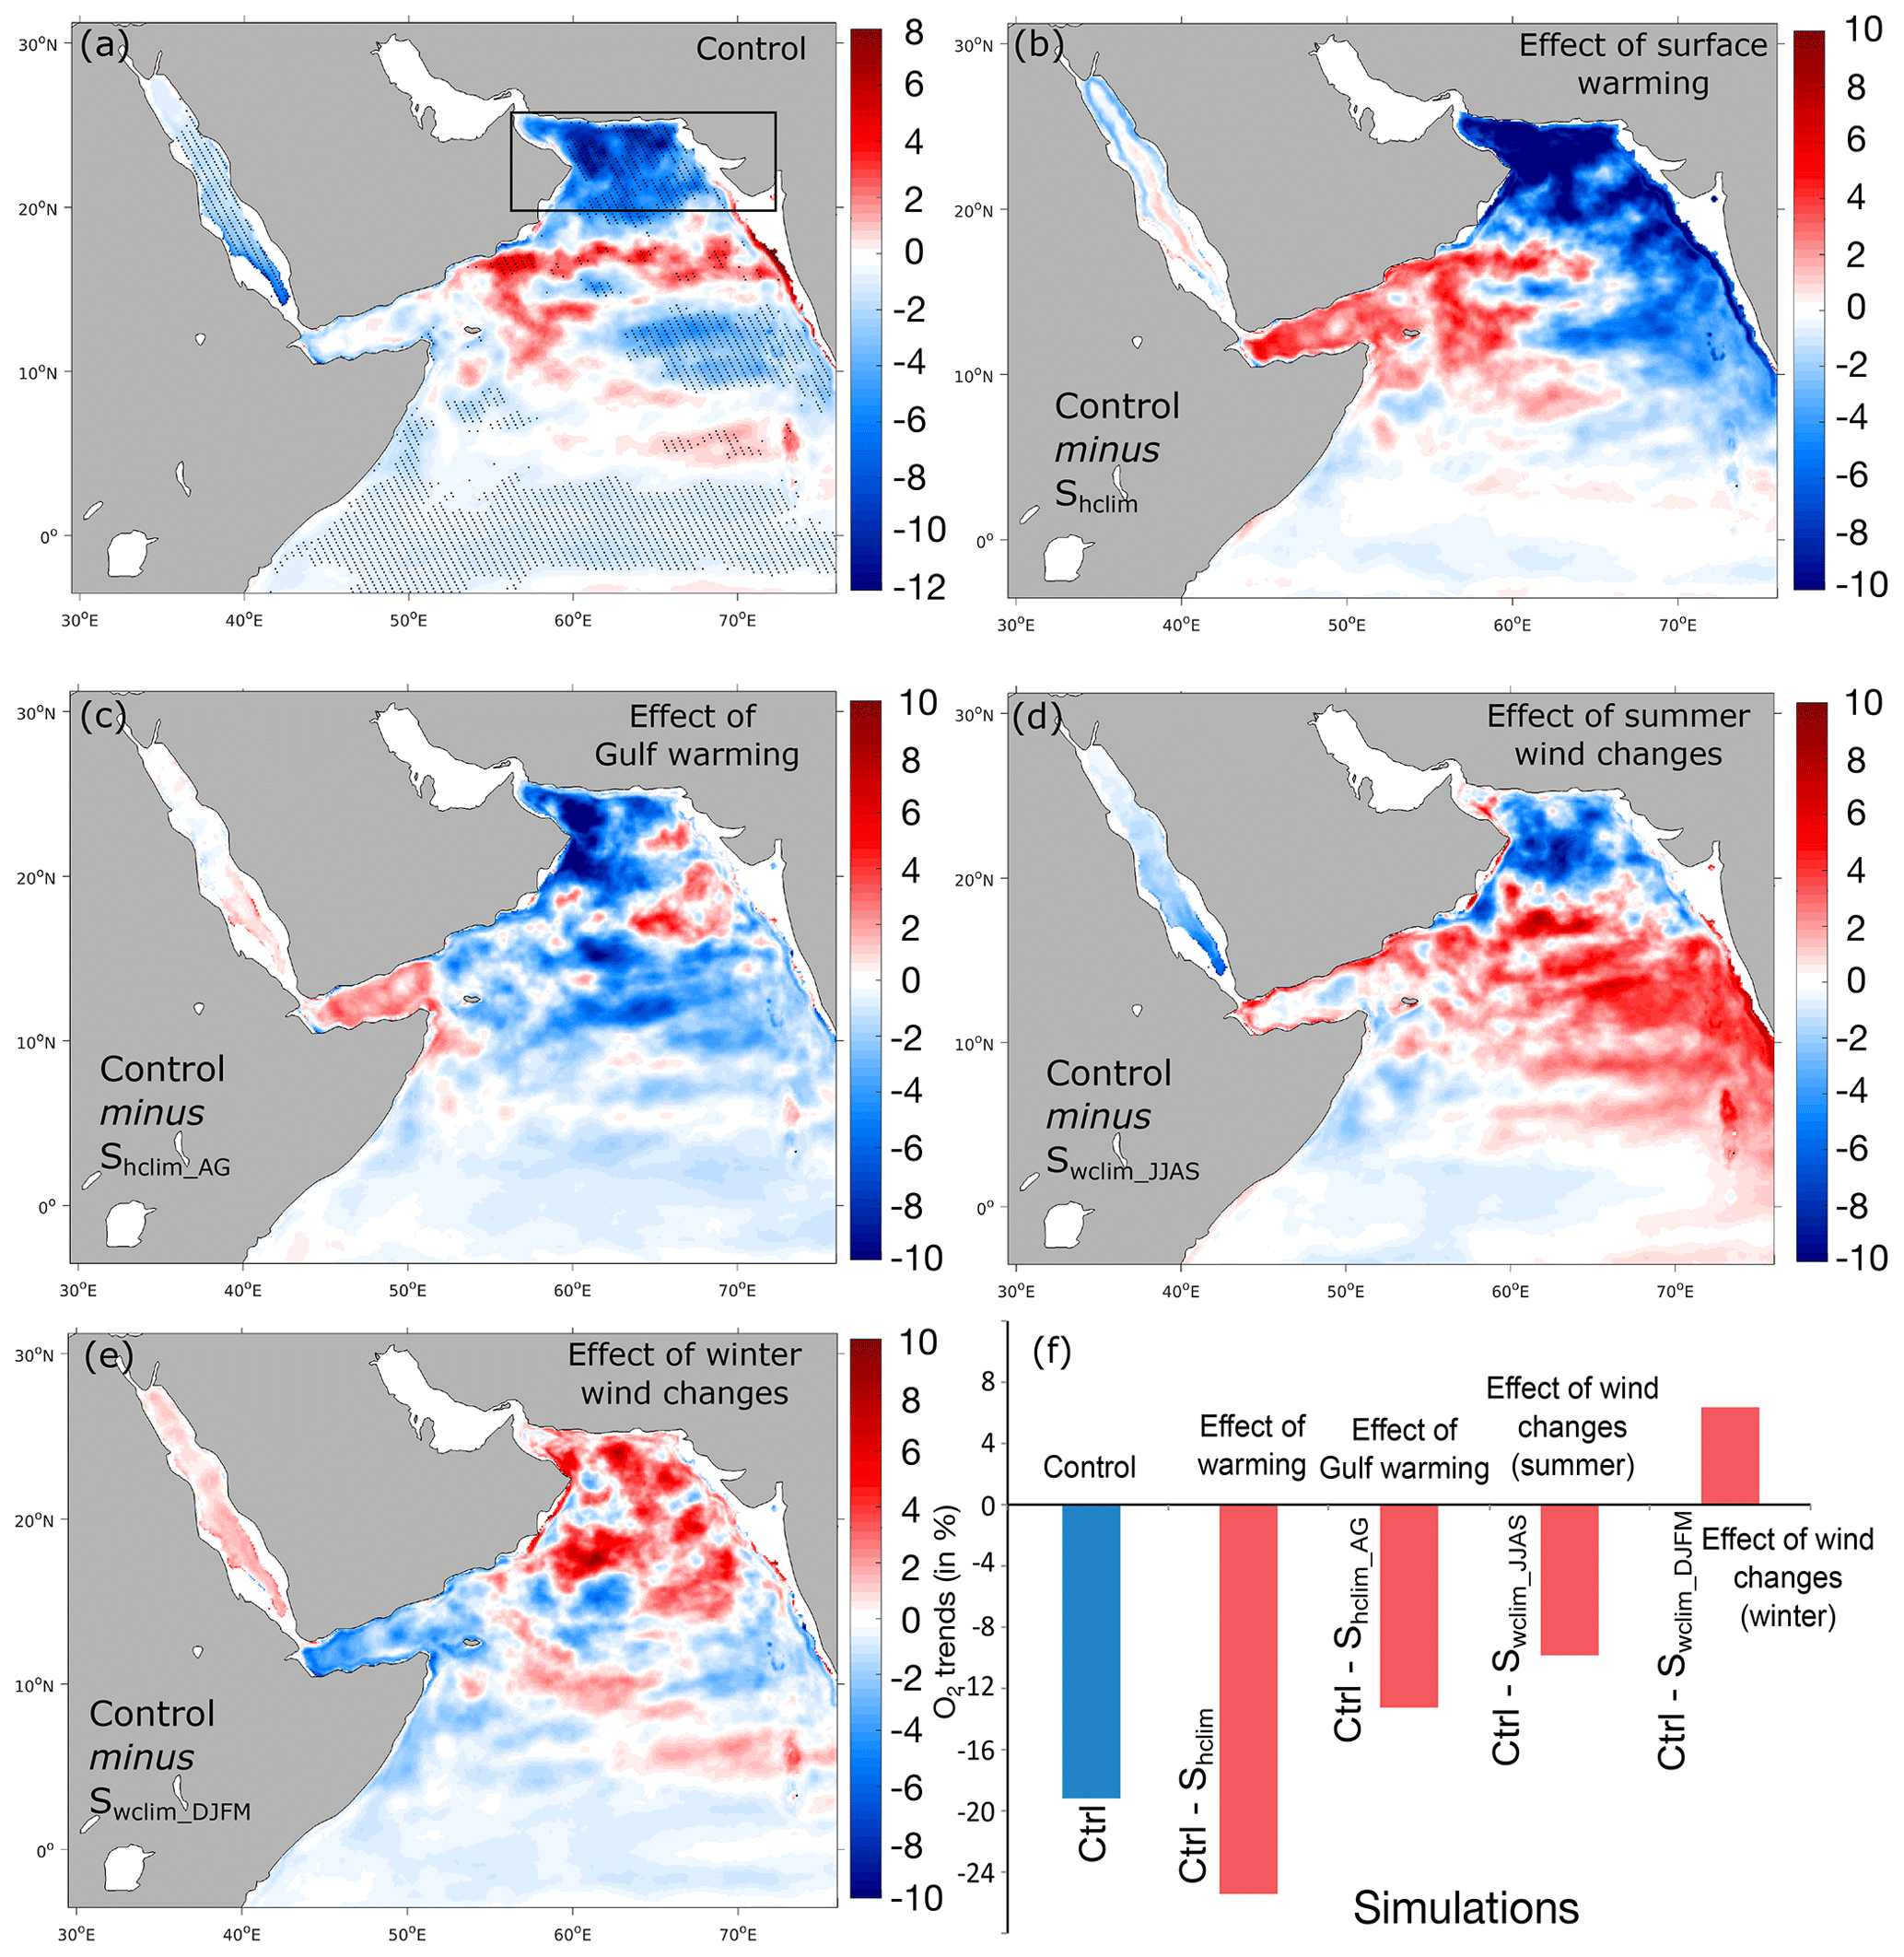
Figure 8Effects of different atmospheric forcing perturbations on deoxygenation rates. (a) Linear trends in O2 inventories in the 100–1000 m layer in the control run (in percent per decade). (b–e) Difference in O2 inventory trends between the control run and the Shclim (i.e., effect of warming), Shclim_AG (i.e., effect of Gulf warming), Swclim_JJAS (i.e., effect of summer wind intensification) and Swclim_DJFM (i.e., effect of winter wind changes) sensitivity simulations in the 100–1000 m layer (in percent per decade). (f) Difference in O2 inventory trends in the northern AS box between the control and the different sensitivity simulations (in percent of the mean O2 inventory over the 1982–2010 period).
3.3 Impact of changes in atmospheric forcing
To explore the impacts of changes in atmospheric forcing on the oxygen distribution in the Arabian Sea, we contrast oxygen trends in the control run to trends in the different sensitivity experiments. More concretely, the effect of surface warming on oxygen is quantified by subtracting the trends in the no-warming simulation Shclim from those in the control run. Similarly, subtracting the trends in the no-Gulf-warming simulation Shclim_AG from trends in the control run allows us to measure the relative importance of the fast warming of the Gulf to the deoxygenation in the northern AS. Finally, by subtracting oxygen trends in the Swclim_JJAS and Swclim_DJFM simulations from the control trends we are able to quantify the effects of summer and winter monsoon wind changes, respectively, on the simulated deoxygenation.
This analysis reveals that surface warming causes a substantial decline in the northern AS oxygen inventory of nearly 25 % in the 100–1000 m layer between 1982 and 2010 relative to the no-warming case (Fig. 8). Indeed, oxygen inventory increased north of 20∘ N by over 6 % between 1982 and 2010 under climatological heat fluxes as opposed to a decrease of over 18 % in the control run during the same period (Fig. S20, Supplement). Contrasting oxygen trends in the no-Gulf-warming simulation to those simulated in the control run suggests that the fast warming of the Gulf has significantly contributed to northern AS deoxygenation. Concretely, the Gulf warming is associated with a decrease in the northern AS oxygen inventory of around 12 % in the 100–1000 m layer between 1982 and 2010 relative to the no-Gulf-warming case (Fig. 8). Indeed, in the absence of Gulf warming the oxygen inventory decreased north of 20∘ N by only around 6 % between 1982 and 2010, a rate that is twice as weak as that simulated in the control run during the same period (Fig. S20, Supplement). The intensification of summer monsoon winds also appears to contribute to simulated deoxygenation in the northern AS, although to a lesser extent (Fig. 8). Indeed, summer wind changes are associated with a decrease in the northern AS oxygen inventory of around 9 % in the 100–1000 m layer between 1982 and 2010 relative to the no-summer-wind-change scenario (Fig. 8). Indeed, oxygen decreases in the northern AS by around 9 % between 1982 and 2010 under climatological summer winds, a rate that is nearly 50 % weaker than in the control run during the same period (Fig. S20, Supplement). Finally, contrary to surface warming and summer monsoon intensification, changes in winter monsoon winds do not contribute to deoxygenation trends in the northern Arabian Sea. Indeed, in the absence of winter wind changes, deoxygenation in the northern AS is maintained and is even slightly stronger relative to the control run (Fig. 8).
In summary, we conclude that deoxygenation in the northern AS is essentially caused by surface warming and that the fast warming of the Gulf plays an important role in this trend. While summer monsoon intensification – to a lesser extent – contributes to deoxygenation in the northern AS, changes in winter monsoon winds have a smaller effect on northern AS oxygen and tend to oppose deoxygenation trends there. Next, we explore the mechanisms through which surface warming and enhanced summer monsoon winds reduce thermocline ventilation, causing upper-ocean deoxygenation in the northern AS.
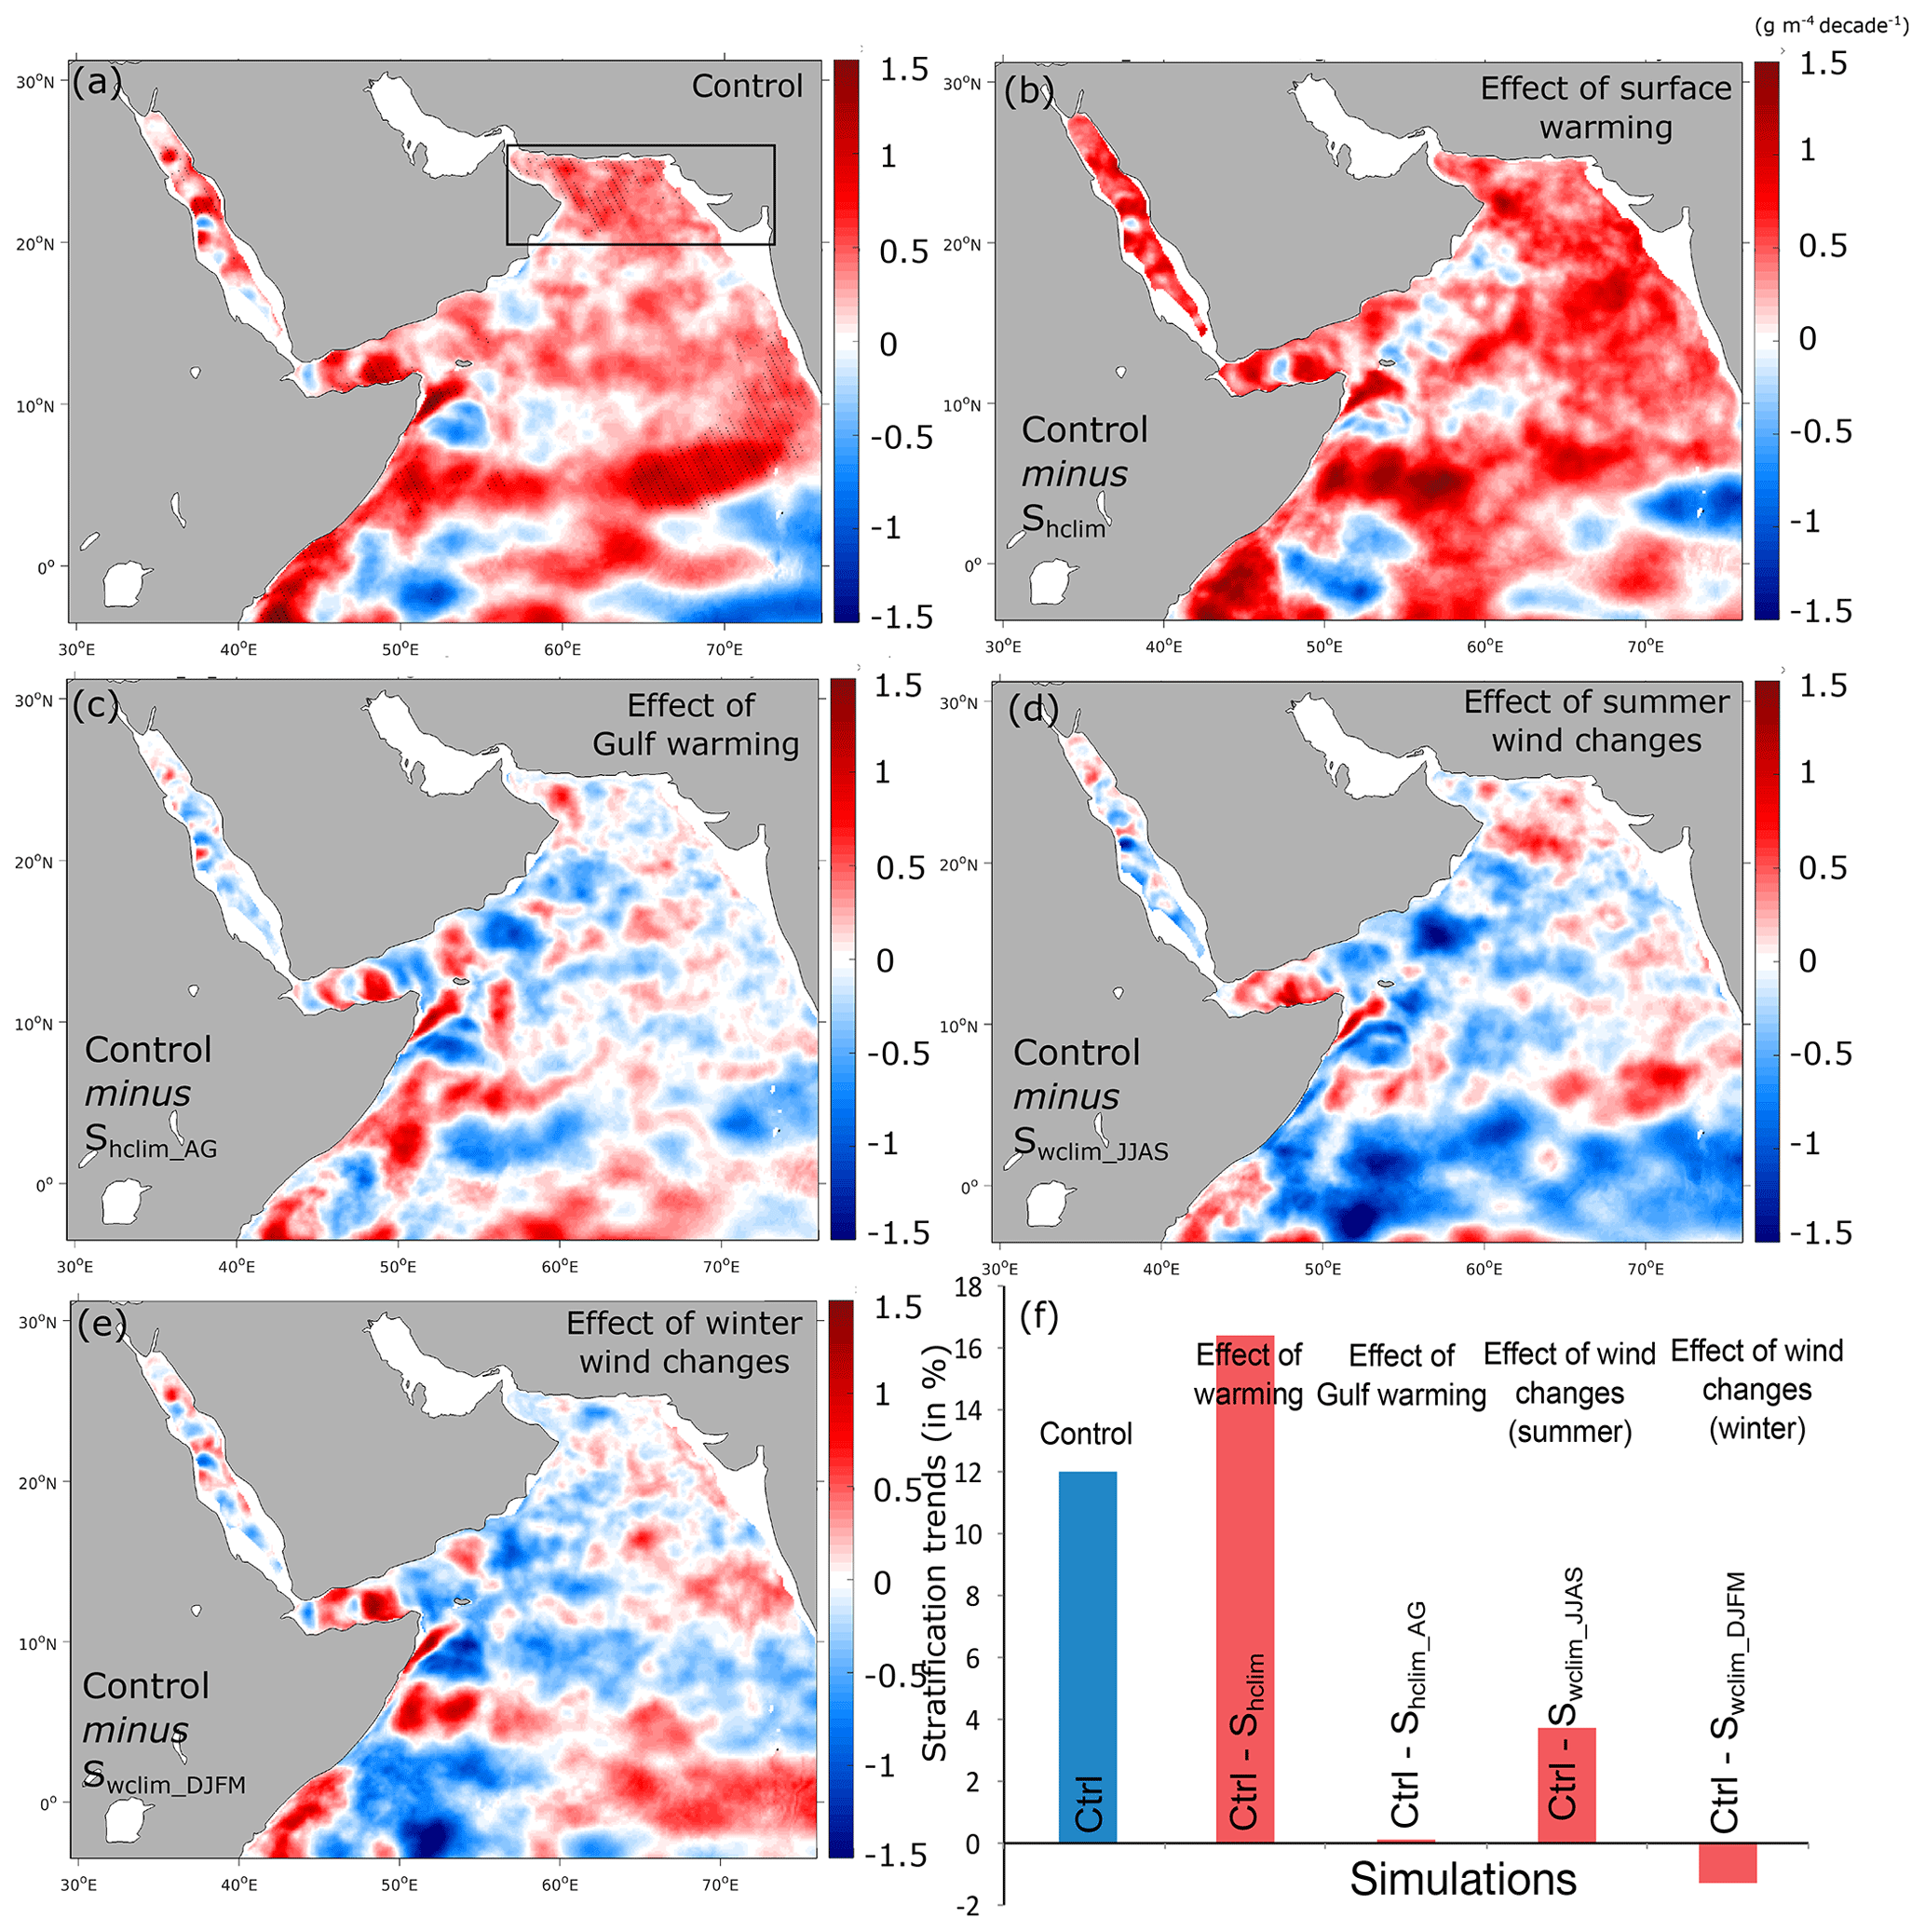
Figure 9Effects of different atmospheric forcing perturbations on upper-ocean vertical stratification. (a) Linear trends in vertical stratification at 100 m in the control run (in g m−4 per decade). (b–e) Difference in trends in stratification at 100 m between the control run and the Shclim (i.e., effect of warming), Shclim_AG (i.e., effect of Gulf warming), Swclim_JJAS (i.e., effect of summer wind intensification) and Swclim_DJFM (i.e., effect of winter wind changes) sensitivity simulations (in g m−4 per decade). (f) Difference in stratification trends in the northern AS box between the control and the different sensitivity simulations (in percent of the mean stratification over the 1982–2010 period).
3.4 Mechanisms of ventilation reduction
The ventilation of the northern AS upper thermocline is predominantly sensitive to (i) the intensity of vertical mixing particularly associated with winter convection (McCreary et al., 2013; Resplandy et al., 2012), (ii) the magnitude of export and subduction of dense Gulf water (Lachkar et al., 2019), and (iii) the vertical displacement of the thermocline causing changes in the oxycline depth (Vallivattathillam et al., 2017). Here, we explore how these ventilation mechanisms have responded to changes in atmospheric forcing.
The ocean surface warming results in an increase in vertical stratification (here estimated using the local vertical density gradient at 100 m) that is particularly important in the northern AS, with stratification at 100 m increasing on average by nearly 4 % per decade north of 20∘ N (Figs. 6 and 9). This positive trend is mostly induced by rapid stratification increases in the 1980s and 1990s, with little change in the 2000s, mirroring the evolution of O2 (Fig. 6). The stratification does not increase (and even slightly decreases) in the northern AS when the heat fluxes are set to be climatological (Fig. S21, Supplement). This confirms that surface warming is responsible for the stratification increase that inhibits vertical mixing and contributes to the reduction in ventilation revealed by the O2 budget analysis (Fig. 7). Additional evidence for the reduced vertical mixing can be seen from the analysis of trends in winter mixed layer depth (MLD) that shows a winter MLD shoaling by over 5 m in the northern AS between 1982 and 2010 (Fig. S22, Supplement).
While both the warming of the Gulf and summer monsoon intensification contribute to deoxygenation in the northern AS, vertical stratification changes little in response to these two perturbations (Figs. 9 and S21). This suggests that other mechanisms contribute to northern AS ventilation reduction besides vertical stratification enhancement. Lachkar et al. (2019) have shown that the AS OMZ can intensify in response to strong warming of the Gulf, causing a reduced outflow of the Gulf water in the northern AS. Here, we find that the depth of the Gulf water has shoaled locally by up to 20 m in the Gulf of Oman in the control run relative to the Shclim_AG run (Fig. S23, Supplement). This indicates an increase in the Gulf water buoyancy and a decline in its subduction to intermediate depths in the northern AS in agreement with the mechanisms described in Lachkar et al. (2019).
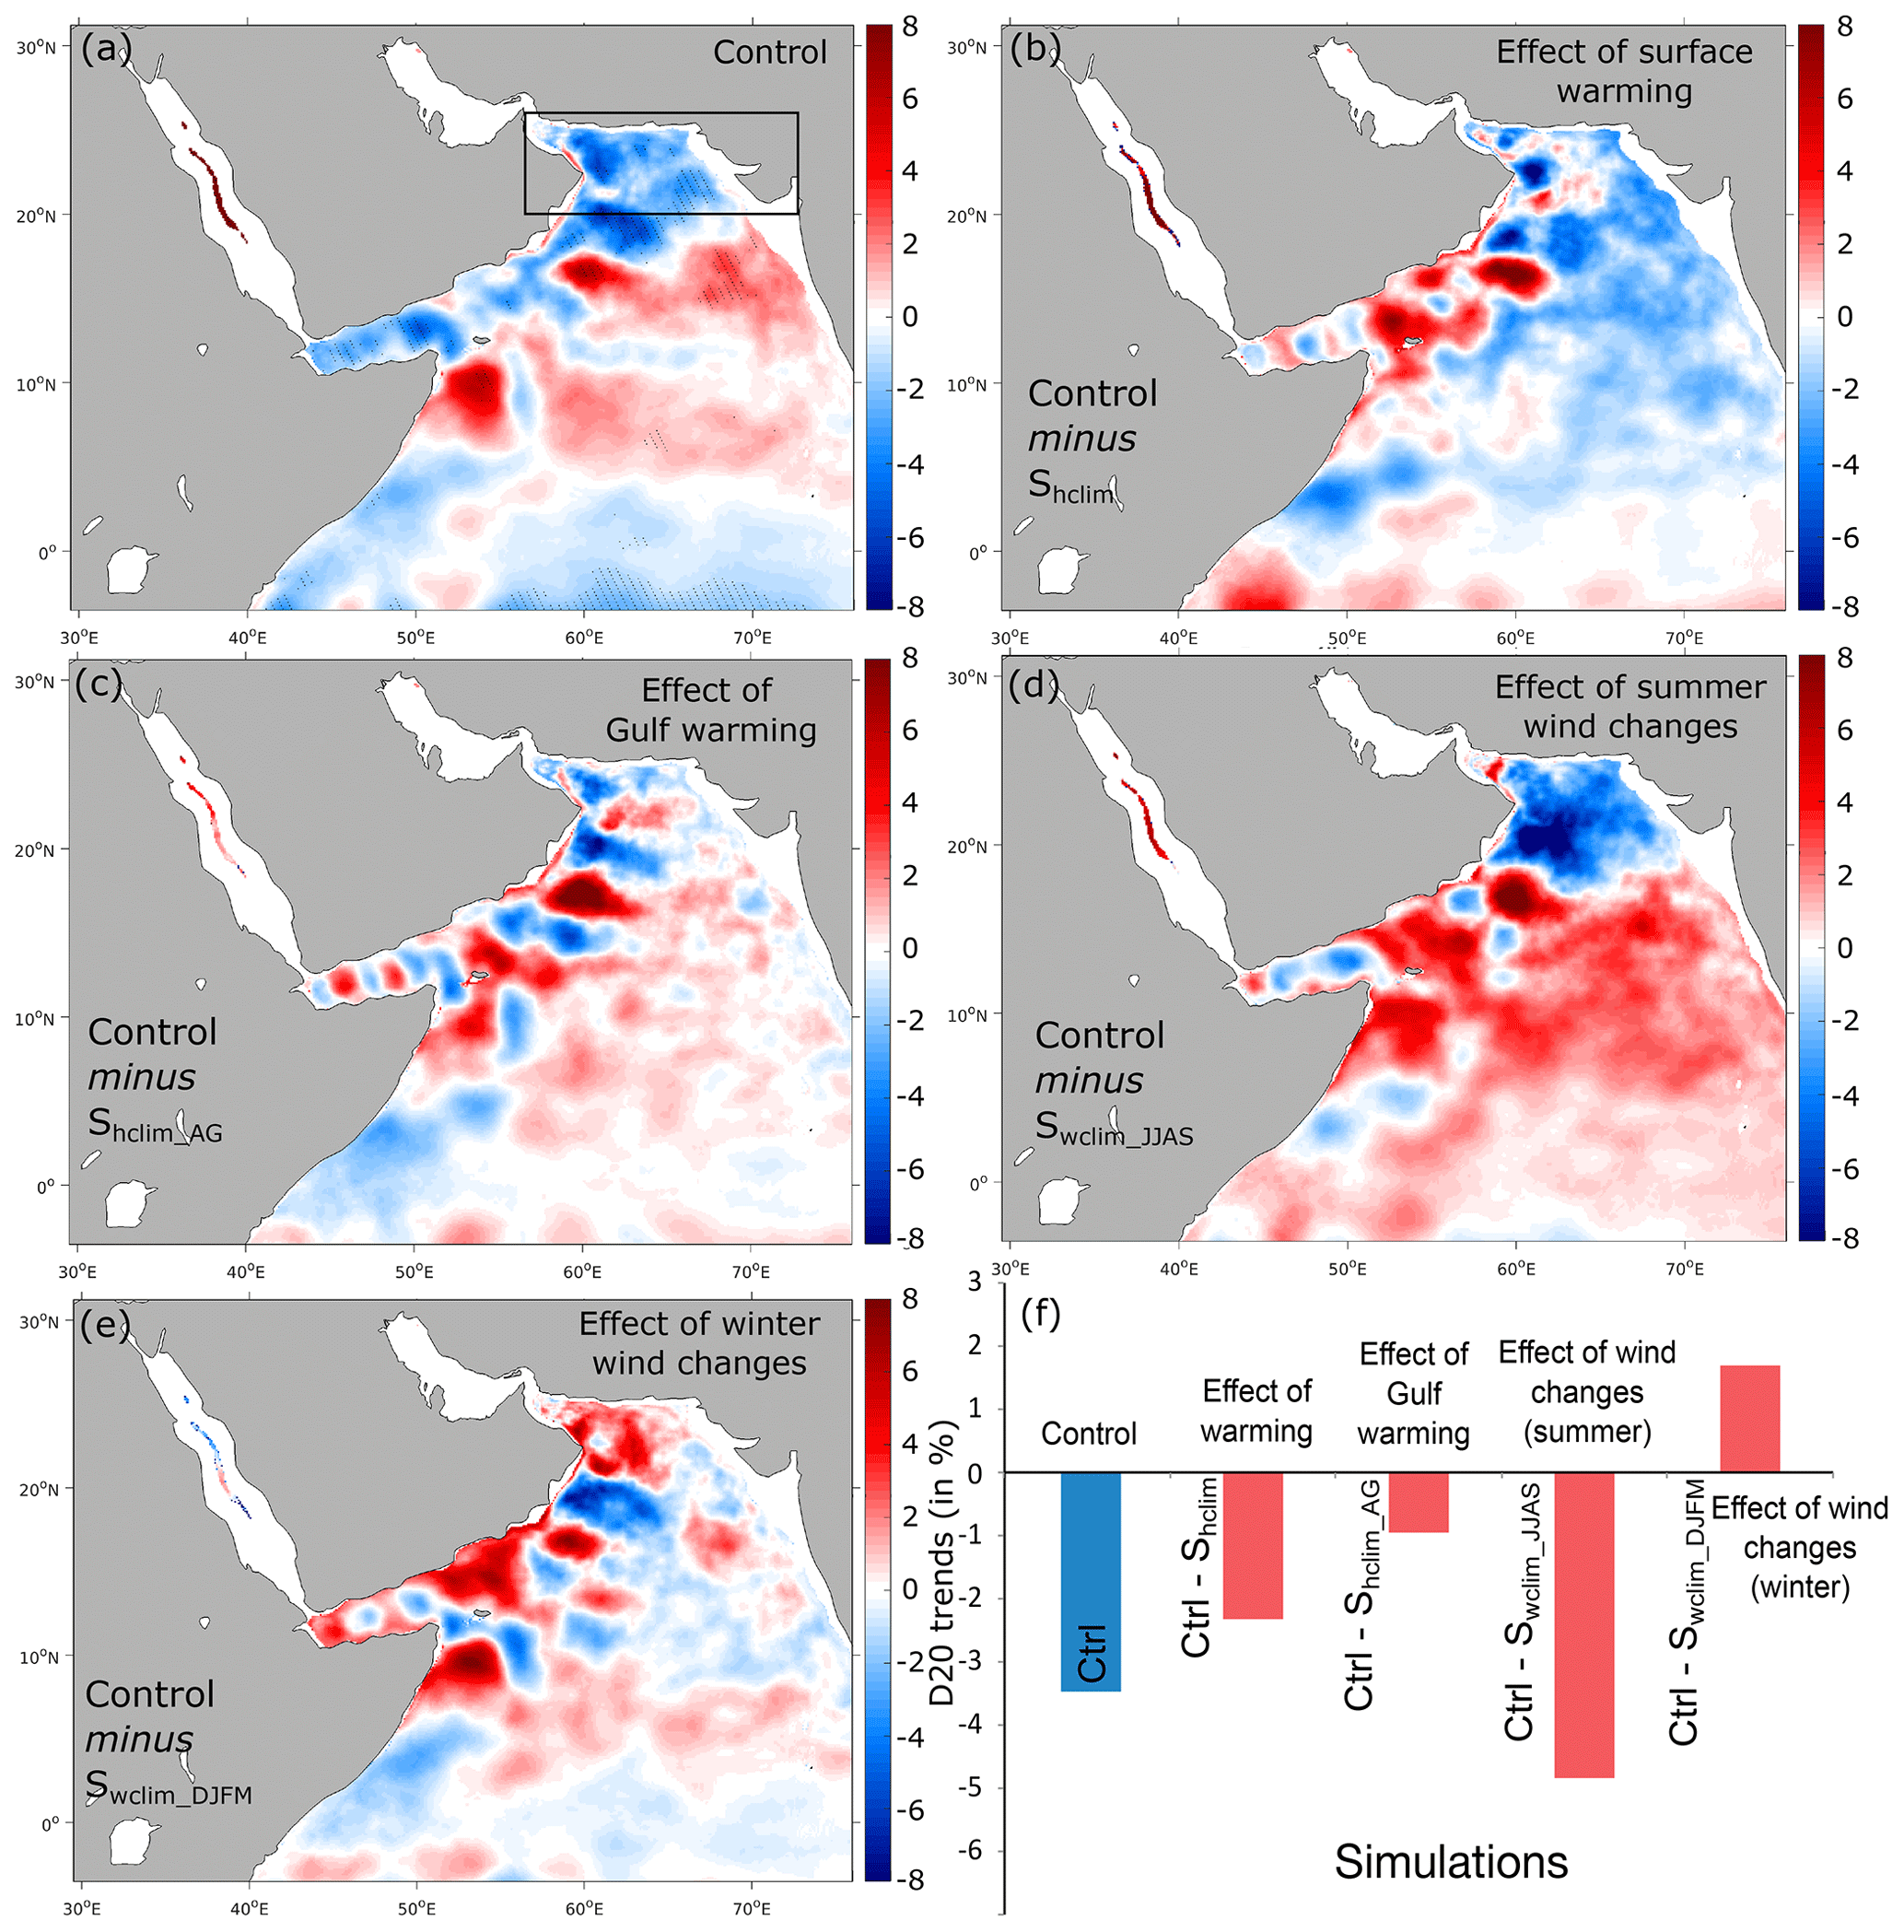
Figure 10Effects of different atmospheric forcing perturbations on thermocline depth. (a) Linear trends in the depth of isotherm 20 ∘C (D20) in the control run (in meters per decade). (b–e) Difference in D20 trends between the control run and the Shclim (i.e., effect of warming), Shclim_AG (i.e., effect of Gulf warming), Swclim_JJAS (i.e., effect of summer wind intensification) and Swclim_DJFM (i.e., effect of winter wind changes) sensitivity simulations (in meters per decade). (f) Difference in D20 trends in the northern AS box between the control and the different sensitivity simulations (in percent of the mean thermocline depth over the 1982–2010 period).
Finally, changes in monsoon winds are likely to affect oxygen levels in the upper ocean through their impact on the thermocline depth and hence the depth of the oxycline. Here we analyze long-term trends in thermocline depth, noted D20 and represented by the depth of isotherm 20 ∘C following previous studies (e.g., Schott et al., 2009). This analysis reveals a shoaling of this interface by over 3 % (around 6 m) in the northern AS between 1982 and 2010 (Fig. 10). Contrasting these trends to those simulated under climatological summer winds shows a strong sensitivity of this parameter to summer monsoon wind intensification. Indeed, under climatological summer monsoon winds the thermocline depth D20 shoals almost everywhere in the AS except in the northern region, where a deepening is simulated (Fig. S21, Supplement). This suggests that summer monsoon wind intensification causes the thermocline depth to rise in the northern AS and deepen elsewhere (Fig. 10). This is likely due to enhanced open-ocean upwelling (Ekman suction) in the north and downwelling (Ekman pumping) in the south (Fig. S24). The shoaling of the thermocline depth contributes to lowering O2 levels in the northern AS upper thermocline, whereas its deepening south of 20∘ N contributes to oxygenation of the upper ocean there. This analysis also shows that changes in winter monsoon winds are associated with a deepening of the thermocline in the northern AS (potentially linked to enhanced downwelling along the west coast of India) that contributes to oxygenation of the upper thermocline (Figs. 2, 10 and S17, Supplement).
In summary, the analysis of the sensitivity simulations suggests that recent deoxygenation in the northern AS has essentially been caused by surface warming, increasing stratification and inhibiting convective vertical mixing as well as increasing the buoyancy of the Gulf water, thus inhibiting its subduction to intermediate depths. The concomitant shoaling of the thermocline in the northern AS driven by summer monsoon wind intensification further contributes to lower O2 in the upper ocean there (see Fig. 11 for a visual depiction of the key mechanisms involved in northern AS recent deoxygenation).
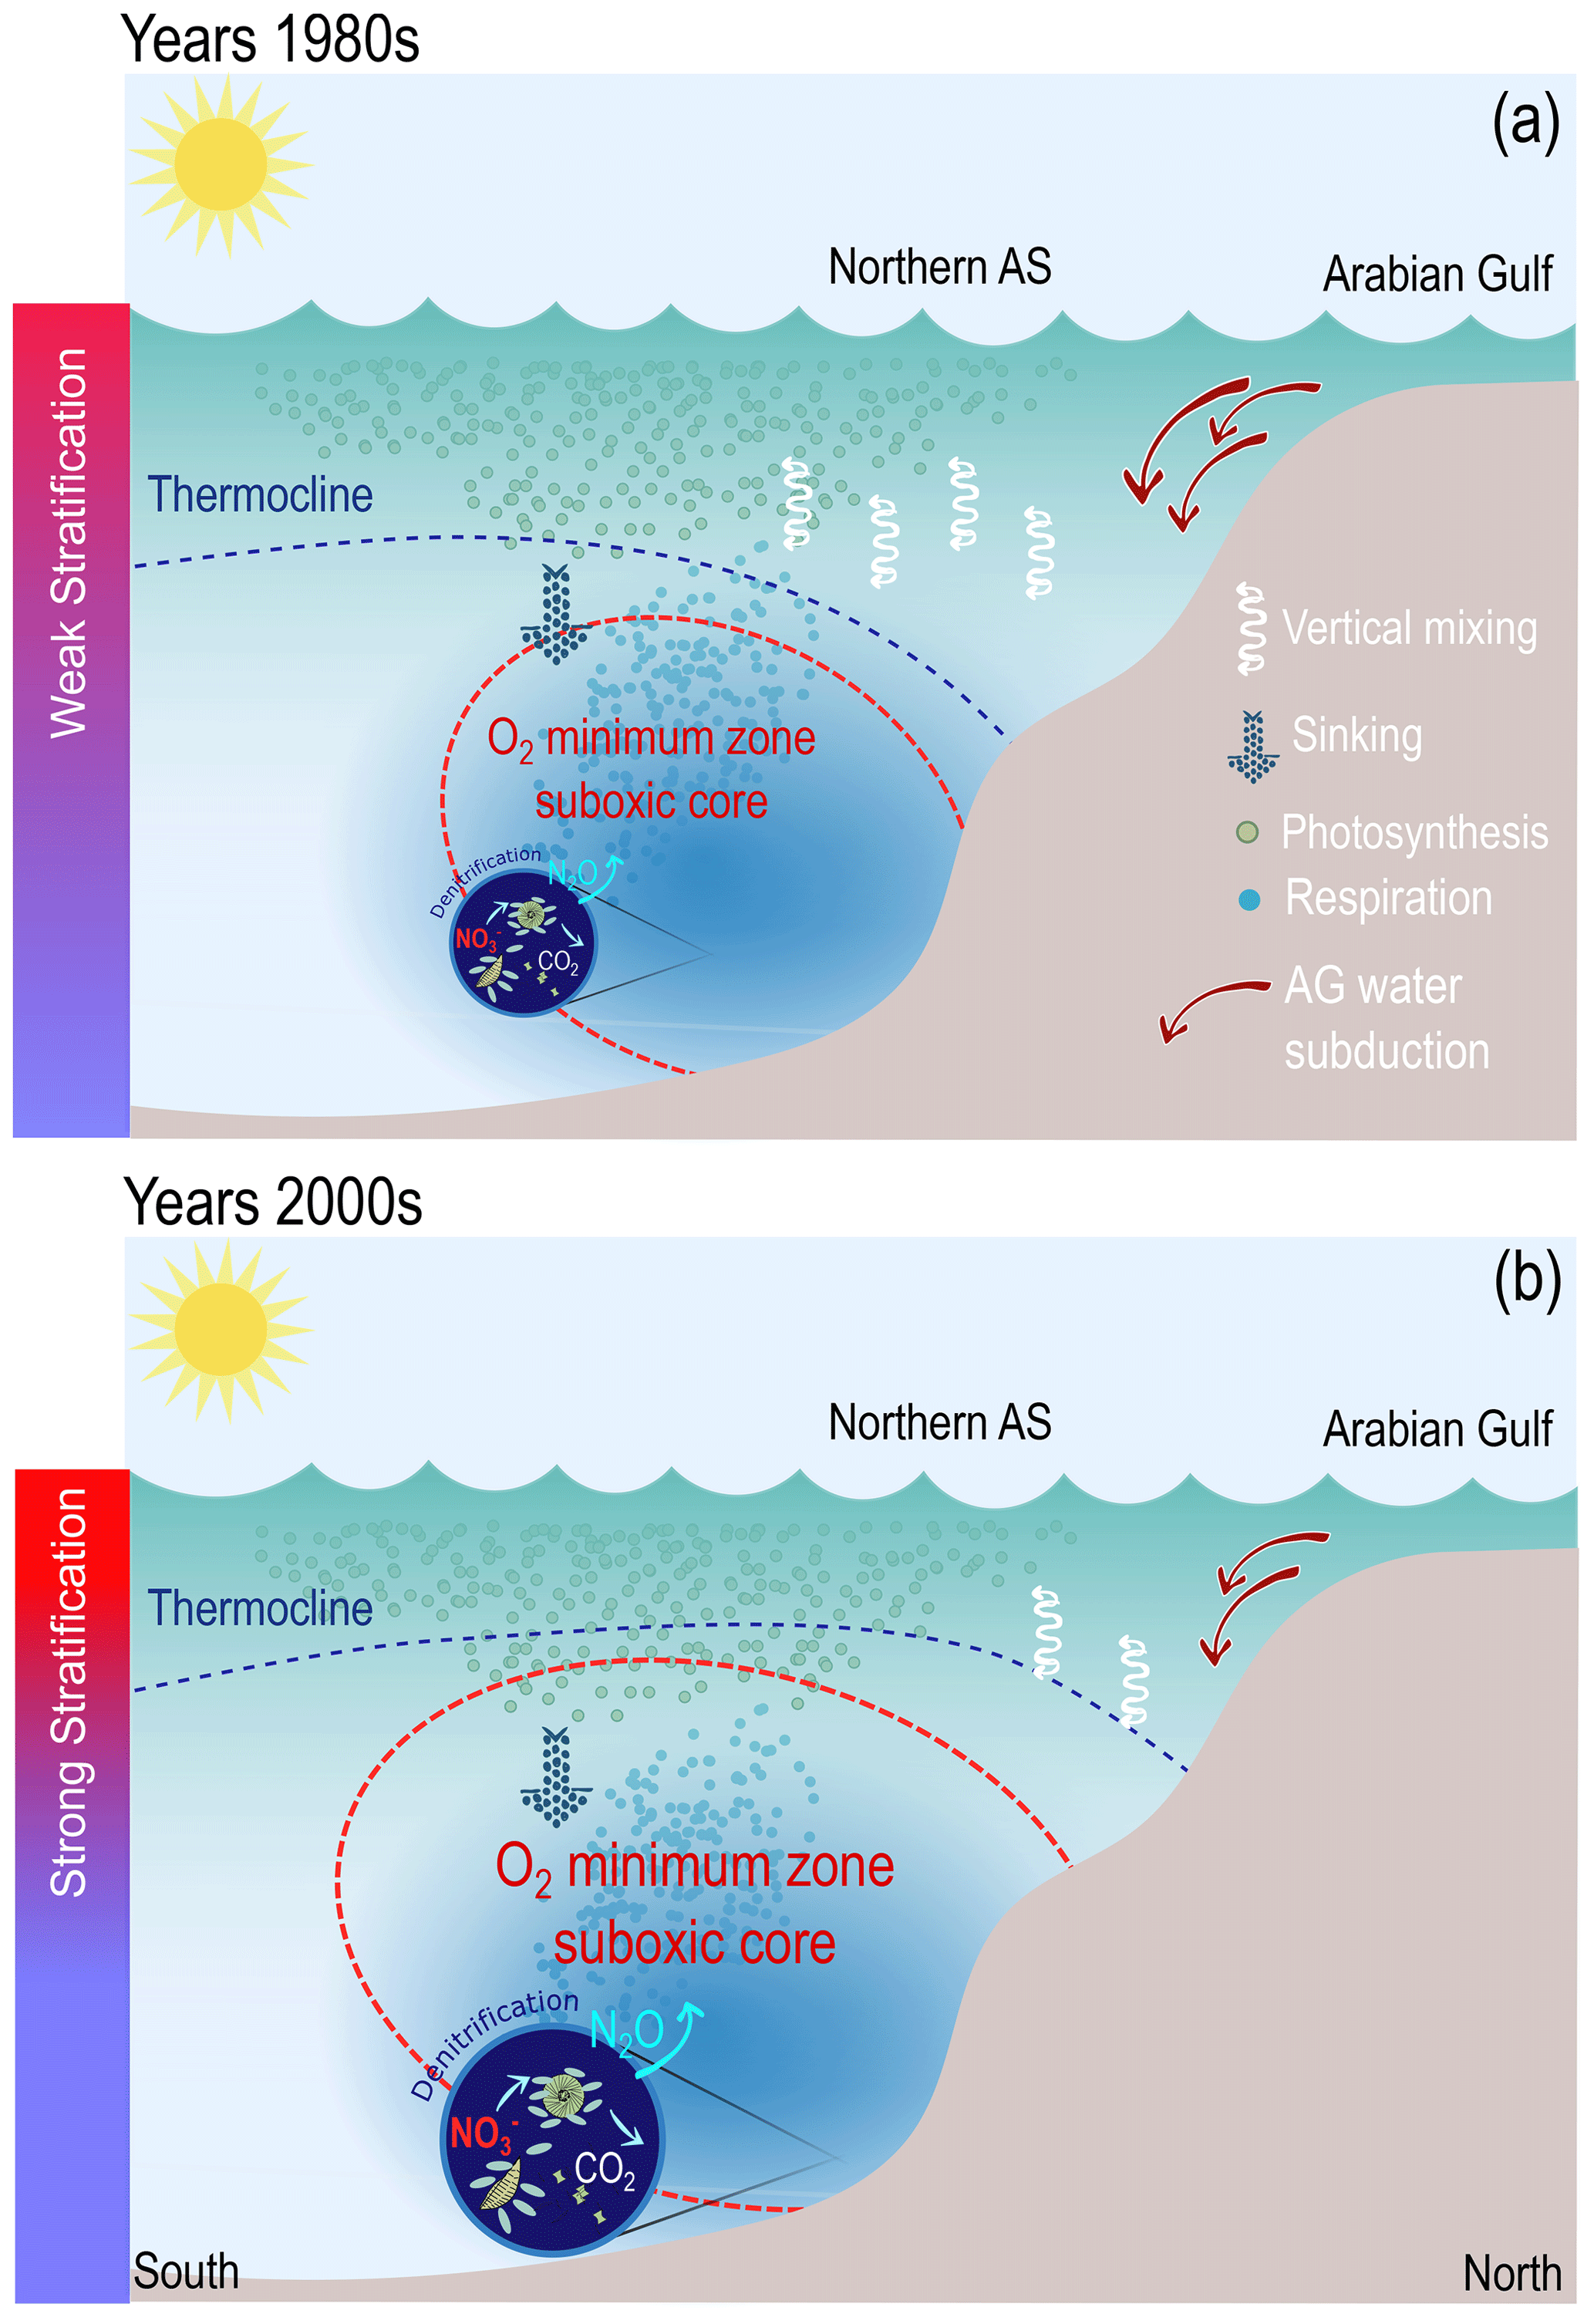
Figure 11A schematic summarizing the main processes responsible for the O2 changes in the northern AS. (a) Conditions in the early 1980s: cool conditions favor weak stratification, enhanced vertical mixing and subduction of high-density Gulf water in the northern Arabian Sea, resulting in a deeper and smaller OMZ suboxic core. (b) Conditions in the early 2000s: warm conditions enhance vertical stratification and cause a weaker vertical mixing and a reduced subduction of the Gulf water in the northern Arabian Sea, resulting in an expansion of the suboxic core of the OMZ and an increase in denitrification. Stronger upwelling-favorable winds also contribute to raise the thermocline depth and hence bring O2-depleted waters upwards further near the surface.
4.1 Role of biology
The relatively limited role of biology in the northern AS deoxygenation is a direct consequence of the minimal change the biological productivity has experienced in the region over the study period as well as due to the negative feedback of enhanced denitrification on O2 consumption at depth. Indeed, the biological productivity has changed little in the northern AS as enhanced stratification on the one hand and increased summer upwelling on the other hand have opposing effects on nutrient supply to the euphotic zone (Fig. 12). For instance, productivity increases substantially in the northern AS and across the domain in the absence of surface warming (Fig. S25, Supplement). Conversely, under climatological summer winds productivity tends to decrease in most of the northern and western AS (Fig. S25, Supplement). Finally, the enhanced denitrification associated with the deoxygenation trends reduces aerobic O2 consumption and hence opposes deoxygenation in the northern AS (Fig. S27, Supplement), a process previously shown to be important for the oxygen budget on long timescales (Oschlies et al., 2019). However, biology appears to play a more important role in the central and western AS as increased summer monsoon winds increase the productivity there (Figs. 12 and S25, Supplement). This productivity enhancement results in an increase in O2 consumption that contributes to the simulated deoxygenation trends in these regions (Figs. S25 and S26, Supplement).
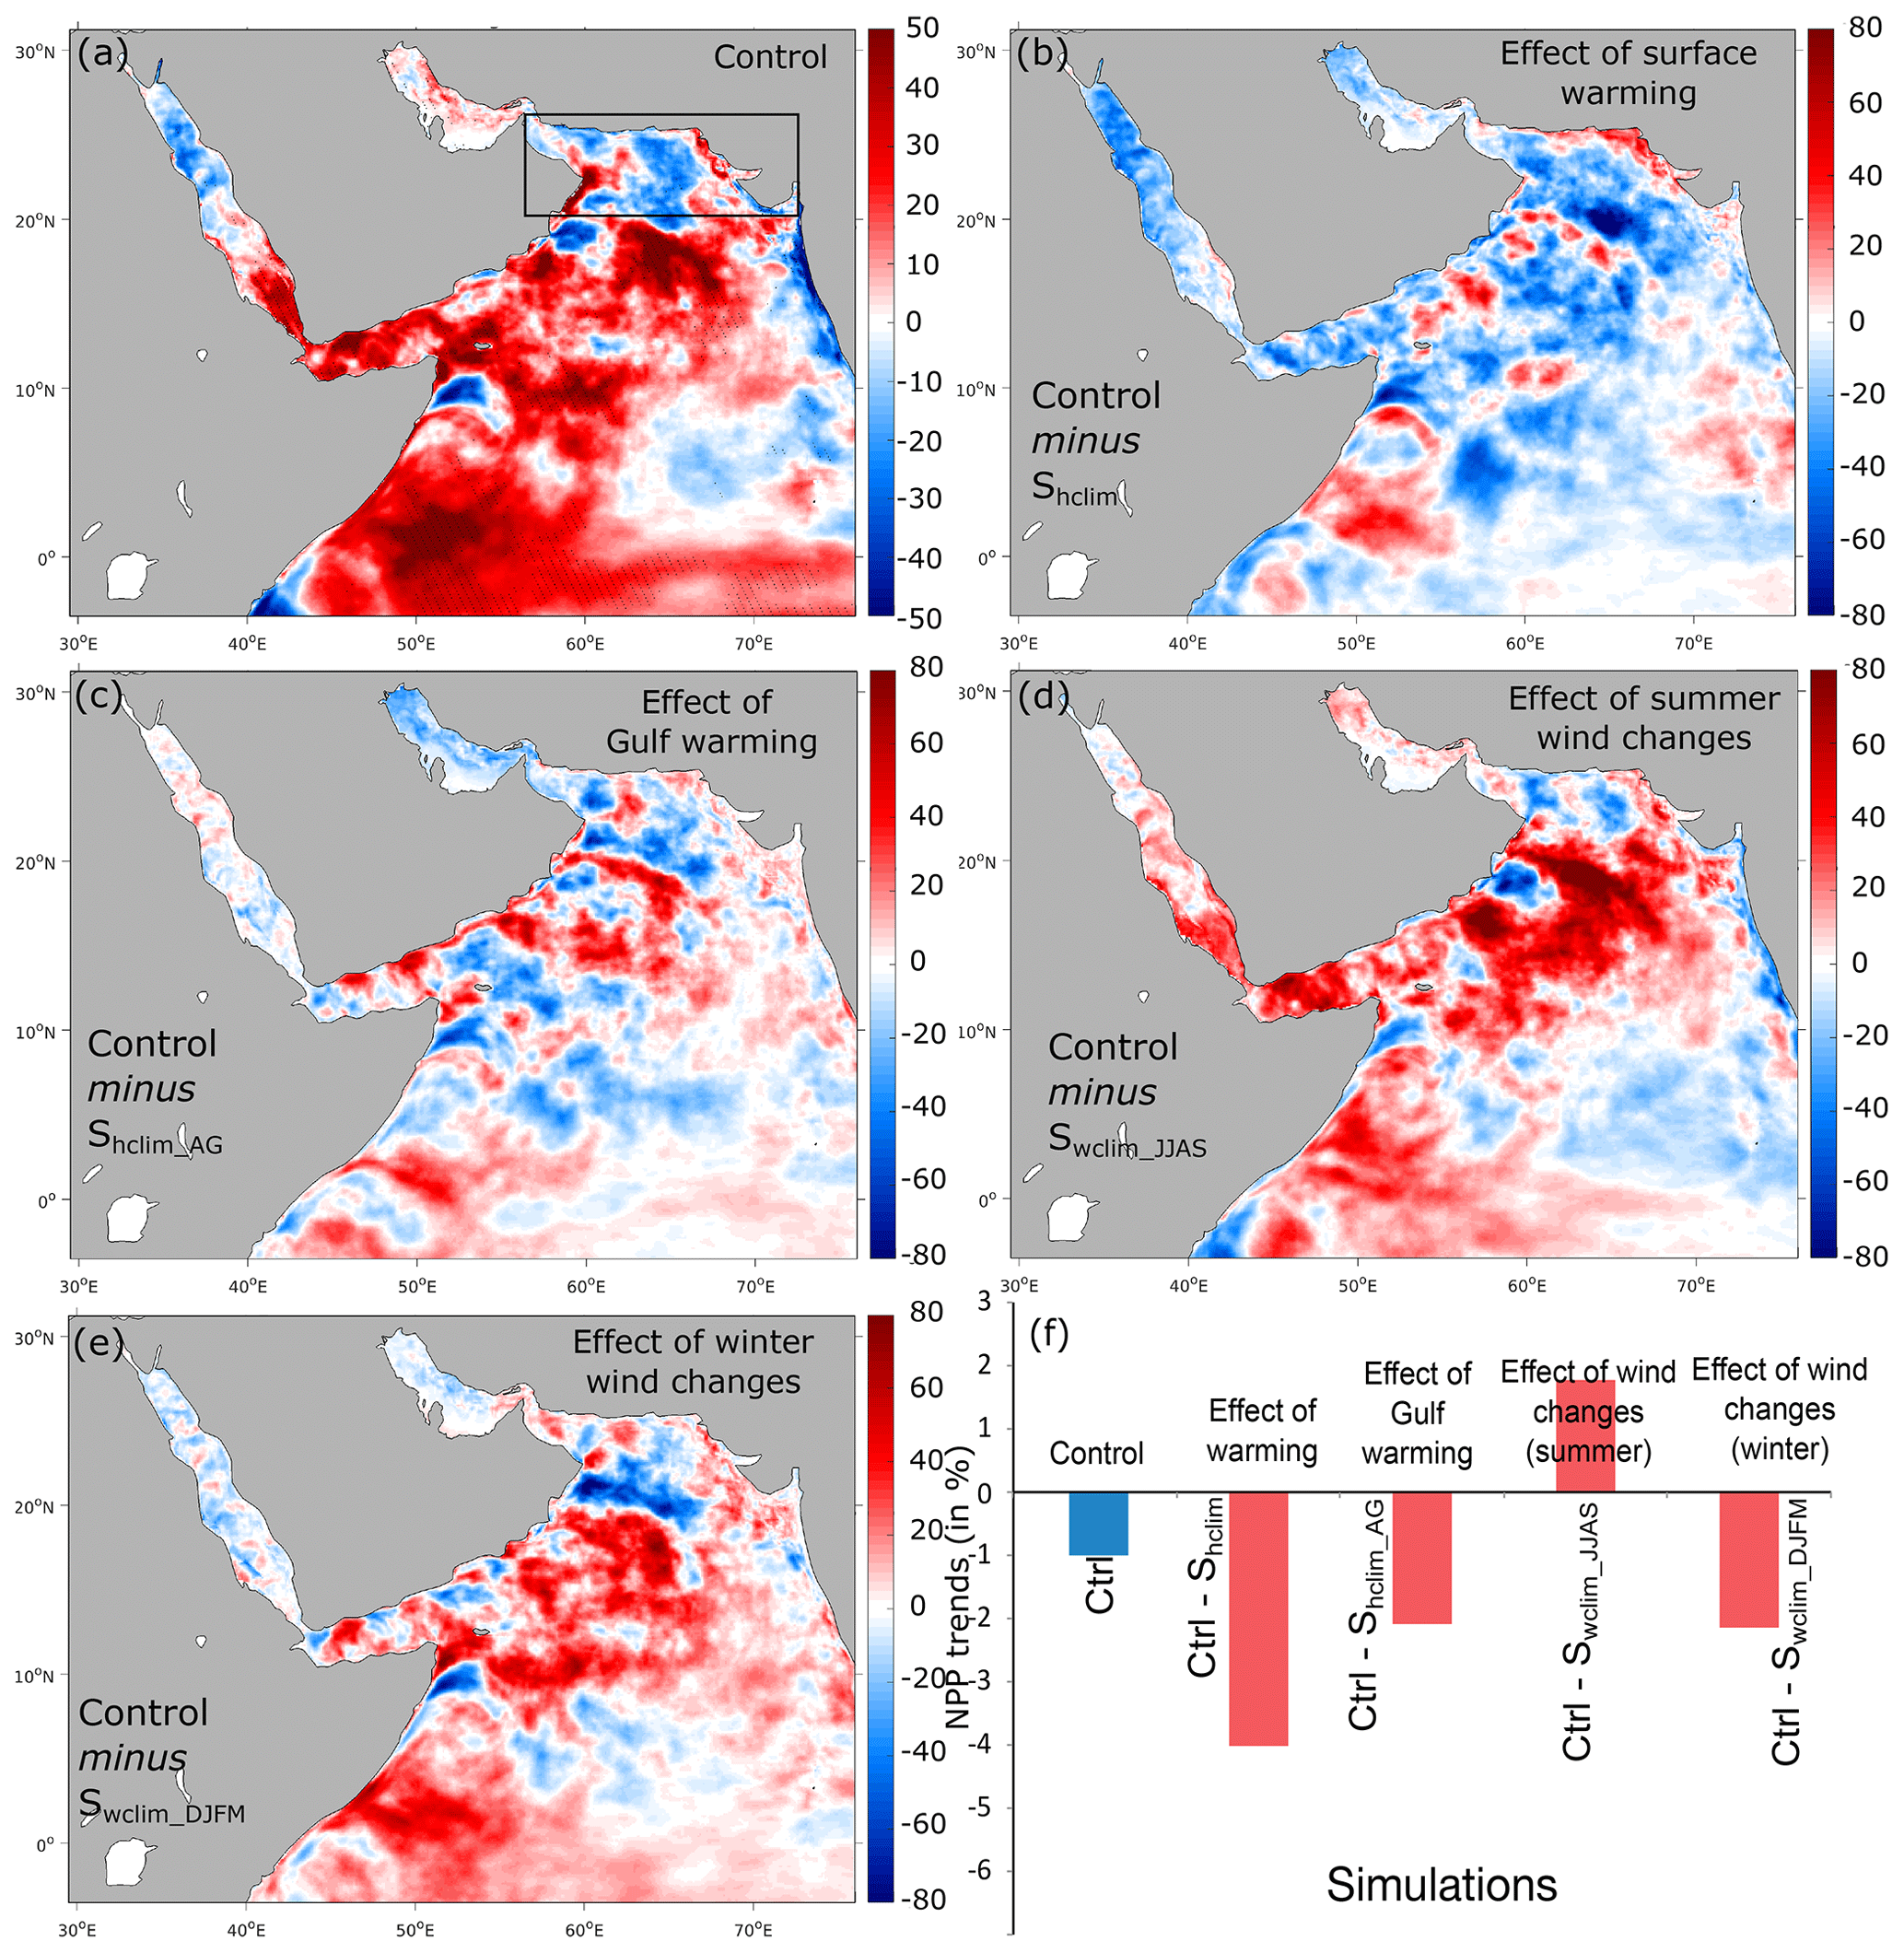
Figure 12Effects of different atmospheric forcing perturbations on net primary production (NPP). (a) Linear trends in NPP in the control run (in mol m−2 yr−1 per decade). (b–e) Difference in NPP trends between the control run and the Shclim (i.e., effect of warming), Shclim_AG (i.e., effect of Gulf warming), Swclim_JJAS (i.e., effect of summer wind intensification) and Swclim_DJFM (i.e., effect of winter wind changes) sensitivity simulations (in mol m−2 yr−1 per decade). (f) Difference in NPP trends in the northern AS box between the control and the different sensitivity simulations (in percent of the mean NPP over the 1982–2010 period).
4.2 Comparison with previous works
Roxy et al. (2016) have reported a decline in surface chlorophyll a over the northern and western AS between 1998 and 2013. This appears to be inconsistent with results from the present study that show very weak NPP trends in the northern AS and even a statistically significant increase in the western Arabian Sea off the coast of Somalia. There are two main differences between our study and the work of Roxy et al. (2016) that may explain this apparent inconsistency. First, in their analysis Roxy and colleagues have considered surface chlorophyll, while we are analyzing trends in vertically integrated biological productivity. While these two quantities are usually strongly correlated, they are not identical, especially in tropical systems where deep chlorophyll maxima are commonly observed. Indeed, the trends in surface chlorophyll in our simulation are quite different and are much weaker in the open ocean in comparison to trends in NPP (Fig. S28, Supplement). The second main difference concerns the study periods. Indeed, the satellite chlorophyll data presented in Roxy et al. (2016) are based on a different and shorter period (1998–2013) than in the present study (1982–2010). Interestingly, our model also simulates a decline in surface chlorophyll in the western Arabian Sea when the analysis is restricted to the period between 1998 and 2010 (Fig. S28, Supplement). We believe the high sensitivity of the trends to the considered period of analysis is an indicator of the strong interannual and decadal variability in the region. This can also be seen in chlorophyll trends based on CMIP models presented in Roxy et al. (2016). Indeed, covering a longer period (1950–2005) these time series reveal strong decadal variability with a decline in surface chlorophyll from the 1950s to the late 1970s followed by no significant trend or even a slight increase over the period from 1980 and 2005.
Our finding that the suboxic volume and denitrification are highly sensitive to deoxygenation is consistent with previous studies that suggest high vulnerability of suboxic zones to small changes in the ocean's O2 content. For instance, the world’s largest suboxic zone in the Pacific Ocean was shown to vary in size by a factor of 2 in model reconstructions of historical oxygen changes (Deutsch et al., 2011). Finally, the weaker sensitivity of the volume of hypoxia to deoxygenation in the AS is consistent with previous studies suggesting a generally weaker sensitivity of the hypoxic volume to deoxygenation. For instance, it was estimated that a decrease in the upper-ocean O2 concentration by 5 mmol m−3 could lead to a tripling of the suboxic volume and only 10 % increase in the hypoxic volume (Deutsch et al., 2011).
4.3 Future deoxygenation in the northern AS
As the AS and the Gulf continue to warm under future climate change, deoxygenation may continue in the northern AS region. Indeed, modeling studies suggest further future ocean deoxygenation in the region. For instance, CMIP5 models project a drop in O2 of up to 20 mmol m−3 in the Sea of Oman in the layer between 200 and 600 m by the end of the century under the RCP8.5 emission scenario (Bopp et al., 2013). The CMIP6 multi-model ensemble average indicates an even stronger oxygen decline of more than 30 mmol m−3 by 2100, in the northern AS between 100 and 600 m, essentially driven by an increase in the AOU (Kwiatkowski et al., 2020). These changes can have dramatic impacts on O2-sensitive species and nitrogen and carbon cycling in the region. Furthermore, the impacts of these O2 changes on marine ecosystems are likely to be exacerbated by concurrent stressors such as warming, declining productivity and ocean acidification (Levin, 2018; Deutsch et al., 2015; Gobler and Baumann, 2016; Miller et al., 2016; Bianchi et al., 2013). In the central and southern AS, however, global model projections show no consistent trends or even a slight oxygenation (Bopp et al., 2013; Kwiatkowski et al., 2020). This may be due to the relatively important future productivity decline these models predict for the western and central AS that may reduce O2 consumption there and compensate for the effect of reduced ventilation.
4.4 Caveats and limitations
Our study has a couple of caveats and limitations. Among the study's main limitations is the relatively short simulation period that precludes the attribution of the documented O2 changes to climate change vs. natural variability. Previous observations suggest that the natural variability in O2, dominated by interannual and decadal oscillations, can locally be stronger than the long-term trends associated with climate warming (Whitney et al., 2007; Cummins and Ross, 2020). Strong modulation of interannual variability in hypoxic and suboxic volumes by decadal oscillations has been documented in previous studies (e.g., Deutsch et al., 2011, 2014). This complicates the detection and attribution of long‐term responses to climate change (Bindoff et al., 2019). Therefore, it is possible that an important fraction of the trends simulated here is associated with natural variability as it has been shown that the emergence of the climate change signal among the internal variability range is generally slow for oxygen, with only a small fraction of the ocean experiencing emergence before the end of the century (Frölicher et al., 2016). According to the same study, the earliest emergence of the O2 signal in the AS is expected to occur only by the middle of the current century, although this may also happen significantly earlier according to other studies (Long et al., 2016; Hameau et al., 2019).
An additional caveat of the study is related to the uncertainty around the recent monsoon wind changes. Indeed, no clear consensus emerges from the different studies that have explored the recent and future wind changes in the region as some point to an intensification (e.g., Wang et al., 2013), whereas others suggest a weakening (e.g., Swapna et al., 2017) or a poleward shift (e.g., Sandeep and Ajayamohan, 2015). Some of this uncertainty may be associated with the strong decadal variability that modulates the surface winds in the region and may lead to aliasing of long-term trends. An additional source of uncertainty is the lack of observations in the AS region that results in reanalyses that are not very well constrained. To test this, we contrast the trends in surface winds estimated over the study period (1982–2010) from three reanalysis products: ERA-Interim (here used to force the model), the National Centers for Environmental Prediction reanalysis II (NCEP-2) and the Japanese 55-year Reanalysis Project (JRA-55). This comparison reveals important discrepancies among the three products (Fig. S29, Supplement). Indeed, while the NCEP2 winds show a modest increase in upwelling-favorable winds in the western Arabian Sea, there seems to be no such an increase (and even a slight weakening) in the JRA-55 winds. While we acknowledge this uncertainty as one of the caveats of the study, we also believe this has likely limited implications for the conclusions of the study as we demonstrate here that surface warming is the dominant factor in the northern Arabian Sea deoxygenation, with the surface wind changes playing only a secondary role.
Other limitations of the study pertain to the biogeochemical model assumptions and model forcing. For instance, the lack of a representation of some major limiting nutrients such as iron, silicate and phosphate can potentially cause biases in regions where these nutrients contribute to limit biological production (e.g., off Somalia). However, previous studies suggest that nitrogen is the main limiting nutrient in the Indian Ocean at larger scales (Koné et al., 2009). Other major model-related limitations concern the lack of representation of important biogeochemical processes such as N2 fixation and the crude representation of microbial respiration in the model. Yet, on the one hand recent studies suggest that N2 fixation has a limited effect on the AS OMZ as it constitutes only a negligible proportion of new nitrogen there (Guieu et al., 2019). On the other hand, simple representations of microbial respiration that miss potentially important biogeochemical feedback are a common problem in most existing biogeochemical models (Oschlies et al., 2018; Robinson, 2019). Additional work that combines expanding the current oxygen measurement system and improving the complexity of microbial respiration in numerical models is needed to reduce biases in model estimates of deoxygenation (Oschlies et al., 2018). Finally, as the model lateral boundary conditions for nitrate and oxygen were set to be climatological, the effects of potential changes in either O2 or NO at the domain southern boundary at 31∘ S are not taken into account. Previous studies (e.g., Keller et al., 2016; Fu et al., 2018) have shown that remote biological processes in the Southern Ocean can significantly affect oxygen levels and OMZs in the tropics either through trapping of nutrients in the Southern Ocean or through changes in O2 levels of locally formed mode and intermediate waters. However, these remote influences have been shown to affect oxygen in the tropics (including the Arabian Sea OMZ region) only on timescales of several decades to centuries (Keller et al., 2016). Therefore, given the short time period considered in the present study we believe the lack of interannual variability at the domain lateral boundaries to have limited impact on our results.
We reconstruct the evolution of dissolved oxygen in the AS from 1982 through 2010 using a series of hindcast simulations performed with an eddy-resolving ocean biogeochemical model forced with ERA-Interim atmospheric reanalysis. We find a significant thermocline deoxygenation in the northern AS, with the ocean O2 content dropping by over 6 % per decade in the 100–1000 m layer. These changes are accompanied by a statistically significant increase in the volume of suboxia (O2<4 mmol m−3) and denitrification by up to 30 % and 40 % over the study period, respectively. Using a set of sensitivity simulations we demonstrate that deoxygenation in the northern AS has been caused essentially by a widespread warming of the sea surface, in particular in the Gulf, causing a reduction in the ventilation of the subsurface and intermediate layers. Additionally, we show that a concomitant summer monsoon intensification over the study period has enhanced the ventilation and hence the oxygenation of the upper ocean south of 20∘ N but has contributed to deoxygenation in the northern AS. This is because, on the one hand, surface warming (i) increases vertical stratification, thus reducing vertical mixing, and (ii) increases the Gulf water buoyancy, inhibiting its subduction to intermediate depths. On the other hand, summer monsoon wind intensification causes the thermocline depth to rise in the northern AS and deepen elsewhere, thus contributing to lowering O2 levels in the upper layers north of 20∘ N and increasing it in the rest of the AS. Our findings confirm that the AS OMZ is strongly sensitive to upper-ocean warming and concurrent changes in the Indian monsoon winds. Our results also demonstrate that changes in the local climatic forcing play a key role in regional dissolved oxygen changes and hence need to be properly represented in global models to reduce uncertainties in future projections of deoxygenation.
The ROMS model code is provided by https://www.croco-ocean.org (last access: 1 January 2018).
Drifter climatology data can be downloaded from the Global Drifter Program at https://www.aoml.noaa.gov/phod/gdp/mean_velocity.php (last access: 1 August 2021). ECMWF ERA-Interim data are available online at https://www.ecmwf.int/en/forecasts/datasets/reanalysis-datasets/era-interim (last access: 1 August 2021). ECMWF ERA5 SST can be downloaded from https://cds.climate.copernicus.eu/cdsapp#!/dataset/satellite-sea-surface-temperature?tab=form (last access: 1 August 2021). SeaWiFS and other sensor-merged satellite chlorophyll data were provided by the Copernicus Marine Environment Monitoring Service (CMEMS) and can be obtained from https://resources.marine.copernicus.eu/product-detail/OCEANCOLOUR_GLO_CHL_L4_REP_OBSERVATIONS_009_082/INFORMATION (last access: 1 August 2021). HadISST data can be downloaded from https://www.metoffice.gov.uk/hadobs/hadisst/data/download.html (last access: 1 August 2021). JRA-55 data can be accessed at https://rda.ucar.edu/datasets/ds628.1/#!access (last access: 1 August 2021). NCEP-2 data are available online at https://psl.noaa.gov/data/gridded/data.ncep.reanalysis2.gaussian.html (last access: 1 August 2021). NOAA OISST can be obtained from https://www.ncei.noaa.gov/thredds/catalog/OisstBase/NetCDF/V2.1/AVHRR/catalog.html (last access: 1 August 2021). ORAS5 data can be downloaded from https://www.ecmwf.int/en/forecasts/dataset/ocean-reanalysis-system-5 (last access: 1 August 2021). SODA reanalysis data can be downloaded from http://apdrc.soest.hawaii.edu/datadoc/soda_2.2.4.php (last access: 1 August 2021). WOA13 data can be accessed at https://www.nodc.noaa.gov/OC5/woa13/ (last access: 1 August 2021). WOA18 data can be downloaded from https://www.nodc.noaa.gov/OC5/SELECT/woaselect/woaselect.html (last access: 1 August 2021). Finally, WOD18 data can be obtained from https://www.ncei.noaa.gov/access/world-ocean-database-select/dbsearch.html (last access: 1 August 2021).
The supplement related to this article is available online at: https://doi.org/10.5194/bg-18-5831-2021-supplement.
ZL conceived and designed the study. MM and MAA performed the simulations and carried out the model output analysis. ZL wrote the manuscript with contributions from all co-authors.
The authors declare that they have no conflict of interest.
Publisher’s note: Copernicus Publications remains neutral with regard to jurisdictional claims in published maps and institutional affiliations.
Support for this research has come from the Center for Prototype Climate Modeling (CPCM) of the New York University Abu Dhabi (NYUAD) Research Institute. Computations were performed at the NYUAD High-Performance Computing (HPC) cluster, Dalma. We thank the NYUAD HPC team for technical support. The authors are also grateful to Matthieu Lengaigne and the two anonymous reviewers for their constructive comments that helped improve the paper.
This paper was edited by Marilaure Grégoire and reviewed by Matthieu Lengaigne and two anonymous referees.
Al-Ansari, E. M., Rowe, G., Abdel-Moati, M., Yigiterhan, O., Al-Maslamani, I., Al-Yafei, M., Al-Shaikh, I., and Upstill-Goddard, R.: Hypoxia in the central Arabian Gulf Exclusive Economic Zone (EEZ) of Qatar during summer season, Estuarine, Coast. Shelf Sci., 159, 60–68, 2015. a
Al-Rashidi, T. B., El-Gamily, H. I., Amos, C. L., and Rakha, K. A.: Sea surface temperature trends in Kuwait bay, Arabian Gulf, Nat. Hazard., 50, 73–82, 2009. a
Al-Yamani, F. and Naqvi, S.: Chemical oceanography of the Arabian Gulf, Deep-Sea Res. Pt. II, 161, 72–80, 2019. a
Bange, H. W., Naqvi, S. W. A., and Codispoti, L.: The nitrogen cycle in the Arabian Sea, Prog. Oceanogr., 65, 145–158, 2005. a
Banse, K., Naqvi, S. W. A., Narvekar, P. V., Postel, J. R., and Jayakumar, D. A.: Oxygen minimum zone of the open Arabian Sea: variability of oxygen and nitrite from daily to decadal timescales, Biogeosciences, 11, 2237–2261, https://doi.org/10.5194/bg-11-2237-2014, 2014. a
Barnier, B., Siefridt, L., and Marchesiello, P.: Thermal forcing for a global ocean circulation model using a three-year climatology of ECMWF analyses, J. Mar. Syst., 6, 363–380, 1995. a
Bianchi, D., Galbraith, E. D., Carozza, D. A., Mislan, K., and Stock, C. A.: Intensification of open-ocean oxygen depletion by vertically migrating animals, Nat. Geosci., 6, 545–548, 2013. a
Bindoff, N. L., Cheung, W. W. L., Kairo, J. G., Arístegui, J., Guinder, V. A., Hallberg, R., Hilmi, N., Jiao, N., Karim, M. S., Levin, L., O’Donoghue, S., Purca Cuicapusa, S. R., Rinkevich, B., Suga, T., Tagliabue, A., and Williamson, P., 2019: Changing Ocean, Marine Ecosystems, and Dependent Communities, in: IPCC Special Report on the Ocean and Cryosphere in a Changing Climate, edited by: Pörtner, H.-O., Roberts, D.C., Masson-Delmotte, V., Zhai, P., Tignor, M., Poloczanska, E., Mintenbeck, K., Alegría, A., Nicolai, M., Okem, A., Petzold, J., Rama, B., and Weyer, N. M., 447–588, 2019. a, b, c, d, e
Bograd, S. J., Buil, M. P., Di Lorenzo, E., Castro, C. G., Schroeder, I. D., Goericke, R., Anderson, C. R., Benitez-Nelson, C., and Whitney, F. A.: Changes in source waters to the Southern California Bight, Deep-Sea Res. Pt. II, 112, 42–52, 2015. a
Bopp, L., Resplandy, L., Orr, J. C., Doney, S. C., Dunne, J. P., Gehlen, M., Halloran, P., Heinze, C., Ilyina, T., Séférian, R., Tjiputra, J., and Vichi, M.: Multiple stressors of ocean ecosystems in the 21st century: projections with CMIP5 models, Biogeosciences, 10, 6225–6245, https://doi.org/10.5194/bg-10-6225-2013, 2013. a, b
Boyer, T. P., Baranova, O. K., Coleman, C., Garcia, H. E., Grodsky, A., Locarnini, R. A., A., Mishonov, V., Paver, C. R., Reagan, J. R., Seidov, D., Smolyar, I. V., Weathers, K., and Zweng, M. M.: World Ocean Database 2018, A. V. Mishonov, Technical Editor, NOAA Atlas NESDIS 87, available at: https://www.ncei.noaa (last access: 1 August 2021), 2019. a
Breitburg, D., Levin, L. A., Oschlies, A., Grégoire, M., Chavez, F. P., Conley, D. J., Garçon, V., Gilbert, D., Gutiérrez, D., Isensee, K., Jacinto, G. S., Limburg, K. E., Montes, I., Naqvi, S. W. A., Pitcher, G. C., Rabalais, N. N., Roman, M. R., Rose, K. A., and Seibel, B. A.: Declining oxygen in the global ocean and coastal waters, Science, 359, 6371, https://doi.org/10.1126/science.aam7240, 2018. a
Burt, J. A., Paparella, F., Al-Mansoori, N., Al-Mansoori, A., and Al-Jailani, H.: Causes and consequences of the 2017 coral bleaching event in the southern Persian/Arabian Gulf, Coral Reefs, 38, 567–589, 2019. a
Carton, J. A. and Giese, B. S.: A reanalysis of ocean climate using Simple Ocean Data Assimilation (SODA), Mon. Weather Rev., 136, 2999–3017, 2008. a
Chaidez, V., Dreano, D., Agusti, S., Duarte, C. M., and Hoteit, I.: Decadal trends in Red Sea maximum surface temperature, Sci. Rep., 7, 1–8, 2017. a
Codispoti, L., Brandes, J. A., Christensen, J., Devol, A., Naqvi, S., Paerl, H. W., and Yoshinari, T.: The oceanic fixed nitrogen and nitrous oxide budgets: Moving targets as we enter the anthropocene?, Sci. Mar., 65, 85–105, 2001. a
Cummins, P. F. and Ross, T.: Secular trends in water properties at Station P in the northeast Pacific: an updated analysis, Prog. Oceanogr., 186, 102329, https://doi.org/10.1016/j.pocean.2020.102329, 2020. a
Dai, A. and Trenberth, K. E.: Estimates of freshwater discharge from continents: Latitudinal and seasonal variations, J. Hydrometeorol., 3, 660–687, 2002. a
deCastro, M., Sousa, M., Santos, F., Dias, J., and Gómez-Gesteira, M.: How will Somali coastal upwelling evolve under future warming scenarios?, Sci. Rep., 6, 1–9, 2016. a
Deutsch, C., Brix, H., Ito, T., Frenzel, H., and Thompson, L.: Climate-forced variability of ocean hypoxia, Science, 333, 336–339, 2011. a, b, c, d
Deutsch, C., Berelson, W., Thunell, R., Weber, T., Tems, C., McManus, J., Crusius, J., Ito, T., Baumgartner, T., Ferreira, V., Mey, J., and van Geen, A.: Centennial changes in North Pacific anoxia linked to tropical trade winds, Science, 345, 665–668, 2014. a
Deutsch, C., Ferrel, A., Seibel, B., Pörtner, H.-O., and Huey, R. B.: Climate change tightens a metabolic constraint on marine habitats, Science, 348, 1132–1135, 2015. a
do Rosário Gomes, H., Goes, J. I., Matondkar, S. P., Buskey, E. J., Basu, S., Parab, S., and Thoppil, P.: Massive outbreaks of Noctiluca scintillans blooms in the Arabian Sea due to spread of hypoxia, Nat. Commun., 5, 1–8, 2014. a
Frölicher, T. L., Rodgers, K. B., Stock, C. A., and Cheung, W. W.: Sources of uncertainties in 21st century projections of potential ocean ecosystem stressors, Global Biogeochem. Cy., 30, 1224–1243, 2016. a
Fu, W., Primeau, F., Keith Moore, J., Lindsay, K., and Randerson, J. T.: Reversal of increasing tropical ocean hypoxia trends with sustained climate warming, Global Biogeochem. Cy., 32, 551–564, 2018. a
Garcia, H. E. and Gordon, L. I.: Oxygen solubility in seawater: Better fitting equations, Limnol. Oceanogr., 37, 1307–1312, 1992. a
Garcia, H. E., Locarnini, R. A., Boyer, T. P., Antonov, J. I., Baranova, O. K., Zweng, M. M., Reagan, J. R., and Johnson, D. R.: World Ocean Atlas 2013, Vol. 3, Dissolved Oxygen, Apparent Oxygen Utilization, and Oxygen Saturation, edited by: Levitus, S., A. Mishonov Technical Ed., NOAA Atlas NESDIS 75, 27 pp., 2014a. a
Garcia, H. E., Locarnini, R. A., Boyer, T. P., Antonov, J. I., Baranova, O.K., Zweng, M. M., Reagan, J. R., and Johnson, D. R.: World Ocean Atlas 2013, Vol. 4, Dissolved Inorganic Nutrients (phosphate, nitrate, silicate), edied by: Levitus, S., A. Mishonov Technical Ed., NOAA Atlas NESDIS 76, 25 pp., 2014b. a
Gobler, C. J. and Baumann, H.: Hypoxia and acidification in ocean ecosystems: coupled dynamics and effects on marine life, Biol. Lett., 12, 20150976, https://doi.org/10.1098/rsbl.2015.0976, 2016. a
Goes, J. I., Tian, H., do Rosario Gomes, H., Anderson, O. R., Al-Hashmi, K., deRada, S., Luo, H., Al-Kharusi, L., Al-Azri, A., and Martinson, D. G.: Ecosystem state change in the Arabian Sea fuelled by the recent loss of snow over the Himalayan-Tibetan plateau region, Sci. Rep., 10, 1–8, 2020. a, b
Gopika, S., Izumo, T., Vialard, J., Lengaigne, M., Suresh, I., and Kumar, M. R.: Aliasing of the Indian Ocean externally-forced warming spatial pattern by internal climate variability, Clim. Dynam., 54, 1093–1111, 2020. a
Griffies, S. M., Danabasoglu, G., Durack, P. J., Adcroft, A. J., Balaji, V., Böning, C. W., Chassignet, E. P., Curchitser, E., Deshayes, J., Drange, H., Fox-Kemper, B., Gleckler, P. J., Gregory, J. M., Haak, H., Hallberg, R. W., Heimbach, P., Hewitt, H. T., Holland, D. M., Ilyina, T., Jungclaus, J. H., Komuro, Y., Krasting, J. P., Large, W. G., Marsland, S. J., Masina, S., McDougall, T. J., Nurser, A. J. G., Orr, J. C., Pirani, A., Qiao, F., Stouffer, R. J., Taylor, K. E., Treguier, A. M., Tsujino, H., Uotila, P., Valdivieso, M., Wang, Q., Winton, M., and Yeager, S. G.: OMIP contribution to CMIP6: experimental and diagnostic protocol for the physical component of the Ocean Model Intercomparison Project, Geosci. Model Dev., 9, 3231–3296, https://doi.org/10.5194/gmd-9-3231-2016, 2016. a
Gruber, N., Frenzel, H., Doney, S. C., Marchesiello, P., McWilliams, J. C., Moisan, J. R., Oram, J. J., Plattner, G.-K., and Stolzenbach, K. D.: Eddy-resolving simulation of plankton ecosystem dynamics in the California Current System, Deep-Sea Res. Pt. I, 53, 1483–1516, 2006. a
Guieu, C., Al Azhar, M., Aumont, O., Mahowald, N., Lévy, M., Éthé, C., and Lachkar, Z.: Major impact of dust deposition on the productivity of the Arabian Sea, Geophys. Res. Lett., 46, 6736–6744, 2019. a
Hameau, A., Mignot, J., and Joos, F.: Assessment of time of emergence of anthropogenic deoxygenation and warming: insights from a CESM simulation from 850 to 2100 CE, Biogeosciences, 16, 1755–1780, https://doi.org/10.5194/bg-16-1755-2019, 2019. a
Huang, B., Liu, C., Banzon, V., Freeman, E., Graham, G., Hankins, B., Smith, T., and Zhang, H.-M.: Improvements of the daily optimum interpolation sea surface temperature (DOISST) version 2.1, J. Clim., 34, 2923–2939, 2021. a
Ito, T., Minobe, S., Long, M. C., and Deutsch, C.: Upper ocean O2 trends: 1958–2015, Geophys. Res. Lett., 44, 4214–4223, 2017. a, b
Keller, D. P., Kriest, I., Koeve, W., and Oschlies, A.: Southern Ocean biological impacts on global ocean oxygen, Geophys. Res. Lett., 43, 6469–6477, 2016. a, b
Kendall, M. G.: Rank correlation methods, 4th Edn., Griffin, London, 160 pp., 1948. a
Koné, V., Aumont, O., Lévy, M., and Resplandy, L.: Physical and biogeochemical controls of the phytoplankton seasonal cycle in the Indian Ocean: a modeling study, in: Indian Ocean Biogeochemical Processes and Ecological Variability, edited by: Wiggert, J. D., Hood, R. R., Wajih, S., Naqvi, A., Brink, K. H., and Smith, S. L., Washington, DC, American Geophysical Union, Geophysical Monograph no. 185, 147–66, https://doi.org/10.1029/2008GM000700, 2009. a
Krishna, M., Prasad, M., Rao, D., Viswanadham, R., Sarma, V., and Reddy, N.: Export of dissolved inorganic nutrients to the northern Indian Ocean from the Indian monsoonal rivers during discharge period, Geochim. Cosmochim. Ac., 172, 430–443, 2016. a
Kumar, S. P., Roshin, R. P., Narvekar, J., Kumar, P. D., and Vivekanandan, E.: Response of the Arabian Sea to global warming and associated regional climate shift, Mar. Environ. Res., 68, 217–222, 2009. a
Kwiatkowski, L., Torres, O., Bopp, L., Aumont, O., Chamberlain, M., Christian, J. R., Dunne, J. P., Gehlen, M., Ilyina, T., John, J. G., Lenton, A., Li, H., Lovenduski, N. S., Orr, J. C., Palmieri, J., Santana-Falcón, Y., Schwinger, J., Séférian, R., Stock, C. A., Tagliabue, A., Takano, Y., Tjiputra, J., Toyama, K., Tsujino, H., Watanabe, M., Yamamoto, A., Yool, A., and Ziehn, T.: Twenty-first century ocean warming, acidification, deoxygenation, and upper-ocean nutrient and primary production decline from CMIP6 model projections, Biogeosciences, 17, 3439–3470, https://doi.org/10.5194/bg-17-3439-2020, 2020. a, b
Lachkar, Z., Smith, S., Lévy, M., and Pauluis, O.: Eddies reduce denitrification and compress habitats in the Arabian Sea, Geophys. Res. Lett., 43, 9148–9156, 2016. a
Lachkar, Z., Lévy, M., and Smith, K.: Strong intensification of the Arabian Sea oxygen minimum zone in response to Arabian Gulf warming, Geophys. Res. Lett., 46, 5420–5429, 2019. a, b, c, d
Laffoley, D. D. and Baxter, J.: Ocean Deoxygenation: Everyone's Problem-Causes, Impacts, Consequences and Solutions, Full report, Gland, Switzerland: IUCN, 580 pp., ISBN 978-2-8317-2013-5, 2019. a, b
Large, W. G. and Yeager, S. G.: Diurnal to decadal global forcing for ocean and sea-ice models: The data sets and flux climatologies, University Corporation for Atmospheric Research, https://doi.org/10.5065/D6KK98Q6, 2004. a
Large, W. G., McWilliams, J. C., and Doney, S. C.: Oceanic vertical mixing: A review and a model with a nonlocal boundary layer parameterization, Rev. Geophys., 32, 363–403, 1994. a
Levin, L. A.: Manifestation, drivers, and emergence of open ocean deoxygenation, Annual review of marine science, 10, 229–260, 2018. a
Long, M. C., Deutsch, C., and Ito, T.: Finding forced trends in oceanic oxygen, Global Biogeochem. Cy., 30, 381–397, 2016. a
Mann, H. B.: Nonparametric tests against trend, Econometrica, J. Econom. Soc., 13, 245–259, https://doi.org/10.2307/1907187, 1945. a
Marchesiello, P., Debreu, L., and Couvelard, X.: Spurious diapycnal mixing in terrain-following coordinate models: The problem and a solution, Ocean Model., 26, 156–169, 2009. a
McCreary, J. P., Yu, Z., Hood, R. R., Vinaychandran, P., Furue, R., Ishida, A., and Richards, K. J.: Dynamics of the Indian-Ocean oxygen minimum zones, Prog. Oceanogr., 112, 15–37, 2013. a
Merchant, C. J., Embury, O., Roberts-Jones, J., Fiedler, E., Bulgin, C. E., Corlett, G. K., Good, S., McLaren, A., Rayner, N., Morak-Bozzo, S., and Donion, C.: Sea surface temperature datasets for climate applications from Phase 1 of the European Space Agency Climate Change Initiative (SST CCI), Geosci. Data J., 1, 179–191, 2014. a
Miller, S. H., Breitburg, D. L., Burrell, R. B., and Keppel, A. G.: Acidification increases sensitivity to hypoxia in important forage fishes, Mar. Ecol. Prog. Ser., 549, 1–8, 2016. a
Oschlies, A., Brandt, P., Stramma, L., and Schmidtko, S.: Drivers and mechanisms of ocean deoxygenation, Nat. Geosci., 11, 467–473, 2018. a, b, c
Oschlies, A., Koeve, W., Landolfi, A., and Kähler, P.: Loss of fixed nitrogen causes net oxygen gain in a warmer future ocean, Nat. Commun., 10, 1–7, 2019. a
Piontkovski, S. and Al-Oufi, H.: The Omani shelf hypoxia and the warming Arabian Sea, Int. J. Environ. Stud., 72, 256–264, 2015. a
Praveen, V., Ajayamohan, R., Valsala, V., and Sandeep, S.: Intensification of upwelling along Oman coast in a warming scenario, Geophys. Res. Lett., 43, 7581–7589, 2016. a
Queste, B. Y., Vic, C., Heywood, K. J., and Piontkovski, S. A.: Physical controls on oxygen distribution and denitrification potential in the north west Arabian Sea, Geophys. Res. Lett., 45, 4143–4152, 2018. a
Rabalais, N. N., Turner, R. E., and Wiseman Jr., W. J.: Gulf of Mexico hypoxia, aka “The dead zone”, Ann. Rev. Ecol. Syst., 33, 235–263, 2002. a
Ramesh, R., Purvaja, G., and Subramanian, V.: Carbon and phosphorus transport by the major Indian rivers, J. Biogeogr., 22, 409–415, 1995. a
Rayner, N., Parker, D. E., Horton, E., Folland, C. K., Alexander, L. V., Rowell, D., Kent, E. C., and Kaplan, A.: Global analyses of sea surface temperature, sea ice, and night marine air temperature since the late nineteenth century, J. Geophys. Res.-Atmos., 108, 4407, https://doi.org/10.1029/2002JD002670, 2003. a
Resplandy, L., Lévy, M., Bopp, L., Echevin, V., Pous, S., Sarma, V. V. S. S., and Kumar, D.: Controlling factors of the oxygen balance in the Arabian Sea's OMZ, Biogeosciences, 9, 5095–5109, https://doi.org/10.5194/bg-9-5095-2012, 2012. a
Robinson, C.: Microbial respiration, the engine of ocean deoxygenation, Front. Mar. Sci., 5, 533, https://doi.org/10.3389/fmars.2018.00533, 2019. a
Roxy, M. K., Modi, A., Murtugudde, R., Valsala, V., Panickal, S., Prasanna Kumar, S., Ravichandran, M., Vichi, M., and Lévy, M.: A reduction in marine primary productivity driven by rapid warming over the tropical Indian Ocean, Geophys. Res. Lett., 43, 826–833, 2016. a, b, c, d, e
Sandeep, S. and Ajayamohan, R.: Poleward shift in Indian summer monsoon low level jetstream under global warming, Clim. Dynam., 45, 337–351, 2015. a, b
Schmidtko, S., Stramma, L., and Visbeck, M.: Decline in global oceanic oxygen content during the past five decades, Nature, 542, 335–339, 2017. a, b, c
Schott, F. A., Xie, S.-P., and McCreary Jr., J. P.: Indian Ocean circulation and climate variability, Rev. Geophys., 47, RG1002, https://doi.org/10.1029/2007RG000245, 2009. a
Shchepetkin, A. F. and McWilliams, J. C.: The regional oceanic modeling system (ROMS): a split-explicit, free-surface, topography-following-coordinate oceanic model, Ocean Model., 9, 347–404, 2005. a
Sooraj, K., Terray, P., and Mujumdar, M.: Global warming and the weakening of the Asian summer monsoon circulation: assessments from the CMIP5 models, Climate Dynamics, 45, 233–252, 2015. a
Stewart, K., Kim, W., Urakawa, S., Hogg, A. M., Yeager, S., Tsujino, H., Nakano, H., Kiss, A., and Danabasoglu, G.: JRA55-do-based repeat year forcing datasets for driving ocean–sea-ice models, Ocean Model., 147, 101557, https://doi.org/10.1016/j.ocemod.2019.101557, 2020. a
Stramma, L., Johnson, G. C., Sprintall, J., and Mohrholz, V.: Expanding oxygen-minimum zones in the tropical oceans, Science, 320, 655–658, 2008. a
Strong, A. E., Liu, G., Skirving, W., and Eakin, C. M.: NOAA's Coral Reef Watch program from satellite observations, Ann. GIS, 17, 83–92, 2011. a
Swapna, P., Jyoti, J., Krishnan, R., Sandeep, N., and Griffies, S.: Multidecadal weakening of Indian summer monsoon circulation induces an increasing northern Indian Ocean sea level, Geophys. Res. Lett., 44, 10560–10572, https://doi.org/10.1002/2017GL074706, 2017. a, b
Vallivattathillam, P., Iyyappan, S., Lengaigne, M., Ethé, C., Vialard, J., Levy, M., Suresh, N., Aumont, O., Resplandy, L., Naik, H., and Naqvi, W.: Positive Indian Ocean Dipole events prevent anoxia off the west coast of India, Biogeosciences, 14, 1541–1559, https://doi.org/10.5194/bg-14-1541-2017, 2017. a
Vaquer-Sunyer, R. and Duarte, C. M.: Thresholds of hypoxia for marine biodiversity, P. Natl. Acad. Sci. USA, 105, 15452–15457, 2008. a
Wang, B., Liu, J., Kim, H.-J., Webster, P. J., Yim, S.-Y., and Xiang, B.: Northern Hemisphere summer monsoon intensified by mega-El Niño/southern oscillation and Atlantic multidecadal oscillation, P. Natl. Acad. Sci., 110, 5347–5352, 2013. a
Whitney, F. A., Freeland, H. J., and Robert, M.: Persistently declining oxygen levels in the interior waters of the eastern subarctic Pacific, Prog. Oceanogr., 75, 179–199, 2007. a, b