the Creative Commons Attribution 4.0 License.
the Creative Commons Attribution 4.0 License.
 | 17 Nov 2021
Seasonal ecosystem vulnerability to climatic anomalies in the Mediterranean
Johannes Vogel
Eva Paton
Valentin Aich
Mediterranean ecosystems are particularly vulnerable to climate change and the associated increase in climate anomalies. This study investigates extreme ecosystem responses evoked by climatic drivers in the Mediterranean Basin for the time span 1999–2019 with a specific focus on seasonal variations as the seasonal timing of climatic anomalies is considered essential for impact and vulnerability assessment. A bivariate vulnerability analysis is performed for each month of the year to quantify which combinations of the drivers temperature (obtained from ERA5-Land) and soil moisture (obtained from ESA CCI and ERA5-Land) lead to extreme reductions in ecosystem productivity using the fraction of absorbed photosynthetically active radiation (FAPAR; obtained from the Copernicus Global Land Service) as a proxy.
The bivariate analysis clearly showed that, in many cases, it is not just one but a combination of both drivers that causes ecosystem vulnerability. The overall pattern shows that Mediterranean ecosystems are prone to three soil moisture regimes during the yearly cycle: they are vulnerable to hot and dry conditions from May to July, to cold and dry conditions from August to October, and to cold conditions from November to April, illustrating the shift from a soil-moisture-limited regime in summer to an energy-limited regime in winter. In late spring, a month with significant vulnerability to hot conditions only often precedes the next stage of vulnerability to both hot and dry conditions, suggesting that high temperatures lead to critically low soil moisture levels with a certain time lag. In the eastern Mediterranean, the period of vulnerability to hot and dry conditions within the year is much longer than in the western Mediterranean. Our results show that it is crucial to account for both spatial and temporal variability to adequately assess ecosystem vulnerability. The seasonal vulnerability approach presented in this study helps to provide detailed insights regarding the specific phenological stage of the year in which ecosystem vulnerability to a certain climatic condition occurs.
- Article
(9538 KB) - Full-text XML
- BibTeX
- EndNote


Drought frequency and intensity are increasing in the Mediterranean, accompanied by rising temperatures and heat wave intensities (Perkins-Kirkpatrick and Gibson, 2017; Samaniego et al., 2018; IPCC, 2019; Tramblay et al., 2020). These climatic changes are linked to vulnerability of ecosystems in various ways, e.g. to reductions in forest growth and increasing tree mortality (Sarris et al., 2007, 2011) as well as extended fire risk (Sarris et al., 2014; Ruffault et al., 2018) and declining agricultural yields (Peña-Gallardo et al., 2019; Fraga et al., 2020). Furthermore, the ability to provide ecosystem services is impaired due to alterations in functioning and structure of Mediterranean ecosystems (Ogaya and Peñuelas, 2007; Peñuelas et al., 2017). Broad-scale vegetation shifts and replacement of species are projected, and ultimately desertification is expected in many Mediterranean regions (Gao and Giorgi, 2008; Zdruli, 2011; Feng and Fu, 2013; Liu et al., 2018).
The Mediterranean climate is characterised by great spatial and temporal variability, which makes the investigation of ecosystem impacts challenging. The Mediterranean Basin is marked by complex topography and is influenced by several large-scale atmospheric patterns (Lionello et al., 2006, 2012). Furthermore, the Mediterranean climate has an intricate seasonal cycle, alternating between water-limited conditions in summer and energy-limited conditions in winter (Spano et al., 2013). An assessment of ecosystem vulnerability in the Mediterranean therefore needs to account for both its spatial and temporal variability.
In this study, we build on the ecosystem vulnerability analysis proposed by van Oijen et al. (2013, 2014) and Rolinski et al. (2015), adapted with a focus on seasonal and multivariate impacts using remote sensing and reanalysis data. We enhance the ecosystem vulnerability concept with a focus on the seasonal timing of impacts. Ecosystem responses differ depending on the seasonal timing of the event (de Boeck et al., 2011; Smith, 2011; Sippel et al., 2016). Shifts of only a few weeks in drought occurrence can make the difference between negligible and detrimental impacts (Denton et al., 2017; Sippel et al., 2017, 2018). Even though accounting for seasonality is crucial in investigating climatic impacts on ecosystems, it is still often neglected (Piao et al., 2019). Studies are frequently limited to particular periods of interest within the year – usually a period of up to half a year centred around summer – when investigating seasonality (van Oijen et al., 2014; Baumbach et al., 2017; Nicolai-Shaw et al., 2017; Karnieli et al., 2019) but rarely investigate the seasonality year-round. In addition, combinations of climatic events in the seasonal cycle are seldom addressed (Smith, 2011; Hatfield and Prueger, 2015). Due to the pronounced land–atmosphere feedback mechanisms in the Mediterranean (Seneviratne et al., 2006; Green et al., 2017; Tramblay et al., 2020), it is particularly important to analyse the impacts of climatic anomalies in soil moisture and temperature jointly rather than in isolation (Mueller and Seneviratne, 2012). Such joint impacts of multiple stressors on ecosystems are still little researched (IPCC, 2019). Relationships between climatological and ecological variables at the tails of the distribution can show distinctly different behaviour compared to the findings based on conventional linear correlation, which makes it especially important to investigate the impact of climate anomalies on ecosystems, not only their mean behaviour (Jentsch et al., 2007; Reyer et al., 2013; Baumbach et al., 2017; Ribeiro et al., 2020).
Soil moisture is a particularly relevant variable for assessing the state of ecosystems as it is directly related to plant activity, biomass and agricultural yields (McWilliam, 1986; Sherry et al., 2008; Seneviratne et al., 2010; Zscheischler et al., 2013), especially in seasonally water-limited areas such as the Mediterranean (Szczypta et al., 2014). However, large-scale soil moisture data covering long time spans are scarce. Therefore, soil moisture proxies are applied in most cases, e.g. land surface models or drought indicators such as the standardised precipitation index (SPI) (Dorigo et al., 2017; Nicolai-Shaw et al., 2017). However, the SPI is primarily an indicator for meteorological droughts, which do not necessarily propagate into soil moisture droughts (de Boeck et al., 2011). Only a few studies use soil moisture data derived from satellite imagery because long-term coverage was not available until recently. Individual satellites do not cover sufficiently long time spans, but long-term coverage can be achieved by merging soil moisture data from several satellites. The European Space Agency's Climate Change Initiative (ESA CCI) soil moisture data set provides a unique, globally consistent multi-decadal time series based on several active and passive microwave sensors (Dorigo and de Jeu, 2016; Dorigo et al., 2017). It was first published in 2012 and has continuously improved since (Dorigo et al., 2017). It has proven capability to assess land–vegetation–atmosphere dynamics (de Jeu and Dorigo, 2016; Dorigo and de Jeu, 2016; Nicolai-Shaw et al., 2017; Gruber et al., 2019). So far, satellite-based soil moisture data are still rarely used in ecosystem research (Dorigo et al., 2017), and Rolinski et al. (2015), for example, point out the need to use observational data in the assessment of ecosystem vulnerability. Therefore, we seek to put greater emphasis on the possibilities arising from newly available remote sensing products within the last years. In addition, we also performed the analysis using the soil moisture product from the ERA5-Land reanalysis data set. The fraction of absorbed photosynthetically active radiation (FAPAR) is used as an indicator of ecosystem productivity in our study. The FAPAR is crucial for monitoring climatic impacts on terrestrial ecosystems and is directly related to the photosynthetic activity of vegetation and thus to its greenness and health (Potter et al., 2003; Gobron et al., 2010; Ivits et al., 2016). Vegetation indices such as the normalised difference vegetation index (NDVI) are closely related to the FAPAR and can be seen as proxies (Myneni and Williams, 1994; Pinty et al., 2009).
This study aims to quantify ecosystem vulnerability by assessing which combinations of climatic drivers lead to extreme reductions in ecosystem productivity in the Mediterranean Basin using a bivariate vulnerability analysis with a specific focus on seasonal variations. Soil moisture and temperature are investigated as climatic drivers, and the FAPAR is used to assess the ecological response. Furthermore, ecosystem vulnerability is calculated separately by land cover class and subregion to account for the spatial complexity of the Mediterranean Basin.
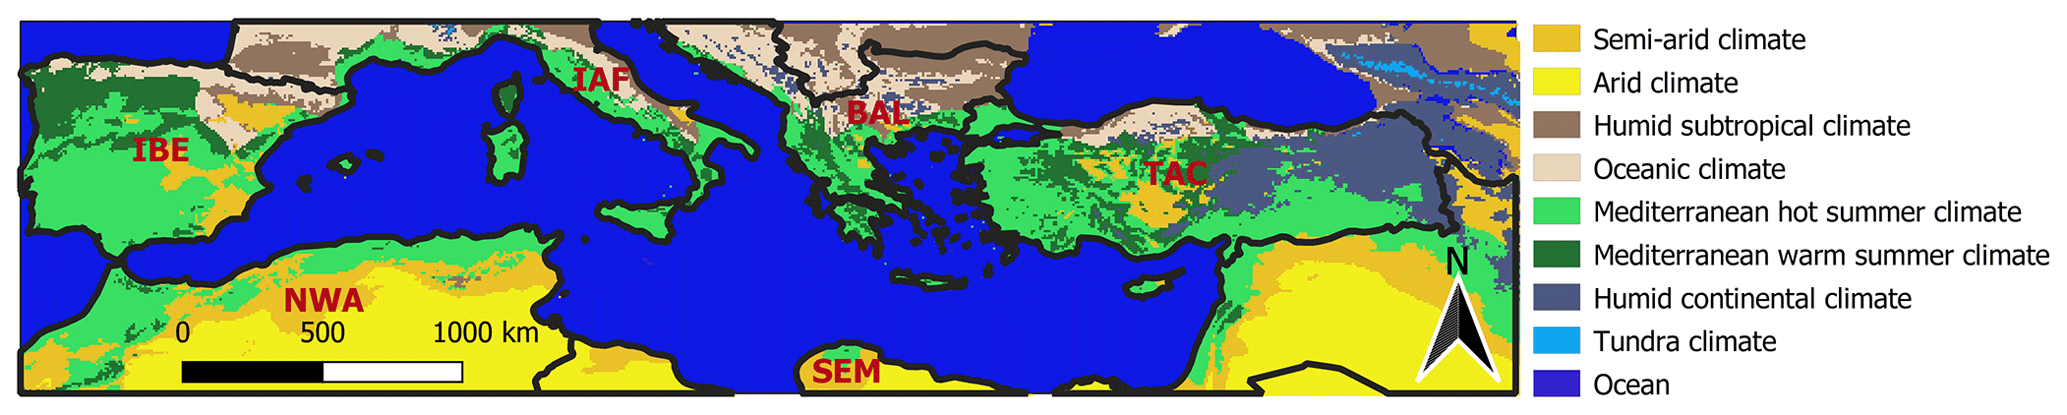
Figure 1Study area in the Mediterranean Basin: the Köppen–Geiger climate categories “Mediterranean hot summer climate” (light green) and “Mediterranean warm summer climate” (dark green) are included in this study. The study area was divided into six subregions: the Iberian Peninsula (IBE), Italy and France (IAF), the Balkan Peninsula (BAL), Turkey and Cyprus (TAC), the south-eastern Mediterranean (SEM), and north-western Africa (NWA)
2.1 Study area
The study area is constrained to all grid points in the Mediterranean Basin belonging to the Köppen–Geiger classes Csa (“warm temperate climate with dry and hot summer”) and Csb (“warm temperate climate with dry and warm summer”; cf. Fig. 1) to ensure a certain level of comparability within the study area. Furthermore, the study area is subdivided into land cover classes and subregions. The land cover classes were aggregated according to Table B1 using the ESA CCI land cover classification map of 2018. Grid points where the land cover changed between 1999 and 2018 were excluded in this study as well as grid points belonging to the land cover classes “water bodies’’ and “urban areas’’. The countries belonging to each subregion are listed in Table B2.
2.2 Data
Daily satellite-based soil moisture data from ESA CCI were obtained at a resolution of 0.25∘ from 1978–2019 (Gruber et al., 2019). The merged data set (v04.7), containing data from both active and passive sensors, is used. The quality of this data set has continuously improved over the years due to the incorporation of an increasing number of satellites (Dorigo et al., 2017). The data set is representative of the topsoil surface layer of up to 2 cm thickness (Kidd and Haas, 2018). Monthly air temperature and soil moisture reanalysis data are retrieved from ERA5-Land produced by the European Centre for Medium-Range Weather Forecasts (ECMWF) at a resolution of 9 km from 1981–2019 (Muñoz-Sabater, 2019). The three soil moisture layers corresponding to the depths 0–7, 7–28 and 28–100 cm are used in the analysis. This study is conducted using the ESA CCI soil moisture data set as well as the ERA5-Land soil moisture data set to verify the robustness of our results. The FAPAR is obtained from the Copernicus Global Land Service (CGLS) (Baret et al., 2013; Verger et al., 2014). It is derived from SPOT/VGT from 1999–2013 and PROBA-V from 2014–2019 and is provided in 10 d steps (Verger et al., 2019). Furthermore, the ESA CCI land cover classification for the years 1999 and 2018 with a spatial resolution of 300 m (v2.1.1) was used (ESA, 2017). The Köppen–Geiger classification map was acquired from Kottek et al. (2006) and Rubel et al. (2017).

Figure 2Percentage of available monthly soil moisture values from 1999–2019. All grid points excluded from this study are marked with a dot.
2.3 Data preprocessing
All data sets are resampled to a common spatial and temporal resolution of 0.25∘ and a monthly time step, respectively. The investigated time span encompasses 21 years from 1999–2019. Grid points with more than 60 months of missing soil moisture data within the period from 1999–2019 were excluded from this study (see Fig. 2). These are primarily grid points located close to the coast. In a next step, all variables are deseasonalised by subtracting the annual cycle to account for extremeness relative to the respective time of the year. The variables are z-transformed by subtracting the monthly mean and dividing by the year-round standard deviation of the deseasonalised time series (Eq. 1); z-score transformation allows for a direct comparison of values despite their different physical units (Orth et al., 2020).
The impact of environmental drivers on ecosystems may show a time lag of up to a few months – so-called “legacy effects” (von Buttlar et al., 2018; Piao et al., 2019). Hence, a moving average of 3 months n=3 is applied to the environmental driver variables env temperature and soil moisture; i.e. the preceding 2 months are included with equal weight for each monthly time step i in the time span of m=21 years (Eq. 2) to account for lagged effects.
2.4 Derivation of ecosystem vulnerability
In the context of our study, ecosystem vulnerability depicts if ecosystems are susceptible or sensitive to a certain hazard. It allows states of low ecosystem productivity to be attributed to certain climatic conditions by linking such states to corresponding deviations in temperature and soil moisture. The terminology on ecosystem vulnerability is confusing since several partially ambiguous terms exist due to the concept being still rather new in ecological research (van Oijen et al., 2013; Weißhuhn et al., 2018). Following the definition by Rolinski et al. (2015), “ecosystem vulnerability VE is the average deviation of the environmental variable under hazardous ecosystem conditions from values under non-hazardous ecosystem conditions” in our approach. Here, the environmental variable env is either temperature or soil moisture, respectively, and the ecosystem variable sys is the FAPAR. Ecosystem vulnerability VE is calculated according to Eq. (3) as the difference in the expectation value Enonhaz of the environmental variable env under non-hazardous conditions of the ecosystem variable sys and the respective value Ehaz under hazardous conditions of the ecosystem variable sys (van Oijen et al., 2013; Rolinski et al., 2015).
with conditional expectational values defined following Eq. (4):
where ℙ is the probability of env under the specified condition ∘ (sys nonhaz or sys haz). The probability of hazard occurrence ℙH is given by the number of data points under hazardous conditions Nhaz divided by the total number of data points N, which gives . The discrimination threshold between non-hazardous and hazardous ecosystem conditions is set as the 10th percentile of the FAPAR values for each grid point individually; i.e. ℙ(sys haz) is fixed to 0.1 in this study. Such a threshold is commonly used in ecoclimatological studies (Ahlström et al., 2015; Baumbach et al., 2017; Nicolai-Shaw et al., 2017). To investigate the robustness of our results, we also performed the analysis using the 5th and 15th percentile for discrimination of hazardous and non-hazardous ecosystem conditions. The spatial and temporal patterns for these cases were in agreement with the 10th percentile chosen in our study (results not shown), which indicates that our results are not sensitive to the choice of the percentile. Every grid point has the same number of months with hazardous ecosystem conditions; i.e. the same risk of exceeding the threshold is assumed uniformly for all grid points.
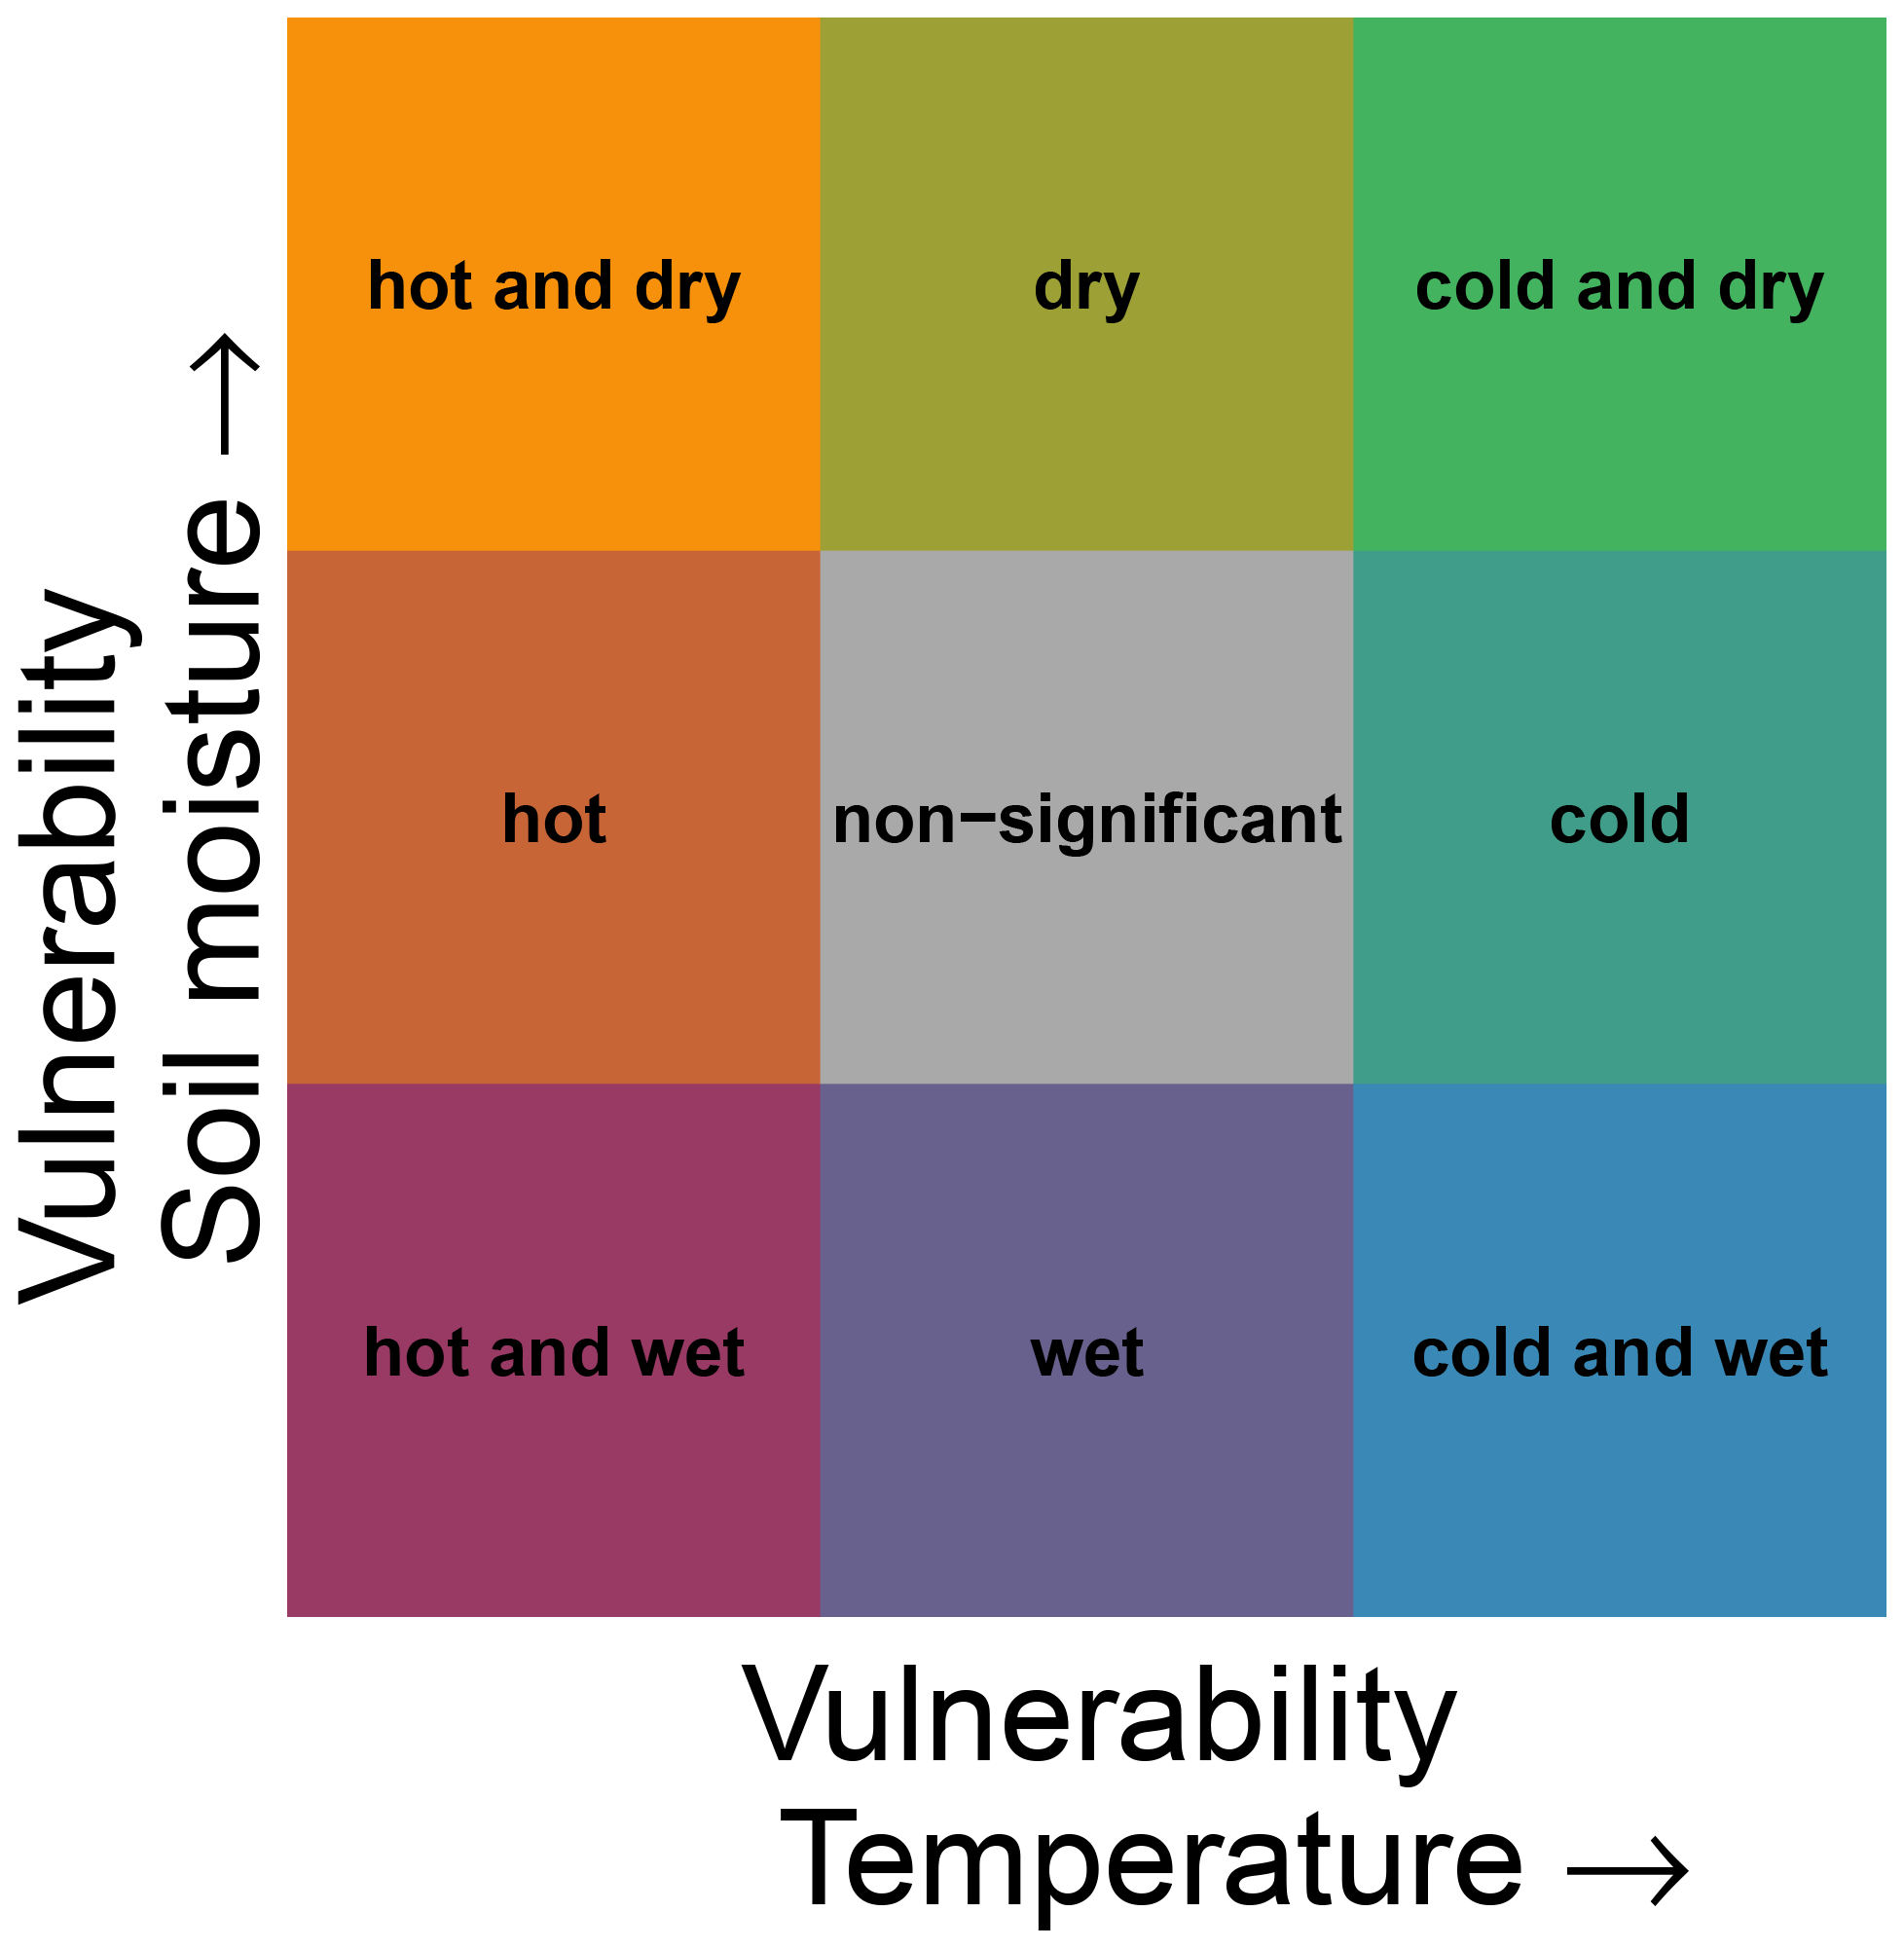
We used the Mann–Whitney U test to investigate significant deviations in climatic conditions during non-hazardous and hazardous ecosystem conditions, which was adjusted for multiple testing using the Benjamini and Hochberg (1995) correction. Significant positive values indicate ecosystem vulnerability VE to cold (dry) conditions for the climatic driver temperature (soil moisture). Similarly, significant negative values are associated with vulnerability to hot (wet) conditions. In the case of two climatic drivers, this leads to nine possible vulnerability conditions (see Fig. 3). The corresponding p values are not shown throughout the article due to the large number of data. A schematic display of the calculation of ecosystem vulnerability VE is given in Fig. 4 for an exemplary grid point with vulnerability to hot and dry conditions for the month of July. The two drivers temperature and soil moisture are assessed for their effects on ecosystem vulnerability. In this example, the average temperature in July during non-hazardous ecosystem conditions Enonhaz is lower than the average during hazardous ecosystem conditions Ehaz, leading to a negative vulnerability to temperature, i.e. vulnerability to hot conditions (Fig. 4a). For soil moisture, the average soil moisture during non-hazardous ecosystem conditions Enonhaz is higher than soil moisture during hazardous conditions Ehaz; therefore vulnerability is positive, indicating vulnerability to dry conditions (Fig. 4b). Our approach is impact-based; i.e. it focusses on the extremeness of the impact rather than the extremeness of the driver as this enables relating multiple drivers to a single outcome (Zscheischler et al., 2014, 2018). According to the framework by Smith (2011), vulnerability to extreme climatic events is defined as a climate extreme leading to an extreme ecological response. Therefore, our definition differs in that regard in that it comprises extremeness only for the ecological response, not necessarily for the climatic driver. The definition used here is broader than the one by Smith (2011) because it includes significant deviations in the driver variable in general, not only extremes. In our case, ecosystem vulnerability rather shows if the ecosystem variable is susceptible to certain climatic conditions (which do not need to be extreme). The analysis was carried out using R version 3.6 and Climate Data Operators (CDO) version 1.9 (Schulzweida, 2019; R Core Team, 2020).
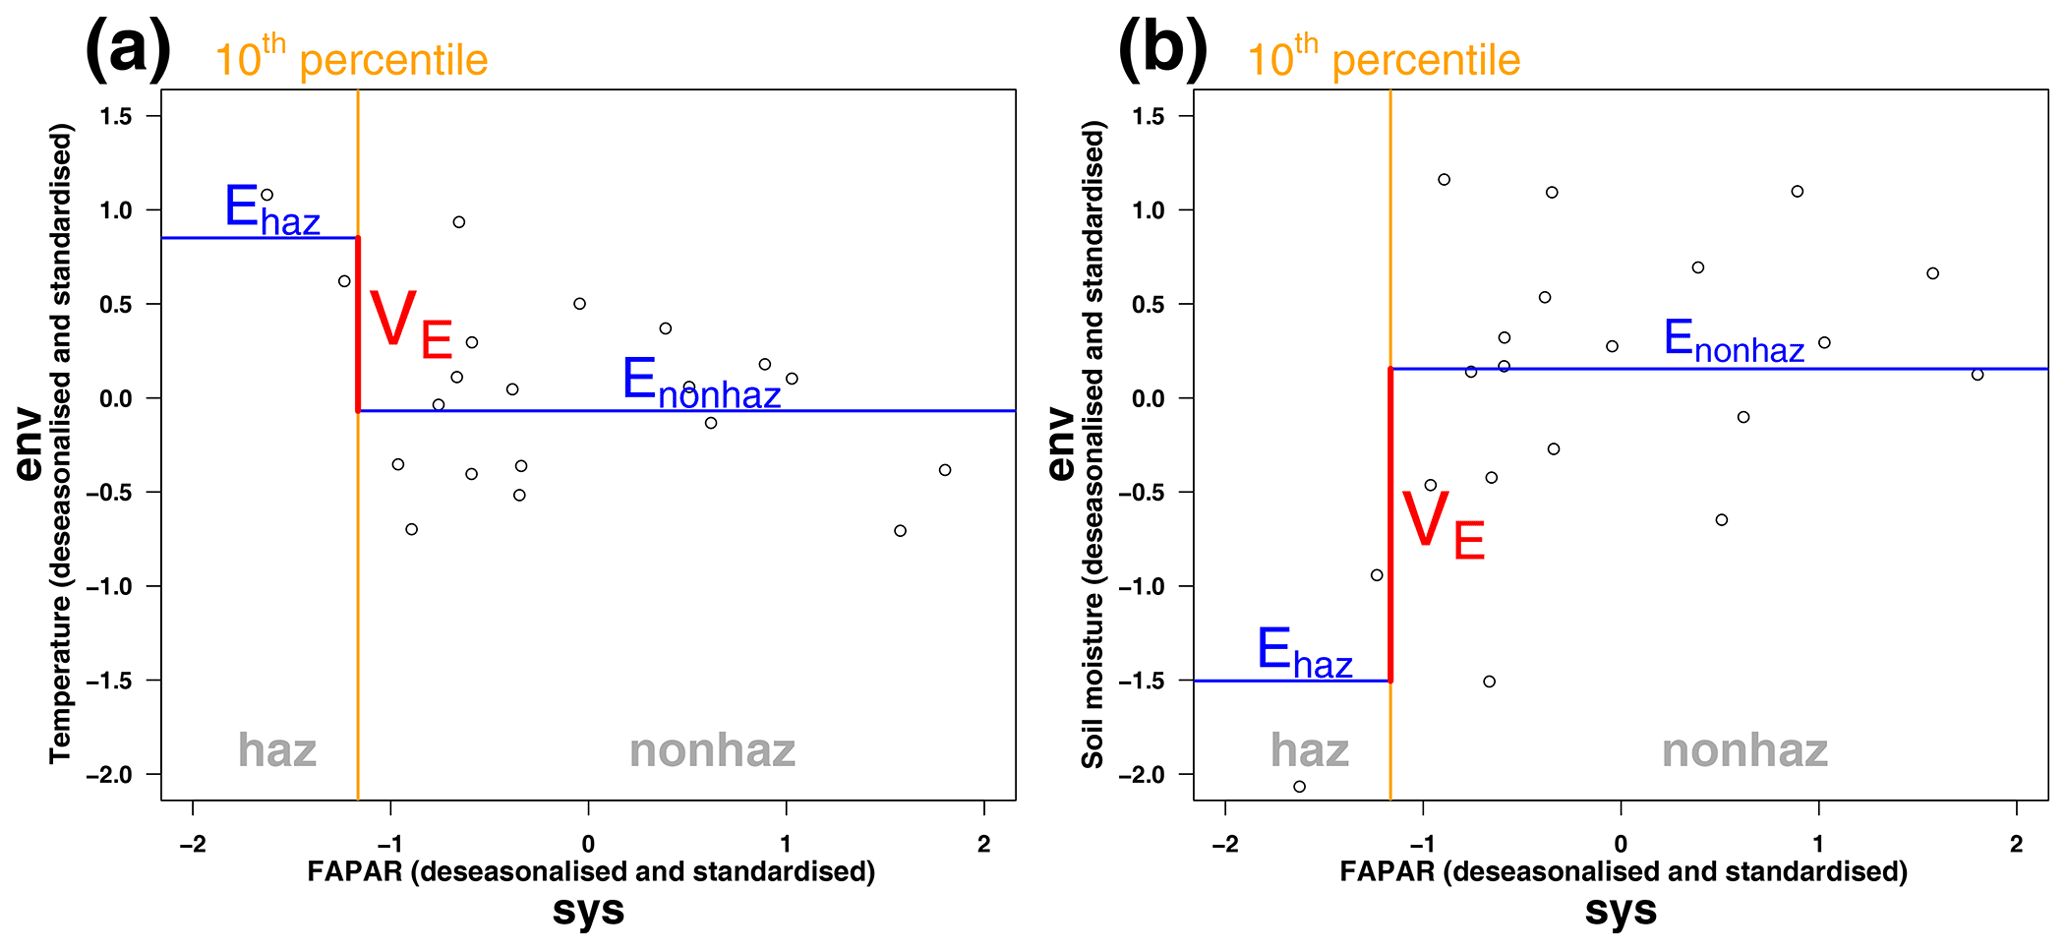
Figure 4Schematic display of ecosystem vulnerability VE for an exemplary grid point for (a) temperature and (b) soil moisture as environmental drivers for the month of July.

Figure 5Median monthly ecosystem vulnerability per land cover: vulnerability to temperature (ERA5-Land) is shown in white, and vulnerability to soil moisture (ESA CCI) is shown in black for each month of the year (columns) for each land cover (rows). Months with statistically significant deviation in climatic drivers during non-hazardous and hazardous ecosystem conditions according to the Mann–Whitney U test based on a significance level α=0.05 are shown in colour (see legend); all other months are shown in grey. The number of grid points in which an event has occurred in this month and land cover within the period 1999–2019 is shown in the upper left corner of each panel.
3.1 Ecosystem vulnerability by land cover
Figure 5 displays the ecosystem vulnerability to soil moisture and temperature for each land cover class and each month of the year as well as the corresponding statistical significance indicated by the background colour (see explanation in Fig. 3). The vulnerability to temperature and soil moisture can be summarised into three major regimes during the course of the year (see Fig. 5). From May to July, the vegetation is especially prone to hot and dry conditions. From August to October, there is a shift to a vulnerability to cold and dry conditions in general. Finally, from November to April cold and wet conditions are usually associated with high vulnerability of the vegetation. There are sharp transitions in ecosystem vulnerability from April to May, from July to August, and from October to November for most land cover classes.
In the period from November to March the vast majority of land covers are vulnerable to cold conditions. From March to May there is a transition phase from cold to hot conditions. While in March almost all land covers are vulnerable to cold conditions, in April only four of them still remain vulnerable (“forest (broadleaved)”, “forest (needleleaved)”, “ mixed” and “shrubland”), and none are vulnerable in May, when the majority shift to vulnerability to hot conditions. In summer, a period with significant vulnerability to hot conditions only precedes the next phase of vulnerability to both hot and dry conditions, e.g. for “crops (rainfed)” and “grassland”, indicating that the heat desiccates the soil first until it reaches critically low soil moisture levels in the following months. The cycle reverses around July and August. While four land cover classes are still vulnerable to hot conditions in July, none of the classes are in August. Vulnerability to high temperatures is almost entirely restricted to the period from May to July. From August to October, most land cover classes exhibit vulnerability to cold and dry conditions, and from midsummer to the beginning of autumn almost all land cover classes are prone to drought. In the following period from November to March, cold and wet conditions prevail on average. The vulnerability to wet conditions is highest from November to January, whereas many land cover classes are insensitive to soil moisture during most of the time from February to May. Exemptions are, for example, “ forest (broadleaved)”, “crops (rainfed)” and “mixed”, where low ecosystem productivity coincides with wet conditions, e.g. in March to April.
The vulnerability to hot conditions of “grassland” is 1 month ahead of most other land classes, starting already in April. This could indicate a faster response of this land cover class to environmental drivers than other land cover classes. Sparse vegetation is probably well adapted to high temperatures as it never shows vulnerability to hot conditions, which means that temperature during extreme ecosystem conditions is not significantly higher than during non-extreme ecosystem conditions. It also never coincides with significantly wet conditions, which might point out that transpiration in these areas is never so high that it could contribute substantially to the desiccation of the soil, and thus its influence on soil moisture is negligible.
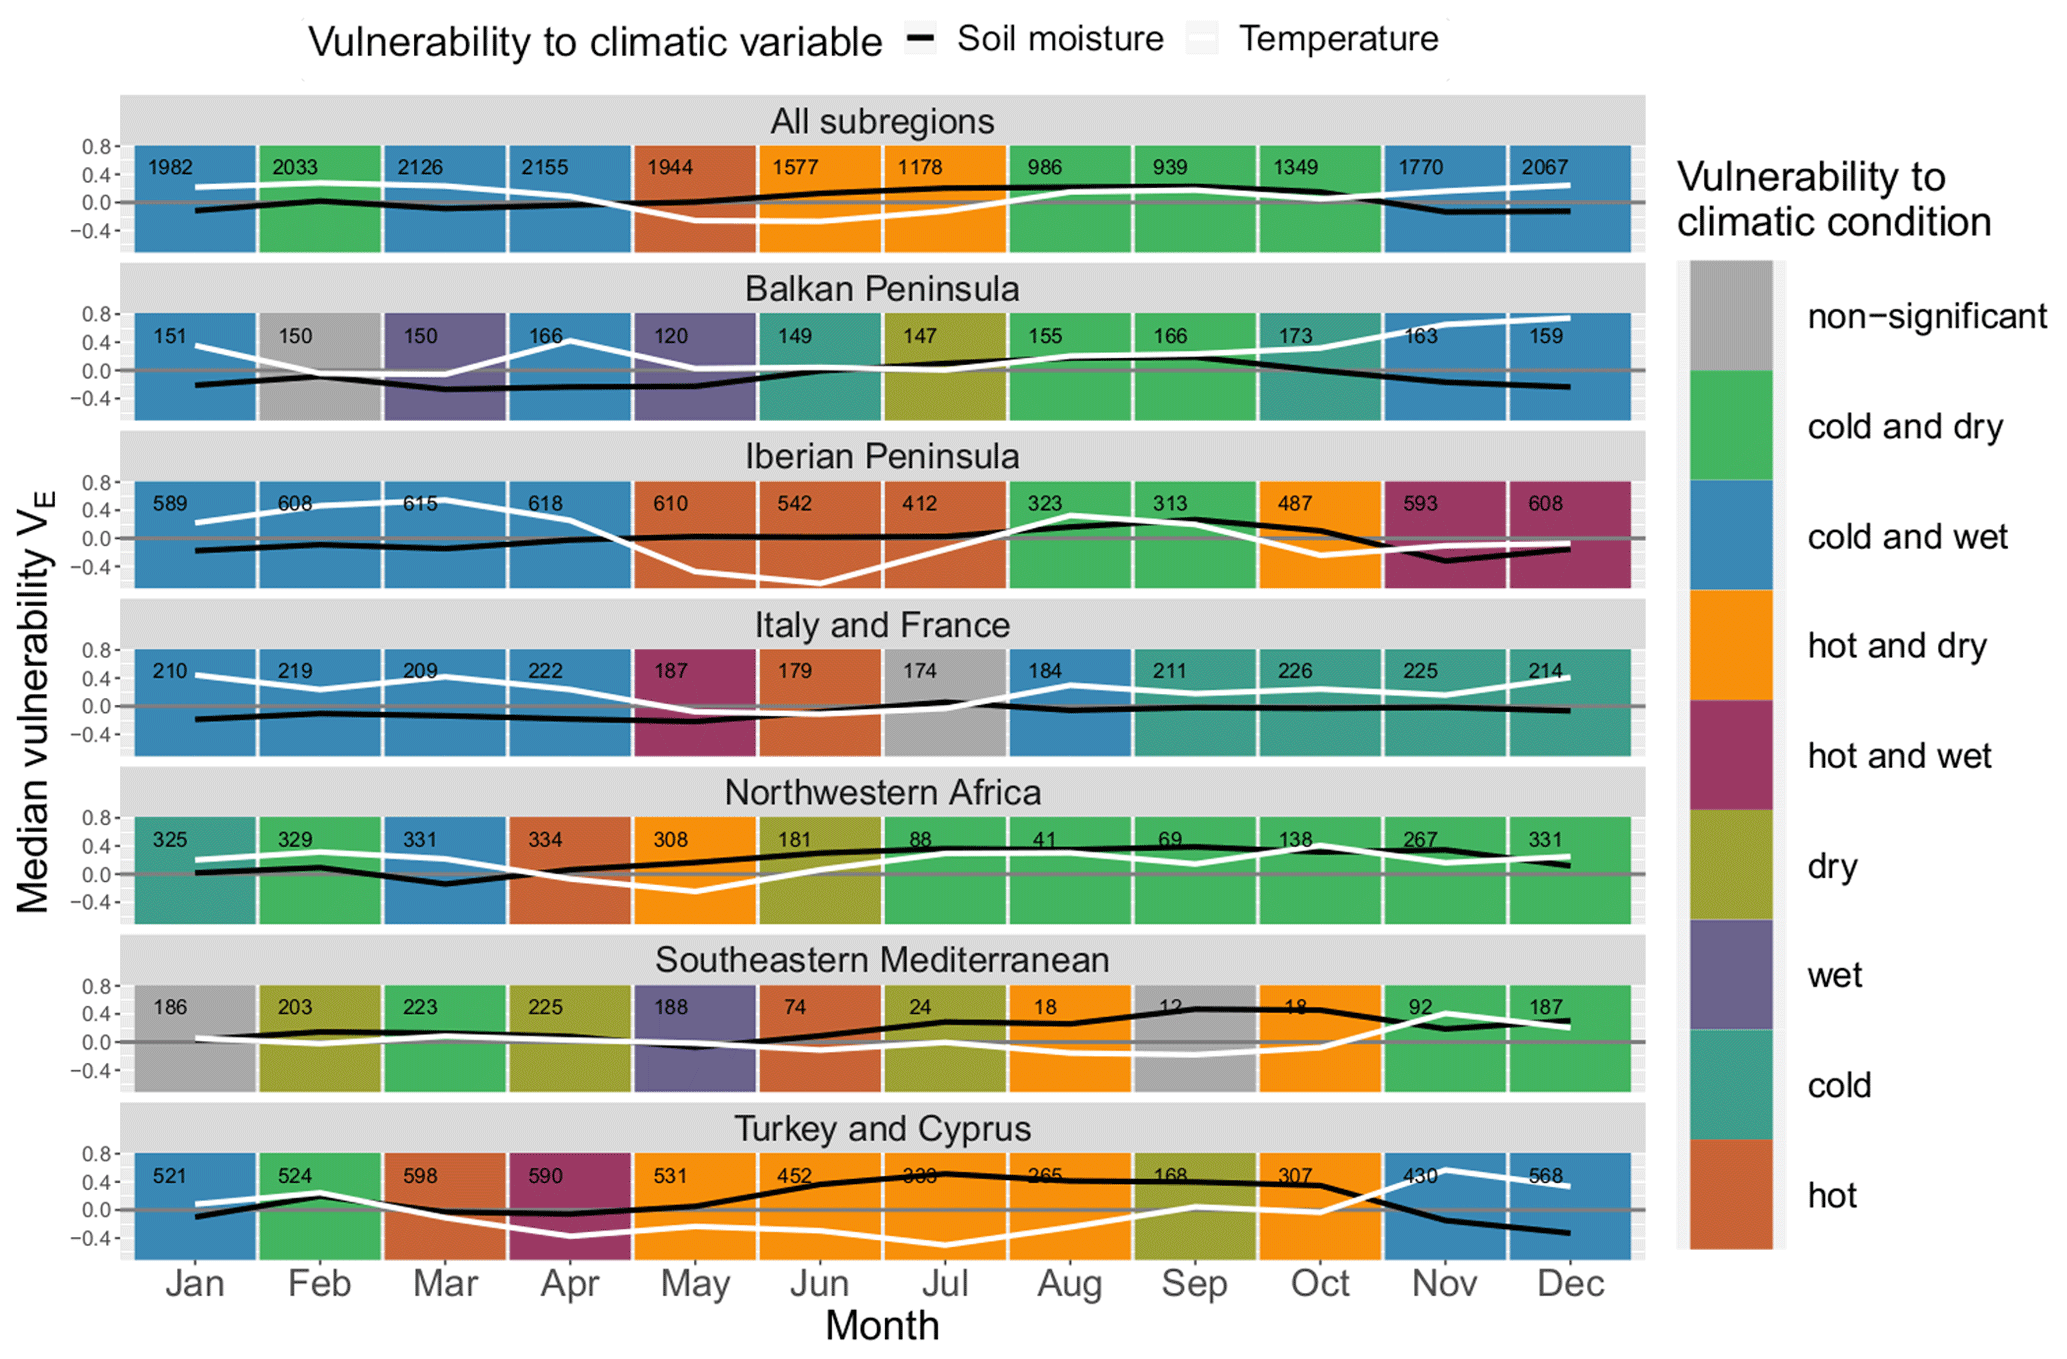
Figure 6Median monthly ecosystem vulnerability per subregion: vulnerability to temperature (ERA5-Land) is shown in white, and vulnerability to soil moisture (ESA CCI) is shown in black for each month of the year (columns) for each land cover (rows). Months with statistically significant deviation in climatic drivers during non-hazardous and hazardous ecosystem conditions according to the Mann–Whitney U test based on a significance level α=0.05 are shown in colour (see legend); all other months are shown in grey. The number of grid points in which an event has occurred in this month and subregion within the period 1999–2019 is shown in the upper left corner of each panel.
3.2 Ecosystem vulnerability by subregions
Similarly to Fig. 5, ecosystem vulnerability for each subregion is shown in Fig. 6. There is more variability than regarding land cover classes, and the general pattern of most land cover classes with a “hot and dry” regime followed by a “cold and dry” regime and subsequently by a “cold and wet” regime does not hold true for most of the Mediterranean subregions. The vulnerability to soil moisture usually peaks during summer or autumn and reaches a minimum in spring or winter – exceptions are Italy and France as well as the south-eastern Mediterranean. The yearly development of vulnerability to temperature is characterised by a minimum around late spring or summer.
There is an extended period of time in which ecosystems are prone to hot conditions from March to October in Turkey, whereas in other regions this period often only lasts for 2 to 3 months in spring and summer. North-western Africa and the south-eastern Mediterranean are prone to dry conditions 9 and 8 months of the year, respectively, indicating that these regions are usually soil-moisture-limited. Italy and France have the lowest sensitivity to soil moisture, with only small deviations from zero. Nevertheless, these deviations are significant for half of the months in the year. Interestingly, the Balkan Peninsula is never prone to hot conditions. Outside of the summer season, wet conditions particularly coincide with low ecosystem productivity in Italy and France, the Balkans, and the Iberian Peninsula.
The number of events per month is not equally distributed throughout the year. There is a decline from June to November with a minimum usually around September in which only few events are detected. This reflects the time span of the dormant season since these months are usually too dry for ecosystem activity. There are some notable exceptions for land covers involving trees (“forest (broadleaved)”, “forest (needleleaved)”, `mixed” and “crops (irrigated)”) (see Fig. 5) as well as the northernmost subregions of the Mediterranean, Italy and France, and the Balkan Peninsula (see Fig. 6), where the number only decreases slightly during this period. These land cover classes and subregions are less affected by the characteristic dry period in summer. Forests have better access to soil moisture because they develop deeper roots (Bréda et al., 2006; Zhang et al., 2016), whereas irrigated areas obviously have an external water supply. The northern subregions are also moister than the southern Mediterranean.
Satellite-derived soil moisture data sets are prone to uncertainty, even though there have been considerable improvements in the last years (Gruber et al., 2019). Therefore, ecosystem vulnerability was also assessed for all land cover classes and subregions using soil moisture layers at 0–7, 7–28 and 28–100 cm depth from the ERA5-Land reanalysis data set and compared to results obtained from the ESA CCI soil moisture product to verify the robustness of our results and whether specific biases are apparent (see Appendix A). Furthermore, certain land cover classes and subregions encompass a relatively small subset of grid points, and thus non-significant ecosystem vulnerability might be related to data scarcity in some of these cases.
The spatial patterns of ecosystem vulnerability are displayed for four exemplary months of the year (see Fig. 7), whereas all 12 months can be found in the Appendix (see Fig. B1). In March in most western Mediterranean regions, low FAPAR values are associated with cold and wet conditions (blue colouring), whereas in the eastern Mediterranean vulnerability to hot conditions (purple and orange colouring) are already emerging at this time of the year. In June, almost all regions are vulnerable to hot conditions and often also to dry conditions (purple and orange colouring), with exceptions in the northernmost regions such as the French Riviera as well as mountainous regions such as the Peloponnese in Greece and the High Atlas in central Morocco. In September, there are often no low FAPAR anomalies occurring (black colouring), particularly in southern and inland regions, which are the hottest regions of the Mediterranean. The reason for this is that this time usually corresponds to the dormant season in these areas. In regions where events are detected during this time of the year, vulnerability to cold and dry conditions (green colouring) prevails in most of the Mediterranean. In December, in most areas in the central Mediterranean, low FAPAR values coincide with cold and wet conditions (blue colouring), whereas in central Turkey and the southern Iberian Peninsula, vulnerability to hot conditions (purple and orange colouring) occurs. It is noteworthy that for a given grid point at a given month, only 21 observations are available. Therefore, the robustness of the magnitude of ecosystem vulnerability of individual grid points is limited and should thus be interpreted with care. The maps in Figs. 7 and B1 primarily aim to identify large-scale spatial patterns but do not provide information on statistical significance at a grid point scale.
4.1 Interpretation of temporal and spatial patterns in the Mediterranean
Our findings are in accordance with the characteristics of the Mediterranean climate regime, which is primarily energy-limited during winter and soil-moisture-limited during summer (Schwingshackl et al., 2017). The vulnerability analysis allows a more detailed investigation of the changes in ecosystem vulnerability to soil moisture and temperature throughout the course of the year for different land cover classes and subregions. In a wet regime, ecosystem activity is energy-limited, depending primarily on temperature and radiation, whereas in a transitional or dry system, soil moisture content is reduced, and thus ecosystem activity is water-limited (Seneviratne et al., 2010; Zscheischler et al., 2015). From May to July, the Mediterranean is often vulnerable to hot and dry conditions, which is a typical feature of a soil-moisture-limited regime (Seneviratne et al., 2010). Heat waves are a frequent characteristic of the Mediterranean summer (Conte et al., 2002) and are often connected to persistent anti-cyclonic regimes and droughts (Mueller and Seneviratne, 2012; Ulbrich et al., 2012). The vulnerability to dry conditions in autumn indicates that moisture reservoirs are often still depleted after the summer, impairing the onset of the next vegetation cycle. By contrast, plant growth is inhibited by too-low temperatures in autumn, which distinguishes it from the antecedent summer period. The general transition to vulnerability to cold conditions already in August is astonishing. However, it should be noted that especially for the warmer regions – e.g. north-western Africa, Turkey and the interior of Spain – either vulnerability to hot conditions prevails or no FAPAR anomalies are detected during this time (see Figs. 6 and B1) because August is outside of the growing season and the FAPAR values are usually at their annual minimum at this time of the year. During the phase of the water-limited regime, soil moisture depletion in combination with high atmospheric evaporative demand leads to plant water stress and can ultimately cause plant mortality due to hydraulic failure or carbon starvation (van der Molen et al., 2011; Vicente-Serrano et al., 2020). As a coping strategy, plants, for example, reduce stomatal conductance to avoid hydraulic failure due to water loss by leaf transpiration, which consequently leads to reduced carbon uptake and thus decreased photosynthetic activity (van der Molen et al., 2011; Reichstein et al., 2013; Piao et al., 2019; Vicente-Serrano et al., 2020). The vulnerability to cold conditions in most months from November to April confirms that ecosystems are energy-limited in this period and is probably related to frost damage during cold spells. Related to the Cyprus Low, cold spells often co-occur with heavy precipitation in the eastern Mediterranean during this time (de Luca et al., 2020). Presumably, wet conditions only coincide with cold conditions but are not damaging ecosystems as such. However, vulnerability of crops to wet conditions in winter was observed, for example, on the Iberian Peninsula in a study by Páscoa et al. (2017). While ecosystem activity in the northern Mediterranean is low during winter, this does not hold true for the southern Mediterranean; e.g. for some regions in Tunisia the NDVI peaks as early as December (Le Page and Zribi, 2019). Cloudiness during precipitation leads to reduced solar radiation and consequently lower surface temperature (Berg et al., 2015). This way, cold and wet conditions can lead to low transpiration rates of plants accompanied by low photosynthetic activity, leading to reduced extraction of soil moisture during that time period (Zscheischler et al., 2015). This highlights the bidirectional relation between vegetation and soil moisture; i.e. not only is the state of the vegetation dependent on soil moisture but also vice versa. This mutual linkage is neglected in many studies (Dorigo et al., 2017).
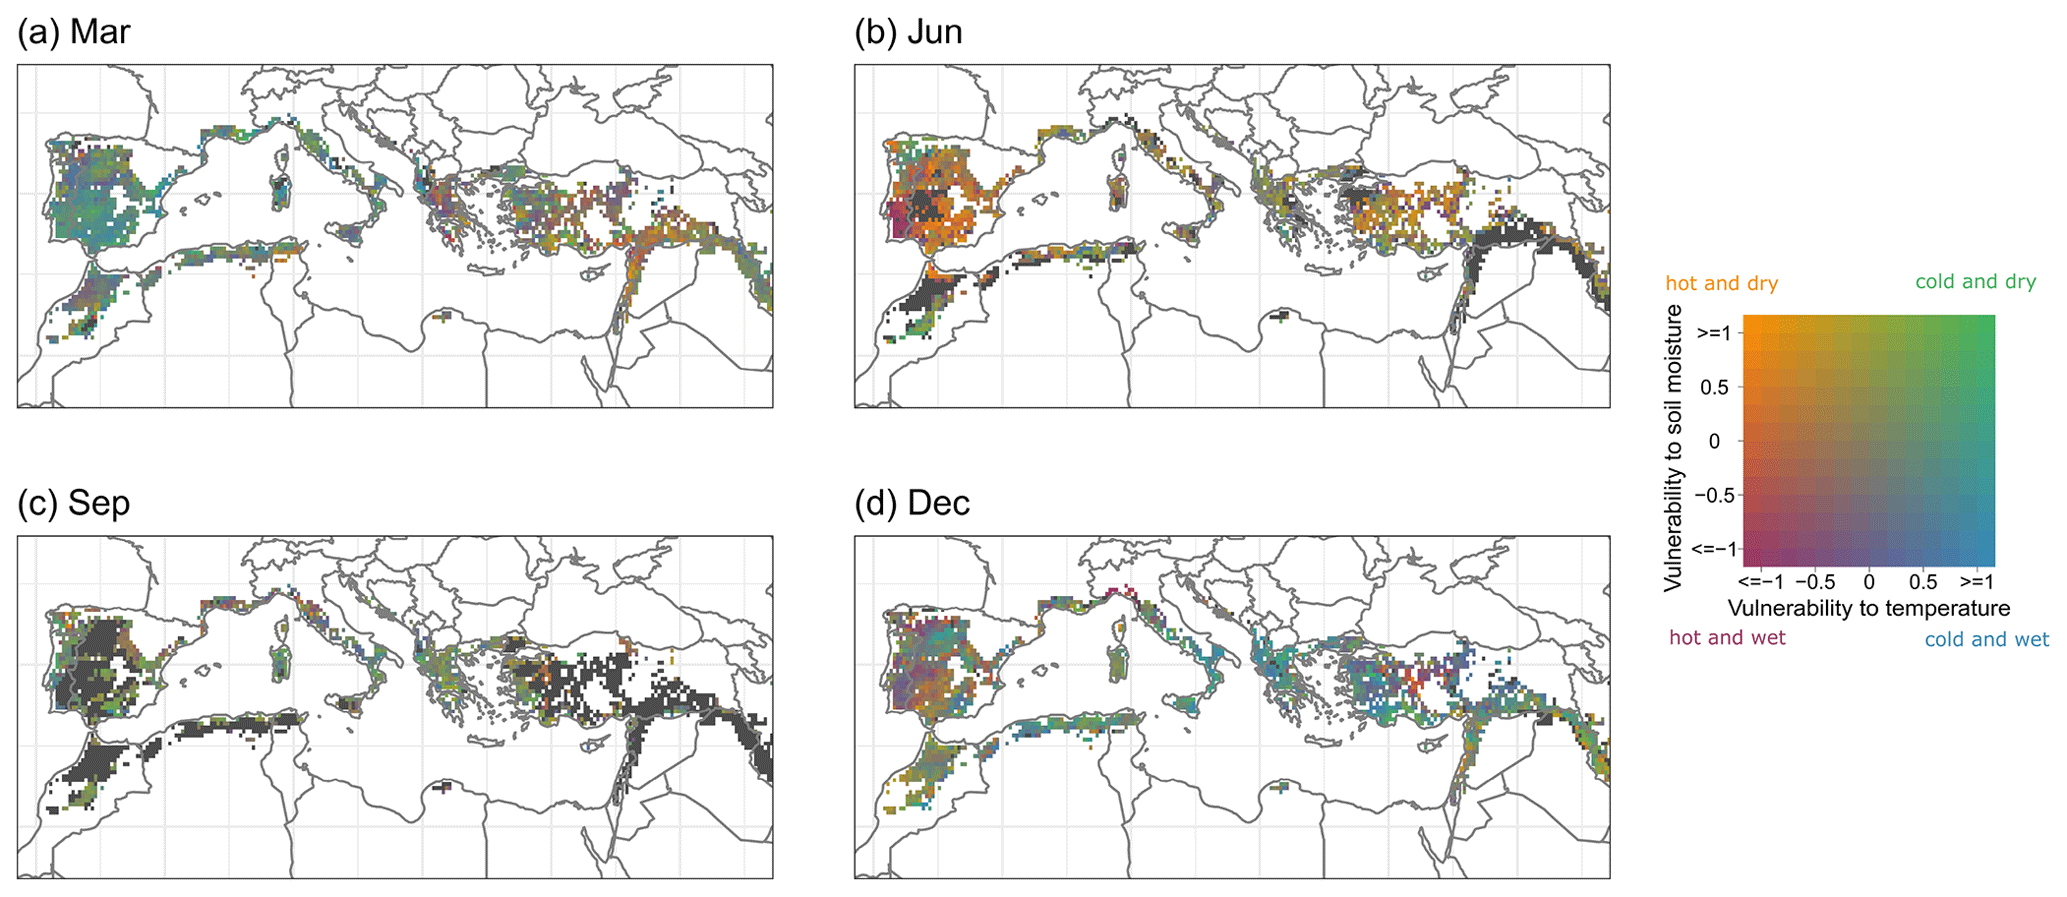
Figure 7Average monthly vulnerability to soil moisture (ESA CCI) and temperature (ERA5-Land) in the Mediterranean Basin for (a) March, (b) June, (c) September and (d) December. Grid points without any events during the respective month are displayed in black.
Energy-limited regimes merge gradually into water-limited regimes from Scandinavia southwards to the Mediterranean in Europe (Teuling et al., 2009). Karnieli et al. (2019) investigated the relationship of the NDVI and land surface temperature at the European scale, hypothesising that a positive relationship indicates an energy-limited condition and a negative one a water-limited condition. Our results are mostly in agreement with the findings of their study that temperature and the NDVI are comprehensively negatively related in summer in Mediterranean Europe, whereas in spring this is only the case in the southernmost regions of Mediterranean Europe, while in other areas either neutral or negative relationships prevail. According to Le Page and Zribi (2019), temperature and the NDVI are always negatively correlated in north-western Africa, while soil moisture and the NDVI are positively correlated. This indicates that this region is soil-moisture-limited year-round, which is in good agreement with our results obtained using the ESA CCI soil moisture data set. However, the ERA5-Land soil moisture data set exhibits vulnerability to wet conditions in north-western Africa in several months of the year, which might indicate lower suitability of this reanalysis data set to represent the soil moisture conditions in this region (see Figs. 6 and A2).
Extreme ecosystem impacts are not always connected to climatic extremes but can also be caused by a combination of concurrent moderate climatic drivers (Pan et al., 2020; van der Wiel et al., 2020). Furthermore, extreme ecosystem impacts are not solely related to soil moisture and temperature anomalies. Other potential causes are, for example, windthrow, pest outbreaks and fires, which often exhibit synergistic effects in combination with droughts and heat waves (Gouveia et al., 2012; Reichstein et al., 2013; Batllori et al., 2017; Ruffault et al., 2018). Furthermore, many ecosystems are managed, which also affects ecosystem productivity (Smit et al., 2008). These additional drivers should be taken into consideration when interpreting the results of this study.
The impact of climate extremes on ecosystems depends highly on their timing (Smith, 2011; Wolf et al., 2016; Piao et al., 2019). The sensitivity to heat varies with phenophase (Hatfield and Prueger, 2015), and the effect on the carbon cycle can differ seasonally. High temperatures might, for example, increase carbon uptake by advancing spring onset but may lead to uptake reductions in summer (Piao et al., 2019). In the same way, droughts can either accelerate the phenological cycle or inhibit plant productivity, and their impact on vegetation is strongly connected to the seasonal variations in the water balance (Spano et al., 2013; Gouveia et al., 2017). The highest detrimental impacts on ecosystems by droughts in the Mediterranean have been reported at the beginning of the year at the peak of the growing season (Ivits et al., 2016; Peña-Gallardo et al., 2019). The drought and heat wave in 2003 were comparably not that harmful to Mediterranean ecosystems as they occurred in August, which is outside the main growing season (Ivits et al., 2016). The approach presented in this study helps to gain a better understanding of which stages of the year are vulnerable to which climatic condition. To our knowledge, none of the previous studies which applied the framework for ecosystem vulnerability accounted for the effects of seasonality so far. However, ecosystem responses are highly sensitive to the timing of events; therefore, it is crucial to consider this.
Climate change leads to seasonal shifts, which already becomes apparent in the strong phenological changes in the Mediterranean (Menzel et al., 2006; Gordo and Sanz, 2009, 2010). For example, higher temperatures lead to increased ecosystem productivity and subsequently higher evapotranspiration earlier in the growing season. Due to this, soil moisture is depleted faster, and therefore more energy is transferred into sensible heat instead of latent heat. As a consequence of these hot and dry conditions, the growing season might end prematurely (Seneviratne et al., 2010; Lian et al., 2020). The time series used here encompasses 21 years and is thus still too short for analysing long-term trends. Nevertheless, our approach can potentially be used to monitor how vulnerability changes in future for all 12 months of the year by comparing vulnerability during different multi-year time spans if time series of sufficient length are available. Hot and dry days are getting more persistent in summer, and unprecedented heat waves associated with Saharan warm air intrusions have occurred within the last years (Sousa et al., 2019; de Luca et al., 2020). Nevertheless, droughts and warm spells are increasing in spring as well (Vogel et al., 2021), which can have detrimental implications for the Mediterranean ecosystems as spring is the main growing season. With temperature increases in future, vulnerability to cold conditions might be constrained to a shorter time frame, whereas the time span with vulnerability to hot conditions might expand within the year. Increasing aridity is projected in the Mediterranean, especially during winter and spring (Samaniego et al., 2018), while at the same time heavy precipitation events are projected to increase (Toreti and Naveau, 2015). Thus, it remains difficult to determine how vulnerability to dry and wet conditions will evolve in future.
4.2 Potential limitations of the methodological procedure
The presented method depends heavily on the quality of the employed data types for both the two drivers and the impact proxy. Several limitations regarding moisture data are well known; e.g. the coarse spatial resolution impairs assessments at local scales. Furthermore, satellite-based soil moisture is limited to the retrieval of surface soil moisture, while deeper-reaching root-zone soil moisture is the actual ecologically relevant variable. Satellite-based soil moisture is only representative of the first 2–5 cm of the soil layer. The root zone of plants is usually deeper, which reduces the explanatory power of satellite-based soil moisture for drought impacts on ecosystems (Liu et al., 2016; Dorigo et al., 2017; West et al., 2019). For example, soil drying during summer affects primarily the top soil layer, while drying in deeper layers shows a lagged response because upward capillary flow from these layers is comparatively slow (Berg et al., 2017). Nicolai-Shaw et al. (2017) found that soil moisture data from ESA CCI were a good indicator for drought in grasslands, while forests exhibited weaker responses, probably due to access to deeper soil layers for forests compared to grasslands. However, we also assessed vulnerability to soil moisture at the depths 0–7, 7–28 and 28–100 cm using reanalysis data from ERA5-Land, and the patterns obtained at the deeper layers 7–28 and 28–100 cm are in large part similar to the ones of the layer at 0–7 cm (see Appendix A). This indicates that the assessment of the top soil layer is able to yield results which are valid for a larger proportion of the soil column. Coupling of land surface models with satellite-based surface soil moisture can further enhance knowledge on the status of root-zone soil moisture in future (Dorigo et al., 2017; Tramblay et al., 2020). Furthermore, it should be noted that validations of the ESA CCI soil moisture data set with in situ observations from Mediterranean sites in Spain, France and Turkey showed high agreement (Albergel et al., 2013; Dorigo et al., 2015; Bulut et al., 2019). Also the FAPAR product from the CGLS has been validated with observation data from Tunisia, Italy, Spain and France, primarily for a variety of crop types as well as a deciduous broadleaf forest in Italy and a needle-leaf forest in Spain (Fuster et al., 2020). The FAPAR is often assumed to be directly linked to productivity. However, droughts might lead to physiological changes such as stomata closure, which are not apparent in the spectral characteristics of the canopy and thus in the FAPAR but nevertheless invoke a decreased productivity. This was the case, for example, in forest ecosystems during the drought-and-heat-wave event in 2003 in Europe (Reichstein et al., 2007; Zhang et al., 2016).
The Mediterranean Basin is characterised by large spatial variability because of its complex topography (Lionello et al., 2006). The relatively coarse resolution of the ESA CCI soil moisture data set is currently limiting the representation of this high spatial complexity (Crocetti et al., 2020). Many land cover classes express similar patterns over the course of the year according to our results. This could potentially indicate that grid points are sometimes not homogeneous enough but rather represent a mixture of several land cover classes due to the coarse resolution of 0.25∘. The ESA CCI land cover product applied in this study is a state-of-the-art data set; a more detailed data set is currently not available for the Mediterranean Basin as a whole. The ESA CCI land cover classification allows only for the differentiation of major plant functional types, and future studies might benefit from a more refined land cover classification scheme with a broader variety of land cover classes. Furthermore, the subregions used in this study are not fully homogeneous, and there is a certain variability within a given subregion. Thus, the patterns identified in this study (see Figs. 5 and 6) cannot always be inferred for an entire subregion. Therefore, the ecosystem vulnerability maps (Figs. 7 and B1) should be additionally examined for the identification of potentially deviating patterns within subregions.
Many studies do not consider lagged effects in their design and the choice of a suitable timescale to account for such effects is not trivial and under debate (Zeng et al., 2013; Ivits et al., 2016). Response time varies depending on the type of event and the affected ecosystem. The response lag of vegetation is land-cover-specific as plants have various regulatory physiological functions to react to changes in soil moisture such as stress memory, water storage and stabilisation activities at the community level (van der Molen et al., 2011; Niu et al., 2014; Zhang et al., 2017). Faster response times to droughts are observed for pasture and crops compared to shrubs and forests (Chen et al., 2014; Bachmair et al., 2018). Generally, responses to drought are slower in semi-arid and sub-humid biomes compared to arid biomes (Vicente-Serrano et al., 2013). A study by Ivits et al. (2016) at the European scale found that vegetation in the Mediterranean responds slowly to meteorological droughts compared to most other European regions. Impacts on vegetation by meteorological and soil moisture droughts are often largest within the preceding 1 to 2 months (Zeng et al., 2013; Chen et al., 2014; Wu et al., 2015; Papagiannopoulou et al., 2017; Bachmair et al., 2018), which is the reason we decided on a 3-month timescale in the moving average applied to the environmental drivers in our approach. Temperature responses are usually faster than responses to drought but can still exhibit lagged responses up to a few months (Zeng et al., 2013; Papagiannopoulou et al., 2017). Temperature and soil moisture anomalies are usually analysed on different timescales (typically on a daily scale for temperature and on a monthly scale for soil moisture), which renders their joint assessment difficult. Ecosystem impacts can also vary substantially on a temporal scale from, for example, temporary changes in productivity to persistent regime shifts (Crausbay et al., 2017). Therefore, using a single timescale might not capture all relevant temporal dynamics. The choice of the optimal timescale is non-trivial, and, for example, timescales of less than a month for investigating drought impacts on vegetation have also been suggested (West et al., 2019).
Our analysis is year-round without being explicitly restricted to the months of the growing season, which makes it easily transferable to any study area. We decided this for two reasons. First, it is complex to account only for the months of the growing season as there is a large variability depending on latitude and longitude within the Mediterranean Basin (Lionello et al., 2006). Second, the analysis is implicitly limited to the growing season because FAPAR deviations during the dormant season are expected to be small and thus will exceed the extremeness threshold only on rare occasions. In our study, it can be clearly noted that the number of detected events is not distributed equally throughout the course of the year. They are at a minimum at the transition from summer to autumn, when ecosystem activity is low in the Mediterranean (see Sect. 3.2). Therefore, large areas – especially in the interior of the countries – are under-represented in these months. Results for months during the dormant season should be interpreted cautiously (Ivits et al., 2016), taking into account that they depend on a considerably lower number of events. These events might be representative solely of specific ecosystems that are still active at this time of the year or may partially result from noise in the data.
The seasonal ecosystem vulnerability analysis presented in this study helps identify the time of the year at which vulnerability to a certain climatic condition occurs. The vulnerability of Mediterranean ecosystems to the concurrent climatic drivers temperature and soil moisture was successfully assessed using the FAPAR as a proxy for ecosystem productivity, with a focus on the variation in impacts with seasonality. Our results are in line with the characteristic intra-annual change between an energy-limited and a water-limited regime from winter to summer in the Mediterranean (Schwingshackl et al., 2017). In general, three seasonal stages of vulnerability are identified throughout the year: (1) vulnerability to hot and dry conditions in late spring to midsummer, (2) vulnerability to cold and dry conditions from the end of summer to mid-autumn, and (3) vulnerability during cold and wet conditions from the end of autumn to mid-spring. There are several regions which deviate from this pattern; e.g. the “hot and dry” regime is extended from spring to autumn in Turkey, whereas the Balkan Peninsula is continuously energy-limited throughout the year and not vulnerable to hot conditions. Our results point out the necessity to incorporate seasonality in the vulnerability analysis concept as well as to examine vulnerability at a subregional scale to account for the large spatial and temporal variability in the Mediterranean. Increasing aridity and fast changes in the phenological cycle are observed in the Mediterranean Basin due to climate change (Gao and Giorgi, 2008; Gordo and Sanz, 2010). The approach for detecting seasonal ecosystem vulnerability opens novel opportunities for developing early-warning tools to identify detrimental ecosystem conditions, water limitations and irrigation demand in near-real time and for performing long-term assessments of ecosystem vulnerability and change for the near- and mid-future climate scenarios.
The ERA5-Land soil moisture layer at 0–7 cm gives very similar results compared to the ESA CCI data set in the second half of the year (August–December) for most land cover classes (see Fig. A1), where the patterns are identical in most cases; for “all land cover classes” they are in agreement from June to December. However, in spring they often deviate, e.g. in May, when dry conditions arise in the ERA5-Land data set, whereas using ESA CCI there is no significant vulnerability to dry conditions for many land cover classes. For land cover classes such as “crops (rainfed)” vulnerability to dry conditions in May seems realistic as various crops are prone to drought in their reproductive phase (Zhang and Oweis, 1999; Daryanto et al., 2016), which indicates that ERA5-Land might give more plausible results for the month of May. “Shrubland” is often prone to dry conditions in the second half of the year in the ESA CCI data set, whereas according to the ERA5-Land data set it is not. Also “forest (broadleaved)” is prone to dry conditions from June to October in the ESA CCI data set, unlike in the ERA5-Land data set, where it is vulnerable to dry conditions from September to October but not during summer. However, there is no apparent systematic bias over all classes, but rather it changes by month. So, in February, vulnerability in the ERA5-Land data set, for example, leans more towards dry conditions, whereas in July this pattern is reversed.
During most of the year, the majority of subregions coincide well in both data sets, but there are exceptions (see Fig. A2). There is vulnerability to dry conditions in August in the Balkans, the Iberian Peninsula and in north-western Africa for ESA CCI soil moisture, whereas for ERA5-Land this is reversed or insignificant. For north-western Africa, ERA5-Land detects lower vulnerability to dry conditions than ESA CCI throughout the course of the year. In addition, in the Iberian Peninsula vulnerability to wet conditions is pronounced at the beginning of the year for ESA CCI, whereas for ERA5-Land most months during this period show vulnerability to dry conditions.
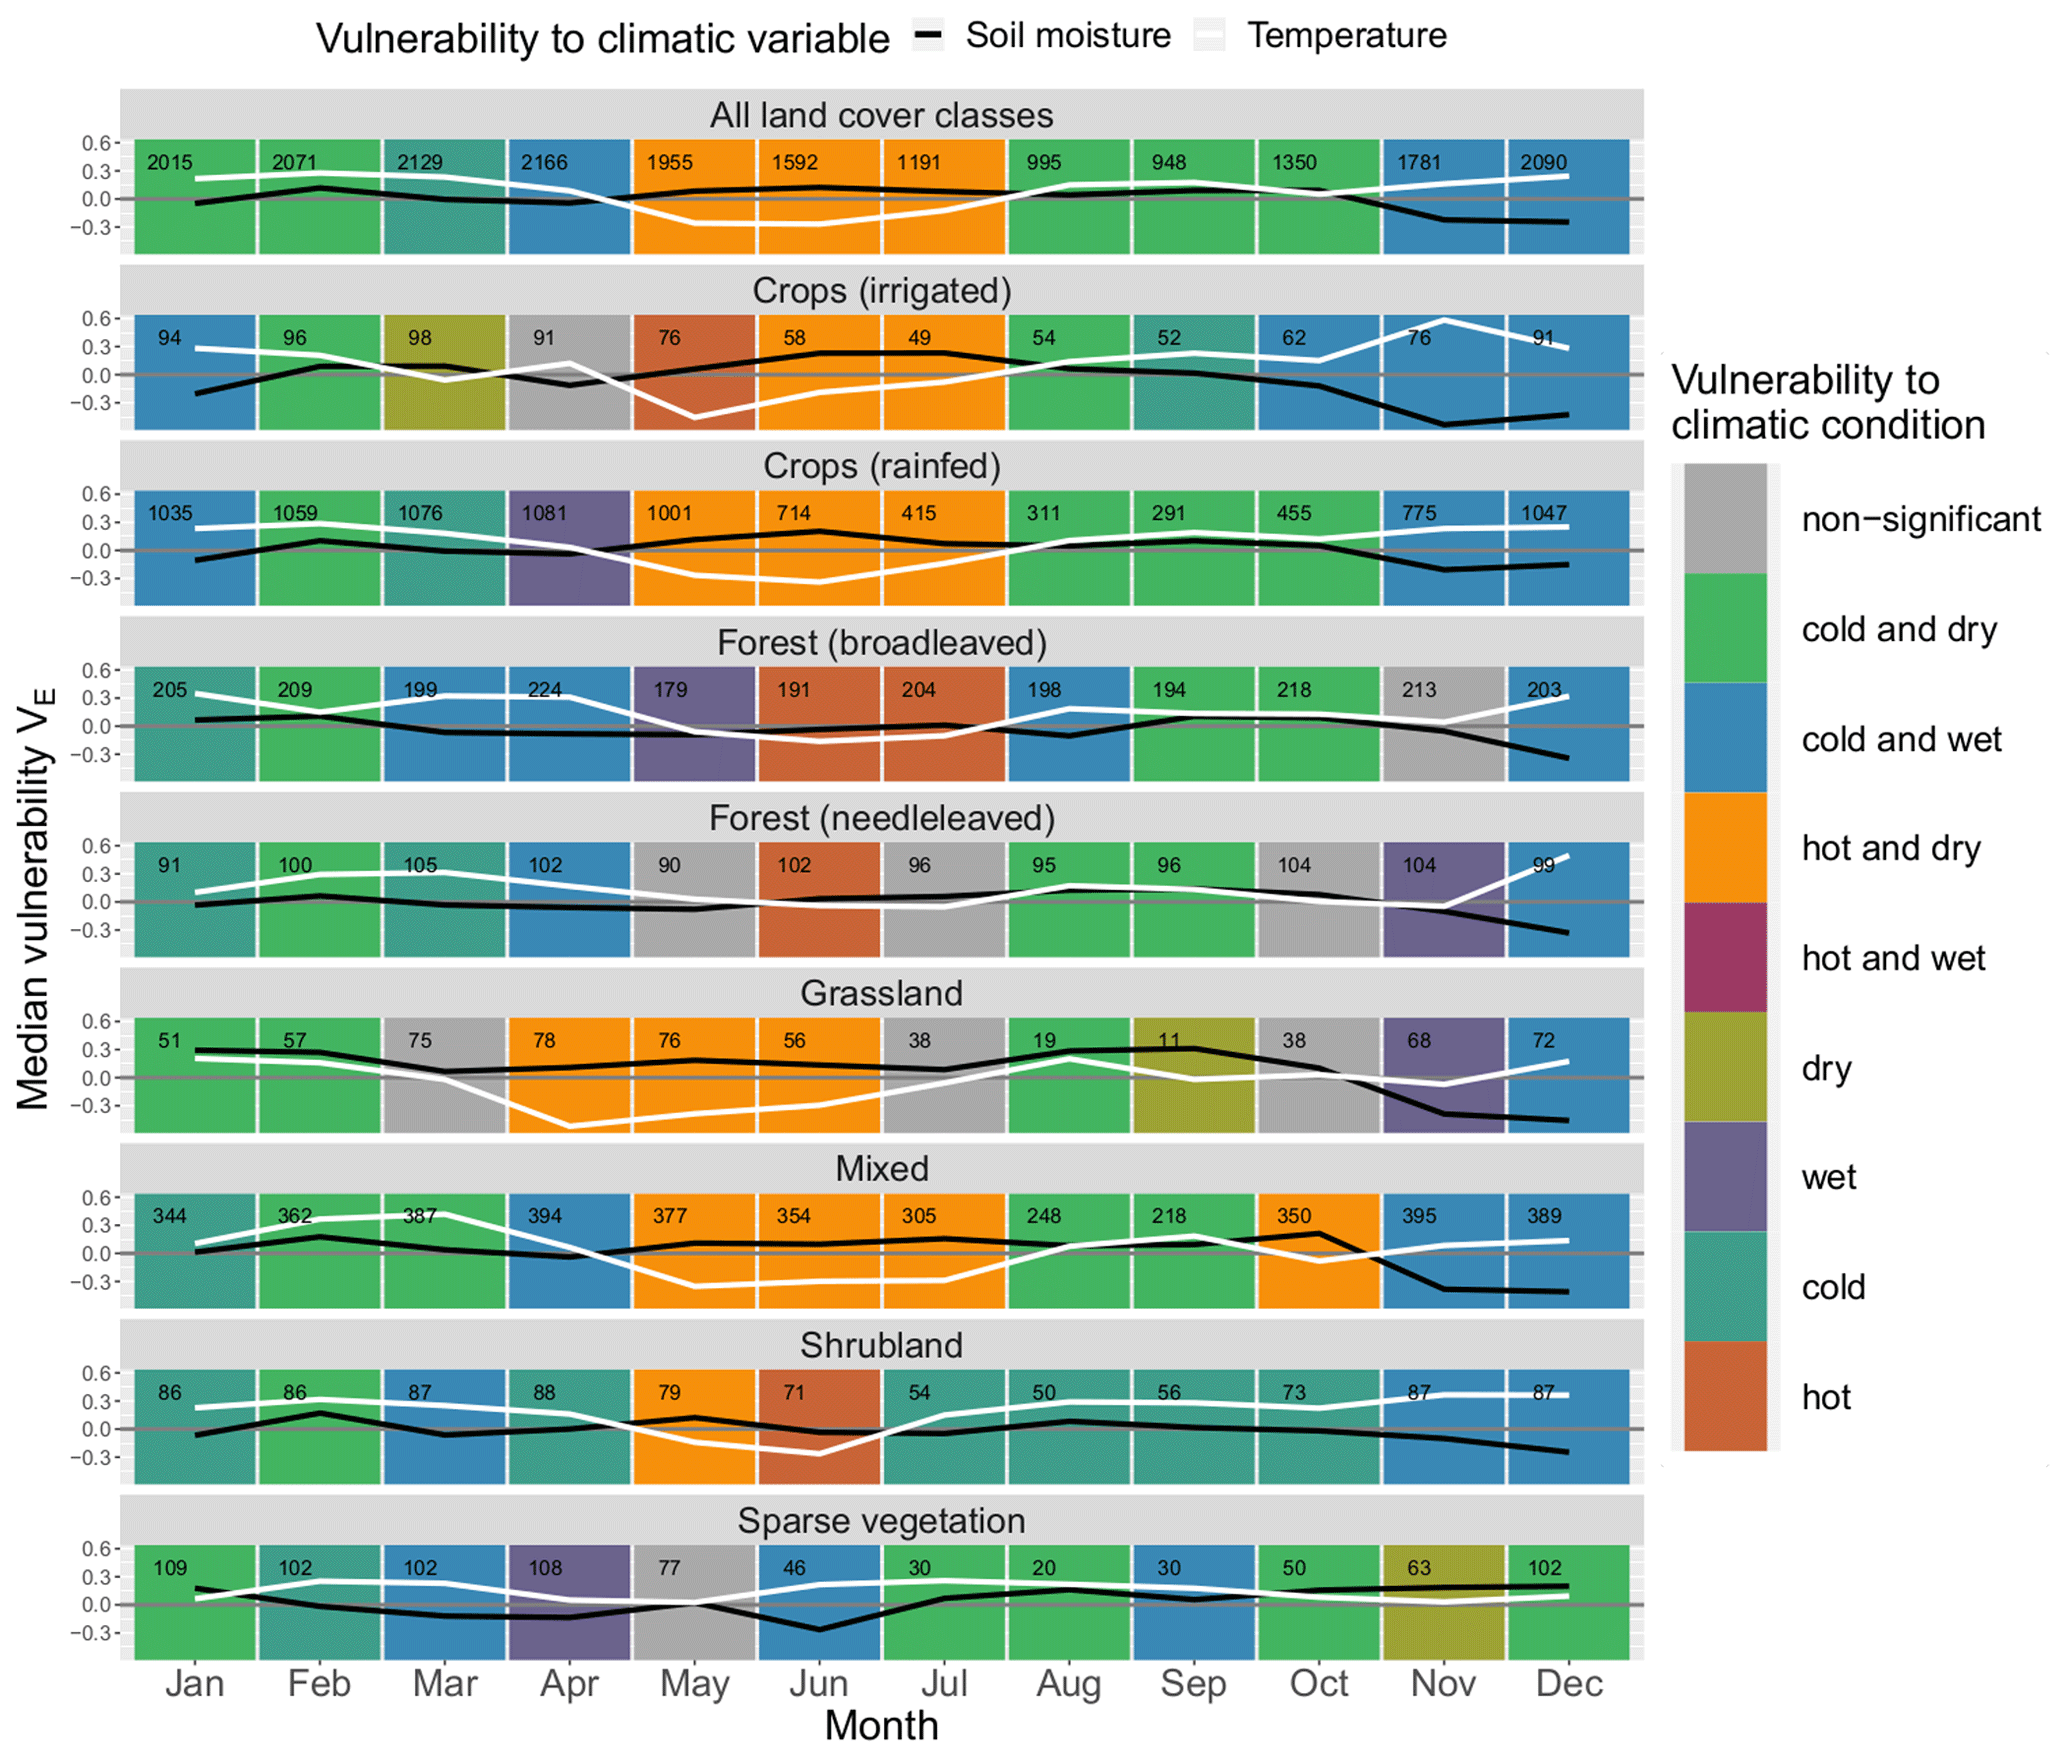
Figure A1Median monthly ecosystem vulnerability per land cover. Vulnerability to temperature (ERA5-Land) is shown in white, and vulnerability to soil moisture (ERA5-Land at depth 0–7 cm) is shown in black for each month of the year (columns) for each land cover (rows). Months with statistically significant deviation in climatic drivers during non-hazardous and hazardous ecosystem conditions according to the Mann–Whitney U test based on a significance level α=0.05 are shown in colour (see legend); all other months are shown in grey. The number of grid points in which an event has occurred in this month and land cover within the period 1999–2019 is shown in the upper left corner of each panel.
In addition to the soil moisture layer corresponding to 0–7 cm soil depth, vulnerability to soil moisture was also analysed for the layers at 7–28 and 28–100 cm (see Figs. A3, A4, A5, A6). The patterns at these deeper layers largely coincide with the surface soil moisture layer (see Figs. A1, A2).
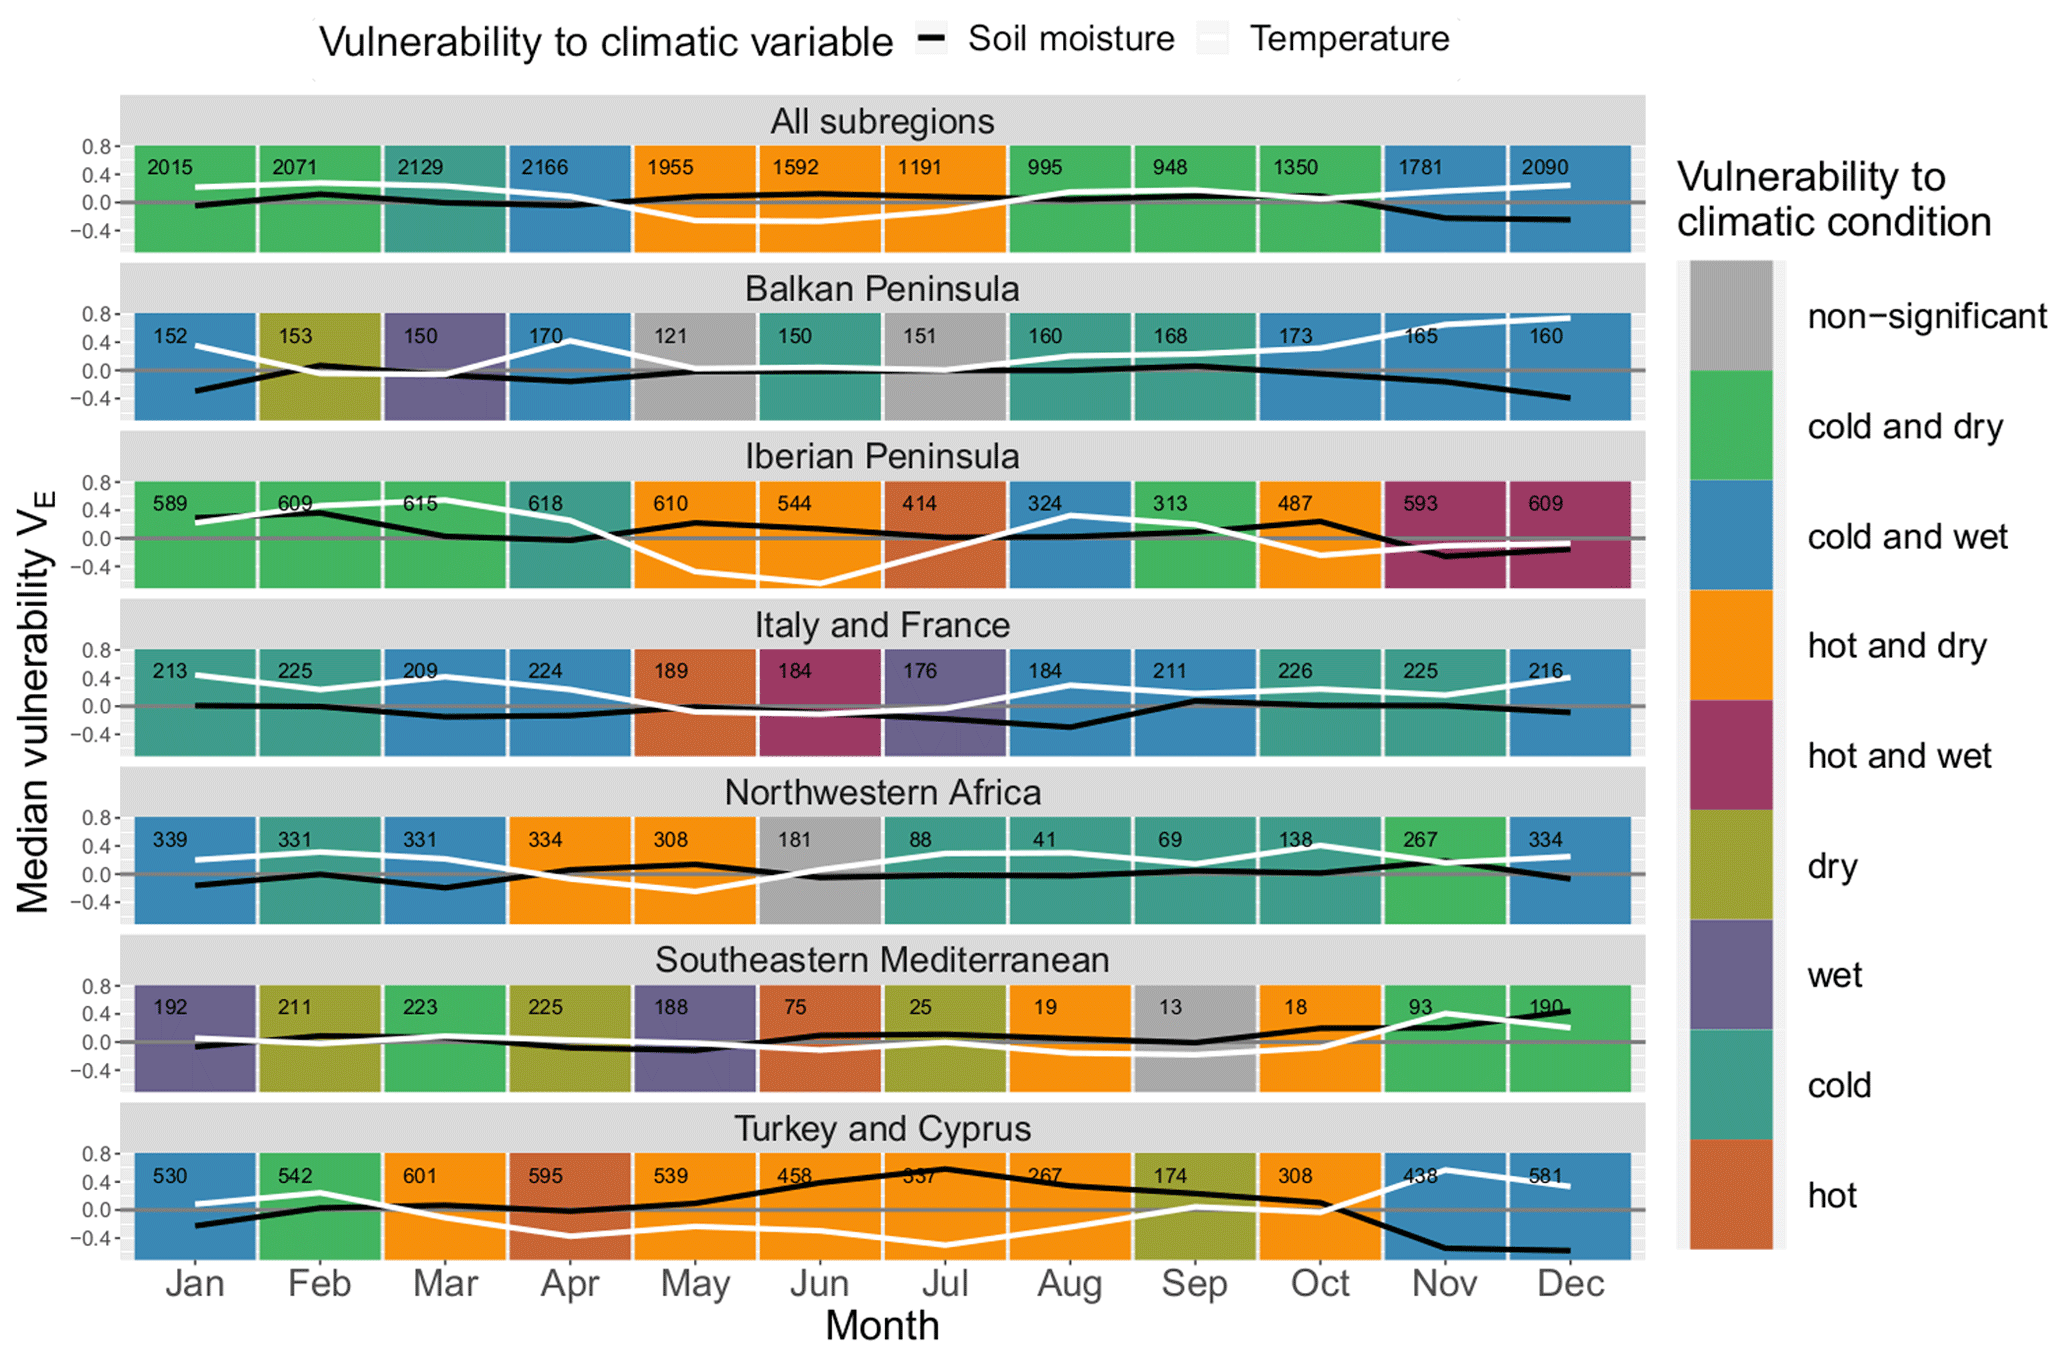
Figure A2Median monthly ecosystem vulnerability per subregion. Vulnerability to temperature (ERA5-Land) is shown in white, and vulnerability to soil moisture (ERA5-Land at depth 0–7 cm) is shown in black for each month of the year (columns) for each land cover (rows). Months with statistically significant deviation in climatic drivers during non-hazardous and hazardous ecosystem conditions according to the Mann–Whitney U test based on a significance level α=0.05 are shown in colour (see legend); all other months are shown in grey. The number of grid points in which an event has occurred in this month and land cover within the period 1999–2019 is shown in the upper left corner of each panel.
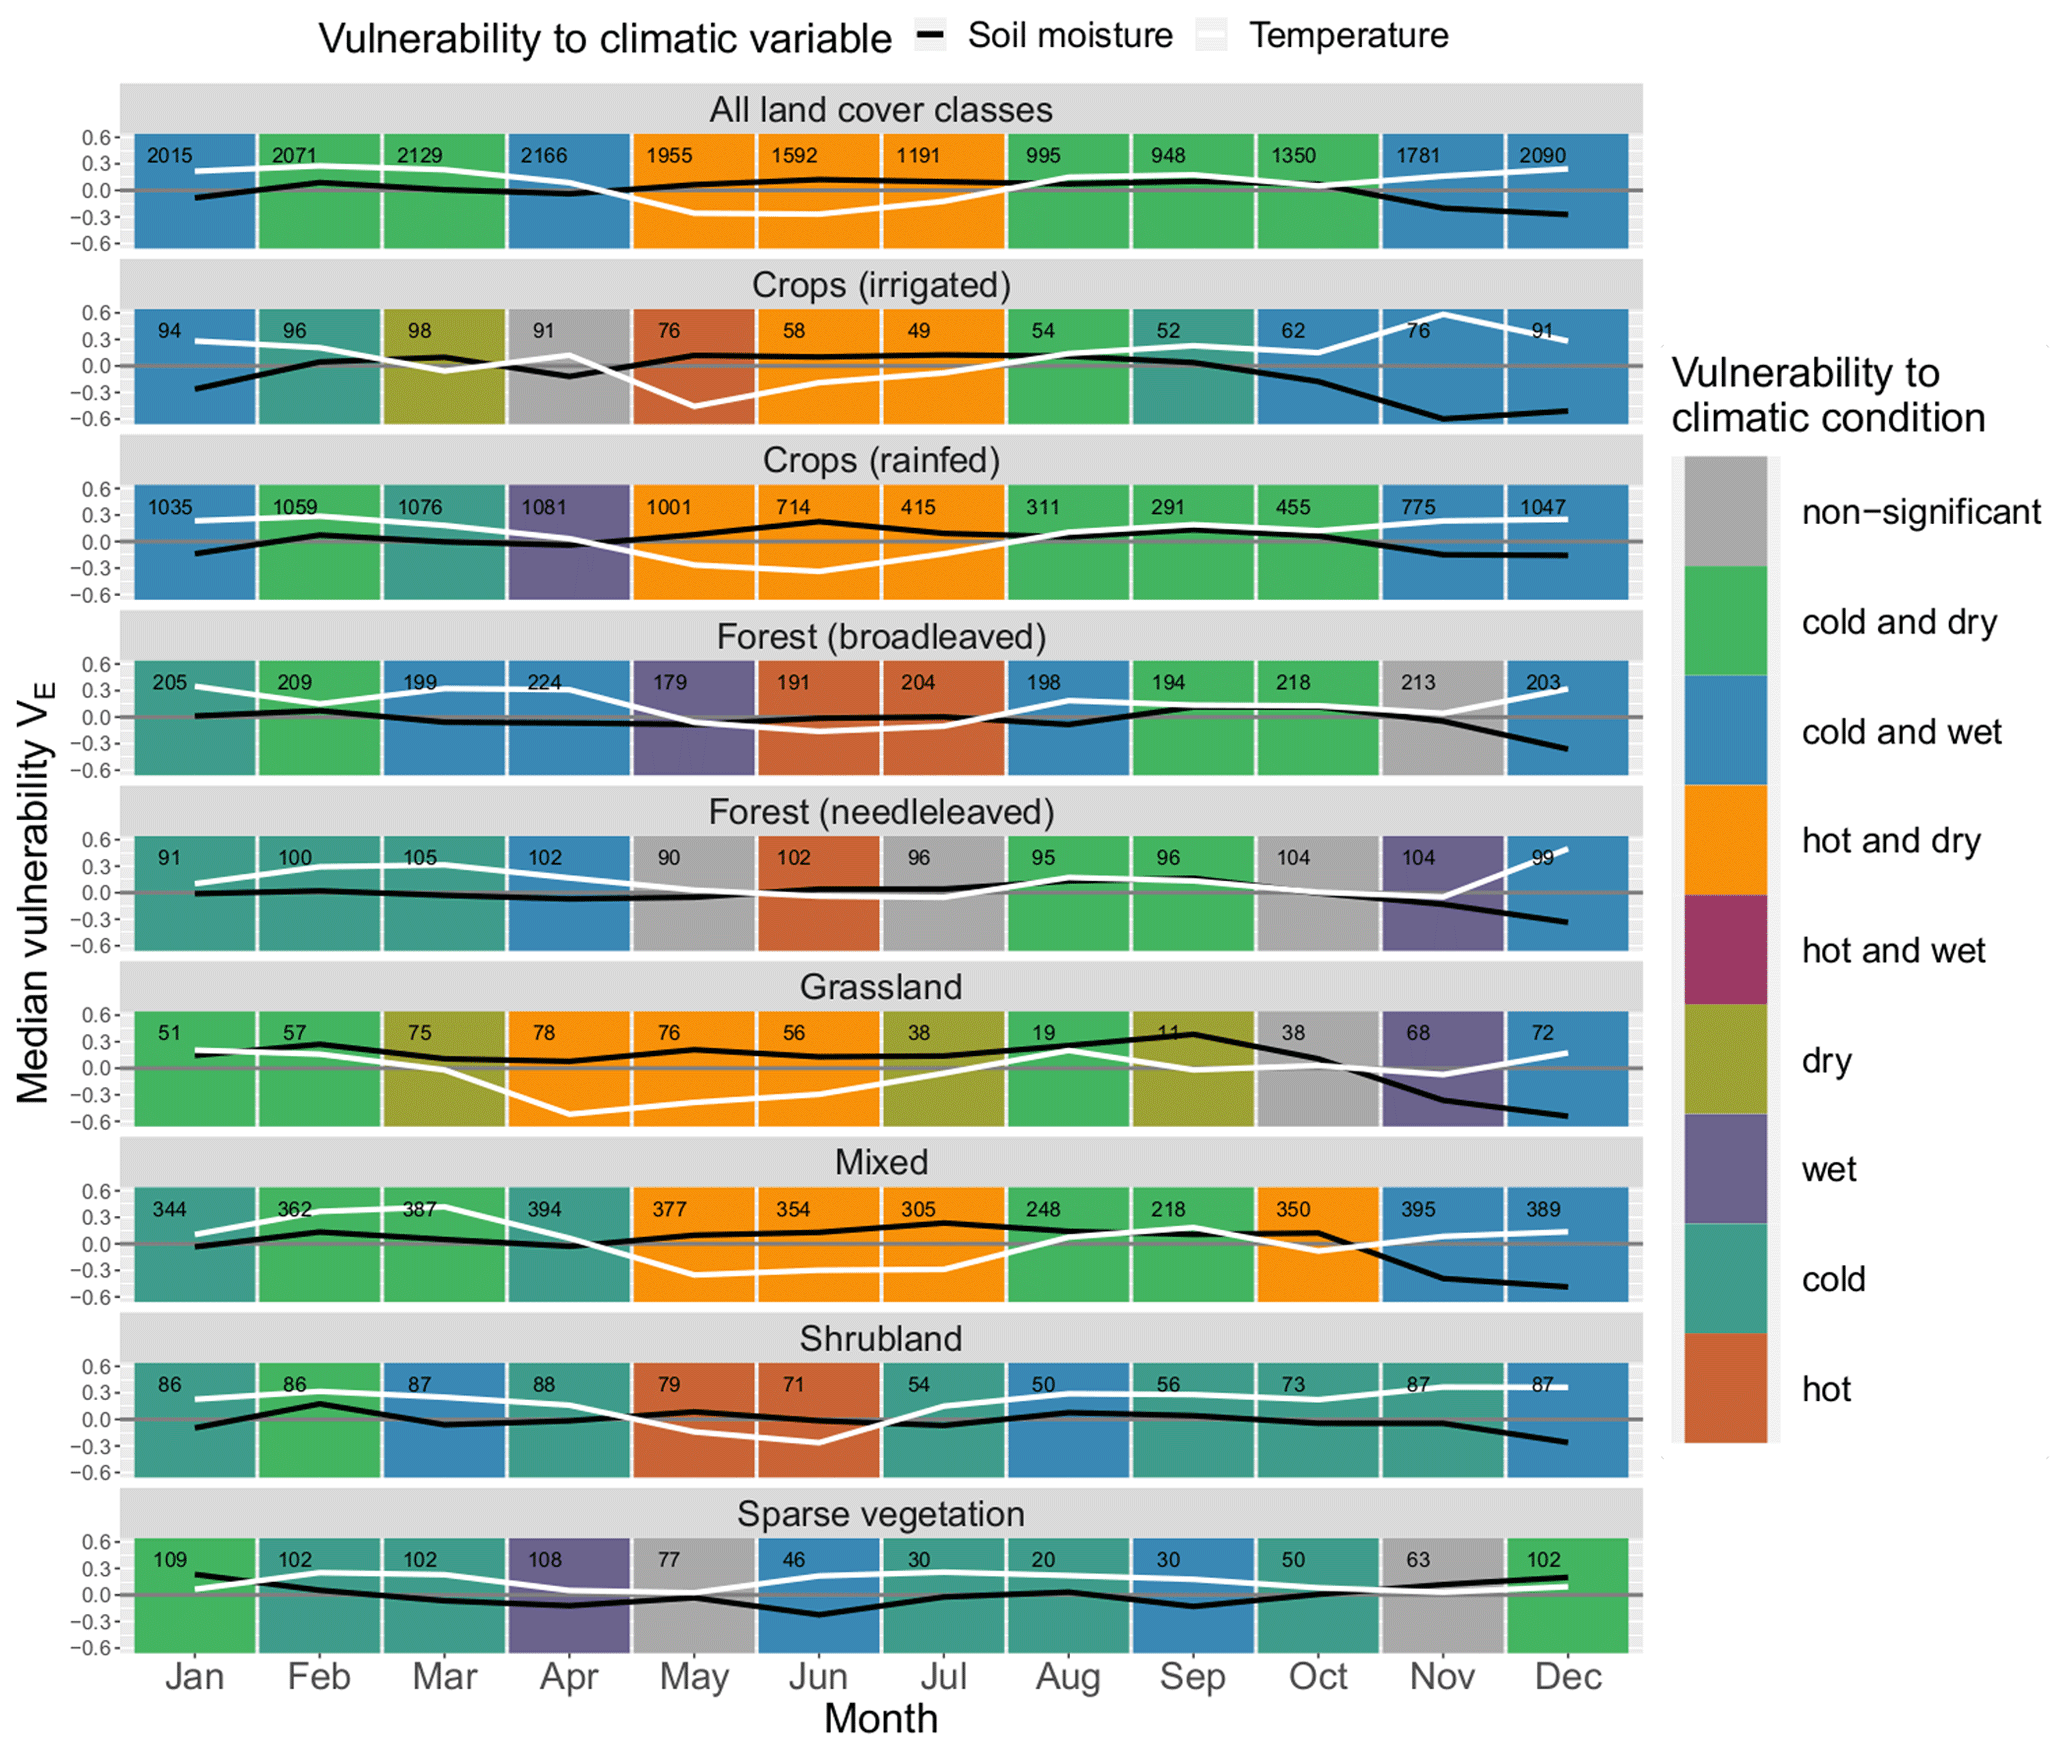
Figure A3Median monthly ecosystem vulnerability per land cover. Vulnerability to temperature (ERA5-Land) is shown in white, and vulnerability to soil moisture (ERA5-Land at depth 7–28 cm) is shown in black for each month of the year (columns) for each land cover (rows). Months with statistically significant deviation in climatic drivers during non-hazardous and hazardous ecosystem conditions according to the Mann–Whitney U test based on a significance level α=0.05 are shown in colour (see legend); all other months are shown in grey. The number of grid points in which an event has occurred in this month and land cover within the period 1999–2019 is shown in the upper left corner of each panel.
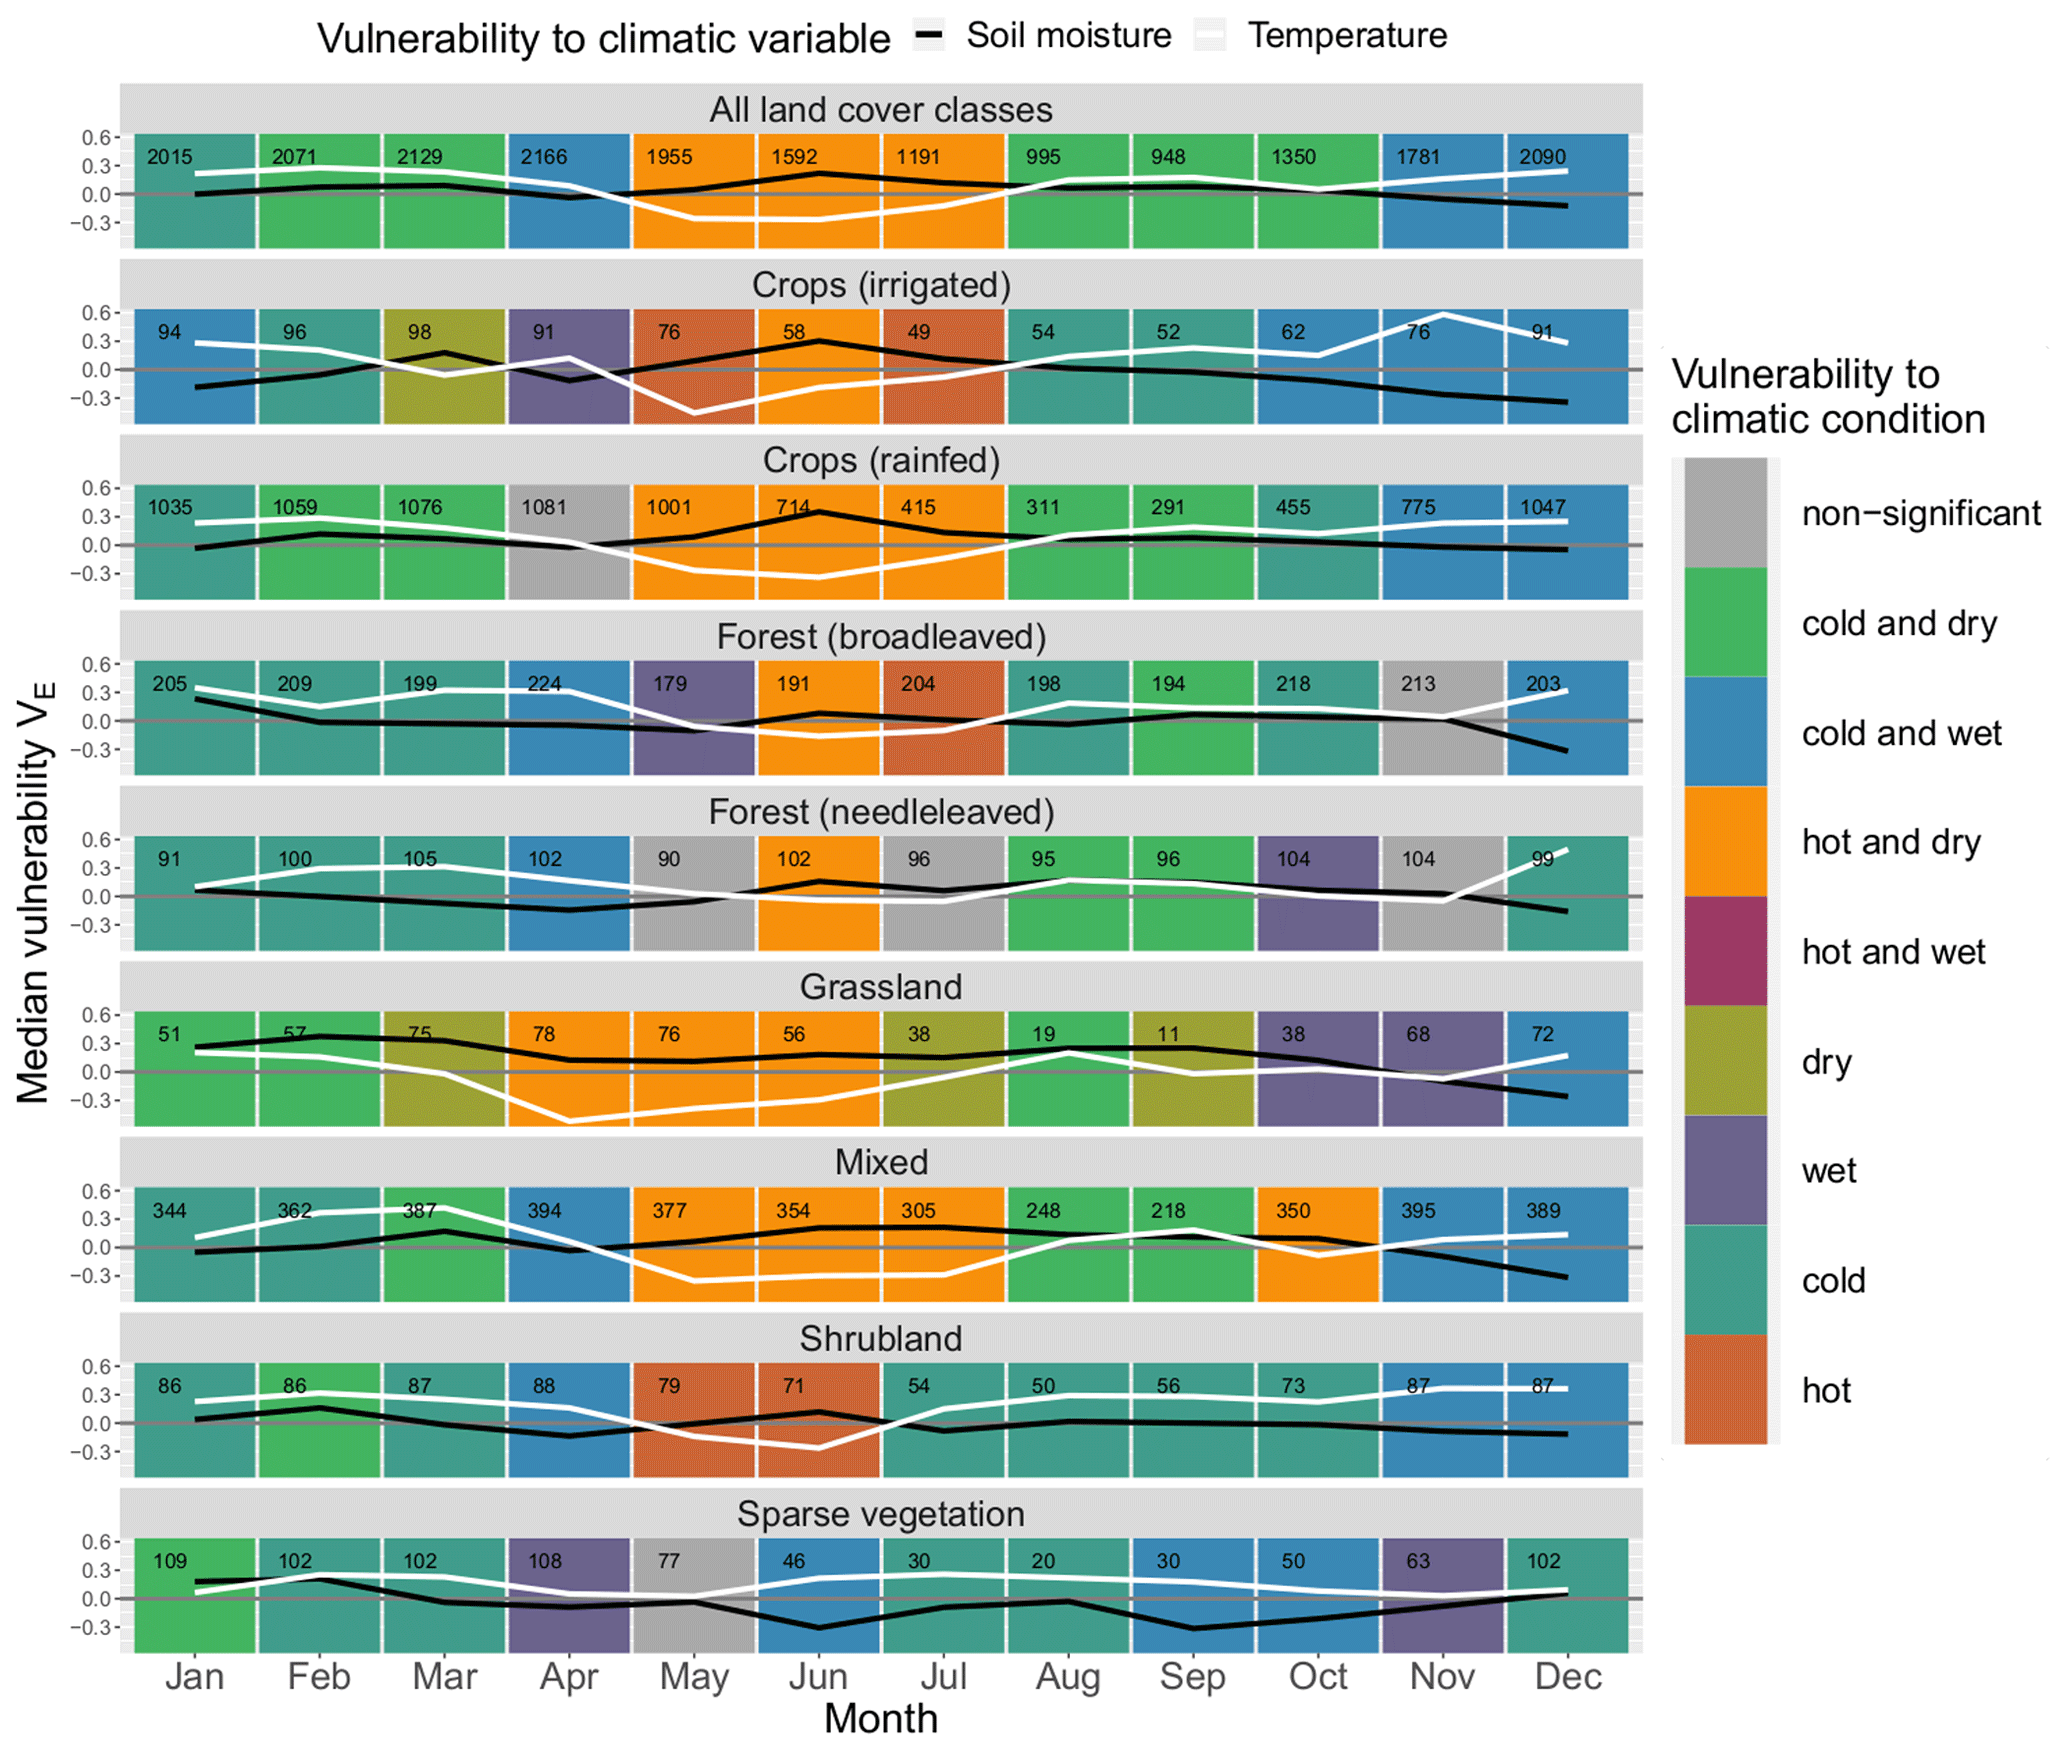
Figure A4Median monthly ecosystem vulnerability per land cover. Vulnerability to temperature (ERA5-Land) is shown in white, and vulnerability to soil moisture (ERA5-Land at depth 28–100 cm) is shown in black for each month of the year (columns) for each land cover (rows). Months with statistically significant deviation in climatic drivers during non-hazardous and hazardous ecosystem conditions according to the Mann–Whitney U test based on a significance level α=0.05 are shown in colour (see legend); all other months are shown in grey. The number of grid points in which an event has occurred in this month and land cover within the period 1999–2019 is shown in the upper left corner of each panel.
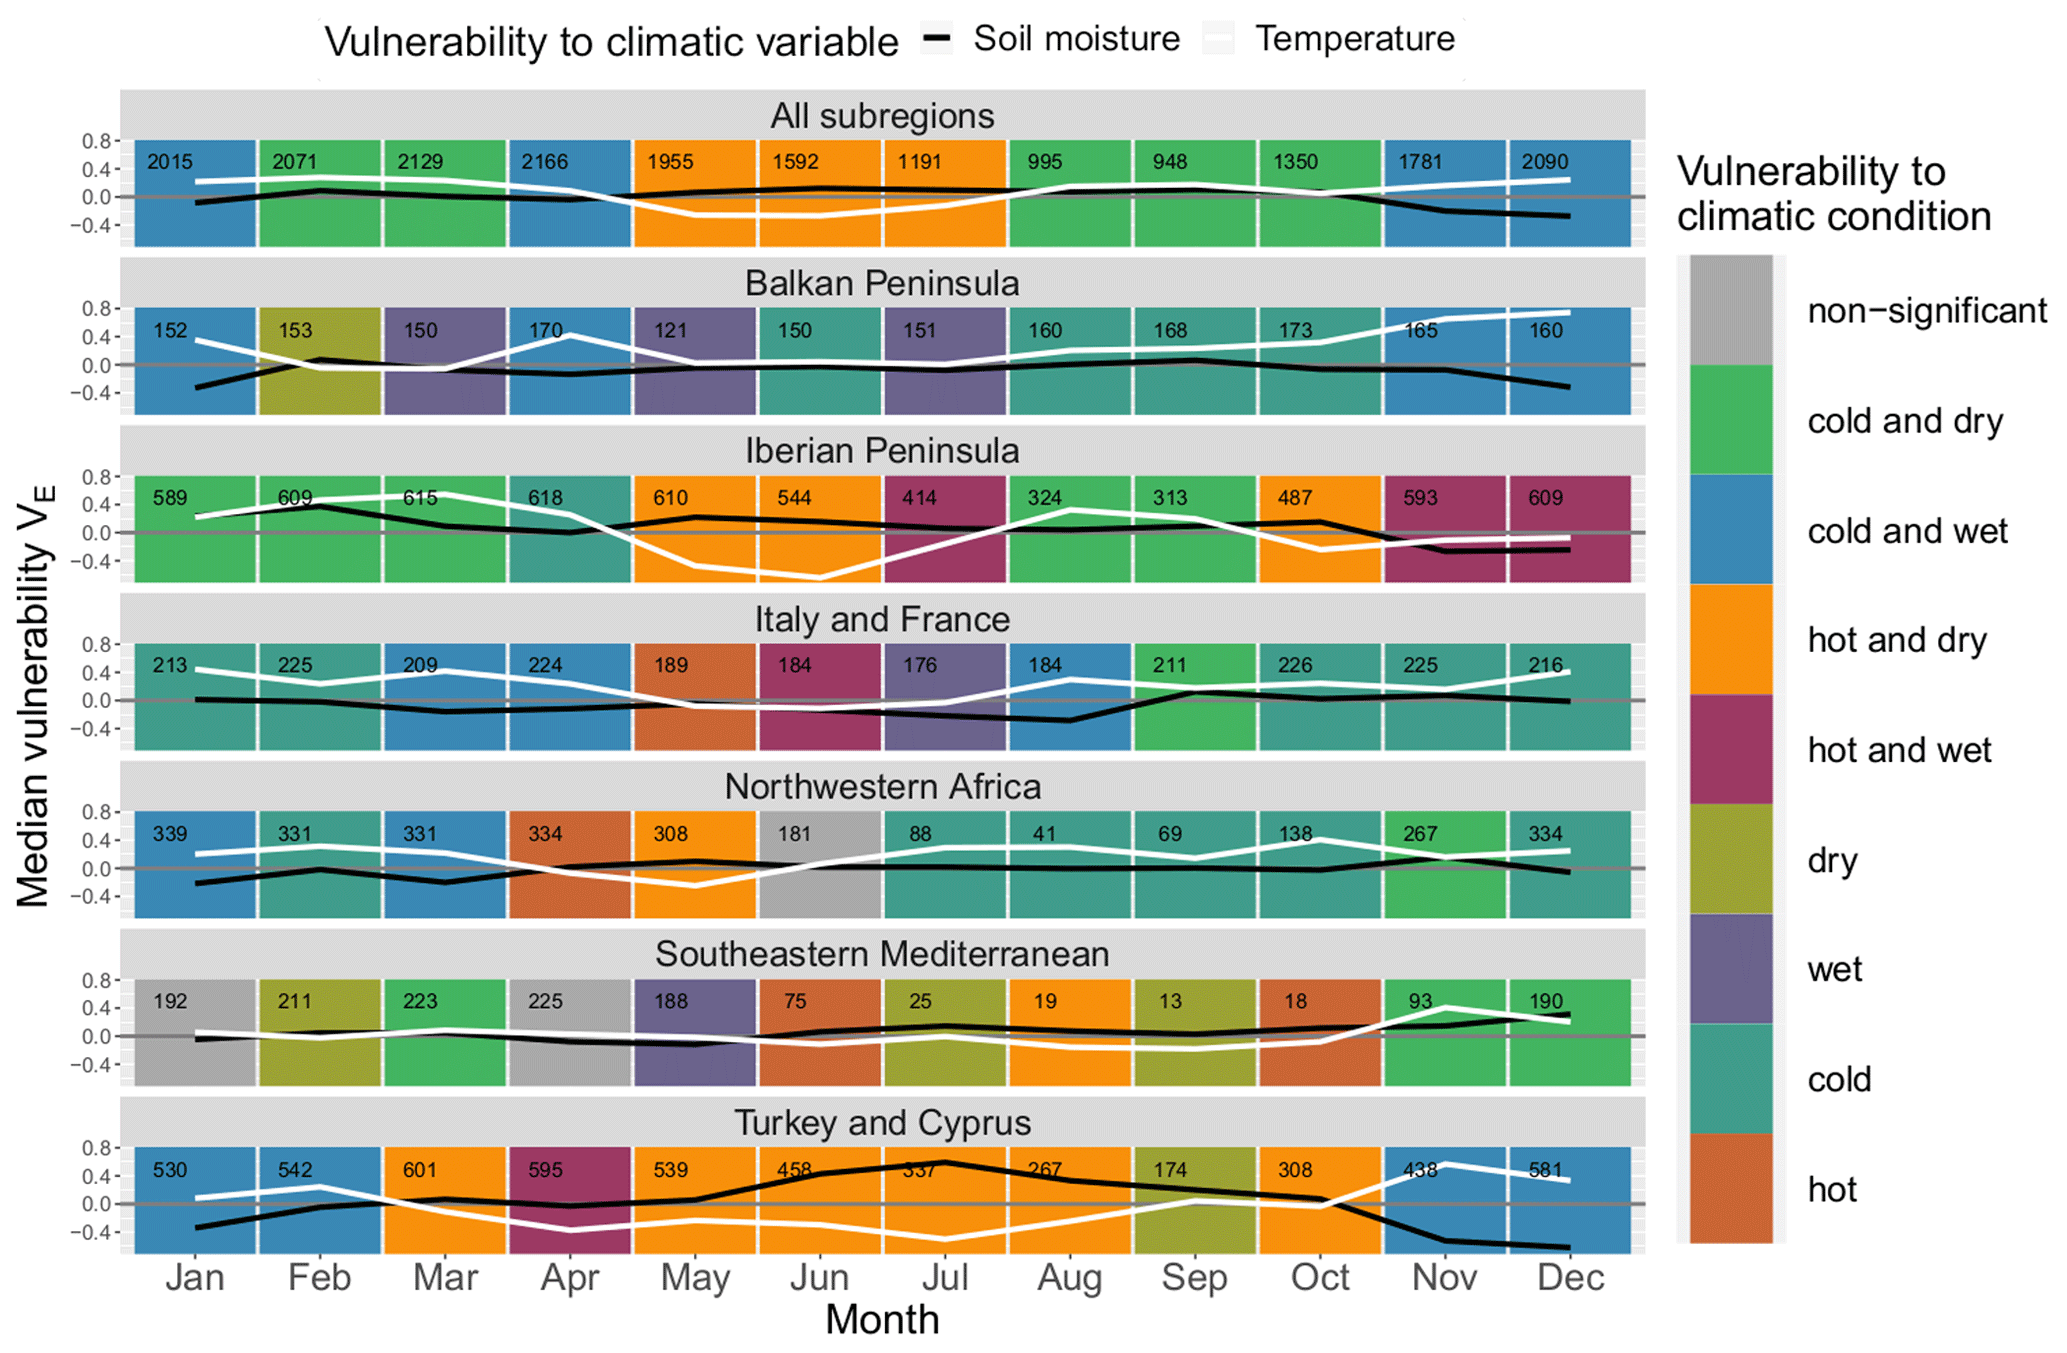
Figure A5Median monthly ecosystem vulnerability per subregion. Vulnerability to temperature (ERA5-Land) is shown in white, and vulnerability to soil moisture (ERA5-Land at depth 7–28 cm) is shown in black for each month of the year (columns) for each land cover (rows). Months with statistically significant deviation in climatic drivers during non-hazardous and hazardous ecosystem conditions according to the Mann–Whitney U test based on a significance level α=0.05 are shown in colour (see legend); all other months are shown in grey. The number of grid points in which an event has occurred in this month and land cover within the period 1999–2019 is shown in the upper left corner of each panel.
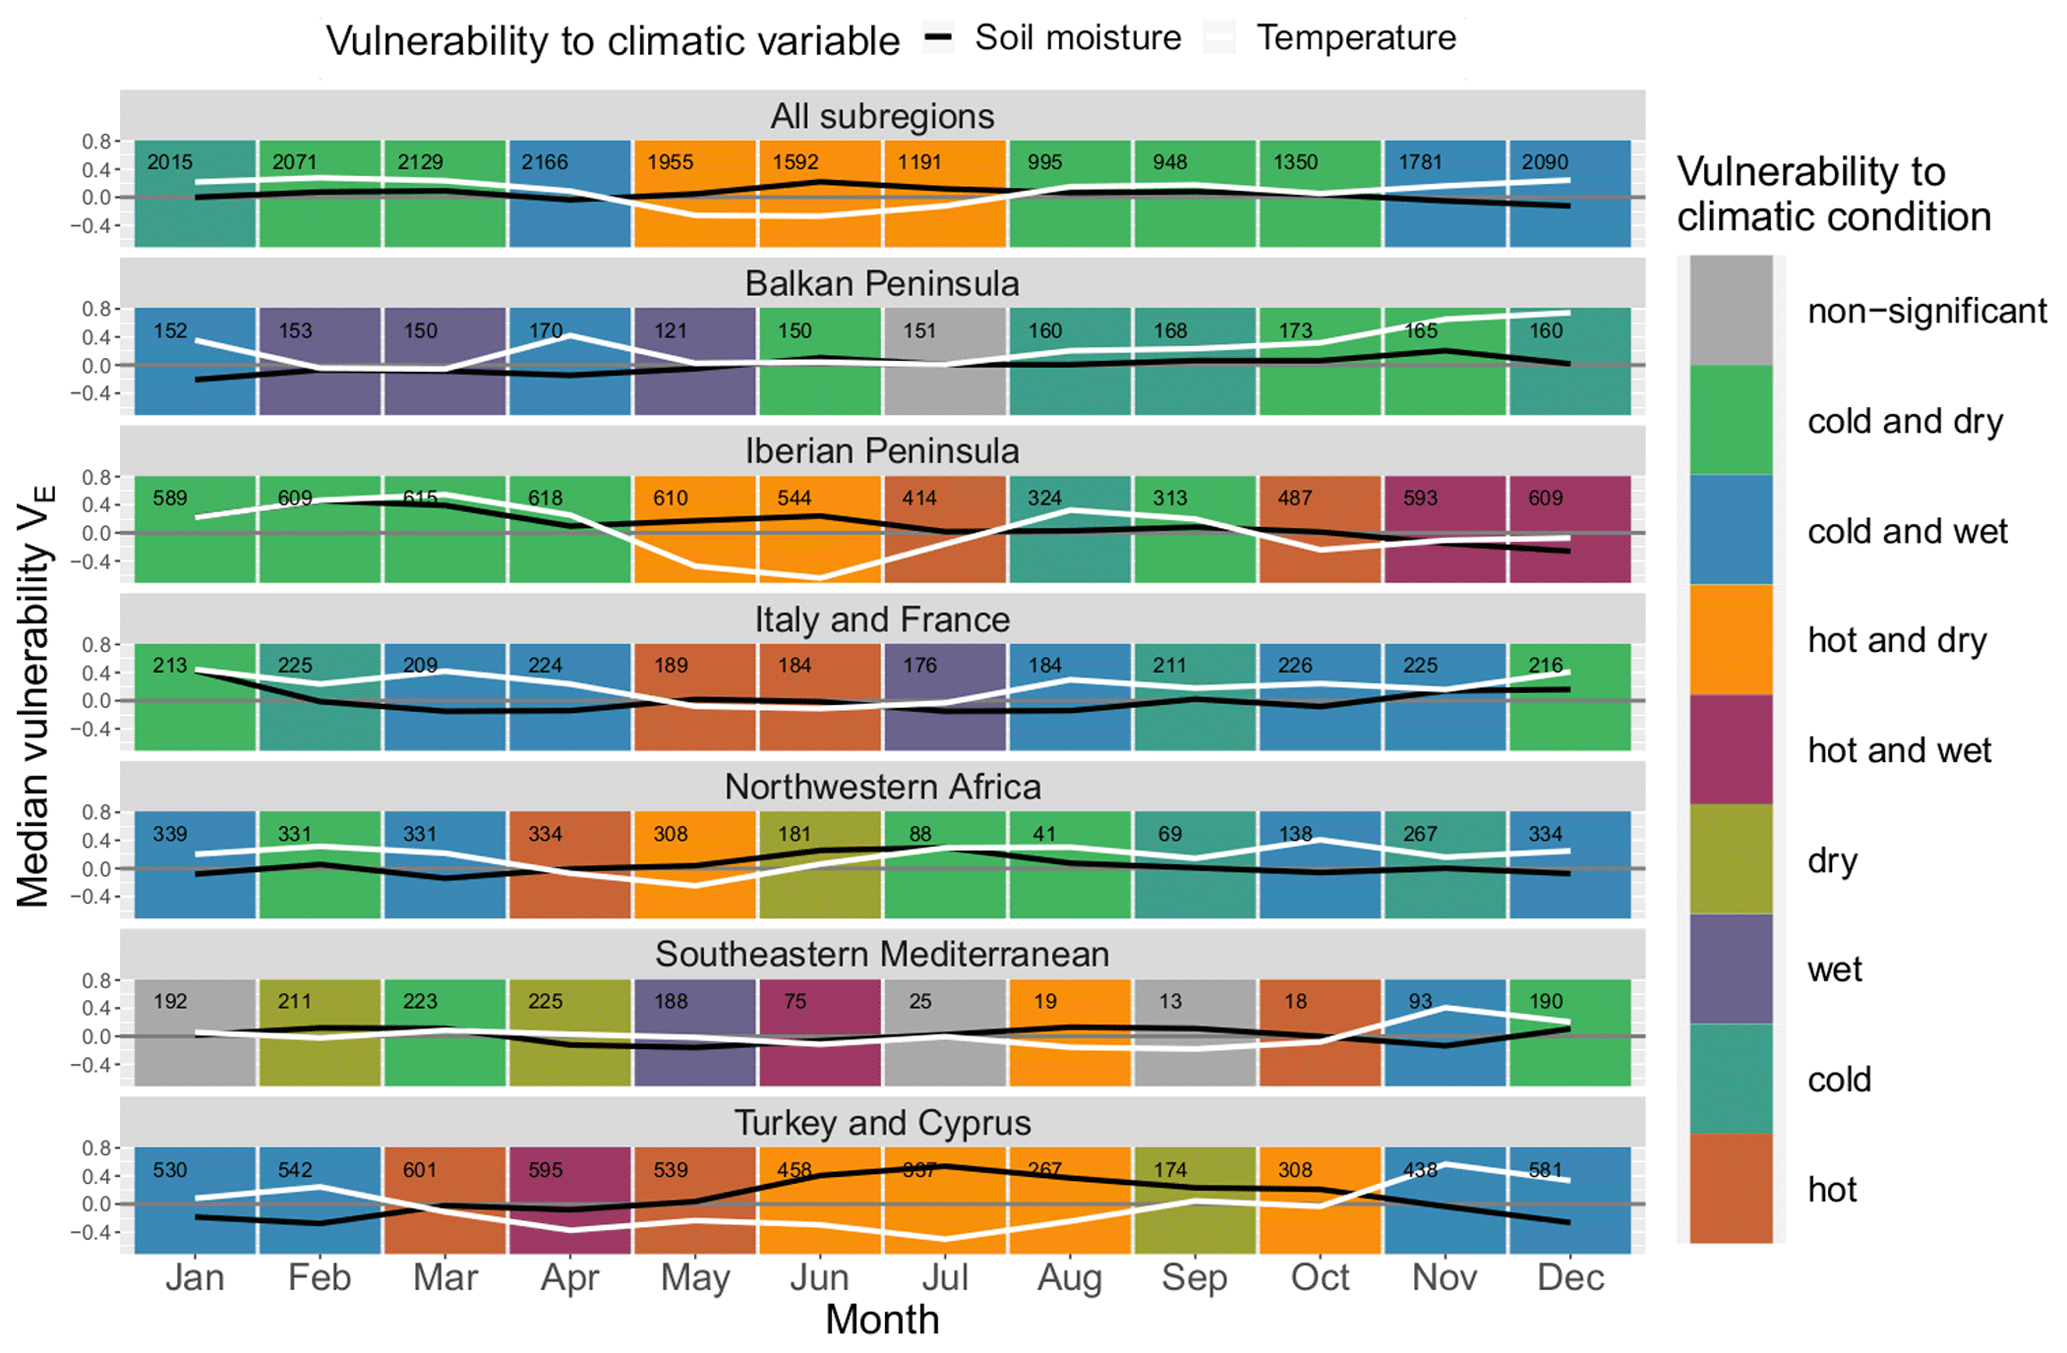
Figure A6Median monthly ecosystem vulnerability per subregion. Vulnerability to temperature (ERA5-Land) is shown in white, and vulnerability to soil moisture (ERA5-Land at depth 28–100 cm) is shown in black for each month of the year (columns) for each land cover (rows). Months with statistically significant deviation in climatic drivers during non-hazardous and hazardous ecosystem conditions according to the Mann–Whitney U test based on a significance level α=0.05 are shown in colour (see legend); all other months are shown in grey. The number of grid points in which an event has occurred in this month and land cover within the period 1999–2019 is shown in the upper left corner of each panel.
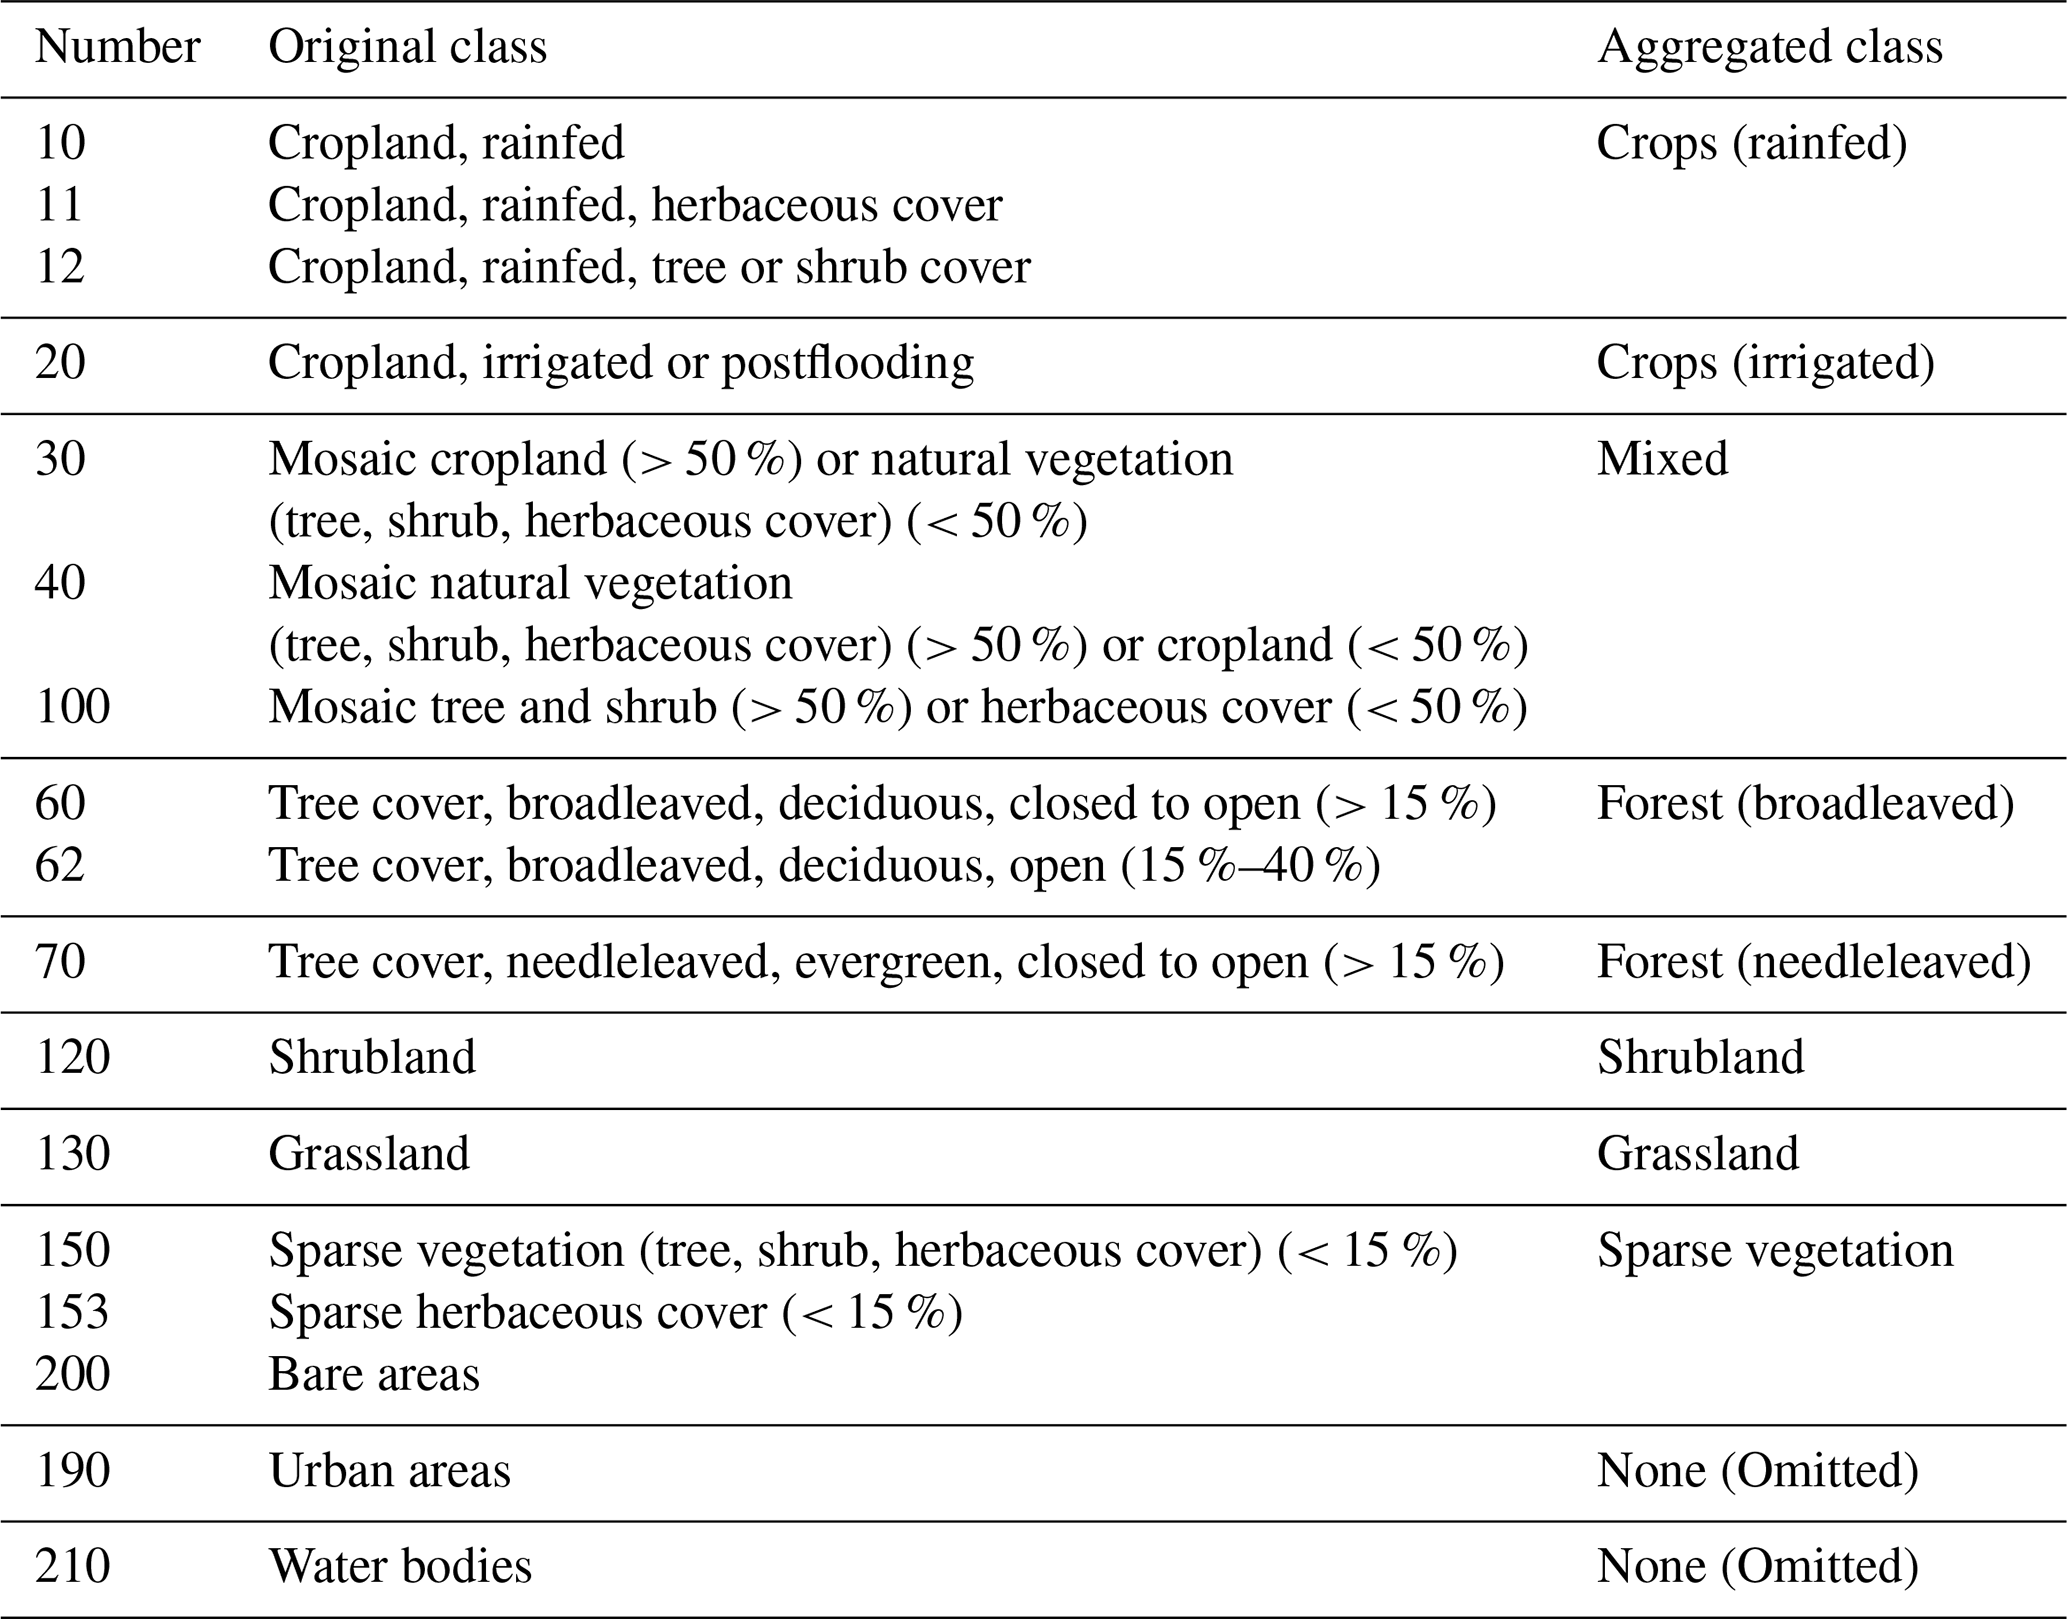
Table B2Overview of the six subregions and the corresponding countries used in this study.
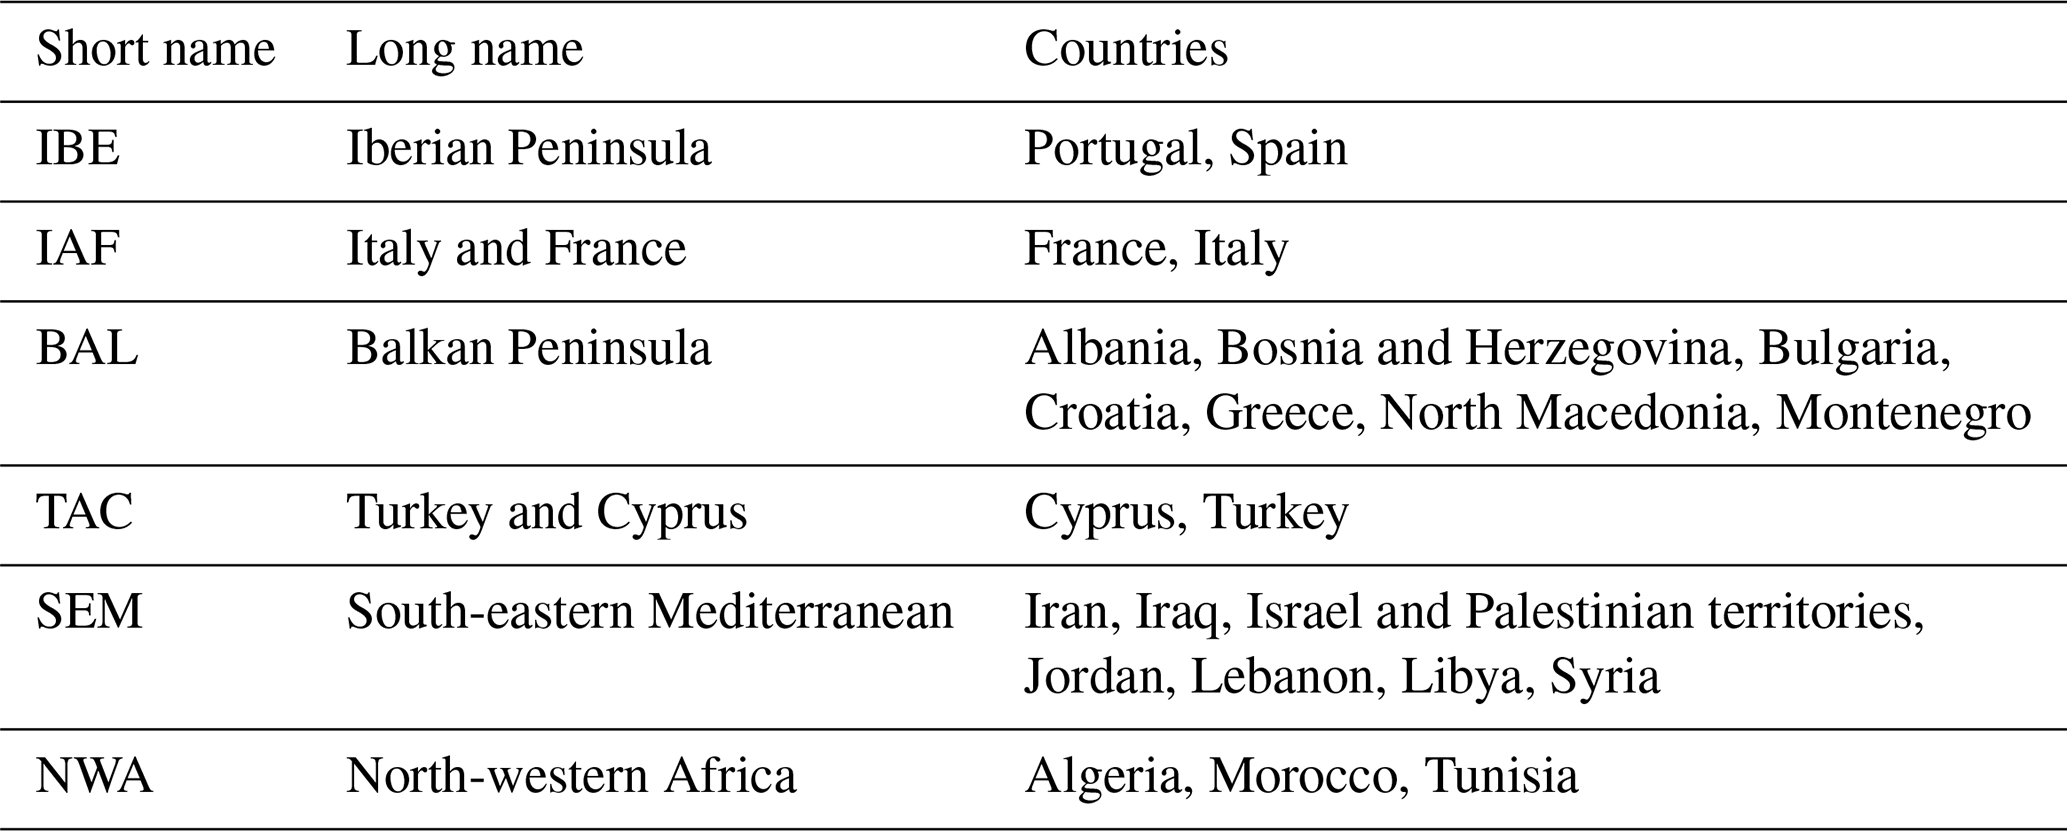

Figure B1Average monthly vulnerability to soil moisture (ESA CCI) and temperature (ERA5-Land) in the Mediterranean Basin for (a) January, (b) February, (c) March, (d) April, (e) May, (f) June, (g) July, (h) August, (i) September, (j) October, (k) November and (l) December. Grid points without any events during the respective month are displayed in black.
The code can be retrieved from https://gitup.uni-potsdam.de/joschavogel/ecosystem_vulnerability (Vogel, 2021). All data sets used in this study are publicly available.
JV, EP and VA designed the study and the methodology. JV developed the computer code, performed the analysis and visualised the results. EP supervised the research project. JV wrote the original draft with contributions from all co-authors.
The authors declare that they have no conflict of interest.
Publisher’s note: Copernicus Publications remains neutral with regard to jurisdictional claims in published maps and institutional affiliations.
This article is part of the special issue “Understanding compound weather and climate events and related impacts (BG/ESD/HESS/NHESS inter-journal SI)”. It is not associated with a conference.
We would like to thank the guest editor Bart van den Hurk and the co-editor-in-chief Michael Bahn as well as Niko Wanders and the other two anonymous reviewers for their valuable feedback to the manuscript.
This research has been supported by the Deutsche Forschungsgemeinschaft (grant no. NatRiskChange GRK 2043).
This paper was edited by Bart van den Hurk and reviewed by Niko Wanders and two anonymous referees.
Ahlström, A., Raupach, M. R., Schurgers, G., Smith, B., Arneth, A., Jung, M., Reichstein, M., Canadell, J. G., Friedlingstein, P., Jain, A. K., Kato, E., Poulter, B., Sitch, S., Stocker, B. D., Viovy, N., Wang, Y. P., Wiltshire, A., Zaehle, S., and Zeng, N.: Carbon cycle. The dominant role of semi-arid ecosystems in the trend and variability of the land CO2 sink, Science (New York, N.Y.), 348, 895–899, https://doi.org/10.1126/science.aaa1668, 2015. a
Albergel, C., Dorigo, W., Reichle, R. H., Balsamo, G., de Rosnay, P., Muñoz-Sabater, J., Isaksen, L., de Jeu, R., and Wagner, W.: Skill and Global Trend Analysis of Soil Moisture from Reanalyses and Microwave Remote Sensing, J. Hydrometeorol., 14, 1259–1277, https://doi.org/10.1175/JHM-D-12-0161.1, 2013. a
Bachmair, S., Tanguy, M., Hannaford, J., and Stahl, K.: How well do meteorological indicators represent agricultural and forest drought across Europe?, Environ. Res. Lett., 13, 034042, https://doi.org/10.1088/1748-9326/aaafda, 2018. a, b
Baret, F., Weiss, M., Lacaze, R., Camacho, F., Makhmara, H., Pacholcyzk, P., and Smets, B.: GEOV1: LAI and FAPAR essential climate variables and FCOVER global time series capitalizing over existing products, Part 1: Principles of development and production, Remote Sens. Environ., 137, 299–309, https://doi.org/10.1016/j.rse.2012.12.027, 2013. a
Batllori, E., de Cáceres, M., Brotons, L., Ackerly, D. D., Moritz, M. A., and Lloret, F.: Cumulative effects of fire and drought in Mediterranean ecosystems, Ecosphere, 8, e01906, https://doi.org/10.1002/ecs2.1906, 2017. a
Baumbach, L., Siegmund, J. F., Mittermeier, M., and Donner, R. V.: Impacts of temperature extremes on European vegetation during the growing season, Biogeosciences, 14, 4891–4903, https://doi.org/10.5194/bg-14-4891-2017, 2017. a, b, c
Benjamini, Y. and Hochberg, Y.: Controlling the False Discovery Rate: A Practical and Powerful Approach to Multiple Testing, J. R. Statist. Soc. B, 57, 289–300, 1995. a
Berg, A., Lintner, B. R., Findell, K., Seneviratne, S. I., van den Hurk, B., Ducharne, A., Chéruy, F., Hagemann, S., Lawrence, D. M., Malyshev, S., Meier, A., and Gentine, P.: Interannual Coupling between Summertime Surface Temperature and Precipitation over Land: Processes and Implications for Climate Change, J. Clim., 28, 1308–1328, https://doi.org/10.1175/JCLI-D-14-00324.1, 2015. a
Berg, A., Sheffield, J., and Milly, P. C. D.: Divergent surface and total soil moisture projections under global warming, Geophys. Res. Lett., 44, 236–244, https://doi.org/10.1002/2016GL071921, 2017. a
Bréda, N., Huc, R., Granier, A., and Dreyer, E.: Temperate forest trees and stands under severe drought: a review of ecophysiological responses, adaptation processes and long-term consequences, Ann. Forest Sci., 63, 625–644, https://doi.org/10.1051/forest:2006042, 2006. a
Bulut, B., Yilmaz, M. T., Afshar, M. H., Şorman, A. Ü., Yücel, İ., Cosh, M. H., and Şimşek, O.: Evaluation of Remotely-Sensed and Model-Based Soil Moisture Products According to Different Soil Type, Vegetation Cover and Climate Regime Using Station-Based Observations over Turkey, Remote Sens., 11, 1875, https://doi.org/10.3390/rs11161875, 2019. a
Chen, T., de Jeu, R., Liu, Y. Y., van der Werf, G. R., and Dolman, A. J.: Using satellite based soil moisture to quantify the water driven variability in NDVI: A case study over mainland Australia, Remote Sens. Environ.t, 140, 330–338, https://doi.org/10.1016/j.rse.2013.08.022, 2014. a, b
Conte, M., Sorani, N., and Piervitali, E.: Extreme climatic events over the Mediterranean, in: Mediterranean desertification, edited by: Geeson, N., Brandt, C. J., and Thornes, J. B., Vol. 1, John Wiley & Sons, Chichester West Sussex England and Hoboken NJ USA, 15–31, 2002. a
Crausbay, S. D., Ramirez, A. R., Carter, S. L., Cross, M. S., Hall, K. R., Bathke, D. J., Betancourt, J. L., Colt, S., Cravens, A. E., Dalton, M. S., Dunham, J. B., Hay, L. E., Hayes, M. J., McEvoy, J., McNutt, C. A., Moritz, M. A., Nislow, K. H., Raheem, N., and Sanford, T.: Defining Ecological Drought for the Twenty-First Century, Bull. Am. Meteorol. Soc., 98, 2543–2550, https://doi.org/10.1175/BAMS-D-16-0292.1, 2017. a
Crocetti, L., Forkel, M., Fischer, M., Jurečka, F., Grlj, A., Salentinig, A., Trnka, M., Anderson, M., Ng, W.-T., Kokalj, Ž., Bucur, A., and Dorigo, W.: Earth Observation for agricultural drought monitoring in the Pannonian Basin (southeastern Europe): current state and future directions, Reg. Environ. Change, 20, 123, 1–17, https://doi.org/10.1007/s10113-020-01710-w, 2020. a
Daryanto, S., Wang, L., and Jacinthe, P.-A.: Global Synthesis of Drought Effects on Maize and Wheat Production, PloS one, 11, e0156362, https://doi.org/10.1371/journal.pone.0156362, 2016. a
de Boeck, H. J., Dreesen, F. E., Janssens, I. A., and Nijs, I.: Whole-system responses of experimental plant communities to climate extremes imposed in different seasons, New Phytol., 189, 806–817, https://doi.org/10.1111/j.1469-8137.2010.03515.x, 2011. a, b
de Jeu, R. and Dorigo, W.: On the importance of satellite observed soil moisture, Int. J. Appl. Earth Obs., 45, 107–109, https://doi.org/10.1016/j.jag.2015.10.007, 2016. a
de Luca, P., Messori, G., Faranda, D., Ward, P. J., and Coumou, D.: Compound warm–dry and cold–wet events over the Mediterranean, Earth Syst. Dynam., 11, 793–805, https://doi.org/10.5194/esd-11-793-2020, 2020. a, b
Denton, E. M., Dietrich, J. D., Smith, M. D., and Knapp, A. K.: Drought timing differentially affects above- and belowground productivity in a mesic grassland, Plant Ecol., 218, 317–328, https://doi.org/10.1007/s11258-016-0690-x, 2017. a
Dorigo, W. and de Jeu, R.: Satellite soil moisture for advancing our understanding of earth system processes and climate change, Int. J. Appl. Earth Obs., 48, 1–4, https://doi.org/10.1016/j.jag.2016.02.007, 2016. a, b
Dorigo, W., Wagner, W., Albergel, C., Albrecht, F., Balsamo, G., Brocca, L., Chung, D., Ertl, M., Forkel, M., Gruber, A., Haas, E., Hamer, P. D., Hirschi, M., Ikonen, J., de Jeu, R., Kidd, R., Lahoz, W., Liu, Y. Y., Miralles, D., Mistelbauer, T., Nicolai-Shaw, N., Parinussa, R., Pratola, C., Reimer, C., van der Schalie, R., Seneviratne, S. I., Smolander, T., and Lecomte, P.: ESA CCI Soil Moisture for improved Earth system understanding: State-of-the art and future directions, Remote Sens. Environ., 203, 185–215, https://doi.org/10.1016/j.rse.2017.07.001, 2017. a, b, c, d, e, f, g, h
Dorigo, W. A., Gruber, A., de Jeu, R., Wagner, W., Stacke, T., Loew, A., Albergel, C., Brocca, L., Chung, D., Parinussa, R. M., and Kidd, R.: Evaluation of the ESA CCI soil moisture product using ground-based observations, Remote Sens. Environ., 162, 380–395, https://doi.org/10.1016/j.rse.2014.07.023, 2015. a
ESA: Land Cover CCI Product User Guide Version 2: Tech. Rep, available at: http://maps.elie.ucl.ac.be/CCI/viewer/index.php (last access: 5 November 2021), 2017. a
Feng, S. and Fu, Q.: Expansion of global drylands under a warming climate, Atmos. Chem. Phys., 13, 10081–10094, https://doi.org/10.5194/acp-13-10081-2013, 2013. a
Fraga, H., Pinto, J. G., Viola, F., and Santos, J. A.: Climate change projections for olive yields in the Mediterranean Basin, Int. J. Climatol., 40, 769–781, https://doi.org/10.1002/joc.6237, 2020. a
Fuster, B., Sánchez-Zapero, J., Camacho, F., García-Santos, V., Verger, A., Lacaze, R., Weiss, M., Baret, F., and Smets, B.: Quality Assessment of PROBA-V LAI, fAPAR and fCOVER Collection 300 m Products of Copernicus Global Land Service, Remote Sens., 12, 1017, https://doi.org/10.3390/rs12061017, 2020. a
Gao, X. and Giorgi, F.: Increased aridity in the Mediterranean region under greenhouse gas forcing estimated from high resolution simulations with a regional climate model, Glob. Planet. Change, 62, 195–209, https://doi.org/10.1016/j.gloplacha.2008.02.002, 2008. a, b
Gobron, N., Belward, A., Pinty, B., and Knorr, W.: Monitoring biosphere vegetation 1998–2009, Geophys. Res. Lett., 37, 1–6, https://doi.org/10.1029/2010GL043870, 2010. a
Gordo, O. and Sanz, J. J.: Long-term temporal changes of plant phenology in the Western Mediterranean, Glob. Change Biol., 15, 1930–1948, https://doi.org/10.1111/j.1365-2486.2009.01851.x, 2009. a
Gordo, O. and Sanz, J. J.: Impact of climate change on plant phenology in Mediterranean ecosystems, Glob. Change Biol., 16, 1082–1106, https://doi.org/10.1111/j.1365-2486.2009.02084.x, 2010. a, b
Gouveia, C. M., Bastos, A., Trigo, R. M., and DaCamara, C. C.: Drought impacts on vegetation in the pre- and post-fire events over Iberian Peninsula, Nat. Hazards Earth Syst. Sci., 12, 3123–3137, https://doi.org/10.5194/nhess-12-3123-2012, 2012. a
Gouveia, C. M., Trigo, R. M., Beguería, S., and Vicente-Serrano, S. M.: Drought impacts on vegetation activity in the Mediterranean region: An assessment using remote sensing data and multi-scale drought indicators, Glob. Planet. Change, 151, 15–27, https://doi.org/10.1016/j.gloplacha.2016.06.011, 2017. a
Green, J. K., Konings, A. G., Alemohammad, S. H., Berry, J., Entekhabi, D., Kolassa, J., Lee, J.-E., and Gentine, P.: Regionally strong feedbacks between the atmosphere and terrestrial biosphere, Nat. Geosci., 10, 410–414, https://doi.org/10.1038/ngeo2957, 2017. a
Gruber, A., Scanlon, T., van der Schalie, R., Wagner, W., and Dorigo, W.: Evolution of the ESA CCI Soil Moisture climate data records and their underlying merging methodology, Earth Syst. Sci. Data, 11, 717–739, https://doi.org/10.5194/essd-11-717-2019, 2019. a, b, c
Hatfield, J. L. and Prueger, J. H.: Temperature extremes: Effect on plant growth and development, Weather and Climate Extremes, 10, 4–10, https://doi.org/10.1016/j.wace.2015.08.001, 2015. a, b
IPCC (Ed.): Climate Change and Land: an IPCC special report on climate change, desertification, land degradation, sustainable land management, food security, and greenhouse gas fluxes in terrestrial ecosystems, edited by: Shukla, P. R., Skea, J., Calvo Buendia, E., Masson-Delmotte, V., Pörtner, H.-O., Roberts, D. C., Zhai, P., Slade, R., Connors, S., van Diemen, R., Ferrat, M., Haughey, E., Luz, S., Neogi, S., Pathak, M., Petzold, J., Portugal Pereira, J., Vyas, P., Huntley, E., Kissick, K., Belkacemi, M., Malley, J., https://www.ipcc.ch/srccl/, 2019. a, b
Ivits, E., Horion, S., Erhard, M., and Fensholt, R.: Assessing European ecosystem stability to drought in the vegetation growing season, Glob. Ecol. Biogeogr., 25, 1131–1143, https://doi.org/10.1111/geb.12472, 2016. a, b, c, d, e, f
Jentsch, A., Kreyling, J., and Beierkuhnlein, C.: A new generation of climate-change experiments: events, not trends, Front. Ecol. Environ., 5, 365–374, 2007. a
Karnieli, A., Ohana-Levi, N., Silver, M., Paz-Kagan, T., Panov, N., Varghese, D., Chrysoulakis, N., and Provenzale, A.: Spatial and Seasonal Patterns in Vegetation Growth-Limiting Factors over Europe, Remote Sens., 11, 2406, https://doi.org/10.3390/rs11202406, 2019. a, b
Kidd, R. and Haas, E.: ESA Climate Change Initiative Plus Soil Moisture: Soil Moisture ECV Product User Guide (PUG) Revision 3: D3.3.1 Version 4.5, Earth Observation Data Centre for Water Resources Monitoring (EODC) GmbH, available at: https://www.esa-soilmoisture-cci.org/node/145 (last access: 5 November 2021), 2018. a
Kottek, M., Grieser, J., Beck, C., Rudolf, B., and Rubel, F.: World Map of the Köppen-Geiger climate classification updated, Meteorol. Z., 15, 259–263, https://doi.org/10.1127/0941-2948/2006/0130, 2006. a
Le Page, M. and Zribi, M.: Analysis and Predictability of Drought In Northwest Africa Using Optical and Microwave Satellite Remote Sensing Products, Sci. Rep., 9, 1466, https://doi.org/10.1038/s41598-018-37911-x, 2019. a, b
Lian, X., Piao, S., Li, L. Z. X., Li, Y., Huntingford, C., Ciais, P., Cescatti, A., Janssens, I. A., Peñuelas, J., Buermann, W., Chen, A., Li, X., Myneni, R. B., Wang, X., Wang, Y., Yang, Y., Zeng, Z., Zhang, Y., and McVicar, T. R.: Summer soil drying exacerbated by earlier spring greening of northern vegetation, Sci. Adv., 6, eaax0255, https://doi.org/10.1126/sciadv.aax0255, 2020. a
Lionello, P., Malanotte-Rizzoli P., Boscolo, R., Alpert, P., Artale, V., Li, L., Luterbacher, J., May, W., Trigo, R., Tsimplis, M., Ulbrich, U., and Xoplaki, E.: The Mediterranean Climate: An Overview of the Main Characteristics and Issues, in: Mediterranean climate variability, edited by: Lionello, P., Malanotte-Rizzoli, P., and Boscolo, R., Developments in earth & environmental sciences, Elsevier, Amsterdam, 1–26, 2006. a, b, c
Lionello, P., Abrantes, F., Congedi, L., Dulac, F., Gacic, M., Gomis, D., Goodess, C., Hoff, H., Kutiel, H., Luterbacher, J., Planton, S., Reale, M., Schröder, K., Struglia, M. V., Toreti, A., Tsimplis, M., Ulbrich, U., and Xoplaki, E.: Mediterranean Climate: Background Information, in: The climate of the Mediterranean region, edited by Lionello, P., Elsevier insights, Elsevier Science, Amsterdam, xxxv–xc, 2012. a
Liu, D., Ogaya, R., Barbeta, A., Yang, X., and Peñuelas, J.: Long-term experimental drought combined with natural extremes accelerate vegetation shift in a Mediterranean holm oak forest, Environ. Exp. Bot., 151, 1–11, https://doi.org/10.1016/j.envexpbot.2018.02.008, 2018. a
Liu, X., Zhu, X., Pan, Y., Li, S., Liu, Y., and Ma, Y.: Agricultural drought monitoring: Progress, challenges, and prospects, J. Geogr. Sci., 26, 750–767, https://doi.org/10.1007/s11442-016-1297-9, 2016. a
McWilliam, J. R.: The National and International Importance of Drought and Salinity Effects on Agricultural Production, Aust. J. Plant Physiol., 13, 1–13, 1986. a
Menzel, A., Sparks, T. H., Estrella, N., Koch, E., Aasa, A., Ahas, R., Alm-Kübler, K., Bissolli, P., Braslavská, O., Briede, A., Chmielewski, F.-M., Crepinsek, Z., Curnel, Y., Dahl, Å., Defila, C., Donnelly, A., Filella, I., Jatzcak, K., Måge, F., Mestre, A., Nordli, Ø., Peñuelas, J., Pirinen, P., Remišová, V., Scheifinger, H., Striz, M., Susnik, A., van Vliet, A. J. H., Wielgolaski, F.-E., Zach, S., and Zust, A.: European phenological response to climate change matches the warming pattern, Glob. Change Biol., 12, 1969–1976, https://doi.org/10.1111/j.1365-2486.2006.01193.x, 2006. a
Mueller, B. and Seneviratne, S. I.: Hot days induced by precipitation deficits at the global scale, P. Natl. Acad. Sci. USA, 109, 12398–12403, https://doi.org/10.1073/pnas.1204330109, 2012. a, b
Muñoz-Sabater, J.: ERA5-Land monthly averaged data from 1981 to present, Copernicus Climate Change Service (C3S) Climate Data Store (CDS) [data set], https://doi.org/10.24381/cds.68d2bb30, 2019. a
Myneni, R. B. and Williams, D. L.: On the relationship between FAPAR and NDVI, Remote Sens. Environ., 49, 200–211, https://doi.org/10.1016/0034-4257(94)90016-7, 1994. a
Nicolai-Shaw, N., Zscheischler, J., Hirschi, M., Gudmundsson, L., and Seneviratne, S. I.: A drought event composite analysis using satellite remote-sensing based soil moisture, Remote Sens. Environ., 203, 216–225, https://doi.org/10.1016/j.rse.2017.06.014, 2017. a, b, c, d, e
Niu, S., Luo, Y., Li, D., Cao, S., Xia, J., Li, J., and Smith, M. D.: Plant growth and mortality under climatic extremes: An overview, Environ. Exp. Bot., 98, 13–19, https://doi.org/10.1016/j.envexpbot.2013.10.004, 2014. a
Ogaya, R. and Peñuelas, J.: Tree growth, mortality, and above-ground biomass accumulation in a holm oak forest under a five-year experimental field drought, Plant Ecol., 189, 291–299, https://doi.org/10.1007/s11258-006-9184-6, 2007. a
Orth, R., Destouni, G., Jung, M., and Reichstein, M.: Large-scale biospheric drought response intensifies linearly with drought duration in arid regions, Biogeosciences, 17, 2647–2656, https://doi.org/10.5194/bg-17-2647-2020, 2020. a
Pan, S., Yang, J., Tian, H., Shi, H., Chang, J., Ciais, P., Francois, L., Frieler, K., Fu, B., Hickler, T., Ito, A., Nishina, K., Ostberg, S., Reyer, C. P., Schaphoff, S., Steinkamp, J., and Zhao, F.: Climate Extreme Versus Carbon Extreme: Responses of Terrestrial Carbon Fluxes to Temperature and Precipitation, J. Geophys. Res.-Biogeo., 125, e2019JG005252, https://doi.org/10.1029/2019JG005252, 2020. a
Papagiannopoulou, C., Miralles, D. G., Dorigo, W. A., Verhoest, N. E. C., Depoorter, M., and Waegeman, W.: Vegetation anomalies caused by antecedent precipitation in most of the world, Environ. Res. Lett., 12, 074016, https://doi.org/10.1088/1748-9326/aa7145, 2017. a, b
Páscoa, P., Gouveia, C. M., Russo, A., and Trigo, R. M.: The role of drought on wheat yield interannual variability in the Iberian Peninsula from 1929 to 2012, Int. J. Biometeorol., 61, 439–451, https://doi.org/10.1007/s00484-016-1224-x, 2017. a
Peña-Gallardo, M., Vicente-Serrano, S. M., Domínguez-Castro, F., and Beguería, S.: The impact of drought on the productivity of two rainfed crops in Spain, Nat. Hazards Earth Syst. Sci., 19, 1215–1234, https://doi.org/10.5194/nhess-19-1215-2019, 2019. a, b
Peñuelas, J., Sardans, J., Filella, I., Estiarte, M., Llusià, J., Ogaya, R., Carnicer, J., Bartrons, M., Rivas-Ubach, A., Grau, O., Peguero, G., Margalef, O., Pla-Rabés, S., Stefanescu, C., Asensio, D., Preece, C., Liu, L., Verger, A., Barbeta, A., Achotegui-Castells, A., Gargallo-Garriga, A., Sperlich, D., Farré-Armengol, G., Fernández-Martínez, M., Liu, D., Zhang, C., Urbina, I., Camino-Serrano, M., Vives-Ingla, M., Stocker, B., Balzarolo, M., Guerrieri, R., Peaucelle, M., Marañón-Jiménez, S., Bórnez-Mejías, K., Mu, Z., Descals, A., Castellanos, A., and Terradas, J.: Impacts of Global Change on Mediterranean Forests and Their Services, Forests, 8, 463, https://doi.org/10.3390/f8120463, 2017. a
Perkins-Kirkpatrick, S. E. and Gibson, P. B.: Changes in regional heatwave characteristics as a function of increasing global temperature, Sci. Repo., 7, 12256, https://doi.org/10.1038/s41598-017-12520-2, 2017. a
Piao, S., Zhang, X., Chen, A., Liu, Q., Lian, X., Wang, X., Peng, S., and Wu, X.: The impacts of climate extremes on the terrestrial carbon cycle: A review, Sci. China Earth Sci., 1, 1285, https://doi.org/10.1007/s11430-018-9363-5, 2019. a, b, c, d, e
Pinty, B., Lavergne, T., Widlowski, J.-L., Gobron, N., and Verstraete, M. M.: On the need to observe vegetation canopies in the near-infrared to estimate visible light absorption, Remote Sens. Environ., 113, 10–23, https://doi.org/10.1016/j.rse.2008.08.017, 2009. a
Potter, C., Tan, P. N., Steinbach, M., Klooster, S., Kumar, V., Myneni, R., and Genovese, V.: Major disturbance events in terrestrial ecosystems detected using global satellite data sets, Glob. Change Biol., 9, 1005–1021, 2003. a
R Core Team: R: A Language and Environment for Statistical Computing, available at: https://www.R-project.org/ (last access: 5 November 2021), 2020. a
Reichstein, M., Ciais, P., Papale, D., Valentini, R., Running, S., Viovy, N., Cramer, W., Granier, A., Ogée, J., Allard, V., Aubinet, M., Bernhofer, C., Buchmann, N., Carrara, A., Grünwald, T., Heimann, M., Heinesch, B., Knohl, A., Kutsch, W., Loustau, D., Manca, G., Matteucci, G., Miglietta, F., Ourcival, J. M., Pilegaard, K., Pumpanen, J., Rambal, S., Schaphoff, S., Seufert, G., Soussana, J.-F., Sanz, M. J., Vesala, T., and Zhao, M.: Reduction of ecosystem productivity and respiration during the European summer 2003 climate anomaly: a joint flux tower, Remote Sensing and Modelling Analysis, Glob. Change Biol., 13, 634–651, https://doi.org/10.1111/j.1365-2486.2006.01224.x, 2007. a
Reichstein, M., Bahn, M., Ciais, P., Frank, D., Mahecha, M. D., Seneviratne, S. I., Zscheischler, J., Beer, C., Buchmann, N., Frank, D. C., Papale, D., Rammig, A., Smith, P., Thonicke, K., van der Velde, M., Vicca, S., Walz, A., and Wattenbach, M.: Climate extremes and the carbon cycle, Nature, 500, 287–295, https://doi.org/10.1038/nature12350, 2013. a, b
Reyer, C. P. O., Leuzinger, S., Rammig, A., Wolf, A., Bartholomeus, R. P., Bonfante, A., de Lorenzi, F., Dury, M., Gloning, P., Abou Jaoudé, R., Klein, T., Kuster, T. M., Martins, M., Niedrist, G., Riccardi, M., Wohlfahrt, G., de Angelis, P., de Dato, G., François, L., Menzel, A., and Pereira, M.: A plant's perspective of extremes: terrestrial plant responses to changing climatic variability, Glob. Change Biol., 19, 75–89, https://doi.org/10.1111/gcb.12023, 2013. a
Ribeiro, A. F., Russo, A., Gouveia, C. M., and Pires, C. A.: Drought-related hot summers: A joint probability analysis in the Iberian Peninsula, Weather and Climate Extremes, 30, 100279, https://doi.org/10.1016/j.wace.2020.100279, 2020. a
Rolinski, S., Rammig, A., Walz, A., von Bloh, W., van Oijen, M., and Thonicke, K.: A probabilistic risk assessment for the vulnerability of the European carbon cycle to weather extremes: the ecosystem perspective, Biogeosciences, 12, 1813–1831, https://doi.org/10.5194/bg-12-1813-2015, 2015. a, b, c, d
Rubel, F., Brugger, K., Haslinger, K., and Auer, I.: The climate of the European Alps: Shift of very high resolution Köppen-Geiger climate zones 1800–2100, Meteorol. Z., 26, 115–125, https://doi.org/10.1127/metz/2016/0816, 2017. a
Ruffault, J., Curt, T., Martin-StPaul, N. K., Moron, V., and Trigo, R. M.: Extreme wildfire events are linked to global-change-type droughts in the northern Mediterranean, Nat. Hazards Earth Syst. Sci., 18, 847–856, https://doi.org/10.5194/nhess-18-847-2018, 2018. a, b
Samaniego, L., Thober, S., Kumar, R., Wanders, N., Rakovec, O., Pan, M., Zink, M., Sheffield, J., Wood, E. F., and Marx, A.: Anthropogenic warming exacerbates European soil moisture droughts, Nat. Clim. Change, 8, 421–426, https://doi.org/10.1038/s41558-018-0138-5, 2018. a, b
Sarris, D., Christodoulakis, D., and Körner, C.: Recent decline in precipitation and tree growth in the eastern Mediterranean, Glob. Change Biol., 13, 1187–1200, https://doi.org/10.1111/j.1365-2486.2007.01348.x, 2007. a
Sarris, D., Christodoulakis, D., and Körner, C.: Impact of recent climatic change on growth of low elevation eastern Mediterranean forest trees, Climatic Change, 106, 203–223, https://doi.org/10.1007/s10584-010-9901-y, 2011. a
Sarris, D., Christopoulou, A., Angelonidi, E., Koutsias, N., Fulé, P. Z., and Arianoutsou, M.: Increasing extremes of heat and drought associated with recent severe wildfires in southern Greece, Reg. Environ. Change, 14, 1257–1268, https://doi.org/10.1007/s10113-013-0568-6, 2014. a
Schulzweida, U.: CDO Climate Data Operator, Zenodo, https://doi.org/10.5281/zenodo.3539275, 2019. a
Schwingshackl, C., Hirschi, M., and Seneviratne, S. I.: Quantifying Spatiotemporal Variations of Soil Moisture Control on Surface Energy Balance and Near-Surface Air Temperature, J. Clim., 30, 7105–7124, https://doi.org/10.1175/JCLI-D-16-0727.1, 2017. a, b
Seneviratne, S. I., Lüthi, D., Litschi, M., and Schär, C.: Land-atmosphere coupling and climate change in Europe, Nature, 443, 205–209, https://doi.org/10.1038/nature05095, 2006. a
Seneviratne, S. I., Corti, T., Davin, E. L., Hirschi, M., Jaeger, E. B., Lehner, I., Orlowsky, B., and Teuling, A. J.: Investigating soil moisture–climate interactions in a changing climate: A review, Earth-Sci. Rev., 99, 125–161, https://doi.org/10.1016/j.earscirev.2010.02.004, 2010. a, b, c, d
Sherry, R. A., Weng, E., Arnone, J. A., Johnson, D. W., Schimel, D. S., Verburg, P. S., Wallace, L. L., and Luo, Y.: Lagged effects of experimental warming and doubled precipitation on annual and seasonal aboveground biomass production in a tallgrass prairie, Glob. Change Biol., 14, 2923–2936, https://doi.org/10.1111/j.1365-2486.2008.01703.x, 2008. a
Sippel, S., Zscheischler, J., and Reichstein, M.: Ecosystem impacts of climate extremes crucially depend on the timing, P. Natl. Acad. Sci. USA, 113, 5768–5770, https://doi.org/10.1073/pnas.1605667113, 2016. a
Sippel, S., Forkel, M., Rammig, A., Thonicke, K., Flach, M., Heimann, M., Otto, F. E. L., Reichstein, M., and Mahecha, M. D.: Contrasting and interacting changes in simulated spring and summer carbon cycle extremes in European ecosystems, Environ. Res. Lett., 12, 075006, https://doi.org/10.1088/1748-9326/aa7398, 2017. a
Sippel, S., Reichstein, M., Ma, X., Mahecha, M. D., Lange, H., Flach, M., and Frank, D.: Drought, Heat, and the Carbon Cycle: a Review, Curr. Clim. Change Rep., 4, 266–286, https://doi.org/10.1007/s40641-018-0103-4, 2018. a
Smit, H. J., Metzger, M. J., and Ewert, F.: Spatial distribution of grassland productivity and land use in Europe, Agr. Syst., 98, 208–219, https://doi.org/10.1016/j.agsy.2008.07.004, 2008. a
Smith, M. D.: An ecological perspective on extreme climatic events: a synthetic definition and framework to guide future research, J. Ecol., 99, 656–663, https://doi.org/10.1111/j.1365-2745.2011.01798.x, 2011. a, b, c, d, e
Sousa, P. M., Barriopedro, D., Ramos, A. M., García-Herrera, R., Espírito-Santo, F., and Trigo, R. M.: Saharan air intrusions as a relevant mechanism for Iberian heatwaves: The record breaking events of August 2018 and June 2019, Weather and Climate Extremes, 26, 100224, https://doi.org/10.1016/j.wace.2019.100224, 2019. a
Spano, D., Snyder, R. L., and Cesaraccio, C.: Mediterranean Phenology, in: Phenology: An Integrative Environmental Science, edited by: Schwartz, M. D., Springer Netherlands, Dordrecht, 173–196, https://doi.org/10.1007/978-94-007-6925-0_10, 2013. a, b
Szczypta, C., Calvet, J.-C., Maignan, F., Dorigo, W., Baret, F., and Ciais, P.: Suitability of modelled and remotely sensed essential climate variables for monitoring Euro-Mediterranean droughts, Geosci. Model Dev., 7, 931–946, https://doi.org/10.5194/gmd-7-931-2014, 2014. a
Teuling, A. J., Hirschi, M., Ohmura, A., Wild, M., Reichstein, M., Ciais, P., Buchmann, N., Ammann, C., Montagnani, L., Richardson, A. D., Wohlfahrt, G., and Seneviratne, S. I.: A regional perspective on trends in continental evaporation, Geophys. Res. Lett., 36, 1–5, https://doi.org/10.1029/2008GL036584, 2009. a
Toreti, A. and Naveau, P.: On the evaluation of climate model simulated precipitation extremes, Environ. Res. Lett., 10, 014012, https://doi.org/10.1088/1748-9326/10/1/014012, 2015. a
Tramblay, Y., Koutroulis, A., Samaniego, L., Vicente-Serrano, S. M., Volaire, F., Boone, A., Le Page, M., Llasat, M. C., Albergel, C., Burak, S., Cailleret, M., Kalin, K. C., Davi, H., Dupuy, J.-L., Greve, P., Grillakis, M., Hanich, L., Jarlan, L., Martin-StPaul, N., Martínez-Vilalta, J., Mouillot, F., Pulido-Velazquez, D., Quintana-Seguí, P., Renard, D., Turco, M., Türkeş, M., Trigo, R., Vidal, J.-P., Vilagrosa, A., Zribi, M., and Polcher, J.: Challenges for drought assessment in the Mediterranean region under future climate scenarios, Earth-Sci. Rev., 210, 103348, https://doi.org/10.1016/j.earscirev.2020.103348, 2020. a, b, c
Ulbrich, U., Lionello, P., Belušić, D., Jacobeit, J., Knippertz, P., Kuglitsch, F. G., Leckebusch, G. C., Luterbacher, J., Maugeri, M., Maheras, P., Nissen, K. M., Pavan, V., Pinto, J. G., Saaroni, H., Seubert, S., Toreti, A., Xoplaki, E., and Ziv, B.: Climate of the Mediterranean, in: The climate of the Mediterranean region, edited by: Lionello, P., Elsevier insights, Elsevier Science, Amsterdam, 301–346, https://doi.org/10.1016/B978-0-12-416042-2.00005-7, 2012. a
van der Molen, M. K., Dolman, A. J., Ciais, P., Eglin, T., Gobron, N., Law, B. E., Meir, P., Peters, W., Phillips, O. L., Reichstein, M., Chen, T., Dekker, S. C., Doubková, M., Friedl, M. A., Jung, M., van den Hurk, B., de Jeu, R., Kruijt, B., Ohta, T., Rebel, K. T., Plummer, S., Seneviratne, S. I., Sitch, S., Teuling, A. J., van der Werf, G. R., and Wang, G.: Drought and ecosystem carbon cycling, Agr. Forest Meteorol., 151, 765–773, https://doi.org/10.1016/j.agrformet.2011.01.018, 2011. a, b, c
van der Wiel, K., Selten, F. M., Bintanja, R., Blackport, R., and Screen, J. A.: Ensemble climate-impact modelling: extreme impacts from moderate meteorological conditions, Environ. Res. Lett., 15, 034050, https://doi.org/10.1088/1748-9326/ab7668, 2020. a
van Oijen, M., Beer, C., Cramer, W., Rammig, A., Reichstein, M., Rolinski, S., and Soussana, J.-F.: A novel probabilistic risk analysis to determine the vulnerability of ecosystems to extreme climatic events, Environ. Res. Lett., 8, 015032, https://doi.org/10.1088/1748-9326/8/1/015032, 2013. a, b, c
van Oijen, M., Balkovi, J., Beer, C., Cameron, D. R., Ciais, P., Cramer, W., Kato, T., Kuhnert, M., Martin, R., Myneni, R., Rammig, A., Rolinski, S., Soussana, J.-F., Thonicke, K., van der Velde, M., and Xu, L.: Impact of droughts on the carbon cycle in European vegetation: a probabilistic risk analysis using six vegetation models, Biogeosciences, 11, 6357–6375, https://doi.org/10.5194/bg-11-6357-2014, 2014. a, b
Verger, A., Baret, F., and Weiss, M.: Near Real-Time Vegetation Monitoring at Global Scale, IEEE Journal of Selected Topics in Applied Earth Observations and Remote Sensing, 7, 3473–3481, https://doi.org/10.1109/JSTARS.2014.2328632, 2014. a
Verger, A., Baret, F., and Weiss, M.: Copernicus Global Land Operations ”Vegetation and Energy” “CGLOPS-1”: Algorithm Theorethical Basis Document: Leaf Area Index (LAI) Fraction of Absorbed Photosynthetically Active Radiation (FAPAR) Fraction of green Vegetation Cover (FCover) Collection 1 km Version 2 Issue I1.41, Copernicus Global Land Operations, available at: https://land.copernicus.eu/global/products/fapar (last access: 5 November 2021), 2019. a
Vicente-Serrano, S. M., Gouveia, C., Camarero, J. J., Beguería, S., Trigo, R., López-Moreno, J. I., Azorín-Molina, C., Pasho, E., Lorenzo-Lacruz, J., Revuelto, J., Morán-Tejeda, E., and Sanchez-Lorenzo, A.: Response of vegetation to drought time-scales across global land biomes, P. Natl. Acad. Sci. USA, 110, 52–57, https://doi.org/10.1073/pnas.1207068110, 2013. a
Vicente-Serrano, S. M., McVicar, T. R., Miralles, D. G., Yang, Y., and Tomas-Burguera, M.: Unraveling the influence of atmospheric evaporative demand on drought and its response to climate change, WIREs Climate Change, 11, e632, https://doi.org/10.1002/wcc.632, 2020. a, b
Vogel, J.: Ecosystem_vulnerability, GitLab [code], available at: https://gitup.uni-potsdam.de/joschavogel/ecosystem_vulnerability, last access: 5 November 2021. a
Vogel, J., Paton, E., Aich, V., and Bronstert, A.: Increasing compound warm spells and droughts in the Mediterranean Basin, Weather and Climate Extremes, 32, 100312, https://doi.org/10.1016/j.wace.2021.100312, 2021. a
von Buttlar, J., Zscheischler, J., Rammig, A., Sippel, S., Reichstein, M., Knohl, A., Jung, M., Menzer, O., Arain, M. A., Buchmann, N., Cescatti, A., Gianelle, D., Kiely, G., Law, B. E., Magliulo, V., Margolis, H., McCaughey, H., Merbold, L., Migliavacca, M., Montagnani, L., Oechel, W., Pavelka, M., Peichl, M., Rambal, S., Raschi, A., Scott, R. L., Vaccari, F. P., van Gorsel, E., Varlagin, A., Wohlfahrt, G., and Mahecha, M. D.: Impacts of droughts and extreme-temperature events on gross primary production and ecosystem respiration: a systematic assessment across ecosystems and climate zones, Biogeosciences, 15, 1293–1318, https://doi.org/10.5194/bg-15-1293-2018, 2018. a
Weißhuhn, P., Müller, F., and Wiggering, H.: Ecosystem Vulnerability Review: Proposal of an Interdisciplinary Ecosystem Assessment Approach, Environ. Manag., 61, 904–915, https://doi.org/10.1007/s00267-018-1023-8, 2018. a
West, H., Quinn, N., and Horswell, M.: Remote sensing for drought monitoring & impact assessment: Progress, past challenges and future opportunities, Remote Sens. Environ., 232, 111291, https://doi.org/10.1016/j.rse.2019.111291, 2019. a, b
Wolf, S., Keenan, T. F., Fisher, J. B., Baldocchi, D. D., Desai, A. R., Richardson, A. D., Scott, R. L., Law, B. E., Litvak, M. E., Brunsell, N. A., Peters, W., and van der Laan-Luijkx, I. T.: Warm spring reduced carbon cycle impact of the 2012 US summer drought, P. Natl. Acad. Sci. USA, 113, 5880–5885, https://doi.org/10.1073/pnas.1519620113, 2016. a
Wu, D., Zhao, X., Liang, S., Zhou, T., Huang, K., Tang, B., and Zhao, W.: Time-lag effects of global vegetation responses to climate change, Glob. Change Biol., 21, 3520–3531, https://doi.org/10.1111/gcb.12945, 2015. a
Zdruli, P.: Desertification in the Mediterranean region, in: Mediterranean Yearbook, edited by: IEMed, Girona, 250–254, available at: https://www.iemed.org/med-yearbook/iemed-mediterranean-yearbook-2011/ (last access: 5 November 2021), 2011. a
Zeng, F.-W., Collatz, G., Pinzon, J., and Ivanoff, A.: Evaluating and Quantifying the Climate-Driven Interannual Variability in Global Inventory Modeling and Mapping Studies (GIMMS) Normalized Difference Vegetation Index (NDVI3g) at Global Scales, Remote Sens., 5, 3918–3950, https://doi.org/10.3390/rs5083918, 2013. a, b, c
Zhang, H. and Oweis, T.: Water–yield relations and optimal irrigation scheduling of wheat in the Mediterranean region, Agr. Water Manag., 38, 195–211, https://doi.org/10.1016/S0378-3774(98)00069-9, 1999. a
Zhang, L., Jiao, W., Zhang, H., Huang, C., and Tong, Q.: Studying drought phenomena in the Continental United States in 2011 and 2012 using various drought indices, Remote Sens. Environ., 190, 96–106, https://doi.org/10.1016/j.rse.2016.12.010, 2017. a
Zhang, Y., Xiao, X., Zhou, S., Ciais, P., McCarthy, H., and Luo, Y.: Canopy and physiological controls of GPP during drought and heat wave, Geophys. Res. Lett., 43, 3325–3333, https://doi.org/10.1002/2016GL068501, 2016. a, b
Zscheischler, J., Mahecha, M. D., Harmeling, S., and Reichstein, M.: Detection and attribution of large spatiotemporal extreme events in Earth observation data, Ecol. Inform., 15, 66–73, https://doi.org/10.1016/j.ecoinf.2013.03.004, 2013. a
Zscheischler, J., Reichstein, M., von Buttlar, J., Mu, M., Randerson, J. T., and Mahecha, M. D.: Carbon cycle extremes during the 21st century in CMIP5 models: Future evolution and attribution to climatic drivers, Geophys. Res. Lett., 41, 8853–8861, https://doi.org/10.1002/2014GL062409, 2014. a
Zscheischler, J., Orth, R., and Seneviratne, S. I.: A submonthly database for detecting changes in vegetation-atmosphere coupling, Geophys. Res. Lett., 42, 9816–9824, https://doi.org/10.1002/2015GL066563, 2015. a, b
Zscheischler, J., Westra, S., van den Hurk, B. J. J. M., Seneviratne, S. I., Ward, P. J., Pitman, A., AghaKouchak, A., Bresch, D. N., Leonard, M., Wahl, T., and Zhang, X.: Future climate risk from compound events, Nat. Clim. Change, 8, 469–477, https://doi.org/10.1038/s41558-018-0156-3, 2018. a
- Abstract
- Introduction
- Methods
- Results
- Discussion
- Conclusions
- Appendix A: Comparison of ecosystem vulnerability using soil moisture from ESA CCI and ERA5-Land
- Appendix B: Further materials
- Code and data availability
- Author contributions
- Competing interests
- Disclaimer
- Special issue statement
- Acknowledgements
- Financial support
- Review statement
- References