the Creative Commons Attribution 4.0 License.
the Creative Commons Attribution 4.0 License.
 | 28 Jan 2021
Nitrate assimilation and regeneration in the Barents Sea: insights from nitrate isotopes
Robyn E. Tuerena
Joanne Hopkins
Raja S. Ganeshram
Louisa Norman
Camille de la Vega
Rachel Jeffreys
Claire Mahaffey
While the entire Arctic Ocean is warming rapidly, the Barents Sea in particular is experiencing significant warming and sea ice retreat. An increase in ocean heat transport from the Atlantic is causing the Barents Sea to be transformed from a cold, salinity-stratified system into a warmer, less-stratified Atlantic-dominated climate regime. Productivity in the Barents Sea shelf is fuelled by waters of Atlantic origin (AW) which are ultimately exported to the Arctic Basin. The consequences of this current regime shift on the nutrient characteristics of the Barents Sea are poorly defined. Here we use the stable isotopic ratios of nitrate (δ15N-NO3, δ18O-NO3) to determine the uptake and modification of AW nutrients in the Barents Sea. In summer months, phytoplankton consume nitrate, surface waters become nitrate depleted, and particulate nitrogen (δ15N-PN) reflects the AW nitrate source. The ammonification of organic matter in shallow sediments resupplies N to the water column and replenishes the nitrate inventory for the following season. Low δ18O-NO3 in the northern Barents Sea reveals that the nitrate in lower-temperature Arctic waters is > 80 % regenerated through seasonal nitrification. During on-shelf nutrient uptake and regeneration, there is no significant change to δ15N-NO3 or N*, suggesting that benthic denitrification does not impart an isotopic imprint on pelagic nitrate. Our results demonstrate that the Barents Sea is distinct from other Arctic shelves where benthic denitrification enriches δ15N-NO3 and decreases N*. As nutrients are efficiently recycled in the Barents Sea and there is no significant loss of N through benthic denitrification, changes to Barents Sea productivity are unlikely to alter N availability on shelf or the magnitude of N advected to the central Arctic Basin. However, we suggest that the AW nutrient source ultimately determines Barents Sea productivity and that changes to AW delivery have the potential to alter Barents Sea primary production and subsequent nutrient supply to the central Arctic Ocean.
- Article
(8543 KB) - Full-text XML
- BibTeX
- EndNote


The Arctic Ocean is warming (Huang et al., 2017), experiencing sea ice loss (Notz and Stroeve, 2016) and freshening (Coupel et al., 2015) as a direct response to climate change. It is an enclosed basin filled with waters from the Atlantic and Pacific oceans, which provide varying concentrations of nutrients (Torres-Valdes et al., 2013). In turn, these nutrient supply pathways influence the distribution and extent of primary production throughout the Arctic Ocean (Lewis et al., 2020). Approximately 50 % of the Arctic Ocean is made up of productive shelves that support large fisheries and diverse habitats (Dalpadado et al., 2014; Friedland and Todd, 2012). As the Arctic continues to warm and more sea ice is lost, phytoplankton growth will become less limited by light availability. Instead, nutrient availability, principally nitrate (Codispoti et al., 2013), may become the primary control on phytoplankton growth (Arrigo and van Dijken, 2015; Lewis et al., 2020). Further insight is required into how nitrate is supplied to Arctic shelves, the nutrient cycling processes that occur in situ and their sensitivity to climate change. A further understanding of these processes will help to inform on future changes to Arctic primary production and food web dynamics (de la Vega et al., 2020).
Atlantic Water (AW) is supplied to the Arctic via the Fram Strait and the Barents Sea Opening (BSO) and fills most of the deep basins of the Arctic. It supplies nutrients to the Eurasian shelves with nitrate and phosphate concentrations close to Redfield (15-16N:1P) and low concentrations of silicate, which can limit the extent of diatom growth (Hatun et al., 2017). AW is a mixture of nutrient-rich North Atlantic subpolar and nutrient-poor subtropical origin water advected into the Norwegian Sea. Over the last 2 decades, there has been a 7 % and 20 % decrease in nitrate and silicate concentrations, respectively, in the Barents Sea (Rey, 2012). This has been driven by shallower winter mixing in the subpolar gyre coupled with weakening and westward retraction of the gyre which has increased the proportion of subtropical origin water entering the Norwegian Sea (Rey, 2012; Hatun et al., 2017).
As warm and saline AW inflow water is transported across the Barents Sea, it is modified by atmospheric cooling and is mixed with cold, fresh Arctic origin water (ArW) and the Norwegian Coastal Current (NCC) (Fig. 1b). ArW found across the northern Barents Sea comprises fresh Arctic river runoff, sea ice melt and precipitation and contains the remnants of the winter mixed layer (Rudels et al., 1996). Less dense ArW isolates the sea surface and ice cover from warm AW below (Lind et al., 2016) and during the summer is capped by a well-mixed surface layer of fresh melt water (polar surface water) (Fig. 2b). Sea ice import from the Nansen Basin and Kara Sea is the most important source of freshwater in the northern Barents Sea (Lind et al., 2016; Ellingsen et al., 2009). The Barents Sea is a key mixing region of AW and ArWs (Porter et al., 2020). The transition between these water masses is marked by the polar front (PF) which can be identified from the sea surface temperature gradient (Barton et al., 2018; Oziel et al., 2016) (Fig. 1b).
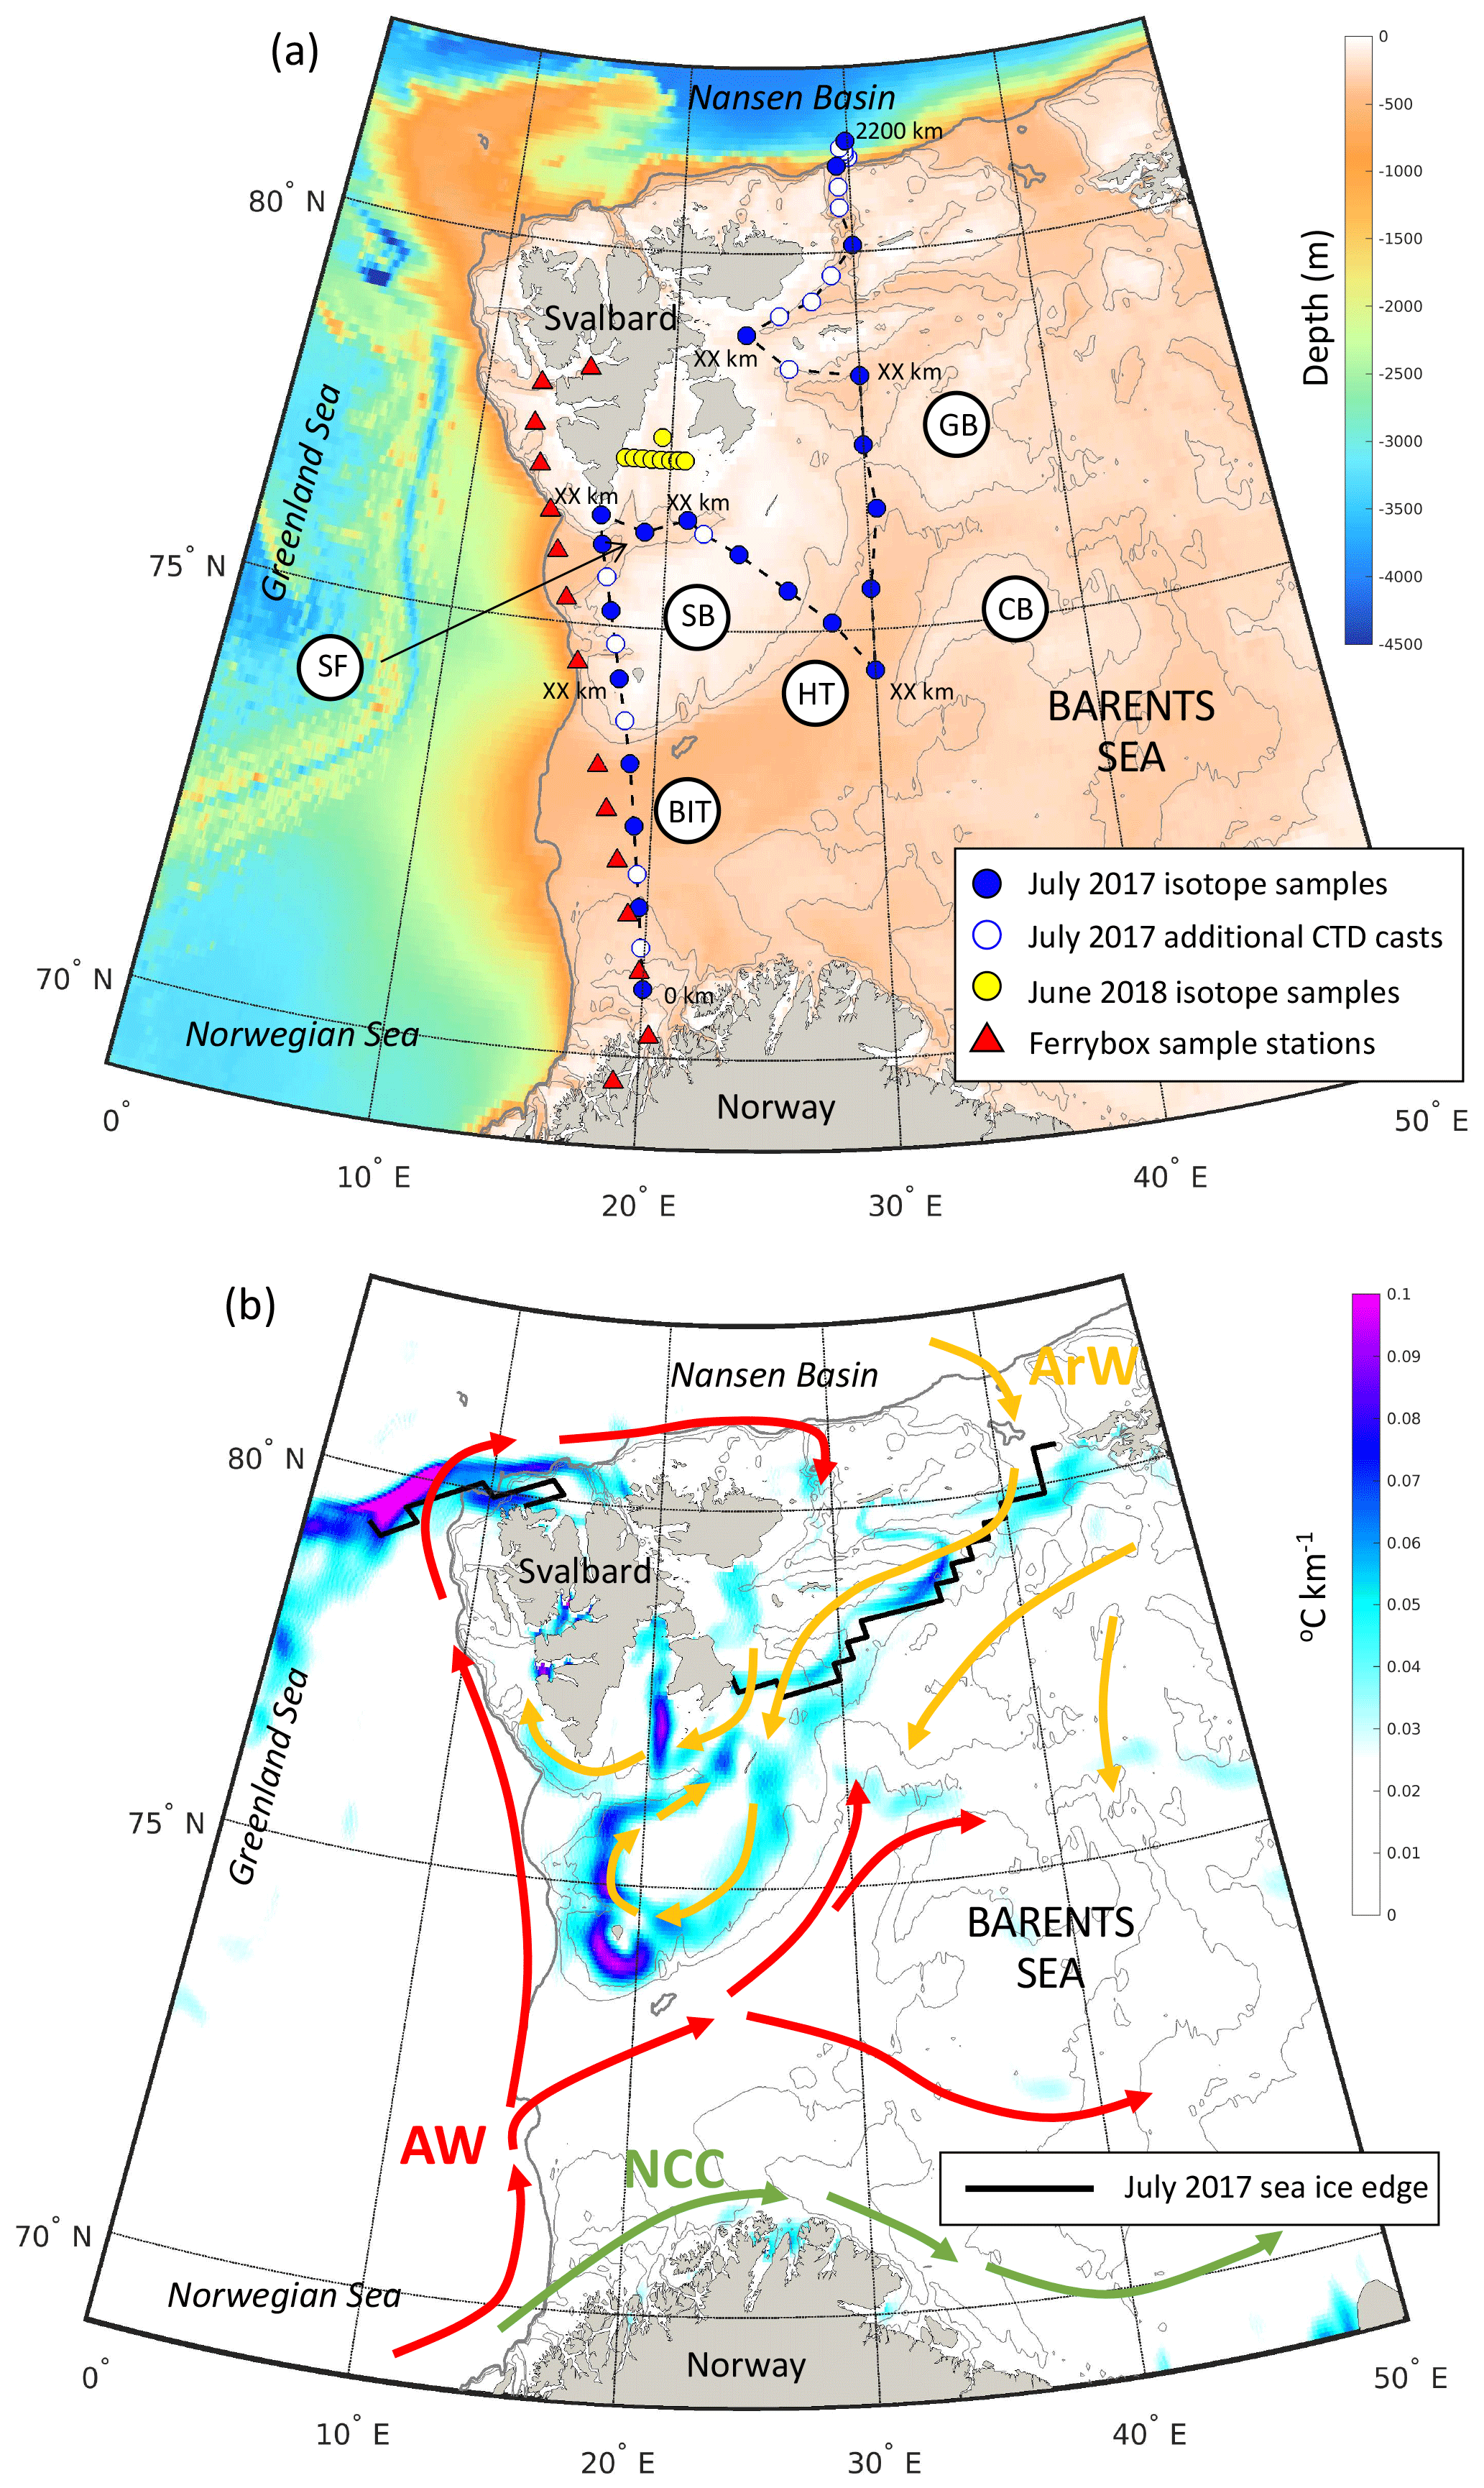
Figure 1(a) Station locations within the Barents Sea from JR16006 during July 2017 and on repeat Ferrybox transects in March, June, August and November 2018. Shading is the depth (in metres). The grey contours mark the 200, 300 and 500 m isobaths. Key bathymetric features are marked: Bear Island Trough (BIT), Hopen Trench (HT), Spitsbergen Bank (SB), Central Bank (CB), Great Bank (GB), Storfjordrenna (SR), Kong Karls Land (KKL) and the Barents Sea Opening (BSO). Distances along the transects presented in Figs. 2 and 3 are marked. (b) Schematic of the circulation of Atlantic Water (AW), Arctic Water (ArW) and the Norwegian Coastal Current (NCC). Shading is the July 2017 sea surface temperature gradient (∘C km−1) calculated from the OSTIA SST product (Donlon et al., 2012) and shows the sea surface temperature expression of the polar front along the edges of Spitsbergen Bank and Great Bank. The solid black contour marks the July 2017 sea ice edge (data from the National Snow and Ice Data Center). Grey bathymetric contours are like in (a).
Intense cooling of AW across the Barents Sea, reinforced by brine rejection due to ice formation, creates dense Barents Sea Water (BSW) that cascades into the deeper troughs of the central and eastern Barents Sea (Arthun et al., 2011; Oziel et al., 2016). BSW eventually leaves the shelf mainly through the St. Anna Trough (Smedsrud et al., 2013) where it is entrained into Arctic Intermediate Water and spreads further into the Arctic Basin (Schauer et al., 1997).
The Barents Sea is experiencing a rapid decline in winter and summer sea ice cover (Onarheim and Arthun, 2017; Arthun et al., 2012), full-depth warming driven by both increased ocean heat transport from the Atlantic and amplified atmospheric warming over the Arctic (Arthun et al., 2012; Onarheim et al., 2015; Serreze et al., 2009), and increases in salinity (Lind et al., 2018; Barton et al., 2018). The area occupied by AW is increasing, and the southern expression of the polar front is moving north (Oziel et al., 2016, 2020). In the northern Barents Sea, a reduction in sea ice import and therefore a loss of freshwater is weakening stratification and enhancing vertical mixing (Lind et al., 2018). The northern Barents Sea is therefore transitioning from a cold, salinity-stratified shelf into a warmer, less-stratified Atlantic-dominated climate regime (Lind et al., 2018), a process described as “Atlantification”. These changes may increase nutrient availability to phytoplankton over the growing season (Henley et al., 2020; Randelhoff et al., 2018), which is increasingly a control on Arctic net primary production (NPP) (Lewis et al., 2020).
On the other side of the Arctic, the Pacific Ocean supplies high concentrations of nutrients onto the Chukchi and East Siberian shelves, fuelling productivity and nutrient uptake (Granger et al., 2011). Increases in volume transport through the Bering Strait in recent years (Woodgate, 2018) have increased Pacific nutrient supply to the Arctic Basin. These waters are relatively depleted of nitrate (in comparison to phosphate) and, combined with sedimentary denitrification on the shallow shelves (Fripiat et al., 2018; Granger et al., 2018), promote nitrogen limitation in the western Arctic Ocean (Mills et al., 2018).
Although many studies have found the western Arctic Ocean to be strongly N limited (Mills et al., 2018; Granger et al., 2018; Brown et al., 2015), we know less about the extent of N limitation and occurrence of sedimentary denitrification in the eastern Arctic Ocean. Nitrate isotope measurements can give integrated estimates of nitrogen cycling processes, yet there is currently no data on the North Atlantic inputs which provide nutrients to the Arctic Basin via the Barents Sea. The 15∕14N and 18∕16O in nitrate (δ15N-NO3 and δ18O-NO3, respectively) provide complementary information about nitrate uptake by phytoplankton and regeneration processes (Sigman et al., 2009b) and can be used to determine the relevant N cycling processes.
Nitrate consumption through algal uptake fractionates both N and O in a 1:1 ratio (Granger et al., 2004) with an isotope effect close to ∼ 5 ‰ (Sigman et al., 2009b). Nitrogen loss through denitrification in the water column leads to enrichment in N and O isotopes in the residual nitrate pool with a fractionation of 25 ‰–30 ‰ (Sigman et al., 2009a). In sediments, denitrification does not usually impart a signature on nitrate isotopes as the reaction goes to completion (Sigman et al., 2003; Lehmann et al., 2007). However, multiple studies from the western Arctic and Bering Sea show that benthic denitrification can impart a signature on the overlying water column (ε=0 ‰–5 ‰) when high δ15N-NH4 is released, a process termed coupled partial nitrification–denitrification (Brown et al., 2015).
Over most of the ocean, fixed nitrogen is efficiently recycled in surface waters, and the regeneration of nitrate in the water column retains a δ15N signature from the N source (Sigman et al., 2000). The δ15N signature imparted on nitrate can therefore be used to identify nutrient sources from a partial utilization of nutrients (Rafter et al., 2012), different water masses (Sigman et al., 2000; Tuerena et al., 2015), new N inputs (Knapp et al., 2008; Marconi et al., 2017), atmospheric inputs (Altieri et al., 2016) and rivers (Thibodeau et al., 2017).
In contrast to δ15N-NO3 in which N atoms are internally recycled during nitrification, oxygen atoms are sourced from ambient O2 and seawater, in general providing a nitrification signature of δ18O-H2O plus 1.1 ‰ (Buchwald et al., 2012; Sigman et al., 2009b). The contrasting sources of N and O atoms and thus their distinct isotopic signatures allow the relative importance of preformed and regenerated nitrate to be investigated (Rafter et al., 2013). The δ18O-NO3 value has been used to quantify the extent of regeneration on the Bering Sea shelf (Granger et al., 2011) and as evidence for the significance of nitrate regeneration in sustaining nutrient stocks on Arctic shelves (Fripiat et al., 2018; Granger et al., 2018). The tracer Δ(15–18) (δ15N-NO3 minus δ18O-NO3) captures the differences between these two isotopes, highlighting nitrate sources from different oceanic environments (Rafter et al., 2013).
When nitrate is not fully consumed in surface waters, δ15N-NO3 and δ18O-NO3 can indicate the extent of seasonal nitrate uptake by phytoplankton (DiFiore et al., 2009). The δ15N of surface water nitrate increases as nitrate is progressively utilized by phytoplankton through the preferential consumption of 14N (Sigman et al., 1999). Together with other N cycling processes, this can be described by Rayleigh fractionation systematics (Mariotti et al., 1981). Nitrate utilization by phytoplankton in an environment where there is no resupply of nutrients, i.e. a stratified upper ocean in summer, follows Rayleigh fractionation systematics for a closed system, with δ15N-NO3 falling on a fractionation trend for its isotopic effect (ε) (Granger et al., 2004). In combination with dissolved nutrients, the δ15N of particulate nitrogen (δ15N-PN) can track the extent of biological utilization, contrasting nutrient sources and the significance of new vs regenerated nutrients (Altabet and Francois, 1994).
In this study, we report the first stable isotope measurements of dissolved and particulate N in the Barents Sea and use them to understand the relative sources of nutrients fuelling contemporary Barents Sea productivity. We use stable isotope tracers to investigate how N cycling processes vary across the Barents Sea in contrast to other Arctic shelves and reflect upon the susceptibility of the ecosystem to climate change.
Samples were collected in the Barents Sea as part of the ARISE project (NERC Changing Arctic Ocean programme). Shipboard measurements were taken from the RRS James Clark Ross during July–August 2017 (JR16006). A 2200 km transect was completed, comprising 59 full-depth conductivity, temperature and depth (CTD) casts, starting from the northern tip of Norway and ending at the shelf edge north-east of Svalbard (Fig. 1a). The transect crossed the Barents Sea Opening (BSO) between Norway and the southern tip of Svalbard. Then, from Hopen Trench it continued north towards Kong Karls Land (KKL; along 30∘ E) and to the shelf edge and Nansen Basin.
Standard CTD measurements and water sampling were performed using a stainless steel rosette equipped with a full sensor array and 24 20 L OTE bottles. Conductivity, temperature and pressure were measured using a CTD system (Seabird 911+). Derived salinity was calibrated on-board with discrete samples using an Autosal 8400B salinometer (Guildline) (Dumont et al., 2019), and an SBE43 oxygen sensor was calibrated against oxygen samples analysed using the Winkler method. A Biospherical QCP Cosine PAR sensor measured downwelling photosynthetically available radiation (PAR; 400–700 nm). We define the base of the euphotic zone to be the depth where PAR decreased to 1 % of its surface value. The mean depth of the euphotic zone was 34.3 ± 11.9 m.
Dissolved inorganic nutrient concentrations were determined using a Bran and Luebbe QuAAtro 5-channel auto analyser (SEAL Analytical) and aACE operating platform (V 6.1) following standard colourimetric methods with a CRM precision of 0.3 %, 0.8 % and 1.9 % for nitrate+nitrite, phosphate and nitrite, respectively (Brand et al., 2020). Nitrate isotope samples were collected and filtered inline from the CTD using an AcroPak and were frozen at −20 ∘C until analysis. Of the 59 CTD casts in 2017, 23 were sampled for nitrate isotopes covering the full water column (Tuerena and Ganeshram, 2020). Particulate nitrogen (PN) and δ15N-PN samples were collected from 21 profiles in the upper 200 m at stations where nitrate isotope samples were also collected (Norman et al., 2020). Samples were gently vacuum filtered through combusted Whatman GF/F filters (450 ∘C, 4 h, 47 or 25 mm, nominal pore size 0.7 µm) until sufficient biomass was collected on the filter (8 to 12 L for the 47 mm diameter filters and 2 to 5 L for the 25 mm diameter filters). The filters were dried at 60 ∘C to remove all moisture and were stored folded and wrapped in combusted aluminium foil until their return to the home laboratory where they were placed in a −80 ∘C freezer until analysis.
To quantify the distinct nutrient concentrations, nutrient ratios and isotopic values of Atlantic Water (AW), Barents Sea Water (BSW) and Arctic Water (ArW), we define the water mass type of each sample using the water mass properties in Oziel et al. (2016). These are summarized in Table 1.
Additional sampling was conducted in collaboration with the Norsk Institutt for Vannforskning (NIVA, Oslo) during transits made by the general cargo vessel M/S Norbjørn between Tromsø, Norway, and Longyearbyen, Svalbard. The M/S Norbjørn is a “ship of opportunity” onto which NIVA has fitted a Ferrybox system that measures a variety of parameters including temperature and salinity at approximately 4 m depth. In addition, seawater can be collected directly from the system for further analysis. During each 4 d transit in March, June, August and November 2018, surface seawater samples were collected for the analysis of δ15N of particulate organic nitrogen (δ15N-PN), the δ15N and δ18O of nitrate (δ15N-NO3, δ18O-NO3), and inorganic nutrients (nitrate+nitrite, nitrite, silicate and phosphate) from 15 stations at pre-determined latitudes (Fig. 1a). Seawater was filtered through combusted GF/F filters for δ15N-PN analysis, and aliquots of the filtrate were placed into acid-cleaned high density polyethylene (HDPE) bottles and stored at −20 ∘C for the analysis of δ15N-NO3 and inorganic nutrients.
The isotopic composition of nitrate+nitrite (δ15N-NO3 and δ18O-NO3) was determined by the denitrifier method (Sigman et al., 2001; Casciotti et al., 2002) and following GEOTRACES protocols (Schlitzer et al., 2018). Samples were corrected using international reference standards N3 and USGS-34 (Weigand et al., 2016) and expressed in delta notation: δ15N-NO3 (‰ vs AIR) = (; δ18O-NO3 (‰ vs VSMOW) = (. Standards were run in triplicate with a reproducibility (σ) of δ15N ± 0.1 ‰ and δ18O ± 0.3 ‰. Internal standards were analysed in each run and corrected using N3 and U34, with an inter-run standard deviation of δ15N ± 0.1 ‰ and δ18O ± 0.3 ‰. Nitrite concentrations in our study region ranged from 0–0.66 µM, the highest concentration contributing 6 % of the nitrate+nitrite pool. Our isotopic measurements are compared to studies in which the nitrite in a sample has been removed using sulfamic acid (Granger and Sigman, 2009); to account for this, when nitrite was > 2.5 % of nitrate+nitrite, samples were re-run with sulfamic acid removal. For samples when nitrite was < 2.5 % of nitrate+nitrite, we correct our δ18O-NO3 data for nitrite interference following Kemeny et al. (2016). The δ15N-NO3+NO2 samples were also corrected assuming a δ15N-NO2 of −24 ‰ (Kemeny et al., 2016; Henley et al., 2017).
The δ15N-PN value was determined by elemental analysis with isotope ratio mass spectrometry (EA-IRMS) using a Costech Instruments elemental analyser coupled to a Thermo Scientific DELTA V Advantage mass spectrometer fitted with a ConFlo IV gas handling system. The instrumentation was operated using ISODAT 3.0 isotope ratio mass spectrometry software. Prior to analysis, the filters were wrapped in tin foil cones (OEA Laboratories) and pelletized. L-glutamic acid standards USGS 40 and USGS 41A were used as calibration standards during each analysis run. The δ15N values obtained for USGS 40 were −4.52 ± 0.08 ‰, n=28, and for USGS 41A 47.56 ± 0.18 ‰, n=21. A 10-point calibration using standard USGS 40 was measured to provide the linear regression equation (peak area vs expected N concentration) which was used to derive PN concentrations from the measured peak areas. Micrograms per litre (µg/L) concentrations were then calculated using the concentration obtained from the whole filter and volume of seawater filtered. The detection limit for PN was 10 µg.
The Barents Sea Opening (BSO) between Norway and Svalbard was dominated by saline (S> 34.8) Atlantic inflow, notably in Bear Island Trough (BIT; Figs. 1a, 2b). South of the Spitsbergen Bank, the water column was thermally stratified, with temperature exceeding 6 ∘C in the euphotic zone (Fig. 2a). South of 72∘ N, low-salinity (S< 34.7) water from the Norwegian Coast Current (NCC) occupied the near-surface layer (Fig. 2b). The water column was fresher, colder and well mixed over the shallow Spitsbergen Bank. This marks the westernmost extent of ArW and the polar front (Fig. 1b) and coincides with strong tidal currents and topographically steered flows (Oziel et al., 2016; Sundfjord et al., 2007; Vage et al., 2014).
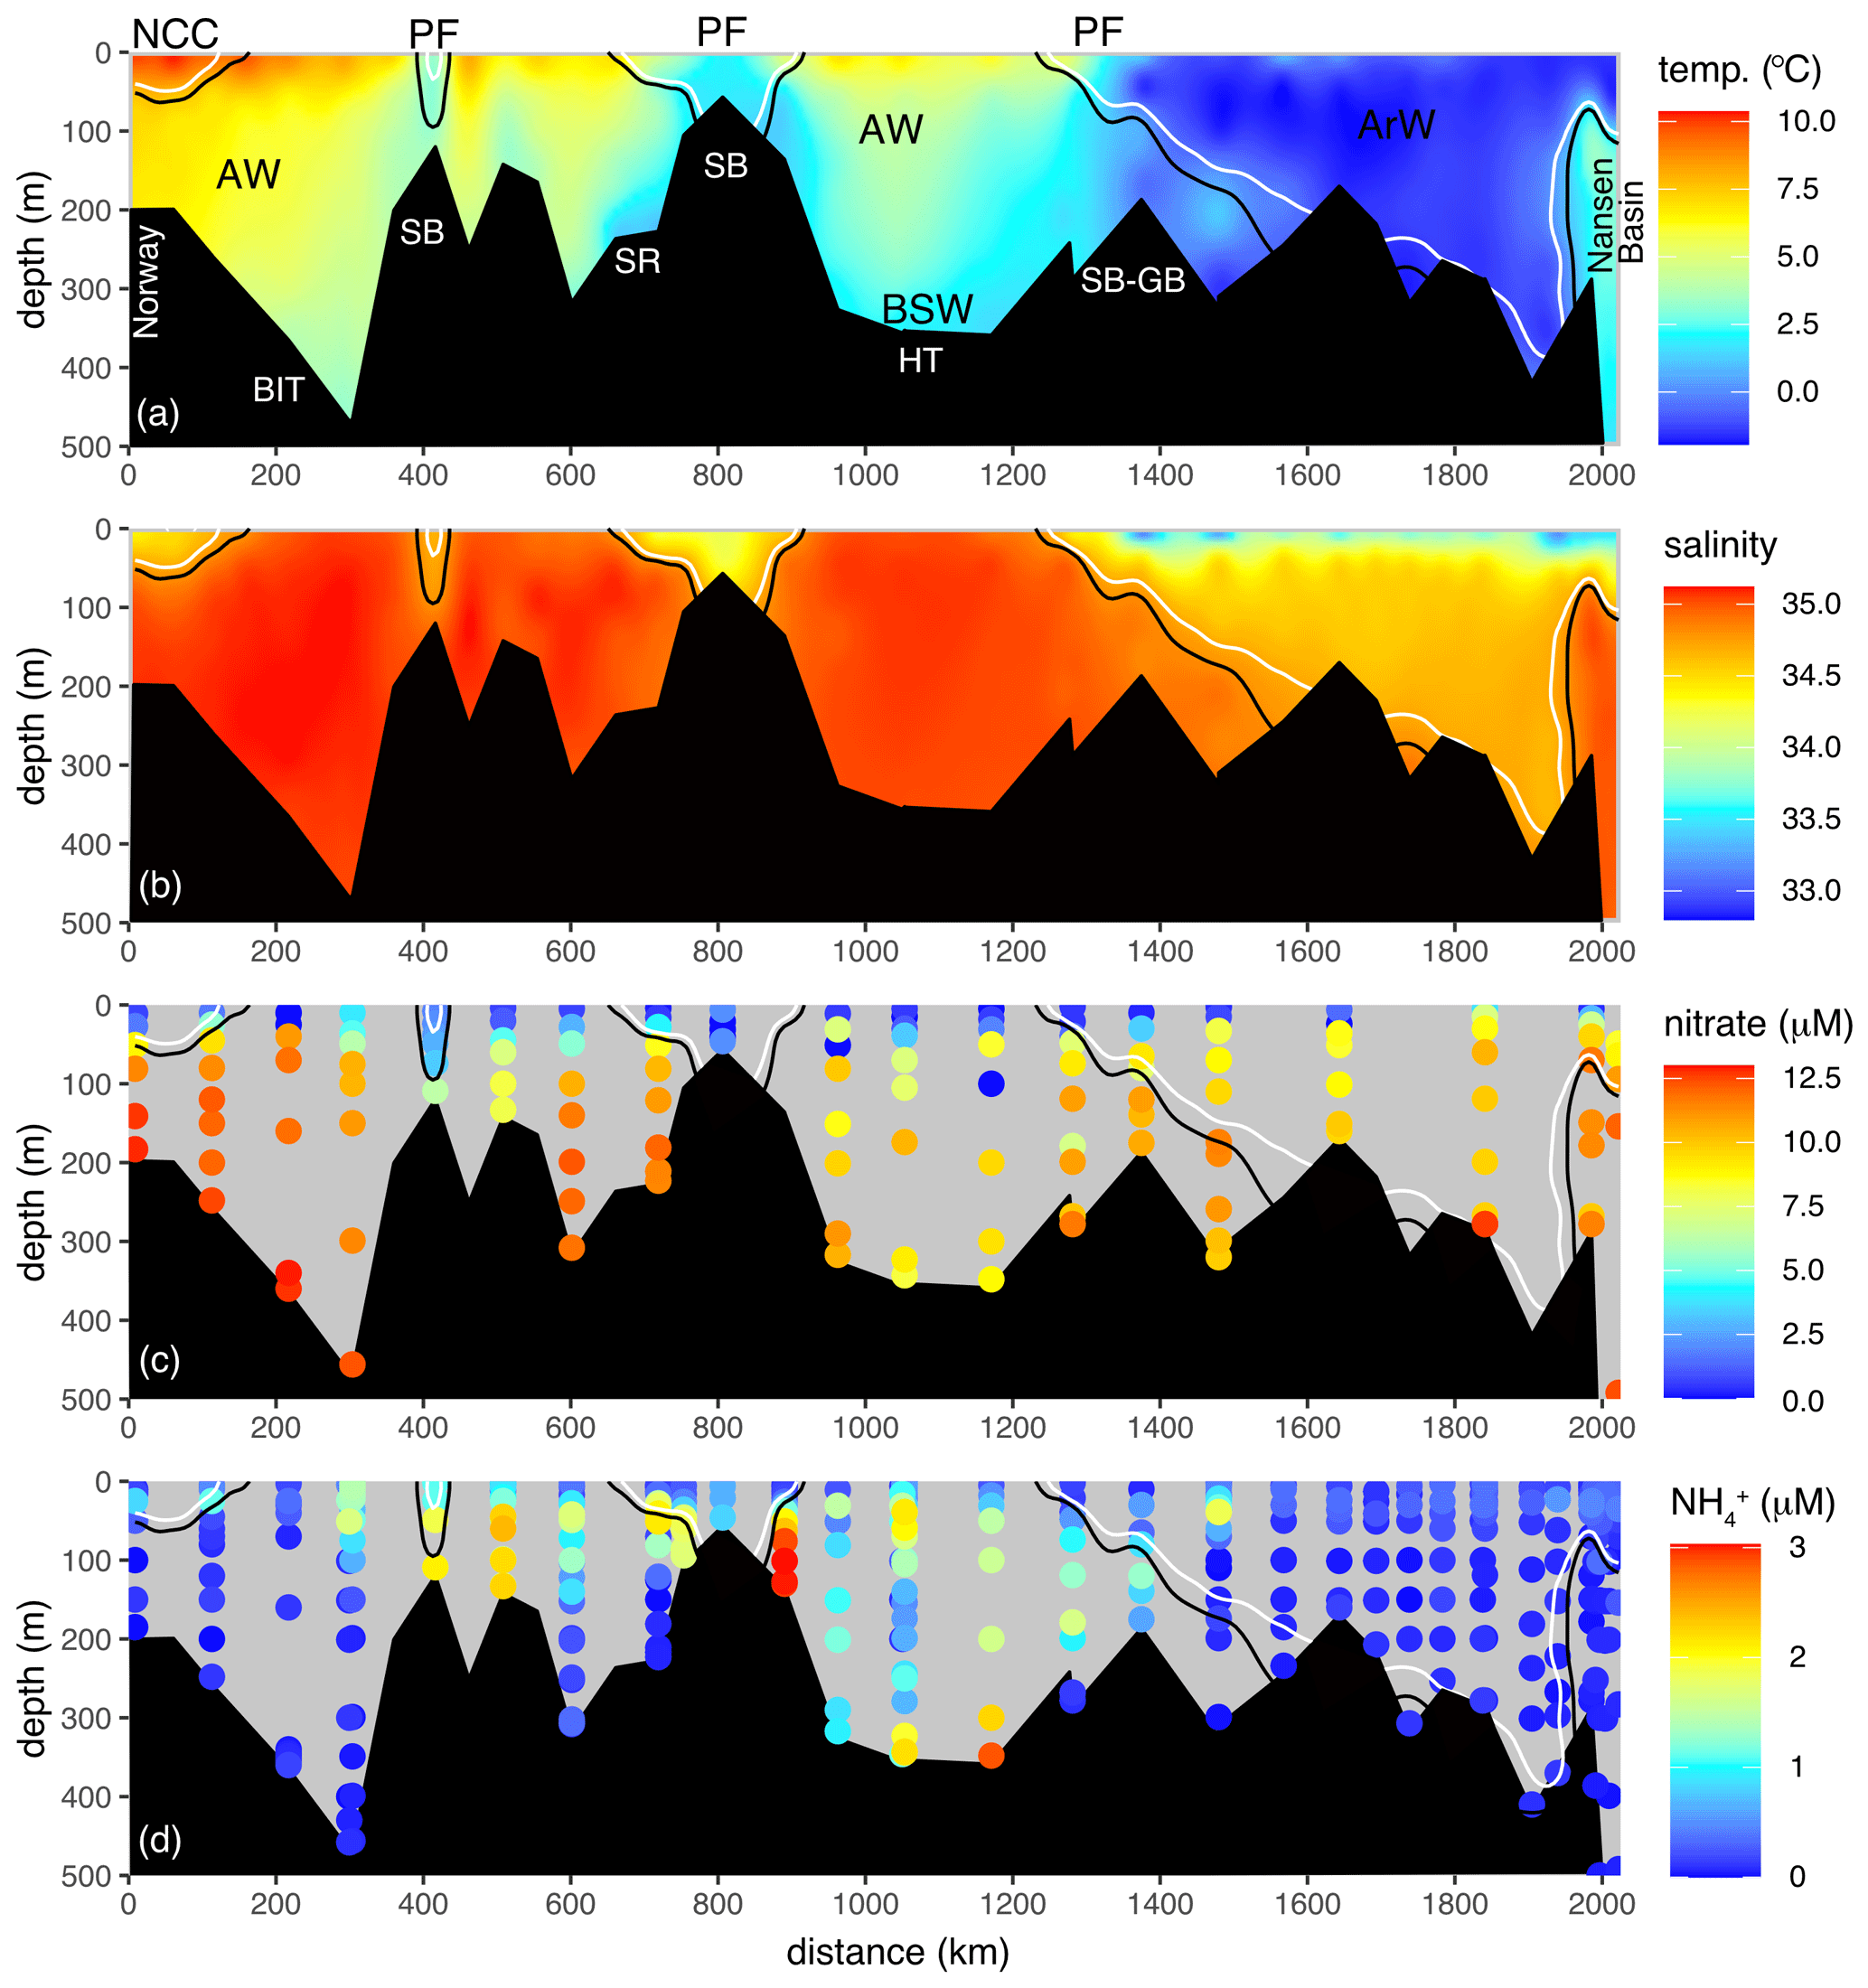
Figure 2Full 2017 transect of (a) temperature, (b) salinity, (c) nitrate and (d) NH. Transect is displayed in Fig. 1. Solid black and white lines are the 34.8 and 34.7 isohalines. Atlantic Water (AW), Arctic Water (ArW), Barents Sea Water (BSW) and the Norwegian Coastal Current (NCC) are indicated in (a). For reference, key bathymetry features are marked in (a): Spitsbergen Bank (SB), Storfjordrenna (SR), Hopen Trench (HT), Bear Island Trough (BIT), and the Spitsbergen and Great banks sill (SB-GB). PF marks the location of the surface expression of the polar front.
Dense Barents Sea Water (BSW) was observed near the seabed in Hopen Trench (Fig. 2a; HT). Above it lay cooled Atlantic origin water and a thermally stratified surface layer. North of the narrow sill joining the Spitsbergen and Great banks (Fig. 2a; SB-GB), the approximate location of the polar front, colder (< 0 ∘C) and fresher (S< 37.7) ArW occupied depths below 50 m (Fig. 2b). This was capped with an even fresher (S< 34) layer of sub-zero temperature melt water. This polar surface layer extended southwards from the Nansen Basin, becoming progressively thinner. Below 100 m depth, over the shelf break and continental slope of the Nansen Basin, high-salinity (cooled) Atlantic origin water was observed within the boundary current that entered the Arctic via the Fram Strait (far right of Fig. 2a and b).
In the AW, nitrate concentrations were relatively homogenous below the mixed layer (11.8 ± 1.8 µM) but low or below the limits of detection in the euphotic layer (Fig. 2c). NH concentrations were highest close to the seafloor over the Spitsbergen Bank (Figs. 2d, 4c). Both δ15N-NO3 and δ18O-NO3 were relatively homogenous in the deeper AW (δ15N-NO3=5.1 ± 0.1 ‰, δ18O-NO3=2.8 ± 0.3 ‰; Fig. 3a and b; Table 1), and N* was close to Redfield (0.2 ± 0.8 µM). As nitrate concentrations decreased into the euphotic zone, both δ15N-NO3 and δ18O-NO3 increased as a result of nitrate utilization by phytoplankton (Fig. 4e and f).

Figure 3Full 2017 transect of (a) δ15N-NO3, (b) δ18O-NO3, (c) N* and (d) proportion of regenerated nitrate. Transect is displayed in Figure 1. Solid black and white lines are the 34.8 and 34.7 isohalines. Atlantic Water (AW), Arctic Water (ArW), Barents Sea Water (BSW) and the Norwegian Coastal Current (NCC) are indicated in (a). The proportion of regenerated nitrate is predicted using δ18O-NO3 source values from the Atlantic (2.8 ‰) and a nitrified value calculated using a δ18O-H2O of 0.2 ‰ (Schlitzer et al., 2018) plus 1.1 ‰ (1.3 ‰). Circles with a grey outline show values not plotted to colour scale and outside of the range used in the plot.
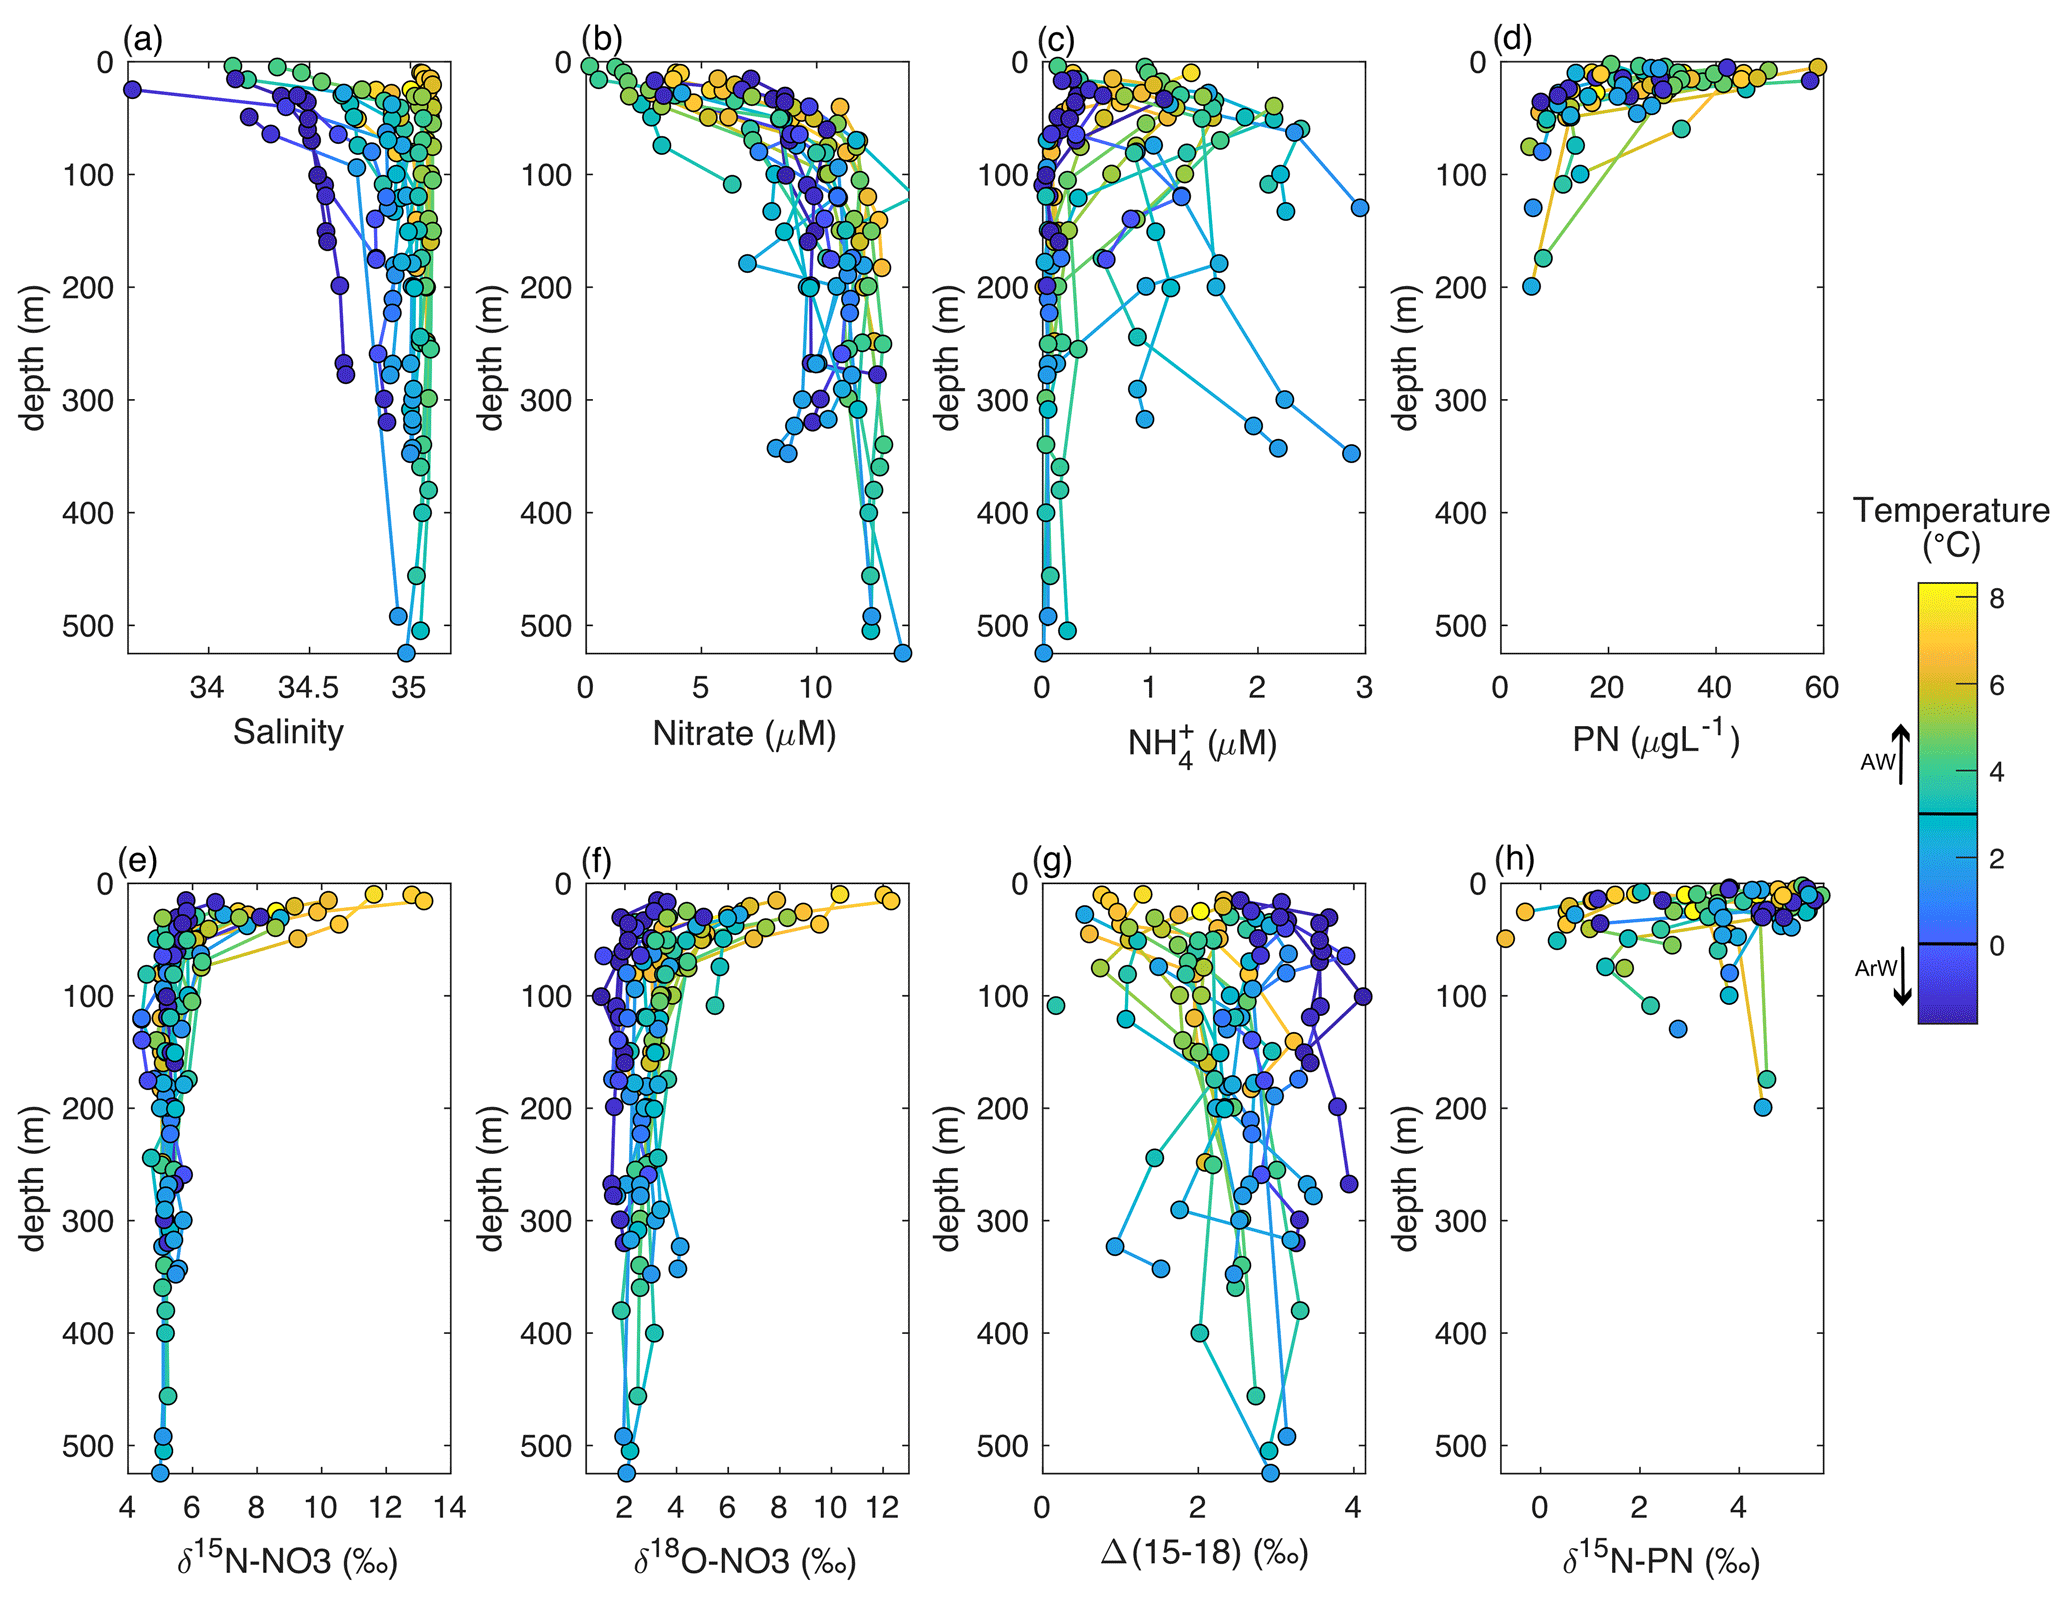
Figure 4Depth profiles of the upper 500 m of the Barents Sea shelf. Colour denotes temperature changes. (a) Salinity, (b) nitrate (µM), (c) NH (µM), (d) PN (µg L−1), (e) δ15N-NO3 (‰ vs AIR), (f) δ18O-NO3 (‰ vs VSMOW), (g) Δ(15–18) (‰) and (h) δ15N-PN (‰ vs AIR).
The cooler ArW in the north of the Barents Sea had slightly lower (although not significantly different) nitrate concentrations of 10 ± 1.1 µM (Table 1). NH concentrations were high close to the seafloor in Hopen Trench but decreased with increasing latitude. There was no significant difference in δ15N-NO3 or N* between AW and ArW (ArW δ15N-NO3=5.1 ± 0.1 ‰, .0 ± 0.7 µM, Table 1), suggesting these nutrients also originated from the Atlantic. In contrast, δ18O-NO3 was 1.2 ‰ lower in ArW compared to AW (Figs. 3b, 4f).
In the BSW, δ15N-NO3, nitrate and N* were comparable to AW and ArW (δ15N-NO3=5.1 ± 0.4 ‰, nitrate =10.4 ± 1.2 µM, .1 ± 1.1 µM). BSW δ18O-NO3 was 2.1 ± 0.5 ‰, lower than AW but higher than ArW, reflecting a mix between these two water masses.
4.1 Origin of Atlantic Water supplied to the Barents Sea
The origin of AW is important as pre-bloom nutrient concentrations advected into the Barents Sea set the upper limit on seasonal primary productivity. The nutrient concentration within AW is controlled by the relative contribution of nutrient-rich North Atlantic subpolar water and nutrient-poor subtropical waters that reach the Norwegian Sea together with the biological and physical transformations en route (Hatun et al., 2017; Rey, 2012; Johnson et al., 2013). Here we consider the contribution of subtropical and subpolar water to the AW sampled in the Barents Sea based on known nitrate isotope end members. We discuss the processes that the source waters are likely to have undergone and consider historical and future long-term trends in δ15N-NO3.
Atlantic Water sampled in the Barents Sea during this study had a nitrate concentration of 11.8 ± 1.2 µM (below the mixed layer; Table 1) and a δ15N-NO3 of 5.1 ± 0.1 ‰ (Table 1). This δ15N-NO3 is comparable to the subpolar gyre thermocline nitrate of 4.8 ± 0.1 ‰ (Peng et al., 2018) when compared over the same depth range (this study > 200 m 5.0 ± 0.1 ‰). Subtropically sourced δ15N-NO3 ( ∼ 3.9 ‰) is lower than subpolar δ15N-NO3 (Van Oostende et al., 2017) as there are significant inputs from N2 fixation producing a lower δ15N nitrate source (Knapp et al., 2008). In comparison, isotopic measurements of subpolar nitrate and particulate nitrogen (PN) reveal the dominance of new production with local phytoplankton utilizing nitrate sources from the subpolar thermocline (Peng et al., 2018; Van Oostende et al., 2017; this study), which is comparable to North Atlantic Deep Water (NADW) (4.75 ‰–5 ‰) (Marconi et al., 2015).
The δ18O-NO3 of AW in the Barents Sea (2.8 ± 0.3 ‰; Table 1) is high compared to NADW (1.67 ‰–2.02 ‰) (Marconi et al., 2015). The δ18O-NO3 of NADW results from regeneration leading to δ18O-NO3 close to the δ18O-H2O source plus 1.1 ‰ (Buchwald et al., 2012; Sigman et al., 2009b). Our characterization of the AW nitrate that enters the Barents Sea reveals an enrichment in δ18O-NO3 above a purely regenerated signal which is also present in the subpolar gyre (Van Oostende et al., 2017). We measured a greater elevation in δ18O-NO3 (by 0.8 ‰) than δ15N-NO3 (0.1 ‰) compared to NADW. An elevation in δ18O-NO3 relative to deep water values from the North Atlantic demonstrates that partial nitrate assimilation followed by nitrification occurs in the subpolar North Atlantic which decreases δ15N-NO3 to a greater extent than δ18O-NO3 (Van Oostende et al., 2017; Peng et al., 2018). Our results suggest that seasonal mixing in the subpolar North Atlantic leaves an enrichment in δ18O-NO3 to depths of > 200 m, a signal which is then transported onto the Barents Sea shelf.
In the North Atlantic, low δ15N-NO3 is associated with the high salinity of the subtropical gyre (Knapp et al., 2008). The salinity of the AW supplied to the Barents Sea has increased in recent years (Barton et al., 2018; Oziel et al., 2016). We suggest that continued increases in salinity and the associated decrease in nitrate supply (Rey, 2012) have the potential to decrease δ15N-NO3 of Arctic nitrate supply albeit to a small degree. Based upon the salinity–δ15N-NO3 relationship established in the wider Atlantic (Marconi et al., 2015; Schlitzer et al., 2018), the 0.05–0.1 psu change in salinity between the periods 1985–2005 and 2005–2016 (Barton et al., 2018) implies that there has been a 0.06–0.13 decrease in δ15N-NO3 (Pearson correlation 0.82, df = 12, p-value = 0.0003).
4.2 Nitrate utilization and limitation in the Barents Sea
In July 2017, nitrate was depleted in the euphotic zone, coinciding with an increase in both δ15N-NO3 and δ18O-NO3. The seasonal uptake of nitrate by phytoplankton fractionates δ15N-NO3 and δ18O-NO3 with an isotope effect (ε) close to 5 ‰ (Sigman et al., 2009b). This relationship can determine the relative importance of algal uptake vs other processes such as dilution and regeneration (DiFiore et al., 2006; Rafter et al., 2012). Here we find that in the Arctic, ε is often muted in surface waters through dilution with nitrate-depleted freshwater.
The southern Barents Sea remains ice-free all year round, and away from the Norwegian Coastal Current, the near-surface salinity remains high. During the spring and summer months, a warm surface mixed layer is established which triggers phytoplankton growth. As nitrate decreases, both δ15N-NO3 and δ18O-NO3 increase, and algal uptake of nitrate is the dominant N cycling process occurring in the euphotic zone and is fuelled by new production (nitrate). We estimate a δ15N-NO3 uptake fractionation of 4.7 ‰–4.9 ‰ (Fig. 5a and c), with isotopic data following a trend for Rayleigh fractionation or a closed system (Mariotti et al., 1981). This finding is anticipated since strong stratification isolated the euphotic zone from deeper waters during the time of sampling. In the northern Barents Sea, δ15N-NO3 and δ18O-NO3 increase as nitrate decreases in the euphotic zone. These waters are cooler and fresher and are likely to have undergone at least one seasonal cycle on the Barents Sea shelf where there is evidence for nutrient regeneration (Sect. 4.3). We find a muted uptake fractionation in this region of 1.8 ‰ which is likely due to dilution of the nitrate concentration by fresh, nutrient-depleted surface water (Fig. 5a and c).
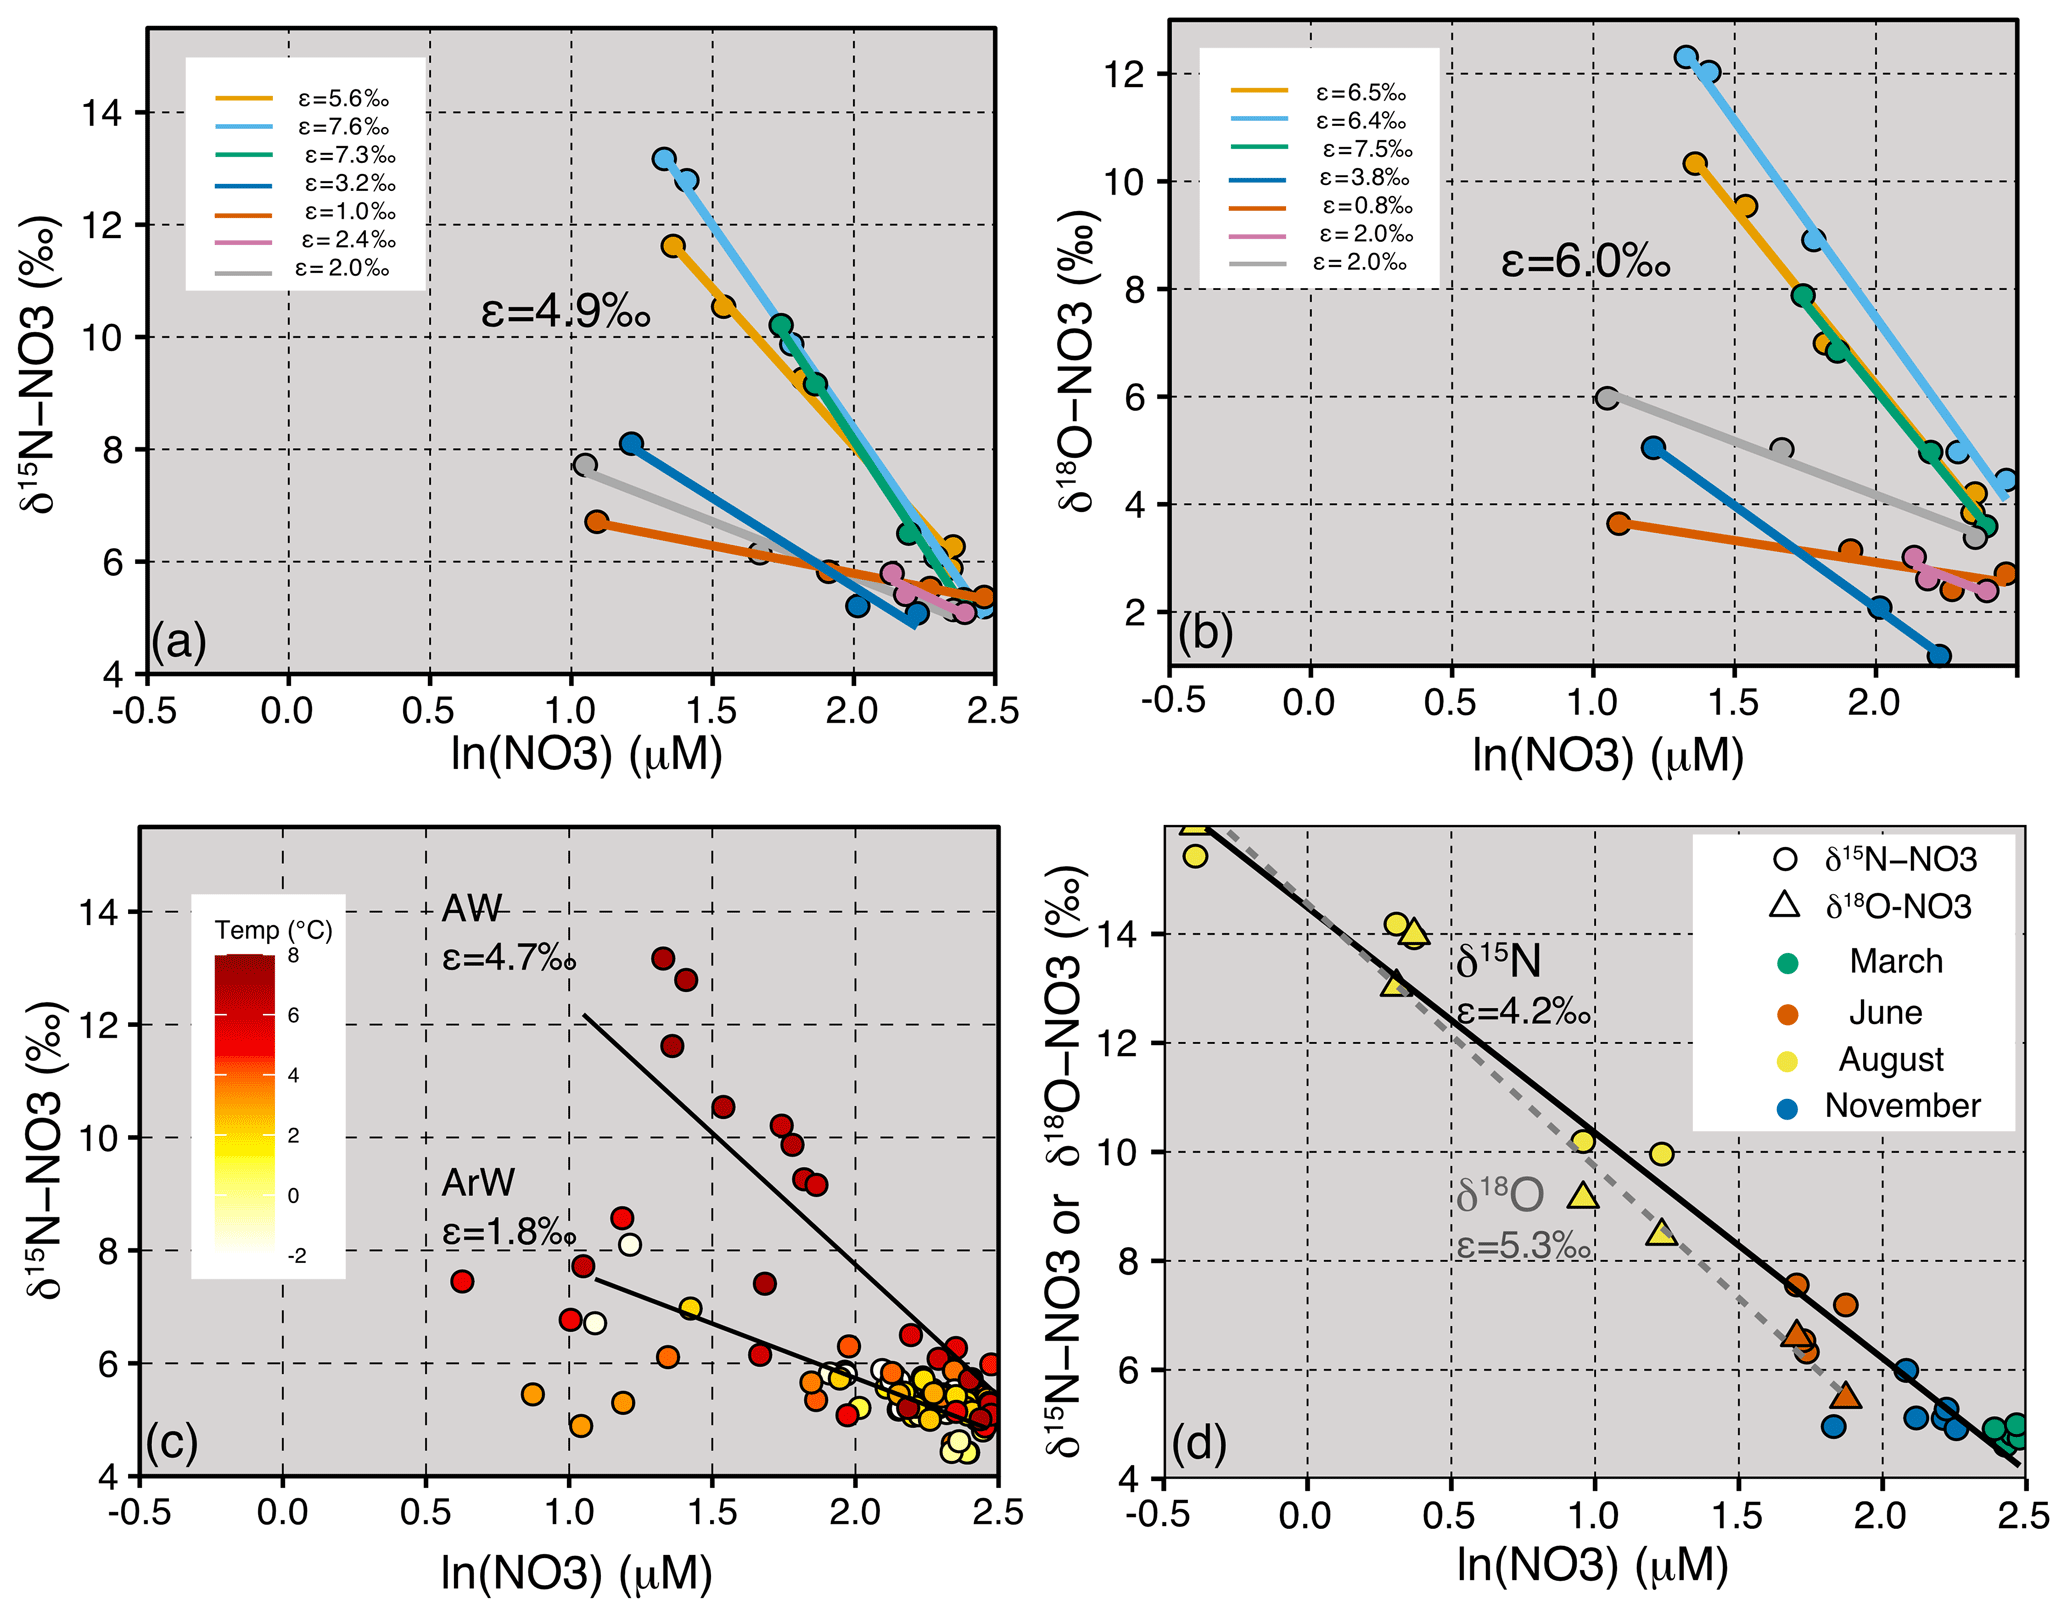
Figure 5Panel (a) is δ15N-NO3 vs lnNO3 from JR16006 showing the isotope effect (ε) for individual stations and an average of 4.9 ‰. Panel (b) is δ18O-NO3 vs lnNO3 from JR16006 showing ε for individual stations and an average of 6.0 ‰. In (a) and (b), only stations with more than three measurements in the upper 120 m are used, and ε is calculated from stations with less than a 0.2 unit change in salinity. (c) δ15N-NO3 vs lnNO3 for all samples from JR16006. The two ε trend lines are calculated for samples within the Atlantic Water (temperature > 3 ∘C, ε=4.7 ‰) and Arctic Water (temperature < 0 ∘C, ε=1.8 ‰). (d) δ15N-NO3 and δ18O-NO3 vs lnNO3 for seasonal Norbjørn samples between 72 and 76∘ N from the Barents Sea Opening, and ε=4.2 ‰ and 5.3 ‰, respectively.
Increases in δ18O-NO3 demonstrate an uptake fractionation of ∼ 6 ‰, which is slightly higher than estimated for δ15N-NO3 (Fig. 5a and b). In general, δ15N-NO3 and δ18O-NO3 increase to a similar degree at individual stations, with muted values of ε in the Arctic waters and higher values in the AWs (Fig. 5). Seasonal fractionation in δ18O-NO3 is also slightly higher (ε=5.3 ‰) compared to δ15N-NO3 (ε=4.2 ‰) (Fig. 5d). Our estimates of AW uptake fractionation of ∼ 4 ‰–8 ‰ for both δ15N-NO3 and δ18O-NO3 fall into the expected range for algal uptake (Tuerena et al., 2015, Sigman et al., 2009b). The higher fractionation of δ18O-NO3 may suggest some degree of simultaneous assimilation and nitrification co-occurring in the euphotic zone (DiFiore et al., 2010).
The stable isotopic signal recorded in the Arctic marine food web is primarily dependent upon the particulate organic material produced by phytoplankton, representing the base of the food web, whose 15N is controlled by the dissolved nutrient source. With knowledge of the mechanism behind isotopic fractionation during nitrate uptake and if nitrate uptake is the primary N cycling process occurring in the euphotic zone, then δ15N-PN may be predicted.
The JR16006 cruise was conducted during summer when the southern Barents Sea was thermally stratified. Further north, sea ice melt had established a fresh surface mixed layer resulting in salinity-driven stratification. Throughout the Barents Sea, particulate organic matter load was highest in the euphotic zone (average of 31.7 ± 14.7 µg L−1) and decreased to 9.5 ± 3.4 µg L−1 below 70 m (Fig. 4d). We found that δ15N-PN in the euphotic zone in summer months largely followed nitrate concentration, falling close to the trend for the integrated product of N uptake (Figs. 4h, 6a and b). In areas where there was still nitrate available to phytoplankton, δ15N-PN was lower, representing the preferential consumption of the lighter isotope. The δ15N-PN value increased to ∼ 5 ‰ as the nitrate concentration approached zero, matching the AW source. Using this information, we predict how the δ15N-PN is likely to change in the euphotic layer following Rayleigh fractionation systematics (δ15Nmod) from the nutrient sources of AW and ArW.
where , δ15Ninitial = 5.1 ‰, ε=4.8 ‰ and .8 µM. We find the spatial trends are captured in the modelled data with the highest modelled δ15N-PN when the concentrations are the lowest and vice versa (Fig. 6c). Deviations from the trend, representing a lower isotopic effect, are in lower temperature samples from ArW (Fig. 6c). At these locations, the upper euphotic zone is salinity stratified, and polar surface water dilutes the nitrate concentration. If the ArW samples are corrected to the lower isotope effect of 1.8 ‰ and nitrate concentration (10 µM), as predicted from our δ15N-NO3 data, we find a Pearson's correlation of r=0.86, df =33 and p=0 (Fig. 6d).
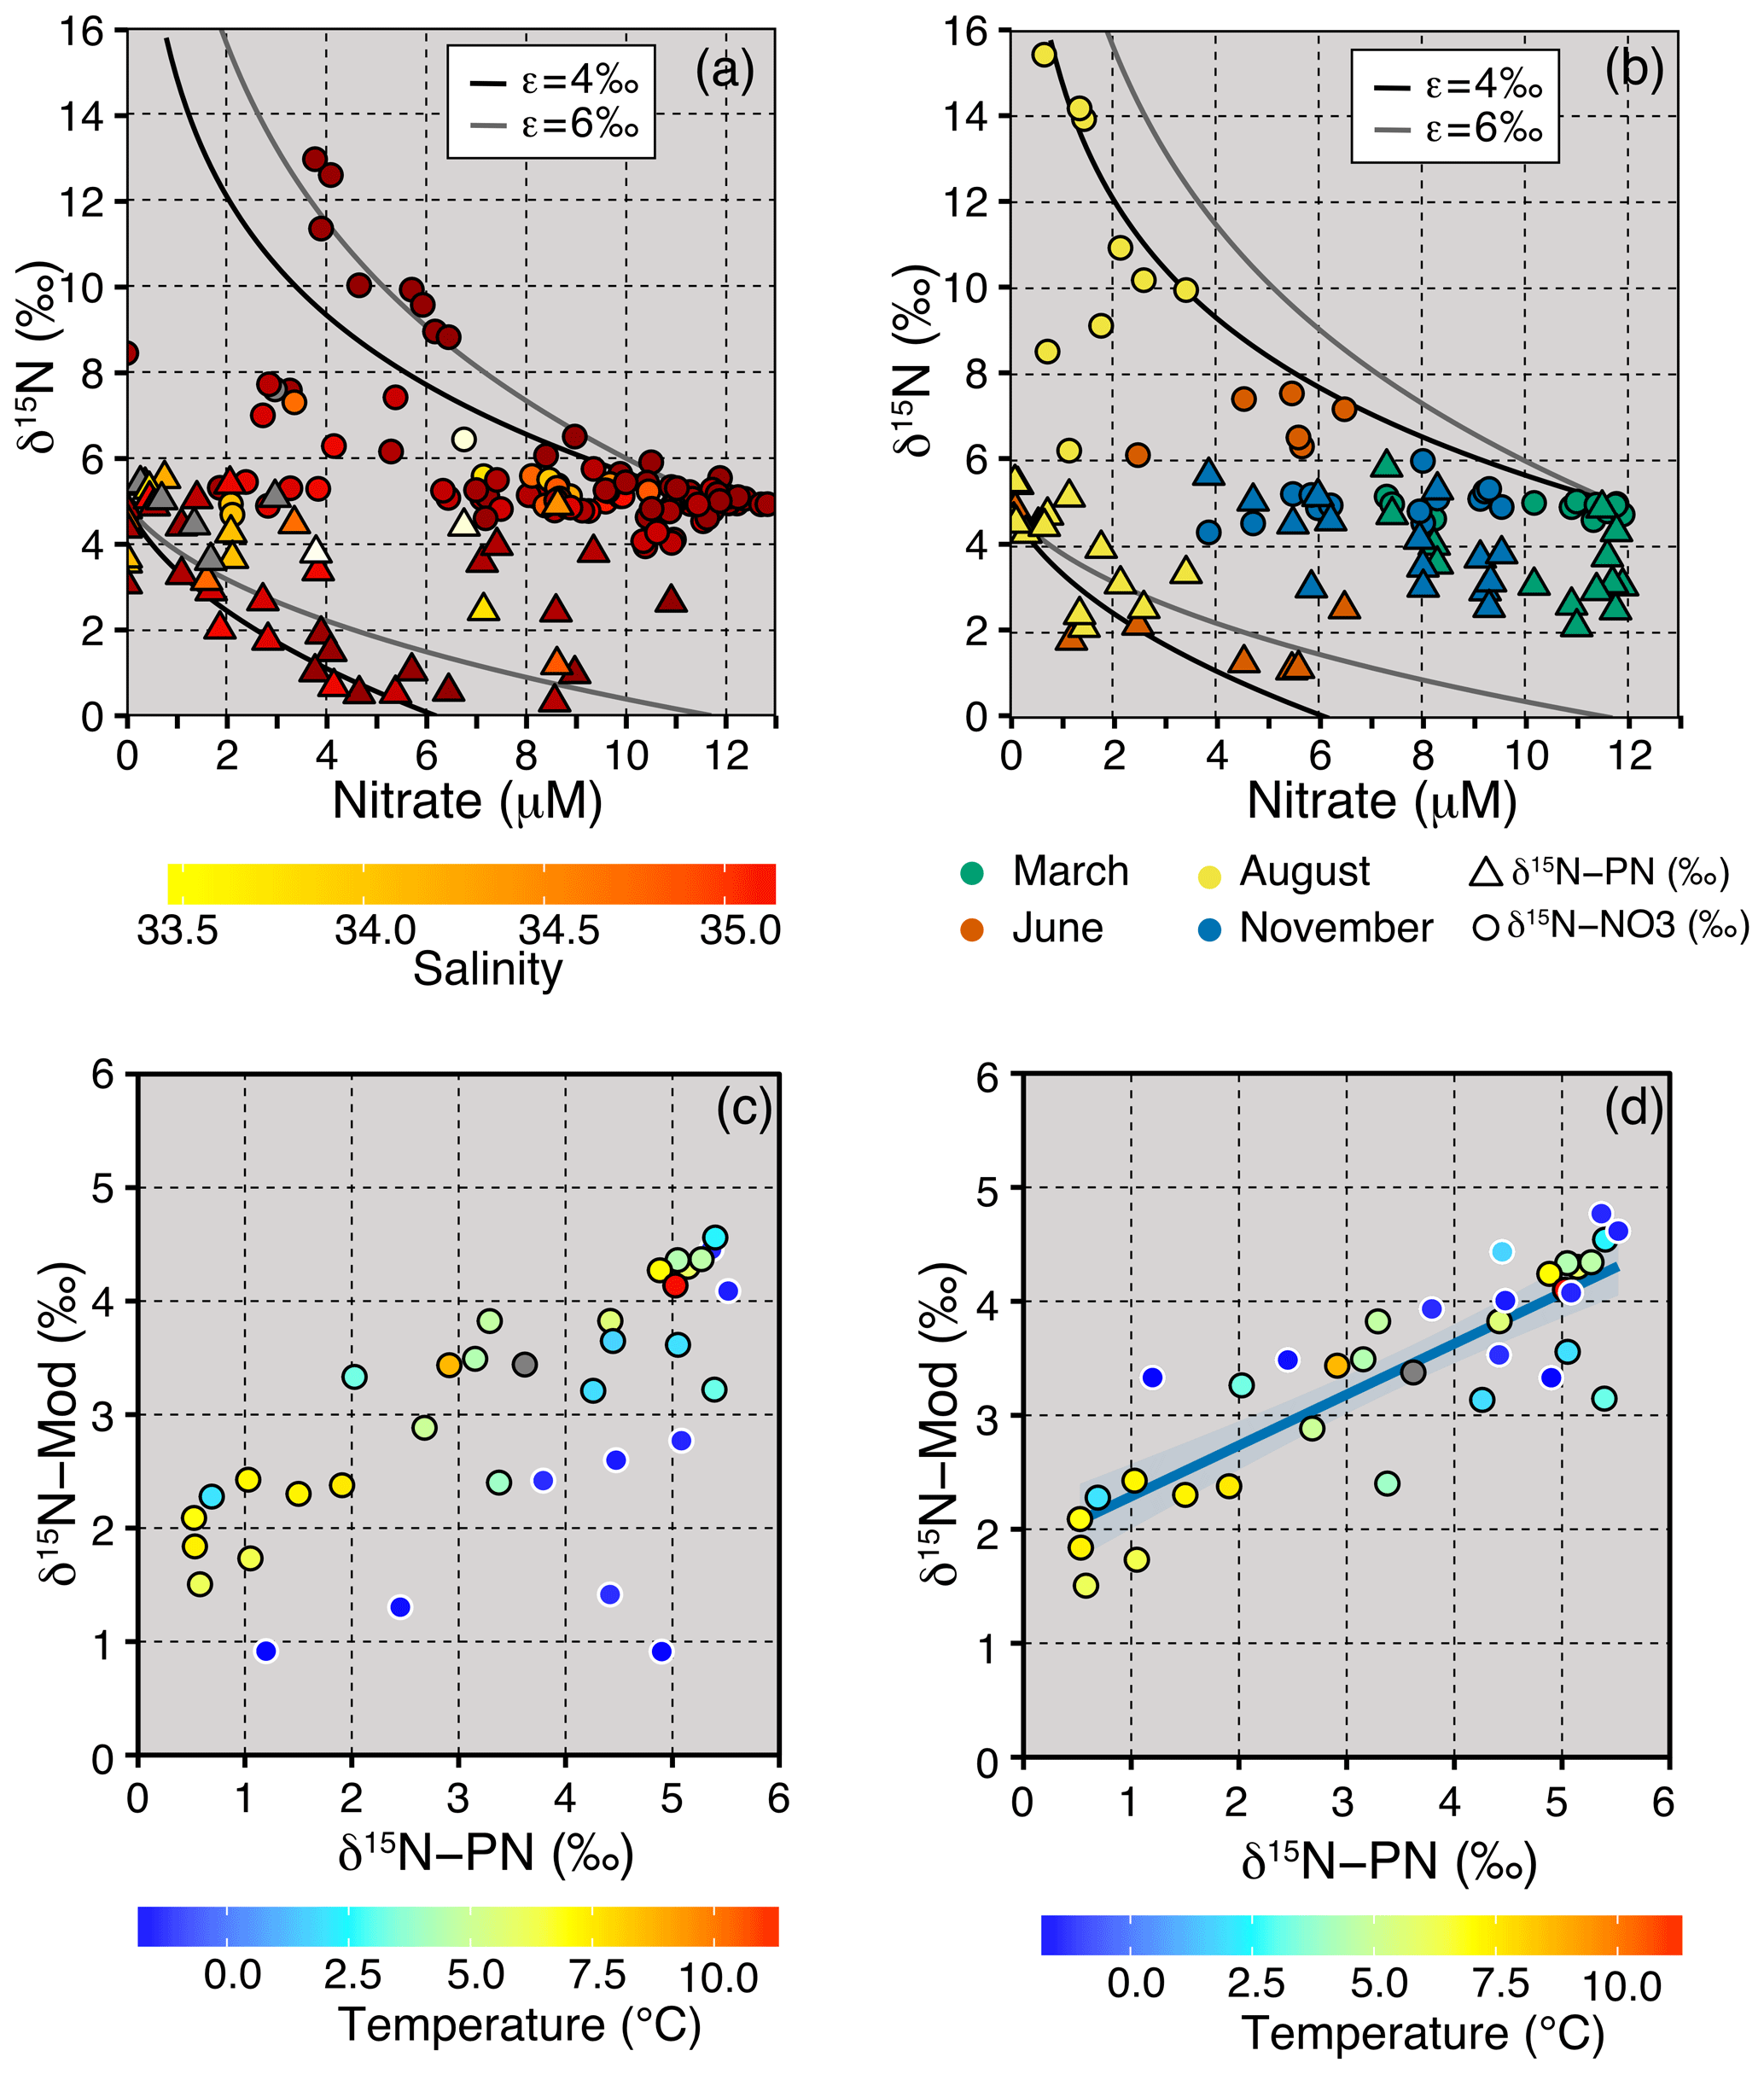
Figure 6(a) δ15N-NO3 (circles, upper 150 m) and δ15N-PN (triangles, upper 50 m) plotted against nitrate (JR16006), with the colour axis denoting changes in salinity. The lines show the fractionation models for a closed system at ε=4 and 6 ‰ with an initial nitrate concentration of 11.8 µM and δ15N-NO3 of 5.1 ‰. (b) Surface measurements of δ15N-NO3 (circles) and δ15N-PN (triangles) plotted against nitrate from the March, June, August and November Norbjørn transects, with the colour denoting the month of sampling. The lines show the fractionation models for a closed system at ε=4 ‰ and 6 ‰. (c) Regression between measured and predicted δ15N-PN in the upper 40 m (euphotic zone) using a 4.8 ‰ fractionation for all samples. (d) Regression between measured and predicted δ15N-PN in the upper 40 m (euphotic zone) using a 4.8 ‰ fractionation for AW and a 1.8 ‰ fractionation for ArW (r=0.86, df =33, p=0). ArW samples in (c) and (d) are outlined in white.
The integrity of the relationship between particulate and dissolved species following Rayleigh uptake systematics is dependent on the environment. The different timescales represented by the isotopic composition of dissolved and particulate species, relative degree of recycled production, and surface inputs from atmospheric deposition and N fixation are all potential factors that can decouple this relationship (Knapp et al., 2016; Fawcett et al., 2011, 2014). Our finding that the large variability in nitrate concentration in the euphotic zone (from < 0.5 to > 8 µM) is captured in the δ15N-PN suggests that during the sampling period, nitrate was likely to be the principle N source to phytoplankton and that the PN measured was largely of autotrophic origin.
These results support the finding that nitrate from the Atlantic is the primary source of nutrients to phytoplankton in surface waters and that the organic matter in the euphotic zone is principally autotrophic. When there is still nitrate readily available in surface waters, the phytoplankton preferentially take up 14N, and a lower δ15N is expressed in particulate N. As there is full utilization of nutrients over the growing season, we suggest that the integrated source of organic matter to the sediments and food web is ∼ 5 ‰ throughout the Barents Sea.
In order to investigate any seasonal changes in the organic matter source in surface waters, we consider the measurements of nitrate, PN and their isotopic ratios on the repeat transects across the BSO (Figs. 6b and 7). Nitrate concentrations were highest in March from replenishment over the winter months. Nitrite remained below 0.25 µM throughout all seasons. The nitrite concentrations were lowest in March, suggesting that the intermediate products, NH and NO had been nitrified to nitrate (Fig. 7). The highest nitrite concentrations were sampled in June and August during or following the spring bloom and remained high into November. Both δ15N-NO3 and δ18O-NO3 showed uptake-driven changes in the nutrients during June and August, whereby the low nitrate concentrations coincided with heavy isotope values from the preferential consumption of the lighter isotope (Figs. 5d, 7d, e).

Figure 7Seasonal variability in (a) nitrate (µM), (b) nitrite (µM), (c) PN (µg L−1), (d) δ15N-NO3 (‰), (e) δ18O-NO3 (‰) and (f) δ15N-PN (‰) in surface waters along the Norbjørn Ferrybox transect of the Barents Sea Opening. The transect was completed over 4 different months of 2018: March is orange, June is blue, August is green, and November is pink.
PN concentrations were low in winter and markedly increased in June and August (Fig. 7c). The δ15N-PN values from August, November and March were relatively constant at around 5 ‰. In June, δ15N-PN decreased as the lighter isotope is preferentially consumed by phytoplankton (Fig. 7f). The relatively constant value of 5 ‰ for the rest of the annual cycle reflected the AW source value of ∼ 5 ‰, suggesting that there is limited new production occurring over the winter months and that δ15N-PN represents the integrated product of nitrate uptake from the previous growing season.
4.3 Nitrogen cycling processes occurring in the Barents Sea
4.3.1 Nitrification
As inflowing AW cools and freshens across the Barents Sea, δ18O-NO3 decreases from its AW source value of 2.8±0.3 ‰ to 1.6±0.3 ‰ (Figs. 3b, 4f). This decline is consistent with N recycling and nitrification. A range in nitrified δ18O nitrate values of −1.5 ‰ to 1.3 ‰ have been reported from nitrifier co-cultures and field experiments (Buchwald et al., 2012). Previous field and modelling studies have used a nitrifying δ18O value of 1.1 ‰ plus δ18O (Granger et al., 2013; Sigman et al., 2009b). As nitrate is regenerated, newly nitrified nitrate tracks the δ18O of seawater, which, in the Barents Sea is ∼ 0.2 ‰ (Schlitzer et al., 2018); therefore, as the proportion of regenerated nitrate increases, δ18O will decrease towards ∼ 1.3 ‰.
The recycling of nitrate in situ is a common feature on Arctic shelves, as evidenced using nitrate isotopes on the West Siberian Shelf (Fripiat et al., 2018) and the Canadian Shelf (Granger et al., 2018). In these regions, δ18O-NO3 tracks δ18O-H2O showing the importance of N recycling in sustaining the N-limited primary production the following season. As we have characterized the Atlantic source δ18O-NO3, we can track the extent of nitrification across the Barents Sea to give an estimate of the proportion of regenerated nitrate on the Barents Sea shelf (Granger et al., 2013).
where δ18Omeas= measured δ18O-NO3, δ18OAW=2.8 ‰, δ18Oreg=1.3 ‰ and NO3 proportion of regenerated nitrate. In Fig. 3d, the proportion of nitrate regenerated follows the trend of δ18O-NO3. The proportion of nitrate regenerated remains relatively unmodified between the BSO and the Spitsbergen and Great banks sill (the approximate location of the polar front), north of which the proportion of regenerated nitrate increases from < 10 % in the south to > 80 % in ArW. The nutrient concentration of ArW is coupled with winter mixing and driven by atmospheric cooling and brine release during sea ice formation. The ArW experiences nutrient regeneration and nitrification over winter which works to decrease δ18O-NO3. As the shelf waters on the Barents Sea cool and freshen, the nitrate inventory is also replenished from the nitrification of ammonium which is supplied to the water column from sediments. The resupply and mixing of nutrients from the sediments is an important component in replenishing the N inventory. Alongside nitrification, Δ(15–18) increases from ∼ 2 ‰ to 3–4 ‰ from AW to ArW (Fig. 4f), Δ(15–18) captures variability between the two isotopes (δ15N-NO3 minus δ18O-NO3), and in this case, an increasing Δ(15–18) results from a lowering of δ18O-NO3 and no significant change in δ15N-NO3 (Table 1). These Δ(15–18) values are still significantly lower than values reported from the western Arctic Basin and Siberian Sea where higher δ15N-NO3 increases Δ(15–18) as a result of benthic denitrification (Fripiat et al., 2018; Granger et al., 2018).
Table 1Mean and standard deviation of nitrate concentration, N*, δ15N-NO3 and δ18O-NO3 for all samples from the base of the mixed layer, and 500 m is classified as being either Atlantic Water, Barents Sea Water or Arctic Water according to the temperature and salinity characteristics used by Oziel et al. (2016). To account for nitrate utilization, only samples for which nitrate was within 1 standard deviation of mean nitrate for a given water mass were used to estimate δ15N-NO3 and δ18O-NO3. For reference, the salinity thresholds are contoured on Figs. 2 and 3.

4.3.2 Nitrogen resupply from sediments
Organic matter produced in surface waters will ultimately be regenerated in the water column or sink to the seafloor. The release of NH from relatively shallow Arctic sediments has been noted in previous work in that the organic rich shelf sediments provide a source of NH to the water column (Brown et al., 2015). Studies from the Chukchi Sea suggest there are annually varying rates of nitrification with much higher rates in winter (Christman et al., 2011). This suggests that there is a build-up of NH in summer, and NH concentrations decrease in winter as nitrification rates exceed NH release. We found NH was enhanced over the Spitsbergen Bank and in the Hopen Trough with the highest concentrations close to the sediment rather than the euphotic zone, indicating that the sediments are releasing NH to the water column.
NH is generated in sediments by the ammonification of organic material and can be released by diffusive and non-diffusive fluxes (Granger et al., 2011). Previous studies have suggested that the NH produced during ammonification should be similar to the organic matter source but that there is a large isotopic effect (∼ 14 ‰) associated with the nitrification of NH to NO (Casciotti et al., 2003). In Sect. 4.2, we discuss the complete consumption of nitrate in the euphotic zone over a seasonal cycle. This finding suggests that over the course of the season, once all NH that has been released from the sediments and oxidized, δ15N-NO3 should reflect the N source (in this study: 5.1 ± 0.1 ‰). There were a few samples with low (< 4.8 ‰) δ15N-NO3 on the flanks of the Spitsbergen Bank, near the seabed at the head of Hopen Trench and over the SB-GB sill, which may be associated with partial N recycling processes and the retention of 15N in NH (Casciotti et al., 2003). However, nitrate δ15N below the nitric line was relatively homogenous across our sampled transect, reflecting the AW source value of 5.1 ± 0.1 ‰ (Table 1).
In the western Arctic, Bering Sea and East Siberian Sea, the release of NH from sediments leads to a decrease in δ18O-NO3 and an enrichment in δ15N-NO3 over the timescales of water mass transit (Fripiat et al., 2018; Granger et al., 2018). In these regions, remineralization is greater than nitrification; therefore, NH diffuses out of the sediments which are higher in 15N as low δ15N nitrified nitrate is lost to benthic denitrification in sediments (Granger et al., 2011). This process enriches NH in 15N, a signature which is subsequently imparted on the overlying water column when NH is released in other regions from the sediments and oxidized by nitrifiers (Brown et al., 2015). These trends are combined with concomitant decreases in N*, demonstrating the prevalence of benthic denitrification on Arctic shelves where δ15N increases from ∼6.5 ‰ at the Bering Strait (Brown et al., 2015; Lehmann et al., 2007) to 8 ‰ on the Canadian and Siberian shelves (Fripiat et al., 2018; Granger et al., 2018).
If coupled partial nitrification–denitrification was occurring in the Barents Sea sediments, there should be an observed increase in δ15N-NO3 with the decrease in δ18O-NO3 through NH release and nitrification. This is not evident in our dataset. (Table 1; Fig. 4). Instead, we found no clear increase in δ15N-NO3 or decrease in N* from the AW entering the shelf, to ArW and BSW further north and east (Table 1). This finding suggests that either the process of NH release from the sediments is insignificant to the water column nitrate inventory or that, in contrast to the Canadian and Siberian shelves, the layer of low oxygen (and thus denitrification) is separated from the layer of ammonification and NH release from sediments. The high NH, which exceeds 25 % of the dissolved inorganic N inventory at the base of some profiles, suggests that NH was accumulating in the water column at the time of our study.
In the Barents Sea, the shallow banks and slopes (e.g. Spitsbergen Bank) experience strong tidal and frontal currents which induce significant mixing (Sundfjord et al., 2007), and in shallower water, winter convection is able to overturn the whole water column, processes that are able to remobilize and increase the oxygenation of surficial sediments. In the shallow regions, we would therefore predict a deeper depth of denitrification within sediments and the faster release of NH to the water column largely by advective rather than diffusive fluxes.
The contrasting findings between this study in the Barents Sea and other Arctic shelves may result from a number of factors. The Pacific inflow supplies the much shallower Chukchi and Beaufort shelves (< 60 m) with higher concentrations of macronutrients (Granger et al., 2013). In contrast, the Atlantic inflow to the Barents Sea provides lower concentrations of macronutrients to a deeper shelf (> 100 m); therefore, the organic load to sediments and thus benthic denitrification is expected to be lower (Chang and Devol, 2009), implying that the nutrient inventory is proportional to production.
We show that nitrogen availability in the Barents Sea is supported through AW supply and the efficient replenishment of nutrients through seasonal cycling processes. By the end of the growing season, all nitrate is consumed in surface waters, and the δ15N of PN reflects the AW source. The N inventory is also dependent on the NH release from sediments and nitrification. In contrast to other Arctic shelf regions, we find no evidence for benthic denitrification interacting with the water column (and no loss of N relative to P). Our results indicate that although nutrients are regenerated in the western Barents Sea, δ15N-NO3 does not increase, suggesting that δ15N-NO3 supplied to Arctic Intermediate Water may be comparable to the AW source values. Our findings suggest δ15N-NO3 is unmodified in transit through the western Barents Sea. Additional samples collected in the eastern Barents Sea and at the primary export gateway (St. Anna Trough) are needed to confirm this.
Previous work has suggested that increasing NPP on Arctic shelves would increase organic matter supply to sediments and thus increase sedimentary denitrification rates (Arrigo and van Dijken, 2015). As N is the primary limiting nutrient to Arctic phytoplankton (Mills et al., 2018), this would have downstream consequences for NPP in the central Arctic Basin. Given the Barents Shelf is not currently a locale that hosts significant sedimentary denitrification and NPP here is limited by N, the future changes are likely to be different from those envisioned for other Arctic shelves. We suggest that N supply through the Barents Sea to the Arctic is likely to be determined by variability in AW inflow. Future changes in this inflow could impact the nutrient inventory transported through the Arctic Intermediate Water, impacting productivity in the central Arctic Basins where AWs are transported.
Nutrient (https://doi.org/10/d8rg, Brand et al., 2020), nitrate isotope (https://doi.org/10/fg27, Tuerena and Ganeshram, 2020) and particulate nitrogen isotope data (https://doi.org/10/fkg8, Norman et al., 2020) are publicly available from the British Oceanographic Database website.
RET wrote the paper with significant input from JH, CM and RSG. RET, JH, RSG and CM designed the study. RET measured nitrate isotopes. LN measured particulate nitrogen and particulate nitrogen δ15N. All authors, including CDLV and RJ, helped with fieldwork implementation and contributed to the final version of the paper.
The authors declare that they have no conflict of interest.
We thank Celeste Kellock for her assistance with sample collection on cruise JR16006. We also thank Patrick Rafter and an anonymous reviewer for their valuable input which has greatly improved the paper.
This work resulted from the ARISE project (NE/P006000/1 awarded to Joanne Hopkins, NE/P006310/1 awarded to Raja S. Ganeshram and NE/P006035/1 awarded to Claire Mahaffey), part of the Changing Arctic Ocean programme, jointly funded by the UKRI Natural Environment Research Council (NERC) and the German Federal Ministry of Education and Research (BMBF).
This paper was edited by Markus Kienast and reviewed by Patrick Rafter and one anonymous referee.
Altabet, M. A. and Francois, R.: Sedimentary nitrogen isotopic ratio as a recorder for surface ocean nitrate utilization, Global Biogeochem. Cy., 8, 103–116, https://doi.org/10.1029/93gb03396, 1994.
Altieri, K. E., Fawcett, S. E., Peters, A. J., Sigman, D. M., and Hastings, M. G.: Marine biogenic source of atmospheric organic nitrogen in the subtropical North Atlantic, P. Natl. Acad. Sci. USA, 113, 925–930, https://doi.org/10.1073/pnas.1516847113, 2016.
Arrigo, K. R. and van Dijken, G. L.: Continued increases in Arctic Ocean primary production, Prog. Oceanogr., 136, 60–70, https://doi.org/10.1016/j.pocean.2015.05.002, 2015.
Arthun, M., Ingvaldsen, R. B., Smedsrud, L. H., and Schrum, C.: Dense water formation and circulation in the Barents Sea, Deep-Sea Res. Pt. I, 58, 801–817, https://doi.org/10.1016/j.dsr.2011.06.001, 2011.
Arthun, M., Eldevik, T., Smedsrud, L. H., Skagseth, O., and Ingvaldsen, R. B.: Quantifying the Influence of Atlantic Heat on Barents Sea Ice Variability and Retreat, J. Climate, 25, 4736–4743, https://doi.org/10.1175/jcli-d-11-00466.1, 2012.
Barton, B. I., Lenn, Y. D., and Lique, C.: Observed Atlantification of the Barents Sea Causes the Polar Front to Limit the Expansion of Winter Sea Ice, J. Phys. Oceanogr., 48, 1849–1866, https://doi.org/10.1175/jpo-d-18-0003.1, 2018.
Brand, T., Norman, L., Henley, S. F., Mahaffey, C., and Tuerena, R.: Dissolved nutrient samples collected in the Barents Sea as part of the Changing Arctic Ocean programme for the Arctic PRIZE and ARISE projects during cruise JR16006, British Oceanographic Data Centre, National Oceanography Centre, NERC, UK, https://doi.org/10.5285/aed2abbb-9814-4a1be053-6c86abc04d55, 2020.
Brown, Z. W., Casciotti, K. L., Pickart, R. S., Swift, J. H., and Arrigo, K. R.: Aspects of the marine nitrogen cycle of the Chukchi Sea shelf and Canada Basin, Deep-Sea Res. Pt. II, 118, 73–87, https://doi.org/10.1016/j.dsr2.2015.02.009, 2015.
Buchwald, C., Santoro, A. E., McIlvin, M. R., and Casciotti, K. L.: Oxygen isotopic composition of nitrate and nitrite produced by nitrifying cocultures and natural marine assemblages, Limnol. Oceanogr., 57, 1361–1375, https://doi.org/10.4319/lo.2012.57.5.1361, 2012.
Casciotti, K. L., Sigman, D. M., Hastings, M. G., Bohlke, J. K., and Hilkert, A.: Measurement of the oxygen isotopic composition of nitrate in seawater and freshwater using the denitrifier method, Anal. Chem., 74, 4905–4912, https://doi.org/10.1021/ac020113w, 2002.
Casciotti, K. L., Sigman, D. M., and Ward, B. B.: Linking diversity and stable isotope fractionation in ammonia-oxidizing bacteria, Geomicrobiol. J., 20, 335–353, https://doi.org/10.1080/01490450303895, 2003.
Chang, B. X. and Devol, A. H.: Seasonal and spatial patterns of sedimentary denitrification rates in the Chukchi sea, Deep-Sea Res. Pt. II, 56, 1339–1350, https://doi.org/10.1016/j.dsr2.2008.10.024, 2009.
Christman, G. D., Cottrell, M. T., Popp, B. N., Gier, E., and Kirchman, D. L.: Abundance, Diversity, and Activity of Ammonia-Oxidizing Prokaryotes in the Coastal Arctic Ocean in Summer and Winter, Appl. Environ. Microbiol., 77, 2026–2034, https://doi.org/10.1128/aem.01907-10, 2011.
Codispoti, L. A., Kelly, V., Thessen, A., Matrai, P., Suttles, S., Hill, V., Steele, M., and Light, B.: Synthesis of primary production in the Arctic Ocean: III. Nitrate and phosphate based estimates of net community production, Prog. Oceanogr., 110, 126–150, https://doi.org/10.1016/j.pocean.2012.11.006, 2013.
Coupel, P., Ruiz-Pino, D., Sicre, M. A., Chen, J. F., Lee, S. H., Schiffrine, N., Li, H. L., and Gascard, J. C.: The impact of freshening on phytoplankton production in the Pacific Arctic Ocean, Prog. Oceanogr., 131, 113–125, https://doi.org/10.1016/j.pocean.2014.12.003, 2015.
Dalpadado, P., Arrigo, K. R., Hjollo, S. S., Rey, F., Ingvaldsen, R. B., Sperfeld, E., van Dijken, G. L., Stige, L. C., Olsen, A., and Ottersen, G.: Productivity in the Barents Sea – Response to Recent Climate Variability, Plos One, 9, e95273, https://doi.org/10.1371/journal.pone.0095273, 2014.
de la Vega, C., Mahaffey, C., Tuerena, R. E., Yurkowski, D. J., Ferguson, S. H., Stenson, G. B., Nordoy, E. S., Haug, T., Biuw, M., Smout, S., Hopkins, J. Tagliabue, A., and Jeffreys, R. M.: Arctic seals as tracers of environmental and ecological change, Limnol. Oceanogr. Lett., https://doi.org/10.1002/lol2.10176, online first, 2020.
DiFiore, P. J., Sigman, D. M., Trull, T. W., Lourey, M. J., Karsh, K., Cane, G., and Ho, R.: Nitrogen isotope constraints on subantarctic biogeochemistry, J. Geophys. Res.-Oceans, 111, C08016, https://doi.org/10.1029/2005jc003216, 2006.
DiFiore, P. J., Sigman, D. M., and Dunbar, R. B.: Upper ocean nitrogen fluxes in the Polar Antarctic Zone: Constraints from the nitrogen and oxygen isotopes of nitrate, Geochem. Geophys. Geosy., 10, Q11016, https://doi.org/10.1029/2009gc002468, 2009.
DiFiore, P. J., Sigman, D. M., Karsh, K. L., Trull, T. W., Dunbar, R. B., and Robinson, R. S.: Poleward decrease in the isotope effect of nitrate assimilation across the Southern Ocean, Geophys. Res. Lett., 37, L17601, https://doi.org/10.1029/2010gl044090, 2010.
Dumont, E., Brand, T., and Hopkins, J.: CTD data from NERC Changing Arctic Ocean Cruise JR16006 on the RRS James Clark Ross, June–August 2017, British Oceanographic Data Centre, National Oceanography Centre, NERC, UK, https://doi.org/10/c7f6, 2019.
Ellingsen, I., Slagstad, D., and Sundfjord, A.: Modification of water masses in the Barents Sea and its coupling to ice dynamics: a model study, Ocean Dyn., 59, 1095–1108, https://doi.org/10.1007/s10236-009-0230-5, 2009.
Fawcett, S. E., Lomas, M., Casey, J. R., Ward, B. B., and Sigman, D. M.: Assimilation of upwelled nitrate by small eukaryotes in the Sargasso Sea, Nat. Geosci., 4, 717–722, https://doi.org/10.1038/ngeo1265, 2011.
Fawcett, S. E., Lomas, M. W., Ward, B. B., and Sigman, D. M.: The counterintuitive effect of summer-to-fall mixed layer deepening on eukaryotic new production in the Sargasso Sea, Global Biogeochem. Cy., 28, 86–102, https://doi.org/10.1002/2013gb004579, 2014.
Friedland, K. D. and Todd, C. D.: Changes in Northwest Atlantic Arctic and Subarctic conditions and the growth response of Atlantic salmon, Polar Biol., 35, 593–609, https://doi.org/10.1007/s00300-011-1105-z, 2012.
Fripiat, F., Declercq, M., Sapart, C. J., Anderson, L. G., Bruechert, V., Deman, F., Fonseca-Batista, D., Humborg, C., Roukaerts, A., Semiletov, I. P., and Dehairs, F.: Influence of the bordering shelves on nutrient distribution in the Arctic halocline inferred from water column nitrate isotopes, Limnol. Oceanogr., 63, 2154–2170, https://doi.org/10.1002/lno.10930, 2018.
Granger, J. and Sigman, D. M.: Removal of nitrite with sulfamic acid for nitrate N and O isotope analysis with the denitrifier method, Rapid Commun. Mass Spectr., 23, 3753–3762, https://doi.org/10.1002/rcm.4307, 2009.
Granger, J., Sigman, D. M., Needoba, J. A., and Harrison, P. J.: Coupled nitrogen and oxygen isotope fractionation of nitrate during assimilation by cultures of marine phytoplankton, Limnol. Oceanogr., 49, 1763–1773, 2004.
Granger, J., Prokopenko, M. G., Sigman, D. M., Mordy, C. W., Morse, Z. M., Morales, L. V., Sambrotto, R. N., and Plessen, B.: Coupled nitrification-denitrification in sediment of the eastern Bering Sea shelf leads to N-15 enrichment of fixed N in shelf waters, J. Geophys. Res.-Oceans, 116, C11006, https://doi.org/10.1029/2010jc006751, 2011.
Granger, J., Prokopenko, M. G., Mordy, C. W., and Sigman, D. M.: The proportion of remineralized nitrate on the ice-covered eastern Bering Sea shelf evidenced from the oxygen isotope ratio of nitrate, Global Biogeochem. Cy., 27, 962–971, https://doi.org/10.1002/gbc.20075, 2013.
Granger, J., Sigman, D. M., Gagnon, J., Tremblay, J. E., and Mucci, A.: On the Properties of the Arctic Halocline and Deep Water Masses of the Canada Basin from Nitrate Isotope Ratios, J. Geophys. Res.-Oceans, 123, 5443–5458, https://doi.org/10.1029/2018jc014110, 2018.
Hatun, H., Azetsu-Scott, K., Somavilla, R., Rey, F., Johnson, C., Mathis, M., Mikolajewicz, U., CoupeI, P., Tremblay, J. E., Hartman, S., Pacariz, S. V., Salter, I., and Olafsson, J.: The subpolar gyre regulates silicate concentrations in the North Atlantic, Sci. Rep., 7, 14576, https://doi.org/10.1038/s41598-017-14837-4, 2017.
Henley, S. F., Porter, M., Hobbs, L., Braun, J., Guillaume-Castel, R., Venables, E. J., Dumont, E., and Cottier, F.: Nitrate supply and uptake in the Atlantic Arctic sea ice zone: seasonal cycle, mechanisms and drivers, Philos. T. Roy. Soc. A., 378, 2181, https://doi.org/10.1098/rsta.2019.0361, 2020.
Henley, S. F., Tuerena, R. E., Annett, A. L., Fallick, A. E., Meredith, M. P., Venables, H. J., Clarke, A., and Ganeshram, R. S.: Macronutrient supply, uptake and recycling in the coastal ocean of the west Antarctic Peninsula, Deep-Sea Res. Pt. II, 139, 58–76, https://doi.org/10.1016/j.dsr2.2016.10.003, 2017.
Huang, J. B., Zhang, X. D., Zhang, Q. Y., Lin, Y. L., Hao, M. J., Luo, Y., Zhao, Z. C., Yao, Y., Chen, X., Wang, L., Nie, S. P., Yin, Y. Z., Xu, Y., and Zhang, J. S.: Recently amplified arctic warming has contributed to a continual global warming trend, Nat. Clim. Change, 7, 875–879, https://doi.org/10.1038/s41558-017-0009-5, 2017.
Johnson, C., Inall, M., and Hakkinen, S.: Declining nutrient concentrations in the northeast Atlantic as a result of a weakening Subpolar Gyre, Deep-Sea Res. Pt. I, 82, 95–107, https://doi.org/10.1016/j.dsr.2013.08.007, 2013.
Kemeny, P. C., Weigand, M. A., Zhang, R., Carter, B. R., Karsh, K. L., Fawcett, S. E., and Sigman, D. M.: Enzyme-level interconversion of nitrate and nitrite in the fall mixed layer of the Antarctic Ocean, Global Biogeochem. Cy., 30, 1069–1085, https://doi.org/10.1002/2015gb005350, 2016.
Knapp, A. N., DiFiore, P. J., Deutsch, C., Sigman, D. M., and Lipschultz, F.: Nitrate isotopic composition between Bermuda and Puerto Rico: Implications for N(2) fixation in the Atlantic Ocean, Global Biogeochem. Cy., 22, Gb3014, https://doi.org/10.1029/2007gb003107, 2008.
Knapp, A. N., Fawcett, S. E., Martínez-Garcia, A., Leblond, N., Moutin, T., and Bonnet, S.: Nitrogen isotopic evidence for a shift from nitrate- to diazotroph-fueled export production in the VAHINE mesocosm experiments, Biogeosciences, 13, 4645–4657, https://doi.org/10.5194/bg-13-4645-2016, 2016.
Lehmann, M. F., Sigman, D. M., McCorkle, D. C., Granger, J., Hoffmann, S., Cane, G., and Brunelle, B. G.: The distribution of nitrate N-15/N-14 in marine sediments and the impact of benthic nitrogen loss on the isotopic composition of oceanic nitrate, Geochim. Cosmochim. Ac., 71, 5384–5404, https://doi.org/10.1016/j.gca.2007.07.025, 2007.
Lewis, K. M., Van Dijken, G. L., and Arrigo, K. R.: Changes in phytoplankton concentration now drive increased Arctic Ocean primary production, Science, 369, 198–202, https://doi.org/10.1126/science.aay8380, 2020.
Lind, S., Ingvaldsen, R. B., and Furevik, T.: Arctic layer salinity controls heat loss from deep Atlantic layer in seasonally ice-covered areas of the Barents Sea, Geophys. Res. Lett., 43, 5233–5242, https://doi.org/10.1002/2016gl068421, 2016.
Lind, S., Ingvaldsen, R. B., and Furevik, T.: Arctic warming hotspot in the northern Barents Sea linked to declining sea-ice import, Nat. Clim. Change, 8, 634–639, https://doi.org/10.1038/s41558-018-0205-y, 2018.
Marconi, D., Weigand, M. A., Rafter, P. A., McIlvin, M. R., Forbes, M., Casciotti, K. L., and Sigman, D. M.: Nitrate isotope distributions on the US GEOTRACES North Atlantic cross-basin section: Signals of polar nitrate sources and low latitude nitrogen cycling, Mar. Chem., 177, 143–156, https://doi.org/10.1016/j.marchem.2015.06.007, 2015.
Marconi, D., Sigman, D. M., Casciotti, K. L., Campbell, E. C., Weigand, M. A., Fawcett, S. E., Knapp, A. N., Rafter, P. A., Ward, B. B., and Haug, G. H.: Tropical Dominance of N-2 Fixation in the North Atlantic Ocean, Global Biogeochem. Cy., 31, 1608–1623, https://doi.org/10.1002/2016gb005613, 2017.
Mariotti, A., Germon, J. C., Hubert, P., Kaiser, P., Letolle, R., Tardieux, A., and Tardieux, P.: Experimental – determination of nitrogen kinetic isotope fractionation – some principles – Illustration for the denitrification and nitrification processes, Plant Soil, 62, 413–430, https://doi.org/10.1007/bf02374138, 1981.
Mills, M. M., Brown, Z. W., Laney, S. R., Ortega-Retuerta, E., Lowry, K. E., van Dijken, G. L., and Arrigo, K. R.: Nitrogen Limitation of the Summer Phytoplankton and Heterotrophic Prokaryote Communities in the Chukchi Sea, Front. Marine Sci., 5, 362, https://doi.org/10.3389/fmars.2018.00362, 2018.
Norman, L., de la Vega, C., Ball, J., and Mahaffey, C.: δ15N-PN, δ13C-PC, particulate organic nitrogen and particulate organic carbon measurements from CTD niskin-collected water column profiles obtained in the Barents Sea during NERC CAO cruise JR16006, July–August 2017, British Oceanographic Data Centre, National Oceanography Centre, NERC, UK, https://doi.org/10/fkg8, 2020.
Notz, D. and Stroeve, J.: Observed Arctic sea-ice loss directly follows anthropogenic CO2 emission, Science, 354, 747–750, https://doi.org/10.1126/science.aag2345, 2016.
Onarheim, I. H. and Arthun, M.: Toward an ice-free Barents Sea, Geophys. Res. Lett., 44, 8387–8395, https://doi.org/10.1002/2017gl074304, 2017.
Onarheim, I. H., Eldevik, T., Arthun, M., Ingvaldsen, R. B., and Smedsrud, L. H.: Skillful prediction of Barents Sea ice cover, Geophys. Res. Lett., 42, 5364–5371, https://doi.org/10.1002/2015gl064359, 2015.
Oziel, L., Sirven, J., and Gascard, J.-C.: The Barents Sea frontal zones and water masses variability (1980–2011), Ocean Sci., 12, 169–184, https://doi.org/10.5194/os-12-169-2016, 2016.
Oziel, L., Baudena, A., Ardyna, M., Massicotte, P., Randelhoff, A., Sallée, J. B., Ingvaldsen, R. B., Devred, E., and Babin, M.: Faster Atlantic currents drive poleward expansion of temperate phytoplankton in the Arctic Ocean, Nat. Commun., 11, 1705, https://doi.org/10.1038/s41467-020-15485-5, 2020.
Peng, X. F., Fawcett, S. E., van Oostende, N., Wolf, M. J., Marconi, D., Sigman, D. M., and Ward, B. B.: Nitrogen uptake and nitrification in the subarctic North Atlantic Ocean, Limnol. Oceanogr., 63, 1462–1487, https://doi.org/10.1002/lno.10784, 2018.
Porter, M., Henley, S. F., Orkney, A., Bouman, H. A., Hwang, B., Dumont, E., Venables, E. J., and Cottier, F.: A Polar Surface Eddy Obscured by Thermal Stratification, Geophys. Res. Lett., 47, e2019GL086281, https://doi.org/10.1029/2019gl086281, 2020.
Rafter, P. A., Sigman, D. M., Charles, C. D., Kaiser, J., and Haug, G. H.: Subsurface tropical Pacific nitrogen isotopic composition of nitrate: Biogeochemical signals and their transport, Global Biogeochem. Cy., 26, GB1003, https://doi.org/10.1029/2010gb003979, 2012.
Rafter, P. A., DiFiore, P. J., and Sigman, D. M.: Coupled nitrate nitrogen and oxygen isotopes and organic matter remineralization in the Southern and Pacific Oceans, J. Geophys. Res.-Oceans, 118, 4781–4794, https://doi.org/10.1002/jgrc.20316, 2013.
Randelhoff, A., Reigstad, M., Chierici, M., Sundfjord, A., Ivanov, V., Cape, M., Vernet, M., Tremblay, J. E., Bratbak, G., and Kristiansen, S. Seasonality of the Physical and Biogeochemical Hydrography in the Inflow to the Arctic Ocean Through Fram Strait, Front. Mar. Sci. 5, 224, https://doi.org/10.3389/fmars.2018.00224, 2018.
Rey, F.: Declining silicate concentrations in the Norwegian and Barents Seas, Ices Journal of Marine Science, 69, 208–212, https://doi.org/10.1093/icesjms/fss007, 2012.
Rudels, B., Anderson, L. G., and Jones, E. P.: Formation and evolution of the surface mixed layer and halocline of the Arctic Ocean, J. Geophys. Res.-Oceans, 101, 8807–8821, https://doi.org/10.1029/96jc00143, 1996.
Schauer, U., Muench, R. D., Rudels, B., and Timokhov, L.: Impact of eastern Arctic shelf waters on the Nansen Basin intermediate layers, J. Geophys. Res., 102, 3371–3382, https://doi.org/10.1029/96JC03366, 1997.
Schlitzer, R., Anderson, R. F., Dodas, E. M., Lohan, M., Geibere, W., Tagliabue, A., Bowie, A., Jeandel, C., Maldonado, M. T., Landing, W. M., Cockwell, D., Abadie, C., Abouchami, W., Achterberg, E. P., Agather, A., Aguliar-Islas, A., van Aken, H. M., Andersen, M., Archer, C., Auro, M., de Baar, H. J., Baars, O., Baker, A. R., Bakker, K., Basak, C., Baskaran, M., Bates, N. R., Bauch, D., van Beek, P., Behrens, M. K., Black, E., Bluhm, K., Bopp, L., Bouman, H., Bowman, K., Bown, J., Boyd, P., Boye, M., Boyle, E. A., Branellec, P., Bridgestock, L., Brissebrat, G., Browning, T., Bruland, K. W., Brumsack, H. J., Brzezinski, M., Buck, C. S., Buck, K. N., Buesseler, K., Bull, A., Butler, E., Cai, P., Mor, P. C., Cardinal, D., Carlson, C., Carrasco, G., Casacuberta, N., Casciotti, K. L., Castrillejo, M., Chamizo, E., Chance, R., Charette, M. A., Chaves, J. E., Cheng, H., Chever, F., Christl, M., Church, T. M., Closset, I., Colman, A., Conway, T. M., Cossa, D., Croot, P., Cullen, J. T., Cutter, G. A., Daniels, C., Dehairs, F., Deng, F. F., Dieu, H. T., Duggan, B., Dulaquais, G., Dumousseaud, C., Echegoyen-Sanz, Y., Edwards, R. L., Ellwood, M., Fahrbach, E., Fitzsimmons, J. N., Flegal, A. R., Fleisher, M. Q., van de Flierdt, T., Frank, M., Friedrich, J., Fripiat, F., Frollje, H., Galer, S. J. G., Gamo, T., Ganeshram, R. S., Garcia-Orellana, J., Garcia-Solsona, E., Gault-Ringold, M., George, E., Gerringa, L. J. A., Gilbert, M., Godoy, J. M., Goldstein, S. L., Gonzalez, S. R., Grissom, K., Hammerschmidt, C., Hartman, A., Hassler, C. S., Hathorne, E. C., Hatta, M., Hawco, N., Hayes, C. T., Heimburger, L. E., Helgoe, J., Heller, M., Henderson, G. M., Henderson, P. B., van Heuven, S., Ho, P., Horner, T. J., Hsieh, Y. T., Huang, K. F., Humphreys, M. P., Isshiki, K., Jacquot, J. E., Janssen, D. J., Jenkins, W. J., John, S., Jones, E. M., Jones, J. L., Kadko, D. C., Kayser, R., Kenna, T. C., Khondoker, R., Kim, T., Kipp, L., Klar, J. K., Klunder, M., Kretschmer, S., Kumamoto, Y., Laan, P., Labatut, M., Lacan, F., Lam, P. J., Lambelet, M., Lamborg, C. H., Le Moigne, F. A. C., Le Roy, E., Lechtenfeld, O. J., Lee, J. M., Lherminier, P., Little, S., Lopez-Lora, M., Lu, Y. B., Masque, P., Mawji, E., McClain, C. R., Measures, C., Mehic, S., Menzel Barraqueta, J. L., van der Merwe, P., Middag, R., Mieruch, S., Milne, A., Minami, T., Moffett, J. W., Moncoiffe, G., Moore, W. S., Morris, P. J., Morton, P. L., Nakaguchi, Y., Nakayama, N., Niedermiller, J., Nishioka, J., Nishiuchi, A., Noble, A., Obata, H., Ober, S., Ohnemus, D. C., van Ooijen, J., O'Sullivan, J., Owens, S., Pahnke, K., Paul, M., Pavia, F., Pena, L. D., Petersh, B., Planchon, F., Planquette, H., Pradoux, C., Puigcorbe, V., Quay, P., Queroue, F., Radic, A., Rauschenberg, S., Rehkamper, M., Rember, R., Remenyi, T., Resing, J. A., Rickli, J., Rigaud, S., Rijkenberg, M. J. A., Rintoul, S., Robinson, L. F., Roca-Marti, M., Rodellas, V., Roeske, T., Rolison, J. M., Rosenberg, M., Roshan, S., van der Loaff, M. M. R., Ryabenko, E., Saito, M. A., Salt, L. A., Sanial, V., Sarthou, G., Schallenberg, C., Schauer, U., Scher, H., Schlosser, C., Schnetger, B., Scott, P., Sedwick, P. N., Semiletov, I., Shelley, R., Sherrell, R. M., Shiller, A. M., Sigman, D. M., Singh, S. K., Slagter, H. A., Slater, E., Smethie, W. M., Snaith, H., Sohrin, Y., Sohst, B., Sonke, J. E., Speich, S., Steinfeldt, R., Stewart, G., Stichel, T., Stirling, C. H., Stutsman, J., Swarr, G. J., Swift, J. H., Thomas, A., Thorne, K., Till, C. P., Till, R., Townsend, A. T., Townsend, E., Tuerena, R., Twining, B. S., Vance, D., Velazquez, S., Venchiarutti, C., Villa-Alfageme, M., Vivancos, S. M., Voelker, A. H. L., Wake, B., Warner, M. J., Watson, R., van Weerlee, E., Weigand, M. A., Weinstein, Y., Weiss, D., Wisotzki, A., Woodward, E. M. S., Wu, J. F., Wu, Y. Z., Wuttig, K., Wyatt, N., Xiang, Y., Xie, R. F. C., Xue, Z. C., Yoshikawa, H., Zhang, J., Zhang, P., Zhao, Y., Zheng, L. J., Zheng, X. Y., Zieringer, M., Zimmer, L. A., Ziveri, P., Zunino, P., and Zurbrick, C.: The GEOTRACES Intermediate Data Product 2017, Chem. Geol., 493, 210–223, https://doi.org/10.1016/j.chemgeo.2018.05.040, 2018.
Serreze, M. C., Barrett, A. P., Stroeve, J. C., Kindig, D. N., and Holland, M. M.: The emergence of surface-based Arctic amplification, The Cryosphere, 3, 11–19, https://doi.org/10.5194/tc-3-11-2009, 2009.
Sigman, D. M., Altabet, M. A., McCorkle, D. C., Francois, R., and Fischer, G.: The delta N-15 of nitrate in the Southern Ocean: Consumption of nitrate in surface waters, Global Biogeochem. Cy., 13, 1149–1166, https://doi.org/10.1029/1999gb900038, 1999.
Sigman, D. M., Altabet, M. A., McCorkle, D. C., Francois, R., and Fischer, G.: The delta N-15 of nitrate in the Southern Ocean: Nitrogen cycling and circulation in the ocean interior, J. Geophys. Res.-Oceans, 105, 19599–19614, https://doi.org/10.1029/2000jc000265, 2000.
Sigman, D. M., Casciotti, K. L., Andreani, M., Barford, C., Galanter, M., and Bohlke, J. K.: A bacterial method for the nitrogen isotopic analysis of nitrate in seawater and freshwater, Anal. Chem., 73, 4145–4153, https://doi.org/10.1021/ac010088e, 2001.
Sigman, D. M., Robinson, R., Knapp, A. N., van Geen, A., McCorkle, D. C., Brandes, J. A., and Thunell, R. C.: Distinguishing between water column and sedimentary denitrification in the Santa Barbara Basin using the stable isotopes of nitrate, Geochem. Geophy. Geosy., 4, 1040, https://doi.org/10.1029/2002gc000384, 2003.
Sigman, D. M., DiFiore, P. J., Hain, M. P., Deutsch, C., and Karl, D. M.: Sinking organic matter spreads the nitrogen isotope signal of pelagic denitrification in the North Pacific, Geophys. Res. Lett., 36, L08605, https://doi.org/10.1029/2008gl035784, 2009a.
Sigman, D. M., DiFiore, P. J., Hain, M. P., Deutsch, C., Wang, Y., Karl, D. M., Knapp, A. N., Lehmann, M. F., and Pantoja, S.: The dual isotopes of deep nitrate as a constraint on the cycle and budget of oceanic fixed nitrogen, Deep-Sea Res. Pt. I, 56, 1419–1439, https://doi.org/10.1016/j.dsr.2009.04.007, 2009b.
Smedsrud, L. H., Esau, I., Ingvaldsen, R. B., Eldevik, T., Haugan, P. M., Li, C., Lien, V. S., Olsen, A., Omar, A. M., Ottera, O. H., Risebrobakken, B., Sando, A. B., Semenov, V. A., and Sorokina, S. A.: The role of the Barents Sea in the Arctic climate system, Rev. Geophys., 51, 415–449, https://doi.org/10.1002/rog.20017, 2013.
Sundfjord, A., Fer, I., Kasajima, Y., and Svendsen, H.: Observations of turbulent mixing and hydrography in the marginal ice zone of the Barents Sea, J. Geophys. Res.-Oceans, 112, C05008, https://doi.org/10.1029/2006jc003524, 2007.
Thibodeau, B., Bauch, D., and Voss, M.: Nitrogen dynamic in Eurasian coastal Arctic ecosystem: Insight from nitrogen isotope, Global Biogeochem. Cy., 31, 836–849, https://doi.org/10.1002/2016gb005593, 2017.
Torres-Valdes, S., Tsubouchi, T., Bacon, S., Naveira-Garabato, A. C., Sanders, R., McLaughlin, F. A., Petrie, B., Kattner, G., Azetsu-Scott, K., and Whitledge, T. E.: Export of nutrients from the Arctic Ocean, J. Geophys. Res.-Oceans, 118, 1625–1644, https://doi.org/10.1002/jgrc.20063, 2013.
Tuerena R. and Ganeshram R.: Nitrate isotope measurements from CTD niskin depth profiles from Changing Arctic Ocean cruise JR16006 in the Barents Sea during summer 2017, British Oceanographic Data Centre, National Oceanography Centre, NERC, UK, https://doi.org/10/fg27, 2020.
Tuerena, R. E., Ganeshram, R. S., Geibert, W., Fallick, A. E., Dougans, J., Tait, A., Henley, S. F., and Woodward, E. M. S.: Nutrient cycling in the Atlantic basin: The evolution of nitrate isotope signatures in water masses, Global Biogeochem. Cy., 29, 1830–1844, https://doi.org/10.1002/2015gb005164, 2015.
Vage, S., Basedow, S. L., Tande, K. S., and Zhou, M.: Physical structure of the Barents Sea Polar Front near Storbanken in August 2007, J. Marine Syst., 130, 256–262, https://doi.org/10.1016/j.jmarsys.2011.11.019, 2014.
Van Oostende, N., Fawcett, S. E., Marconi, D., Lueders-Dumont, J., Sabadel, A. J. M., Woodward, E. M. S., Jonsson, B. F., Sigman, D. M., and Ward, B. B.: Variation of summer phytoplankton community composition and its relationship to nitrate and regenerated nitrogen assimilation across the North Atlantic Ocean, Deep-Sea Res. Pt. I, 121, 79–94, https://doi.org/10.1016/j.dsr.2016.12.012, 2017.
Weigand, M. A., Foriel, J., Barnett, B., Oleynik, S., and Sigman, D. M.: Updates to instrumentation and protocols for isotopic analysis of nitrate by the denitrifier method, Rapid Commun. Mass Spectrom., 30, 1365–1383, https://doi.org/10.1002/rcm.7570, 2016.
Woodgate, R. A.: Increases in the Pacific inflow to the Arctic from 1990 to 2015, and insights into seasonal trends and driving mechanisms from year-round Bering Strait mooring data, Prog. Oceanogr., 160, 124–154, https://doi.org/10.1016/j.pocean.2017.12.007, 2018.