the Creative Commons Attribution 4.0 License.
the Creative Commons Attribution 4.0 License.
 | 04 Feb 2021
Nitrogen isotopic fractionations during nitric oxide production in an agricultural soil
Emily M. Elliott
Nitric oxide (NO) emissions from agricultural soils play a critical role in atmospheric chemistry and represent an important pathway for loss of reactive nitrogen (N) to the environment. With recent methodological advances, there is growing interest in the natural-abundance N isotopic composition (δ15N) of soil-emitted NO and its utility in providing mechanistic information on soil NO dynamics. However, interpretation of soil δ15N-NO measurements has been impeded by the lack of constraints on the isotopic fractionations associated with NO production and consumption in relevant microbial and chemical reactions. In this study, anoxic (0 % O2), oxic (20 % O2), and hypoxic (0.5 % O2) incubations of an agricultural soil were conducted to quantify the net N isotope effects (15η) for NO production in denitrification, nitrification, and abiotic reactions of nitrite () using a newly developed δ15N-NO analysis method. A sodium nitrate () containing mass-independent oxygen-17 excess (quantified by a Δ17O notation) and three ammonium () fertilizers spanning a δ15N gradient were used in soil incubations to help illuminate the reaction complexity underlying NO yields and δ15N dynamics in a heterogeneous soil environment. We found strong evidence for the prominent role of re-oxidation under anoxic conditions in controlling the apparent 15η for NO production from in denitrification (i.e., 49 ‰ to 60 ‰). These results highlight the importance of an under-recognized mechanism for the reversible enzyme oxidoreductase to control the N isotope distribution between the denitrification products. Through a Δ17O-based modeling of co-occurring denitrification and re-oxidation, the 15η for reduction to NO and NO reduction to nitrous oxide (N2O) were constrained to be 15 ‰ to 22 ‰ and −8 ‰ to 2 ‰, respectively. Production of NO in the oxic and hypoxic incubations was contributed by both oxidation and consumption, with both processes having a significantly higher NO yield under O2 stress. Under both oxic and hypoxic conditions, NO production from oxidation proceeded with a large 15η (i.e., 55 ‰ to 84 ‰) possibly due to expression of multiple enzyme-level isotopic fractionations during oxidation to that involves NO as either a metabolic byproduct or an obligatory intermediate for production. Adding to sterilized soil triggered substantial NO production, with a relatively small 15η (19 ‰). Applying the estimated 15η values to a previous δ15N measurement of in situ soil NOx emission (NO) provided promising evidence for the potential of δ15N-NO measurements in revealing NO production pathways. Based on the observational and modeling constraints obtained in this study, we suggest that simultaneous δ15N-NO and δ15N-N2O measurements can lead to unprecedented insights into the sources of and processes controlling NO and N2O emissions from agricultural soils.
- Article
(3622 KB) - Full-text XML
-
Supplement
(694 KB) - BibTeX
- EndNote


Agricultural production of food has required a tremendous increase in the application of nitrogen (N) fertilizers since the 1960s (Davidson, 2009). In order to maximize crop yields, N fertilizers are often applied in excess to agricultural soils, resulting in loss of reactive N to the environment (Galloway et al., 2003). Loss of N in the form of gaseous nitric oxide (NO) has long been recognized for its adverse impacts on air quality and human health (Veldkamp and Keller, 1997). Once emitted to the atmosphere, NO is rapidly oxidized to nitrogen dioxide (NO2), and these compounds (collectively referred to as NOx) drive production and deposition of atmospheric nitrate () (Calvert et al., 1985) and play a critical role in the formation of tropospheric ozone (O3) – a toxic air pollutant and potent greenhouse gas (Crutzen, 1979). Despite the observations that emission of NO from agricultural soils can sometimes exceed that of nitrous oxide (N2O) – a climatically important trace gas primarily produced from reduction of NO in soils (Liu et al., 2017), NO is frequently overlooked in soil N studies due to its high reactivity and transient presence relative to N2O (Medinets et al., 2015). Consequently, the contribution of soil NO emission to contemporary NOx inventories at regional to global scales is highly uncertain (e.g., ranging from 3 % to >30 %) (Hudman et al., 2010; Vinken et al., 2014) and remains the subject of much current debate (Almaraz et al., 2018; Maaz et al., 2018).
As the central hub of the biogeochemical N cycle, NO can be produced and consumed in numerous microbial and chemical reactions in soils (Medinets et al., 2015). Among these processes, nitrification and denitrification are the primary sources responsible for NO emission from N-enriched agricultural soils (Firestone and Davidson, 1989). Denitrification is the sequential reduction of and nitrite () to NO, N2O, and dinitrogen (N2) and can be mediated by a diversity of soil heterotrophic microorganisms (Zumft, 1997). The enzymatic system of denitrification comprises a series of dedicated reductases whereby reductase (NIR) and NO reductase (NOR) are the key enzymes that catalyze production and reduction of NO, respectively (Ye et al., 1994). As such, NO is often viewed as a free intermediate of the denitrification process (Russow et al., 2009). In comparison, nitrification is a two-step aerobic process in which oxidation of ammonia (NH3) to is mediated by ammonia-oxidizing bacteria (AOB) or archaea (AOA), while the subsequent oxidation of to is performed by nitrite-oxidizing bacteria (NOB) (Lehnert et al., 2018). Although production of NO during the nitrification process has been linked to NH3 oxidation (Hooper et al., 2004; Caranto and Lancaster, 2017) and reduction by AOB/AOA-encoded NIR (Wrage-Mönning et al., 2018), the metabolic role of NO in AOB and AOA remains ambiguous, making it difficult to elucidate the enzymatic pathways driving NO release by nitrification (Beeckman et al., 2018; Stein, 2019). Additionally, NO can also be produced from abiotic reactions involving soil or its protonated form – nitrous acid (HNO2) (Venterea et al., 2005; Lim et al., 2018). However, despite empirical evidence for the dependence of soil NO emission on soil N availability and moisture content (Davidson and Verchot, 2000), the source contribution of soil NO emission across temporal and spatial scales is poorly understood (Hudman et al., 2012). This is largely due to the lack of a robust means for source partitioning soil-emitted NO under dynamic environmental conditions.
Natural-abundance stable N and oxygen (O) isotopes in N-containing molecules have long provided insights into the sources and relative rates of biogeochemical processes comprising the N cycle (Granger and Wankel, 2016). The unique power of stable isotope ratio measurements stems from the distinct partitioning of isotopes between chemical species or phases, known as isotopic fractionation. Thus, in order to extract the greatest information from the distributions of isotopic species, a rigorous understanding of the direction and magnitude of isotopic fractionations associated with each relevant transformation is required. Both kinetic and equilibrium isotope effects can lead to isotopic fractionations between N-bearing compounds in soils (Granger and Wankel, 2016; Denk et al., 2017). During kinetic processes, isotopic fractionation occurs as a result of differences in the reaction rates of isotopically substituted molecules (i.e., isotopologues), leading to either enrichment or, in a few rare cases, depletion of heavy isotopes in the reaction substrate (Fry, 2006; Casciotti, 2009). The degree of kinetic isotope fractionation can be quantified by a kinetic isotope fractionation factor (αk), which is often represented by the ratio of reaction rate constants of light isotopologues to that of heavy isotopologues. In this definition, αk is larger than 1 for normal kinetic isotope fractionation. For equilibrium reactions, equilibrium isotope fractionation arises from differences in the zero-point energies of two species undergoing isotopic exchange, leading to enrichment of heavy isotopes in the more strongly bonded form (Fry, 2006; Casciotti, 2009). In this case, the isotope ratios of two species at equilibrium are defined by an equilibrium isotope fractionation factor (αeq), which is also related to the kinetic isotope fractionation factors of forward and backward equilibrium reactions (Fry, 2006). By convention, isotopic fractionation can be expressed in units of per mill (‰) as an isotope effect . Nevertheless, in a heterogeneous soil environment, expression of intrinsic kinetic and equilibrium isotope effects for biogeochemical N transformations is often limited due to transport limitation in soil substrates, the multi-step nature of transformation processes, and the presence of diverse soil microbial communities that transform N via parallel and/or competing reaction pathways (Maggi and Riley, 2010). As such, interpretation of N isotope distribution in soils has largely relied on measuring net isotope effects (η), which are often characterized by incubating soil samples under environmentally relevant conditions, that favor expression of intrinsic isotope effects for specific N transformations (Lewicka-Szczebak et al., 2014). For example, it has been shown that the net N isotope effects for N2O production in soil nitrification, denitrification, and abiotic reactions are distinctively different under certain soil conditions (Denk et al., 2017), rendering natural-abundance N isotopes of N2O a useful index for inferring sources of N2O in agricultural soils (Toyoda et al., 2017).
While the isotopic dynamics underlying soil N2O emissions has been extensively studied, there has been little investigation into the N isotopic composition (notated as δ15N in units of ‰; ) of soil-emitted NO due to measurement difficulties (Yu and Elliott, 2017). Using a tubular denuder that trapped NO released from urea and ammonium ()-fertilized soils, Li and Wang (2008) revealed a gradual increase in δ15N-NO from −49 ‰ to −19 ‰ and simultaneous 15N enrichment in soil and over a 2-week laboratory incubation. Similar δ15N variations (i.e., −44 ‰ to −14 ‰) were recently reported for in situ soil NOx emission in a manure-fertilized cornfield (Miller et al., 2018). Moreover, the magnitude of δ15N-NOx measured in this study depended on manure application methods, implying that NOx was mainly sourced from nitrification of manure-derived (Miller et al., 2018). Based on a newly developed soil NO collection system that quantitatively converts soil-emitted NO to NO2 for collection in triethanolamine (TEA) solutions, our previous work demonstrated substantial variations in δ15N-NO (−54 ‰ to −37 ‰) in connection with changes in moisture content in a forest soil (Yu and Elliott, 2017). Furthermore, the measured in situ δ15N-NO values spanned a wide range (−60 ‰ to −23 ‰) and were highly sensitive to added N substrates (i.e., , , and ), indicating that NO produced from different sources may bear distinguishable δ15N imprints (Yu and Elliott, 2017). Nevertheless, despite the potential of δ15N-NO measurements in providing mechanistic information on soil NO dynamics, interpretation of δ15N-NO has been largely impeded by the knowledge gap as to how δ15N-NO is controlled by N isotopic fractionations during NO production and consumption in soils.
To this end, we conducted a series of controlled incubation experiments to quantify the net N isotope effects for NO production in an agricultural soil. Replicate soil incubations were conducted to measure the yield and δ15N of soil-emitted NO under anoxic (0 % O2), oxic (20 % O2), and hypoxic (0.5 % O2) conditions, respectively. A sodium fertilizer mined in the Atacama Desert, Chile (Yu and Elliott, 2018), was used to amend the soil in all three incubation experiments. This Chilean originated from atmospheric deposition and thus contained an anomalous 17O excess (quantified by the Δ17O notation) as a result of mass-independent isotopic fractionations during its photochemical formation in the atmosphere (Michalski et al., 2004). Because isotopic fractionations during biogeochemical production and consumption are mass-dependent, Δ17O- is a conservative tracer of gross nitrification and consumption and provides a quantitative benchmark for disentangling isotopic overprinting on δ15N- and δ18O- during co-occurring nitrification and denitrification (Yu and Elliott, 2018) (see Sect. S1 in the Supplement for more details). As additional tracers, three isotopically different fertilizers were used in parallel treatments of the oxic and hypoxic incubations to quantify the nitrifier source contribution of NO production with changing O2 availability. By integrating multi-species measurements of N and O isotopes in an isotopologue-specific modeling framework, we were able for the first time to unambiguously link the yield and δ15N variations of soil-emitted NO to nitrification and denitrification carried out by whole soil microbial communities and to characterize the net isotope effects for NO production from soil , , and under different redox conditions. The quantified isotope effects are discussed in the context of chemical and enzymatic pathways leading to net NO production in the soil environment and are applied to a previous field study (Miller et al., 2018) to provide implications for tracing the sources of NO emission from agricultural soils.
2.1 Soil characteristics and preparation
Soil samples used in this study were collected in July 2017 from a conventional corn–soybean rotation field in central Pennsylvania, USA, managed by the USDA (Agricultural Research Service, University Park, PA, USA). The soil is a well-drained Hagerstown silt loam (fine, mixed, semiactive, mesic Typic Hapludalfs) with sand, silt, and clay content of 21 %, 58 %, and 21 %, respectively. The sampled surface layer (0–10 cm) had a bulk density of 1.2 g cm−3 and a pH (1:1 water) of 5.7. Total N content was 0.2 % and δ15N of total N was 5.3 ‰. Soil C:N ratio was 11.4 and organic carbon content was 1.8 %. In the laboratory, soils were homogenized and sieved to 2 mm (but not air-dried) and then stored in resealable plastic bags at 4 ∘C until further analyses and incubations. Gravimetric water content of the sieved and homogenized soils was 0.14 g H2O g−1. Indigenous and concentrations were 0.7 and 19.8 µg N g−1, respectively. Throughout this paper, soil N concentrations, NO fluxes, and N transformation rates are expressed on the basis of soil ovendry (105 ∘C) weight.
2.2 Net NO production and collection of NO for δ15N analysis
The recently developed soil dynamic flux chamber (DFC) system was used to measure net NO production rates and to collect soil-emitted NO for δ15N analysis (Yu and Elliott, 2017). A schematic of the DFC system is shown in Fig. 1a. Detailed development and validation procedures for the NO collection method were presented in Yu and Elliott (2017). Briefly, custom-made flow-through incubators modified from 1 L Pyrex medium bottles (13951 L, Corning, USA) were used for all the incubation experiments (Fig. 1b). Each incubator was stoppered with two 42 mm Teflon septa secured by an open-topped screw cap and equipped with two vacuum valves for purging and closure of the incubator headspace. To measure net NO production from enclosed soil samples, a flow of NO-free air with desired O2 content was directed through the incubator into a chemiluminescent NO–NOx–NH3 analyzer (model 146i, Thermo Fisher Scientific) (Fig. 1a) (Yu and Elliott, 2017). Outflow NO concentration was monitored continuously until steady, and then the net NO production rate was determined from the flow rate and steady-state NO concentration. To collect NO for δ15N analysis, a subsample of the incubator outflow was forced to pass through a NO collection train (Fig. 1a) where NO is converted to NO2 by excess O3 (∼3 ppm) in a Teflon reaction tube (9.5 mm i.d., ca. 240 cm length) and subsequently collected in a 500 mL gas washing bottle containing a 20 % (v∕v, 70 mL) TEA solution (Yu and Elliott, 2017). The collection products were about 90 % and 10 % (Yu and Elliott, 2017). Results from comprehensive method testing showed that the NO collection efficiency was 98.5 %±3.5 % over a wide range of NO concentrations (12 to 749 ppb) and environmental conditions (e.g., temperature from 11 to 31 ∘C and relative humidity of the incubator outflow from 27 % to 92 %) (Yu and Elliott, 2017). Moreover, it was confirmed that high concentrations of ammonia (NH3) (e.g., 500 ppb) and nitrous acid (HONO) (removed by an inline HONO scrubber, Fig. 1a) in the incubator outflow do not interfere with NO collection (Yu and Elliott, 2017).
2.3 Anoxic incubation
To prepare for the anoxic incubation, the soil samples were spread out on a covered tray for pre-conditioning under room temperature (21 ∘C) for 24 h. Next, the soil was amended with the Chilean fertilizer (, , ) to achieve a fertilization rate of 35 µg -N g−1 and a target soil water content of 0.21 g H2O g−1 (equivalent to 46 % water-filled pore space, WFPS). The fertilized soil samples were thoroughly homogenized using a glass rod in the tray. A total of 100 g (dry-weight equivalent) of soil was then weighed into each of eight incubators, resulting in a soil depth of about 1.5 cm. The incubators were connected in parallel using a Teflon purging manifold (Fig. 1c), vacuumed and filled with ultra-high-purity N2 for three cycles, and incubated in the dark with a continuous flow of N2 circulating through each of the eight incubators at 0.015 standard liters per minute (SLPM). The sample fertilization and preparation procedures were repeated three times to establish three batches of replicate samples, leading to 24 soil samples in total for the anoxic incubation.
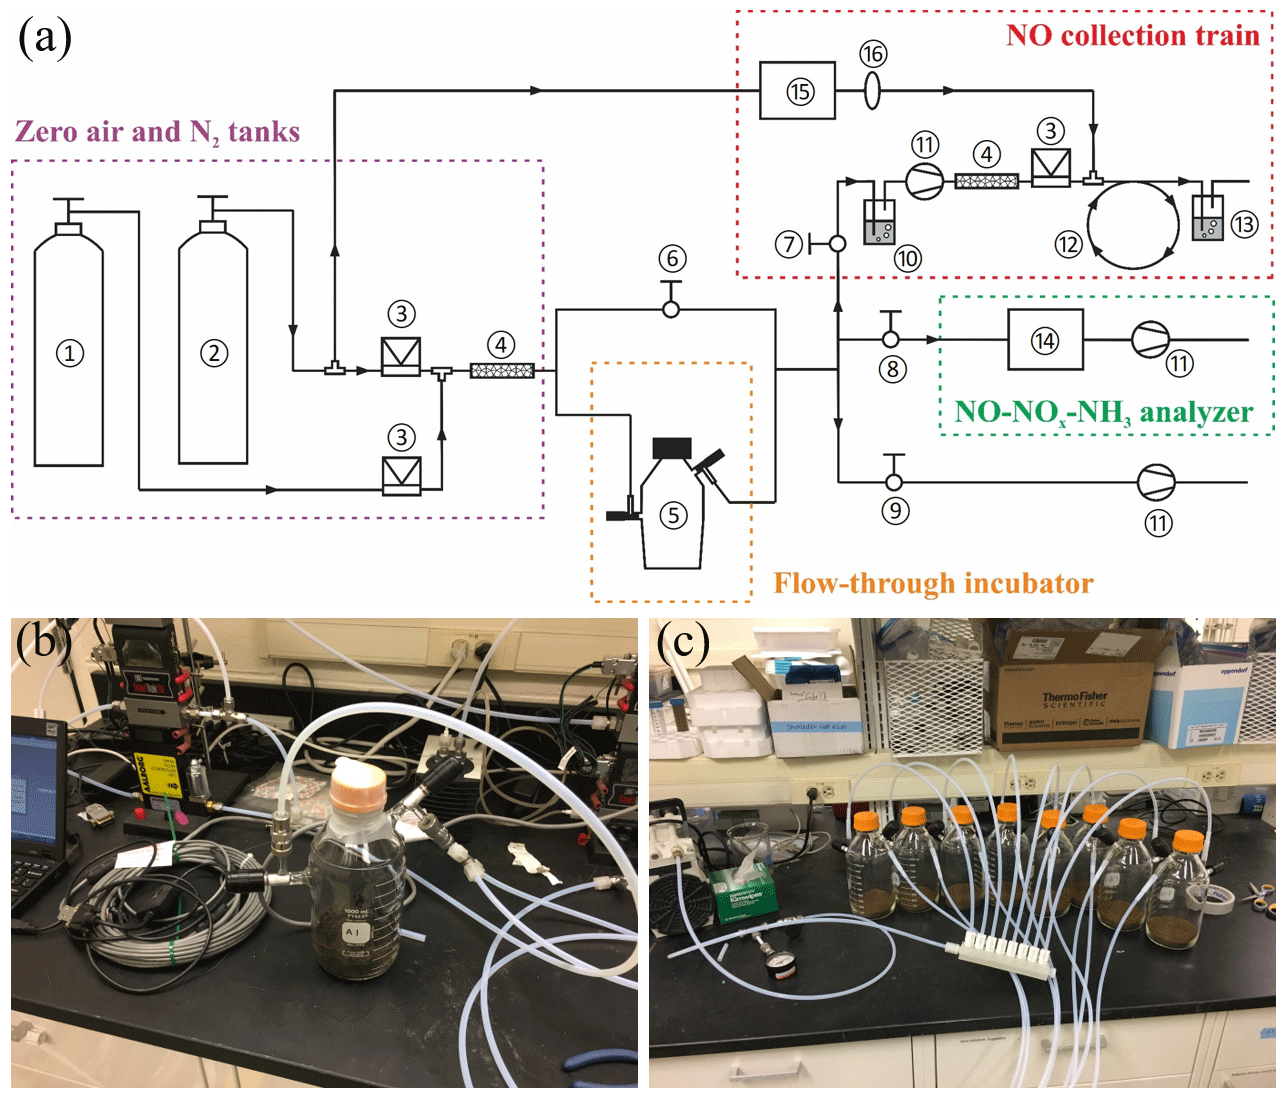
Figure 1(a) Schematic of the DFC system (not to scale) consisting of the following: (1) zero air tank, (2) N2 tank, (3) mass flow controller, (4) Nafion moisture exchanger, (5) flow-through incubator, (6–9) needle valves for controlling vacuum and flushing of the DFC system, (10) HONO scrubber, (11) diaphragm pump, (12) Teflon reaction tube, (13) gas washing bottle containing TEA solution, (14) NO–NOx–NH3 analyzer, (15) O3 generator, and (16) in-line PTFE particulate filter assembly. (b) Photo of the flow-through incubator. (c) Photo of the Teflon purging manifold for connection of the incubators in parallel.
The first NO measurement and collection event was conducted 24 h after the onset of the anoxic incubation, and daily sampling was conducted thereafter. At each sampling event, one incubator from each replicate sample batch was isolated by closing the vacuum valves, removed from the purging manifold, and then measured using the DFC system. To prevent O2 contamination by residual air in the DFC system, the DFC system was evacuated and flushed with N2 five times before the vacuum valves were re-opened. A flow of N2 was then supplied at 1 SLPM for continuous NO concentration measurement and collection. Samples from the replicate batches were measured successively.
Following the completion of measurement and collection of each sample, the incubator was opened from the top and the soil was combined with 500 mL deionized water for extraction of soil and (McKenney et al., 1982). Because accumulation was found in pilot experiments, deionized water, rather than routinely used KCl solutions, was used for the extraction to ensure accurate determination (Homyak et al., 2015). To extract soil and , the soil slurry was agitated vigorously on a stir plate for 10 min and then centrifuged for 10 min at 3400 g. The resultant supernatant was filtered through a sterile 0.2 µm filter (Homyak et al., 2015). In light of high concentrations observed in the pilot experiments, the filtrate was divided into two 60 mL Nalgene bottles, with one of the bottles receiving sulfamic acid to remove (Granger and Sigman, 2009). This -removed sample was used for isotope analysis, while the other sample without sulfamic acid treatment was used for determining and concentrations and combined δ15N analysis of NO. Two important control tests, based on ∕ spiking and acetylene (C2H2) addition, were conducted to evaluate the robustness of the adopted soil incubation and extraction methods. The results confirmed that the water extraction method was robust for determining concentrations and isotopic composition of soil and and that aerobic production from oxidation was negligible during the soil incubation and extraction procedures (Tables S1 and S2 in the Supplement; see Sect. S2 for more details).
2.4 Oxic and hypoxic incubations
The same pre-conditioning and fertilization protocol described for the anoxic incubation was used for the oxic and hypoxic incubations. Three isotopically different fertilizers were used in parallel treatments of each incubation experiment: (1) δ15N-NH ‰ (low 15N enrichment), (2) δ15N-NH ‰ (intermediate 15N enrichment), and (3) δ15N-NH ‰ (high 15N enrichment). An off-the-shelf ammonium sulfate ((NH4)2SO4) reagent was used in the low-δ15N- treatment, while the fertilizers with intermediate and high enrichment of 15N were prepared by gravimetrically mixing the (NH4)2SO4 reagent with reference materials IAEA-N2 (δ15N-NH ‰) and USGS26 (δ15N-NH ‰). In both oxic and hypoxic incubations, each of the three δ15N- treatments consisted of three replicate sample batches where each batch consisted of eight samples, resulting in 72 samples for each incubation experiment.
At the onset of each incubation experiment, soil samples (100 g dry-weight equivalent) were amended with the desired fertilizer (90 µg N g−1) and the Chilean fertilizer (15 µg N g−1) to the target soil water content of 0.21 g H2O g−1 (46 % WFPS). Following the amendment, two soil samples from each replicate batch were immediately extracted – one with 500 mL of deionized water for soil and using the extraction method described above and the other one with 500 mL of a 2 M KCl solution for determination of soil . The remaining samples were incubated under desired O2 conditions until further measurements. In the oxic incubation, the incubators were connected in parallel using the purging manifold and continuously flushed by a flow of zero air (20 % O2+80 % N2). In the hypoxic incubation, a flow of synthetic air with 0.5 % O2 content (balanced by 99.5 % N2) was used to incubate the soil samples. The synthetic air was generated by mixing the zero air with ultra-high-purity N2 using two mass flow controllers (model SmartTrak 50, Sierra Instruments).
Replicate NO measurement and collection events were conducted at 24, 48, and 72 h following the onset of the oxic and hypoxic incubations. Because net NO production rates were low under oxic and hypoxic conditions, all remaining soil samples in each replicate batch were connected in parallel for NO measurement and collection using the DFC system. This parallel connection ensured high outflow NO concentrations (i.e., >30 ppb) required for quantitative NO collection (Yu and Elliott, 2017). The flow rate of purging air (20 % O2 for the oxic incubation and 0.5 % O2 for the hypoxic incubation) during the DFC measurement was 0.25 SLPM to each incubator. Following the NO measurement and collection, two soil samples from each replicate batch were extracted for determination of soil ∕ (500 mL deionized water) and (500 mL 2M KCl), respectively. Because NO concentrations were too low for reliable NO collection at 72 h after the onset of the incubations, only net NO production rates were measured using the remaining two soil samples in each replicate batch.
2.5 Abiotic NO production
The potential for NO production from abiotic reactions was assessed using sterilized soil samples. Soil samples (100 g dry-weight equivalent) were weighed into the incubators and then autoclaved at 121 ∘C and 1.3 atm for 30 min. The autoclaved samples were pre-incubated under oxic and anoxic conditions, respectively, for 24 h and then fertilized with the Chilean (35 µg -N g−1) or the lab (NH4)2SO4 (90 µg -N g−1). The fertilizer solutions were added to the soil surface through the Teflon septa using a sterile syringe equipped with a 25-gauge needle. These samples were then measured periodically for net NO production. Because was found to accumulate during the anoxic incubation (see below), four soil samples were sterilized, pre-incubated under anoxic condition, and then fertilized with a NaNO2 solution (δ15N-) (8 µg N g−1) for immediate NO measurement and collection. These -amended samples were thereafter incubated under anoxic conditions and measured periodically for net NO production until undetectable.
2.6 Chemical and isotopic analyses
Soil concentrations were determined using a Dionex ion chromatograph ICS-2000 with a precision of (1σ) of ±5.0 µg N L−1. Soil concentrations were analyzed using the Griess–Ilosvay colorimetric reaction with a precision of ±1.2 µg N L−1. Soil concentrations were measured using a modified fluorometric o-phthaldialdehyde (OPA) method for soil KCl extracts (Kang et al., 2003) with a precision of ±7.0 µg N L−1. NO concentration in the TEA collection samples was measured using a modified spongy cadmium method with a precision of ±1.6 µg N L−1 (Yu and Elliott, 2017).
The denitrifier method (Sigman et al., 2001; Casciotti et al., 2002) was used to measure δ15N and δ18O of in the -removed soil extracts and the δ15N of NO in the extracts without sulfamic acid treatment. In brief, a denitrifying bacterium (Pseudomonas aureofaciens) lacking the N2O reductase enzyme was used to convert 20 nmol of into gaseous N2O. The N2O was then purified in a series of chemical traps, cryo-focused, and finally analyzed on a GV Instruments Isoprime continuous flow isotope ratio mass spectrometer (CF-IRMS) at m∕z 44, 45, and 46 at the University of Pittsburgh Regional Stable Isotope Laboratory for Earth and Environmental Science Research where all isotope analyses were conducted for this study. International reference standards IAEA-N3, USGS34, and USGS35 were used to calibrate the δ15N and δ18O analyses. The long-term precision is ±0.3 ‰ and ±0.5 ‰, respectively, for the δ15N and δ18O analyses. Because the denitrifier method does not differentiate and for the δ15N analysis, δ15N of was estimated using an isotopic mass balance when accounted for a significant fraction of the total NO pool.
Δ17O of was measured using the coupled bacterial reduction and thermal decomposition method described by Kaiser et al. (2007). The denitrifying bacteria were used to convert 200 nmol of to N2O, which was subsequently converted to O2 and N2 by reduction over a gold surface at 800 ∘C. The produced O2 and N2 were separated using a 5 Å molecular sieve gas chromatograph, and the O2 was then analyzed for δ17O and δ18O using the CF-IRMS. Δ17O was calculated from the measured δ17O and δ18O using Eq. (1) (see Sect. S1) and calibrated by USGS34, USGS35, and a 1:1 mixture of USGS34 and USGS35.
The precision of the Δ17O analysis of USGS35 and the USGS35:USGS34 mixture is ±0.3 ‰ (Yu and Elliott, 2018). Following Kaiser et al. (2007), the measured Δ17O- was used in the reduction of molecular isotope ratios of N2O to correct for the isobaric interference (i.e., m∕z 45) on the measured δ15N-.
δ15N of in the KCl extracts was measured by coupling the NH3 diffusion method (Zhang et al., 2015) and the hypobromite (BrO−) oxidation method (Zhang et al., 2007) with the denitrifier method (Felix et al., 2013). Briefly, an aliquot of soil KCl extract with 60 nmol was pipetted into a 20 mL serum vial containing an acidified glass fiber disk. The solution was made alkaline by adding magnesium oxide (MgO) to volatilize NH3, which was subsequently captured on the acidic disk as . After incubation under 37 ∘C for 10 d, was eluted from the disk using deionized water, diluted to 10 µM, oxidized by BrO− to , and finally measured for δ15N as at 20 nmol using the denitrifier method. International reference standards IAEA-N1, USGS25, and USGS26 underwent the same preparation procedure as the soil KCl extracts and were used along with the reference standards to correct for blanks and instrument drift. The precision of the δ15N- analysis is ±0.5 ‰ (Yu and Elliott, 2018).
δ15N of NO collected in the TEA solution was measured following the method described in Yu and Elliott (2017). Briefly, the TEA collection samples were first neutralized with 12 N HCl to pH ∼7, and then 10 to 20 nmol of the collected product NO was converted to N2O using the denitrifier method. In light of the low δ15N values of soil-emitted NO and the presence of as the dominant collection product, a low-δ15N- isotopic standard (KNO2, RSIL20, USGS Reston; ‰) was used together with the international reference standards to calibrate the δ15N-NO analysis. Following the identical treatment principle, we prepared the isotopic standards in the same matrix (i.e., 20 % TEA) as the collection samples and matched both the molar N amount and injection volume (±5 %) between the collection samples and the standards to minimize the blank interferences associated with the bacterial medium and the TEA solution. The precision and accuracy of the δ15N-NO analysis, determined by repeated sampling of an analytical NO tank (δ15N-) under diverse collection conditions, is ±1.1 ‰ (Yu and Elliott, 2017).
Sixty-three NO collection samples were obtained from the incubation experiments. The NO collection efficiency calculated based on the measured NO concentration in the TEA solution and the theoretical concentration based on the measured net NO production rate (Yu and Elliott, 2017) was on average 99.1 %±3.7 %. Out of the 63 collection samples, four samples had a NO collection efficiency lower than 95 %. These samples were excluded from further data analysis and interpretation. The measured N concentrations, net NO production rates, and isotope data from all the incubation experiments are available in Tables S5 to S11.
3.1 Anoxic incubation
During the anoxic incubation, soil concentration decreased linearly from 49.3±0.1 to 23.1±0.2 µg N g−1 (Fig. 2a), while concentration increased linearly from 0.4±0.1 to 6.9±0.1 µg N g−1 (Fig. 2b). The net NO production rate (fNO-anoxic) increased progressively from the first sampling day (72±8 ) to sampling day 5 and then stabilized at about 82 (Fig. 2c).
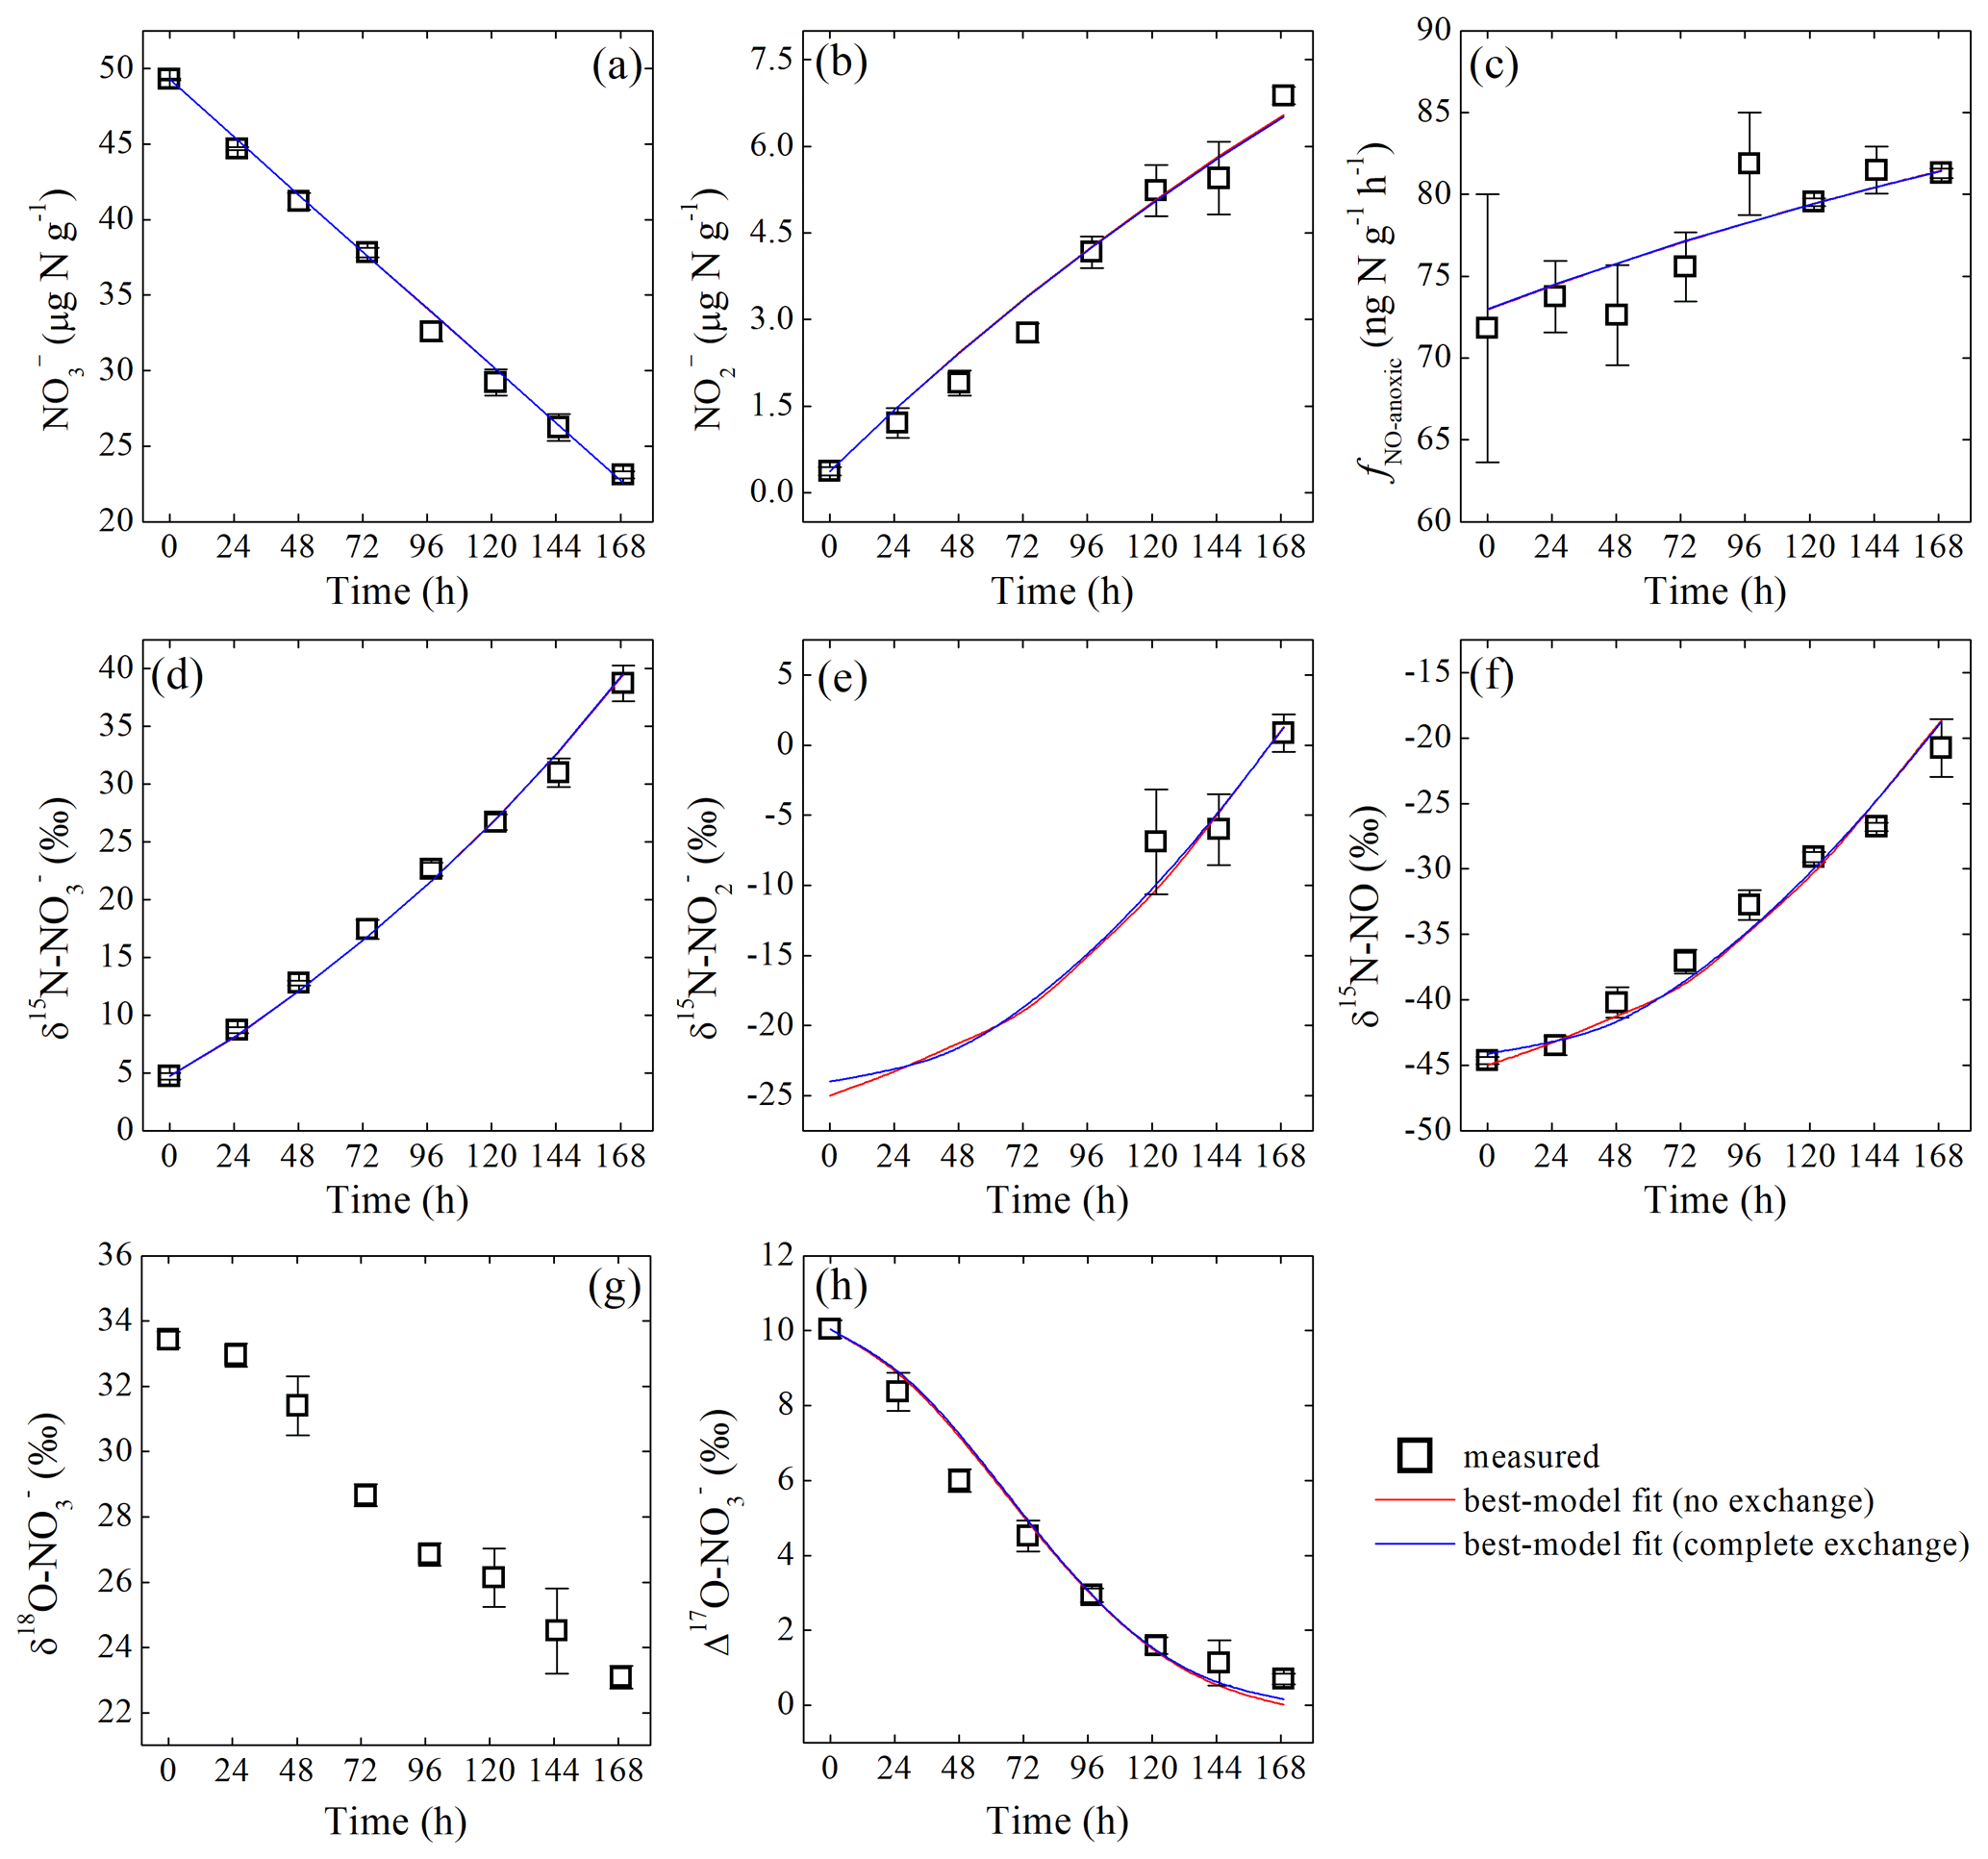
Figure 2Measured and modeled concentrations of (a) and (b); net NO production rate (c); δ15N values of (d), (e), and NO (f); and δ18O (g) and Δ17O (h) of during the anoxic incubation.
δ15N- and δ15N-NO values increased from 4.7 ‰±0.3 ‰ to 38.7 ‰±1.5 ‰ and to , respectively, over the anoxic incubation (Fig. 2d and f). The difference between δ15N- and δ15N-NO values increased significantly from 49.4 ‰ to 59.5 ‰ toward the end of the incubation (Fig. 2d and f). Based on the closed-system Rayleigh model, the apparent N isotopic fractionation during consumption was estimated to be 43.3 ‰±0.9 ‰ (Fig. S3 in the Supplement). δ15N- was estimated for samples collected in the last 3 sampling days where accounted for >15 % of the NO pool. The estimated δ15N- values were , , and , respectively (Fig. 2e). Although limited to the last 3 sampling days, δ15N- was lower than δ15N- by 33.6 ‰ to 37.9 ‰ (Fig. 2d and e) but was higher than the concurrently measured δ15N-NO values by a relatively constant offset of 21.5 ‰±0.7 ‰ (Fig. 2e and f). Surprisingly, both δ18O- values (33.4 ‰±0.2 ‰ to 23.1 ‰±0.3 ‰) and Δ17O- values (10.0 ‰±0.2 ‰ to 0.7 ‰±0.2 ‰) decreased progressively over the course of the anoxic incubation and were entirely decoupled from δ15N- (Fig. 2g and h).
3.2 Oxic and hypoxic incubations
Over the oxic incubation, soil concentration decreased linearly with increasing concentration under all three δ15N- treatments (Fig. 3a and b). In the hypoxic incubation, changes in and concentrations were more limited, although the linear trends were still evident (Fig. 3a and b). Under both oxic and hypoxic conditions, the total concentration of soil and remained nearly constant over the entire incubations (i.e., variations <4 %), and soil concentration was below the detection limit in both incubations. In the oxic incubation, δ15N- values uniformly increased by 8.6 ‰ to 13.1 ‰ under all three δ15N- treatments (Fig. 3e), while δ15N- values varied distinctly, depending on the initial δ15N- values (Fig. 3d). Specifically, δ15N- values increased by 7.8 ‰ and decreased by 10.9 ‰ under the high and low δ15N- treatments, respectively, and remained relatively constant under the intermediate δ15N- treatment (Fig. 3d). Limited increases in δ15N- values (<2 ‰) were observed under all three δ15N- treatments in the hypoxic incubation (Fig. 3e). Correspondingly, variations in δ15N- values were much smaller in the hypoxic incubation compared to those revealed in the oxic incubation (Fig. 3d). In both oxic and hypoxic incubations, δ18O- (Fig. 3g) and Δ17O- (Fig. 3h) values decreased progressively under all three δ15N- treatments, although the rates of decrease were significantly higher in the oxic incubation (Fig. 3g and h).
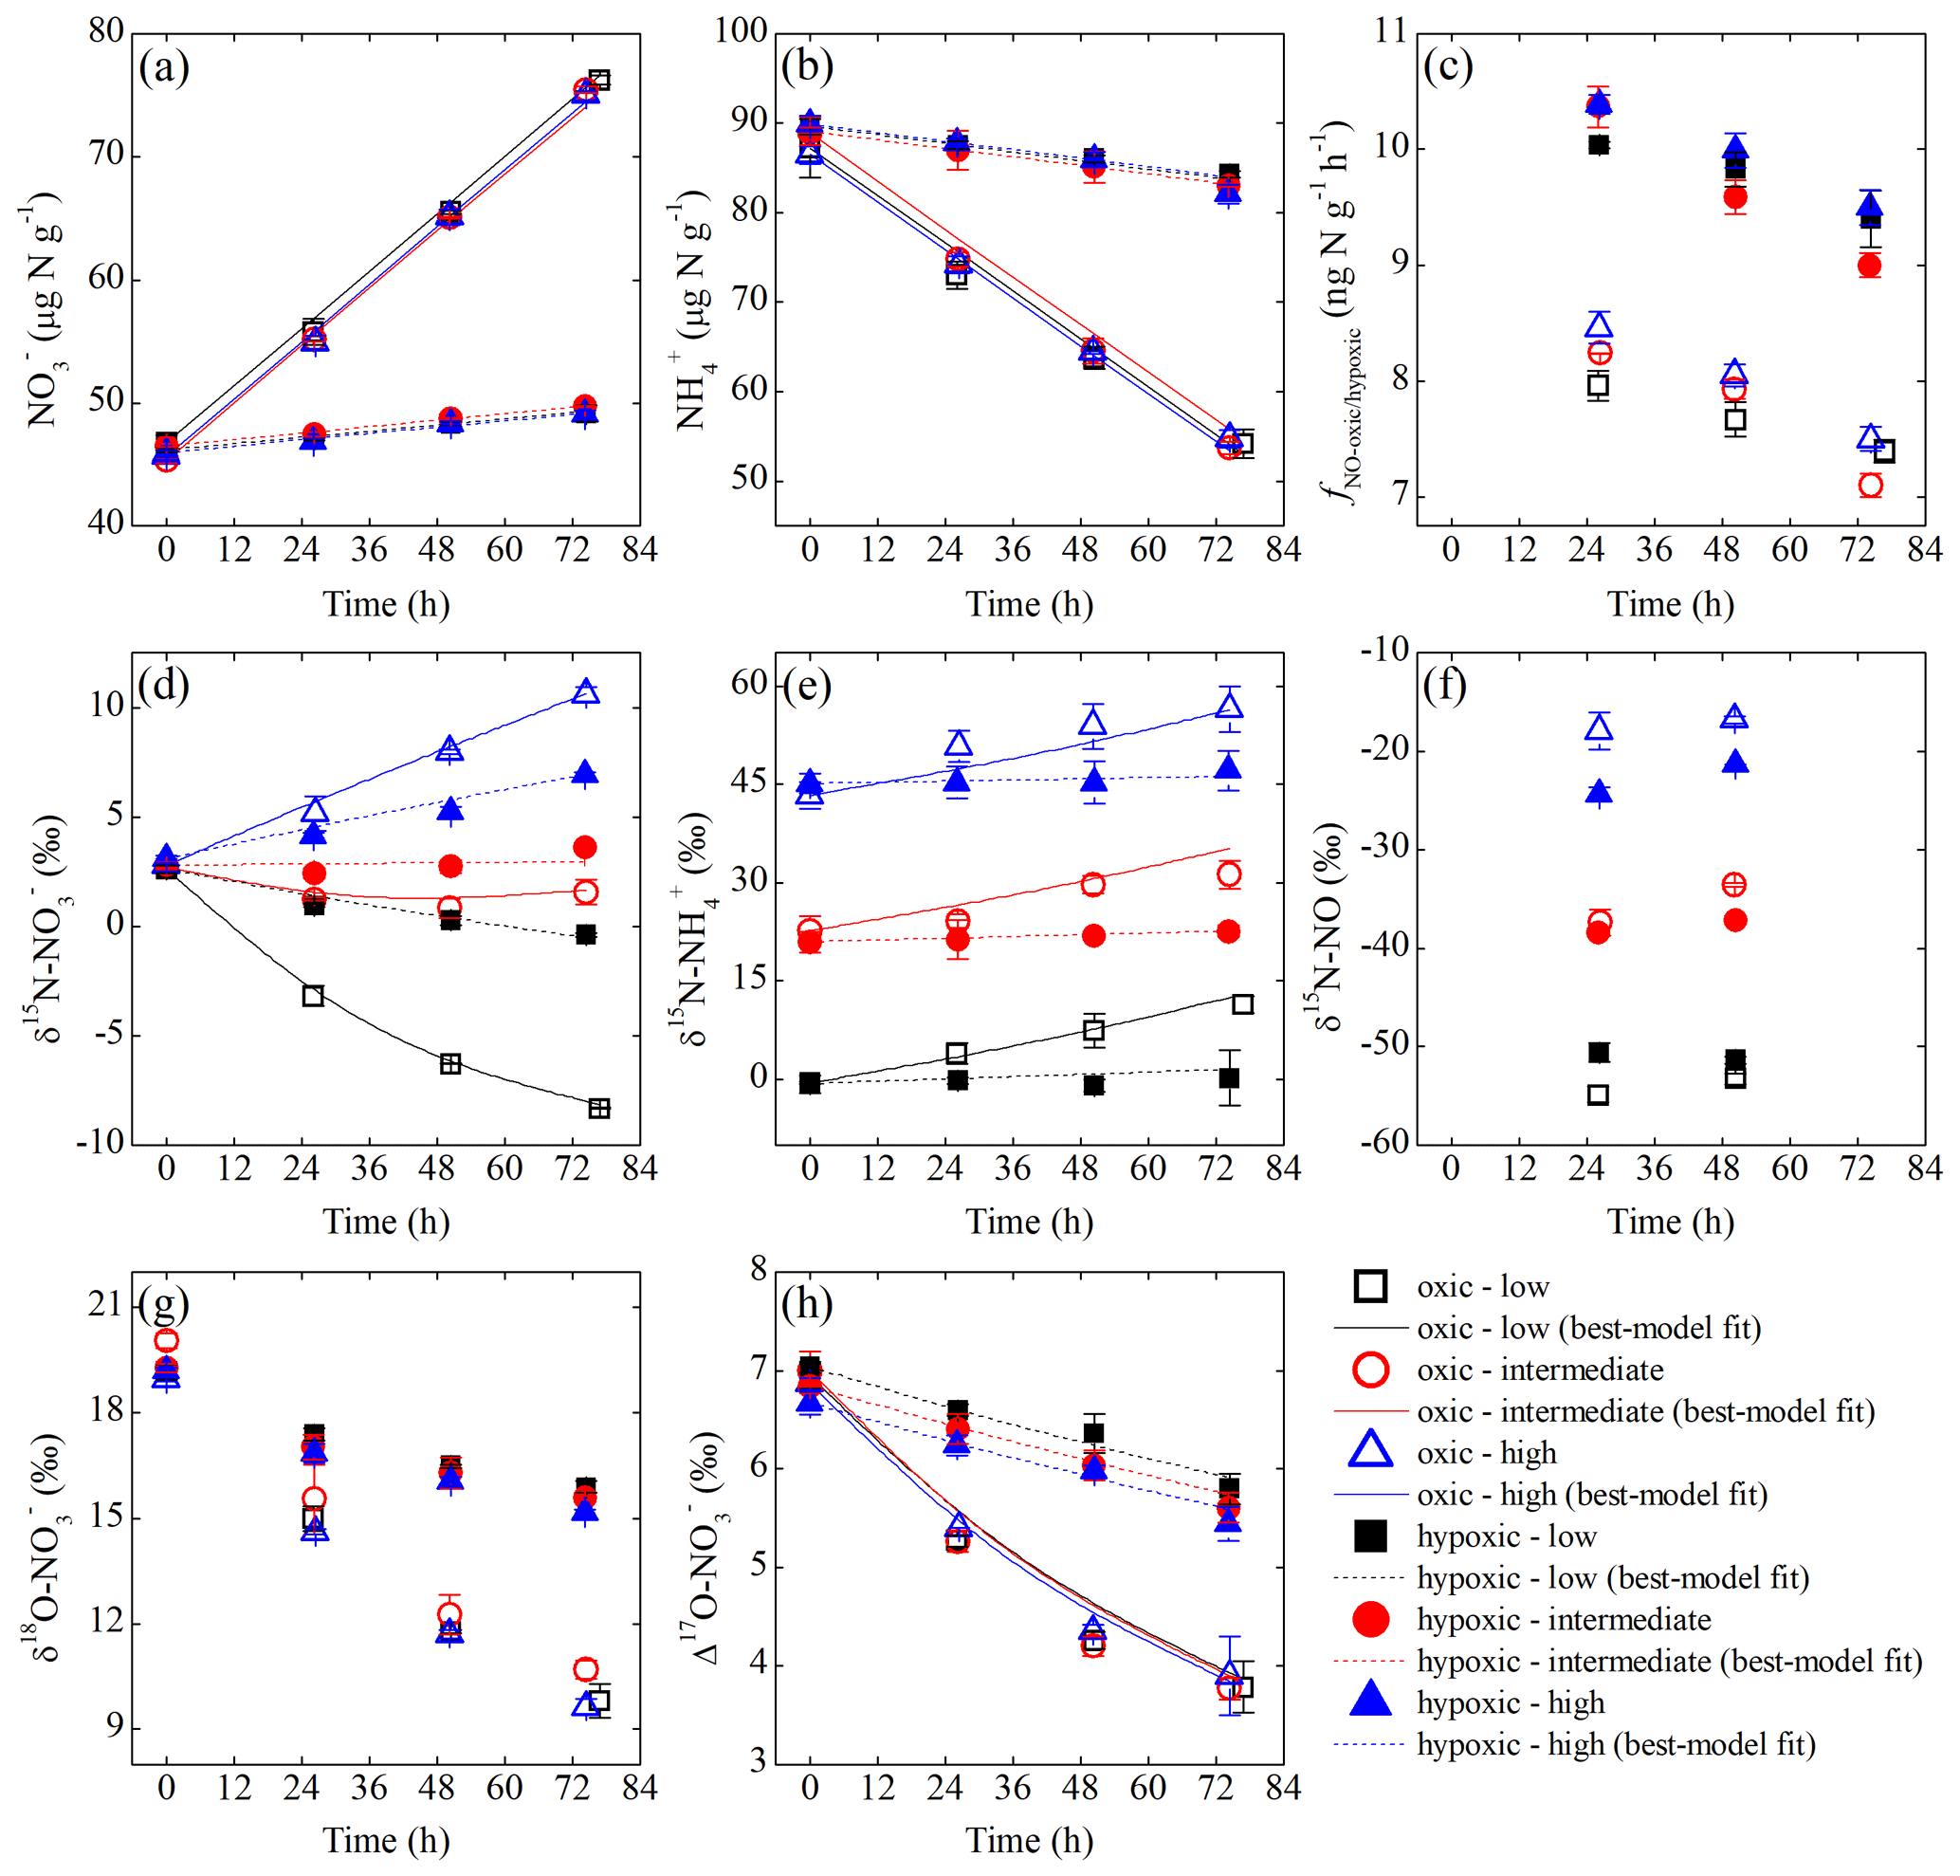
Figure 3Measured and modeled concentrations of (a) and (b); net NO production rate (c); δ15N values of (d), (e), and NO (f); and δ18O (g) and Δ17O (h) of under the three δ15N- treatments (differed by color) of the oxic (open symbols) and hypoxic (solid symbols) incubations.
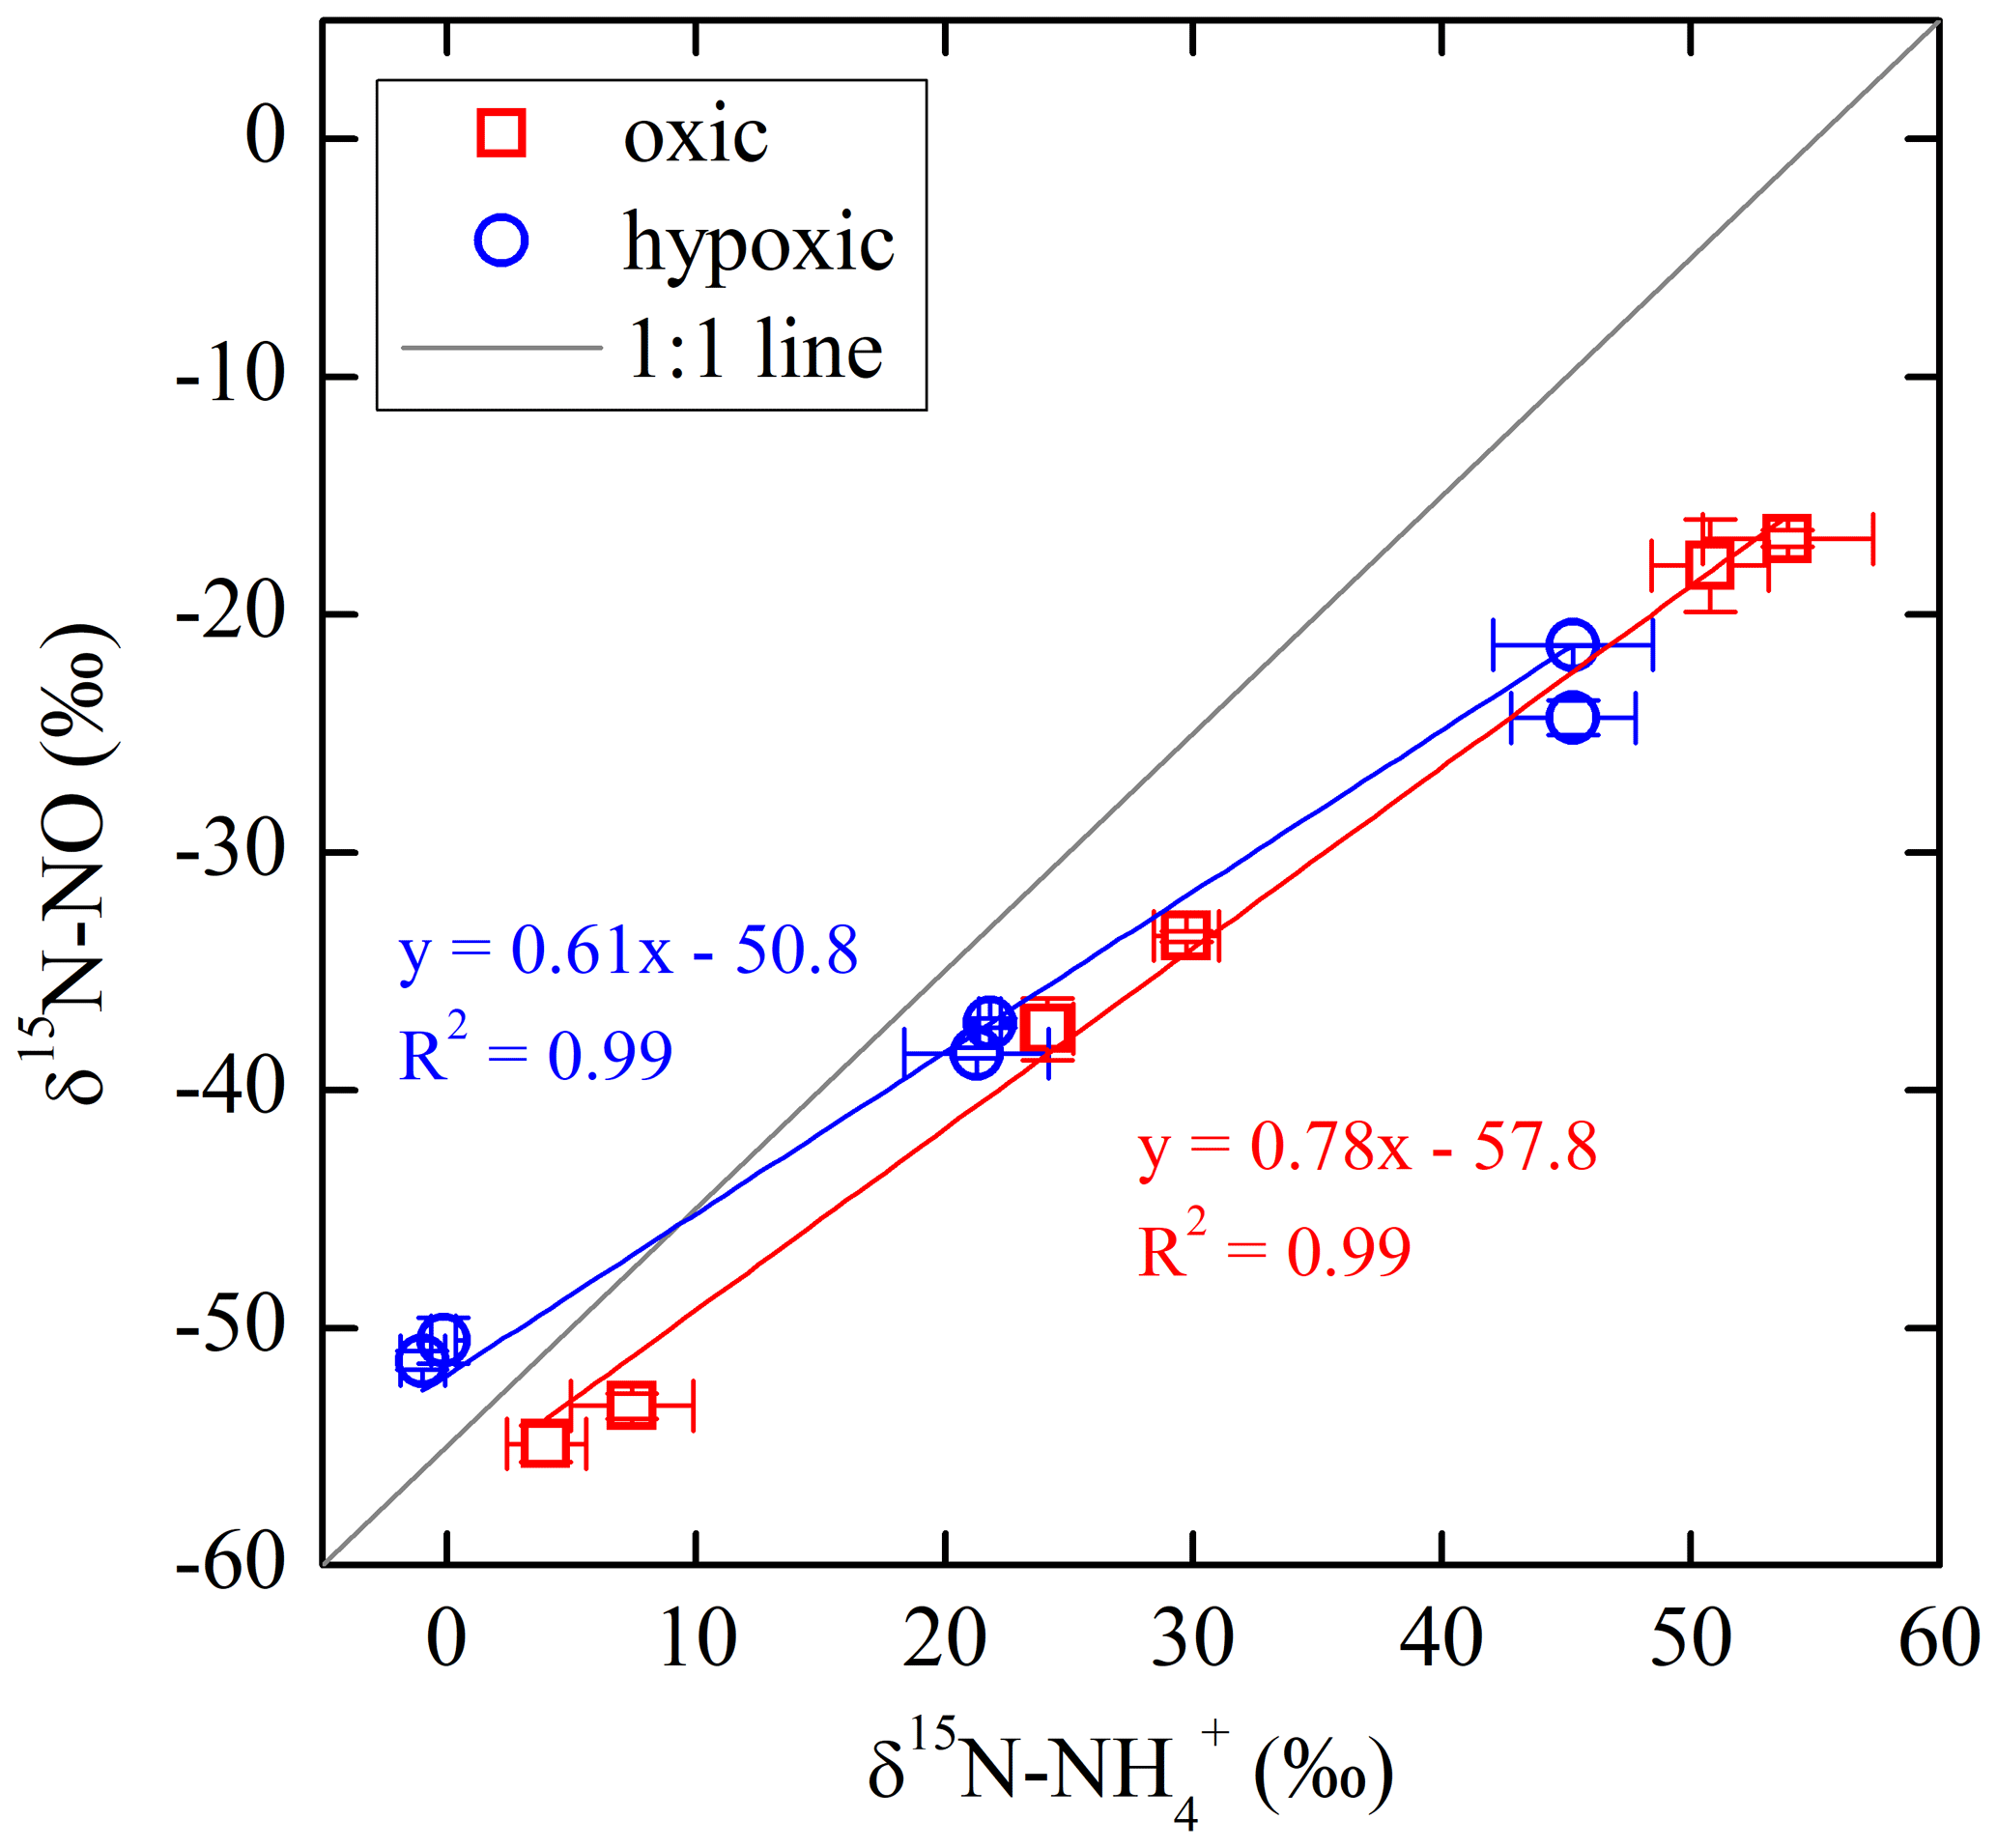
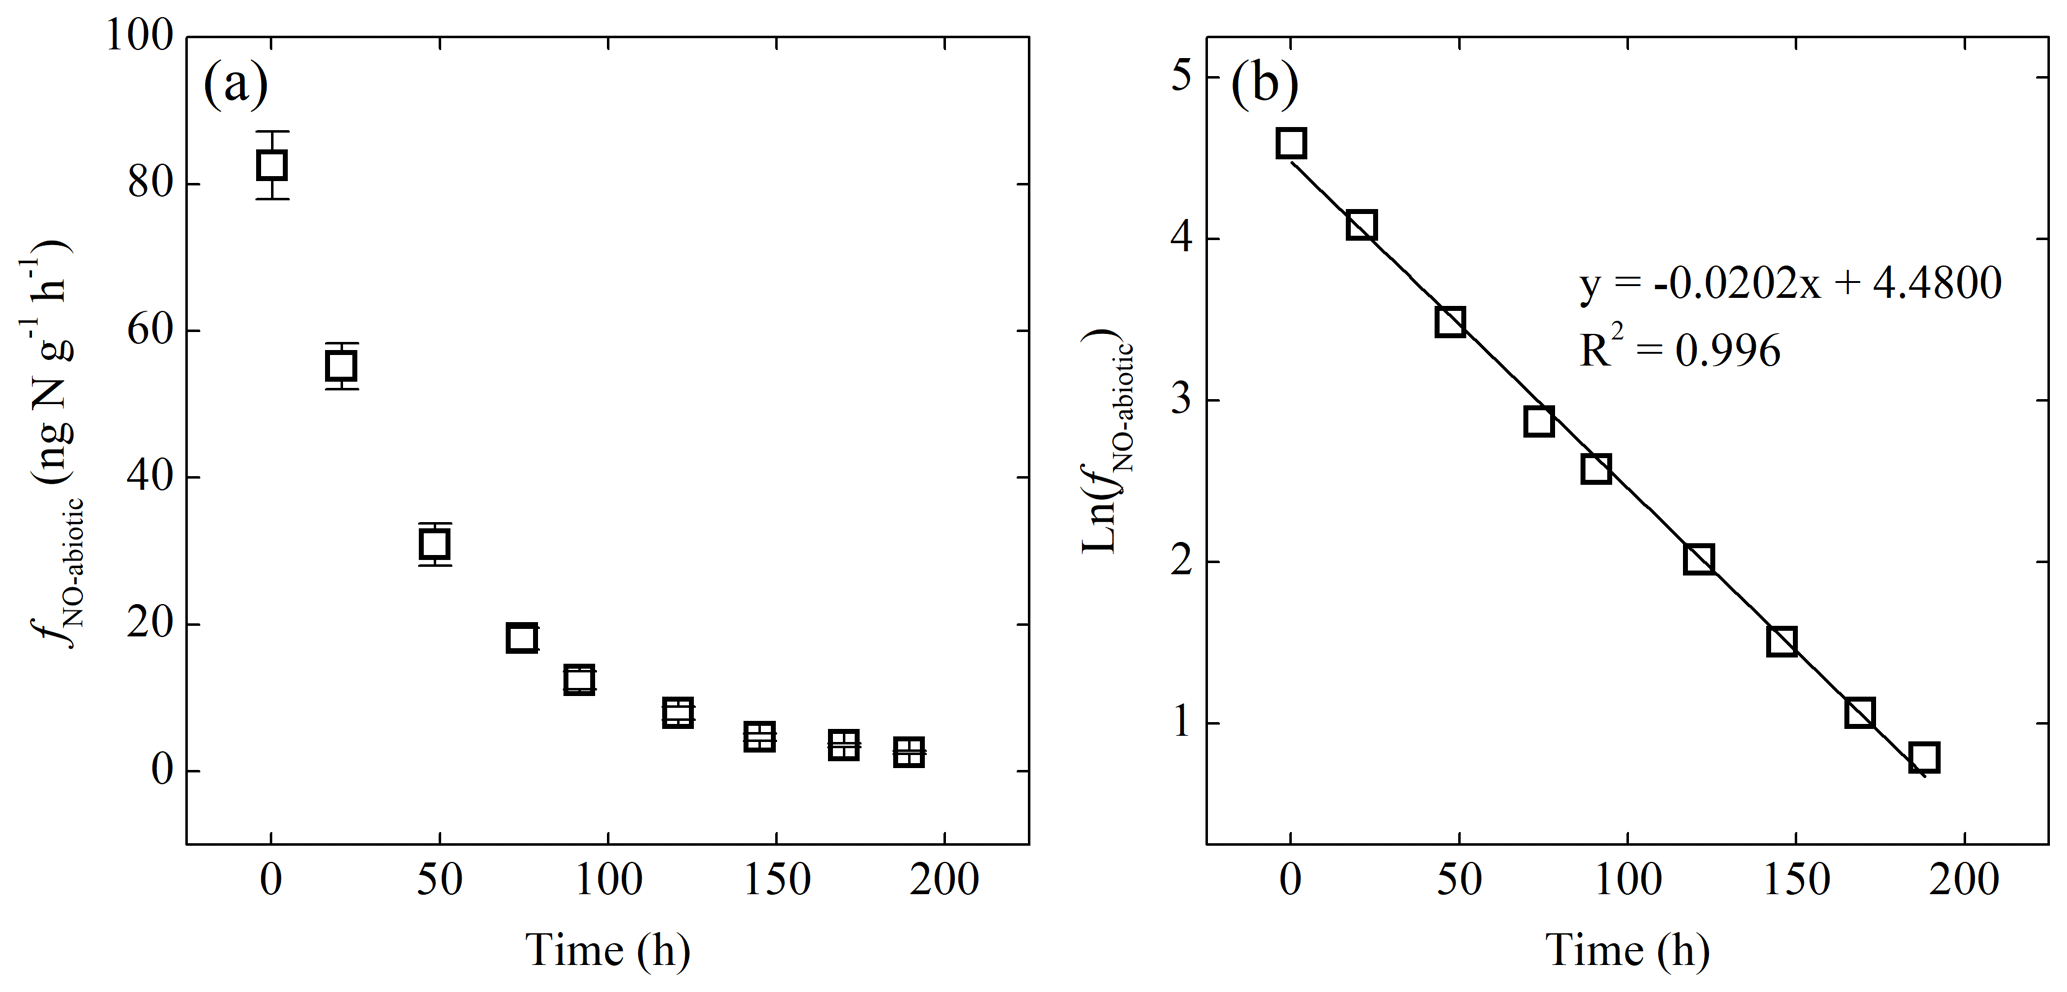
Figure 5(a) Net NO production rate (fNO-abiotic) of the -amended sterilized soil as a function of time. (b) Plot of the natural logarithm of fNO-abiotic vs. time showing first-order decay of fNO-abiotic.
The net NO production was significantly higher in the hypoxic incubation (fNO-hypoxic; 9.0 to 10.4 ) than in the oxic incubation (fNO-oxic; 7.1 to 8.5 ) (Fig. 3c). The measured δ15N-NO values ranged from to in the oxic incubation and from to in the hypoxic incubation (Fig. 3f). Pooling all the δ15N-NO measurements, we found that δ15N values between and NO differed from 58.9 ‰ to 70.7 ‰ across the three δ15N- treatments in the oxic incubation and from 50.4 ‰ to 69.6 ‰ in the hypoxic incubation (Fig. 4). In both incubations, the largest difference was observed under the high-δ15N- treatment, while the smallest difference was observed under the low δ15N- treatment. Under both oxic and hypoxic conditions, there was a significant linear relationship between the measured δ15N-NO and δ15N- values from all three δ15N- treatments (Fig. 4). The slope of the linear relationship is 0.78±0.03 (±1 SE) and 0.61±0.05 for the oxic and hypoxic incubations, respectively (Fig. 4).
3.3 Abiotic NO production
Addition of or to the sterilized soil did not result in detectable NO production under either oxic or anoxic condition. Immediate NO release was, however, triggered by addition under anoxic conditions (Fig. 5a). The abiotic NO production rate (fNO-abiotic) reached a steady level of 83±5 several minutes after the addition and then decreased exponentially to <3 over the following 8 d (Fig. 5a). The natural logarithm of fNO-abiotic showed a linear relationship with time (Fig. 5b). The NO produced following the addition had a δ15N value of , giving rise to a δ15N offset between and NO of 19.2 ‰±0.5 ‰.
Because interpretations of the results from the incubation experiments build upon each other, here we discuss the results from incubation of the sterilized soils (hereafter, abiotic incubation), anoxic incubation, and oxic/hypoxic incubations successively.
4.1 Reaction characteristics and N isotopic fractionation during abiotic NO production
The immediate release of NO upon the addition of highlights the chemically unstable nature of and the critical role of chemical reactions in driving soil NO emissions (Venterea et al., 2005; Lim et al., 2018). The strong linearity between ln(fNO-abiotic) and time (Fig. 5b) suggests apparent first-order kinetics for the abiotic NO production from (Eqs. 2 and 3) (McKenney et al., 1990).
In Eqs. (2) and (3), t is time; kabiotic is the pseudo-first-order rate constant for loss; sabiotic is the apparent stoichiometric coefficient for NO production from ; and []t and []0 are concentration at time t and t=0 in the sterilized soil, respectively. Combining Eqs. (2) and (3) and then log-transforming both sides yield
According to Eq. (4), kabiotic and sabiotic are estimated using the slope and intercept of the linear regression of ln (fNO-abiotic) vs. time (Fig. 5b). Given []0=8 µg N g−1, sabiotic and kabiotic are estimated to be 0.52±0.05 (±SE) and 0.019±0.002 h−1, respectively, suggesting that NO accounted for 52 %±5 % of the reacted during the abiotic incubation. The estimated kabiotic is within the range (i.e., 0.00055 to 0.73 h−1) derived by a recent study based on soil samples spanning a wide range of pH values (3.4 to 7.2) (Lim et al., 2018). Based on the estimated kabiotic, 97 % of the added was lost by the end of the abiotic incubation.
Several reaction pathways with distinct stoichiometry have been proposed for abiotic NO production from in soils. Under acidic soil conditions, self-decomposition of HNO2 produces NO and nitric acid (HNO3) with a stoichiometric HNO2-to-NO ratio ranging from 0.5 to 0.66 (i.e., 1 mole of HNO2 produces 0.5 to 0.66 moles of NO) (Van Cleemput and Samater, 1995). Although at pH 5.7 HNO2 constituted <1 % of the NO pool in this soil, HNO2 decomposition can occur on acidic clay mineral surfaces, even though bulk soil pH is circumneutral (Venterea et al., 2005). However, given the complete consumption in the abiotic incubation, HNO2 decomposition confined to acidic microsites could not account for all observed NO production. Under anoxic conditions, ∕HNO2 can also be stoichiometrically reduced to NO by transition metals (e.g., Fe(II)) and diverse organic molecules (e.g., humic and fulvic acids, lignins, and phenols) in a process termed chemo-denitrification (Zhu-Barker et al., 2015). The produced NO from chemo-denitrification can undergo further reduction to form N2O and N2 (Zhu-Barker et al., 2015). In addition, both and NO in soil solution can be consumed as nitroso donors in abiotic nitrosation reactions, resulting in N incorporation into soil organic matter (Heil et al., 2016; Lim et al., 2018). Therefore, our observation that about half of the reacted was recovered as NO may result from multiple competing sinks, parallel NO-producing pathways, and possibly abiotic NO consumption in the sterilized soil. The other half of the reacted that could not be accounted for by the measured NO was likely present in the forms of N2O, N2, and/or nitrosated organic compounds in the soil.
The observed δ15N difference between and NO (i.e., ) likely reflects a combined N isotope effect for all of the competing NO production pathways during the abiotic incubation. While very little isotope data exist for abiotic reactions in the literature, the measured in this study is consistent with reported N isotope effects (i.e., 15 ‰ to 25 ‰) for abiotic reduction by Fe(II) at similar consumption rates to this study (0.02 to 0.05 h−1) (Buchwald et al., 2016). On the other hand, the measured is lower than the reported δ15N offsets between and N2O (i.e., ) for chemo-denitrification (24 ‰ to 29 ‰) (Jones et al., 2015; Wei et al., 2019). This seems to suggest that the observed abiotic NO production was mainly driven by chemo-denitrification and that accumulation of NO as an chemo-denitrification intermediate may explain why the observed was larger than the N isotope effect for Fe(II)-catalyzed reduction in previous batch experiments (Jones et al., 2015; Buchwald et al., 2016). Future studies adopting simultaneous δ15N-NO and δ15N-N2O measurements will be required to elucidate the role of NO as the N2O precursor during chemo-denitrification.
It is important to note that the autoclaving is a harsh sterilization method and can substantially alter soil physical and chemical properties. For example, Buessecker et al. (2019) recently showed that autoclaved peat soil had 10-fold-higher total fluorescence compared to non-sterilized controls, indicating dramatic increases in solubility and lability of organic molecules by autoclaving. Furthermore, autoclaving has also been shown to substantially increase abiotic N2O production from -amended soils (Wei et al., 2019). Conversely, milder sterilization methods (e.g., gamma-irradiation) that presumably cause less alteration of soil properties may not completely inactivate biological NO production due to the high diversity of biological NO production pathways in soils (e.g., non-specific reactions catalyzed by extracellular enzymes) (Medinets et al., 2015). Further research is warranted to compare different sterilization methods for their effects on abiotic NO production and .
4.2 Reaction reversibility between and and N isotope distribution between , , and NO during the anoxic incubation
The measured fNO-anoxic (72 to 82 ) (Fig. 2c) is well within the range reported for anoxic soil incubations (e.g., 5 to 500 ) (Medinets et al., 2015) and is about two-thirds of the net consumption rate of NO during the anoxic incubation. That the majority of consumed NO was recovered as NO supports the emerging notion that NO can be the end product of denitrification once limitations on gas diffusion are lifted in soils (Russow et al., 2009; Loick et al., 2016). Applying the derived kabiotic and sabiotic in the abiotic incubation to the measured concentrations under anoxic condition produced a range of fNO-abiotic from <4 to 68 (Fig. S4). While this modeled fNO-abiotic appears to contribute up to 80 % of the measured fNO-anoxic (Fig. S4), fNO-anoxic was high and remained stable even without any significant accumulation of in the soil (Fig. 2b and c), suggesting that kabiotic was likely overestimated in the abiotic incubation (see above). Assuming that net biological NO production was maintained at the level of fNO-anoxic measured during the first sampling event and that sabiotic was constant and equal to 0.52, a back-of-the-envelope calculation based on the difference in fNO-anoxic between the first and last sampling events and the concentration measured at the end of the anoxic incubation indicates that kabiotic was likely on the order of 0.0027 h−1, or about 7 times lower than the kabiotic derived in the abiotic incubation. Although qualitative, this calculation suggests a minor contribution of abiotic NO production to the measured fNO-anoxic (<12 %; Fig. S4).
The large increases in δ15N- and δ15N-NO values over the anoxic incubation (Fig. 2d and f) are congruent with strong N isotopic fractionations during microbial denitrification (Mariotti et al., 1981; Granger et al., 2008). However, the observed net isotope effect for NO production from (i.e., ; 49.4 ‰ to 59.5 ‰) is larger than the apparent N isotope effect for consumption (43.3 ‰±0.9 ‰) (Fig. S3). The large magnitude and increasing pattern of , together with the accumulation of in the soil, point to complexity beyond single-step isotopic fractionations and highlight the need to carefully examine fractionation mechanisms for all intermediate steps leading to net NO production (i.e., to , to NO, and NO to N2O). Moreover, it is surprising that both δ18O- and Δ17O- values decreased over the anoxic incubation (Fig. 2g and h). Interestingly, similar decreasing trends in δ18O- values (e.g., up to 4 ‰ over 25 h) have been reported by Lewicka-Szczebak et al. (2014) for two anoxically incubated agricultural soils amended with a high-δ18O Chilean fertilizer similar to ours (i.e., δ18O-NO ‰), although Δ17O- was not reported in this previous study. The decreasing δ18O- values, observed here and by Lewicka-Szczebak et al. (2014), appear to contradict the well-established paradigm that variations in δ15N- and δ18O- values follow a linear trajectory with a slope of 0.5 to 1 during dissimilatory reduction (Granger et al., 2008). Furthermore, as Δ17O- is in theory not altered by microbial denitrification – a mass-dependent fractionation process (Michalski et al., 2004; Yu and Elliott, 2018), the decreasing Δ17O- values observed in this study indicate that processes capable of diluting or erasing the Δ17O signal may occur concurrently with denitrification during the anoxic incubation. Importantly, if this dilution or removal of the Δ17O signal was accompanied by N isotopic fractionations, there may be cascading effects on the distribution of N isotopes between , , and NO.
The decreasing δ18O- and Δ17O- values could be potentially explained by an O isotope equilibration between and soil H2O, catalyzed either chemically or biologically via a reversible reaction between and (Granger and Wankel, 2016). However, it has been shown in controlled laboratory experiments that dissimilatory reduction catalyzed by bacterial nitrate reductase (NAR) is irreversible at the enzyme level (Treibergs and Granger, 2017) and that abiotic O isotope exchange between and H2O is extremely slow (half-life >109 years at 25 ∘C and pH 7) and therefore irrelevant under natural soil conditions (Kaneko and Poulson, 2013). Although fungi use a distinct enzyme system for denitrification (Shoun et al., 2012), there is no evidence for enzymatic reversibility of fungal NAR in the literature. Furthermore, by converting and simultaneously to N2 and , anaerobic oxidation (anammox) could dilute the Δ17O signal by producing with Δ17O=0 (Brunner et al., 2013). However, due to the low indigenous concentration, anammox is considered not pertinent during the anoxic incubation. Given the complete recovery of concentrations and isotopes in the control experiments (Tables S1 and S2), as well as the significantly increased δ15N- values during the anoxic incubation, we excluded production from aerobic oxidation as a possible explanation for the observed declines in δ18O- and Δ17O- values.
Therefore, having ruled out the above possibilities led us to postulate that the decreasing δ18O- and Δ17O- values may result from anaerobic oxidation mediated by NOB in the soil. The enzyme catalyzing oxidation to in NOB – oxidoreductase (NXR) – is metabolically versatile and has been shown to catalyze reduction under anoxic conditions by operating in reverse (Friedman et al., 1986; Freitag et al., 1987; Bock et al., 1988; Koch et al., 2015). Moreover, during NXR-catalyzed oxidation, the required O atom originates from H2O molecules (Reaction R1), so that can in theory be oxidized to without the presence of O2 by donating electrons to redox-active intracellular components (Wunderlich et al., 2013) or alternative electron acceptors in niche environments (Babbin et al., 2017).
In a denitrifying environment, anaerobic oxidation of denitrification-produced back to (i.e., re-oxidation) can dilute δ18O- and Δ17O- values by incorporating a “new” O atom from H2O into the reacting pool (Reaction R1) (Granger and Wankel, 2016). Under acidic and circumneutral pH conditions, this dilution effect can be further enhanced by chemically and perhaps biologically catalyzed O isotope equilibration between and H2O (Casciotti et al., 2007; Buchwald and Casciotti, 2010), which effectively erases the isotopic imprints of denitrification on prior to its re-oxidation. The reversibility of NXR and its direct control on O isotopes in have been convincingly demonstrated by Wunderlich et al. (2013) using a pure culture of Nitrobacter vulgaris. By incubating N. vulgaris in a solution under anoxic conditions, Wunderlich et al. (2013) showed that was produced in the solution by N. vulgaris and that N. vulgaris promoted incorporation of amended 18O-H2O labels into through a re-oxidation of the accumulated (Wunderlich et al., 2013).
Importantly, there is mounting evidence from the marine N cycle community that re-oxidation plays a critical role in the N isotope partitioning between and . At the process scale, re-oxidation co-occurring with dissimilatory reduction can lead to a large δ15N difference between and beyond what would be expected to result from reduction alone (Gaye et al., 2013; Dale et al., 2014; Dähnke and Thamdrup, 2016; Peters et al., 2016; Martin and Casciotti, 2017; Buchwald et al., 2018). This large δ15N difference is thought to arise from a rare, but intrinsic, inverse kinetic isotope effect associated with re-oxidation (e.g., −13 ‰) (Casciotti, 2009). As such, in a net denitrifying environment, re-oxidation functions as an apparent branching pathway along the sequential reduction of , preferentially re-oxidizing 15 back to . At the enzyme scale, the bidirectional NXR enzyme has been proposed to catalyze intracellular coupled reduction and oxidation (i.e., bidirectional interconversion of and ), facilitating expression of an equilibrium N isotope effect between and (Reaction R2) (Wunderlich et al., 2013; Kemeny et al., 2016).
Evidence from pure culture studies of anammox bacteria carrying the NXR enzyme (Brunner et al., 2013) and theoretical quantum calculations (Casciotti, 2009) suggest that this N isotope equilibration favors partitioning of 14N into with an equilibrium isotope effect ranging from −50 ‰ to −60 ‰ (negative sign is used to denote that this N isotope equilibration partitions 14N to the left side of Reaction R2). This NXR-catalyzed ∕ interconversion was invoked to explain the extremely low δ15N- values relative to δ15N- (up to 90 ‰) in the surface Antarctic Ocean, where aerobic oxidation is inhibited by low nutrient availability (Kemeny et al., 2016). Hypothetically, if expressed at either the process or the enzyme level, the N isotope effect for re-oxidation could propagate into denitrification-produced NO, giving rise to an increased δ15N difference between and NO ().
To test whether re-oxidation can explain the observed declines in δ18O- and Δ17O- values and δ15N distribution between , , and NO, we modified an isotopologue-specific (i.e., 14N, 15N, 16O, 17O, and 18O) numerical model previously described by Yu and Elliott (2018) to simulate co-occurring denitrification and re-oxidation in two steps. Without a clear identification of the alternative electron acceptors that coupled with anaerobic oxidation in the studied soil, we followed the reaction scheme proposed by Wunderlich et al. (2013) and Kemeny et al. (2016) (Reaction R1) to parameterize the NXR-catalyzed re-oxidation as the backward reaction of a dynamic equilibrium between and (Fig. 6) – that is, the NXR-catalyzed re-oxidation (backward reaction) is balanced by an NXR-catalyzed reduction (forward reaction), leading to no net oxidation or reduction in the soil. Importantly, this representation is consistent with the observation that both consumption and accumulation followed a pseudo-zero-order kinetics over the anoxic incubation (Fig. 2a and b), which implies no net contribution from the ∕ interconversion. Given previous findings that the NXR-catalyzed O exchange between and depends on availability (Wunderlich et al., 2013), the backward re-oxidation was assumed to be first order (with respect to ), defined by a first-order rate constant, kNXR(b). With respect to the O isotope equilibration between H2O and the reacting pool, we considered two extreme-case scenarios: (1) no exchange and (2) complete exchange. In the no-exchange scenario, the imprints of denitrification on δ18O- and Δ17O- values are preserved, such that only one H2O-derived O atom is incorporated into with each molecule being re-oxidized (Reaction R1). In the complete-exchange scenario, δ18O and Δ17O values of always reflect those of soil H2O (δ18O- ‰, Δ17O-H2O=0 ‰) (Fig. 6), and therefore all three O atoms in produced from re-oxidation originate from H2O. Furthermore, we considered both abiotic NO production and denitrification as the source of NO during the anoxic incubation (Fig. 6). To account for the potential overestimation in kabiotic(see above), we used a reduced kabiotic (0.0027 h−1) to model net abiotic NO production from , while sabiotic and were fixed at 0.52 ‰ and 19.2 ‰, respectively. With respect to δ15N of denitrification-produced NO, we assumed that NIR-catalyzed reduction to NO and NOR-catalyzed NO reduction to N2O were each associated with a kinetic N isotope effect (15ηNIR and 15ηNOR). The closed-system Rayleigh equation was then used to simulate the coupled NO production and reduction in denitrification at each model time interval (Lewicka-Szczebak et al., 2014). Detailed model derivation and formulation are provided in the Supplement (Sect. S3.1).

Figure 6Model structure of co-occurring denitrification and re-oxidation and associated N isotope effects. Nitrogen transformations driven by denitrifiers and nitrifiers are shown by solid black and red arrows, respectively, and abiotic O exchange between and H2O by the solid blue arrow. The dashed blue arrow denotes net NO yield from abiotic reactions.
With this model of co-occurring denitrification and re-oxidation, we first solved for the rates of denitrifier-catalyzed (RNAR), (RNIR), and NO (RNOR) reductions and kNXR(b) (four unknowns) using the measured and concentrations, fNO-anoxic, and Δ17O- values (four measured variables). This first modeling step was robustly constrained by the measured Δ17O-, which essentially functions as a 15 tracer (Yu and Elliott, 2018) and is therefore particularly sensitive to re-oxidation. In the second modeling step, the measured δ15N-, δ15N-, and δ15N-NO values (three measured variables) were used to optimize the kinetic N isotope effects for NAR-catalyzed reduction (15ηNAR), 15ηNIR, 15ηNOR, and the equilibrium N isotope effect for NXR-catalyzed ∕ interconversion (15ηNXR(eq)) (Reaction R2; Fig. 6) (four unknowns). This modeling system is under-determined (number of measured variables is less than the number of unknowns) and thus cannot be solved uniquely. Thus, instead of definitively solving for the four unknown isotope effects, we explored their best combination to fit the measured δ15N values of , , and NO. Specifically, to reduce the number of unknowns for model optimization, 15ηNAR and 15ηNXR(eq) were treated as known values, and 15ηNIR and 15ηNOR were solved by mapping through the entire space of 15ηNAR and 15ηNXR(eq) (at a resolution of 1 ‰), defined by their respective widest range of possible values. We used a range of 5 ‰ to 55 ‰ for 15ηNAR, consistent with a recent compilation based on soil incubations and denitrifier pure cultures (Denk et al., 2017). Given the existing observational and theoretical constraints (Casciotti, 2009; Brunner et al., 2013), a range of −60 ‰ to 0 ‰ was assigned to 15ηNXR(eq), which is equivalent to the argument that the impact of ∕ interconversion on the N isotope distribution between and can vary from null to a strong partitioning of 14N to . We further defined the lower percentile 2.5 of the error-weighted residual sum of squares (RSS) between simulated and measured δ15N values of , , and NO as the threshold for selection of the best-fit models. Detailed information regarding model optimization can be found in the Supplement (Sect. S3.2).
Table 1Means and 95 % confidence intervals of modeled denitrification rates and re-oxidation rate constants under the no-exchange and complete-exchange scenarios.
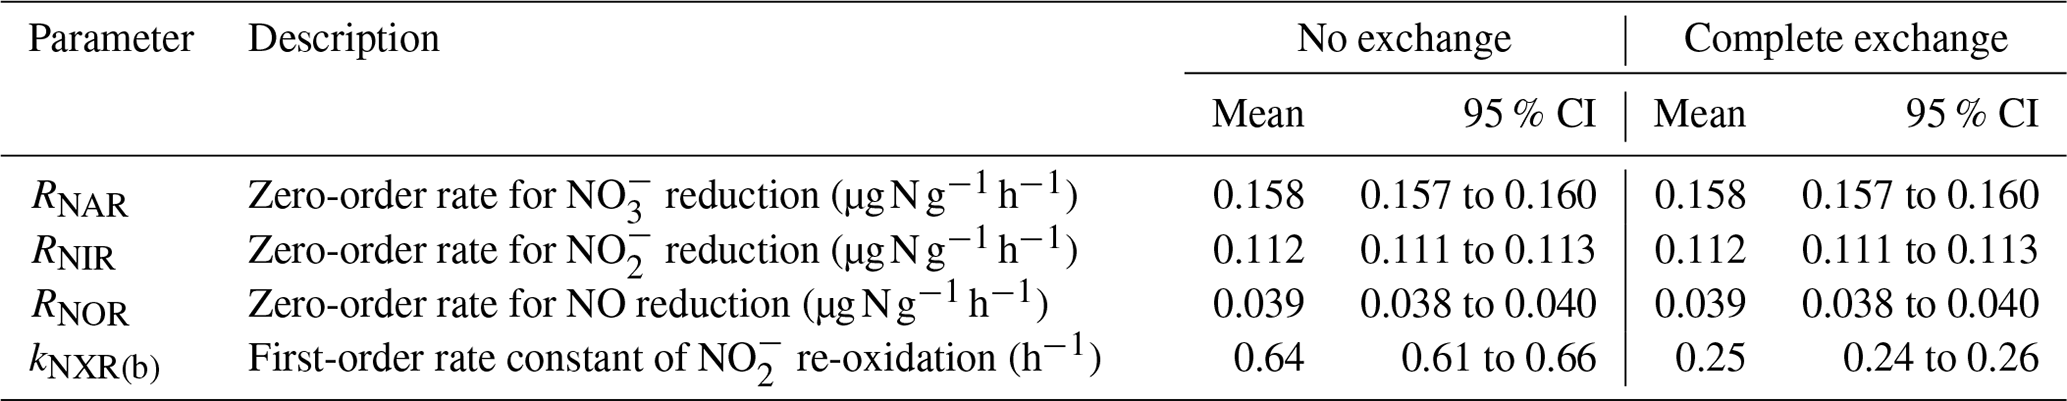
Results from the first modeling step are summarized in Table 1, and the best-fit models were plotted in Fig. 2 to compare with the measured data. Because the NXR-catalyzed ∕ interconversion was assumed to result in no change in and concentrations, RNAR (0.158 ), RNIR (0.112 ), and RNOR (0.039 ) can be well described by zero-order kinetics and are not sensitive to model scenarios for O exchange between and H2O (Table 1). Moreover, the observed accumulation and fNO-anoxic dynamics can be well reproduced using the modeled denitrification rates and the downward adjustment of kabiotic (Fig. 2b and c). kNXR(b) was estimated to be 0.64 and 0.25 h−1 under the no-exchange and complete-exchange scenarios, respectively (Table 1). Under both scenarios, the simulated Δ17O- values exhibit a characteristic decreasing trend and are in excellent agreement with measured Δ17O- values (Fig. 2h). The larger kNXR(b) under the no-exchange scenario is expected and can be explained by the faster back reaction (i.e., re-oxidation) required to reproduce the observed dilution of Δ17O-, because only one new O atom is incorporated into with each molecule being re-oxidized. Although the measured δ18O- values did not provide quantitative constraints for the model optimization, the isotopologue-specific model with the optimized denitrification rates and kNXR(b) was run forward to test whether the decreasing δ18O- values can also be possibly explained by co-occurring denitrification and re-oxidation (details are provided in Sect. S4). The results showed that reduction (acting to increase δ18O- values) and re-oxidation (acting to decrease δ18O- values) have counteracting effects on the forward-modeled δ18O- (Fig. S2) and that the decreasing trend in δ18O- values can be well reproduced under both no-exchange and complete-exchange scenarios with a reasonable assumption on the net O isotope effects for denitrification and re-oxidation (Fig. S2; see Sect. S4) (Granger and Wankel, 2016). Therefore, although kNXR(b) cannot be definitively quantified in this study due to the unknown degree of O exchange between and H2O, these simulation results provide confidence in our hypothesis that the observed decreases in δ18O- and Δ17O- values were driven by the reversible action of the NXR enzyme. It is important to note that the estimated kNXR(b) is fairly large even under the complete-exchange scenario. Based on the concentration measured at the end of the anoxic incubation (6.9 µg N g−1), a kNXR(b) of 0.25 h−1 would require a re-oxidation rate (1.7 ) that is 1 order of magnitude higher than the estimated RNAR and RNIR. However, the inferred maximum re-oxidation rate under either model scenario (1.7 to 4.4 ) is still within the reported range for aerobic oxidation in agricultural soils (e.g., up to 6–7 ) (Taylor et al., 2019), which is indicative of high NOB activity even under anoxic conditions (Koch et al., 2015). It is also noteworthy that Δ17O analysis of can in theory provide quantitative constraint on the degree of O isotope exchange between and H2O during the anoxic incubation, as has been previously demonstrated by Δ17O analysis of N2O to determine O exchange between N2O and H2O during denitrification (Lewicka-Szczebak et al., 2016). However, in this study, robust Δ17O- analysis was confounded by the low concentrations as well as the fact that can undergo O exchange with H2O during sample processing and storage (Casciotti et al., 2007). Future development in soil Δ17O- analysis and calibration will benefit the use of Δ17O to disentangle reaction complexity in soil environments.
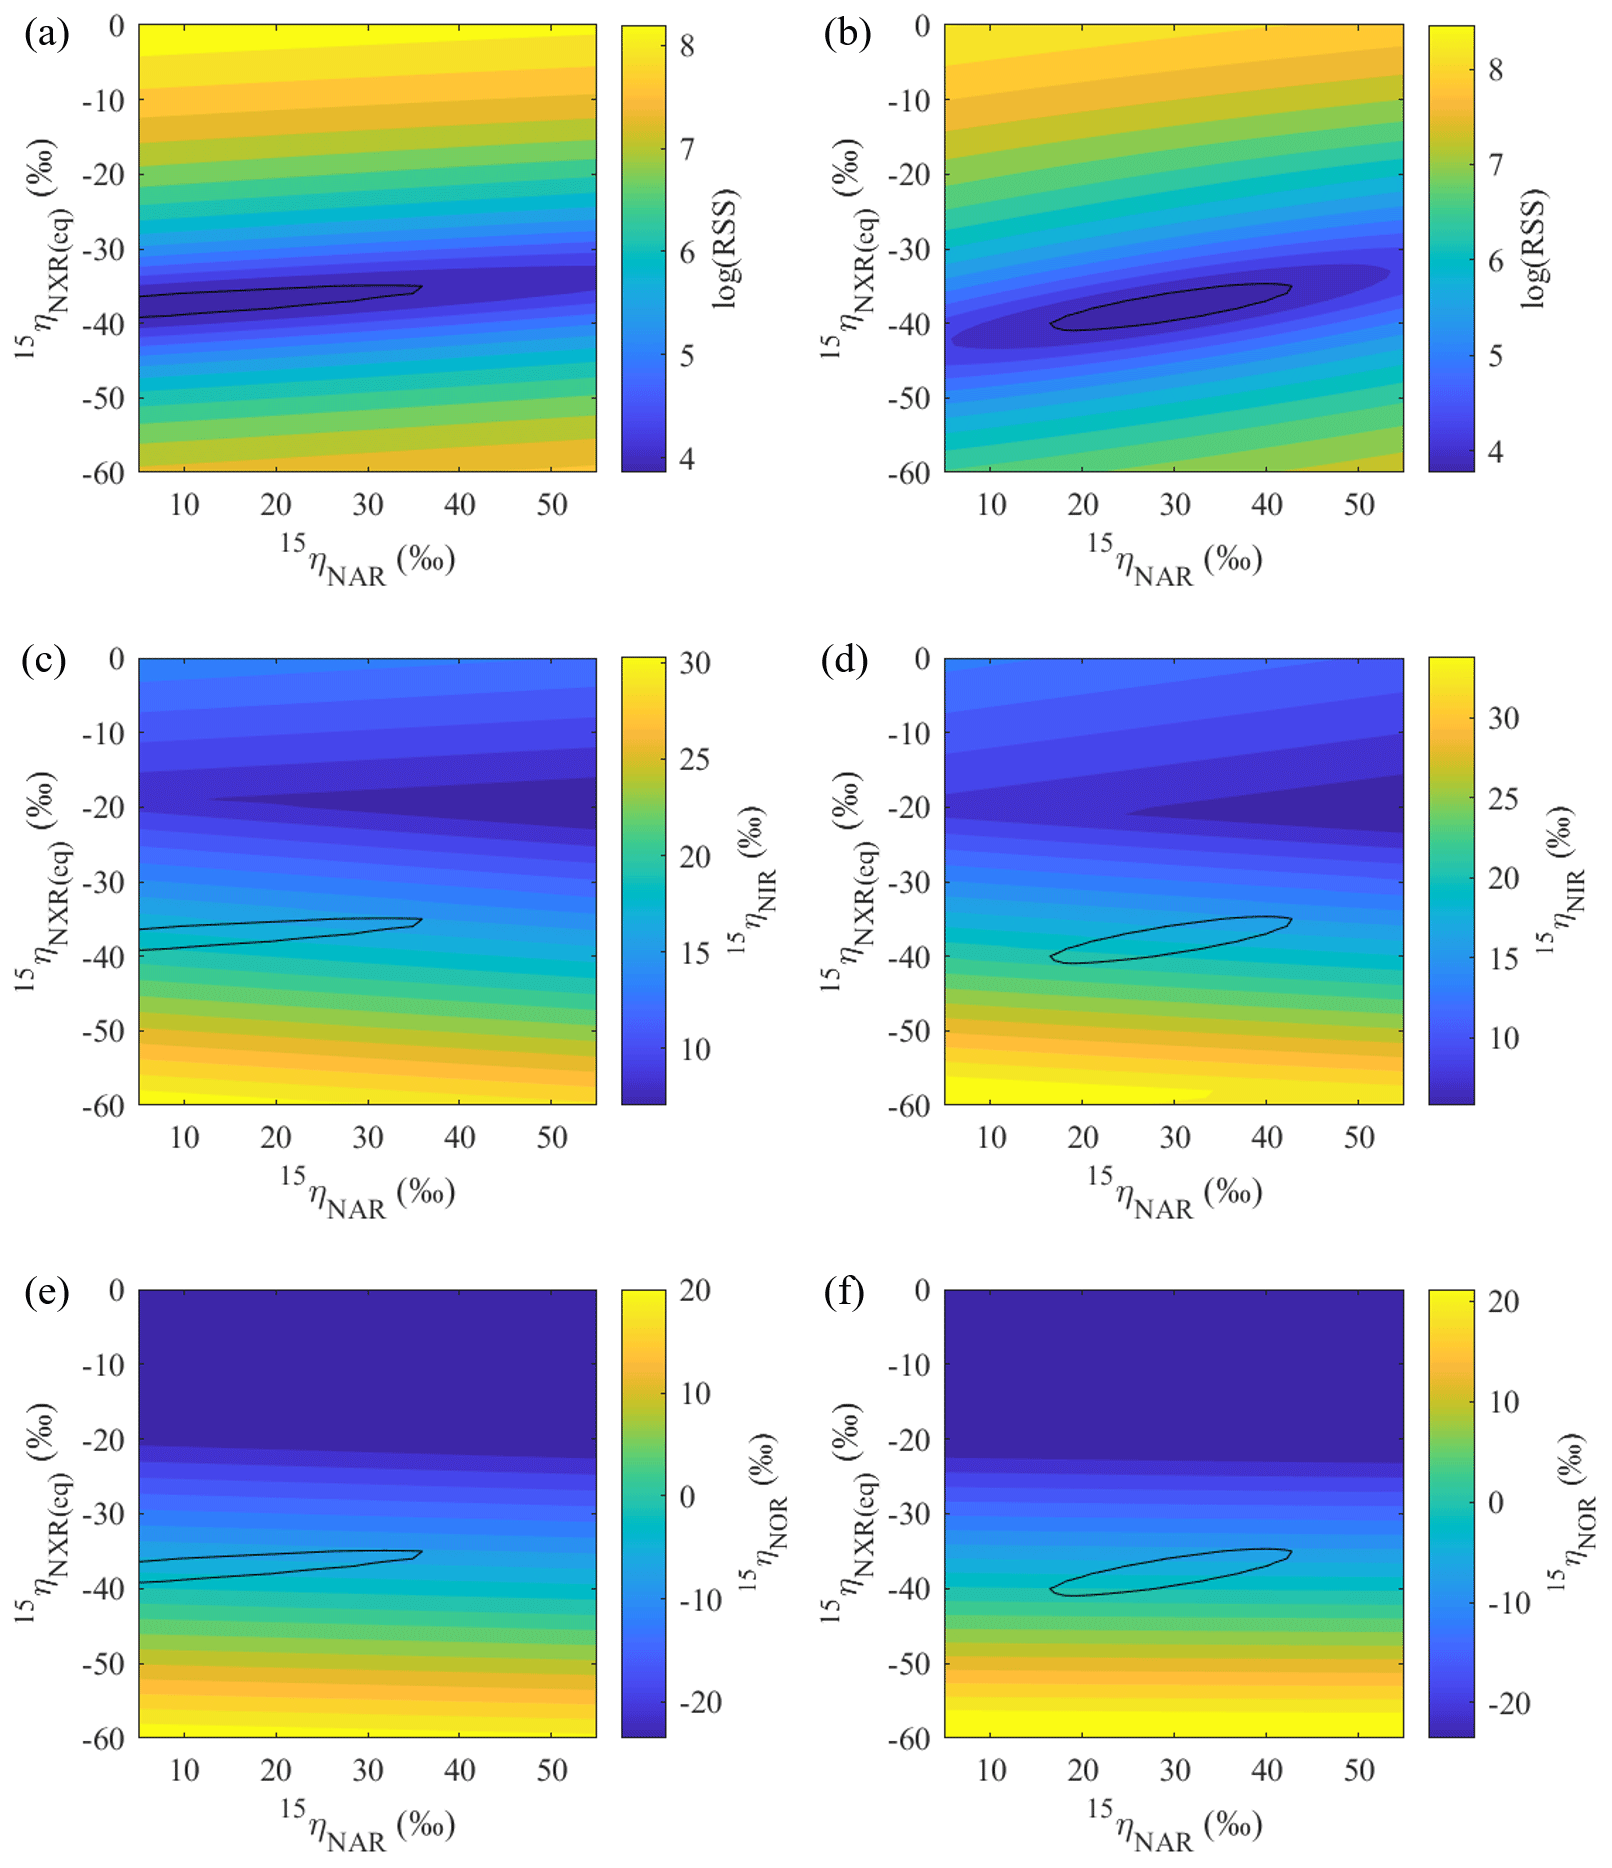
Figure 7Contour maps showing variations in error-weighted residual sum of squares (RSS) between simulated and measured δ15N values, modeled 15ηNIR, and modeled 15ηNOR as a function of prescribed 15ηNAR and 15ηNXR under the no-exchange (a, c, e) and complete-exchange (b, d, f) model scenarios. Bold contour lines encompass the best-fit models defined by the lower percentile 2.5 of the error-weighted RSS.
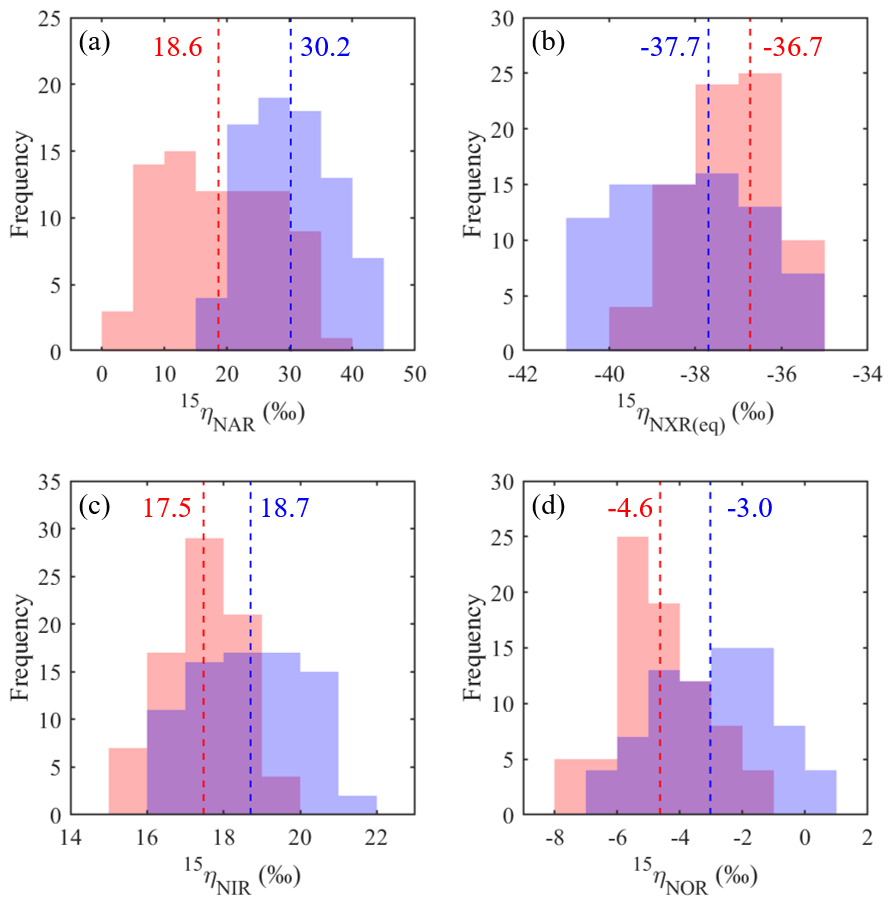
Figure 8Frequency distributions of the best-fit 15ηNAR (a), 15ηNXR(eq) (b), 15ηNIR (c), and 15ηNOR (d) under the no-exchange (red) and complete-exchange (blue) model scenarios. Dashed vertical lines denote the RSS-weighted mean 15η values from the best-fit models under the two model scenarios.
Based on the modeled denitrification rates and kNXR(b), the best-fit 15ηNXR(b) was confined to a narrow range from −40 ‰ to −35 ‰ (Fig. 7a and b) and was not sensitive to model scenarios for O equilibration between and H2O (Fig. 8b). While the best-fit 15ηNAR and 15ηNXR(b) were positively correlated, especially under the complete-exchange scenario (Fig. 7a and b), the best-fit 15ηNAR spanned a wide range (5 ‰ to 45 ‰) and was significantly lower under the no-exchange scenario (RSS-weighted mean: 19 ‰) relative to the complete-exchange scenario (RSS-weighted mean: 30 ‰) (Fig. 8a). On the other hand, the best-fit 15ηNIR (15 ‰ to 22 ‰) and 15ηNOR (−8 ‰ to 2 ‰) did not vary substantially and were similar between the two model scenarios (Figs. 7c–d and 8c–d). Under both model scenarios, the measured δ15N-, δ15N-, and δ15N-NO values can be well simulated using the RSS-weighted mean 15η values from the best-fit models (Fig. 2d to f). Specifically, the modeled difference between δ15N- and δ15N- values increased from about 29 ‰ at the beginning of the incubation to about 38 ‰ at the end of the incubation (Fig. 2d and e), whereas a constant δ15N offset of about 20 ‰ was revealed between the modeled δ15N- and δ15N-NO values (Fig. 2e and f). Therefore, the modeled 15η values and δ15N- dynamics reveal important new information for understanding the increasing over the anoxic incubation. During the early phase of the incubation, the N isotope partitioning between , , and NO was mainly controlled by denitrification and its associated isotope effects (i.e., 15ηNAR, 15ηNIR, and 15ηNOR). With the increasing accumulation of in the soil, the dominant control on the δ15N distribution shifted to the N isotope exchange between and , so that the difference between the δ15N- and δ15N- values was primarily determined by 15ηNXR(eq) (−40 ‰ to −35 ‰). The revealed positive correlation between the best-fit 15ηNAR and 15ηNXR(b) (Fig. 7a and b) and the significantly lower 15ηNAR under the no-exchange scenario (Fig. 8a) essentially reflect a trade-off between 15ηNAR and 15ηNXR(b) in controlling the δ15N difference between and – that is, when the interconversion between and is fast and the magnitude of 15ηNXR(eq) is large (i.e., very negative), only a small 15ηNAR is required to sustain the large δ15N difference between and over the course of the anoxic incubation.
The estimated 15ηNXR(eq) from the best-fit models is higher (i.e., closer to zero) than that derived from theoretical calculations and pure culture studies (−50 ‰ to −60 ‰) (Casciotti, 2009; Brunner et al., 2013). Given the heterogeneous distribution of substrates in soils, the lower absolute magnitude of the best-fit 15ηNXR(eq) may be due to the partial rate limitation by transport of ∕ to the active site of NXR. As such, the best-fit 15ηNXR(eq) should provide a conservative estimate of the intrinsic equilibrium isotope effect. Thus, the results from the anoxic incubation underscore the important, yet previously unrecognized, role of the reversible ∕ interconversion in controlling the δ15N dynamics of soil and its denitrification products. Substantial re-oxidation of under anoxic conditions seems paradoxical but is underpinned by the increasingly recognized high degree of metabolic versatility of NOB, including simultaneous oxidation of an organic substrate and , as well as parallel use of and O2 as electron acceptors (Koch et al., 2015). In the absence of O2, few electron acceptors exist at common environmental pH that have a higher redox potential than the ∕ pair (Wunderlich et al., 2013; Babbin et al., 2017). It is therefore likely that NOB would gain energy by performing the intracellular coupled oxidation of and reduction of to survive periods of O2 deprivation. Although anaerobic oxidation until now has been conclusively shown only in anoxic ocean water columns (Sun et al., 2017; Babbin et al., 2017) and aquatic sediments (Wunderlich et al., 2013), soils host a huge diversity of coexisting NOB (Le Roux et al., 2016) and the physiological flexibility of NOB beyond aerobic oxidation may contribute to the unexpected higher abundances and activities of NOB relative to AOB and AOA in agricultural soils (Høberg et al., 1996; Ke et al., 2013). Using the modified isotopologue-specific model, we demonstrate the possibility that large 15ηNAR can be an artifact of an isotopic equilibrium between and , occurring in connection with the bifunctional NXR enzyme. Therefore, effective expressions of 15ηNXR(eq) in concurrence with 15ηNAR may explain why 15ηNAR values estimated by some anoxic soil incubations (e.g., 25 ‰ to 65 ‰) are far larger than those reported by studies of denitrifying and -reducing bacterial cultures (e.g., 5 ‰ to 30 ‰) (Denk et al., 2017) and why the slope of δ18O- vs. δ15N- values during denitrification in many field studies was not constant and rarely close to unity as observed in pure denitrifying cultures (Granger and Wankely, 2016). Indeed, evidence for a reversible enzymatic pathway linking and under anoxic conditions has already been documented in previous soil studies (e.g., Kool et al., 2011; Lewicka-Szcebak et al., 2014), implying its wide occurrence in soils. More studies using soils from a broad range of environments are needed to pinpoint the exact mechanisms by which can be anaerobically oxidized in soils. To that end, Δ17O- can be used as a powerful benchmark for disentangling co-occurring reduction and re-oxidation.
The best-fit 15ηNIR (15 ‰ to 22 ‰) falls within the range derived in anoxic soil incubations (11 ‰ to 33 ‰) (Mariotti et al., 1982) and is consistent with results based on denitrifying bacteria carrying copper-containing NIR (22 ‰) (Martin and Casciotti, 2016). Under both model scenarios, the best-fit 15ηNOR (−8 ‰ to 2 ‰) is relatively small and more normal (i.e., 15η value closer to zero) than the bulk N isotope effect for NO reduction to N2O catalyzed by purified fungal NOR (P450nor) (−14 ‰) (Yang et al., 2014). During P450nor-catalyzed NO reduction, two NO molecules are sequentially bonded to the Fe active site of P450nor, and the observed inverse isotope effect was proposed to arise from a reversible bonding of the first NO molecule (Yang et al., 2014). To date, the N isotope effect for NO reduction catalyzed by bacterial NORs has not yet been quantified. Unlike P450nor, which contains only a single heme Fe at the active site, the active site of bacterial NORs has two Fe atoms (i.e., binuclear center). Therefore, three classes of mechanisms have been proposed for the two-electron reduction of NO by bacterial NORs, including sequential bonding of two NO molecules to either Fe catalytic center and simultaneous bonding of two NO molecules to both Fe centers (Kuypers et al., 2018; Lehnert et al., 2018). Although the precise catalytic mechanism remains uncertain, site-specific measurements of N isotopes in N2O (i.e., N2O isotopomers) produced from denitrifying bacteria indicate a similar magnitude for isotopic fractionations during the reduction of two NO molecules, in support of the simultaneous binding theory (Sutka et al., 2006; Yamazaki et al., 2014). Thus, if the bulk N isotope effect for bacterial NO reduction is higher than that for fungal NO reduction, the best-fit 15ηNOR may reflect a mixed contribution of bacteria and fungi to NO consumption during the anoxic incubation. Alternatively, the model-inferred 15ηNOR might reflect a balance between enzymatic and diffusion isotope effects, as has been previously demonstrated for N2O reduction in soil denitrification (Lewicka-Szczebak et al., 2014). Because diffusion would be expected to have a small and normal kinetic isotope effect, if reduction was limited by NO diffusion out of soil denitrifying sites, the estimated 15ηNOR would be shifted toward the isotope effect for NO diffusion. Diffusion might be particularly important in this study due to the flow-through condition during the anoxic incubation and the low solubility of NO, both of which favor gas diffusion while preventing re-entry of escaped NO to denitrifying cells. Thus, the small 15ηNOR inferred from the best-fit models is likely a combination of diverse NO reduction pathways in this agricultural soil, as well as limited expression of enzymatic isotope effects imposed by NO diffusion. Regardless, the empirical finding of this study suggests that due to the small 15ηNOR, the bulk δ15N values of denitrification-produced N2O should not be significantly altered by accumulation and diffusion of NO during denitrification.
4.3 NO source contribution and N isotope effects for NO production from oxidation under oxic and hypoxic conditions
The coupled decrease in concentrations and increase in concentrations (Fig. 3a and b) indicate active nitrification in both oxic and hypoxic incubations. Moreover, the two oxidation steps of nitrification were tightly coupled, resulting in no accumulation of in the soil. Because produced from nitrification has a zero Δ17O value, the active nitrification was also reflected in the progressive dilution of Δ17O- under both oxic and hypoxic conditions (Yu and Elliott, 2018). Based on the measured concentrations and isotopic composition of and , the isotopologue-specific model previously developed by Yu and Elliott (2018) was used to estimate the rates and net N isotope effects of net mineralization ( and ), gross oxidation to ( and ), and gross consumption ( and ) during the oxic and hypoxic incubations. As has been discussed above, this numerical model relies on the conservative nature of Δ17O- and its powerful application in tracing co-occurring nitrification and consumption (consisting of immobilization and denitrification in this case) (Yu and Elliott, 2018). Detailed model derivation, formulation, and optimization have been documented in Yu and Elliott (2018) and are also briefly summarized in Sect. S5. The modeling results based on the low-δ15N- treatment in the oxic incubation were reported by Yu and Elliott (2018). Here, we used data from all three δ15N- treatments to more robustly constrain the N transformation rates and net N isotope effects for each incubation experiment (i.e., oxic and hypoxic).
Table 2Means and 95 % confidence intervals of modeled gross N transformation rates, NO yields, and net N isotope effects in the oxic and hypoxic incubations.
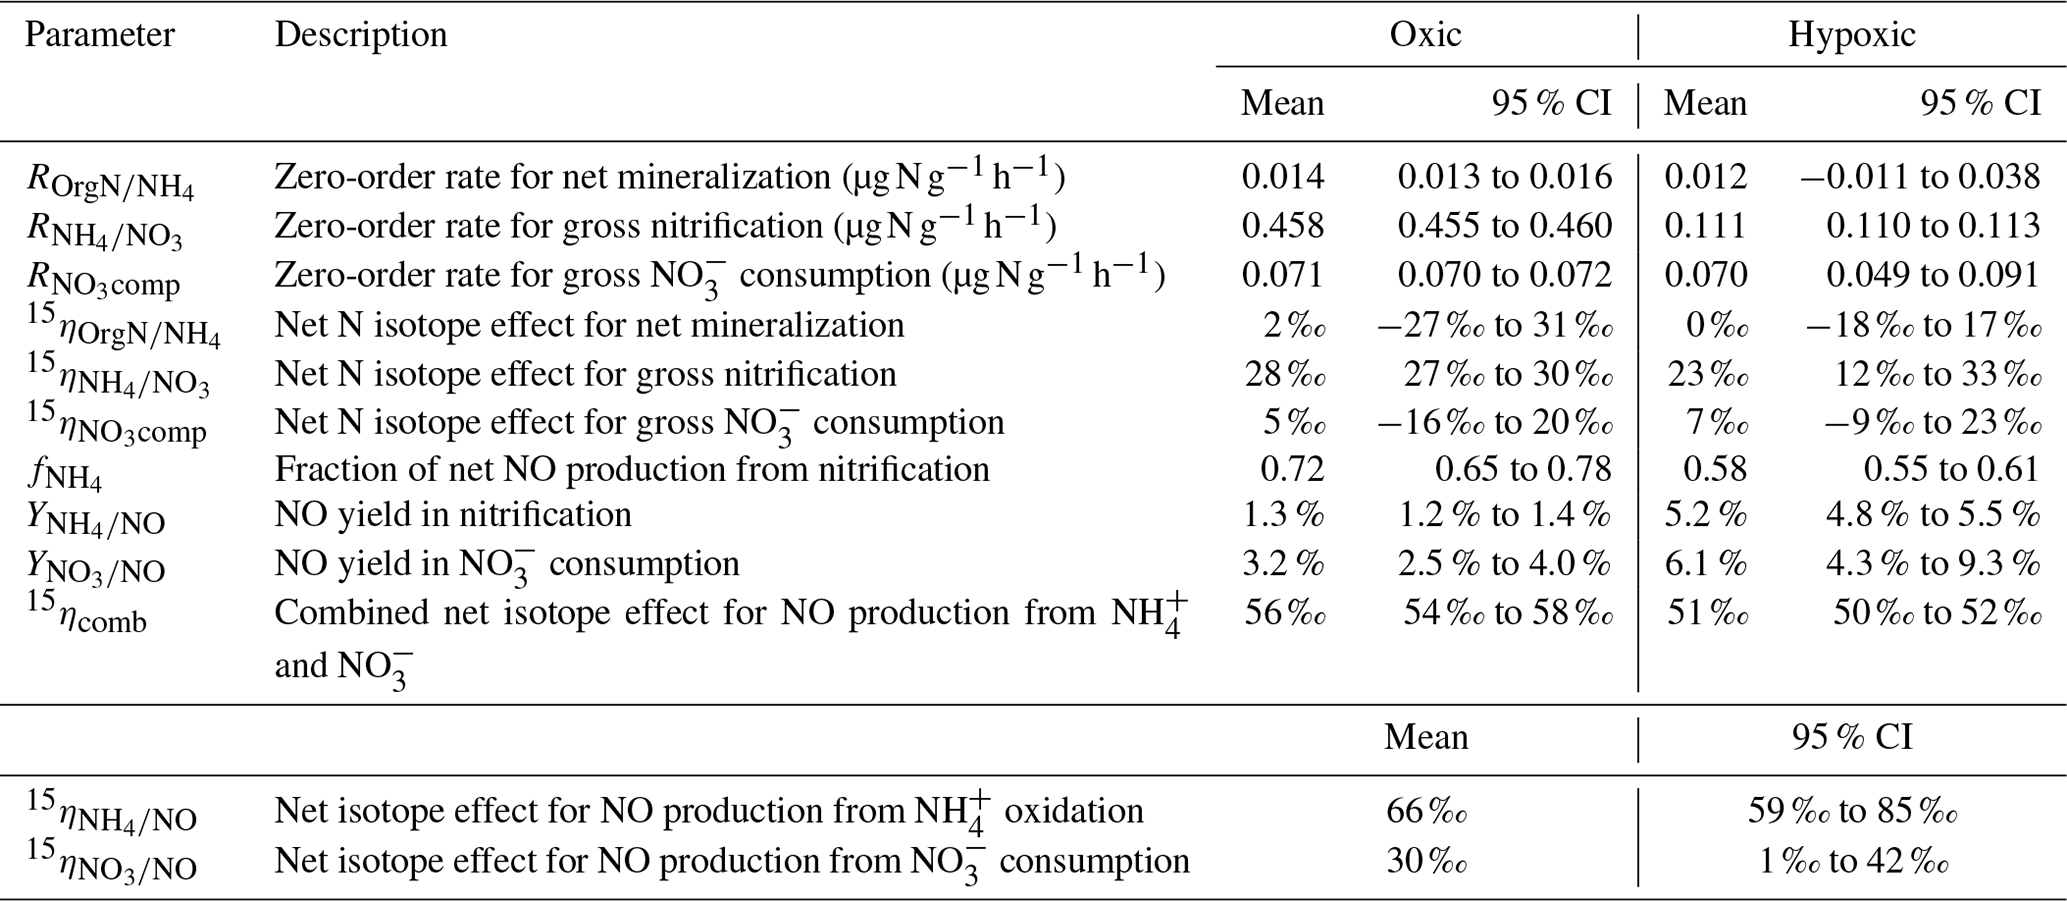
The modeling results are summarized in Table 2. Excellent agreement was obtained between the observed and simulated concentrations and isotopic composition of and for both oxic and hypoxic incubations (Fig. 3). can be well described by zero-order kinetics and was estimated to be 0.46 and 0.11 for the oxic and hypoxic incubations, respectively (Table 2). The lower in the hypoxic incubation indicates that nitrification was limited by low O2 availability. Under both oxic and hypoxic conditions, oxidation of to was associated with a large (23 ‰ to 28 ‰; Table 2), consistent with the N isotope effects for NH3 oxidation in pure cultures of AOB and AOA (e.g., 13 ‰ to 41 ‰) (Mariotti et al., 1981; Casciotti et al., 2003; Santoro and Casciotti, 2011). On the other hand, the estimated and were low and not significantly different between the two incubation experiments (Table 2). Nevertheless, while was only 16 % of in the oxic incubation, accounted for a much larger fraction (63 %) of in the hypoxic incubation, mainly due to the reduced under the low-O2 condition. Due to the low magnitude of and , the estimated and are associated with large errors and not significantly different from zero (Table 2).
By using three isotopically different fertilizers in parallel treatments, we are able to quantify the fractional contribution of oxidation to the measured net NO production (). Specifically, if NO was exclusively produced from soil , we would expect to see a constant δ15N difference between and NO across the three δ15N- treatments. In fact, the observed δ15N differences were not constant, and the slope of δ15N- vs. δ15N-NO was significantly lower than unity under both oxic and hypoxic conditions (Fig. 4). This suggests that sources other than oxidation contributed to the observed net NO production. Although NO can be produced by numerous microbial and abiotic processes (Medinets et al., 2015), we argue that the other major NO source is mostly likely related to consumption. This is based on the observation of high concentrations in both oxic and hypoxic incubations, as well as the estimated low (Table 2), which indicates a low availability of labile organic N – another potential substrate for NO production (Stange et al., 2013) – in this agricultural soil. Therefore, based on the assumption that oxidation and consumption were the two primary NO sources during the oxic and hypoxic incubations, a two-source isotope mixing model was used to relate the measured δ15N-NO values to the concurrently measured δ15N- and δ15N- values:
where and are the net isotope effects for NO production from oxidation and consumption, respectively. Rearranging Eq. (5) yields Eq. (6):
Equation (6) essentially dictates that the δ15N-NO values can be modeled from the δ15N- and δ15N- values using a hypothetical isotope effect for NO production from the combined soil and pool (15ηcomb; the last term in Eq. 6) that is a mixing of and controlled by (Eq. 7). Thus, assuming and 15ηcomb were constant in each incubation experiment, and 15ηcomb can be solved using the measured δ15N-NO, δ15N-, and δ15N- values from all three δ15N- treatments (Eq. 8). was estimated to be 0.72 under the oxic incubation (Table 2), indicating that 72 % of the measured net NO production was sourced from oxidation, with the remainder being ascribed to consumption. Under the hypoxic condition, the share of oxidation decreased to 58 % (Table 2). 15ηcomb was estimated to be 56 ‰ under the oxic condition and 51 ‰ under the hypoxic condition (Table 2). Combining the δ15N-based NO source partitioning with the estimated and , we further estimated NO yield in oxidation and consumption, respectively, and where the results are illustrated according to the classic “hole-in-the-pipe” (HIP) concept (Fig. 9) (Davidson and Verchot, 2000). NO yield was 1.3 % in oxidation and 3.2 % in consumption in the oxic incubation (Fig. 9; Table 2). Under the hypoxic condition, NO yield was increased to 5.2 % in oxidation and 6.1 % in consumption (Fig. 9; Table 2).

Figure 9Hole-in-the-pipe illustration of NO production from gross nitrification and consumption under oxic and hypoxic conditions. “OrgN” denotes organic nitrogen.
Most previous laboratory and field studies suggest that soil NO emissions are predominately driven by nitrification, whereas NO produced from denitrification is further reduced to N2O before it escapes to the soil surface (Kester et al., 1997; Skiba et al., 1997). The minor role of denitrification is largely deduced from the supposition that denitrification is activated only under wet soil conditions (Davidson and Verchot, 2000). However, based on our δ15N-based NO source partitioning, about 30 % of the net NO production was contributed by consumption under oxic condition, highlighting the potential importance of denitrification in driving soil NO emissions under conditions not typically conducive to its occurrence. There is growing evidence that extensive anoxic microsites can develop in otherwise well-aerated soils due to micro-scale variability of O2 demand and soil texture-dependent gas diffusion limitations (Keiluweit et al., 2018). Although we would not predict high rates of heterotrophic respiration in this agricultural soil with low organic carbon, it is possible that rapid O2 consumption by nitrification may outpace O2 supply through diffusion in soil microsites, fostering development of anoxic niches in close association with nitrification hot spots (Kremen et al., 2005). Based on 15N labeling and direct 15NO measurements using a gas chromatograph–quadrupole mass spectrometer, Russow et al. (2009) demonstrated that nitrification contributed about 70 % of net NO production in a well-aerated, -fertilized silt loam, in strong agreement with our results based on natural-abundance δ15N measurements. An even lower contribution to NO production, e.g., 26 % to 44 %, has been reported for nitrification in organic, N-rich forest soils incubated under oxic conditions (Stange et al., 2013). The persistence of denitrifying microsites in the studied soil is further corroborated by the nearly doubled net NO production from consumption in the hypoxic incubation (Fig. 9). Importantly, the actual NO yield in denitrification might be much higher than those estimated for gross consumption during the oxic and hypoxic incubations (i.e., 3.2 % and 6.1 %), as denitrification occurring in anoxic niches might only comprise a small fraction of the estimated .
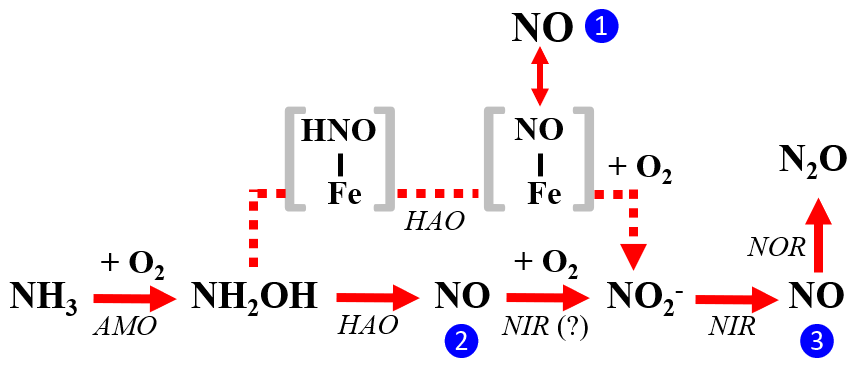
Figure 10The three enzymatic pathways for NO production during NH3 oxidation to by AOB: the NH2OH obligatory intermediate pathway is indicated by blue circle 1, the NH2OH∕NO obligatory intermediate pathway is indicated by blue circle 2, and the nitrifier-denitrification pathway is indicated by blue circle 3. Square brackets enclose proposed enzyme-bound intermediates [HNO-Fe] and [NO-Fe] of the NH2OH obligatory intermediate pathway. The role of AOB-encoded nitrite reductase (NIR) in catalyzing NO oxidation to in the NH2OH∕NO obligatory intermediate pathway is hypothetical.
Interestingly, while was significantly lower in the hypoxic incubation, the net NO production from oxidation was similar between the two incubation experiments, indicating a higher NO yield in nitrification when O2 availability became limited (Fig. 9). However, mechanisms underlying the differential NO yield in nitrification are difficult to elucidate owing to the high complexity of biochemical pathways of NO production by AOB and AOA. In AOB, the prevailing view of NH3 oxidation is that it occurs via a two-step enzymatic process, involving hydroxylamine (NH2OH) as an obligatory intermediate (Fig. 10). The first step is catalyzed by NH3 monooxygenase (AMO), which uses copper and O2 to hydroxylate NH3 to NH2OH. Next, a multiheme enzyme, NH2OH oxidoreductase (HAO), catalyzes the four-electron oxidation of NH2OH to via enzyme-bound nitroxyl ([HNO-Fe]) and nitrosyl ([NO-Fe]) intermediates (Lehnert et al., 2018) (Fig. 10). Under this NH2OH obligate intermediate model, NO emission was proposed to result from dissociation of NO from the enzyme-bound nitrosyl complex under high-NH3 and/or low-O2 conditions (Fig. 10) (Hooper et al., 2004; Beeckman et al., 2018). However, there is recent strong evidence that HAO generally catalyzes the three-electron oxidation of NH2OH to NO under both aerobic and anaerobic conditions; the HAO-produced NO is further oxidized to by an unknown enzyme (Caranto and Lancaster, 2017). In this way, NO would not be a byproduct of incomplete NH2OH oxidation but rather required as an obligatory intermediate for production (Fig. 10). It was further proposed that AOB-encoded copper-containing NIR may catalyze the final one-electron oxidation of NO to by operating in reverse (Lancaster et al., 2018). Under this NH2OH∕NO obligate intermediate model, high intracellular NO concentrations arise when the rate of NO production outpaces the rate of its oxidation to , leading to NO leakage from cells. Consequently, under O2 stress, decreases in the rate of NO oxidation to might be expected, and this may explain the observed increase in nitrification NO yield in the hypoxic incubation. Additionally, some AOB strains can produce NO in a process termed nitrifier denitrification, in which NO is produced through NIR-catalyzed reduction and can be further reduced to N2O by AOB-encoded NOR (Wrage-Mönning et al., 2018) (Fig. 10). Compared to AOB, the NH3 oxidation pathway in AOA remains unclear (Beeckman et al., 2018). The current model is that NH3 is first oxidized by an archaeal AMO to NH2OH and subsequently converted to by an unknown HAO counterpart (Kozlowski et al., 2016). NO seems to be mandatory for archaeal NH2OH oxidation and has been proposed to act as a co-substrate for the production (Kozlowski et al., 2016). Consequently, NO is usually produced and immediately consumed with tighter control in AOA than in AOB (Kozlowski et al., 2016).
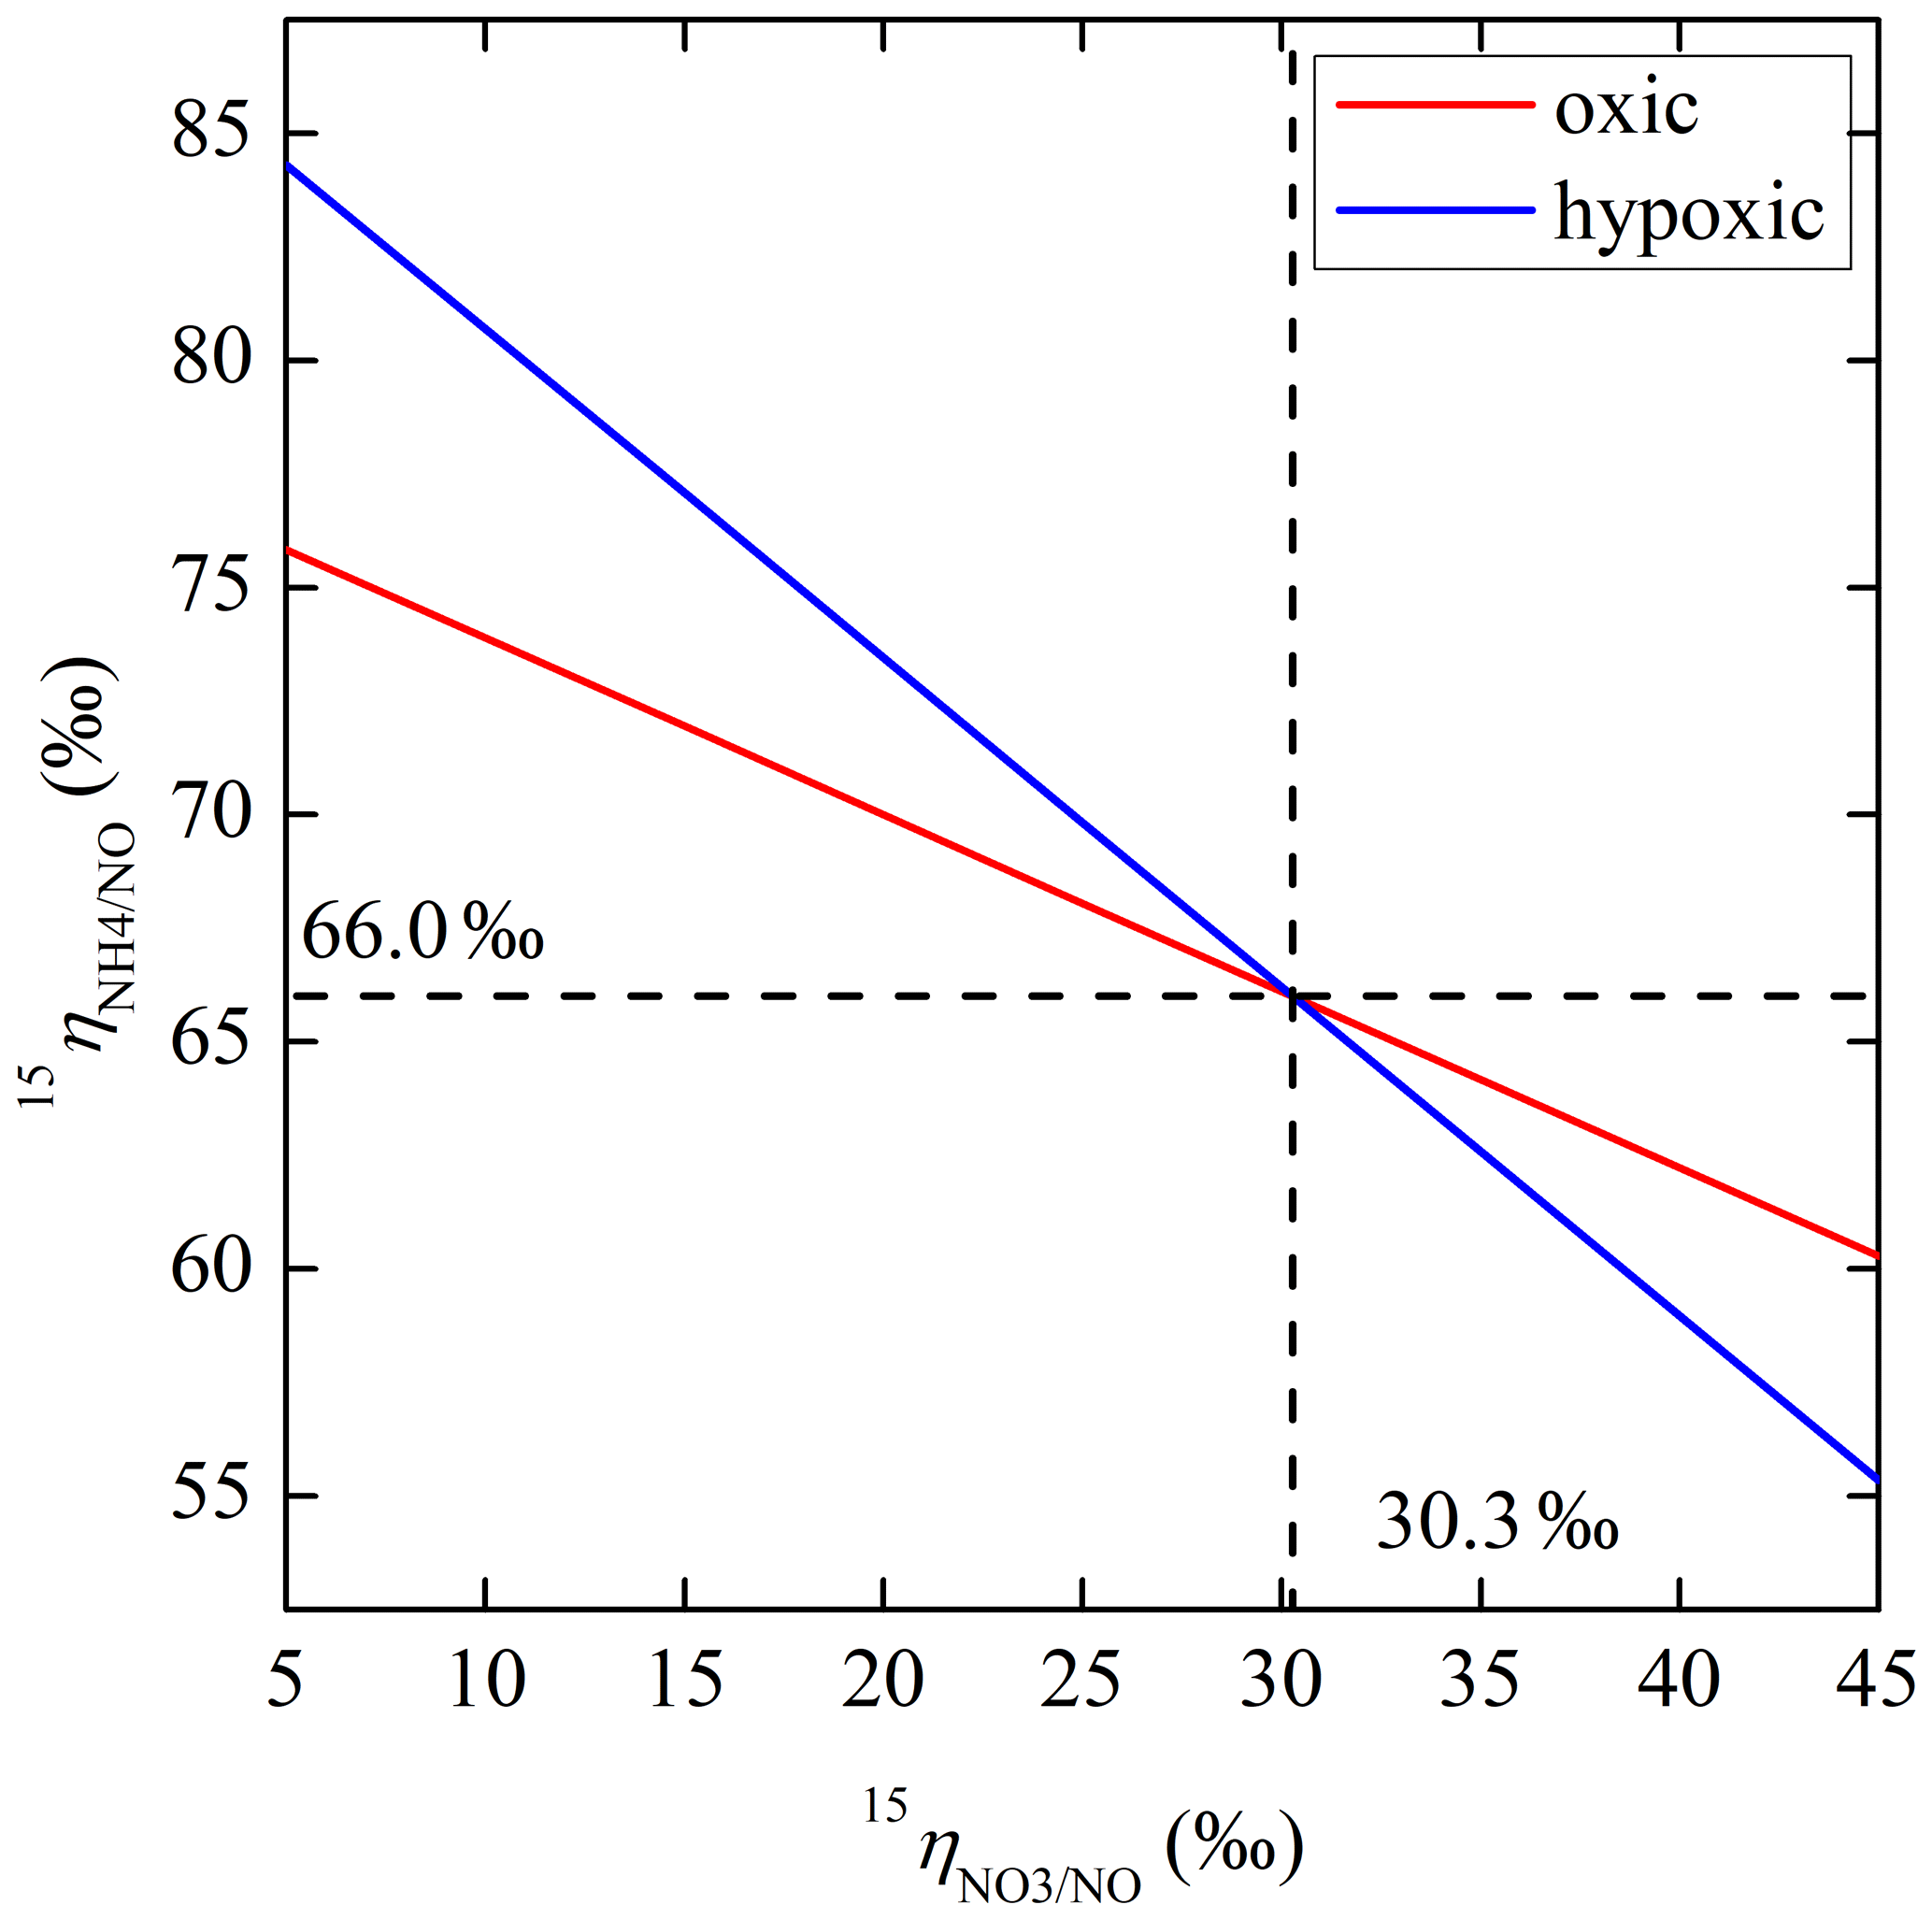
Figure 11Relative magnitude of net N isotope effects for NO production from oxidation () and consumption () in the oxic and hypoxic incubations.
To shed further light on the inner workings of net NO production from , we turn to constraining . Specifically, the inherent linkage between 15ηcomb, , and (Eq. 7) allows one to probe the relative magnitude of and using the determined 15ηcomb and . Given that was absent in the soil and that NO reduction in denitrification was likely associated with a small isotope effect (i.e., 15ηNOR; see above), in the oxic and hypoxic incubations should mainly reflect 15ηNAR. Thus, by assigning the entire possible range of the best-fit 15ηNAR derived in the anoxic incubation (5 ‰ to 45 ‰; Fig. 7a) to , was estimated to range from 60 ‰ to 76 ‰ in the oxic incubation and from 55 ‰ to 84 ‰ in the hypoxic incubation (Fig. 11). If we take one step further by assuming that both and were identical between the oxic and hypoxic incubations, then and could be uniquely determined to be 30 ‰ and 66 ‰, respectively (Fig. 11; Table 2). Thus, the relative magnitude of and provides insights into the differential relationship between δ15N- and δ15N-NO across the three δ15N- treatments in the oxic and hypoxic incubations (Fig. 4). In the oxic incubation, if we assume that ‰ and ‰, the δ15N of NO produced from oxidation under the low δ15N- treatment (about −60 ‰) would be much lower than the δ15N of NO from consumption (about −38 ‰). However, under the high-δ15N- treatment, the δ15N of -produced NO would increase to about −14 ‰ and be higher than δ15N values of -produced NO (about −26 ‰). Consequently, the production of NO from consumption would dilute the δ15N of total net NO production, pulling it to fall below the 1:1 line between the δ15N- and δ15N-NO values in Fig. 4. This dilution effect was more pronounced in the hypoxic incubation due to the lower (i.e., higher contribution of -produced NO) (Fig. 4).
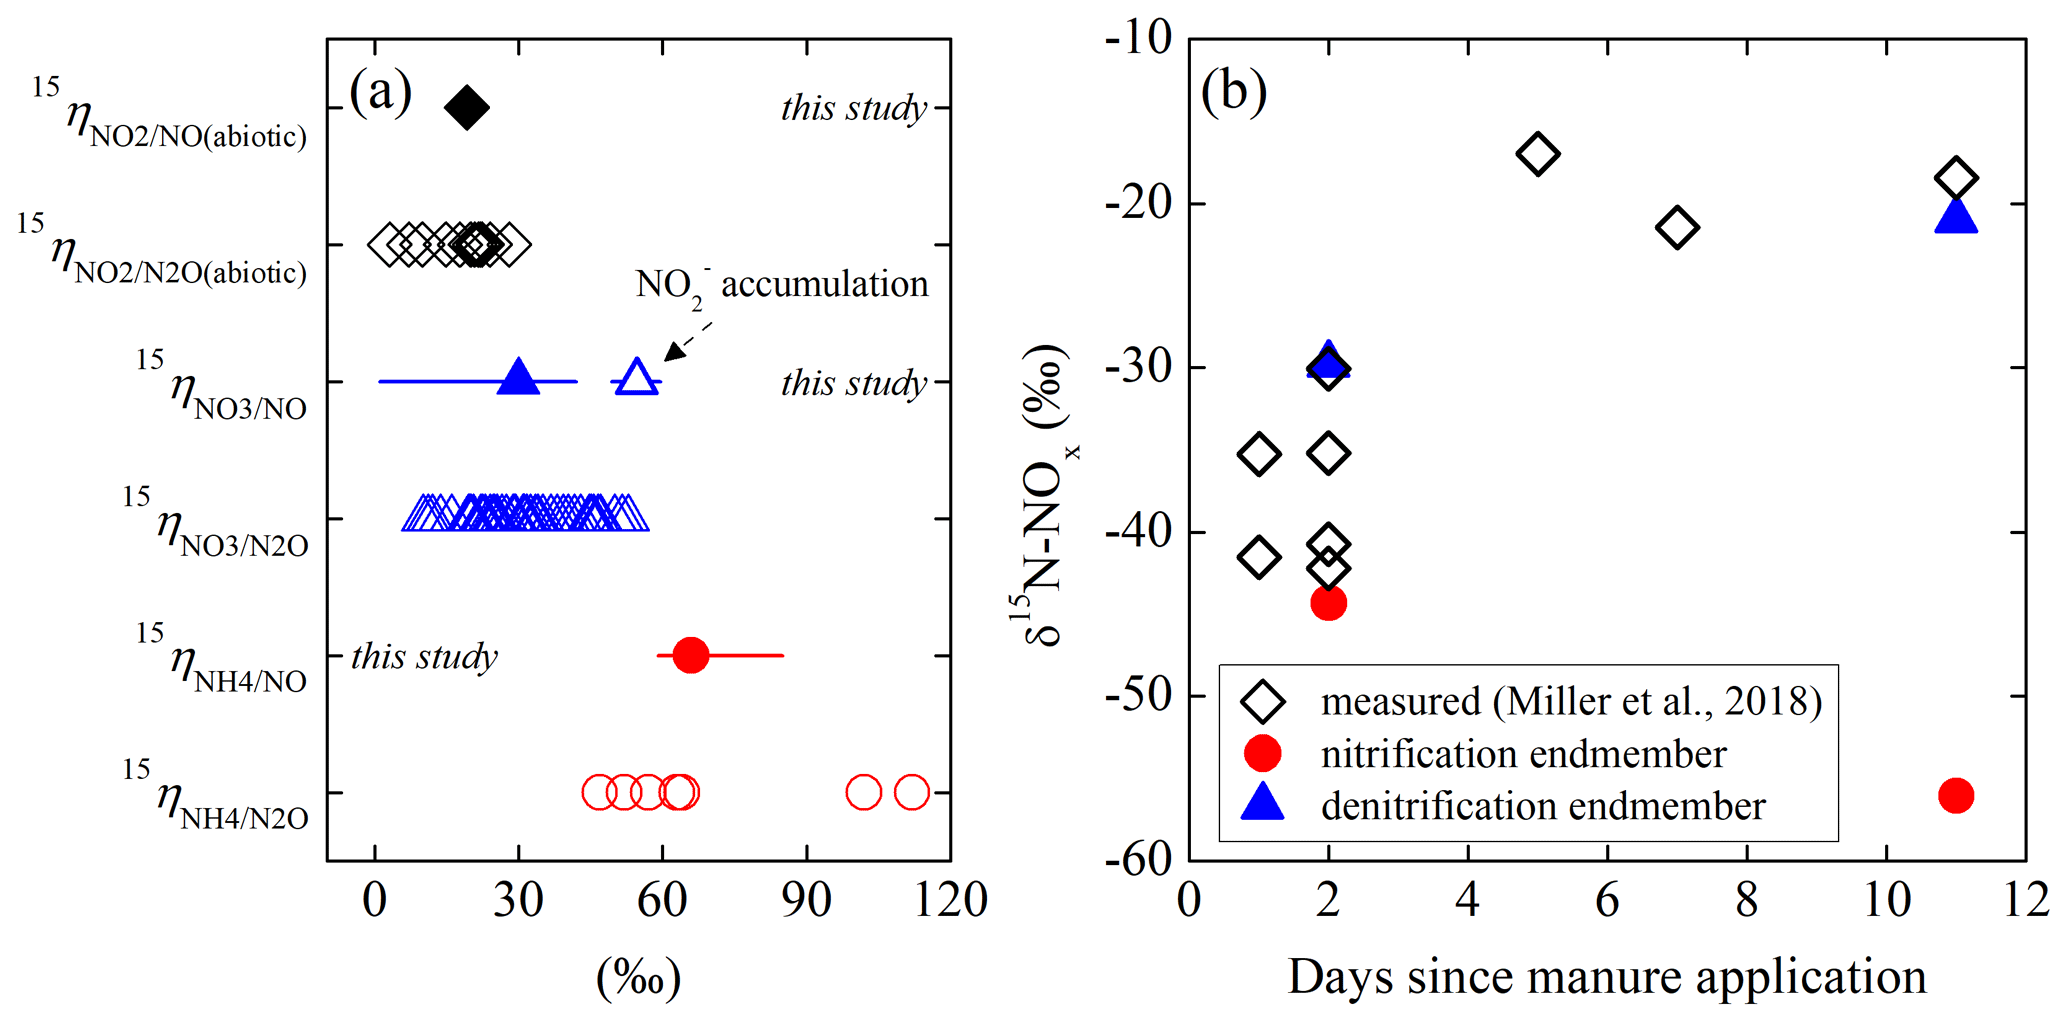
Figure 12(a) Comparison of net isotope effects for NO production estimated in this study to net isotope effects for N2O production reported in the literature. (b) Comparison of in situ δ15N of NOx emission from a manure-fertilized soil (reported by Miller et al., 2018) to nitrification and denitrification δ15N-NO end-members derived using the estimated net isotope effects for NO production in the oxic and hypoxic incubations.
Therefore, under either oxic or hypoxic condition, the net NO production from oxidation proceeded with a large . As NH3 oxidation to NH2OH was likely the rate-limiting step for the entire nitrification process, a fraction of the inferred large can be accounted for by the isotope effect for NH3 oxidation to NH2OH, which should be similar to the estimated (e.g., 23 ‰ to 28 ‰). The residual isotope effect, on the order of 40 ‰, must therefore stem from additional bond forming/breaking during net NO production in NH3 oxidation. This additional N isotope effect could be explained by reduction catalyzed by AOB-encoded NIR if NO was dominantly produced through the nitrifier-denitrification pathway (Fig. 10). However, provided that the two oxidation steps of nitrification were tightly coupled under both oxic and hypoxic conditions, it is unlikely that would accumulate to high enough intracellular concentrations to trigger nitrifier denitrification (Wrage-Mönning et al., 2018). Similarly, we would not expect any substantial isotope fractionations to result from accumulation of intracellular NH2OH or enzyme-bound intermediate species (e.g., [HNO-Fe] and [NO-Fe]). Thus, we are left with either a large and normal isotope effect for NO dissociation from its enzyme-bound precursor if NO production was mainly routed through the NH2OH obligate intermediate pathway or an inverse isotope effect associated with NO oxidation if NO itself was an obligatory intermediate required for production (Fig. 10). With respect to the first possibility, if NO dissociation from the Fe active site of HAO is mainly controlled by an equilibrium reaction between NO and enzyme-bound nitrosyl species, the forward and backward reactions may occur with distinctively different isotope effects, giving rise to an equilibrium isotope effect that favors partitioning of 14N to the dissociated NO. However, expression of this equilibrium isotope effect would be largely suppressed by limited isotope exchange between the two N pools due to the presumably transient presence of nitrosyl intermediate. Therefore, a partial expression of a large equilibrium isotope effect (e.g., >40 ‰) would be required to explain the residual N isotopic fractionation during NO production in NH3 oxidation. Alternatively, in regards to the second possibility, if we assume that the enzyme-catalyzed oxidation of NO to proceeds via an enzyme-bound transition state and that the transition state contains the newly formed N-O bond, an inverse isotope effect may result from more strongly bonded N atom in the transition state, for which there is precedent in the literature (i.e., oxidation to ; see above) (Casciotti, 2009). Moreover, the small NO yield observed in the oxic and hypoxic incubations would indicate a large consumption of NO (i.e., 95 % to 99 %). With this high level of NO consumption, an inverse isotope effect on the order of −13 ‰ to −9 ‰ would be sufficient to account for the residual isotope effect for net NO production from . This inferred isotope effect is of similar magnitude to that reported for NXR-catalyzed oxidation (i.e., −13 ‰) (Casciotti, 2009). However, to unambiguously determine the mechanisms giving rise to the large , further biochemical analyses will be needed to clarify the enzymatic pathways responsible for NO production by AOB and AOA under relevant soil conditions. Nonetheless, the results presented here provide evidence that production of NO with low δ15N values may be a characteristic feature of nitrification in -fertilized agricultural soils under both oxic and hypoxic conditions.
In this study, the net production rates and δ15N values of NO were measured under a range of controlled laboratory conditions. The results provide insights into how stable N and O isotopes can be effectively used to understand the reaction mechanisms by which NO is produced and consumed in soils. While nitrification is the commonly cited source for NO emissions from agricultural soils, the measured net NO production rates in this study highlight the great potential of abiotic reduction and denitrification in driving NO production and release from agricultural soils and thus should not be overlooked when attributing field soil NO emissions. Indeed, because NO is a direct product or free intermediate in these processes, abiotic reduction and denitrification may inherently have a larger NO yield – that is, a bigger “hole” for NO leaking in the HIP model (Davidson and Verchot, 2000). We conclude that the isotope-based measurement and modeling framework established in this work is a powerful tool to bridge NO production with gross N transformation processes in agricultural soils, thereby providing a quantitative way to parameterize the HIP model for modeling soil NO emissions under dynamic environmental conditions (e.g., varying temperature and soil moisture content).
The differences in the net isotope effects for NO production from abiotic reduction, denitrification, and nitrification revealed in this study (Fig. 12a) suggest that δ15N-NO is a useful tracer for informing NO production pathways in agricultural soils. Specifically, the relatively small magnitude of indicates that δ15N-NO is particularly useful in probing the relative importance of NO production from abiotic vs. microbial reactions, lending support to our previous finding based on rewetting of a dry forest soil that high δ15N values of rewetting-triggered NO pulses were mainly contributed by chemical reduction (Yu and Elliott, 2017). Moreover, the large revealed in the oxic and hypoxic incubations provides an empirical basis for discerning the relative role of oxidation and reduction in driving soil NO production and emissions. Interestingly, comparing the measured net isotope effects for NO production from abiotic reduction, denitrification, and nitrification with those previously quantified for N2O production in soil incubations and pure cultures (Denk et al., 2017, and references therein; Jones et al., 2015; Wei et al., 2019), a similar pattern is evident across these three common production pathways for NO and N2O (Fig. 12a). This similarity reflects the intimate connection between NO and N2O turnover within each reaction pathway and provides strong evidence that simultaneous δ15N-NO and δ15N-N2O measurements can potentially yield unprecedented insights into the sources and processes controlling NO and N2O emissions from agricultural soils. However, on the other hand, the demonstrated reaction reversibility between and under anoxic conditions is a new complication that needs to be considered when using δ15N to examine soil NO and N2O emissions. As is often accumulated in agricultural soils following fertilizer application (Venterea et al., 2020), expression of the equilibrium isotope effect between and in redox-dynamic surface soils may render δ15N-NO and δ15N-N2O less useful in tracing NO and N2O sources. Given that high soil concentrations can trigger emission pulses of NO and N2O (Venterea et al., 2020), accumulation should be taken as a critical sign for careful evaluation of the reaction complexity underlying δ15N distributions among the denitrification products.
To further assess the potential utility of δ15N measurements in source partitioning NO emissions from agricultural soils, we applied the estimated N isotope effects to the in situ δ15N-NOx measurements reported by Miller et al. (2018). Importantly, the soil used in this study was collected from the same farm where Miller et al. (2018) conducted their field measurements (e.g., the USDA-managed corn–soybean field in central Pennsylvania, USA). Hence, the derived isotope effects may be particularly relevant to their reported δ15N-NOx values due to similar soil microbial community structures. Because accumulation was not reported by Miller et al. (2018), we consider nitrification and denitrification to be the primary sources for the observed NO (and, to a much lesser extent, NO2) emissions. Therefore, the and values derived in the oxic and hypoxic incubations (i.e., 66 ‰ and 30 ‰, respectively) were used in combination with the δ15N values of soil and reported in Miller et al. (2018) to calculate the δ15N end-members for NO produced from oxidation and reduction. As shown in Fig. 12b, comparing the in situ δ15N-NOx measurements with the estimated isotopic end-members provides a compelling picture of soil NO dynamics following manure application. Notably, the initial low δ15N-NOx values reported by Miller et al. (2018) might indicate a mixed contribution of oxidation and reduction to soil NOx emissions (Fig. 12b). Nevertheless, the increase in δ15N-NOx values measured 4 to 11 d after manure application may reflect a shift in the dominant NO production pathway to denitrification, in line with the increasing accumulation of supplied by nitrification in the soil (Miller et al., 2018). Although data-limited, this example provides promising initial evidence for the ability of multi-species δ15N measurements to provide mechanistic information on soil NO dynamics and its environmental controls. Further experimental constraints on soil δ15N-NO variations can build on the measurement and modeling framework developed in this study to advance our understanding of soil NO source contributions over a wide range of environmental conditions and soil types.
The datasets generated for this study and documentation about the equations and parameters of the isotopologue-specific models are available in the Supplement. The MATLAB codes for the isotopologue-specific models are available at https://github.com/zjyuuiuc/Isotopologue-specific-models (last access: 1 February 2021) and at https://doi.org/10.5281/zenodo.4495715 (Yu, 2020).
The supplement related to this article is available online at: https://doi.org/10.5194/bg-18-805-2021-supplement.
ZY and EME designed the study; ZY conducted the experiments and analyzed the data; ZY and EME wrote the paper.
The authors declare that they have no conflict of interest.
The authors thank Curtis Dell (USDA-ARS) for helping with the field soil sampling and Katherine Redling, Vivian Feng, Madeline Ellgass, and Madeline Gray (University of Pittsburgh) for assistance with the isotopic analyses.
This work was supported by a National Science Foundation CAREER award (grant no. 1253000) to Emily M. Elliott.
This paper was edited by Andreas Richter and reviewed by Wolfgang Wanek and one anonymous referee.
Almaraz, M., Bai, E., Wang, C., Trousdell, J., Conley, S., Faloona, I., and Houlton, B. Z.: Agriculture is a major source of NOx pollution in California, Sci. Adv., 4, 3477, https://doi.org/10.1126/sciadv.aao3477, 2018.
Babbin, A. R., Peters, B. D., Mordy, C. W., Widner, B., Casciotti, K. L., and Ward, B. B.: Multiple metabolisms constrain the anaerobic nitrite budget in the Eastern Tropical South Pacific, Global Biogeochem. Cy., 31, 258–271, 2017.
Beeckman, F., Motte, H., and Beeckman, T.: Nitrification in agricultural soils: impact, actors and mitigation, Curr. Opin. Biotech., 50, 166–173, 2018.
Bock, E., Wilderer, P. A., and Freitag, A.: Growth of Nitrobacter in the absence of dissolved oxygen, Water Res., 22, 245–250, 1988.
Brunner, B., Contreras, S., Lehmann, M. F., Matantseva, O., Rollog, M., Kalvelage, T., Klockgether, G., Lavik, G., Jetten, M. S., Kartal, B., and Kuypers, M. M.: Nitrogen isotope effects induced by anammox bacteria, P. Natl. Acad. Sci. USA, 110, 18994–18999, 2013.
Buchwald, C. and Casciotti, K. L.: Oxygen isotopic fractionation and exchange during bacterial nitrite oxidation, Limnol. Oceanogr., 55, 1064–1074, 2010.
Buchwald, C., Grabb, K., Hansel, C. M., and Wankel, S. D.: Constraining the role of iron in environmental nitrogen transformations: dual stable isotope systematics of abiotic reduction by Fe (II) and its production of N2O, Geochim. Cosmochim. Ac., 186, 1–12, 2016.
Buchwald, C., Homola, K., Spivack, A. J., Estes, E. R., Murray, R. W., and Wankel, S. D.: Isotopic constraints on nitrogen transformation rates in the deep sedimentary marine biosphere, Global Biogeochem. Cy., 32, 1688–1702, 2018.
Buessecker, S., Tylor, K., Nye, J., Holbert, K. E., Urquiza Muñoz, J. D., Glass, J. B., Hartnett, H. E., and Cadillo-Quiroz, H.: Effects of sterilization techniques on chemodenitrification and N2O production in tropical peat soil microcosms, Biogeosciences, 16, 4601–4612, https://doi.org/10.5194/bg-16-4601-2019, 2019.
Calvert, J. G., Lazrus, A., Kok, G. L., Heikes, B. G., Walega, J. G., Lind, J., and Cantrell, C. A.: Chemical mechanisms of acid generation in the troposphere, Nature, 317, 27–35, 1985.
Caranto, J. D. and Lancaster, K. M.: Nitric oxide is an obligate bacterial nitrification intermediate produced by hydroxylamine oxidoreductase, P. Natl. Acad. Sci. USA, 114, 8217–8222, 2017.
Casciotti, K. L.: Inverse kinetic isotope fractionation during bacterial nitrite oxidation, Geochim. Cosmochim. Ac., 73, 2061–2076, 2009.
Casciotti, K. L., Sigman, D. M., Hastings, M. G., Böhlke, J. K., and Hilkert, A.: Measurement of the oxygen isotopic composition of nitrate in seawater and freshwater using the denitrifier method, Anal. Chem., 74, 4905–4912, 2002.
Casciotti, K. L., Sigman, D. M., and Ward, B. B.: Linking diversity and stable isotope fractionation in ammonia-oxidizing bacteria, Geomicrobiol. J., 20, 335–353, 2003.
Casciotti, K. L., Böhlke, J. K., McIlvin, M. R., Mroczkowski, S. J., and Hannon, J. E.: Oxygen isotopes in nitrite: analysis, calibration, and equilibration, Anal. Chem., 79, 2427–2436, 2007.
Crutzen, P. J.: The role of NO and NO2 in the chemistry of the troposphere and stratosphere, Annu. Rev. Earth Pl. Sc., 7, 443–472, 1979.
Davidson, E. A.: The contribution of manure and fertilizer nitrogen to atmospheric nitrous oxide since 1860, Nat. Geosci., 2, 659–662, 2009.
Dähnke, K. and Thamdrup, B.: Isotope fractionation and isotope decoupling during anammox and denitrification in marine sediments, Limnol. Oceanogr., 61, 610–624, 2016.
Dale, A. W., Sommer, S., Ryabenko, E., Noffke, A., Bohlen, L., Wallmann, K., Stolpovsky, K., Greinert, J., and Pfannkuche, O.: Benthic nitrogen fluxes and fractionation of nitrate in the Mauritanian oxygen minimum zone (Eastern Tropical North Atlantic), Geochim. Cosmochim. Ac., 134, 234–256, 2014.
Davidson, E. A. and Verchot, L. V.: Testing the hole-in-the-pipe model of nitric and nitrous oxide emissions from soils using the TRAGNET database, Global Biogeochem. Cy., 14, 1035–1043, 2000.
Denk, T. R., Mohn, J., Decock, C., Lewicka-Szczebak, D., Harris, E., Butterbach-Bahl, K., Kiese, R., and Wolf, B.: The nitrogen cycle: A review of isotope effects and isotope modeling approaches, Soil Biol. Biochem., 105, 121–137, 2017.
Felix, D. J., Elliott, E. M., Gish, T. J., McConnell, L. L., and Shaw, S. L.: Characterizing the isotopic composition of atmospheric ammonia emission sources using passive samplers and a combined oxidation-bacterial denitrifier approach, Rapid Commun. Mass Sp., 27, 2239–2246, 2013.
Firestone, M. K. and Davidson, E. A.: Microbiological basis of NO and N2O production and consumption in soil, in: Exchange of trace gases between terrestrial ecosystems and the atmosphere, edited by: Andreae, M. O., Schimel, D. S., and Robertson, G. P., John Wiley and Sons Ltd, Berlin, 7–21, 1989.
Freitag, A., Rudert, M., and Bock, E.: Growth of Nitrobacter by dissimilatoric nitrate reduction, FEMS Microbiol. Lett., 48, 105–109, 1987.
Friedman, S. H., Massefski, W., and Hollocher, T. C.: Catalysis of intermolecular oxygen atom transfer by nitrite dehydrogenase of Nitrobacter agilis, J. Biol. Chem., 261, 10538–10543, 1986.
Fry, B.: Stable Isotope Ecology, Vol. 521, Springer, New York, 2006.
Galloway, J. N., Aber, J. D., Erisman, J. W., Seitzinger, S. P., Howarth, R. W., Cowling, E. B., and Cosby, B. J.: The nitrogen cascade, Bioscience, 53, 341–356, 2003.
Gaye, B., Nagel, B., Dähnke, K., Rixen, T., and Emeis, K. C.: Evidence of parallel denitrification and nitrite oxidation in the ODZ of the Arabian Sea from paired stable isotopes of nitrate and nitrite, Global Biogeochem. Cy., 27, 1059–1071, 2013.
Granger, J. and Sigman, D. M.: Removal of nitrite with sulfamic acid for nitrate N and O isotope analysis with the denitrifier method, Rapid Commun. Mass Sp., 23, 3753–3762, 2009.
Granger, J. and Wankel, S. D.: Isotopic overprinting of nitrification on denitrification as a ubiquitous and unifying feature of environmental nitrogen cycling, P. Natl. Acad. Sci. USA, 113, E6391–E6400, 2016.
Granger, J., Sigman, D. M., Lehmann, M. F., and Tortell, P. D.: Nitrogen and oxygen isotope fractionation during dissimilatory nitrate reduction by denitrifying bacteria, Limnol. Oceanogr., 53, 2533–2545, 2008.
Heil, J., Vereecken, H., and Brüggemann, N.: A review of chemical reactions of nitrification intermediates and their role in nitrogen cycling and nitrogen trace gas formation in soil, Eur. J. Soil Sci., 67, 23–39, 2016.
Højberg, O., Binnerup, S. J., and Sørensen, J.: Potential rates of ammonium oxidation, nitrite oxidation, nitrate reduction and denitrification in the young barley rhizosphere, Soil Biol. Biochem., 28, 47–54, 1996.
Homyak, P. M., Vasquez, K. T., Sickman, J. O., Parker, D. R., and Schimel, J. P.: Improving nitrite analysis in soils: Drawbacks of the conventional 2 M KCl extraction, Soil Sci. Soc. Am. J., 79, 1237–1242, 2015.
Hooper, A. B., Arciero, D., Bergmann, D., and Hendrich, M. P.: The Oxidation of Ammonia as an Engergy Source in Bacteria, in: Respiration in archaea and bacteria, Springer, Dordrecht, 121–147, 2004.
Hudman, R. C., Russell, A. R., Valin, L. C., and Cohen, R. C.: Interannual variability in soil nitric oxide emissions over the United States as viewed from space, Atmos. Chem. Phys., 10, 9943–9952, https://doi.org/10.5194/acp-10-9943-2010, 2010.
Hudman, R. C., Moore, N. E., Mebust, A. K., Martin, R. V., Russell, A. R., Valin, L. C., and Cohen, R. C.: Steps towards a mechanistic model of global soil nitric oxide emissions: implementation and space based-constraints, Atmos. Chem. Phys., 12, 7779–7795, https://doi.org/10.5194/acp-12-7779-2012, 2012.
Jones, L. C., Peters, B., Lezama Pacheco, J. S., Casciotti, K. L., and Fendorf, S.: Stable isotopes and iron oxide mineral products as markers of chemodenitrification, Environ. Sci. Technol., 49, 3444–3452, 2015.
Kaiser, J., Hastings, M. G., Houlton, B. Z., Röckmann, T., and Sigman, D. M.: Triple oxygen isotope analysis of nitrate using the denitrifier method and thermal decomposition of N2O, Anal. Chem., 79, 599–607, 2007.
Kaneko, M. and Poulson, S. R.: The rate of oxygen isotope exchange between nitrate and water, Geochim. Cosmochim. Ac., 118, 148–156, 2013.
Kang, H., Stanley, E. H., and Park, S. S.: A sensitive method for the measurement of ammonium in soil extract and water, Commun. Soil Sci. Plan., 34, 2193–2201, 2003.
Ke, X., Angel, R., Lu, Y., and Conrad, R.: Niche differentiation of ammonia oxidizers and nitrite oxidizers in rice paddy soil, Environ. Microbiol., 15, 2275–2292, 2013.
Keiluweit, M., Gee, K., Denney, A., and Fendorf, S.: Anoxic microsites in upland soils dominantly controlled by clay content, Soil Biol. Biochem., 118, 42–50, 2018.
Kemeny, P. C., Weigand, M. A., Zhang, R., Carter, B. R., Karsh, K. L., Fawcett, S. E., and Sigman, D. M.: Enzyme-level interconversion of nitrate and nitrite in the fall mixed layer of the Antarctic Ocean, Global Biogeochem. Cy., 30, 1069–1085, 2016.
Kester, R. A., Meijer, M. E., Libochant, J. A., Boer, W. D., and Laanbroek, H. J.: Contribution of nitrification and denitrification to the NO and N2O emissions of an acid forest soil, a river sediment and a fertilized grassland soil, Soil Biol. Biochem., 29, 1655–1664, 1997.
Koch, H., Lücker, S., Albertsen, M., Kitzinger, K., Herbold, C., Spieck, E., Nielsen, P. H., Wagner, M., and Daims, H.: Expanded metabolic versatility of ubiquitous nitrite-oxidizing bacteria from the genus Nitrospira, P. Natl. Acad. Sci. USA, 112, 11371–11376, 2015.
Kool, D. M., Wrage, N., Oenema, O., Van Kessel, C., and Van Groenigen, J. W.: Oxygen exchange with water alters the oxygen isotopic signature of nitrate in soil ecosystems, Soil Biol. Biochem., 43, 1180–1185, 2011.
Kozlowski, J. A., Stieglmeier, M., Schleper, C., Klotz, M. G., and Stein, L. Y.: Pathways and key intermediates required for obligate aerobic ammonia-dependent chemolithotrophy in bacteria and Thaumarchaeota, ISME J., 10, 1836–1845, 2016.
Kremen, A., Bear, J., Shavit, U., and Shaviv, A.: Model demonstrating the potential for coupled nitrification denitrification in soil aggregates, Environ. Sci. Technol., 39, 4180–4188, 2005.
Kuypers, M. M., Marchant, H. K., and Kartal, B.: The microbial nitrogen-cycling network, Nat. Rev. Microbiol., 16, 263–276, https://doi.org/10.1038/nrmicro.2018.9, 2018.
Lancaster, K. M., Caranto, J. D., Majer, S. H., and Smith, M. A.: Alternative bioenergy: updates to and challenges in nitrification metalloenzymology, Joule, 2, 421–441, 2018.
Lehnert, N., Dong, H. T., Harland, J. B., Hunt, A. P., and White, C. J.: Reversing nitrogen fixation, Nat. Rev. Chem., 2, 278–289, 2018.
Le Roux, X., Bouskill, N. J., Niboyet, A., Barthes, L., Dijkstra, P., Field, C. B., Hungate, B. A., Lerondelle, C., Pommier, T., Tang, J., and Terada, A.: Predicting the responses of soil nitrite-oxidizers to multi-factorial global change: a trait-based approach, Front. Microbiol., 7, 628, https://doi.org/10.3389/fmicb.2016.00628, 2016.
Lewicka-Szczebak, D., Well, R., Köster, J. R., Fuß R., Senbayram, M., Dittert, K., and Flessa, H.: Experimental determinations of isotopic fractionation factors associated with N2O production and reduction during denitrification in soils, Geochim. Cosmochim. Ac., 134, 55–73, 2014.
Lewicka-Szczebak, D., Dyckmans, J., Kaiser, J., Marca, A., Augustin, J., and Well, R.: Oxygen isotope fractionation during N2O production by soil denitrification, Biogeosciences, 13, 1129–1144, https://doi.org/10.5194/bg-13-1129-2016, 2016.
Li, D. and Wang, X.: Nitrogen isotopic signature of soil-released nitric oxide (NO) after fertilizer application, Atmos. Environ., 42, 4747–4754, 2008.
Lim, N. Y., Frostegård, Å., and Bakken, L. R.: Nitrite kinetics during anoxia: The role of abiotic reactions versus microbial reduction, Soil Biol. Biochem., 119, 203–209, 2018.
Liu, S., Lin, F., Wu, S., Ji, C., Sun, Y., Jin, Y., Li, S., Li, Z., and Zou, J.: A meta-analysis of fertilizer-induced soil NO and combined NO+N2O emissions, Glob. Change Biol., 23, 2520–2532, 2017.
Loick, N., Dixon, E. R., Abalos, D., Vallejo, A., Matthews, G. P., McGeough, K. L., Well, R., Watson, C. J., Laughlin, R. J., and Cardenas, L. M.: Denitrification as a source of nitric oxide emissions from incubated soil cores from a UK grassland soil, Soil Biol. Biochem., 95, 1–7, 2016.
Maaz, T. M., Waldo, S., Bruulsema, T., and Mikkelsen, R.: Inconsistencies undermine the conclusion that agriculture is a dominant source of NOx in California, Sci. Adv., 4, 4706, https://doi.org/10.1126/sciadv.aat4706, 2018.
Maggi, F. and Riley, W. J.: Mathematical treatment of isotopologue and isotopomer speciation and fractionation in biochemical kinetics, Geochim. Cosmochim. Ac., 74, 1823–1835, 2010.
Mariotti, A., Germon, J. C., Hubert, P., Kaiser, P., Letolle, R., Tardieux, A., and Tardieux, P.: Experimental determination of nitrogen kinetic isotope fractionation: some principles; illustration for the denitrification and nitrification processes, Plant Soil, 62, 413–430, 1981.
Mariotti, A., Leclerc, A., and Germon, J. C.: Nitrogen isotope fractionation associated with the NO N2O step of denitrification in soils, Can. J. Soil Sci., 62, 227–241, 1982.
Martin, T. S. and Casciotti, K. L.: Nitrogen and oxygen isotopic fractionation during microbial nitrite reduction, Limnol. Oceanogr., 61, 1134–1143, 2016.
Martin, T. S. and Casciotti, K. L.: Paired N and O isotopic analysis of nitrate and nitrite in the Arabian Sea oxygen deficient zone, Deep-Sea Res. Pt. I, 121, 121–131, 2017.
McKenney, D. J., Shuttleworth, K. F., Vriesacker, J. R., and Findlay, W. I.: Production and loss of nitric oxide from denitrification in anaerobic Brookston clay, Appl. Environ. Microb., 43, 534–541, 1982.
McKenney, D. J., Lazar, C., and Findlay, W. J.: Kinetics of the nitrite to nitric oxide reaction in peat, Soil Sci. Soc. Am. J., 54, 106–112, 1990.
Medinets, S., Skiba, U., Rennenberg, H., and Butterbach-Bahl, K.: A review of soil NO transformation: Associated processes and possible physiological significance on organisms, Soil Biol. Biochem., 80, 92–117, 2015.
Michalski, G., Meixner, T., Fenn, M., Hernandez, L., Sirulnik, A., Allen, E., and Thiemens, M.: Tracing atmospheric nitrate deposition in a complex semiarid ecosystem using Δ17O, Environ. Sci. Technol., 38, 2175–2181, 2004.
Miller, D. J., Chai, J., Guo, F., Dell, C. J., Karsten, H., and Hastings, M. G.: Isotopic Composition of In Situ Soil NOx Emissions in Manure-Fertilized Cropland, Geophys. Res. Lett., 45, 12–058, 2018.
Peters, B. D., Babbin, A. R., Lettmann, K. A., Mordy, C. W., Ulloa, O., Ward, B. B., and Casciotti, K. L.: Vertical modeling of the nitrogen cycle in the eastern tropical South Pacific oxygen deficient zone using high-resolution concentration and isotope measurements, Global Biogeochem. Cy., 30, 1661–1681, 2016.
Russow, R., Stange, C. F., and Neue, H. U.: Role of nitrite and nitric oxide in the processes of nitrification and denitrification in soil: Results from 15N tracer experiments, Soil Biol. Biochem., 41, 785–795, 2009.
Santoro, A. E. and Casciotti, K. L.: Enrichment and characterization of ammonia-oxidizing archaea from the open ocean: phylogeny, physiology and stable isotope fractionation, ISME J., 5, 1796–1808, https://doi.org/10.1038/ismej.2011.58, 2011.
Shoun, H., Fushinobu, S., Jiang, L., Kim, S. W., and Wakagi, T.: Fungal denitrification and nitric oxide reductase cytochrome P450nor, Philos. T. R. Soc. B, 367, 1186–1194, 2012.
Sigman, D. M., Casciotti, K. L., Andreani, M., Barford, C., Galanter, M. B. J. K., and Böhlke, J. K.: A bacterial method for the nitrogen isotopic analysis of nitrate in seawater and freshwater, Anal. Chem., 73, 4145–4153, 2001.
Skiba, U., Fowler, D., and Smith, K. A.: Nitric oxide emissions from agricultural soils in temperate and tropical climates: sources, controls and mitigation options, Nutr. Cycl. Agroecosys., 48, 139–153, 1997.
Stange, C. F., Spott, O., Arriaga, H., Menéndez, S., Estavillo, J. M., and Merino, P.: Use of the inverse abundance approach to identify the sources of NO and N2O release from Spanish forest soils under oxic and hypoxic conditions, Soil Biol. Biochem., 57, 451–458, 2013.
Stein, L. Y.: Insights into the physiology of ammonia-oxidizing microorganisms, Curr. Opin. Chem. Biol., 49, 9–15, 2019.
Sun, X., Ji, Q., Jayakumar, A., and Ward, B. B.: Dependence of nitrite oxidation on nitrite and oxygen in low-oxygen seawater, Geophys. Res. Lett., 44, 7883–7891, 2017.
Sutka, R. L., Ostrom, N. E., Ostrom, P. H., Breznak, J. A., Gandhi, H., Pitt, A. J., and Li, F.: Distinguishing nitrous oxide production from nitrification and denitrification on the basis of isotopomer abundances, Appl. Environ. Microb., 72, 638–644, 2006.
Taylor, A. E., Myrold, D. D., and Bottomley, P. J.: Temperature affects the kinetics of nitrite oxidation and nitrification coupling in four agricultural soils, Soil Biol. Biochem., 136, 107523, https://doi.org/10.1016/j.soilbio.2019.107523, 2019.
Toyoda, S., Yoshida, N., and Koba, K.: Isotopocule analysis of biologically produced nitrous oxide in various environments, Mass Spectrom. Rev., 36, 135–160, 2017.
Treibergs, L. A. and Granger, J.: Enzyme level N and O isotope effects of assimilatory and dissimilatory nitrate reduction, Limnol. Oceanogr., 62, 272–288, 2017.
Van Cleemput, O. and Samater, A. H.: Nitrite in soils: accumulation and role in the formation of gaseous N compounds, Fert. Res., 45, 81–89, 1995.
Veldkamp, E. and Keller, M.: Fertilizer-induced nitric oxide emissions from agricultural soils, Nutr. Cycl. Agroecosys., 48, 69–77, 1997.
Venterea, R. T., Rolston, D. E. E., and Cardon, Z. G.: Effects of soil moisture, physical, and chemical characteristics on abiotic nitric oxide production, Nutr. Cycl. Agroecosys., 72, 27–40, 2005.
Venterea, R. T., Coulter, J. A., and Clough, T. J.: Nitrite accumulation and nitrogen gas production increase with decreasing temperature in urea-amended soils: Experiments and modeling, Soil Biol. Biochem., 142, 107727, https://doi.org/10.1016/j.soilbio.2020.107727, 2020.
Vinken, G. C. M., Boersma, K. F., Maasakkers, J. D., Adon, M., and Martin, R. V.: Worldwide biogenic soil NOx emissions inferred from OMI NO2 observations, Atmos. Chem. Phys., 14, 10363–10381, https://doi.org/10.5194/acp-14-10363-2014, 2014.
Wei, J., Ibraim, E., Brüggemann, N., Vereecken, H., and Mohn, J.: First real-time isotopic characterisation of N2O from chemodenitrification, Geochim. Cosmochim. Ac., 267, 17–32, 2019.
Wrage-Mönnig, N., Horn, M. A., Well, R., Müller, C., Velthof, G., and Oenema, O.: The role of nitrifier denitrification in the production of nitrous oxide revisited, Soil Biol. Biochem., 123, A3–A16, 2018.
Wunderlich, A., Meckenstock, R. U., and Einsiedl, F.: A mixture of nitrite-oxidizing and denitrifying microorganisms affects the δ18O of dissolved nitrate during anaerobic microbial denitrification depending on the δ18O of ambient water, Geochim. Cosmochim. Ac., 119, 31–45, 2013.
Yamazaki, T., Hozuki, T., Arai, K., Toyoda, S., Koba, K., Fujiwara, T., and Yoshida, N.: Isotopomeric characterization of nitrous oxide produced by reaction of enzymes extracted from nitrifying and denitrifying bacteria, Biogeosciences, 11, 2679–2689, https://doi.org/10.5194/bg-11-2679-2014, 2014.
Yang, H., Gandhi, H., Ostrom, N. E., and Hegg, E. L.: Isotopic fractionation by a fungal P450 nitric oxide reductase during the production of N2O, Environ. Sci. Technol., 48, 10707–10715, 2014.
Ye, R. W., Averill, B. A., and Tiedje, J. M.: Denitrification: production and consumption of nitric oxide, Appl. Environ. Microb., 60, 1053–1058, 1994.
Yu, Z.: Isotopologue-specific models, Zenodo, https://doi.org/10.5281/zenodo.4495715, 2021.
Yu, Z. and Elliott, E. M.: Novel method for nitrogen isotopic analysis of soil-emitted nitric oxide, Environ. Sci. Technol., 51, 6268–6278, 2017.
Yu, Z. and Elliott, E. M.: Probing soil nitrification and nitrate consumption using Δ17O of soil nitrate, Soil Biol. Biochem., 127, 187–199, 2018.
Zhang, L., Altabet, M. A., Wu, T., and Hadas, O.: Sensitive measurement of NH15N∕14N (δ15NH) at natural abundance levels in fresh and saltwaters, Anal. Chem., 79, 5297–5303, 2007.
Zhang, S., Fang, Y., and Xi, D.: Adaptation of micro-diffusion method for the analysis of 15N natural abundance of ammonium in samples with small volume, Rapid Commun. Mass Sp., 29, 1297–1306, 2015.
Zhu-Barker, X., Cavazos, A. R., Ostrom, N. E., Horwath, W. R., and Glass, J. B.: The importance of abiotic reactions for nitrous oxide production, Biogeochemistry, 126, 251–267, 2015.
Zumft, W. G.: Cell biology and molecular basis of denitrification, Microbiol. Mol. Biol. R., 61, 533–616, 1997.