the Creative Commons Attribution 4.0 License.
the Creative Commons Attribution 4.0 License.
 | 21 Mar 2022
Modeling the interinfluence of fertilizer-induced NH3 emission, nitrogen deposition, and aerosol radiative effects using modified CESM2
Maria Val Martin
Global ammonia (NH3) emission is expected to continue to rise due to intensified fertilization for growing food to satisfy the increasing demand worldwide. Previous studies have focused mainly on estimating the land-to-atmosphere NH3 injection but seldom addressed the other side of the bidirectional nitrogen exchange – deposition. Ignoring this significant input source of soil mineral nitrogen may lead to an underestimation of NH3 emissions from natural sources. Here, we used an Earth system model to quantify NH3-induced changes in atmospheric composition and the consequent impacts on the Earth's radiative budget and biosphere as well as the impacts of deposition on NH3 emissions from the land surface. We implemented a new scheme into the Community Land Model version 5 (CLM5) of the Community Earth System Model version 2 (CESM2) to estimate the volatilization of ammonium salt (NH associated with synthetic and manure fertilizers into gaseous NH3. We further parameterized the amount of emitted NH3 captured in the plant canopy to derive a more accurate quantity of NH3 that escapes to the atmosphere. Our modified CLM5 estimated that 14 Tg N yr−1 of global NH3 emission is attributable to fertilizers. Interactively coupling terrestrial NH3 emissions to atmospheric chemistry simulations by the Community Atmospheric Model version 4 with chemistry (CAM4-chem), we found that such emissions favor the formation and deposition of NH aerosol, which in turn influences the aerosol radiative effect and enhances soil NH3 volatilization in regions downwind of fertilized croplands. Our fully coupled simulations showed that global-total NH3 emission is enhanced by 3.3 Tg N yr−1 when 30 % more synthetic fertilizer is used compared to the 2000-level fertilization. In synergy with observations and emission inventories, our work provides a useful tool for stakeholders to evaluate the intertwined relations between agricultural trends, fertilizer use, NH3 emission, atmospheric aerosols, and climate so as to derive optimal strategies for securing both food production and environmental sustainability.
- Article
(5479 KB) - Full-text XML
-
Supplement
(4135 KB) - BibTeX
- EndNote


Global NH3 emission has risen from 59 to 65 Tg N yr−1 during 2000–2008, driven mainly by the increasing fertilizer use and manure handling in farms and animal operations (Sutton et al., 2013). After entering the atmosphere, NH3 gas readily neutralizes sulfuric acid (H2SO4) and nitric acid (HNO3), which are derived from the oxidation of sulfur dioxide (SO2) and nitrogen oxides (NOx), forming inorganic sulfate–nitrate–ammonium (SNA) aerosols (Behera and Sharma, 2012). These secondary ammonium (NH aerosols can constitute 25 %–75 % of inorganic fine particulate matter (PM2.5, particles with an aerodynamic diameter <2.5 µm) (Ianniello et al., 2011; Snider et al., 2016), which causes not only haze and smog that lower visibility, but also respiratory and cardiovascular diseases that harm human health (Tie and Cao, 2009; Xing et al., 2016; Yang et al., 2019). In 2010 alone, an estimated 2.6 million premature deaths were associated with PM2.5 pollution (Wang et al., 2017). Without proper controls, unbridled use of fertilizer to boost food production for the fast-growing population can further enhance global agricultural NH3 emissions by ∼ 12 % in 2050 compared to the 2010 level, posing an even greater health risk via PM2.5 formation (Bodirsky et al., 2014). The global public health system may have to spend USD 20–290 billion more each year to compensate for the NH3-derived detrimental effects on air quality and health (Gu et al., 2012; Paulot and Jacob, 2014; Guthrie et al., 2018).
Excessive atmospheric NH3 also threatens ecosystems. The highly soluble NH3 gas and aerosol NH (together known as NHy) eventually return to the Earth's surface via dry and wet deposition, thus modifying the terrestrial nitrogen cycle. NHy deposited on canopy foliage can be taken up and become readily available to promote photosynthesis (Wortman et al., 2012), but if highly concentrated it can also injure plant tissues and suppress biomass growth (Fangmeier et al., 1994; Krupa, 2003). Though NHy deposition can enrich soil nutrients, it also brings several adverse effects, including soil acidification and forest biodiversity loss (Tian and Niu, 2015; Lu et al., 2008). Nitrifying bacteria often oxidize soil NH in excess, and the resulting NO, which is prone to leaching, can lower soil nutrient content as well as contaminate groundwater, streams, rivers, and coastal waters, causing eutrophication (Lin et al., 2001; Beeckman et al., 2018). NHy directly falling onto natural waters is potentially toxic to aquatic life, even in low concentrations, and can deteriorate marine biodiversity (Zhang and Liu, 1994; Shou et al., 2018).
The severity of the aforementioned consequences of excessive reactive nitrogen in the environment has called for better management of these compounds, including better monitoring and mitigation of agricultural NH3. In the recent decade, the space-based Infrared Atmospheric Sounding Interferometer (IASI) has been deployed to gauge atmospheric NH3 concentration within air columns (Clarisse et al., 2009). This new ensemble of satellite observations offers significant progress to address previous observational deficiencies and allows daily monitoring of global NH3 distribution (Clarisse et al., 2010; Van Damme et al., 2014). Continued refinement in retrieval schemes and incorporation of machine-learning techniques have further improved the sensitivity and reliability of measured NH3 concentrations (Van Damme et al., 2017). It enables the creation of high-resolution maps of atmospheric NH3 and the possibility of pinpointing industrial and agricultural emission hotspots with diameters smaller than 50 km (Van Damme et al., 2018a). The works of Van Damme et al. (2018a) have provided valuable datasets not only for monitoring agricultural emissions but also for benchmarking and improving emission inventories and numerical models.
NH3 emission inventories are generally compiled by surveyed activity data and empirical emission factors associated with primary sources including animal populations, synthetic nitrogen fertilizers, biomass burning, and natural sources. A inventory, which was among the first back then, estimated a global emission of 54 Tg N yr−1 for 1990, of which 34 Tg N yr−1 is agricultural, excluding field burning, and 2.4 Tg N yr−1 from natural soil (Bouwman et al., 1997). Since then, much effort has been put into refining the estimation of anthropogenic emissions. Recent inventories adjusted the estimated agricultural emissions (including manure management and both synthetic and manure fertilizers) in 2000–2010 to 33–37 Tg N yr−1 (Sutton et al., 2013; Janssens-Maenhout et al., 2015; Hoesly et al., 2018). One of the state-of-the-art inventories, the Emissions Database for Global Atmospheric Research (EDGAR) version 4.3.2, provides global anthropogenic emission estimates in resolution for the period 1970–2012 (Crippa et al., 2018). The accuracy of these inventories is not only affected by the integrity of the activity data surveyed but also constrained by the suitability of emission factors. Simply adopting emission factors from other countries may result in biases because of regional differences in technologies, farming practices, climate, and soil conditions (Huang et al., 2012). This pitfall has motivated the development of other national and regional inventories in the US (e.g., US Environmental Protection Agency, 2014), China (e.g., Zhang et al., 2018), and Europe (e.g., European Environment Agency, 2013). These emission inventories are useful tools for source apportionment and input data for forward models, but as the NH3 emissions are prescribed they do not respond to changes in, for example, nitrogen deposition and meteorology, making them insufficient for models to represent the full dynamics of the NHy cycle.
The global NHy cycle has proven to be challenging to study because of the various feedback mechanisms within the Earth system. The reactive nature of NH3 and the contribution of deposited NH to the re-emission of NH3 from natural and agricultural soils have created a convoluted relationship between emissions and deposition. NH particles can be transported along with airflows and dispersed across a more extensive geographical range than the highly reactive gaseous NH3. Such transport can introduce large heterogeneity in the spatial distribution of reactive nitrogen, rendering it not only a local but also a pan-regional problem (Asman et al., 1998). Moreover, NH3 volatilization is a temperature-dependent process, while the presence of atmospheric NH3 affects the composition of aerosols and their radiative forcing, thus in turn modifying the Earth's surface energy budget (Ansari and Pandis, 1998).
In this study, we hence aim to enable modeling of the land–atmosphere bidirectional exchange of NHy so that we can quantify the dynamically evolving NHy cycle and feedback mechanisms associated with it under a changing environment. We employed the Community Earth System Model version 2 (CESM2), which has state-of-the-art model components representing the land, atmosphere, sea ice, and oceans. These sub-models can run independently or in various coupled configurations (Hurrell et al., 2013). Many studies have employed CESM for studying processes in both the atmospheric and terrestrial nitrogen cycles, e.g., NOx and N2O emission (Saikawa et al., 2013, 2014; Zhao et al., 2017), deposition (Lamarque et al., 2013), denitrification and nitrate leaching (Nevison et al., 2016), crop nitrogen uptake (Levis et al., 2018), and reactive nitrogen input to the ecosystem associated with synthetic and manure fertilizers (Riddick et al., 2016; Vira et al., 2020, 2021). Yet, these studies did not consider the dynamic bidirectional transfer of NH3 and NH between the land and atmosphere. To add the dynamic cycle of NHy back to CESM2, we adopted a process-based approach to parameterize NH3 emission from cropland soils, which is different from the bidirectional “voltage resistance” models (Zhu et al., 2015; Riddick et al., 2016; Pleim et al., 2019; Vira et al., 2020). Our approach determines the multistage processes of soil NH to NH3, including adsorption, dissociation, and volatilization. The process-based nature of this scheme allows us to evaluate the response of NH3 emission to soil climate, soil nitrogen content, fertilization, deposition, competition against other soil biogeochemical processes (nitrification, microbial uptake, etc.), and vegetation growth. Comparing to other approaches, our scheme, which borrowed from a biogeochemical model, DeNitrification–DeComposition (DNDC), requires variables that are mostly already modeled in CLM5, allowing us to largely capture the dynamic nature of NH3 emission. We also developed a prognostic parameterization for canopy capture of NH3 instead of using a fixed generic value, e.g., one constant canopy reduction factor for all plants as used in some other studies (e.g., Riddick et al., 2016; Bouwman et al., 1997). Implementing these new schemes in the Community Land Model version (CLM5) (Lawrence et al., 2019), we could then estimate the emission associated with fertilizer use and perform fully coupled simulations with the Community Atmosphere Model version 4 with Chemistry (CAM4-chem) (Lamarque et al., 2012) that allow two-way exchange of NHy bridged by online emission and deposition to understand the subsequent effects on aerosol formation, climate, terrestrial ecosystems, and crop growth. We also compared our results with available emission inventories to evaluate model accuracy and uncertainty.
This paper demonstrates a framework that could help unfold the complicated interactions between fertilizer use, NH3 emission, aerosol formation, climate, terrestrial ecosystems, and crop production. For instance, a recent study based on our model framework showed that enhanced nitrogen deposition induced by future fertilize use could modify the meteorological environment via changes in vegetation and soil biogeochemistry and modulate future ozone pollution (Liu et al., 2021).
2.1 Community Earth System Model
We introduced new functionalities into CESM2 to enable the simulation of a coupled land–atmosphere nitrogen cycle and to further investigate the impacts of fertilizer-induced NH3 emission on atmospheric composition, terrestrial biogeochemistry, and climate change. In particular, we implemented into CLM5 new parameterization schemes to quantify NH3 volatilized from soil due to fertilizer application and captured by plant canopies. We further bridged CLM5 and CAM4-chem to enable two-way exchange of soil NH3 emission and deposition of NH to model a fully coupled, prognostic land–atmospheric NHy cycle.
Our model development was based on CLM5 with active biogeochemical cycles and a crop sub-model (CLM5-BGC-Crop, or CLM5 for short), which represents terrestrial carbon and nitrogen cycling with prognostic vegetation and crop growth. The model uses a sub-grid hierarchy (from grid cells, land units, columns, to patches) to capture the biogeophysical and biogeochemical differences between various land types within a model grid cell. In particular, CLM5 handles natural soil and croplands differently: multiple natural vegetation patches are configured to occupy a single unmanaged soil column sharing a single pool of nutrients, while each crop patch has a dedicated column. Such a setting allows no resource competition between natural vegetation and crops, nor among crops (Drewniak et al., 2013). There are 16 types of natural vegetation (including bare ground) and 8 active crops (temperate soybean, tropical soybean, temperate corn, tropical corn, spring wheat, cotton, rice, and sugarcane) in this model (Lombardozzi et al., 2020). Vegetation and crops are represented by plant functional types (PFTs), each having specific ecophysiological, phenological, and biogeochemical parameters (Levis et al., 2018). Default PFT distributions of natural vegetation and crops are derived from satellite observations (e.g., MODIS) and agricultural census data (Lawrence and Chase, 2007; Portmann et al., 2010). The beginning of plant growth stages (seedling, leaf emerging, and grain filling), as well as crop sowing dates and planting durations, is controlled by cumulative warm-enough hours at the beginning of spring. Crops obtain nutrients from the soil mineral nitrogen pool, which is supplied by nitrogen deposition and fertilization. Fertilizer is applied to each patch for 20 consecutive days evenly when the crops enter the leaf emergence phase. Synthetic fertilizer input was prescribed by crop type and country at the 2000 level based on Land-Use Harmonization (LUH2) fertilization rates (Hurtt et al., 2011). The manure fertilizer application rate is assumed constant for all crops at 2 g N m−2 yr−1, the same as the model default (Lombardozzi et al., 2020). All added depositional and fertilizer N is added to the soil NH pool of each layer from ground surface to 0.4 m underground according to a model-defined soil profile (Table S1) (Lawrence et al., 2018). Crops are harvested once they reach maturity or after a predefined maximum number of growing days (typically 150–165 d) (Lawrence et al., 2018).
In addition to the NH3 schemes, we also modified CLM5 to better simulate the terrestrial nitrogen cycle, specifically on the emission of NOx from denitrification and nitrification and microbial mineralization of soil nitrogen. These modifications are documented in the Supplement.
2.2 Soil ammonia emission and canopy capture
Figure 1 summarizes the primary pathways of the terrestrial nitrogen cycle in CLM5. The model tracks nitrogen content in soil, plant, and organic matter as an array of separate nitrogen pools and biogeochemical processes as exchange fluxes of nitrogen between these pools. Soil mineral nitrogen, NH, and NO are competed for among plant uptake, microbial immobilization, nitrification, and denitrification based on the relative demand from each process. Release of nitrous oxide (N2O) and NOx as byproducts of nitrification and denitrification and leaching of soil nitrate also deplete soil NH and NO, which can be replenished by fertilization and deposition of atmospheric NHy and NOx. The deposition rates were prescribed in the default configuration and dynamically computed by CAM4-chem in our version. Other sources of soil mineral nitrogen include biological fixation by microbes or soybean and decomposition of plant litter and soil organic matter. Our proposed NH3 emission scheme was borrowed from a standalone biogeochemical model, DNDC version 9.5 (Li et al., 2012; Gilhespy et al., 2014; source code of DNDC v9.5 provided by Changsheng Li via personal communication on 18 June 2015), which has been extensively used for studying agricultural NH3 emission (e.g., Li et al., 2012; Balasubramanian et al., 2015, 2017; Zhang and Niu, 2016).
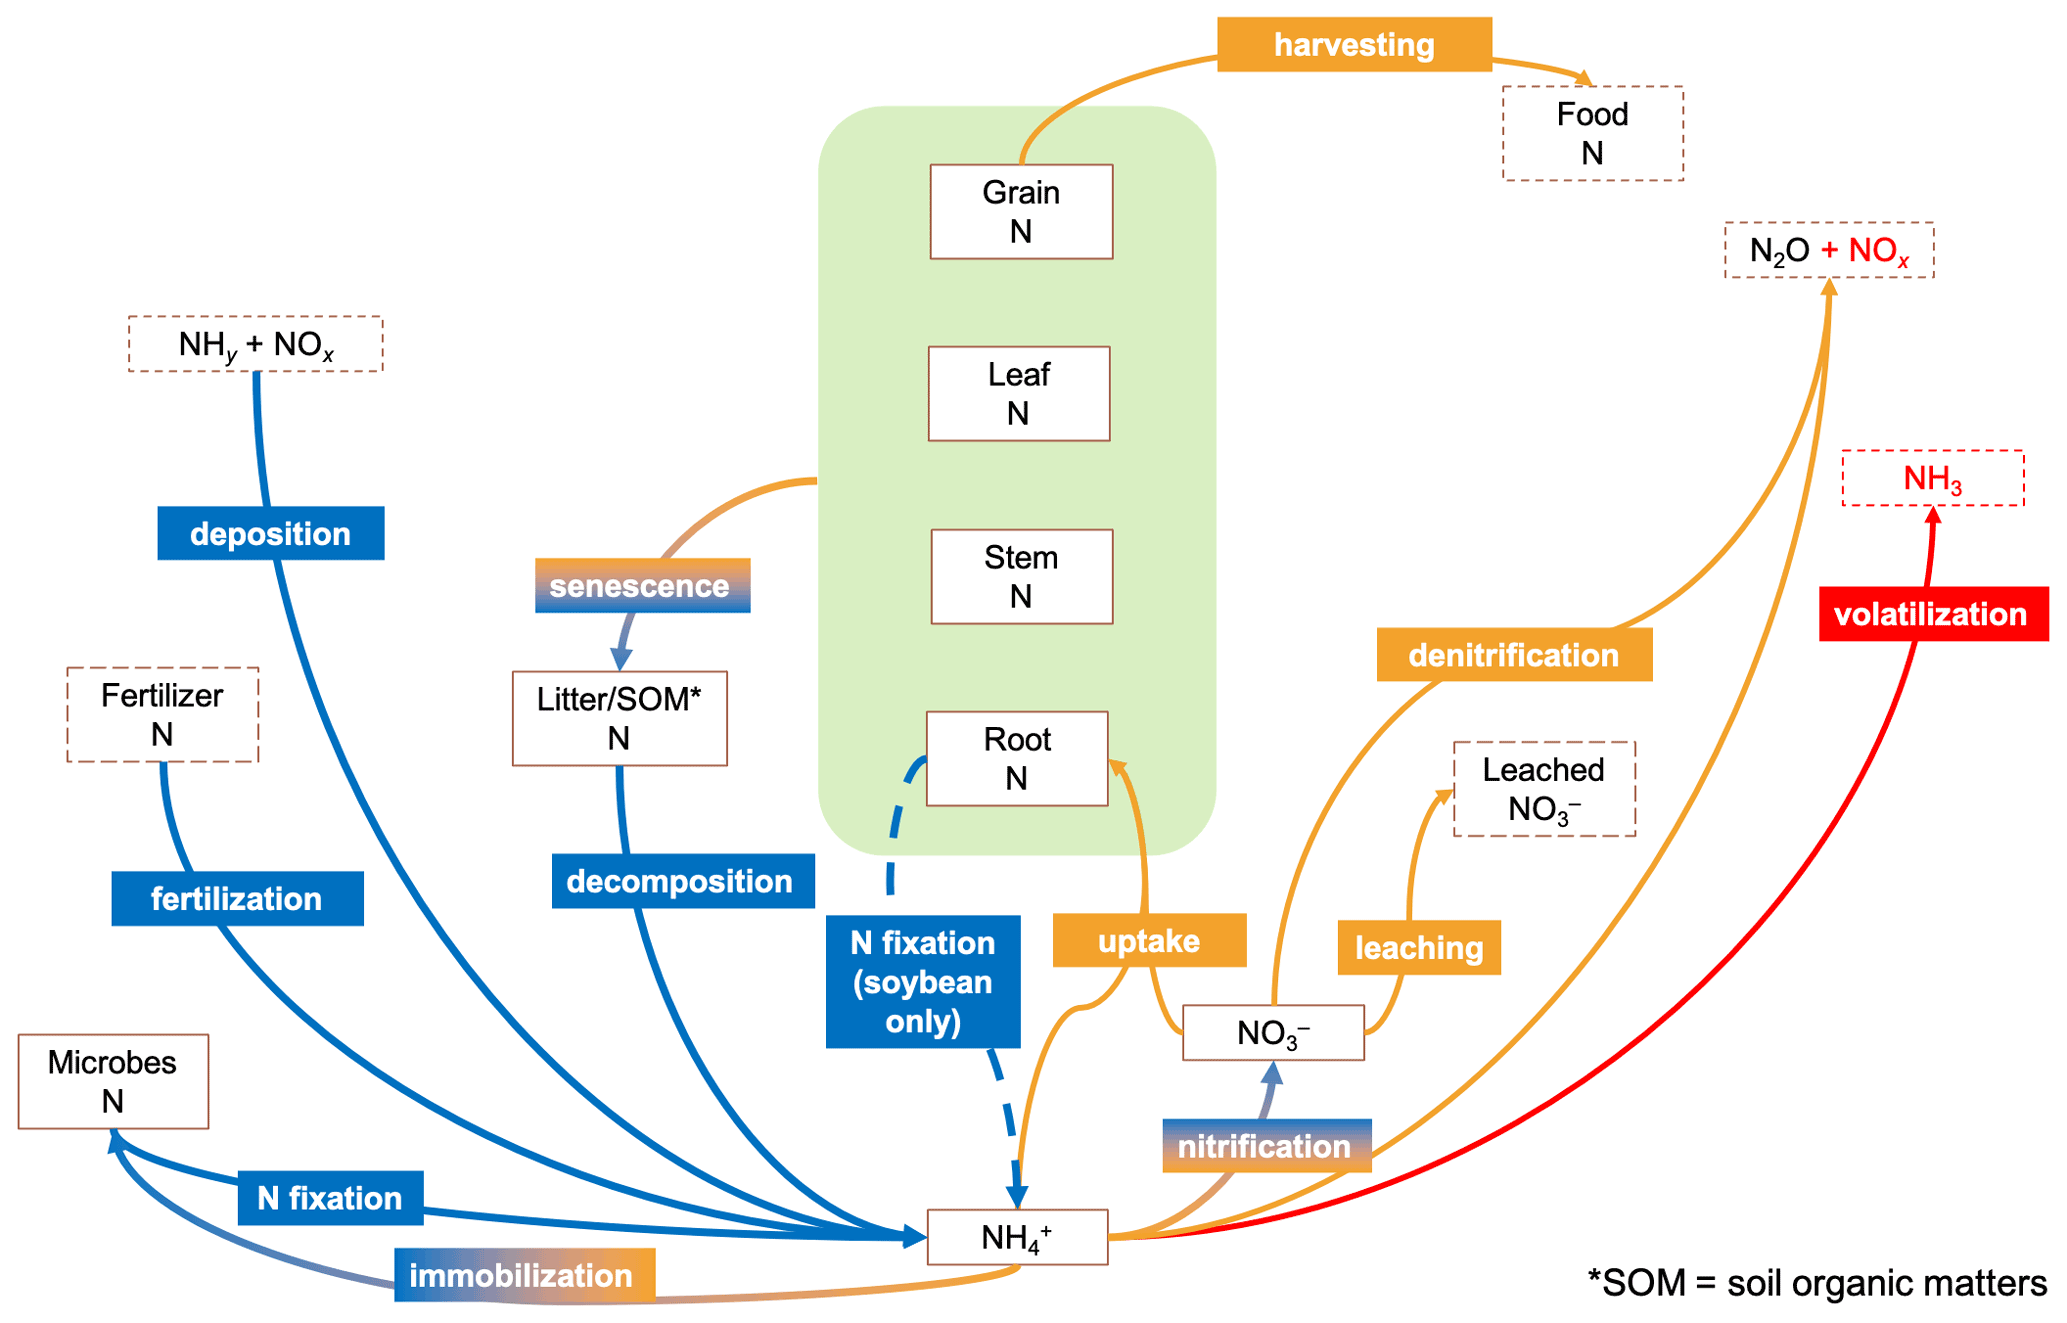
Figure 1Major pathways modeled by CLM5 nitrogen (N) cycle. Blue arrows indicate N entering the soil N nitrogen pool, while orange arrows are for leaving. The default model tracks only N pools in boxes enclosed by solid lines but not those with dashed lines. N contents in crop tissues are modeled as pools inside the green regions. The red arrow indicates the missing pathway of NH3 volatilization in the default model. Nitrogen gas (N2) emitted by denitrification is not shown. SOM denotes soil organic matter.
Following the treatment in DNDC, our scheme considered NH3 volatilization a multistage process and estimated the potential soil NH3 prone to emission (Fsoil,pot; g N m−3) based on soil NH content. In each soil layer of a column or patch
where [NH] (g N m−3) is the amount of soil NH, fads accounts for the portion of NH adsorbed onto the surface of the soil matrix, fdis is the fraction of the non-adsorbed NH that dissociated into aqueous NH3, and fvol is the fraction of aqueous NH3 volatilized as gaseous NH3. The adsorbed fraction fads, which is also bounded between 0 and 1, is given by Li et al. (1992) and Dutta et al. (2016):
where fclay is the soil clay fraction as prescribed by the CLM5 surface data (Bonan et al., 2002); we adopted a factor of 0.99 instead of the one reported in Dutta et al. (2016), as per the source code of DNDC.
The non-adsorbed NH dissociates reversibly into aqueous NH3 and hydrogen ions (NH NH), and hence, fdis is determined by the following equations (Li et al., 2012; Sutton, 1990; Sutton et al., 1993):
where Ka (mol L−1) and Kw (mol L−2) are dissociation constants for as well as hydrogen- and hydroxide-ion equilibria, respectively; Tsoil (∘C) is soil temperature; and [H+] (mol) is the concentration of aqueous hydrogen ion in the soil calculated from soil pH. CLM5 is currently not capable of calculating soil pH implicitly, so we performed our simulations using a constant pH of 6.5 for a more focused analysis. This pH value is consistent with the value used in the nitrification and denitrification schemes in CLM5. We further evaluated the uncertainty induced by our choice of pH and presented the sensitivity test results in the Supplement. Briefly, a higher pH would promote the model NH3 emission rate exponentially as the emission rate is of the order of 10pH. This high sensitivity warrants the need to include crucial chemical processes in the model for accurately determining soil pH online.
Lastly, we used this equation to calculate fvol (Li et al., 1992; Gardner, 1965; source code of DNDC v9.5):
where s (m s−1) is surface wind speed; Tsoil (∘C) is soil temperature; and l and lmax (both in meters) are the depth of each soil layer and the maximum depth of a soil column, respectively. Our scheme assumes that vaporized soil NH3 in a deeper layer diffuses upward to the surface but does not explicitly simulate the process. Instead, it is represented in the last term in Eq. (7) as a ratio of ( for the NH3(g) contained in each soil layer. Hence, soil NH in deeper layers is also subject to loss to NH3 volatilization but at much slower rates than that in the upper layers. Details of the soil profile are provided in Table S1.
The actual soil NH3 to be emitted (Fsoil,act; g N m−3) from each soil layer is then determined as
where Fsoil,pot is from Eq. (1), and [NH]available (g N m−3) is the concentration of available soil NH in the soil layer. The model distributes available soil NH to all competing processes, namely NH3 emission, plant uptake, microbial immobilization, and nitrification, according to their relative demands (individual potential flux to sum of all four potential fluxes) without bias toward any process (Lawrence et al., 2019). The column-level actual soil NH3 prone to emission (Fsoil; g N m−2) is then computed as the sum of the product of Fsoil,act and the soil layer thickness (in meters) across all vertical layers.
Finally, assuming such NH3 is released to the atmosphere at a constant rate over a model time step size (Δt=1800 s in this study), our model estimates the NH3 emission flux (; g N m−2 s−1) as
If vegetation is present above the soil, some of the emitted NH3 can be retained by the plant canopy, which is known to be related to the adsorption of hydrophilic NH3 onto the leaf surface and molecular diffusion via the leaf stomata (Van Hove et al., 1987). Some studies represented the amount of captured NH3 using constant scaling factors (e.g., 0.6 for all vegetation in Riddick et al., 2016; 0.8, 0.5, and 0.2 for tropical rainforests, other forests, and all other vegetation types, respectively, in Bouwman et al., 1997). Here, we calculated the flux of NH3 captured by the canopy following the equation used in DNDC that accounts for the change in in-canopy NH3 concentration, deposition velocity of ammonia, leaf area index (LAI), and air moisture (Institute for the Study of Earth, Oceans, and Space, University of New Hampshire, 2017). To include the dynamic growth of crop canopy, we further adopted the canopy height adjustment factor employed by the Community Multiscale Air Quality (CMAQ) regional chemical transport model (Pleim et al., 2013). The portion of NH3 flux from the soil that is not captured by plant canopies (; g N m−2 s−1) is thus
where L is one-sided snow-free LAI; s10 is the wind speed (m s−1) at 10 m height; vc is the deposition velocity of NH3 (0.05 m s−1 as in DNDC); φc is in-canopy relative humidity; b is a correction factor for the effect of canopy thickness (14 m−1 is used here as suggested by Pleim et al., 2013); and htop and hbot are heights of canopy top and bottom (both in meters), respectively. Except for vc and b, all variables are calculated within CLM5 (see Lawrence et al., 2019, for detailed calculation methods). These two equations estimate the concentration of NH3 exposed to plant canopy under a given soil emission rate at each time step: dividing soil NH3 emission rate by s10 gives an approximate in-canopy NH3 concentration, and multiplying the latter with vc and L produces an estimated quantity of NH3 retained by the canopy. The last three terms account for the influence of in-canopy moisture and canopy thickness on the effectiveness of canopy capturing. We used as an input of the ammonia emissions to drive chemistry calculations in CAM4-chem. The captured NH3 can re-enter the soil surface along with water throughfall or be metabolized by the plants if it diffuses into the leaf tissues (Hutchinson et al., 1972). Since the detailed mechanisms are still uncertain and beyond the focus of this study, we decided to assume that all captured NH3 returns to the soil directly as NH and discuss how it will affect our analysis in the “Conclusions” section.
2.3 Simulations of the land–atmosphere NHy cycle
For the atmospheric component, we employed CAM4-chem (Lamarque et al., 2012), with chemistry based on the tropospheric chemistry mechanism of MOZART-4 (Emmons et al., 2010). CAM4-chem employs a bulk aerosol approach and predicts the formation of PM2.5 components including SO, NO, and NH, where the injection rates of precursors – sulfur dioxide (SO2), NOx, and NH3 – are prescribed by the Coupled Model Intercomparison Project phase 6 (CMIP6), also known as the Community Emissions Data System (CEDS) emission inventory (CMIP6 hereinafter) for anthropogenic activities (Hoesly et al., 2018). The biomass burning emissions used for our simulations are described by von Marle et al. (2016, 2017) and are all assumed as surface emissions without plume rise or predefined vertical distribution. Biogenic emissions, e.g., of isoprene, are updated online from CLM5 using the Model of Emissions of Gases and Aerosols from Nature (MEGAN) version 2.1 (Guenther et al., 2012). In our coupled simulations, we substituted the portion of NH3 emission associated with fertilizers from the CAM4-chem inventory input (CESD) for our online simulated emission rates from CLM5. This study did not consider manure spreading on pastures and grazing animals. Atmospheric NH3 and NH formed sequentially return to CLM5 through deposition. We note that the NOx emission inputs for CAM4-chem were solely from the emission inventories and did not include those from our modified denitrification and nitrification schemes.
Dry deposition in CAM4-chem is handled using the resistance approach (Wesely, 1989; Emmons et al., 2010). For NH3 vapor, the model calculates the aerodynamic and the boundary-layer (laminar sublayer) resistance based on the online atmospheric dynamics, while the surface resistance over land is determined according to the online CLM5 surface variables, e.g., canopy height and LAI, as well as a species-specific reactivity factor for oxidation and effective Henry's law coefficients. For particle-phase NH, the aerodynamic resistance is the same as that of NH3, but the boundary-layer and surface resistances are replaced by a single resistance term that depends on the surface friction velocity. The deposition velocities of NH3 and NH are the reciprocal of the sum of their corresponding resistance terms, and their deposition rates are the product of their deposition velocities and concentrations. Wet deposition in CAM4-chem follows the Neu and Prather (2012) scheme, which assumes a first-order loss of chemicals due to in-cloud and below-cloud scavenging processes. The wet deposition rates of NH3 and NH are the products of their concentration, their loss frequencies (based on their Henry's law coefficients), and the fraction of the grid box subject to scavenging (e.g., cloudy or raining). These NHy deposition fluxes (together with NOx) then become the input to CLM5 for the soil NH pool (Lawrence et al., 2018).
In the default configuration, atmospheric chemistry interacts with the climate solely through radiation in CAM4-chem (Lamarque et al., 2012). Furthermore, atmospheric reactive nitrogen (NH or NO does not directly interact with radiative transfer in the model. Instead, its radiative implications are manifested via altering the gas–aqueous partitioning of sulfate (Emmons et al., 2010; Metzger, 2002) and the subsequent changes in direct radiative effect due to any changes in sulfate aerosols. The subsequent sulfate-induced changes in cloud optical properties (indirect radiative effect) were not considered in this work. A detailed description of the radiative transfer processes in CAM4-chem is provided in Neale et al. (2010).
Recent studies on NH3 emission using CESM2 (e.g., Riddick et al., 2016, and Vira et al., 2020) focused only on the one-way land-to-atmosphere flux of NH3 while neglecting the enhancing effect of nitrogen deposition on NH3 emission. By coupling CLM5 and CAM4-chem, we allowed the model land–atmosphere NHy cycle to evolve in response to any changes in the bidirectional exchange of NH3 and NH via online emission and deposition. It also makes our method more suitable than a one-way model for studying the feedback effects of future changes in climate and agricultural activities on the biogeochemical cycles.
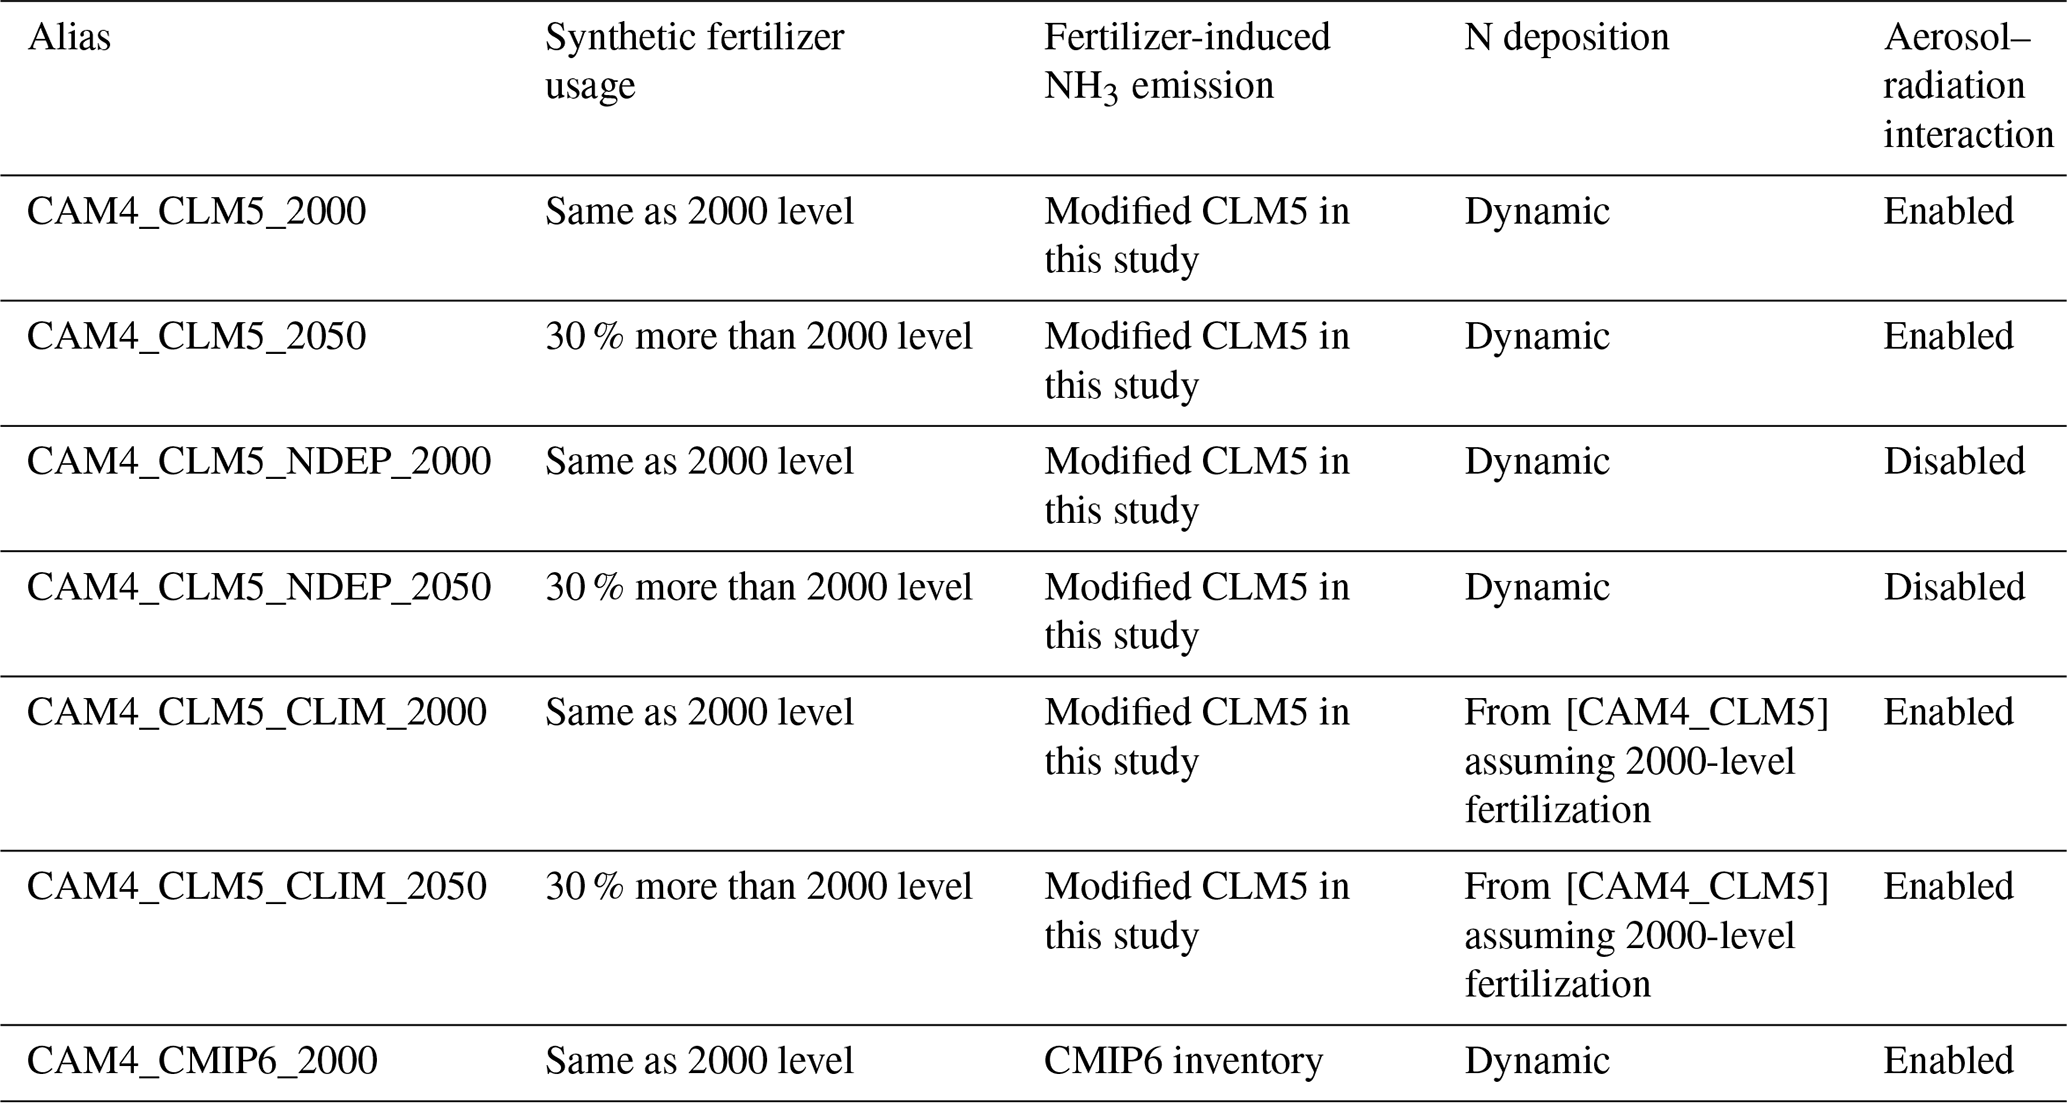
Table 1 provides configuration details of our experiments. [CAM4_CLM5_2000] and [CAM4_CLM5_2050] encapsulated the full functionality of our implementation, i.e., CAM4-chem receives the online CLM5 NH3 emission rates as input to predict atmospheric NH3 concentration, the subsequent formation of secondary ammonium aerosols (modeled as changes in sulfate aerosols in the model), and the corresponding instantaneous sulfate aerosol radiative effect, whilst CLM5 obtains the online CAM4-chem dry and wet deposition rates of NHy and NOx to calculate the addition of soil NH via deposition. The deposited nitrogen will eventually enrich soil fertility and fuel the re-emission of soil NH3, while the aforementioned aerosol radiative effect can cool the Earth's surface and suppress NH3 volatilization. The [CAM4_CLM5_NDEP] cases were set to isolate the impact of NHy deposition on NH3 emission and crop growth. In this setup, CAM4-chem used prescribed gases (except for water vapor) and aerosols in the radiation transfer calculation (i.e., aerosol–radiation interaction is disabled). Hence, any changes in the atmospheric sulfate aerosol loading induced by the addition of or reduction in NH3 would not affect radiative transfer. We note that the differences in radiative budget between the [CAM4_CLM5_NDEP] and other configurations with aerosol–radiation interaction enabled would include the effects attributable to both NH3-induced sulfate changes and the differences in spatial distribution between the prescribed and prognostic aerosols. For instance, the differences between [CAM4_CLM5_NDEP] and [CAM4_CLM5] are substantial for sulfate (up to 4 % in zonal mean mass ratio; mostly inland) and dust (up to 30 % zonally; mostly in sub-Saharan Africa and other desert regions) and are unlikely related to NH3 changes; meanwhile, the differences are rather negligible for organic carbon, black carbon, and sea salt. This configuration was intended to isolate the enhanced fertilization effect of N deposition. Similarly, [CAM4_CLM5_CLIM] cases were prescribed with constant nitrogen deposition fluxes so that we could quantify the impacts of the changes in instantaneous aerosol radiative effects. We hypothesized that an increased NH3 emission would promote the formation of sulfate aerosols, and the subsequent aerosol cooling effect would be observed in this setup. Finally, we further evaluated the impacts of intensive fertilizer use to promote agricultural production in the future as projected by FAO (2007) by repeating the first three simulations with fertilization at present-day (2000; model default) and future (2050; assuming 30 % more synthetic fertilizers, while manure fertilizer is kept at 2000 level) rates. We note that future increases in agricultural production might also involve cropland expansion, but such a practice was not included in this study.
All simulations were run for 30 years using the spun-up year 2000 initial conditions with the corresponding land cover data provided out of the box by CLM5. The first 10 years of outputs were used to further stabilize the model (such that the interannual variability in the emission fluxes could be %) after our ammonia scheme was implemented. Our analysis in the next section focuses on the averages of the last 20 years of simulated results to minimize influence from any long-term meteorological variability. Only the atmosphere (CAM4-chem) and the land (CLM5) components were active. CAM4-chem was run with free dynamics in the standard spatial resolution of horizontally with 27 vertical layers (from surface to ∼40 km). CLM5 was run in the same horizontal resolution with 25 soil layers down to ∼50 m below ground. Sea surface temperature (SST) and sea ice conditions (Hurrell et al., 2008) as well as the mixing ratios of greenhouse gases (Meinshausen et al., 2017) were all fixed at the 2000 levels. Our analysis focuses on the changes in fluxes of soil biogeochemical processes, the evolution of atmospheric NH3, the sequential changes in sulfate aerosols, and the influence of the bidirectional NHy exchange on crop production.
2.4 Datasets for model validation
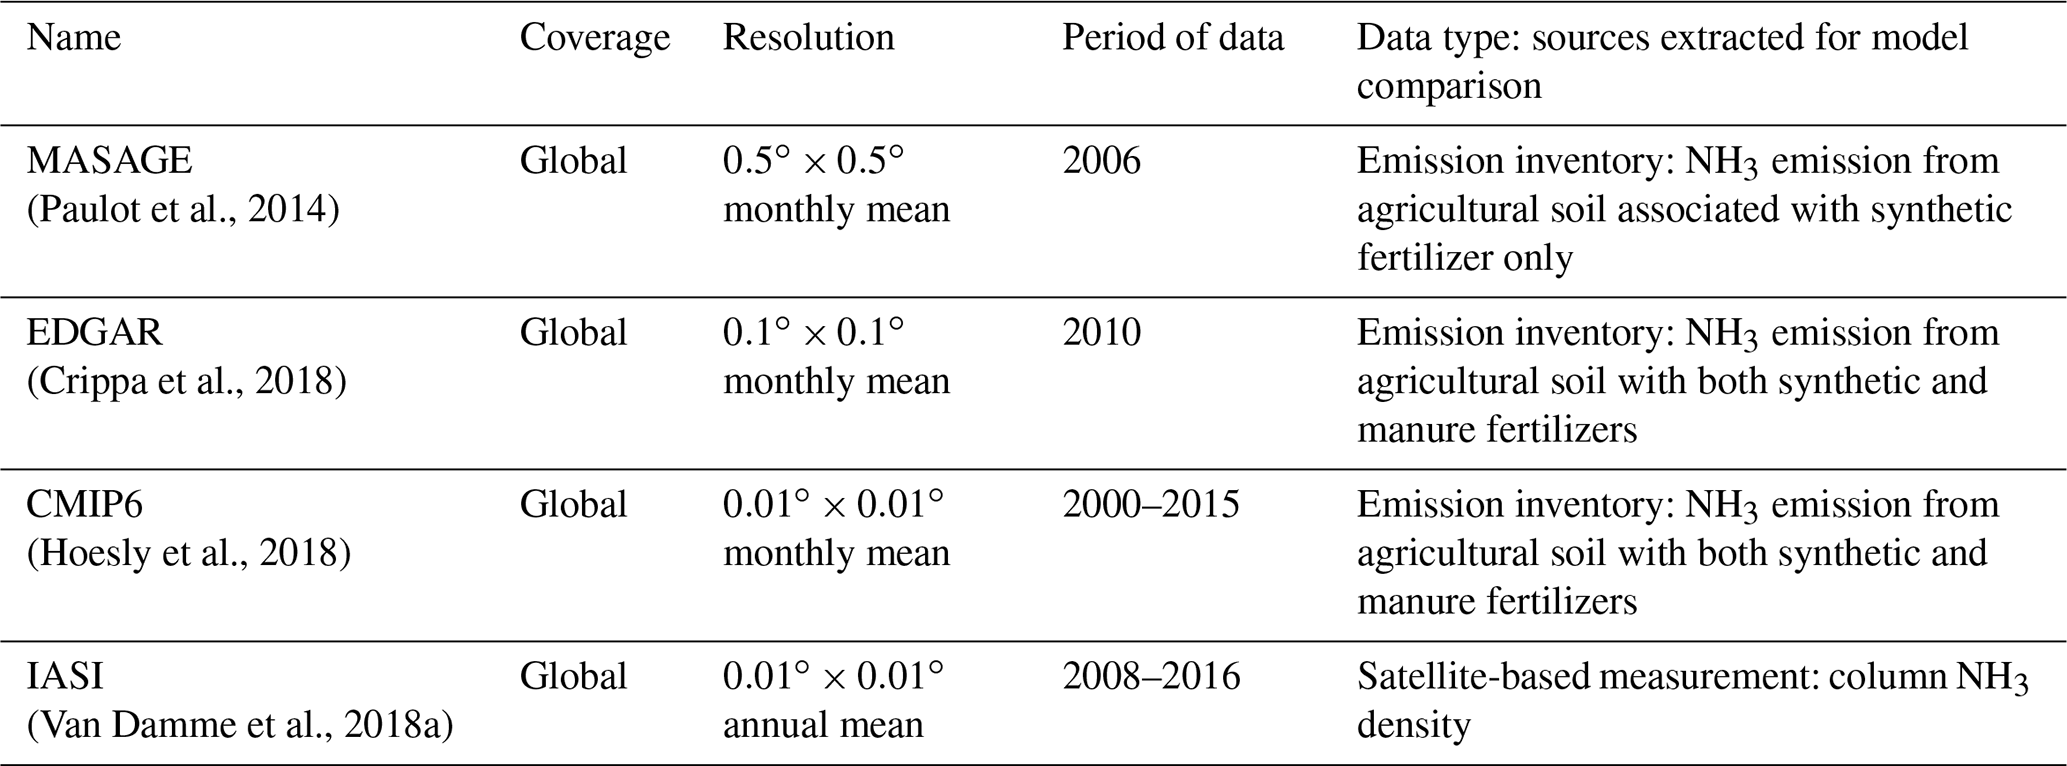
We also compared our simulation results with various available global observations and emission inventories. CLM5-modeled NH3 emission was compared with multiple emission inventories including CMIP6, EDGAR, and the Magnitude And Seasonality of Agricultural Emissions for NH3 (MASAGE). CAM4-chem-simulated atmospheric NH3 using CLM5 NH3 and CMIP6 was compared against the satellite-derived IASI NH3 concentration field (gridded and reported in Van Damme et al., 2018a). Details of these datasets are tabulated in Table 2. The datasets were regridded to match our model resolution of using bilinear interpolation. We note also that model–inventory comparisons are not meant to be exact given that our simulations were performed using free-running dynamics and thus did not necessarily match the meteorological years of the inventories, and the synthetic fertilizer use was not identical to the ones assumed when inventories were compiled. Thus, these results are presented as qualitative comparisons to indicate where our estimation is consistent with the inventories and where it is not.
Table 2Details of observations and emission inventories used in this study for model comparison and validation.
3.1 Fertilizer-induced NH3 emission
We first evaluated the fertilizer-induced NH3 emission simulated by the fully coupled land–atmosphere simulation, [CAM4_CLM5_2000]. Figure 2 shows the annual-total global NH3 emission at above-canopy level from different land types averaged over the remaining 20 years of simulation. We also compared our NH3 emission with inventory estimates reported by CMIP6 (Hoesly et al., 2018), EDGAR v4.3.2 (Crippa et al., 2018), and MASAGE (Paulot et al., 2014). We extracted the monthly fertilizer-induced NH3 emission estimates from MASAGE and assumed that one-third of the total agricultural NH3 emission reported by CMIP6 and EDGAR is associated with synthetic fertilizer, which is consistent with the apportionment reported in previous studies and environmental reports (Paulot et al., 2014; Riddick et al., 2016; National Oceanic and Atmospheric Administration, 2000; European Environment Agency, 2010; Gu et al., 2012; Paulot et al., 2015; Zheng et al., 2017).
Regional emission totals are summarized in Table 3. A grid-cell-by-grid-cell model–inventory spatial comparison of the annual-total NH3 emission rates was conducted by computing Pearson's correlation coefficients (R) and slopes (β) of linear regression using the reduced major axis method as well as normalized mean biases (NMBs; , where Mi and Oi are simulated and inventory NH3 emission in each grid cell) and mean fractional biases (MFBs; 2, where N is the number of grid cells). A summary of these statistics is shown in Fig. 2a. We also computed the R values between the monthly emission rates computed by CLM5 (as in the fully coupled case, [CAM4_CLM5_2000]) and each inventory for each grid cell (see Fig. 2d, f, and h). We highlighted with overlaying black dots the grid cells with high coefficients of determination, which are statistically significant (i.e., R2>0.5 and p<0.05), indicating where our simulation can reproduce more than half of the variability in the inventory estimates.
Table 3Regional fertilizer-induced NH3 emission totals (Tg N yr−1) estimated by our model and reported by other inventories.
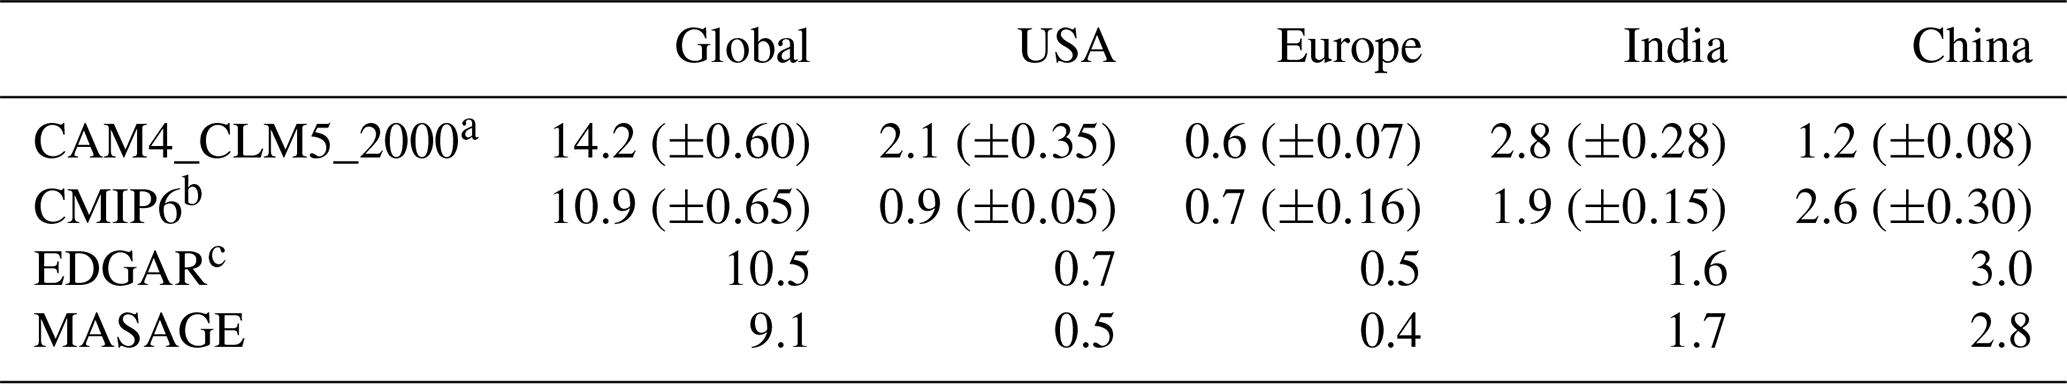
a SDs over 20 years shown in the brackets. b SDs over 16 years are shown in the brackets (2000–2015). c Variation in 2012 in both cultural statistics and emission factors ranged from 186 % to 294 % (Crippa et al., 2018).
Globally, CLM5 estimates that the annual-total fertilizer-induced NH3 emission reaches 14 Tg N yr−1, while the global fertilizer input is 96 Tg N yr−1 (of which 71 % is synthetic fertilizers). Our estimation is close to the 12 Tg N yr−1 (from synthetic fertilizer only) and 18 Tg N yr−1 (11 Tg N yr−1 from synthetic fertilizer and 6.5 Tg N yr−1 from manure application) reported by two similar studies, Riddick et al. (2016) and Vira et al. (2020), respectively. Our estimate is higher than all three inventories of NH3 emissions associated with synthetic fertilizers, which are 10 Tg N yr−1 for CMIP6 and EDGAR and 9.1 Tg N yr−1 for MASAGE. The global R values are positive and lie within 0.4–0.6 across all inventories, indicating a fairly good correlation between CLM5 and all three inventories, especially CMIP6 and MASAGE. Systematic model high biases are implied by the greater-than-unity β values, with small NMB and MFB values ranging between +32 %–+56 % and −22 %–+32 %, respectively.
Top food-producing countries are responsible for a major portion of the fertilizer-induced NH3 emission: 20 % of CLM5 global total was from India (2.8 Tg N yr−1), 15 % from the US (2.1 Tg N yr−1), and 8.6 % from China (1.2 Tg N yr−1). Emission hotspots are found close to their cropping regions in the model and the inventories, but their spatial gradients are different. In India, CLM5 shows more concentrated emission sources over the northern regions, resulting in higher local emission rates than the inventories. This distribution pattern resembles India's gradient of higher fertilization in the north and lower fertilization in the south adopted by the model. In contrast, CMIP6 estimates a more evenly distributed emission spatial pattern over India and higher emission rates over the southern regions. EDGAR and MASAGE show a spatial gradient of NH3 emission decreasing from north to south. Such gradients may explain their low R and high β values against our revised CLM5. Despite the spatial mismatch, the NMB (+68 %–+74 %) and MFB (+14 %–+15 %) for the model estimation over India are relatively small.
CLM5 estimates more intense emission hotspots in the US, which are located near the “Corn Belt” of the central US and southern California. US emission rates by CLM5 are much higher than the other three inventories, as seen in the difference maps in Fig. 2, as indicated by the large β (>3.2) and large regional NMB. Differences in the spatial distribution of NH3 emission are also observed over China. CLM5 estimates that more NH3 is emitted from central and northeastern China, while the emission hotspots in CMIP6 and EDGAR are found in northeastern China, and those of MASAGE are in eastern China. Such deviation may be attributable to different fertilizer usage schedules used by CLM5 and other inventories. For example, MASAGE considers multiple types of fertilizers that can be more or less prone to NH3 loss than urea (Bouwman et al., 2002) and assumes a three-stage fertilization at sowing, growth, and harvesting (Paulot et al., 2014). EDGAR also reported a high uncertainty (∼97 %) of present-day NH3 emissions in China due to incomplete information about the agricultural sector (Crippa et al., 2018).
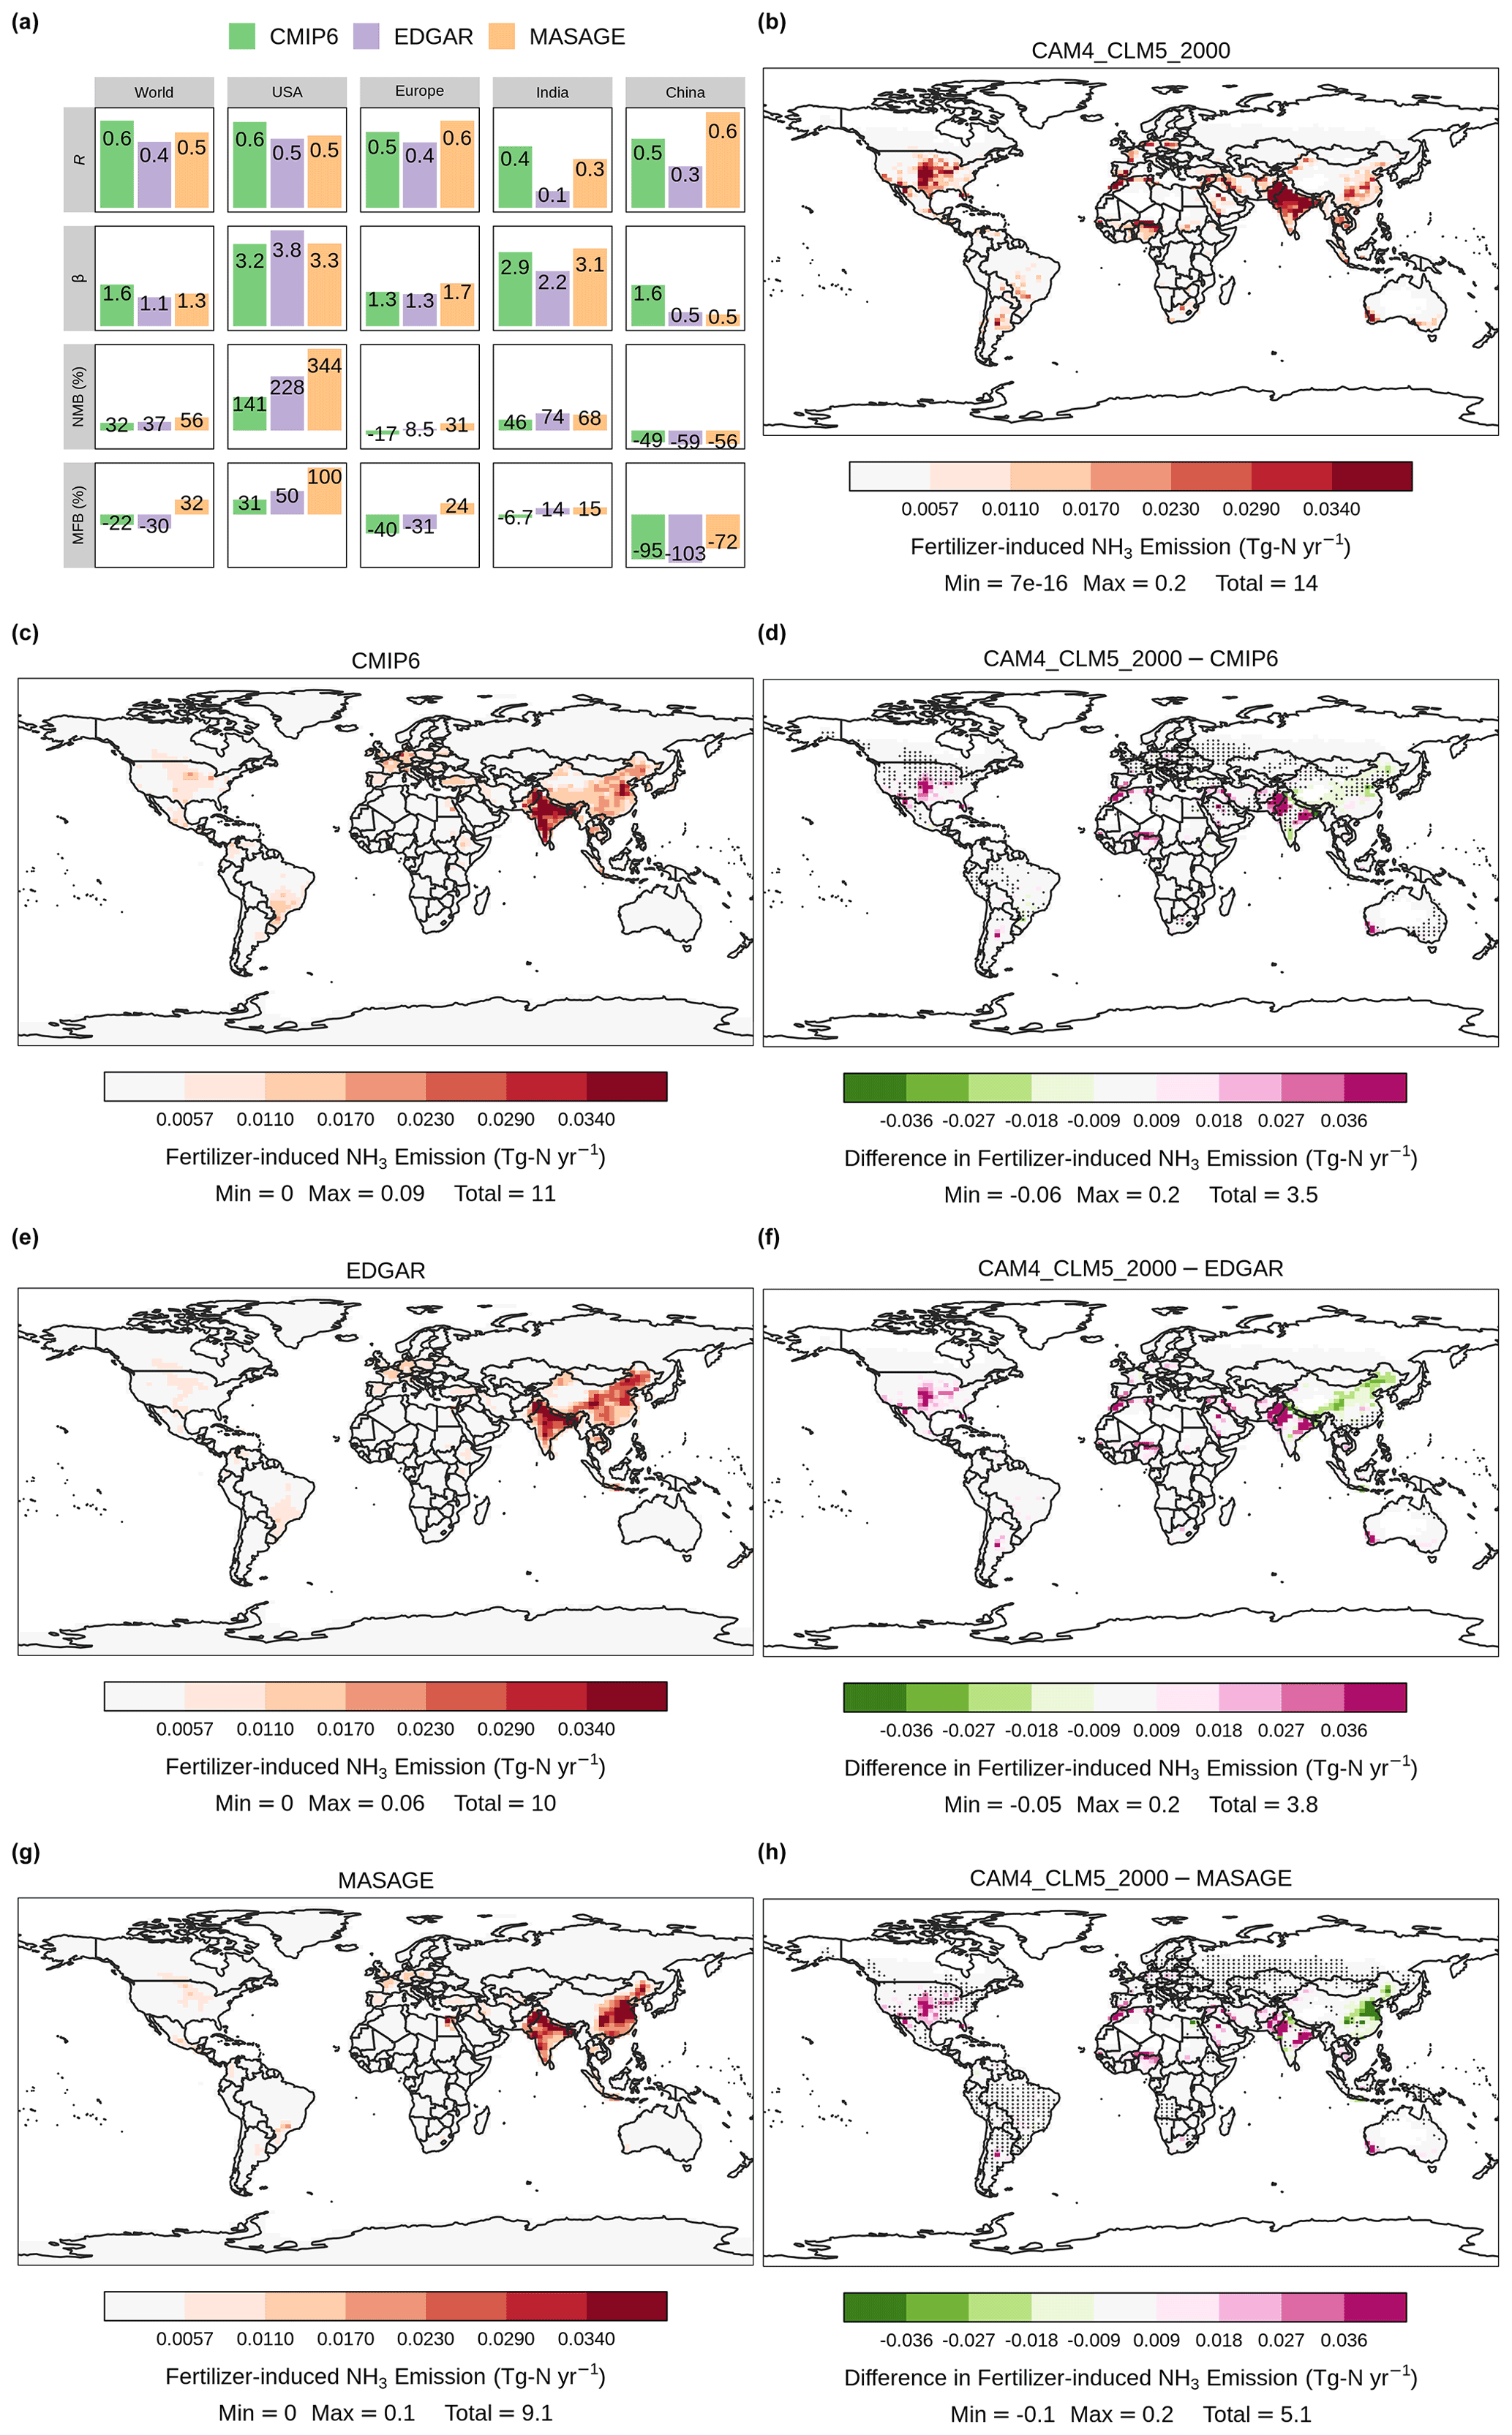
Figure 2Fertilizer-induced NH3 emission estimated by CLM5 (synthetic and manure) and other emission inventories (synthetic only). Correlation analysis between CLM5-simulated annual-total emission and other inventories with regional breakdowns is summarized in (a). Spatial distribution of annual-total fertilizer-induced NH3 emission simulated by [CAM4_CLM5_2000] and estimated by CMIP6, EDGAR, and MASAGE is illustrated in (b), (c), (e), and (g), respectively. Panels (d), (f), and (h) show the spatial distribution of differences in annual-total NH3 between CLM5 and CMIP6, EDGAR, and MASAGE, correspondingly. Overlaying black dots in the difference maps indicate grid cells with a high statistically significant spatiotemporal correlation (i.e., R2>50 %, p<0.05) between CLM5 and the corresponding inventories. Color scales are saturated at respective values, and ranges of values are shown in the legend titles.
Figure 3 shows the seasonality of NH3 emission associated with artificial fertilizer in the Northern Hemisphere and Southern Hemisphere. CLM5 assumes that each crop receives a specific amount of fertilizer (as soil NH applied evenly for 20 consecutive days since leaf emergence. This soil NH input speeds up plant uptake, microbial immobilization, nitrification, and NH3 volatilization, explaining the Northern Hemisphere peaking in emission in April and May and Southern Hemisphere peaking in October, overlapping with the regional cropping seasons. All inventories show springtime peaks in each hemisphere, but the peak of EDGAR always leads the others by a month. CMIP6 has multiple peaks (two in the Northern Hemisphere and three in the Southern Hemisphere). These deviations exist mainly because of the differences in planting schedule and duration of fertilization used by the inventories. The higher CLM5 peaks are consistent with the systematic overestimation discussed above. NH3 emission returns to “background” levels when it is not in the planting seasons. EDGAR and CMIP6 have higher background levels than MASAGE because the original estimates used in this study accounted for not only synthetic fertilizer but also manure application (for both) and management (for CMIP6 only), which are not necessarily in phase with the cropping seasons (Huijsmans et al., 2018).
We concluded our model–inventory comparison by computing the correlation of monthly NH3 emission rates in each model grid cell (see Fig. 2d, f, h). CLM5 can capture a large portion of emission hotspots of CMIP6 over the US, Europe, India, China, and South America. With MASAGE, our estimate shows good agreement over mid-range emission regions, in North America, South America, Europe, and southern Africa. CLM5 differs the most from EDGAR among the three inventories. The resemblance with CMIP6 and MASAGE indicates that our NH3 scheme has allowed CLM5 to produce reasonable NH3 emission inputs for CAM4-chem simulations over most high- to medium-emission hotspots. It is also noteworthy that the magnitude and spatial distribution of NH3 emission among inventories are also not consistent. Since environmental conditions control the rate of biological and chemical processes that release NH3, processes such as urea hydrolysis and equilibrium can induce further inventory uncertainties (Hoesly et al., 2018). Inter-inventory uncertainties are also attributable to the choice of global and/or regional emission factors, which is crucial to reflect different agricultural procedures across the world, such as fertilization methods and fertilizer types, but not always well represented in global inventories (Paulot and Jacob, 2014; Riddick et al., 2016; Zhang et al., 2018).
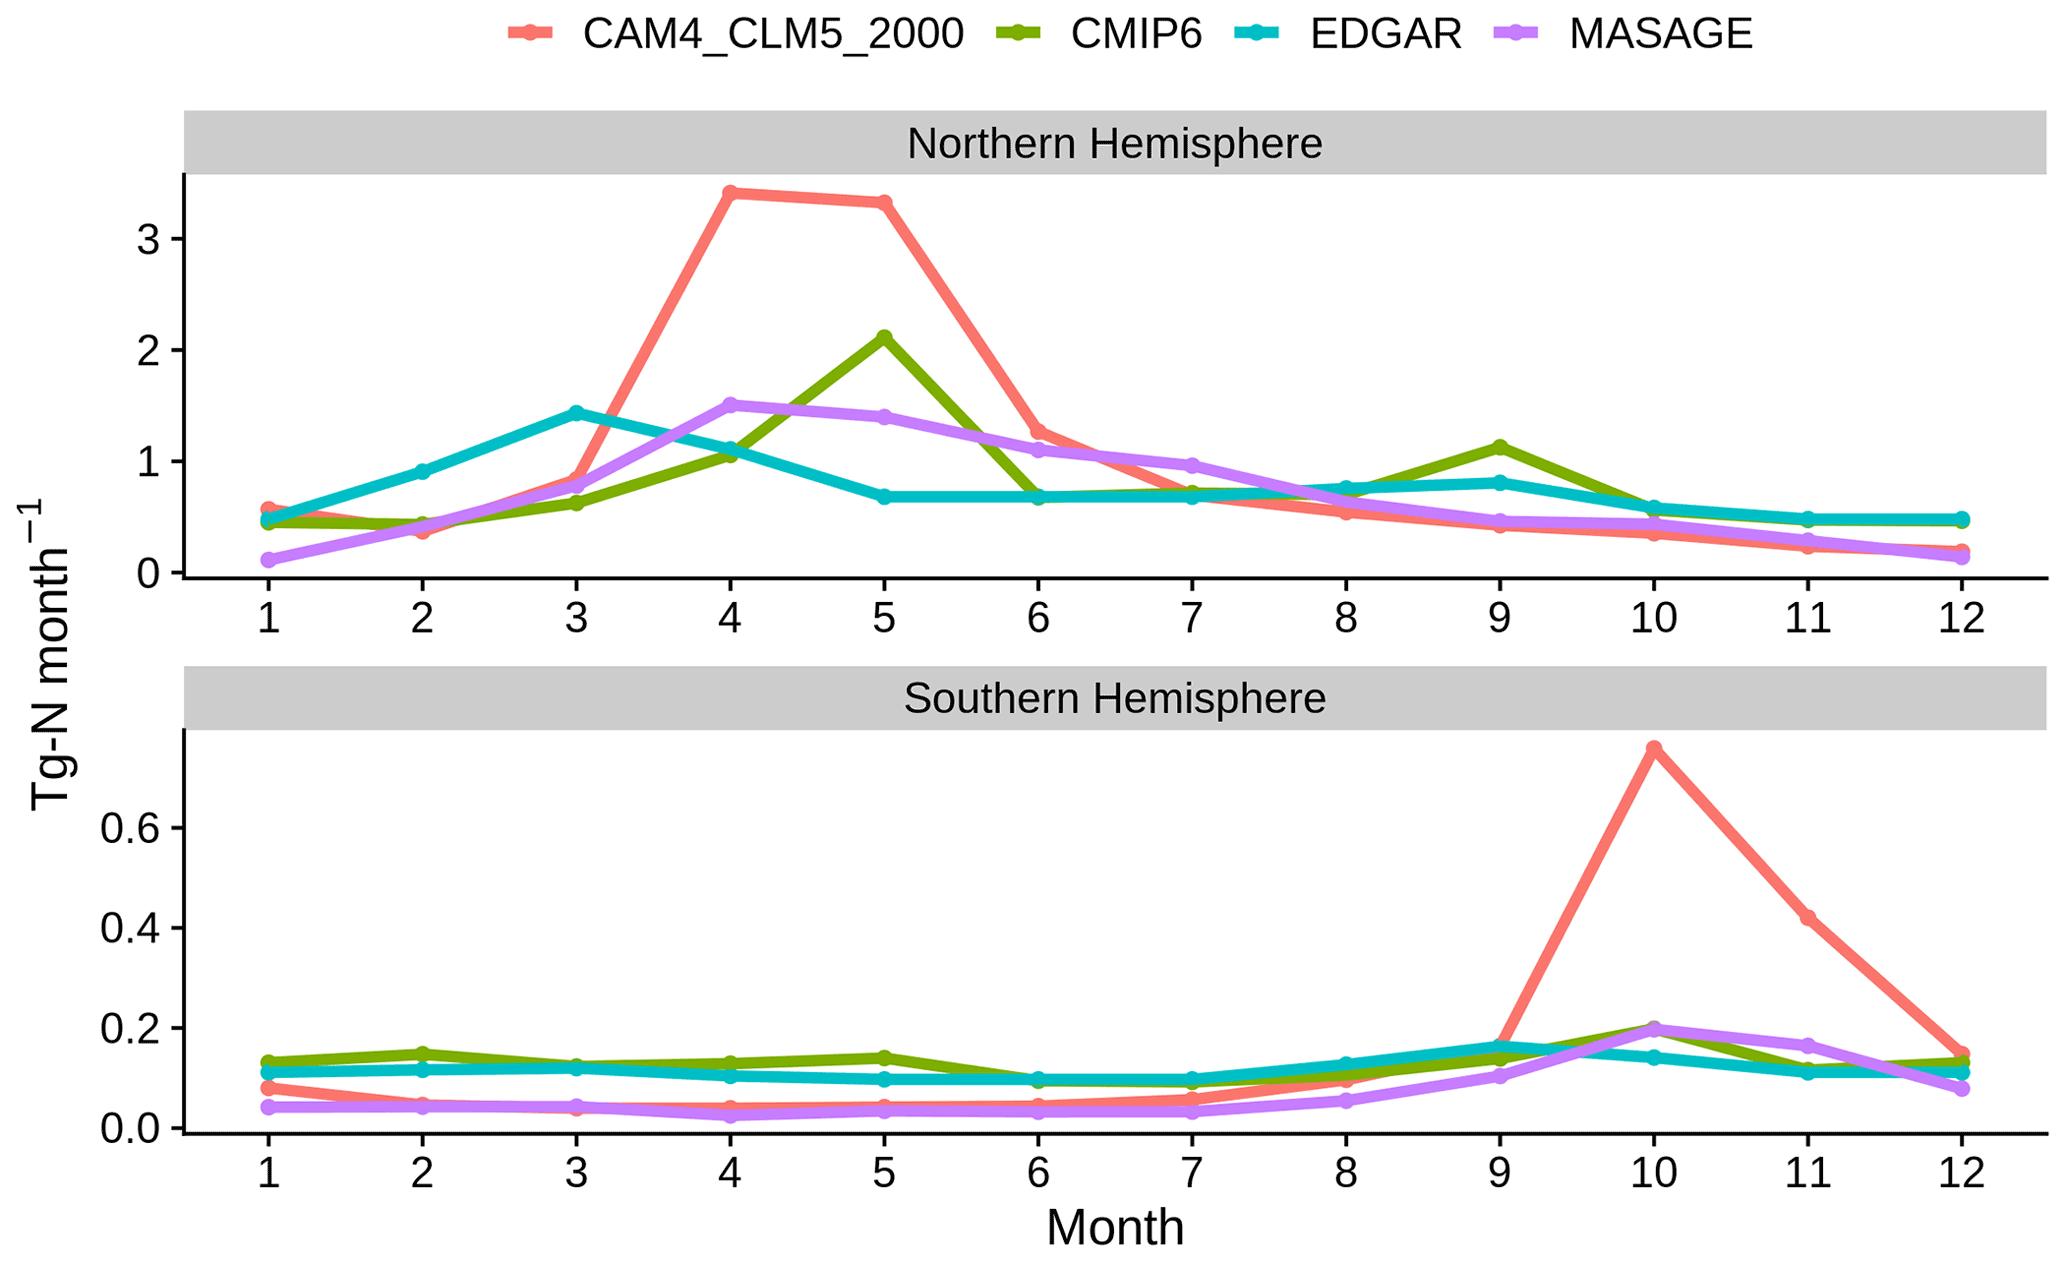
Figure 3Monthly NH3 emission associated with synthetic fertilizer use in the Northern Hemisphere and Southern Hemisphere estimated by CLM5, CMIP6, EDGAR, and MASAGE.
3.2 Atmospheric NH3 concentration
Previous studies have evaluated the reactive nitrogen processes in CESM against satellite and ground observations, e.g., depositional fluxes of NH3 and NH (Lamarque et al., 2013), and ground concentration of gaseous NH3 (He et al., 2015). Here, we estimated the CAM4-chem-simulated annual-mean atmospheric NH3 using two different sets of fertilizer-induced emissions: (1) simulated by our revised CLM5 ([CAM4_CLM5_2000]) and (2) one prescribed from CMIP6 ([CAM4_CMIP6_2000]). The sources of non-fertilizer-related NH3 and other reactive gases were identical in these two cases. Figure 4 shows these results, aggregated to column total NH3, alongside the 8-year annual-average IASI satellite retrievals.
Both simulations can capture the high NH3 zones observed by IASI over the US, South America, and Europe, with global and regional R values >0.5, indicating a good correlation between the modeled results and observations. However, both [CAM4_CLM5_2000] and [CAM4_CMIP6_2000] NH3 are generally lower than IASI. One except is over India, in which [CAM4_CLM5_2000] estimates higher than IASI with a regional β of 3.3. [CAM4_CLM5_2000] matches IASI better over the US (regional β=0.9), where CLM5 estimates high emission rates. Even more significant underestimation is seen in [CAM4_CMIP6_2000] (regional β=0.5) over the US. The magnitudes of NMB and MFB of [CAM4_CLM5_2000] are less negative than [CAM4_CMIP6_2000] in most regions, reflecting the fact that using CLM5 as NH3 emission input reduces the model NH3 underestimation of CAM4-chem with the default CMIP6 inventory.
Mild differences are seen in North America and northeastern China, which are both intense agricultural regions; the discrepancies are likely attributable to the mismatch in crop growth map between CLM5 and the real world. Larger differences are shown over India and western Europe, indicating the low biases in the model of emission from tropical biomass burning regions (Whitburn et al., 2017; Van Damme et al., 2018a).
We further compared the NH3 burden of a run with online NH3 emission but prescribed N deposition, i.e., [CAM4_CLM5_CLIM_2000], against IASI to examine whether enabling the online bidirectional exchange can improve the estimation of NH3 in CLM5. The global-total NH3 emission increases by 0.45 % by enabling dynamic nitrogen deposition ([CAM4_CLM5_2000]–[CAM4_CLM5_CLIM_2000]), while the regional changes are not uniform (Fig. S3). The most prominent increase is found in Asia (+0.06 Tg N yr−1 or +0.9 % regionally), while the largest decrease is seen in Europe (−0.03 Tg N yr−1 or −2.9 %). When compared with IASI, [CAM4_CLM5_2000] and [CAM4_CLM5_CLIM_2000] both have closer-to-one β and closer-to-zero NMB and MFB than [CAM4_CMIP6_2000] (Fig. S4), indicating that coupling the land–atmosphere N cycle could reduce model low bias.
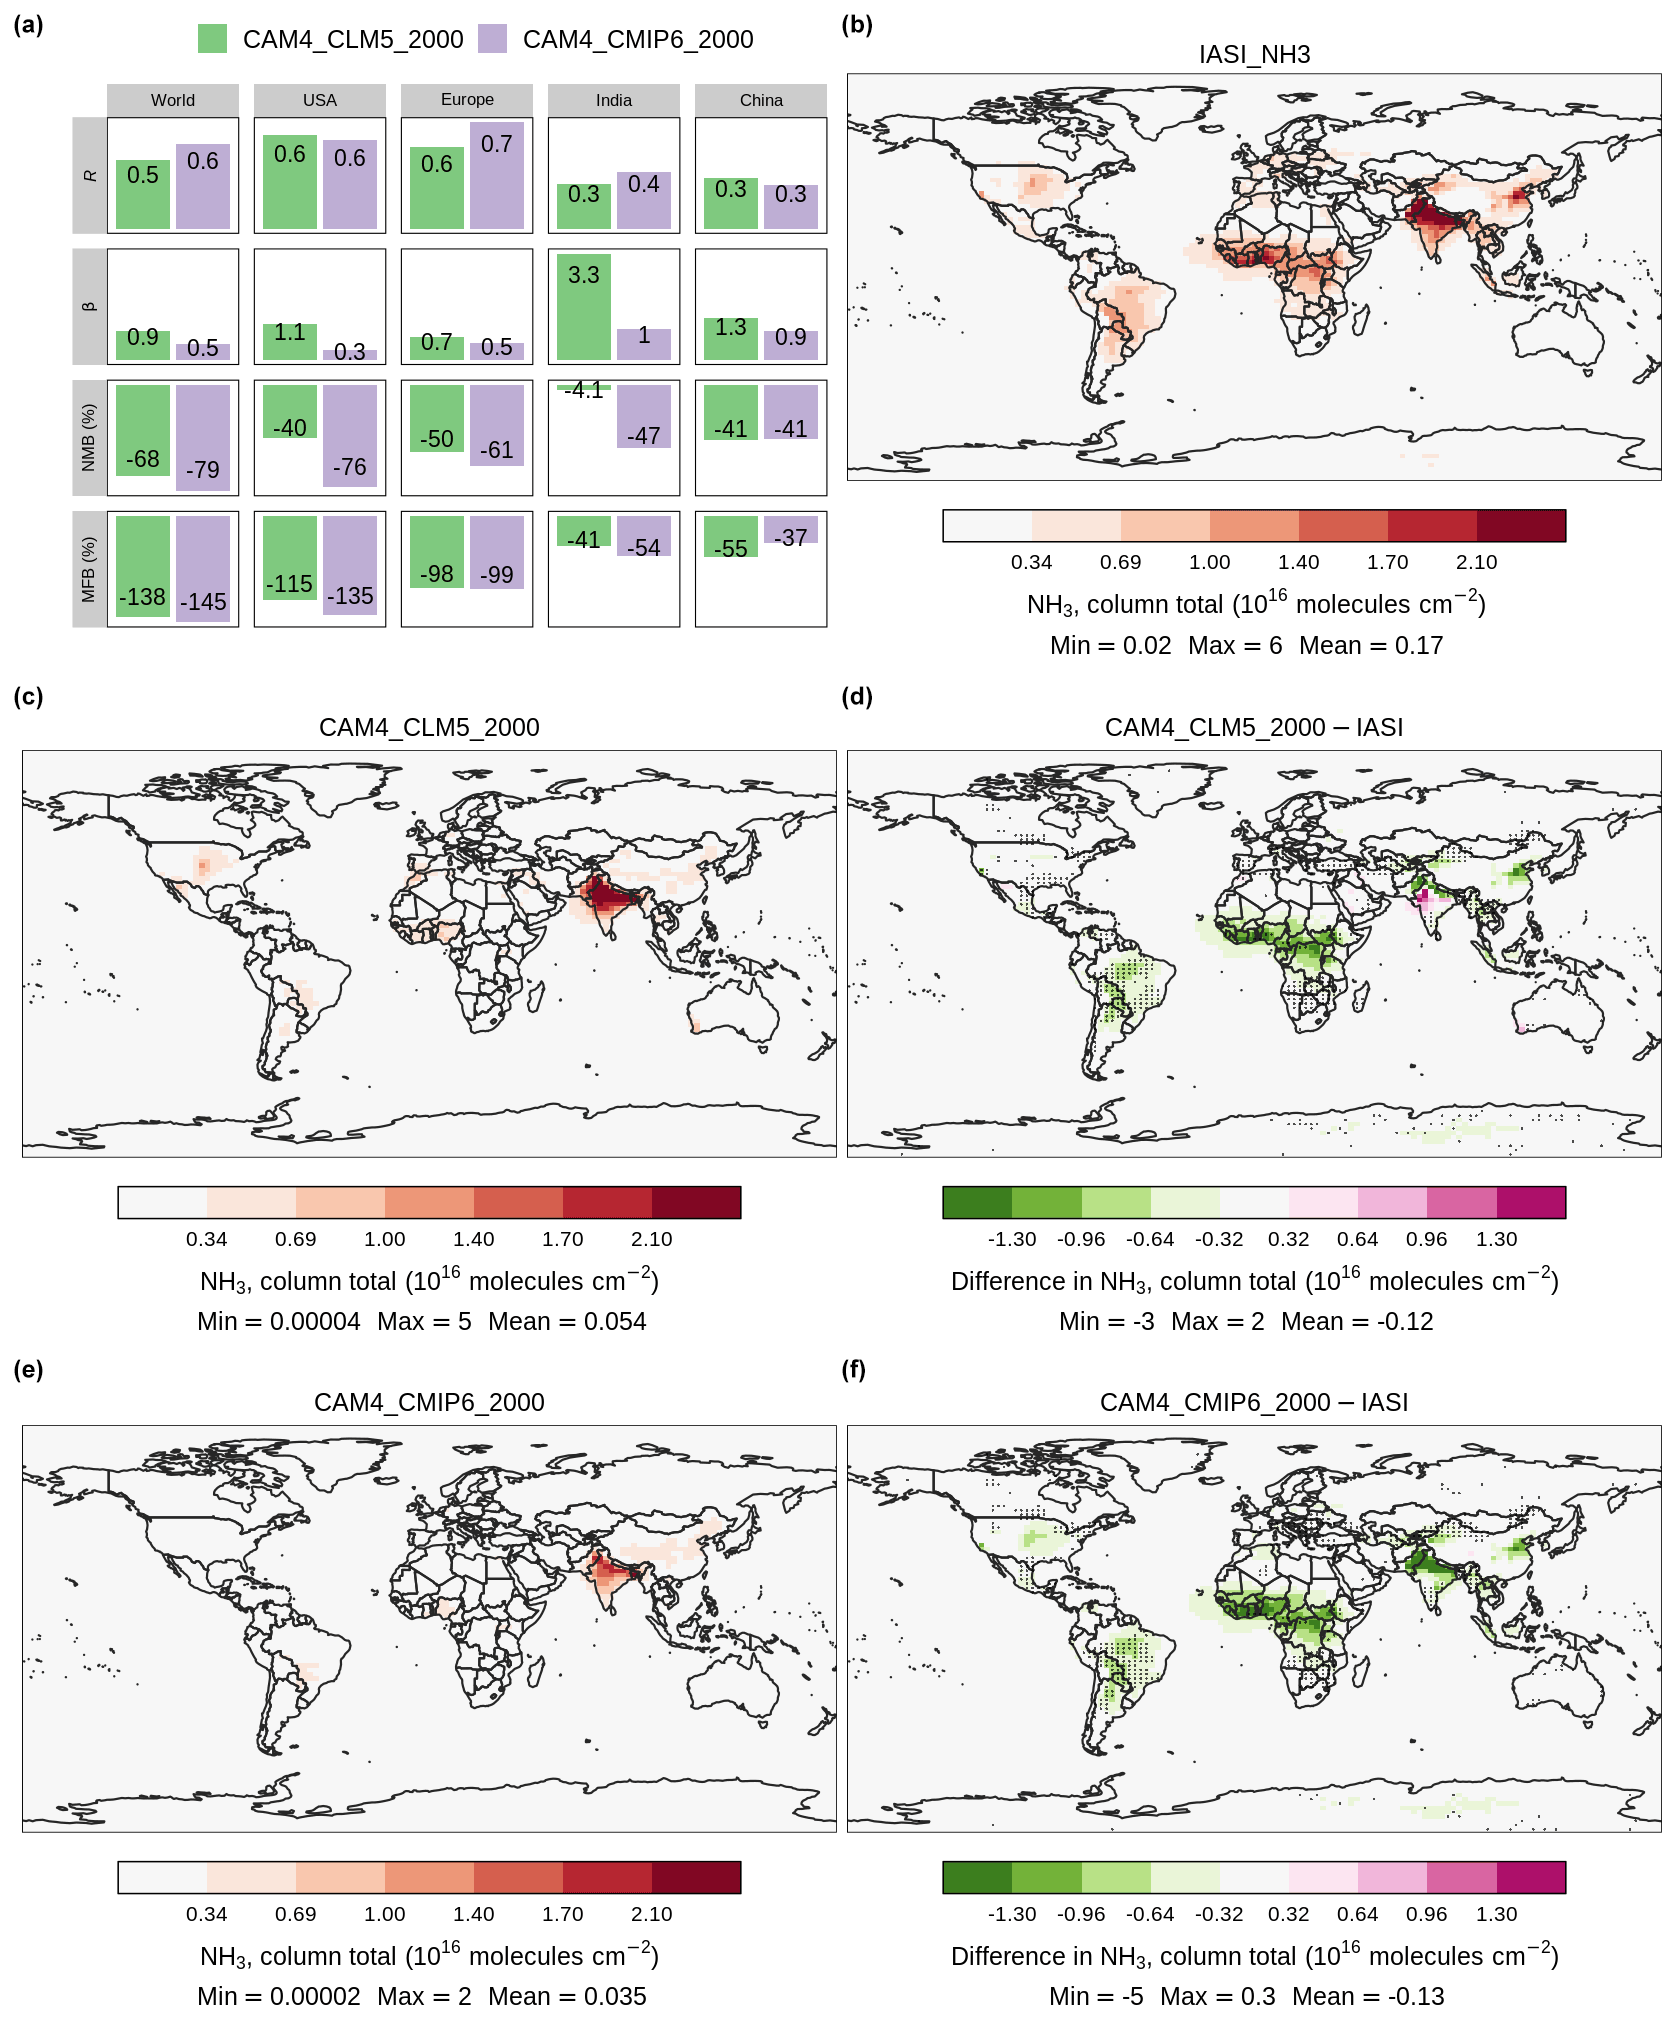
Figure 4Annual-mean atmospheric NH3 estimated by CAM4-chem with online CLM5 simulation and CMIP6 emission inventory as inputs of fertilizer-induced NH3 emission, which are aliased as [CAM4_CLM5_2000] and [CAM4_CMIP6_2000], respectively. Panel (a) summarizes the correlation analysis between the two simulations and the IASI satellite retrievals. Panels (b), (c), and (e) show the column NH3 concentration of IASI and the two cases correspondingly. Panels (d) and (f) show concentration differences between each case and the IASI observations. Overlaying black dots in the difference maps indicate grid cells with a high statistically significant spatiotemporal correlation (i.e., R2>50 %, p<0.05) between CLM5 and IASI. Color scales are saturated at respective values, and ranges of values are shown in the legend titles.
3.3 When 30 % more synthetic fertilizer is applied globally – a case study to reveal the importance of nitrogen deposition and aerosol–climate effect on NH3 emission and grain production in a future scenario
Fertilizer use is predicted to increase by >30 % of the 2000 level to boost grain production to meet the fast-growing food demand by 2050 (FAO, 2007). Such injection of soil nitrogen will not only enhance soil NH3 emission but also alter atmospheric NH formation and its subsequent climate effects and deposition, which will induce secondary impacts on crop growth and NH3 re-emission. Here, we used the modified CLM5 and CAM4-chem to attribute such secondary impacts to nitrogen deposition and the aerosol–climate effect. We performed this case study by scaling up the amounts of synthetic fertilizer application by 30 % globally as input to the simulations detailed in Table 1. The application rate of manure fertilizer was assumed to be at the same level in both scenarios since increased usage would likely raise nitrogen leakage during production and transportation, which is difficult to quantify and beyond the scope of this study.
Table 4 summarizes the changes in annual-total fertilizer-induced NH3 emission estimated by these simulations when the global synthetic fertilizer use rises to 130 % of the 2000 level. The total fertilization rate at the 2050 level was 117 Tg N yr−1 (or +21 % from the present-day total fertilization rate at 96.5 Tg N yr−1, which is comparable to ∼100 Tg N yr−1 suggested by FAO, 2008). We also computed the nitrogen leakage ratio (NLR) and nitrogen use efficiency (NUE) for each case. NLR remains at ∼15 % for [CAM4_CLM5_2000] and [CAM4_CLM5_2050], while NUE decreases from 23 % to 22 %, respectively, indicating that the crops are under nitrogen surplus under this future fertilization scenario. This is also confirmed by the reduced ratio of crop uptake to fertilization from ∼130 % to ∼115 % (Table S3).
Table 4Summary of N fluxes in the simulations averaged over 20 years.
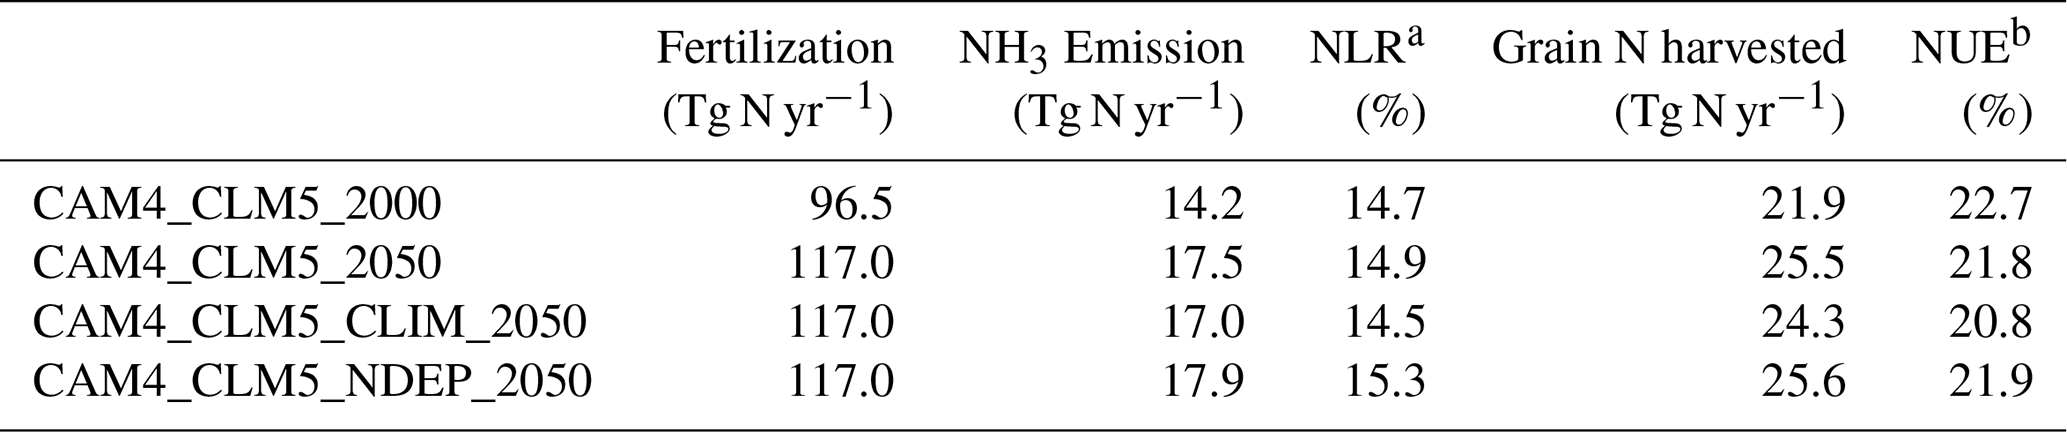
a Nitrogen leakage ratio (NLR) = NH3 emission fertilization. b Nitrogen use efficiency (NUE) = grain N harvested/fertilization.
Figure 5b shows the changes in the fully coupled case, [CAM4_CLM5_2050], which estimated that global emission will rise by 3.3 Tg N yr−1 of fertilizer-associated NH3 emission than the baseline case, i.e., [CAM4_CLM5_2000]. The super-linear increase in NH3 emission (+24 %) relative to total fertilizer (+21 %) is associated with a sub-linear rise in nitrification (+17 %), crop uptake (+5.8 %), and other loss processes of soil NH. It is a result of a larger tendency of NH3 volatilization compared to other loss processes during the 20 d of intensive fertilizer application, highlighting that our model modifications enabled CLM5 to simulate the dynamic competing processes of soil nitrogen. Regionally, changes in Indian and Chinese emissions are the highest, generally overlapping with the high fertilization zones (Fig. S5), totaling +1.6 Tg N yr−1 or +24 % for Asia relative to the baseline.
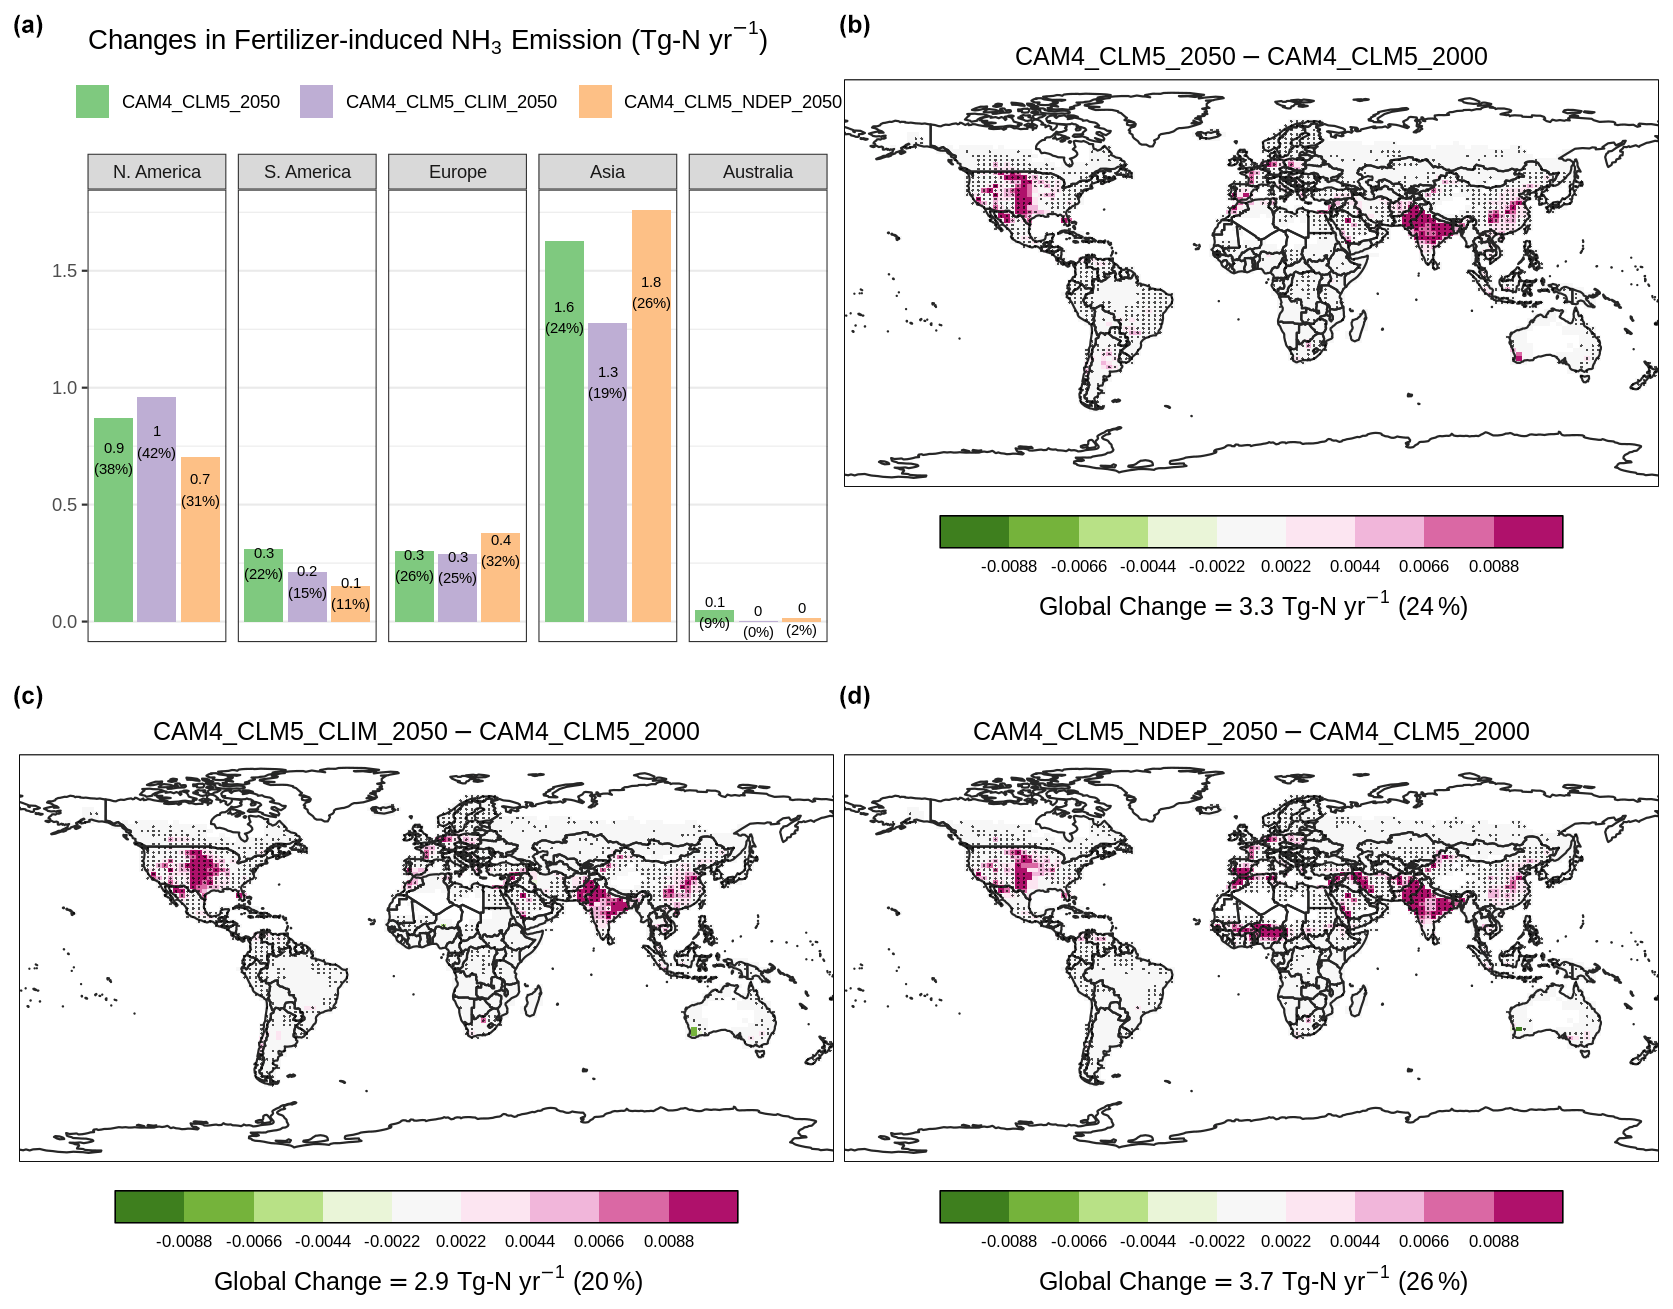
Figure 5Changes in annual-total fertilizer-induced NH3 emission at the present-day synthetic fertilizer usage in the future scenario. Panel (a) summarizes regional changes relative to [CAM4_CLM5_2000]. Spatial distribution of the changes from [CAM4_CLM5_2000] with [CAM4_CLM5_2050] is shown in (b), with [CAM4_CLM5_CLIM_2050] in (c), and with [CAM4_CLM5_NDEP_2050] in (d). Overlaying black dots indicate grid cells with a statistically significant difference under two-sample t tests (i.e., p<0.05) between corresponding simulations. Color scales are saturated at respective values.
CLM5 assumes a harvest efficiency of 85 % (Lawrence et al., 2018). [CAM4_CLM5_2050] estimated that, with nitrogen deposition and the aerosol climate effect, 243 Tg more grain (in dry matter hereinafter) is produced per year than the baseline (see Fig. 6b). Such enhancement is found dominantly over the food-producing regions over Europe (+76 Tg yr−1 or +17 %) and North America (+78 Tg yr−1 or +17 %). The grain production in Asia has divergent responses to induced fertilizers (increases in northern China and decreases in southern India). This results in a smaller Asian grain production increase of +55 Tg yr−1 (+4 %).
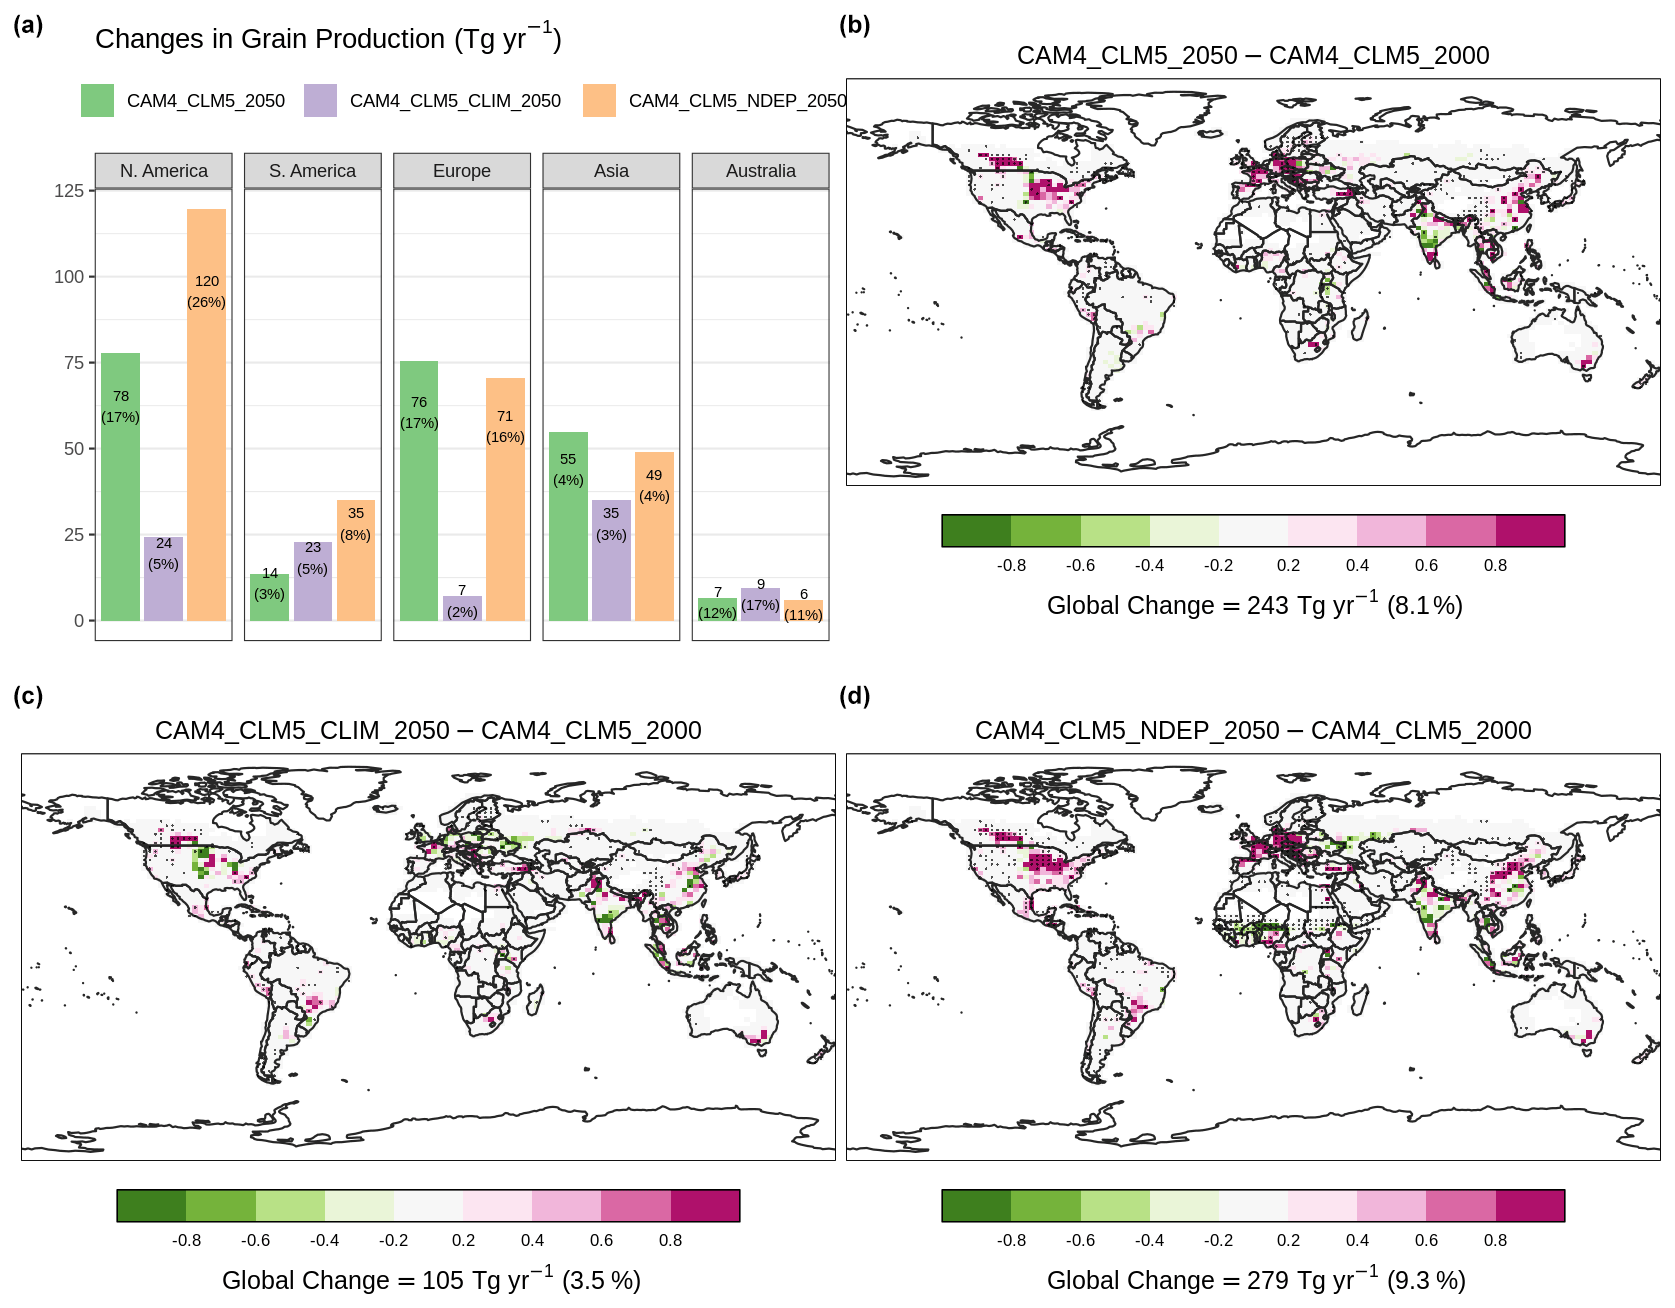
Figure 6Same as Fig. 5 but for annual-total grain production (in teragrams of dry matter per year).
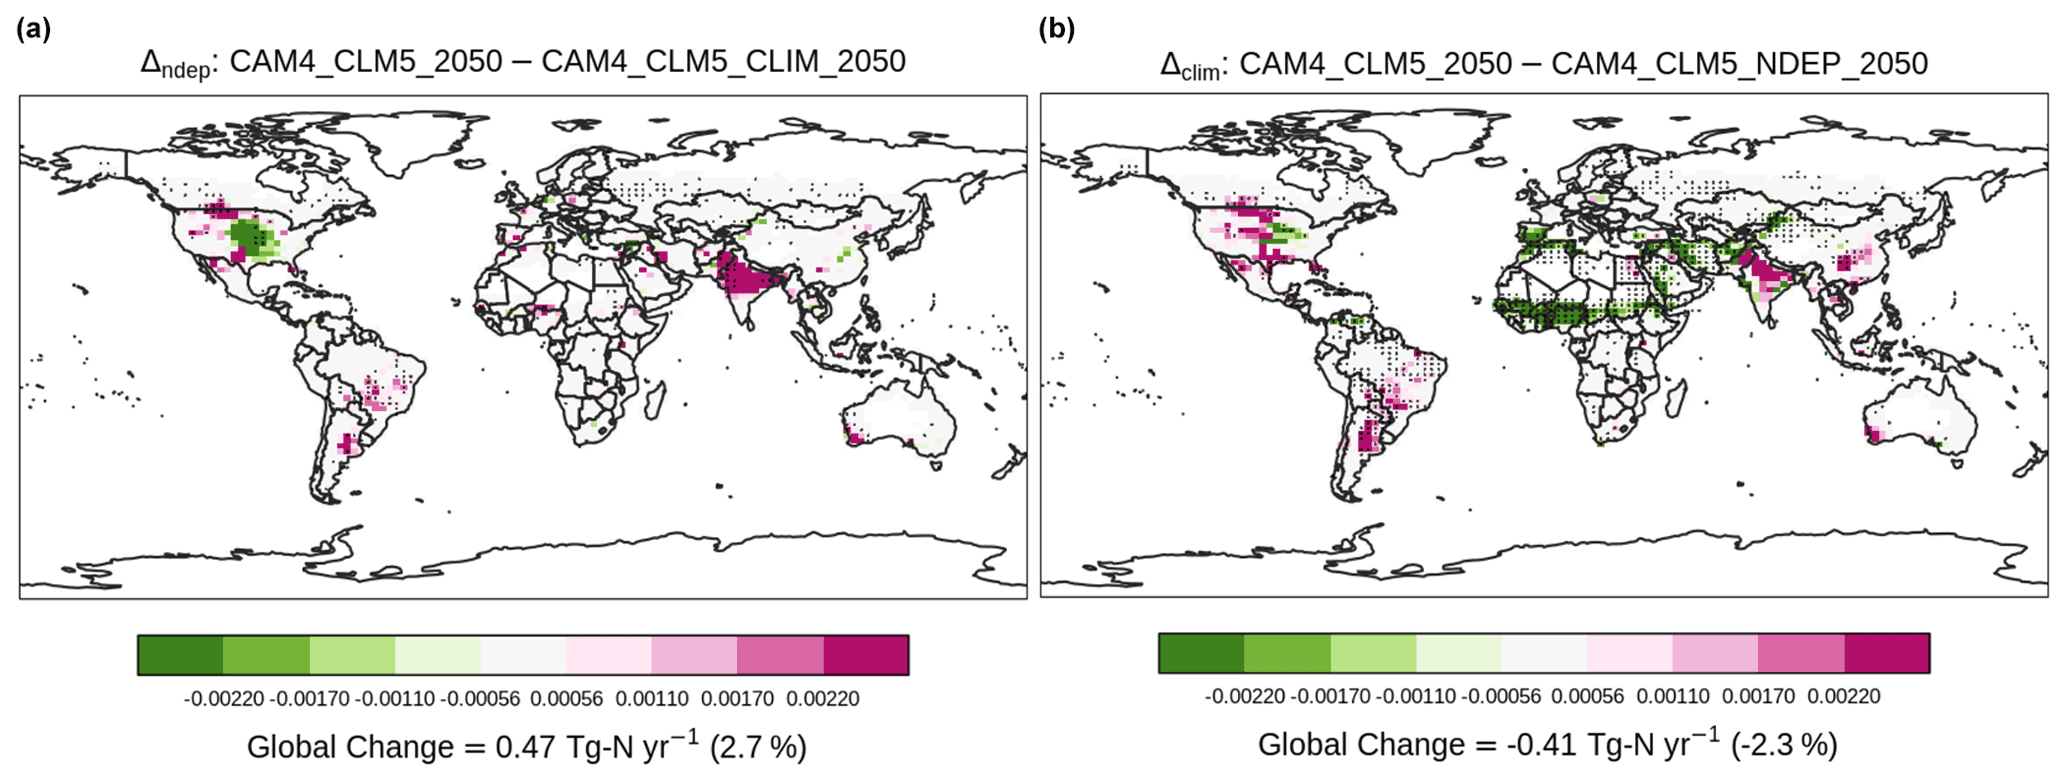
Figure 7Contrasting the difference in NH3 emission (Tg N yr−1). Overlaying black dots indicate grid cells with a statistically significant difference under two-sample t tests (i.e., p<0.05) between corresponding simulations. Only results of grid cells with croplands are shown.
We evaluated the impacts of dynamic processes in our simulations by comparing the fully coupled simulation with other cases, i.e., the effects of including dynamic nitrogen deposition (Δndep = [CAM4_CLM5_2050]–[CAM4_CLM5_CLIM_2050]) and aerosol–climate interaction (Δclim = [CAM4_CLM5_2050]–[CAM4_CLM5_NDEP_2050]) in the model.
As agricultural NH3 is injected to the atmosphere, it rapidly neutralizes other acidic chemicals and facilitates the formation of particulate NH. Some of the nitrogen particles return to the surface via deposition, sequentially fuel soil NH3 emission, and boost crop growth. Our simulation shows that nitrogen deposition is enhanced by 1.6 Tg N yr−1, mostly in the US and India (Fig. S8a). It translates to an increased NH3 emission by 0.47 Tg N yr−1 globally (Fig. 7), but the enhancement is seen mostly in India. In contrast, there is a decrease in NH3 emission over the US. The increase (decrease) is associated with a higher (lower) annual-mean surface temperature (Fig. S9a). In addition to directly enhancing the tendency of NH3 volatilization, a warmer surface temperature also shortens the crop growth and grain filling period, resulting in lower crop nitrogen uptake (Fig. S10a) and less grain production (Fig. 8a), e.g., in India. Though the impacts of the larger nitrogen deposition in Δndep are not evenly distributed spatially, it boosts grain production by 138 Tg N globally.
On the other hand, we expected that the sulfate aerosols induced by agricultural NH3, which directly increases aerosol albedo, would reduce the amount of insolation reaching the Earth's surface. Comparing the 2000 and 2050 fertilization levels, our fully coupled simulation estimated −0.005 W m−2 in global downward radiative flux (i.e., cooling), which is virtually negligible compared to the 16-model mean total anthropogenic aerosol radiative forcing of −0.27 W m−2 reported in (Myhre et al., 2013). Though the global impact is also negligible (+0.004 W m−2), Δclim reveals a substantial regional cooling at the surface level (Fig. S11b) largely because there are more prognostic dusts in [CAM4_CLM5_2050] over sub-Saharan Africa than prescribed in [CAM4_CLM5_NDEP_2050]. Such a cooling effect results in lower surface temperature (Fig. S9b) and also suppression of the formation of particulate sulfate (Fig. S12b). These changes in surface temperature reduce NH3 emission substantially over Africa while promoting NH3 volatilization in India and North and South America, resulting in a net decrease by 0.41 Tg N yr−1 globally. Grain production decreases by 36 Tg N yr−1 in Δclim, indicating that the warming induced by aerosol–radiation interaction partly offsets the benefit of nitrogen deposition as an extra input of soil NH for crop growth and yield, though the deposition rate is increased slightly over the US (Fig. S8b).
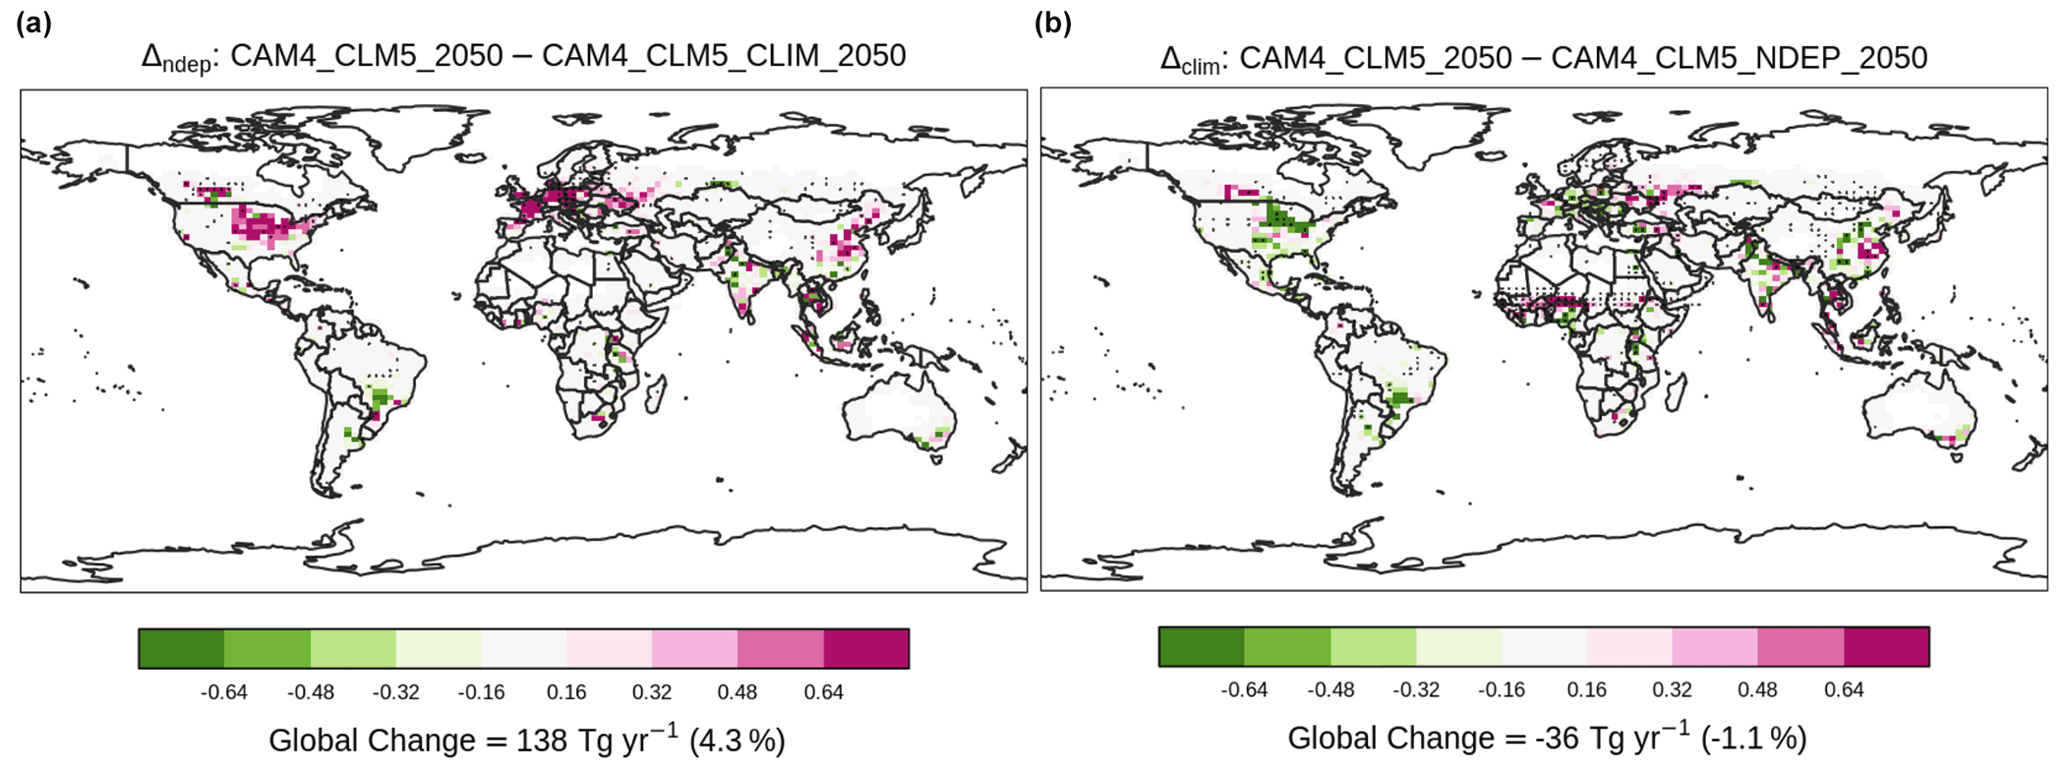
Figure 8Contrasting the difference in grain production (teragrams of dry matter per year). Overlaying black dots indicate grid cells with a statistically significant difference under two-sample t tests (i.e., p<0.05) between corresponding simulations. Only results of grid cells with croplands are shown.
In this study, we implemented into the land and biogeochemical model, CLM5, new mechanistic schemes to better represent fertilizer-induced NH3 emission from agricultural soil. Our modifications allowed CLM5 and CAM4-chem to dynamically exchange fluxes associated with reactive nitrogen deposition and NH3 emission. These new features enabled CESM2 to perform a more reliable estimation of soil NH3 emission and atmospheric NH3 concentration than using constant emission inventory values under dynamic climate and environmental conditions. We verified that a fully coupled simulation case, [CAM4_CLM5_2000], produced an estimation of NH3 emission that agrees fairly well spatially and temporally with the emission inventories, MASAGE (Paulot et al., 2014) and CMIP6 (Hoesly et al., 2018), especially over high-emission regions (see Fig. 2). When compared to the IASI satellite observations (Van Damme et al., 2018a), online NH3 emission input in CLM5 reduces the low biases exhibited in CAM4-chem estimation of atmospheric NH3 using the CMIP6 NH3 emission inventory.
Our modifications also enabled us to understand how NH3 emission influences aerosol formation and aerosol radiative effect and their secondary impacts on the re-emission of NH3 and grain production. Our fully coupled simulation, [CAM4_CLM5_2000], recreates the spatial distribution of the emission hotspots observed by satellite over intensive agricultural regions including China, India, Europe, and the US (see Fig. 4). We also estimate that if the synthetic fertilizer use were to increase by 30 % from the 2000 level, NH3 emission would rise by 3.3 Tg N yr−1 globally (see Fig. 5). We further performed two simulations to highlight the importance of including a fully coupled nitrogen cycle in the model. Our results showed that lacking dynamic N deposition would underestimate NH3 emission and grain production under intensified fertilization, while ignoring the aerosol–radiation interaction would lead to overestimation.
This study demonstrates a modeling approach to estimate the climatic and environmental sensitivity of NH3 emission, with a focus on sources associated with manure and synthetic fertilizer only. Other primary sources of atmospheric NH3 include manure management and application (47 %), ocean (16 %), and biomass burning (11 %) (e.g., Bouwman et al., 1997; Sutton et al., 2013; Paulot et al., 2014, 2015). Unlike soil emission, whereby the volatilization of NH3 depends on a series of biogeochemical processes, emissions associated with manure management are typically estimated differently, e.g., collecting activity data and emission factors from factory managers and installing monitoring instruments at outlets of confined facilities such as animal factories (Bouwman et al., 1997; Paulot et al., 2014). Manure production, storage, and usage can be collected by surveying practices adopted by farmers, while its associated NH3 emission can be estimated using source-specific emission factors and weather data, especially dominant factors such as air temperature, wind speed, and humidity. Fire emission directly injects the reactive nitrogen into the atmosphere, and satellite measurement is capable of capturing such short-term ammonia blooms (Van Damme et al., 2017). We did not include manure management in our study due to the high uncertainty and data insufficiency for validation. It is noteworthy that manure is attributable to up to ∼60 % of total soil NH3 emission (Vira et al., 2020) and hence shall warrant further research efforts in terms of its downstream impact on ecosystems via nitrogen deposition and aerosol radiative effect.
We also incorporated a prognostic parameterization for canopy capture of the emitted NH3, which is an improvement when compared to previous studies that assigned blanket reduction factors to all vegetated land types (Bouwman et al., 1997; Riddick et al., 2016; Vira et al., 2020). Despite such addition, our model still shows systematic high biases, implying room for improvement, including further calibration of the canopy capture effects against field measurements. Another source of uncertainty stems from the model's initial soil NH content, which determines the potential emission rate of NH3. The overestimation by CLM5 in this study may point to the more-fertile-than-reality soil conditions in the model, highlighting the need for a more realistic soil nitrogen map compiled by field surveys to better constrain the initial conditions for the model. We also note that such field surveys, especially in underrepresented regions with low data coverage, would also be useful to infer a soil pH map that constrains the uncertainty in simulations using a constant pH, like those reported in this study.
Our schemes simplified the fate of NH3 captured by the canopy and assumed that such NH3 is returned to the soil and becomes immediately accessible to plants, soil microbes, and bacteria, due to limited knowledge of the consequences of the canopy capturing process. A chamber study suggested that soybean can absorb up to 20 kg N ha−1 of NH3 via leaf capturing (Hutchinson et al., 1972), which is a significant amount compared to average fertilizer use for soybean of 13–45 kg N ha−1 in CLM5. On the other hand, concentrated NH3 could damage leaf tissues if the contacting plant fails to metabolize or detoxify such a reactive gas in time (Nemitz et al., 2001). The remaining captured NH3 on the leaf surface can return to the soil via throughfall, but its magnitude is difficult to measure. These unspecified processes may induce uncertainties in our simulations, especially for plant growth and soil NH content. This knowledge gap points to a demand for more field experiments to investigate the impacts of these processes.
FAO projects that fertilizer use will be increased by >30 % (FAO, 2007) to boost food production to meet the fast-growing food demand by 2050. Such additional fertilizer injects mineral nitrogen into the soil that further fuels the volatilization of NH3 spontaneously and hence promotes the subsequent formation of aerosol particles. This study shows the nonlinear impacts of nitrogen deposition and aerosol radiative effect on the environment. Thus, our work makes it possible to evaluate the intertwined consequences of such soaring use of fertilizer on NH3 emission, atmospheric aerosol composition, and the corresponding aerosol–climate effect. Our results can provide scientific information to aid stakeholders in evaluating various global and regional plans for mitigating climate change and safeguarding a sustainable environment.
The modified codes of CESM2 developed in this study will be available will be available upon request.
The NH3 satellite data mentioned in this study were obtained from the PANGAEA repository (https://doi.org/10.1594/PANGAEA.894736) (Van Damme at al., 2018b).
The supplement related to this article is available online at: https://doi.org/10.5194/bg-19-1635-2022-supplement.
All co-authors participated in designing the experiments. KMF and MVM developed the model code. KMF performed the simulations. KMF prepared the manuscript with contributions from all co-authors.
The contact author has declared that neither they nor their co-authors have any competing interests.
Publisher's note: Copernicus Publications remains neutral with regard to jurisdictional claims in published maps and institutional affiliations.
Maria Val Martin acknowledges funding from the Leverhulme Trust through a Leverhulme Research Centre award (grant no. RC-2015-029) and the UKRI Future Leaders Fellowship program (grant no. MR/T019867/1). We would also like to acknowledge the high-performance computing support from Cheyenne (https://doi.org/10.5065/D6RX99HX) provided by the NCAR's Computational and Information Systems Laboratory, sponsored by the National Science Foundation. We also thank the reviewers of this paper for their constructive feedback.
This work was supported by the General Research Fund (project no. 14323116) and the National Natural Science Foundation of China (NSFC)/Research Grants Council (RGC) (grant no. N_CUHK440/20) awarded by the RGC of the University Grants Committee of Hong Kong to Amos P. K. Tai.
This paper was edited by Sönke Zaehle and reviewed by two anonymous referees.
Ansari, A. S. and Pandis, S. N.: Response of Inorganic PM to Precursor Concentrations, Environ. Sci. Technol., 32, 2706–2714, https://doi.org/10.1021/es971130j, 1998.
Asman, W. A. H., Sutton, M. A., and Schjorring, J. K.: Ammonia: emission, atmospheric transport and deposition, New Phytol., 139, 27–48, https://doi.org/10.1046/j.1469-8137.1998.00180.x, 1998.
Balasubramanian, S., Koloutsou-Vakakis, S., McFarland, D. M., and Rood, M. J.: Reconsidering emissions of ammonia from chemical fertilizer usage in Midwest USA: Ammonia emissions from fertilizer usage, J. Geophys. Res.-Atmos., 120, 6232–6246, https://doi.org/10.1002/2015JD023219, 2015.
Balasubramanian, S., Nelson, A., Koloutsou-Vakakis, S., Lin, J., Rood, M. J., Myles, L., and Bernacchi, C.: Evaluation of DeNitrification DeComposition model for estimating ammonia fluxes from chemical fertilizer application, Agr. Forest Meteorol., 237, 123–134, https://doi.org/10.1016/j.agrformet.2017.02.006, 2017.
Beeckman, F., Motte, H., and Beeckman, T.: Nitrification in agricultural soils: impact, actors and mitigation, Curr. Opin. Biotech., 50, 166–173, https://doi.org/10.1016/j.copbio.2018.01.014, 2018.
Behera, S. N. and Sharma, M.: Transformation of atmospheric ammonia and acid gases into components of PM2.5: an environmental chamber study, Environ. Sci. Pollut. R., 19, 1187–1197, https://doi.org/10.1007/s11356-011-0635-9, 2012.
Bodirsky, B. L., Popp, A., Lotze-Campen, H., Dietrich, J. P., Rolinski, S., Weindl, I., Schmitz, C., Müller, C., Bonsch, M., Humpenöder, F., Biewald, A., and Stevanovic, M.: Reactive nitrogen requirements to feed the world in 2050 and potential to mitigate nitrogen pollution, Nat. Commun., 5, 3858, https://doi.org/10.1038/ncomms4858, 2014.
Bonan, G. B., Levis, S., Kergoat, L., and Oleson, K. W.: Landscapes as patches of plant functional types: An integrating concept for climate and ecosystem models: Plant functional types and climate models, Global Biogeochem. Cy., 16, 1–23, https://doi.org/10.1029/2000GB001360, 2002.
Bouwman, A. F., Lee, D. S., Asman, W. A. H., Dentener, F. J., Van Der Hoek, K. W., and Olivier, J. G. J.: A global high-resolution emission inventory for ammonia, Global Biogeochem. Cy., 11, 561–587, https://doi.org/10.1029/97GB02266, 1997.
Bouwman, A. F., Boumans, L. J. M., and Batjes, N. H.: Estimation of global NH 3 volatilization loss from synthetic fertilizers and animal manure applied to arable lands and grasslands: AMMONIA EMISSION FROM FERTILIZERS, Global Biogeochem. Cy., 16, 1–14, https://doi.org/10.1029/2000GB001389, 2002.
Clarisse, L., Clerbaux, C., Dentener, F., Hurtmans, D., and Coheur, P.-F.: Global ammonia distribution derived from infrared satellite observations, Nat. Geosci., 2, 479–483, https://doi.org/10.1038/ngeo551, 2009.
Clarisse, L., Shephard, M. W., Dentener, F., Hurtmans, D., Cady-Pereira, K., Karagulian, F., Van Damme, M., Clerbaux, C., and Coheur, P.-F.: Satellite monitoring of ammonia: A case study of the San Joaquin Valley, J. Geophys. Res., 115, D13302, https://doi.org/10.1029/2009JD013291, 2010.
Crippa, M., Guizzardi, D., Muntean, M., Schaaf, E., Dentener, F., van Aardenne, J. A., Monni, S., Doering, U., Olivier, J. G. J., Pagliari, V., and Janssens-Maenhout, G.: Gridded emissions of air pollutants for the period 1970–2012 within EDGAR v4.3.2, Earth Syst. Sci. Data, 10, 1987–2013, https://doi.org/10.5194/essd-10-1987-2018, 2018.
Drewniak, B., Song, J., Prell, J., Kotamarthi, V. R., and Jacob, R.: Modeling agriculture in the Community Land Model, Geosci. Model Dev., 6, 495–515, https://doi.org/10.5194/gmd-6-495-2013, 2013.
Dutta, B., Congreves, K. A., Smith, W. N., Grant, B. B., Rochette, P., Chantigny, M. H., and Desjardins, R. L.: Improving DNDC model to estimate ammonia loss from urea fertilizer application in temperate agroecosystems, Nutr. Cycl. Agroecosys., 106, 275–292, https://doi.org/10.1007/s10705-016-9804-z, 2016.
Emmons, L. K., Walters, S., Hess, P. G., Lamarque, J.-F., Pfister, G. G., Fillmore, D., Granier, C., Guenther, A., Kinnison, D., Laepple, T., Orlando, J., Tie, X., Tyndall, G., Wiedinmyer, C., Baughcum, S. L., and Kloster, S.: Description and evaluation of the Model for Ozone and Related chemical Tracers, version 4 (MOZART-4), Geosci. Model Dev., 3, 43–67, https://doi.org/10.5194/gmd-3-43-2010, 2010.
European Environment Agency: Ammonia (NH3) emissions, 2010, https://www.eea.europa.eu/ last access: 15 February 2022.
European Environment Agency: EMEP/EEA air pollutant emission inventory guidebook 2013: Exhaust emissions from road transport, 160, https://doi.org/10.2800/92722, 2013.
Fangmeier, A., Hadwiger-Fangmeier, A., Van der Eerden, L., and Jäger, H.-J.: Effects of atmospheric ammonia on vegetation – A review, Environ. Pollut., 86, 43–82, https://doi.org/10.1016/0269-7491(94)90008-6, 1994.
FAO: World fertilizer trends and outlook to 2022, 2019, https://www.fao.org/3/ca6746en/ca6746en.pdf, last access: 15 February 2022.
Gardner, W. R.: Movement of Nitrogen in Soil, in: Soil Nitrogen, John Wiley & Sons, Ltd, 550–572, https://doi.org/10.2134/agronmonogr10.c15, 1965.
Gilhespy, S. L., Anthony, S., Cardenas, L., Chadwick, D., del Prado, A., Li, C., Misselbrook, T., Rees, R. M., Salas, W., Sanz-Cobena, A., Smith, P., Tilston, E. L., Topp, C. F. E., Vetter, S., and Yeluripati, J. B.: First 20 years of DNDC (DeNitrification DeComposition): Model evolution, 292, 51–62, https://doi.org/10.1016/j.ecolmodel.2014.09.004, 2014.
Gu, B., Ge, Y., Ren, Y., Xu, B., Luo, W., Jiang, H., Gu, B., and Chang, J.: Atmospheric Reactive Nitrogen in China: Sources, Recent Trends, and Damage Costs, Environ. Sci. Technol., 46, 9420–9427, https://doi.org/10.1021/es301446g, 2012.
Guenther, A. B., Jiang, X., Heald, C. L., Sakulyanontvittaya, T., Duhl, T., Emmons, L. K., and Wang, X.: The Model of Emissions of Gases and Aerosols from Nature version 2.1 (MEGAN2.1): an extended and updated framework for modeling biogenic emissions, Geosci. Model Dev., 5, 1471–1492, https://doi.org/10.5194/gmd-5-1471-2012, 2012.
Guthrie, S., Dunkerley, F., Tabaqchali, H., Harshfield, A., Ioppolo, B., and Manville, C.: Impact of ammonia emissions from agriculture on biodiversity: An evidence synthesis, RAND Corporation, https://doi.org/10.7249/RR2695, 2018.
He, J., Zhang, Y., Glotfelty, T., He, R., Bennartz, R., Rausch, J., and Sartelet, K.: Decadal simulation and comprehensive evaluation of CESM/CAM5.1 with advanced chemistry, aerosol microphysics, and aerosol-cloud interactions, J. Adv. Model. Earth Syst., 7, 110–141, https://doi.org/10.1002/2014MS000360, 2015.
Hoesly, R. M., Smith, S. J., Feng, L., Klimont, Z., Janssens-Maenhout, G., Pitkanen, T., Seibert, J. J., Vu, L., Andres, R. J., Bolt, R. M., Bond, T. C., Dawidowski, L., Kholod, N., Kurokawa, J.-I., Li, M., Liu, L., Lu, Z., Moura, M. C. P., O'Rourke, P. R., and Zhang, Q.: Historical (1750–2014) anthropogenic emissions of reactive gases and aerosols from the Community Emissions Data System (CEDS), Geosci. Model Dev., 11, 369–408, https://doi.org/10.5194/gmd-11-369-2018, 2018.
Huang, X., Song, Y., Li, M., Li, J., Huo, Q., Cai, X., Zhu, T., Hu, M., and Zhang, H.: A high-resolution ammonia emission inventory in China: Ammonia emission in China, Global Biogeochem. Cy., 26, https://doi.org/10.1029/2011GB004161, 2012.
Huijsmans, J. F. M., Vermeulen, G. D., Hol, J. M. G., and Goedhart, P. W.: A model for estimating seasonal trends of ammonia emission from cattle manure applied to grassland in the Netherlands, Atmospheric Environment, 173, 231–238, https://doi.org/10.1016/j.atmosenv.2017.10.050, 2018.
Hurrell, J. W., Hack, J. J., Shea, D., Caron, J. M., and Rosinski, J.: A New Sea Surface Temperature and Sea Ice Boundary Dataset for the Community Atmosphere Model, J. Climate, 21, 5145–5153, https://doi.org/10.1175/2008JCLI2292.1, 2008.
Hurrell, J. W., Holland, M. M., Gent, P. R., Ghan, S., Kay, J. E., Kushner, P. J., Lamarque, J.-F., Large, W. G., Lawrence, D., Lindsay, K., Lipscomb, W. H., Long, M. C., Mahowald, N., Marsh, D. R., Neale, R. B., Rasch, P., Vavrus, S., Vertenstein, M., Bader, D., Collins, W. D., Hack, J. J., Kiehl, J., and Marshall, S.: The Community Earth System Model: A Framework for Collaborative Research, B. Am. Meteorol. Soc., 94, 1339–1360, https://doi.org/10.1175/BAMS-D-12-00121, 2013.
Hurtt, G. C., Chini, L. P., Frolking, S., Betts, R. A., Feddema, J., Fischer, G., Fisk, J. P., Hibbard, K., Houghton, R. A., Janetos, A., Jones, C. D., Kindermann, G., Kinoshita, T., Klein Goldewijk, K., Riahi, K., Shevliakova, E., Smith, S., Stehfest, E., Thomson, A., Thornton, P., van Vuuren, D. P., and Wang, Y. P.: Harmonization of land-use scenarios for the period 1500–2100: 600 years of global gridded annual land-use transitions, wood harvest, and resulting secondary lands, Clim. Change, 109, 117–161, https://doi.org/10.1007/s10584-011-0153-2, 2011.
Hutchinson, G. L., Millington, R. J., and Peters, D. B.: Atmospheric Ammonia: Absorption by Plant Leaves, Science, 175, 771–772, https://doi.org/10.1126/science.175.4023.771, 1972.
Ianniello, A., Spataro, F., Esposito, G., Allegrini, I., Hu, M., and Zhu, T.: Chemical characteristics of inorganic ammonium salts in PM2.5 in the atmosphere of Beijing (China), Atmos. Chem. Phys., 11, 10803–10822, https://doi.org/10.5194/acp-11-10803-2011, 2011.
Institute for the Study of Earth, Oceans, and Space, University of New Hampshire: DNDC v9.5 Scientific Basis and Processes, 2017, https://www.dndc.sr.unh.edu/papers/DNDC_Scientific_Basis_and_Processes.pdf, last access: 15 February 2022.
Janssens-Maenhout, G., Crippa, M., Guizzardi, D., Dentener, F., Muntean, M., Pouliot, G., Keating, T., Zhang, Q., Kurokawa, J., Wankmüller, R., Denier van der Gon, H., Kuenen, J. J. P., Klimont, Z., Frost, G., Darras, S., Koffi, B., and Li, M.: HTAP_v2.2: a mosaic of regional and global emission grid maps for 2008 and 2010 to study hemispheric transport of air pollution, Atmos. Chem. Phys., 15, 11411–11432, https://doi.org/10.5194/acp-15-11411-2015, 2015.
Krupa, S. V.: Effects of atmospheric ammonia (NH3) on terrestrial vegetation: a review, Environ. Pollut., 124, 179–221, https://doi.org/10.1016/S0269-7491(02)00434-7, 2003.
Lamarque, J.-F., Emmons, L. K., Hess, P. G., Kinnison, D. E., Tilmes, S., Vitt, F., Heald, C. L., Holland, E. A., Lauritzen, P. H., Neu, J., Orlando, J. J., Rasch, P. J., and Tyndall, G. K.: CAM-chem: description and evaluation of interactive atmospheric chemistry in the Community Earth System Model, Geosci. Model Dev., 5, 369–411, https://doi.org/10.5194/gmd-5-369-2012, 2012.
Lamarque, J.-F., Dentener, F., McConnell, J., Ro, C.-U., Shaw, M., Vet, R., Bergmann, D., Cameron-Smith, P., Dalsoren, S., Doherty, R., Faluvegi, G., Ghan, S. J., Josse, B., Lee, Y. H., MacKenzie, I. A., Plummer, D., Shindell, D. T., Skeie, R. B., Stevenson, D. S., Strode, S., Zeng, G., Curran, M., Dahl-Jensen, D., Das, S., Fritzsche, D., and Nolan, M.: Multi-model mean nitrogen and sulfur deposition from the Atmospheric Chemistry and Climate Model Intercomparison Project (ACCMIP): evaluation of historical and projected future changes, Atmos. Chem. Phys., 13, 7997–8018, https://doi.org/10.5194/acp-13-7997-2013, 2013.
Lawrence, D., Fisher, R., Koven, C., Swenson, S., and Vertenstein, M.: Technical Description of version 5.0 of the Community Land Model (CLM), http://www.cesm.ucar.edu/models/cesm2/land/CLM50_Tech_Note.pdf, last access: February 2018.
Lawrence, D. M., Fisher, R. A., Koven, C. D., Oleson, K. W., Swenson, S. C., Bonan, G., Collier, N., Ghimire, B., Kampenhout, L., Kennedy, D., Kluzek, E., Lawrence, P. J., Li, F., Li, H., Lombardozzi, D., Riley, W. J., Sacks, W. J., Shi, M., Vertenstein, M., Wieder, W. R., Xu, C., Ali, A. A., Badger, A. M., Bisht, G., Broeke, M., Brunke, M. A., Burns, S. P., Buzan, J., Clark, M., Craig, A., Dahlin, K., Drewniak, B., Fisher, J. B., Flanner, M., Fox, A. M., Gentine, P., Hoffman, F., Keppel-Aleks, G., Knox, R., Kumar, S., Lenaerts, J., Leung, L. R., Lipscomb, W. H., Lu, Y., Pandey, A., Pelletier, J. D., Perket, J., Randerson, J. T., Ricciuto, D. M., Sanderson, B. M., Slater, A., Subin, Z. M., Tang, J., Thomas, R. Q., Val Martin, M., and Zeng, X.: The Community Land Model Version 5: Description of New Features, Benchmarking, and Impact of Forcing Uncertainty, J. Adv. Model. Earth Syst., 11, 4245–4287, https://doi.org/10.1029/2018MS001583, 2019.
Lawrence, P. J. and Chase, T. N.: Representing a new MODIS consistent land surface in the Community Land Model (CLM 3.0), J. Geophys. Res., 112, G01023, https://doi.org/10.1029/2006JG000168, 2007.
Levis, S., Badger, A., Drewniak, B., Nevison, C., and Ren, X.: CLMcrop yields and water requirements: avoided impacts by choosing RCP 4.5 over 8.5, Clim. Change, 146, 501–515, https://doi.org/10.1007/s10584-016-1654-9, 2018.
Li, C., Frolking, S., and Frolking, T. A.: A model of nitrous oxide evolution from soil driven by rainfall events: 2. Model applications, 97, 9777–9783, https://doi.org/10.1029/92JD00510, 1992.
Li, C., Salas, W., Zhang, R., Krauter, C., Rotz, A., and Mitloehner, F.: Manure-DNDC: a biogeochemical process model for quantifying greenhouse gas and ammonia emissions from livestock manure systems, Nutr. Cycl. Agroecosyst., 93, 163–200, https://doi.org/10.1007/s10705-012-9507-z, 2012.
Lin, B.-L., Sakoda, A., Shibasaki, R., and Suzuki, M.: A Modelling Approach to Global Nitrate Leaching Caused by Anthropogenic Fertilisation, Water Res., 35, 1961–1968, https://doi.org/10.1016/S0043-1354(00)00484-X, 2001.
Liu, X., Tai, A. P. K., and Fung, K. M.: Responses of surface ozone to future agricultural ammonia emissions and subsequent nitrogen deposition through terrestrial ecosystem changes, Atmos. Chem. Phys., 21, 17743–17758, https://doi.org/10.5194/acp-21-17743-2021, 2021.
Lombardozzi, D. L., Lu, Y., Lawrence, P. J., Lawrence, D. M., Swenson, S., Oleson, K. W., Wieder, W. R., and Ainsworth, E. A.: Simulating Agriculture in the Community Land Model Version 5, J. Geophys. Res.-Biogeo., 125, e2019JG005529, https://doi.org/10.1029/2019JG005529, 2020.
Lu, X., Mo, J., and Dong, S.: Effects of nitrogen deposition on forest biodiversity, Acta Ecol. Sin., 28, 5532–5548, https://doi.org/10.1016/S1872-2032(09)60012-3, 2008.
Meinshausen, M., Vogel, E., Nauels, A., Lorbacher, K., Meinshausen, N., Etheridge, D. M., Fraser, P. J., Montzka, S. A., Rayner, P. J., Trudinger, C. M., Krummel, P. B., Beyerle, U., Canadell, J. G., Daniel, J. S., Enting, I. G., Law, R. M., Lunder, C. R., O'Doherty, S., Prinn, R. G., Reimann, S., Rubino, M., Velders, G. J. M., Vollmer, M. K., Wang, R. H. J., and Weiss, R.: Historical greenhouse gas concentrations for climate modelling (CMIP6), Geosci. Model Dev., 10, 2057–2116, https://doi.org/10.5194/gmd-10-2057-2017, 2017.
Metzger, S.: Gas/aerosol partitioning: 1. A computationally efficient model, J. Geophys. Res., 107, 4312, https://doi.org/10.1029/2001JD001102, 2002.
Myhre, G., Samset, B. H., Schulz, M., Balkanski, Y., Bauer, S., Berntsen, T. K., Bian, H., Bellouin, N., Chin, M., Diehl, T., Easter, R. C., Feichter, J., Ghan, S. J., Hauglustaine, D., Iversen, T., Kinne, S., Kirkevåg, A., Lamarque, J.-F., Lin, G., Liu, X., Lund, M. T., Luo, G., Ma, X., van Noije, T., Penner, J. E., Rasch, P. J., Ruiz, A., Seland, Ø., Skeie, R. B., Stier, P., Takemura, T., Tsigaridis, K., Wang, P., Wang, Z., Xu, L., Yu, H., Yu, F., Yoon, J.-H., Zhang, K., Zhang, H., and Zhou, C.: Radiative forcing of the direct aerosol effect from AeroCom Phase II simulations, Atmos. Chem. Phys., 13, 1853–1877, https://doi.org/10.5194/acp-13-1853-2013, 2013.
National Oceanic and Atmospheric Administration: Atmospheric Ammonia: Sources and Fate – A Review of Ongoing Federal Research and Future Need, J. Molec. Liq., https://csl.noaa.gov/aqrs/reports/ammonia.pdf (last access: 15 February 2022), 2000.
Neale, R. B., Chen, C.-C., Gettelman, A., Lauritzen, P. H., Park, S., Williamson, D. L., Conley, A. J., Garcia, R., Kinnison, D., and Lamarque, J.-F.: Description of the NCAR community atmosphere model (CAM 5.0), https://www.cesm.ucar.edu/models/cesm1.0/cam/docs/description/cam5_desc.pdf, (last access: 15 February 2022), 1, 1–12, 2010.
Nemitz, E., Milford, C., and Sutton, M. A.: A two-layer canopy compensation point model for describing bi-directional biosphere-atmosphere exchange of ammonia, Q. J. Roy. Meteor. Soc., 127, 815–833, https://doi.org/10.1002/qj.49712757306, 2001.
Nevison, C., Hess, P., Riddick, S., and Ward, D.: Denitrification, leaching, and river nitrogen export in the Community Earth System Model, J. Adv. Model. Earth Syst., 8, 272–291, https://doi.org/10.1002/2015MS000573, 2016.
Paulot, F. and Jacob, D. J.: Hidden Cost of U.S. Agricultural Exports: Particulate Matter from Ammonia Emissions, Environ. Sci. Technol., 48, 903–908, https://doi.org/10.1021/es4034793, 2014.
Paulot, F., Jacob, D. J., Pinder, R. W., Bash, J. O., Travis, K., and Henze, D. K.: Ammonia emissions in the United States, European Union, and China derived by high-resolution inversion of ammonium wet deposition data: Interpretation with a new agricultural emissions inventory (MASAGE_NH3), J. Geophys. Res.-Atmos., 119, 4343–4364, https://doi.org/10.1002/2013JD021130, 2014.
Paulot, F., Jacob, D. J., Johnson, M. T., Bell, T. G., Baker, A. R., Keene, W. C., Lima, I. D., Doney, S. C., and Stock, C. A.: Global oceanic emission of ammonia: Constraints from seawater and atmospheric observations, Global Biogeochem. Cy., 29, 1165–1178, https://doi.org/10.1002/2015GB005106, 2015.
Pleim, J. E., Bash, J. O., Walker, J. T., and Cooter, E. J.: Development and evaluation of an ammonia bidirectional flux parameterization for air quality models: Ammonia bidirectional flux model, J. Geophys. Res.-Atmos., 118, 3794–3806, https://doi.org/10.1002/jgrd.50262, 2013.
Pleim, J. E., Ran, L., Appel, W., Shephard, M. W., and Cady-Pereira, K.: New Bidirectional Ammonia Flux Model in an Air Quality Model Coupled With an Agricultural Model, J. Adv. Model. Earth Syst., 11, 2934–2957, https://doi.org/10.1029/2019MS001728, 2019.
Portmann, F. T., Siebert, S., and Döll, P.: MIRCA2000-Global monthly irrigated and rainfed crop areas around the year 2000: A new high-resolution data set for agricultural and hydrological modeling: MONTHLY IRRIGATED AND RAINFED CROP AREAS, Global Biogeochem. Cy., 24, GB1011, https://doi.org/10.1029/2008GB003435, 2010.
Riddick, S., Ward, D., Hess, P., Mahowald, N., Massad, R., and Holland, E.: Estimate of changes in agricultural terrestrial nitrogen pathways and ammonia emissions from 1850 to present in the Community Earth System Model, Biogeosciences, 13, 3397–3426, https://doi.org/10.5194/bg-13-3397-2016, 2016.
Saikawa, E., Schlosser, C. A., and Prinn, R. G.: Global modeling of soil nitrous oxide emissions from natural processes: Global soil nitrous oxide emissions, Global Biogeochem. Cy.,, 27, 972–989, https://doi.org/10.1002/gbc.20087, 2013.
Saikawa, E., Prinn, R. G., Dlugokencky, E., Ishijima, K., Dutton, G. S., Hall, B. D., Langenfelds, R., Tohjima, Y., Machida, T., Manizza, M., Rigby, M., O'Doherty, S., Patra, P. K., Harth, C. M., Weiss, R. F., Krummel, P. B., van der Schoot, M., Fraser, P. J., Steele, L. P., Aoki, S., Nakazawa, T., and Elkins, J. W.: Global and regional emissions estimates for N2O, Atmos. Chem. Phys., 14, 4617–4641, https://doi.org/10.5194/acp-14-4617-2014, 2014.
Shou, W., Zong, H., Ding, P., and Hou, L.: A modelling approach to assess the effects of atmospheric nitrogen deposition on the marine ecosystem in the Bohai Sea, China, Estuar. Coast. Shelf Sci., 208, 36–48, https://doi.org/10.1016/j.ecss.2018.04.025, 2018.
Snider, G., Weagle, C. L., Murdymootoo, K. K., Ring, A., Ritchie, Y., Stone, E., Walsh, A., Akoshile, C., Anh, N. X., Balasubramanian, R., Brook, J., Qonitan, F. D., Dong, J., Griffith, D., He, K., Holben, B. N., Kahn, R., Lagrosas, N., Lestari, P., Ma, Z., Misra, A., Norford, L. K., Quel, E. J., Salam, A., Schichtel, B., Segev, L., Tripathi, S., Wang, C., Yu, C., Zhang, Q., Zhang, Y., Brauer, M., Cohen, A., Gibson, M. D., Liu, Y., Martins, J. V., Rudich, Y., and Martin, R. V.: Variation in global chemical composition of PM2.5: emerging results from SPARTAN, Atmos. Chem. Phys., 16, 9629–9653, https://doi.org/10.5194/acp-16-9629-2016, 2016.
Sutton, M. A.: The surface/atmosphere exchange of ammonia, PhD thesis, University of Edinburgh, 1990.
Sutton, M. A., Pitcairn, C. E., and Fowler, D.: The exchange of ammonia between the atmosphere and plant communities, Adv. Ecol. Res., 24, 301–393, 1993.
Sutton, M. A., Reis, S., Riddick, S. N., Dragosits, U., Nemitz, E., Theobald, M. R., Tang, Y. S., Braban, C. F., Vieno, M., Dore, A. J., Mitchell, R. F., Wanless, S., Daunt, F., Fowler, D., Blackall, T. D., Milford, C., Flechard, C. R., Loubet, B., Massad, R., Cellier, P., Personne, E., Coheur, P. F., Clarisse, L., Van Damme, M., Ngadi, Y., Clerbaux, C., Skjøth, C. A., Geels, C., Hertel, O., Wichink Kruit, R. J., Pinder, R. W., Bash, J. O., Walker, J. T., Simpson, D., Horváth, L., Misselbrook, T. H., Bleeker, A., Dentener, F., and de Vries, W.: Towards a climate-dependent paradigm of ammonia emission and deposition, Philos. T. Roy. Soc. B, 368, 20130166, https://doi.org/10.1098/rstb.2013.0166, 2013.
Tian, D. and Niu, S.: A global analysis of soil acidification caused by nitrogen addition, Environ. Res. Lett., 10, 024019, https://doi.org/10.1088/1748-9326/10/2/024019, 2015.
Tie, X. and Cao, J.: Aerosol pollution in China: Present and future impact on environment, Particuology, 7, 426–431, https://doi.org/10.1016/j.partic.2009.09.003, 2009.
US Environmental Protection Agency: National Emission Inventory (NEI) Report, https://www.epa.gov/air-emissions-inventories/2014-national-emissions-inventory-nei-data (last access: 15 February 2022), 2014.
Van Damme, M., Clarisse, L., Heald, C. L., Hurtmans, D., Ngadi, Y., Clerbaux, C., Dolman, A. J., Erisman, J. W., and Coheur, P. F.: Global distributions, time series and error characterization of atmospheric ammonia (NH3) from IASI satellite observations, Atmos. Chem. Phys., 14, 2905–2922, https://doi.org/10.5194/acp-14-2905-2014, 2014.
Van Damme, M., Whitburn, S., Clarisse, L., Clerbaux, C., Hurtmans, D., and Coheur, P.-F.: Version 2 of the IASI NH3 neural network retrieval algorithm: near-real-time and reanalysed datasets, Atmos. Meas. Tech., 10, 4905–4914, https://doi.org/10.5194/amt-10-4905-2017, 2017.
Van Damme, M., Clarisse, L., Whitburn, S., Hadji-Lazaro, J., Hurtmans, D., Clerbaux, C., and Coheur, P.-F.: Industrial and agricultural ammonia point sources exposed, Nature, 564, 99–103, https://doi.org/10.1038/s41586-018-0747-1, 2018a.
Van Damme, M., Clarisse, L., Whitburn, S., Hadji-Lazaro, J., Hurtmans, D., Clerbaux, C., Coheur, P.-F.,: Level 2 dataset and Level 3 oversampled average map of the IASI/Metop-A ammonia (NH3) morning column measurements (ANNI-NH3-v2.1R-I) from 2008 to 2016, PANGAEA [data set], https://doi.org/10.1594/PANGAEA.894736, 2018b.
Van Hove, L. W. A., Koops, A. J., Adema, E. H., Vredenberg, W. J., and Pieters, G. A.: Analysis of the uptake of atmospheric ammonia by leaves of Phaseolus vulgaris L., Atmos. Environ., 21, 1759–1763, https://doi.org/10.1016/0004-6981(87)90115-6, 1987.
van Marle, M. J. E., Kloster, S., Magi, B. I., Marlon, J. R., Daniau, A.-L., Field, R. D., Arneth, A., Forrest, M., Hantson, S., Kehrwald, N. M., Knorr, W., Lasslop, G., Li, F., Mangeon, S., Yue, C., Kaiser, J. W., and van der Werf, G. R.: Biomass Burning emissions for CMIP6 (v1.2), https://doi.org/10.22033/ESGF/input4MIPs.1117, 2016.
van Marle, M. J. E., Kloster, S., Magi, B. I., Marlon, J. R., Daniau, A.-L., Field, R. D., Arneth, A., Forrest, M., Hantson, S., Kehrwald, N. M., Knorr, W., Lasslop, G., Li, F., Mangeon, S., Yue, C., Kaiser, J. W., and van der Werf, G. R.: Historic global biomass burning emissions for CMIP6 (BB4CMIP) based on merging satellite observations with proxies and fire models (1750–2015), Geosci. Model Dev., 10, 3329–3357, https://doi.org/10.5194/gmd-10-3329-2017, 2017.
Vira, J., Hess, P., Melkonian, J., and Wieder, W. R.: An improved mechanistic model for ammonia volatilization in Earth system models: Flow of Agricultural Nitrogen version 2 (FANv2), Geosci. Model Dev., 13, 4459–4490, https://doi.org/10.5194/gmd-13-4459-2020, 2020.
Vira, J., Hess, P., Ossohou, M., and Galy-Lacaux, C.: Evaluation of interactive and prescribed agricultural ammonia emissions for simulating atmospheric composition in CAM-chem, Atmos. Chem. Phys., 22, 1883–1904, https://doi.org/10.5194/acp-22-1883-2022, 2022.
Wang, J., Xing, J., Mathur, R., Pleim, J. E., Wang, S., Hogrefe, C., Gan, C.-M., Wong, D. C., and Hao, J.: Historical Trends in PM2.5 -Related Premature Mortality during 1990–2010 across the Northern Hemisphere, Environmen. Health Perspec., 125, 400–408, https://doi.org/10.1289/EHP298, 2017.
Wesely, M.: Parameterization of surface resistances to gaseous dry deposition in regional-scale numerical models, Atmos. Environ., 41, 52–63, https://doi.org/10.1016/j.atmosenv.2007.10.058, 2007.
Whitburn, S., Van Damme, M., Clarisse, L., Hurtmans, D., Clerbaux, C., and Coheur, P.-F.: IASI-derived NH3 enhancement ratios relative to CO for the tropical biomass burning regions, Atmos. Chem. Phys., 17, 12239–12252, https://doi.org/10.5194/acp-17-12239-2017, 2017.
Wortman, E., Tomaszewski, T., Waldner, P., Schleppi, P., Thimonier, A., Eugster, W., Buchmann, N., and Sievering, H.: Atmospheric nitrogen deposition and canopy retention influences on photosynthetic performance at two high nitrogen deposition Swiss forests, Tellus B, 64, 17216, https://doi.org/10.3402/tellusb.v64i0.17216, 2012.
Xing, Y.-F., Xu, Y.-H., Shi, M.-H., and Lian, Y.-X.: The impact of PM2.5 on the human respiratory system, J. Thorac. Dis., 8.1, 69–74, https://doi.org/10.3978/j.issn.2072-1439.2016.01.19, 2016.
Yang, Y., Ruan, Z., Wang, X., Yang, Y., Mason, T. G., Lin, H., and Tian, L.: Short-term and long-term exposures to fine particulate matter constituents and health: A systematic review and meta-analysis, Environ. Pollut., 247, 874–882, https://doi.org/10.1016/j.envpol.2018.12.060, 2019.
Zhang, J. and Liu, M. G.: Observations on nutrient elements and sulphate in atmospheric wet depositions over the northwest Pacific coastal oceans – Yellow Sea, Mar. Chem., 47, 173–189, https://doi.org/10.1016/0304-4203(94)90107-4, 1994.
Zhang, Y. and Niu, H.: The development of the DNDC plant growth sub-model and the application of DNDC in agriculture: A review, Agric. Ecosyst. Environ., 230, 271–282, https://doi.org/10.1016/j.agee.2016.06.017, 2016.
Zhang, L., Chen, Y., Zhao, Y., Henze, D. K., Zhu, L., Song, Y., Paulot, F., Liu, X., Pan, Y., Lin, Y., and Huang, B.: Agricultural ammonia emissions in China: reconciling bottom-up and top-down estimates, Atmos. Chem. Phys., 18, 339–355, https://doi.org/10.5194/acp-18-339-2018, 2018.
Zhao, Y., Zhang, L., Tai, A. P. K., Chen, Y., and Pan, Y.: Responses of surface ozone air quality to anthropogenic nitrogen deposition in the Northern Hemisphere, Atmos. Chem. Phys., 17, 9781–9796, https://doi.org/10.5194/acp-17-9781-2017, 2017.
Zheng, Y., Xue, T., Zhang, Q., Geng, G., Tong, D., Li, X., and He, K.: Air quality improvements and health benefits from China's clean air action since 2013, Environ. Res. Lett., 12, 114020, https://doi.org/10.1088/1748-9326/aa8a32, 2017.
Zhu, L., Henze, D., Bash, J., Jeong, G.-R., Cady-Pereira, K., Shephard, M., Luo, M., Paulot, F., and Capps, S.: Global evaluation of ammonia bidirectional exchange and livestock diurnal variation schemes, Atmos. Chem. Phys., 15, 12823–12843, https://doi.org/10.5194/acp-15-12823-2015, 2015.