the Creative Commons Attribution 4.0 License.
the Creative Commons Attribution 4.0 License.
 | 10 Jan 2022
Versatile soil gas concentration and isotope monitoring: optimization and integration of novel soil gas probes with online trace gas detection
Juliana Gil-Loaiza
Joseph R. Roscioli
Joanne H. Shorter
Till H. M. Volkmann
Wei-Ren Ng
Jordan E. Krechmer
Laura K. Meredith
Gas concentrations and isotopic signatures can unveil microbial metabolisms and their responses to environmental changes in soil. Currently, few methods measure in situ soil trace gases such as the products of nitrogen and carbon cycling or volatile organic compounds (VOCs) that constrain microbial biochemical processes like nitrification, methanogenesis, respiration, and microbial communication. Versatile trace gas sampling systems that integrate soil probes with sensitive trace gas analyzers could fill this gap with in situ soil gas measurements that resolve spatial (centimeters) and temporal (minutes) patterns. We developed a system that integrates new porous and hydrophobic sintered polytetrafluoroethylene (sPTFE) diffusive soil gas probes that non-disruptively collect soil gas samples with a transfer system to direct gas from multiple probes to one or more central gas analyzer(s) such as laser and mass spectrometers. Here, we demonstrate the feasibility and versatility of this automated multiprobe system for soil gas measurements of isotopic ratios of nitrous oxide (δ18O, δ15N, and the 15N site preference of N2O), methane, carbon dioxide (δ13C), and VOCs. First, we used an inert silica matrix to challenge probe measurements under controlled gas conditions. By changing and controlling system flow parameters, including the probe flow rate, we optimized recovery of representative soil gas samples while reducing sampling artifacts on subsurface concentrations. Second, we used this system to provide a real-time window into the impact of environmental manipulation of irrigation and soil redox conditions on in situ N2O and VOC concentrations. Moreover, to reveal the dynamics in the stable isotope ratios of N2O (i.e., 14N14N16O, 14N15N16O, 15N14N16O, and 14N14N18O), we developed a new high-precision laser spectrometer with a reduced sample volume demand. Our integrated system – a tunable infrared laser direct absorption spectrometry (TILDAS) in parallel with Vocus proton transfer reaction mass spectrometry (PTR-MS), in line with sPTFE soil gas probes – successfully quantified isotopic signatures for N2O, CO2, and VOCs in real time as responses to changes in the dry–wetting cycle and redox conditions.
Broadening the collection of trace gases that can be monitored in the subsurface is critical for monitoring biogeochemical cycles, ecosystem health, and management practices at scales relevant to the soil system.
- Article
(4383 KB) - Full-text XML
-
Supplement
(908 KB) - BibTeX
- EndNote


The impact of the biosphere's soils on atmospheric composition is typically measured at the soil surface, yet belowground approaches may provide a more mechanistic perspective into trace gas cycling. Soil is a source and sink of trace gases such as nitrous oxide (N2O), carbon dioxide (CO2), methane (CH4), and volatile organic compounds (VOCs) that impact climate and air quality. Soil fluxes are driven by abiotic and biotic processes including microbial metabolism and soil environmental conditions (Conrad, 2005; Karbin et al., 2015; Jiao et al., 2018) that vary in space (i.e., soil aggregate, Schimel, 2018, to field, Wang et al., 2014) and time (e.g., rain-driven emission pulses) (Jiao et al., 2018). Environmental drivers such as soil moisture and oxygen availability modulate rates of aerobic and anaerobic processes that influence gas cycling including N2O emissions (Groffman et al., 2009) and VOC fluxes (Raza et al., 2017; Abis et al., 2020). Yet, capturing how belowground variations in soil structure (e.g., air-filled soil porosity) and conditions (e.g., moisture, wetting frequency, redox state) impact gas cycling remains challenging. While surface flux chambers remain a dominant, integrative tool to constrain soil gas fluxes, new capabilities are needed to unearth spatiotemporal variations in belowground processes.
Soil gases serve as messengers of belowground biogeochemical processes and microbial activity. Soil microbes produce trace gases via biochemical pathways that impart characteristic isotopic signatures onto trace gases that help identify and quantify gas processes (Yoshida and Toyoda, 2000). For example, microbial pathways driving CH4 production have been identified from the ratio of rare 13CH4 to the abundant 12CH4 natural isotopes (McCalley et al., 2014; Penger et al., 2012). Other studies use isotopically enriched trace gases, such as 15N N2O to determine consumption and production rates of N2O in soil columns (Clough et al., 2006). The ratio of 15N to 14N and the position of the 15N relative to the O in N2O (termed the 15N site preference) depend on the N2O production pathway (Yoshida and Toyoda, 2000; Sutka et al., 2006), with the 15N site preference reflecting only the microbial pathway and not the substrate isotopic signature. Together, measurements of all three isotopic properties of N2O (15N abundance, 15N site preference, and 18O abundance) can identify the type of biochemical process generating the N2O and the associated microbial groups (bacterial, archaeal, or fungal) (Toyoda et al., 2017). VOCs are signals for diverse microbial and chemical interactions in soils that are increasingly recognized as an important part of the soil metabolome (Honeker et al., 2021). VOCs are also involved in microbial and plant–microbe interactions such as quorum sensing, and they may reflect soil health, stress responses, and microbial identity (Insam and Seewald, 2010; Schulz-Bohm et al., 2018). Inert tracers present or released in soil (e.g., helium; Laemmel et al., 2017) help distinguish physical from chemical mechanisms affecting soil gas concentrations. Tracking microbial activity using trace gas messengers can elevate the understanding of the role of microbial communities and their metabolism in soil.
Soil gas sampling approaches have evolved to recover gas samples with less disruption to the soil environment. Early methods inserted rigid perforated tubes or wells into the soil to withdraw gas by suction using a syringe (Holter, 1990), pump (Maier et al., 2012), or other manual methods (Panikov et al., 2007). This methodology was time-consuming, created artifacts by driving advective flow that transports gas from other regions, and disturbed the probe surroundings (Maier et al., 2012). In contrast, diffusive probes sample soil gases by non-advective gas exchange driven by molecular diffusion across a porous membrane from soil gas- and aqueous-phase partitioning (Volkmann et al., 2016a, b). One drawback of diffusive sampling probes has been their relatively large volume, which was used to generate sufficient sample for gas analyzers but led to correspondingly long times for the internal sampling volume to reach equilibration with soil gas. For example, probes longer than 1 m have been used in water (Rothfuss et al., 2013) and soil (Jacinthe and Dick, 1996), and small silicone probes require extended sampling return periods (> 7–48 h) to equilibrate (Kammann et al., 2001; Petersen, 2014). Long probes disturb soil, especially upon installation, spurring the interest in discovering new materials that enhance diffusion at a smaller probe size while still resolving gas concentrations and isotopic signatures. Polypropylene (Accurel, V8/2HF, Membrana GmbH, Germany) materials have improved the equilibrium time at an equivalent probe length (Flechard et al., 2007; Gut et al., 1998; Rothfuss et al., 2015); for example, Rothfuss et al. (2015) used 15 cm polypropylene (PP) tubing to measure water isotopes for 290 d. High-density materials like expanded polytetrafluoroethylene (PTFE) and polyethylene equilibrate faster than silicone (DeSutter et al., 2006), increasing the temporal resolution from hours to minutes in different matrices including for the analysis of water isotopes in soil (Volkmann and Weiler, 2014) and tree xylem (Volkmann et al., 2016a) and CO2 in soil (DeSutter et al., 2006). The diffusive sampling approach is a promising means for non-destructively recovering soil gas for analysis, despite challenges in finding porous materials that equilibrate efficiently with minimal probe length.
Probes face multiple demands in the soil system during field deployment. For long-term monitoring in the field, subsurface probes must be robust to extreme weather, plant, and microbial activity and disruptions that could affect the integrity of the porous membrane. While current materials recover representative gas concentrations and isotopic signatures, their application has been limited by cracking, water infiltration (Volkmann et al., 2016a, b), and soil disruption during sampling (Hirsch et al., 2004). Microbial interactions with probe materials can reduce probe integrity, modify gas concentrations, or reduce gas exchange by biofouling (Krämer and Conrad, 1993). Small soil particles can clog pores and limit gas diffusion, and probes can break or crack in freeze–thaw cycles (Burton and Beauchamp, 1994; Gut et al., 1998) or during installation (Volkmann et al., 2016a, b). Probe membranes must resist water breakthrough, which has caused water interference problems in nylon (Burton and Beauchamp, 1994) and polypropylene (Gut et al., 1998) probes. The limitations of some probe materials have been evaluated under controlled conditions (DeSutter et al., 2006; Munksgaard et al., 2011; Rothfuss et al., 2013). To meet the demands of long-term soil sampling, new non-reactive and hydrophobic porous probe materials are needed.
Diffusive soil gas probes can be integrated with online gas analyzers (e.g., for H2O, CO2, CH4) to quantify soil gas concentrations and isotopic signatures (Gangi et al., 2015; Gut et al., 1998; Rothfuss et al., 2013; Volkmann et al., 2016b, 2018). Growing capabilities in trace gas analysis can be leveraged to monitor additional tracers of subsurface processes. For example, small molecules such as N2O, CH4, NO, CO2, and CO can be monitored using tunable infrared laser direct absorption spectrometry (TILDAS), and VOCs are now routinely monitored by proton transfer reaction time-of-flight mass spectrometry (PTR-TOF-MS). For each trace gas analyte and corresponding analyzer, methods for soil gas sampling should be optimized in ways that account for differences in molecular diffusivity (exchange across probe) and surface interactions (partitioning to tubing). Sample transfer systems are used to multiplex gas analyzers with multiple soil probes for online measurements of multiple spatial points (Jochheim et al., 2018; Volkmann and Weiler, 2014). Expanding the suite of gases that can be sampled by diffusive soil probes will enhance the spatiotemporal resolution of observable interactions between microbial activity and biogeochemical processes in the environment and their interactive impact on the atmosphere.
In this study, we describe a real-time soil trace gas sampling system that integrates diffusive soil probes with online gas analyzers (TILDAS and PTR-TOF-MS) to capture fast, spatially resolved concentrations and isotopic signatures of key soil gases and their responses to environmental changes. We expect that a minimally disruptive, diffusive soil gas probe approach would be capable of high-spatiotemporal-resolution measurements of soil trace gases. To test this, we developed diffusive, hydrophobic soil probes from sintered PTFE (sPTFE) and used controlled soil columns to evaluate their ability to retrieve gas samples via continuous sampling. We optimized the TILDAS sample cell volume, sample transfer schemes and flow rates, and the instrument's concentration dependence. With the optimized system, we then performed process studies in soil to determine whether the system could unveil soil microbial metabolisms and their responses to environmental changes. Soil wetting events are known to stimulate N2O emissions from soil, and we performed an irrigation manipulation on the soil column and measured the subsurface site-specific stable isotopes of N2O in real time. We hypothesized that soil wetting would induce a shift in N2O production pathways that would be detectable via the isotopic tracers. Moreover, recognizing the sensitivity of biochemical transformations to redox conditions, we measured multiple subsurface trace gases (N2O, CO2, VOCs) after changing the redox conditions in soil. We hypothesized that the dynamic response in subsurface gas concentrations would not be uniform across compounds, reflecting the sensitivity of (bio)chemical reactions to the soil redox state. Here, we present the optimization and application of an online soil gas sampling approach that is robust and flexible with transferability to a wide array of trace gases that reflect microbial activity and biogeochemical cycles in soils.
2.1 Probes and probe evaluation system
2.1.1 Sintered PTFE (sPTFE) probes
We built gas-permeable soil probes from microporous tubes of sPTFE (Fig. 1a). sPTFE is hydrophobic and has uniform pore distribution, which improves gas diffusion (Dhanumalayan and Joshi, 2018). The material is structurally stable and non-reactive, properties that make this material a good candidate as long-term soil gas probes. We selected four probes with different pore sizes and dimensions (Table 1) to evaluate their equilibration properties. Probes were machined (White Industries, Inc., Petaluma, CA, USA) from solid sPTFE blocks (Berghof GmbH, Eningen, Germany). We constructed probe prototype assemblies to connect probes to inlet and outlet transport lines of fluorinated ethylene propylene (FEP; Versilon™, Saint-Gobain, Malvern, PA, USA) using stainless-steel reducing unions (Swagelok, Solon, OH, USA). In some cases, probes were assembled from two pieces (Table 1) using perfluoroalkoxy (PFA) unions (Swagelok, Solon, OH, USA). After assembly, probe assembly leak tightness at the fittings was tested by submersion under water while flowing ultra zero air through the probe.
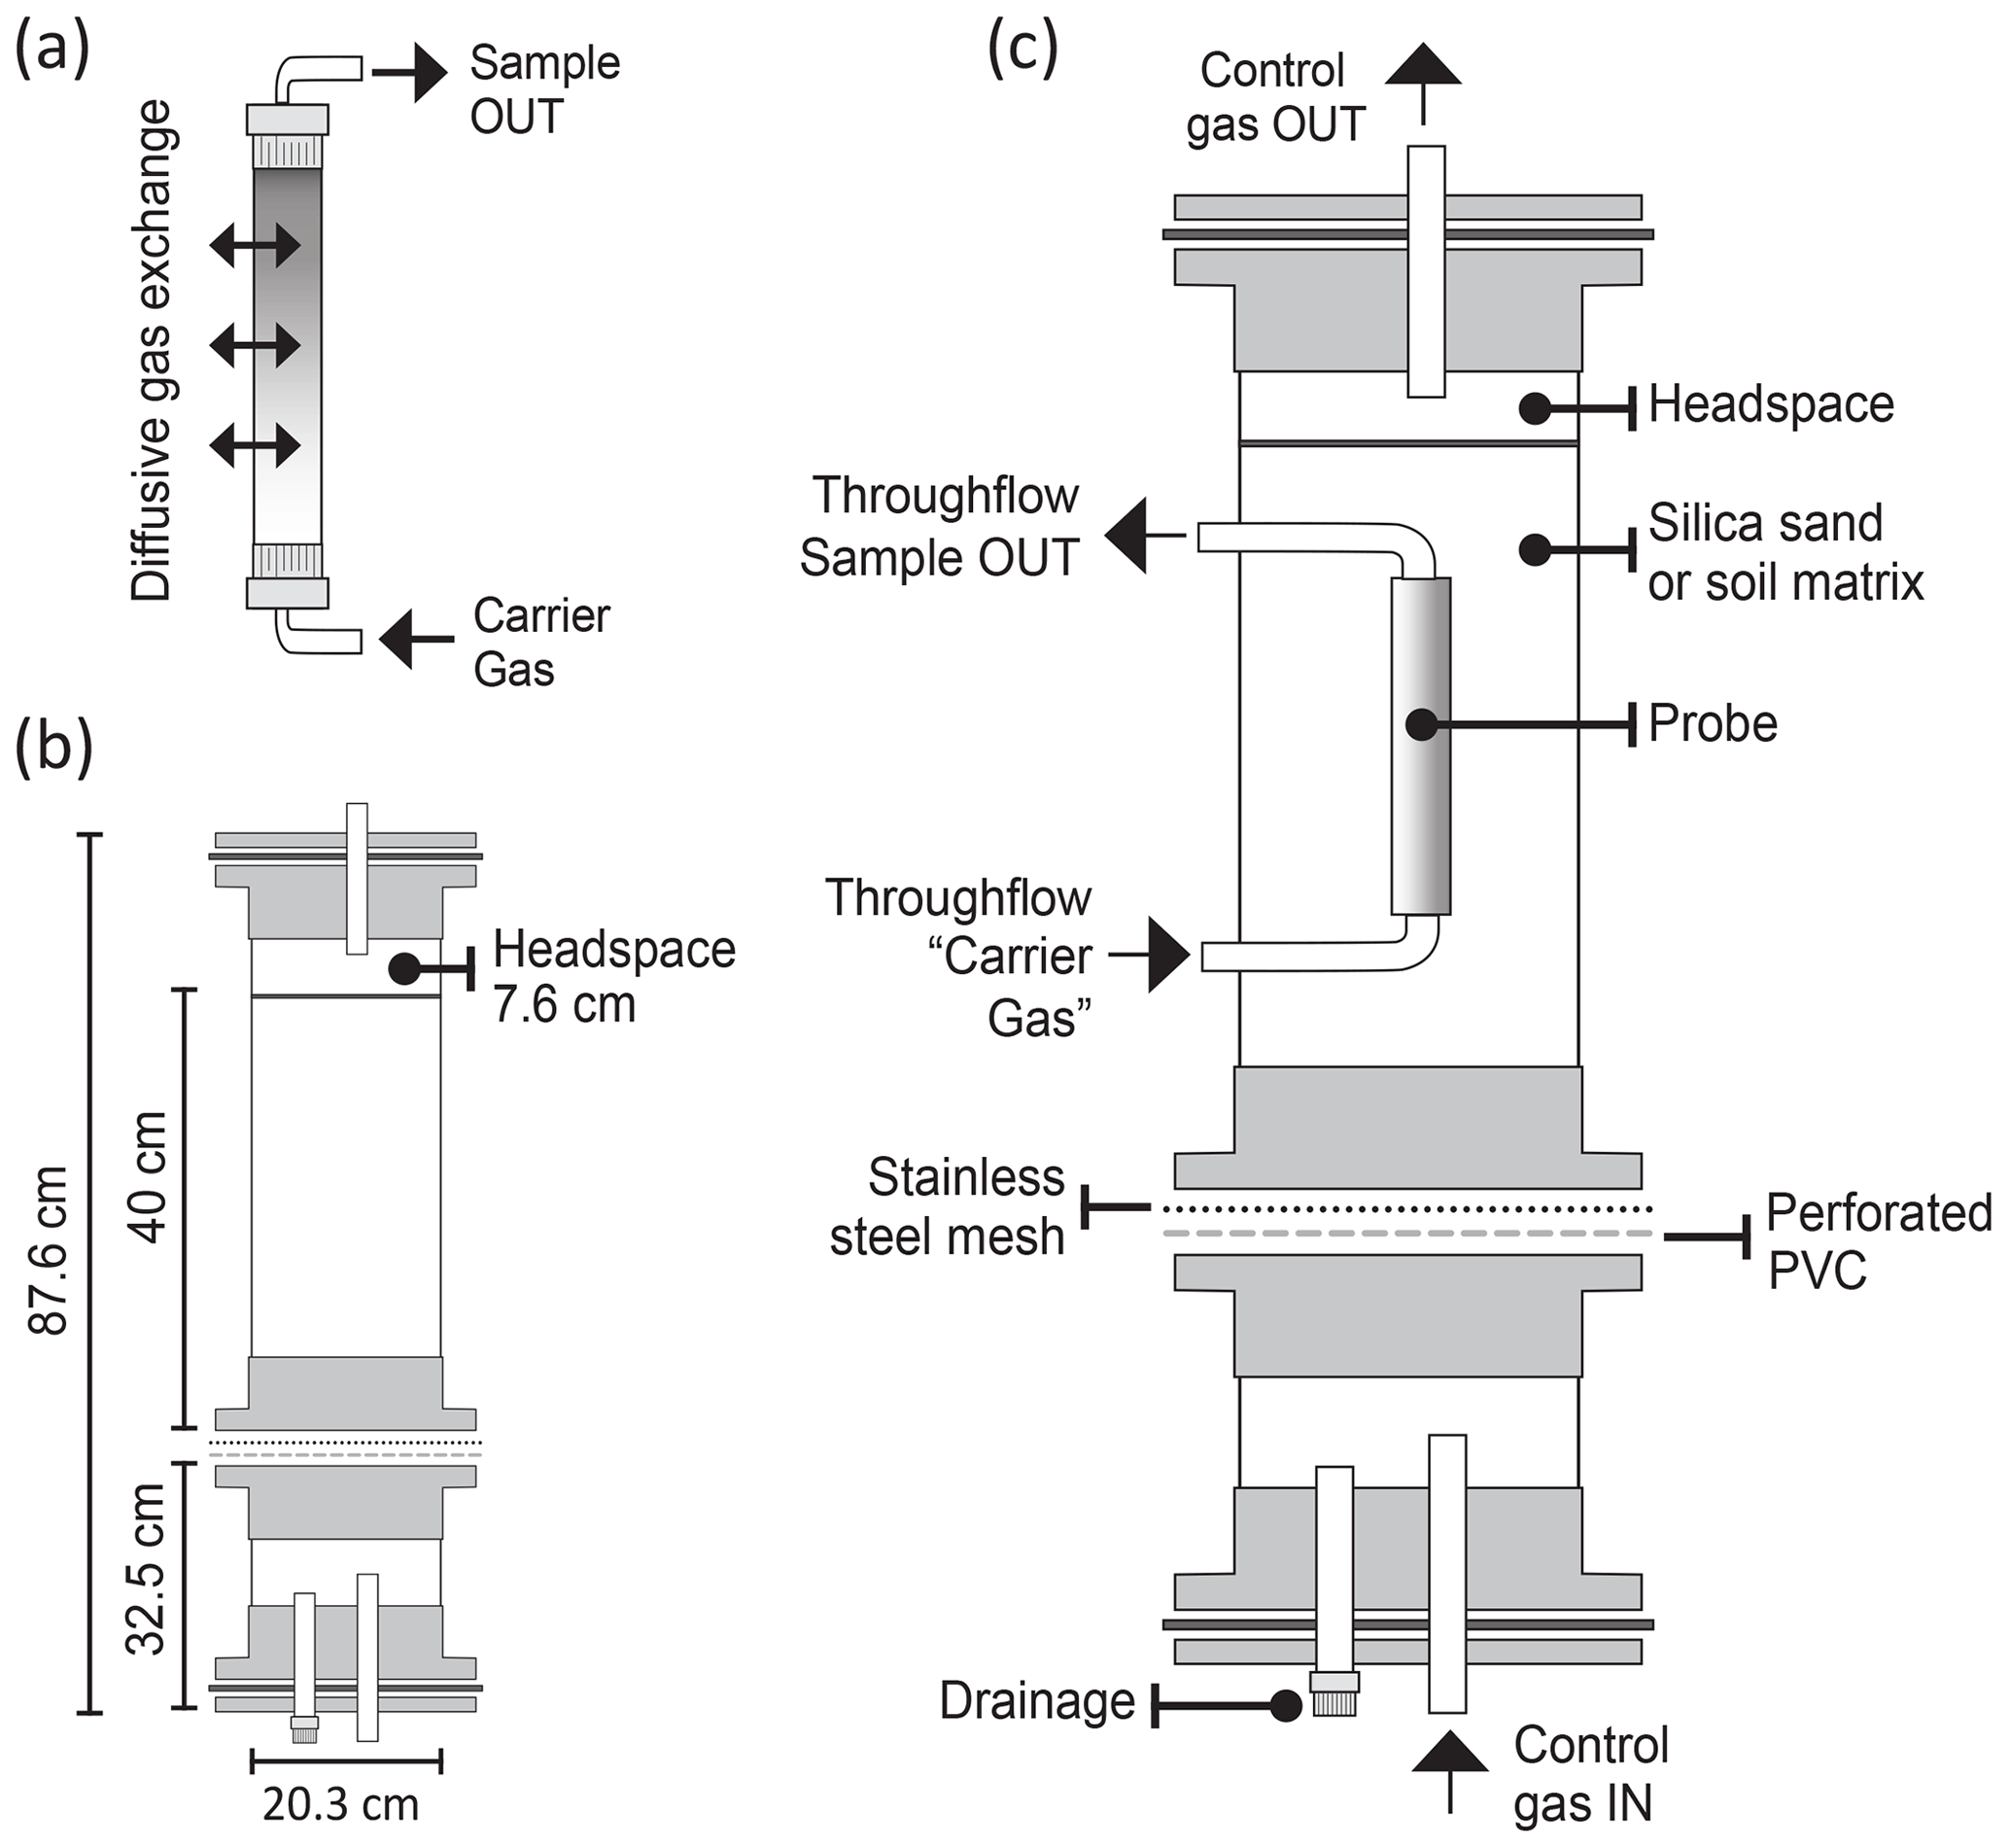
Figure 1Gas probe and soil column assemblies: (a) microporous probe of sPTFE, (b) dimensions of the two column sections of the custom soil column assembly built to evaluate probe performance, and (c) probe and column components for probe evaluation.
Table 1sPTFE probe pore size and dimensions including outer diameter (o.d.), inner diameter (i.d.), and wall thickness (W).
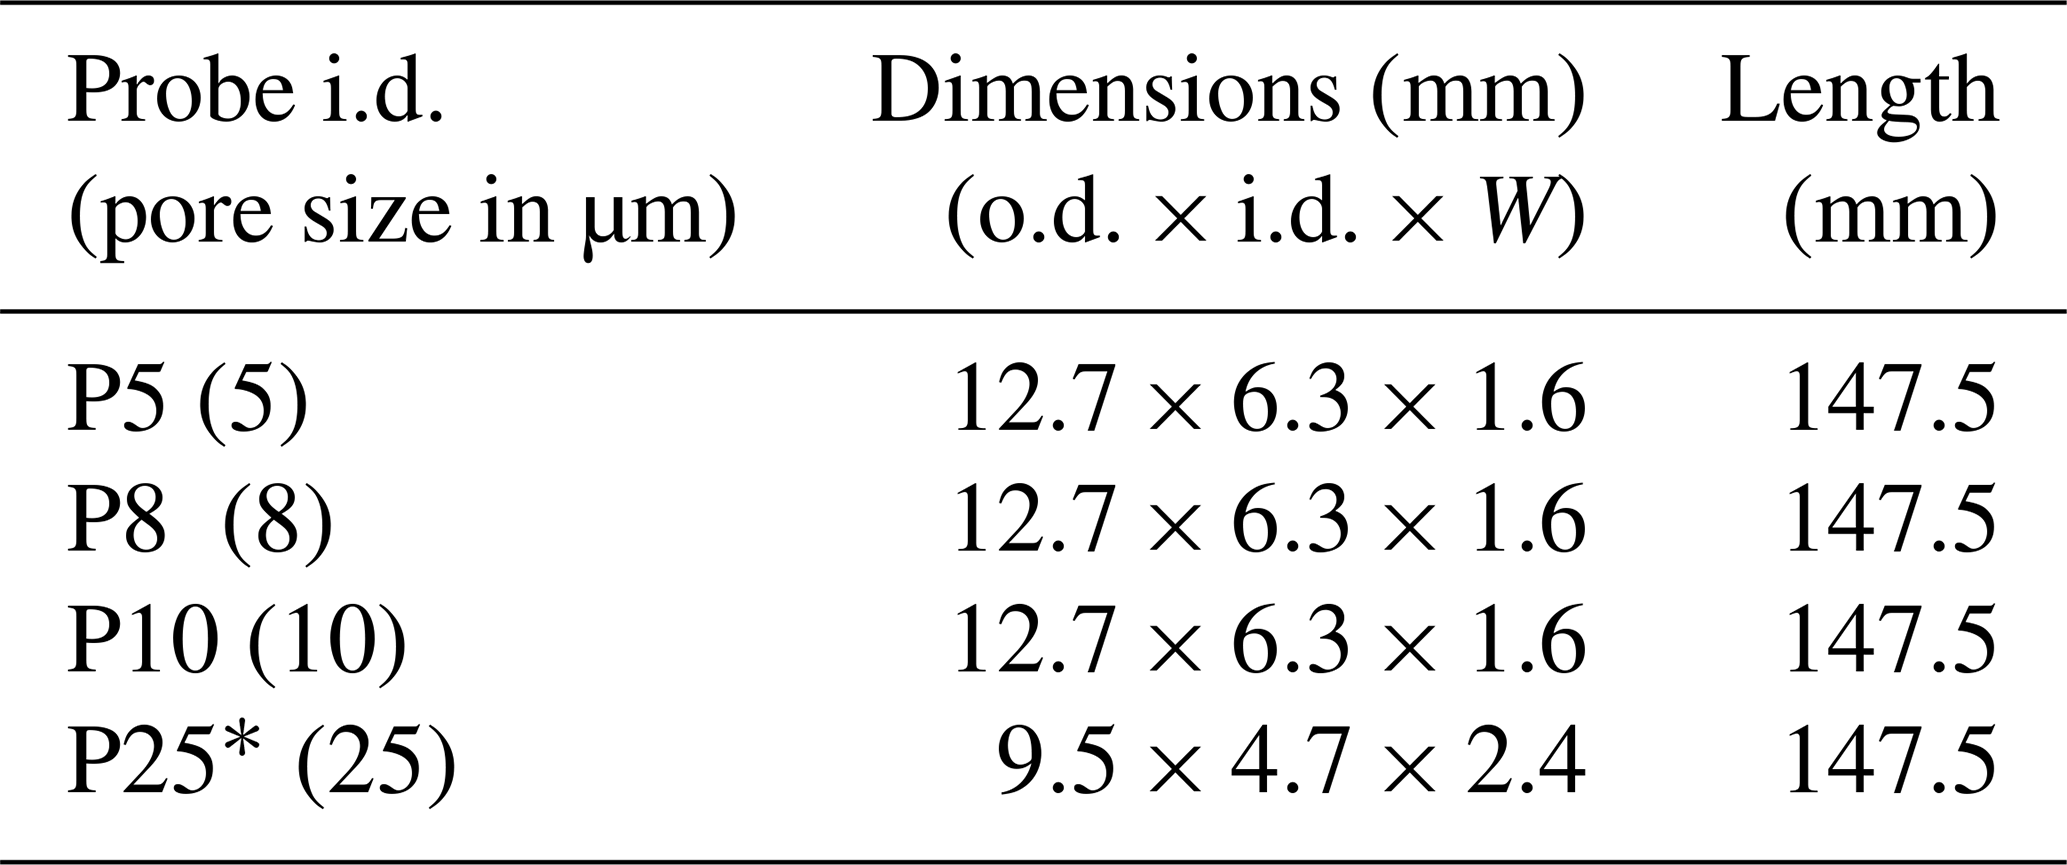
* Two sPTFE pieces joined with a PFA fitting.
2.1.2 Soil columns
We used soil columns to evaluate probe performance under controlled soil gas in a non-reactive matrix (silica sand). Silica sand (Granusil 4095, high-purity industrial quartz; Covia Corporation, Emmett, ID, USA) was used as the non-reactive matrix, which is a low-alkaline-oxide matrix with a characterized particle size distribution (Table S1). We designed the column to allow a gas of controlled composition (control gas) to be advectively forced through the silica matrix from below (Fig. 1) to evaluate probe performance (System 1 tests at University of Arizona, UA, and System 2 tests at Aerodyne Research Inc., ARI; Sect. 2.3.1). We also used the columns to measure in situ gas dynamics in response to environmental manipulation (e.g., wetting, redox state) in a complex matrix (soil) (System 2 tests at ARI, Sect. 2.3.2).
The lower column section (Fig. 1b) supported drainage and buffered delivery of control gas, and the upper section contained the matrix (silica or soil), with a headspace layer for uniform column outflow. Together, the two column sections had a 20.3 cm inner diameter, 87.6 cm length (including base and cover), and 28 L volume. The probe was positioned centrally in the upper section to allow sufficient distance from column walls (10 cm) and the soil–gas interface (15.2 cm) to avoid edge effects (Fig. 1c). The upper and lower column sections were separated by a layer of perforated PVC (3.17 mm thickness, staggered 3.17 mm holes, 4.67 mm center to center, 40 % open area) and a type 304 stainless-steel wire cloth mesh (325 × 325 mesh (44 µm), 0.051 mm opening size) to allow the passage of control gas and drainage of water (sealed during sampling) while retaining matrix integrity in the upper section. Column sections were joined using schedule-80 PVC pipes, flanges, bolts, and rubber gasket seals, allowing columns to be modular and easy to disassemble, transport, and refill. Additionally, PTFE and polyetheretherketone (PEEK) bulkhead fittings (IDEX Health and Science LLC., Oak Harbor, WA, USA) and washers provided airtight and watertight connections for gas tubing. Soil sensors (e.g., moisture, temperature) flanked the soil probes (Fig. 1c).
2.1.3 Gas sampling system
The soil probe sampling system operated in a continuous-flow mode whereby carrier gas (ultra zero air, UZA; Airgas Inc.) flowed through the soil probe to equilibrate with soil gas (probe flow), the outflow was diluted online (dilution flow), and the combined flow (total flow) was sent to the gas analyzer for real-time measurement. The gas sampling system consisted of a controlled soil gas transfer system, sampling probes, and a measurement and data acquisition system that coordinated sampling in three gas columns (Fig. 2). Nearly identical sampling systems were built at UA (System 1) and Aerodyne (System 2) and differed in the specific TILDAS and gas control components deployed at each location (Table 2). To prevent bulk gas advection in the soil, it was critical to ensure that flows into and out of the probe were matched such that the sum of the probe and dilution flows were equal to the total flow at the instrument intake. This depended on precise flow control by digital mass flow controllers (MFCs; Alicat Scientific, Tucson, AZ, USA). Dilution flow (Fig. 2) was important to reduce risk of condensation, avoid exceeding the optimal detection range, and increase the gas analyzer cell response time. The control gas system allowed us to stipulate the specific mole fractions and relative isotope mixtures at the column inlet. Two streams of UZA controlled by MFCs (probe and dilution) were delivered in tandem through a stream selector 16×2 port valve (VICI – Valco Instruments Co. Inc., Houston, TX, USA) with the total flow directed to the analyzer (Fig. 2) by a separate multiport selector (VICI – Valco Instruments Co. Inc., Houston, TX, USA). The custom control gas composition added to soil columns was mixed from UZA and concentrated gas cylinders (e.g., 5 % CO2; Table 3). A bypass line was installed to independently verify the control gas composition entering the column, while the column outflow line was used to measure column headspace concentrations (Fig. 2). In System 1, we used a custom LabVIEW (National Instruments, Austin, TX, USA) program to execute scripts generated in MATLAB (2018; The MathWorks Inc., Natick, MA, USA) for the timing and control of MFC gas flow rates and VICI valve switching. The custom LabVIEW program was also used to query and log all the MFC parameters via USB multi-drop box (BB9 RS-232, Alicat Scientific, Tucson, AZ, USA) and all SDI-12 (serial digital interface at 1200 Bd) sensors with a SDI-12-to-RS-232 converter (Vegetronix, Inc., Riverton, UT, USA). In System 2, TDLWintel, the TILDAS measurement and data acquisition program, controlled the multi-valves on a schedule for continuous unattended operation.
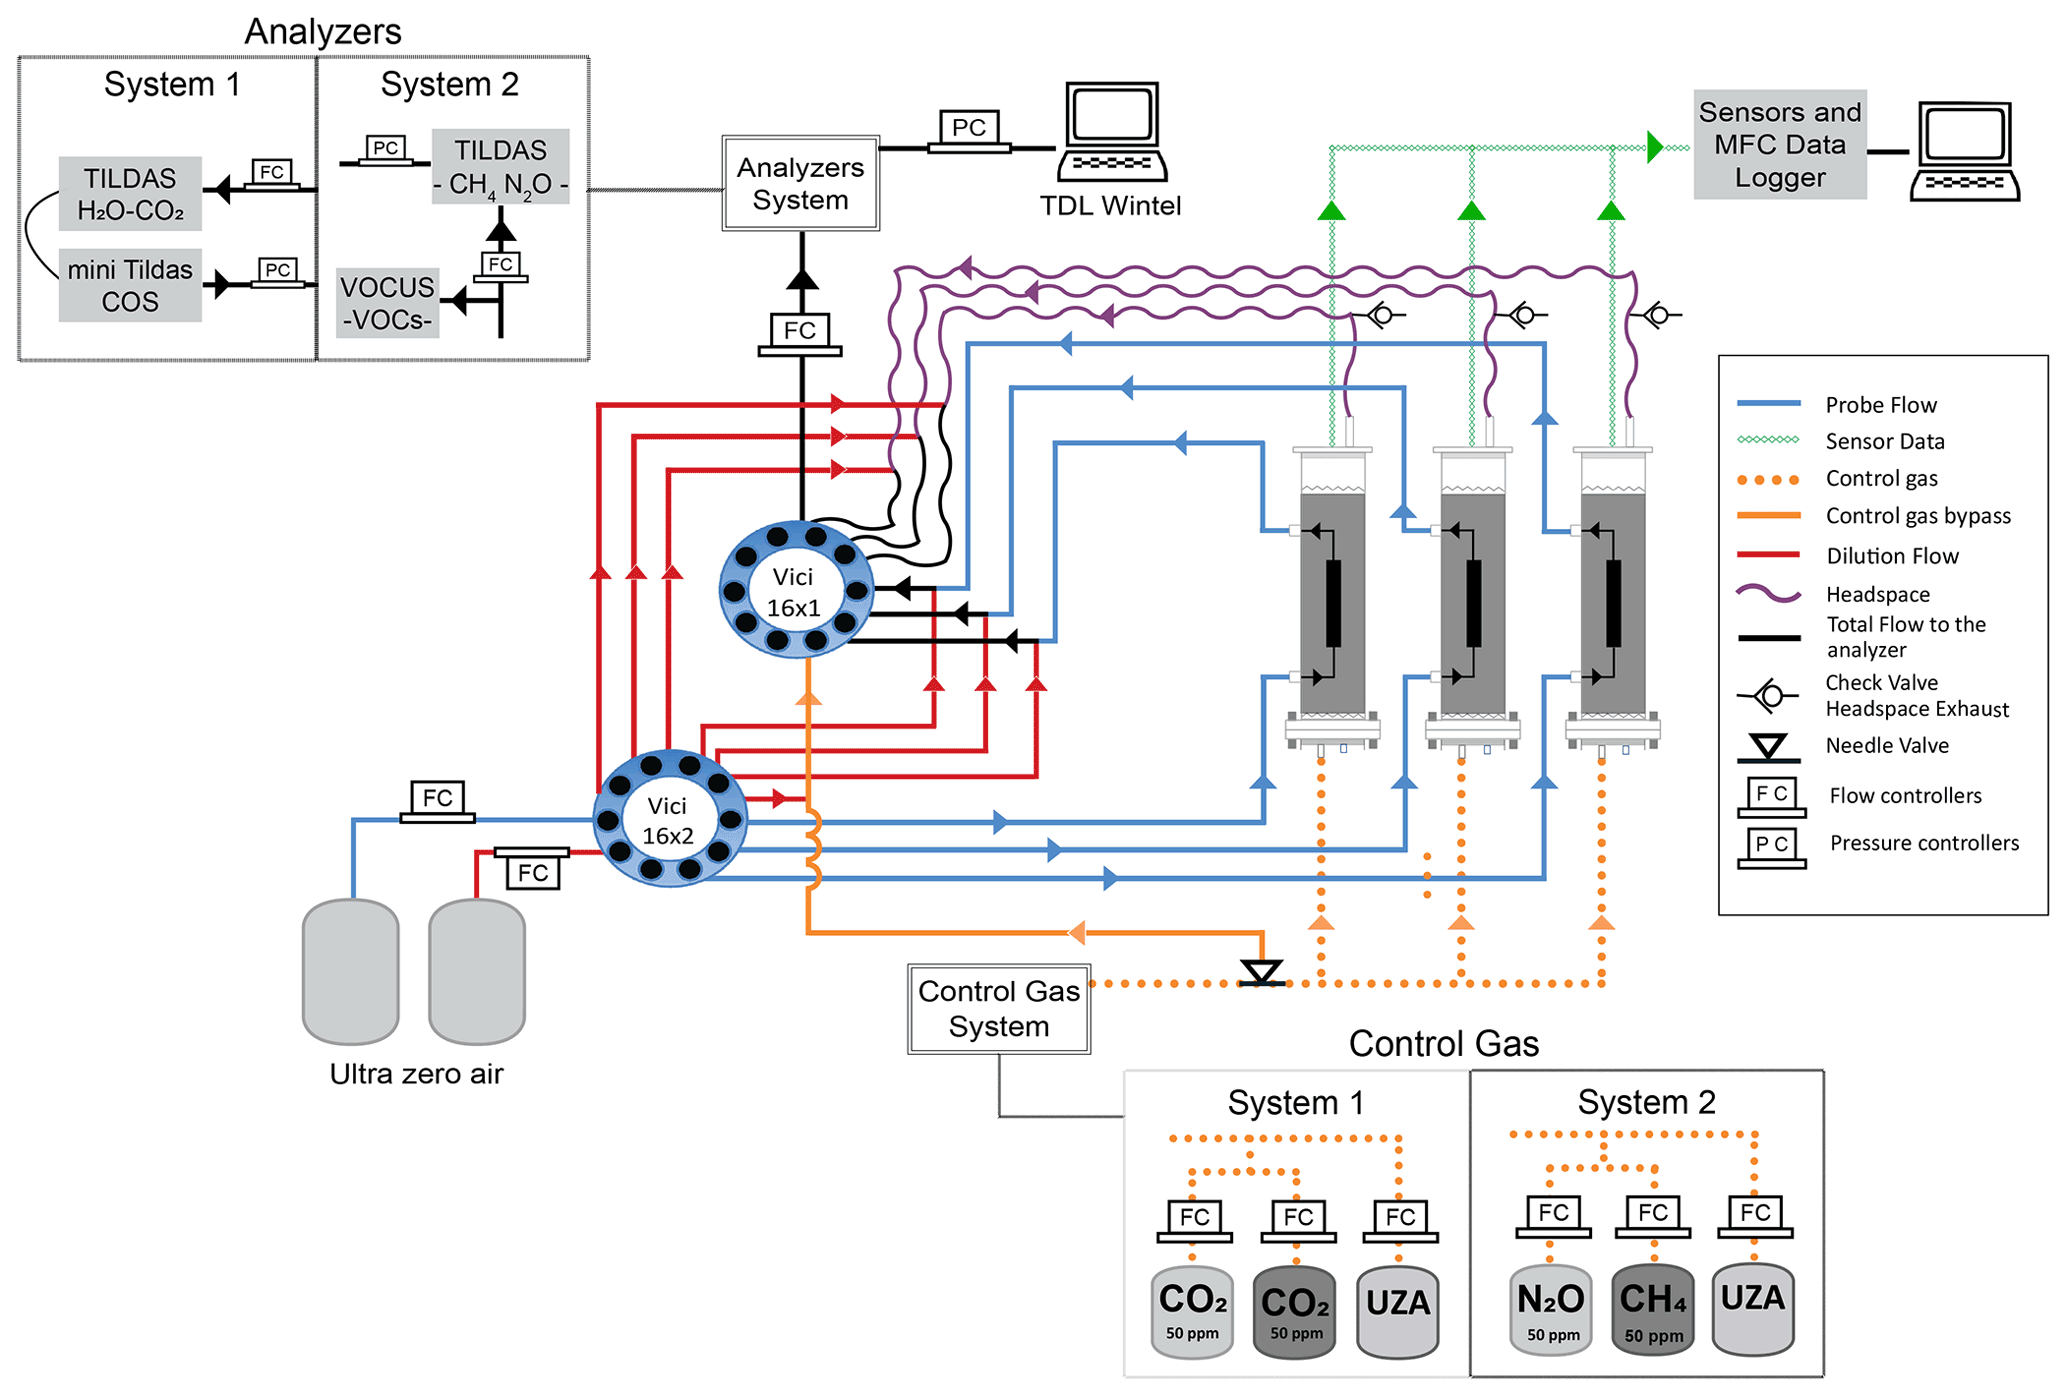
Figure 2Detailed schematic of sampling System 1 (UA) and System 2 (ARI). Column matrix gas concentrations were controlled by mixing cylinder gas with UZA using MFCs and delivering the custom gas mixture through the columns from bottom to top (dotted orange line). Probe sampling flow rates were controlled precisely using three MFCs to ensure that flow in and out of the probe was balanced (probe flow (blue lines) + dilution flow (red lines) is equal to total flow to analyzer (black lines)). Column headspace (atmospheric pressure) and control gas bypass (positive pressure) were controlled by MFCs at two points (dilution, total flow to analyzer), forcing the probe flow as a makeup flow (probe flow is equal to total flow minus dilution flow).
To evaluate the probe and the column performance, we corrected observed concentrations (Cobs) using the ratio of the dilution and total flows to obtain true probe sample, column/headspace, and control gas concentrations (C). For example, for soil probe sample concentrations we used the ratio of the total flow (Ft, probe plus dilution flow) to the probe flow (Fp) as shown in Eq. (1):
2.2 Trace gas analyzers
We used a suite of trace gas analyzers relevant to biological soil gas cycling (Fig. 2) to integrate with the soil probe sampling system. TILDAS isotope analyzers measure the concentrations of individual isotopologues, and isotopic ratios can be determined using Eq. (2):
where Rn refers to the ratio of the rare isotopomer and iX to its abundant isotopomer (Toyoda et al., 2017).
2.2.1 Coupled laser spectrometers for CO2 and H2O isotopes and OCS and CO
In System 1 we integrated two TILDAS trace gas analyzers (Aerodyne Research Inc., Billerica, MA, USA) with the soil probe system to evaluate the feasibility of coupling with the sintered PTFE probes and evaluate performance under controlled conditions. TILDAS-1 was a dual-laser instrument configured for measurement of water isotopes at 3765 cm−1 and 12C16O16O, 13C16O16O, 12C16O17O, and 12C16O18O at 2310 cm−1 with an 18 m absorption cell. TILDAS-2 was a compact “mini” single-laser instrument configured to quantify carbonyl sulfide (OCS), carbon monoxide (CO), water (H2O), and CO2 at 2050.4–2051.3 cm−1 with a 76 m absorption cell. The dual and mini TILDAS analyzers had a 500 and 300 cm3 sample cell volume, respectively. The TILDAS platforms draw air samples through an absorption cell at low pressure where laser light is transmitted in a multipass configuration for long effective absorption pathlengths. The laser is scanned at kilohertz rates over the rovibrational absorptions of the molecule(s) of interest. Transient light absorptions were fit to known Voigt profiles to determine molecular concentrations on the fly using Aerodyne's proprietary acquisition and analysis software, TDLWintel. For this experiment, we connected the two TILDAS analyzers at a controlled flow rate (500–250 sccm, MC-1SLPM-D, Alicat) in series, and cell pressure was dynamically controlled to 40 Torr (PCS-EXTSEN-D-ISC/5P, Alicat) between the two analyzer sample cells and vacuum pump (MPU 2134-N920-2.08, KNF Neuberger, Trenton, NJ, USA). The TILDAS optical tables were each purged with 100 sccm zero air.
In System 1, CO2 concentrations varied linearly with controlled dilutions of 10 % CO2 tanks (Fig. S1, dual CO2 cal), and absolute CO2 concentrations were calibrated with a linear curve. We calibrated the δ13C CO2 from the concentration-dependent relationship of δ13C CO2 vs. observed [CO2] (Fig. S2); specifically, we fit a Gaussian equation to the relationship between (δ13C CO2 observed – δ13C CO2 true ‰ vs. Vienna Pee Dee Belemnite (VPDB)) and CO2 concentration (accounting for standard deviation in δ13C-CO2 measurements). We applied this CO2-dependent correction to all reported δ13C-CO2 values.
2.2.2 Novel laser spectrometer for N2O and CH4 isotopomers
System 2 integrated a second and nearly identical (Table 2) gas sampling system with a novel dual TILDAS analyzer for isotopomers of methane (CH4) and nitrous oxide (N2O) (Aerodyne Research Inc., Billerica, MA, USA) to test instrument modifications that help integrate soil gas sampling probes with laser spectrometry.
In this study, we identified and selected the best spectral region and laser technology for continuous high-precision measurements of isotopomers of CH4 (12CH4 and 13CH4), and N2O (14N14N16O (“446”), 14N15N16O (“456”), 15N14N16O (“546”), and 14N14N18O (“448”)). The regions near 2196 cm−1 (4.56 µm) and 1295 cm−1 (7.72 µm) provide interference-free measurements of N2O and CH4, respectively, and their rare isotopes. The 2196 cm−1 region is also capable of measuring CO2 at soil-relevant concentrations (parts-per-thousand levels). The CH4 and N2O TILDAS system was optimized with respect to optical alignment, laser operating parameters (i.e., scan length, laser current, and temperature settings), and fit parameters. Short-term (seconds) and long-term (minutes–hours) noise was determined by sampling from a compressed air cylinder as a constant gas source, followed by Allan–Werle variance analysis (Werle et al., 1993). We chose 30 Torr as the optimum cell pressure to minimize both noise and spectral crosstalk between isotopomer absorptions. To reduce sample volume we designed a new cell insert and a compact 76 m pathlength multipass sampling cell. The novel volume-reducing insert for the 76 m cell has interior walls that match the contour of the multipass pattern and was 3D-printed using PA2200 nylon. After printing, the interior and exterior surfaces of the insert were sealed with urushi lacquer – a stable, durable, inert lacquer (McSharry et al., 2007). The turnover time of the cell volume with insert was evaluated in continuous sampling mode.
The concentration dependence of isotope δ values derived from infrared isotopic measurements is an analytical challenge that is instrument dependent. To minimize the concentration dependence we followed two steps. (i) We used frequent spectral backgrounds to minimize offsets (i.e., immediately prior to each sample measurement). A sample spectrum is recorded with the instrument sample cell filled with UZA. This spectrum is used to normalize sample spectra, improving accuracy and sensitivity by accounting for changing instrument conditions and possible drift. (ii) We identified best-fitting parameters for each spectral region and application. During System 2 operation, we automated script schedules using an external command language (ECL) within TDLWintel that ran backgrounds, calibrations, and controlled valves.

Alcohols (e.g., methanol and ethanol) have weak features in the methane spectral window (1295 cm−1), at levels typically below that of the isotopic precision. We tested whether VOCs would cause infrared spectral interferences with TILDAS analysis by exposing the instrument to artificially elevated part-per-thousand levels of methanol, ethanol, and formaldehyde – three species that may be common in soil. We found potential for interference near the 13CH4 absorption at elevated alcohol levels but did not observe this interference in the spectra collected from probes in the soil tested.
System 2 calibration used online mass flow control to dilute concentrated N2O or CH4 calibration gases into UZA. We used pure samples of N2O from the Massachusetts Institute of Technology (MIT Ref I and Ref II). The isotopic ratios of N2O were determined by isotope ratio mass spectrometry (IRMS) and TILDAS measurements and externally verified by Sakae Toyoda at the Tokyo Institute of Technology (McClellan, 2018). For calibration of the soil matrix tests discussed below, we used MIT Ref II to make a surveillance standard of 1000 ppm N2O. After calibrating N2O isotopes against the reference gas, observed lab air N2O isotopic ratios were within 3 ‰ of the relatively stable isotopic ratios of ambient tropospheric N2O (Snider et al., 2015): bulk 15N value of 6.3 ‰–6.7 ‰, site preference of 18.7 ‰ (Mohn et al., 2014), and 18O value of 44.4 ‰ (Snider et al., 2015). For CH4 concentrations, a CH4 surveillance tank served as a stable isotopic source to identify changes in isotopic composition. Measured instrumental precisions with an averaging time of 2 min were 0.9 ‰ and 1.6 ‰ for N2O bulk 15N and the site preference, respectively, at 325 ppb N2O, and 0.2 ‰ for 13CH4.
2.2.3 High-resolution volatile organic compound gas analyzer
In System 2 experiments, we integrated a PTR-TOF-MS instrument (Vocus; Aerodyne Research Inc., Billerica, MA, USA) (Krechmer et al., 2018) into the sampling system in parallel with the N2O–CH4 TILDAS to detect soil VOCs such as monoterpenes, isoprene, and pyruvic acid (Gonzalez-Meler et al., 2014; Guenther et al., 1995). The Vocus technology contains a corona discharge reagent-ion source and focusing ion molecule reactor (fIMR) that has low limits of detection (less than parts per trillion by volume) and a fast time response, acquiring the entire mass-to-charge spectrum on the order of microseconds. A TOF instrument also has high resolving power in the mass dimension, enabling separation of isobaric signals (occurring at the same nominal mass-to-charge ratio). The TOF instrument employed in this work consisted of a 1.2 m flight tube enabling a resolving power > 10 000 m Δm. A sample flow of 100 sccm was injected continuously into the Vocus source, with no extra overblow or carrier flow in the inlet line.
Data were processed using the Tofware (Aerodyne and TOFWERK A.G.) software package in Igor Pro (WaveMetrics). For these experiments the PTR-TOF-MS instrument was not quantitatively calibrated for the signals reported below, as we were only interested in relative concentration responses to wetting. Thus, signals are reported in non-normalized counts per second (Hz).
2.3 Experiments performed
We performed experiments using Systems 1 and 2 (Sect. 2.2, Fig. 2) to demonstrate the feasibility and versatility in coupling the permeable soil gas probes to trace gas analyzers to measure in situ gas concentrations and isotope ratios in soils. We conducted two categories of experiments: (1) experiments under controlled conditions using silica, characterizing the ability of probe sampling to measure known, controlled soil gas concentrations, and (2) experiments with soil, characterizing the ability of probes to capture soil microbial gas cycling dynamics from natural soils in response to environmental changes.
2.3.1 Experiments under controlled conditions using silica
Silica sand was used to limit trace gas production or consumption from the matrix for controlled evaluation of the probe. Three columns were filled with a dry silica matrix (Table S1) and closed hermetically. Gas concentrations and isotopic signatures of the inlet, soil probe, and column headspace samples were quantified while the gases flowed continuously through the column and dilution rates were varied (Table 3).
We evaluated the effect of probe sampling on the column (Experiment 1) by changing the probe flow rate with constant control gas concentration and dilution. With System 1 and a single column, we alternated measurement of CO2 concentration in headspace gas (1 h) and the probe (15 min) to determine the impact of probe sampling on soil column outflow concentrations. Next, we tested the flow conditions that support the probe delivering fully equilibrated and representative samples by varying flow and dilution at constant column concentrations (Experiment 2). We evaluated 42 combinations of set points for total flow (from 50 to 300 sccm, at 50 sccm intervals) and dilution (from 90 % to 9 %, at 15 % intervals). Each measurement cycle lasted 25 min (15 min probe, 10 min column headspace) using one probe in System 1 and System 2.
We scaled up the sampling systems to three probes to evaluate multiple probes (Experiment 3). We measured probe and headspace gas at a constant dilution (75 %) of a 2000 ppm CO2 control gas for a target observation concentration of 500 ppm and probe flow rates of 5, 10, 20, 30, 40, 50, and 100 sccm (System 1). System 2 was similarly evaluated with N2O and CH4 control gases in the silica matrix (Table 3).
Table 3Experiments under controlled conditions with the silica matrix using Systems 1 and 2.
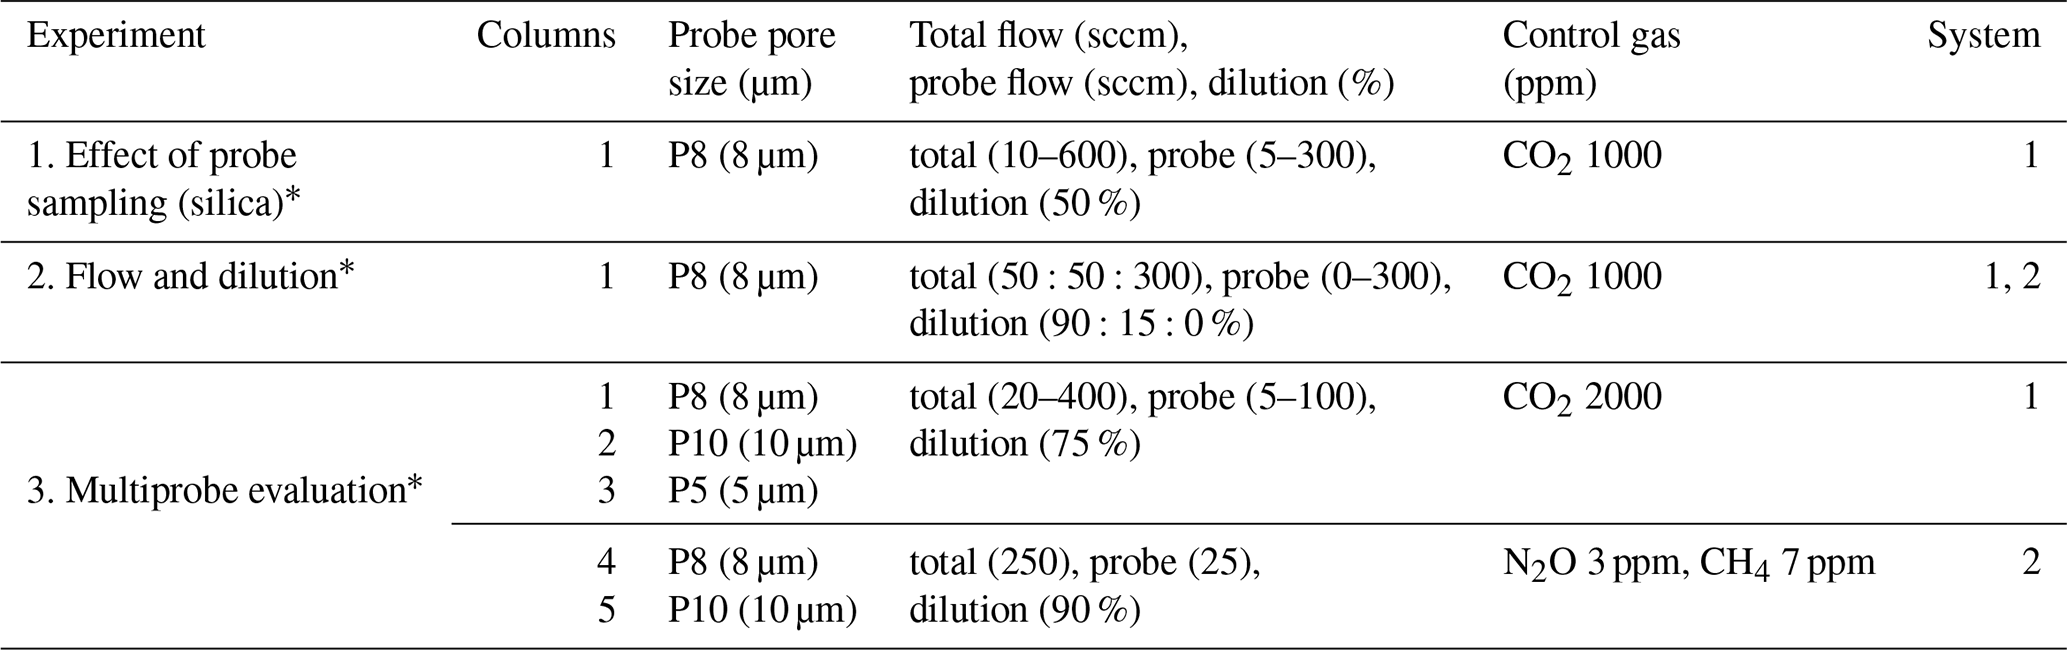
* Experiments 1–3 were conducted with the column top closed and no water addition.
2.3.2 Experiments with soil
We replaced the silica matrix with soil in the columns to understand (1) probe behavior and response when monitoring soil gases in a complex and dynamic soil matrix and (2) soil processes that drive dynamic changes in subsurface soil gases. We measured N2O and CH4 concentrations and isotopic signatures with the improved TILDAS instrument in System 2 (Fig. 2) in a series of experiments (Table 4). For soil experiments, headspace measurements can be used to track surface gas fluxes but do not represent control gas concentrations as in the silica experiments. We evaluated how measured soil gas concentrations changed in response to the following: probe sample flow rate (Experiment 4), environmental manipulation of the soil matrix (e.g., increased soil moisture with 5.1 cm of simulated rainfall) (Experiment 5), and forced changes to the soil redox state (e.g., forced N2 and UZA through the columns to shift from anoxic to oxic soil environments) (Experiment 6). In this last experiment, we integrated the Vocus PTR-TOF-MS instrument into the system to measure soil VOCs (Fig. 2).
Table 4Experiments under controlled conditions with the soil and silica matrix using System 2.
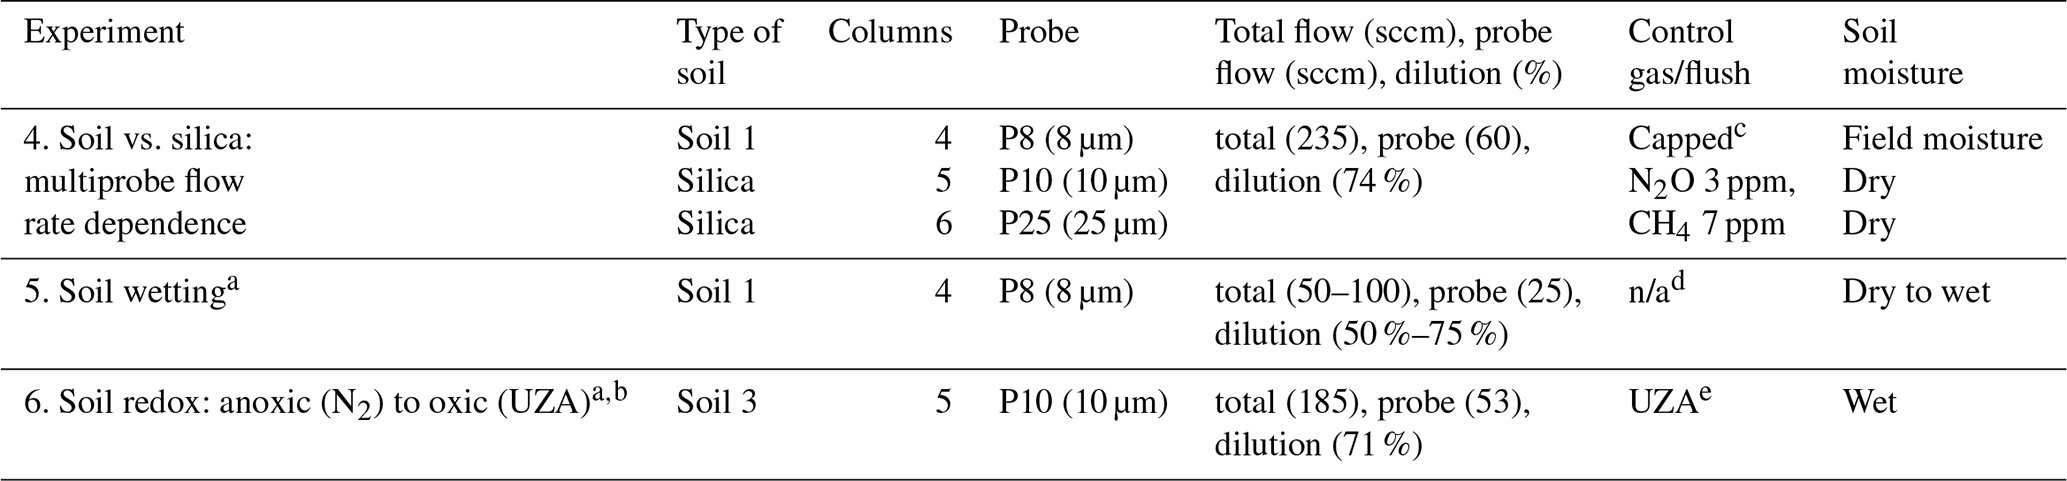
a Experiment conducted with the column top open. b Experiment integrated the Vocus PTR-TOF-MS instrument for VOCs. c Measurements performed with the column closed. d n/a: not applicable – control gas was not used during the experiment. e Matrix flushed with ultra zero air (UZA) on a capped (close) column to change the condition only.
2.4 Data processing
For System 1, we used RStudio and R version 3.3.2 (R Core Team, 2017) to integrate raw data with metadata. Igor Pro (version 7, WaveMetrics, Lake Oswego, OR, USA) for System 1 and System 2 was used to analyze instrument diagnostics, concentrations, and time series. We averaged the last 80 % to 90 % of each measurement. Measurements were dilution corrected to obtain undiluted sample concentrations (Eq. 1). In controlled tests when true headspace concentrations were measured before and after a probe measurement, these values were interpolated for comparison against probe concentrations to determine fractional recovery of soil gas concentrations.
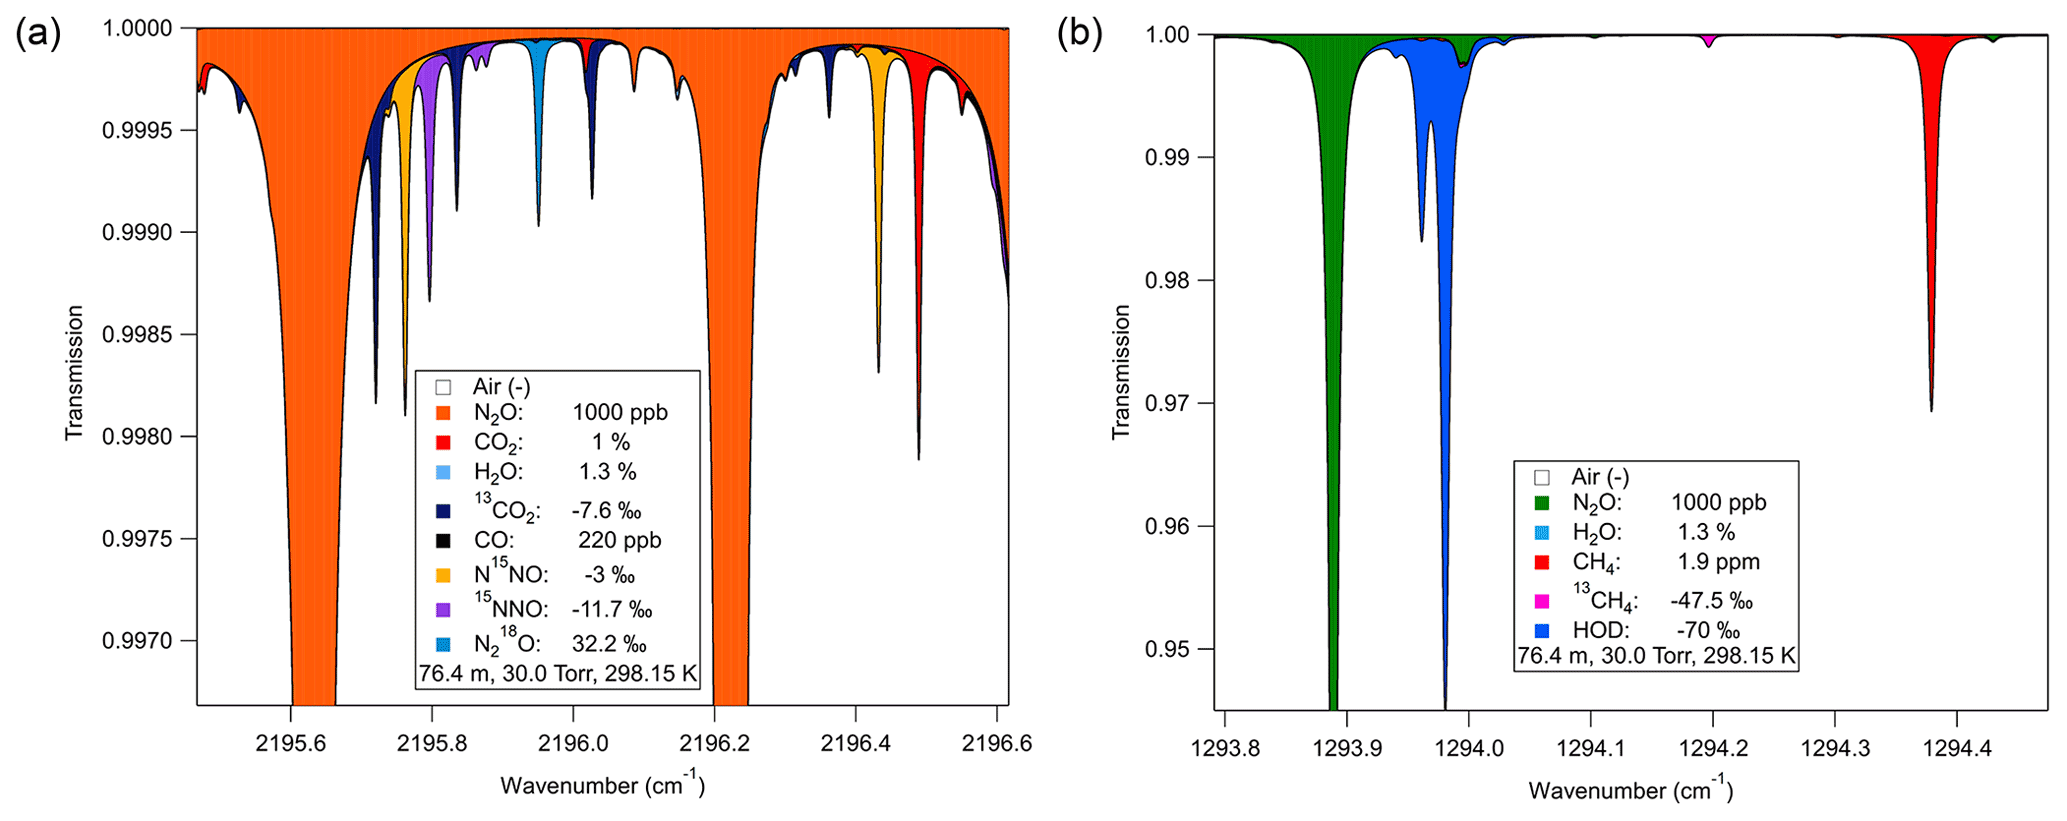
Figure 3Isotopomer spectral regions for monitoring N2O and CH4 isotopomers. (a) N2O isotopologue spectrum near 2196 cm−1. Four N2O isotopomers were present and spectrally separated; yellow and purple refer to the 15N isotopomers with different positions relative to the oxygen. Blue refers to the 18O isotopomer. (b) Spectral simulation of 1294 cm−1 region for methane analysis with lines well separated from H2O and N2O.
3.1 Instrument improvement (N2O–CH4 isotopomer TILDAS)
3.1.1 Selection of spectral regions
We selected optimal spectra windows and laser technologies for detection of the isotopomers of both CH4 and N2O using fundamental rovibrational transitions (Fig. 3). We used Aerodyne-developed simulation programs that utilize the HITRAN database (Rothman et al., 2013) to perform spectral simulations to identify potential measurement regions. Based on these simulations, we obtained appropriate lasers and detectors for the selected spectral regions. Simulations assumed an N2O mixing ratio of 1 ppm (lower end of expected values; Rock et al., 2007) in a mixture with 1.3 % H2O, 1 % CO2, 220 ppb CO, and 1.9 ppm CH4, at 30 Torr in a 76.4 m pathlength sample cell. This resulted in the selection of a spectral region (Fig. 3a) where all four N2O isotopomers of interest, 14N14N16O (446), 14N15N16O (456), 15N14N16O (546), and 14N14N18O (448), have absorptions in close spectral proximity (< 1 cm−1) but without overlap of absorptions of each other or other trace gases such as CO2. The 2196 cm−1 region was used to monitor the N2O isotopologues and CO2 in the soil gas matrix using a quantum cascade laser (QCL) (Alpes Lasers, Switzerland). We selected a second QCL (Alpes Lasers) based on simulations of methane isotopes in the 1294 cm−1 region to monitor 12CH4 and 13CH4 isotopomers (Fig. 3b). This region also provided measurement of H2O content in the soil gas via a water spectral feature at ∼ 1294.0 cm−1.
3.1.2 Optimization of isotope ratio measurements
TILDAS operational parameters were optimized to increase isotope ratio precision. For example, we monitored the slightly weaker doublet at 2196.2 cm−1 that had lower concentration dependence than the stronger absorber singlet at 2195.6 cm−1 that would produce nonlinear dependence at high mixing ratios. In addition, we modified fitting parameters to minimize the impact of baseline variability on measurement precision (fit shown in Fig. S3). These improvements in spectral fitting helped minimize the dependency of N2O and CH4 isotopic ratios on concentration. Specifically, we reduced the slope of δ vs. the mole fraction to 0.7 ‰ ppm−1 N2O (for N2O < 8 ppm) and 0.5 ‰ ppm−1 CH4 (for CH4 < 14 ppm). The online dilution approach was critical for avoiding N2O and CH4 concentrations in soil exceeding these linear ranges. We quantified the precision of the isotopic ratios (Table S2) using Allan–Werle plots (Werle et al., 1993) (Fig. S3).
3.1.3 Sample cell reduction
We improved measurement response time by reducing the TILDAS sample cell volume while maintaining the spectroscopic pathlength. Unnecessary “dead” volume in the sample cell was eliminated through two approaches. First, we reduced the cell volume (port to port) by 20 % (610 to 485 cm3) by shortening the cell by 4.2 cm, eliminating dead volume behind the mirrors. Second, the insert reduced the cell volume by ∼ 50 % (485 to 245 cm3) by filling volume between the mirrors but in the region outside of the multipass laser path. Overall, these changes reduced cell volume from 610 cm3 (previous ARI 76 m astigmatic multipass absorption cell (AMAC)) to 245 cm3, which improved the cell response time by 40 %, here defined as the time to observe 75 % of a full transition in concentration (Fig. S4) (i.e., from 1.13 (0.005) to 0.76 (0.01) s; 30 Torr and 1 slpm). At the cell pressure of 30 Torr used here, this 245 cm3 absorption cell volume corresponds to 9.7 cm3 of sample gas at ambient pressure.
3.2 Probe integration with gas sampling system – performance and optimization
3.2.1 Effect of probe sampling on soil gas concentrations (Experiment 1)
Soil probes sample subsurface gases by diffusion across the probe membrane into a UZA stream flowing through the probe. In our balanced mass flow approach, an equal proportion of UZA molecules diffuse out of the probe relative to soil gas diffusing in, which can affect (i.e., dilute) concentrations in the subsurface environment. To quantify the impact of probe sampling on soil column concentrations, we set control gas to 1000 ppm CO2 and varied the probe flow rate from 5 to 300 sccm and back, at a constant dilution (50 %). We evaluated the impact of a 15 min soil probe measurement on subsequent 1 h measurements of the column headspace. We found that column CO2 concentrations were depleted directly following probe sampling (from 0.6 % to 1.6 % depletion) and took > 1 h to fully stabilize. Column CO2 was most depleted after higher probe flow rates (Fig. 4) due to increased CO2-free UZA diffusion through the probe membrane. Low probe flow rates helped minimize these sampling artifacts on subsurface concentrations.

Figure 4Effect of probe flow rate on column gas concentration (System 1), representing the potential impact of probe sampling on the soil environment. Points represent concentration of CO2 in the headspace column for 1 h after a 15 min probe sampling event at various increasing (forward) and decreasing (reverse) probe sampling flow rates.
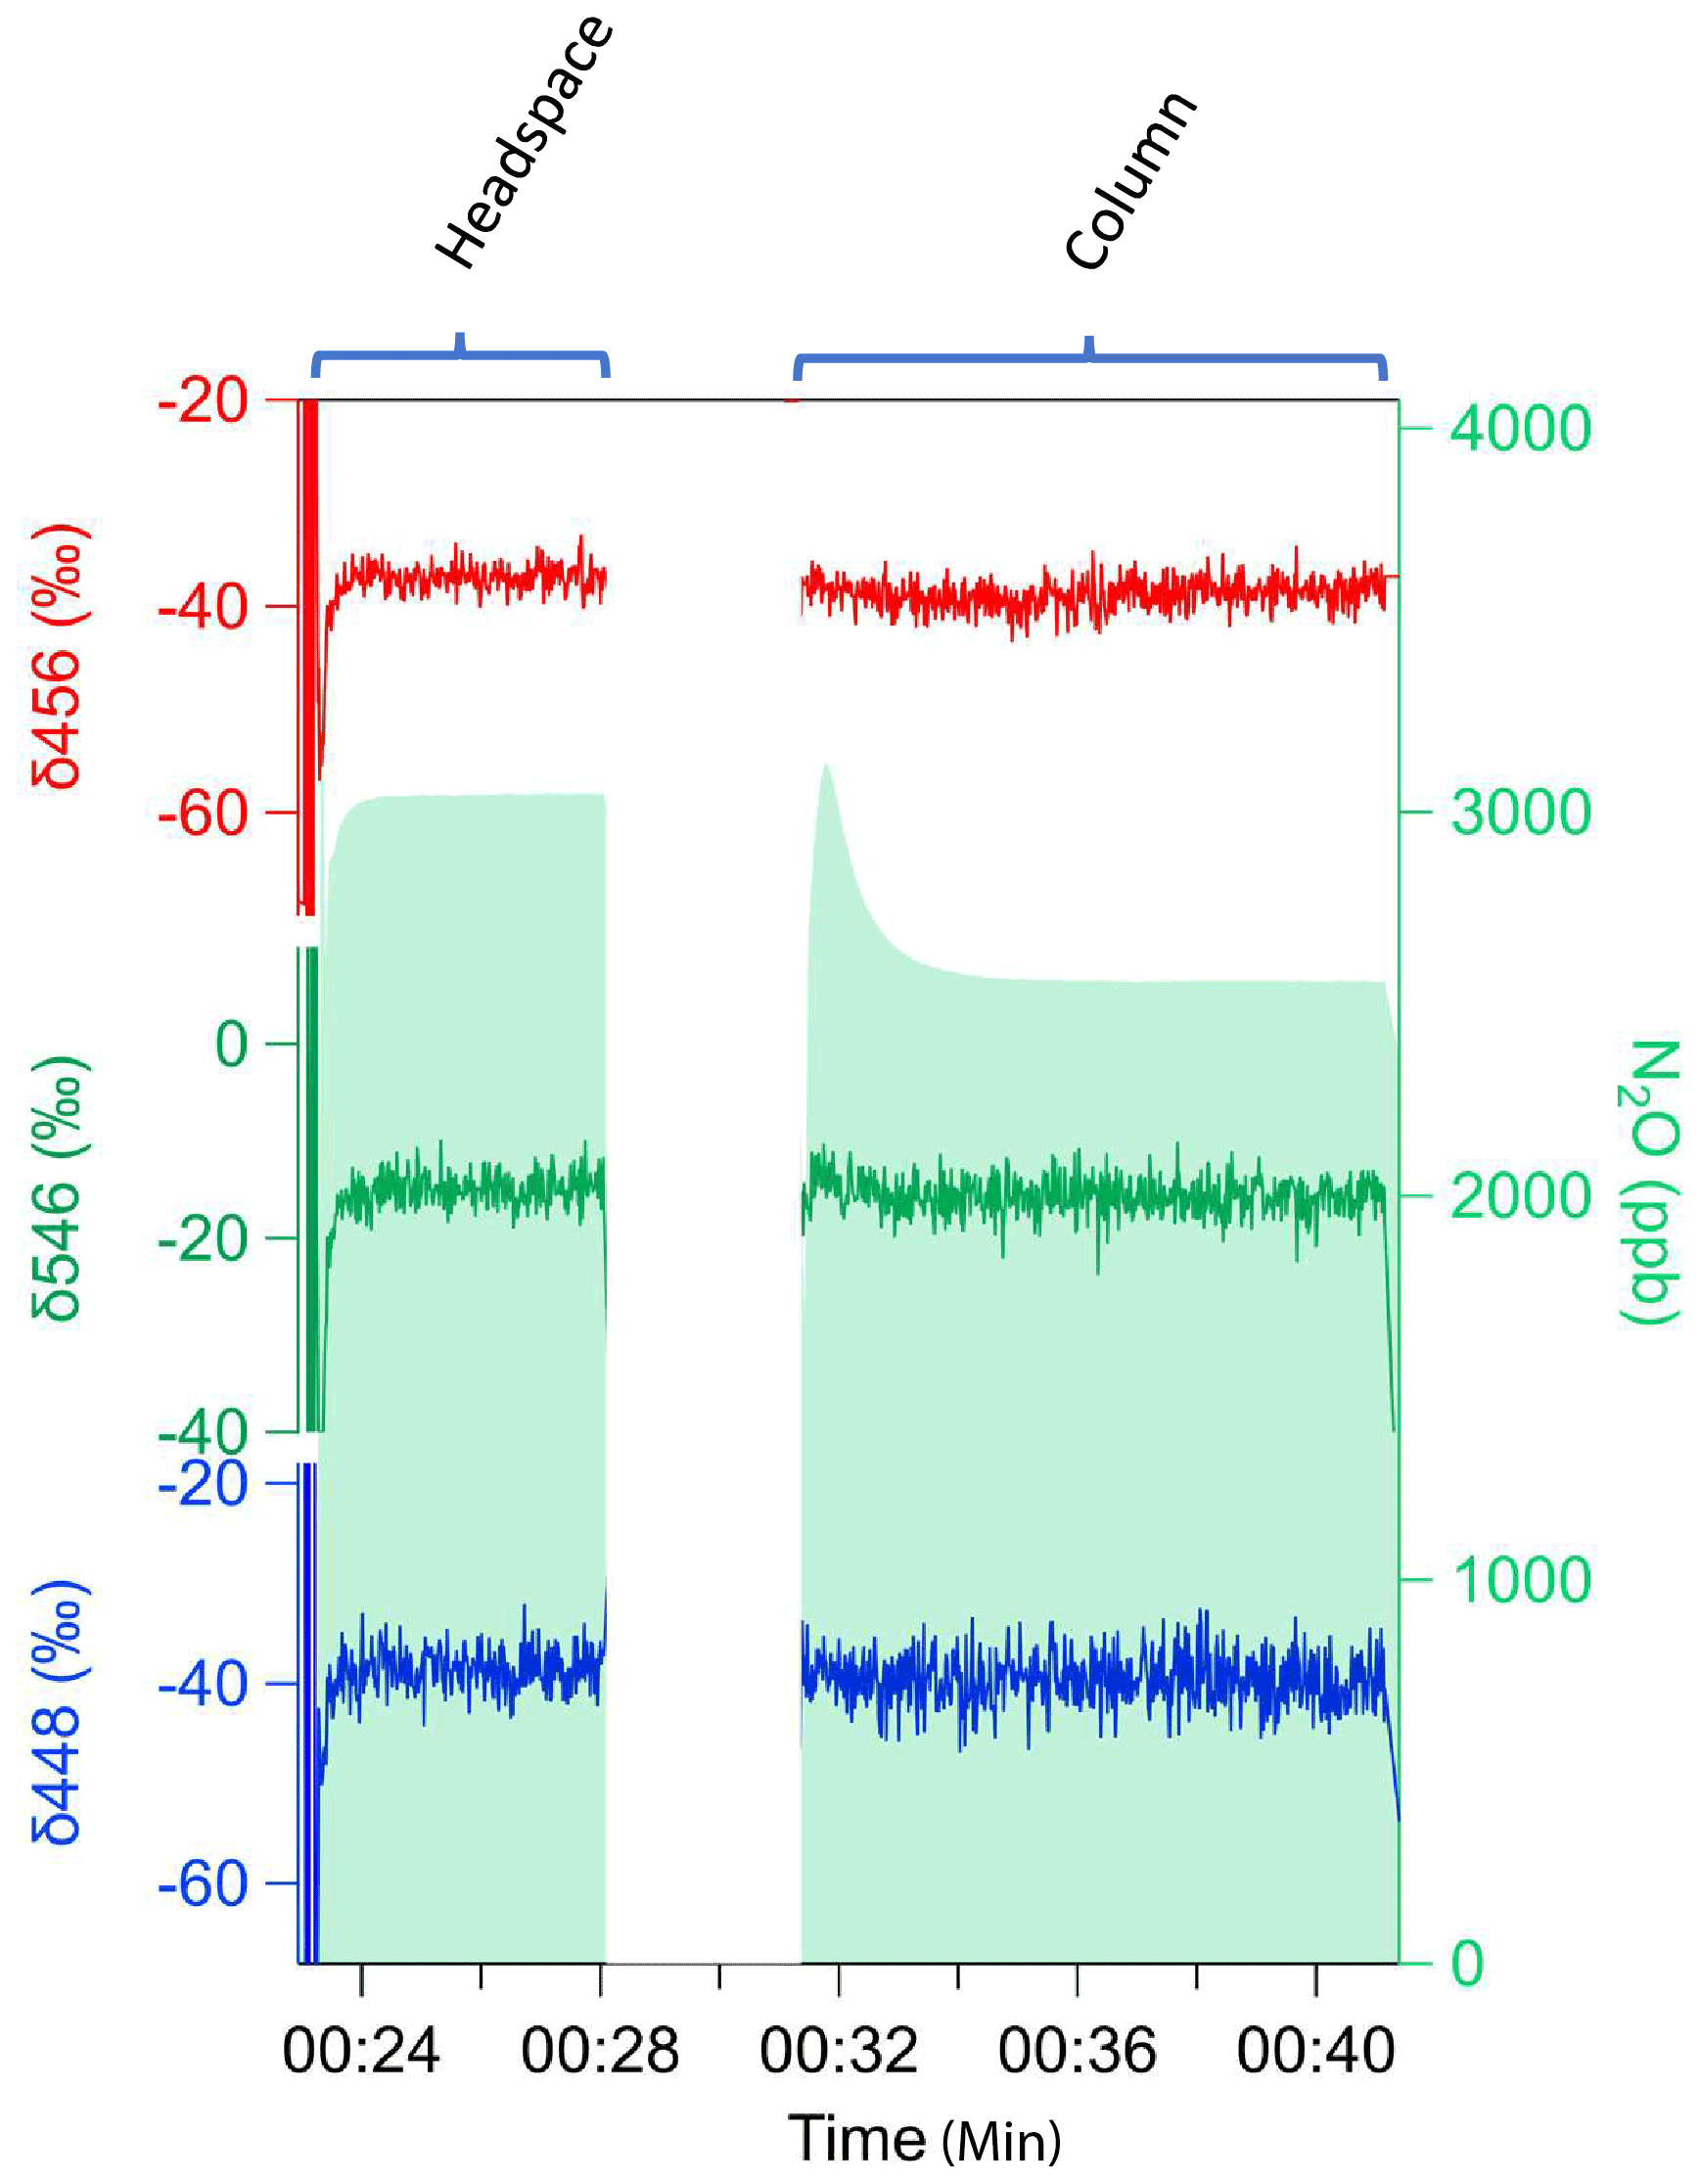
Figure 5Headspace and probe measurements of N2O using silica in System 2 (CH4–N2O). Example of initial pulse that equilibrates under flow-through and incomplete diffusion of N2O concentration (green shade) with undetectable isotopic fractionation of isotopomers δ456 (red), δ546 (green), and δ448 (blue).
3.2.2 Impact of probe flow rate and dilution on residence time of gas in probes (Experiment 2)
Compared to the controlled soil gas concentrations (Fig. 5), the probe-sampled concentrations were lower. When probe carrier gas is not flowing, the volume inside the probe is fully equilibrated with soil gas. This resulted in the observed initial “pulse” of high gas concentrations when a probe was first selected and measured. During sampling, probe gas concentrations drop to a steady-state value that represents a balance between the probe flow rate and the diffusion rate of soil gas molecules into the probe.
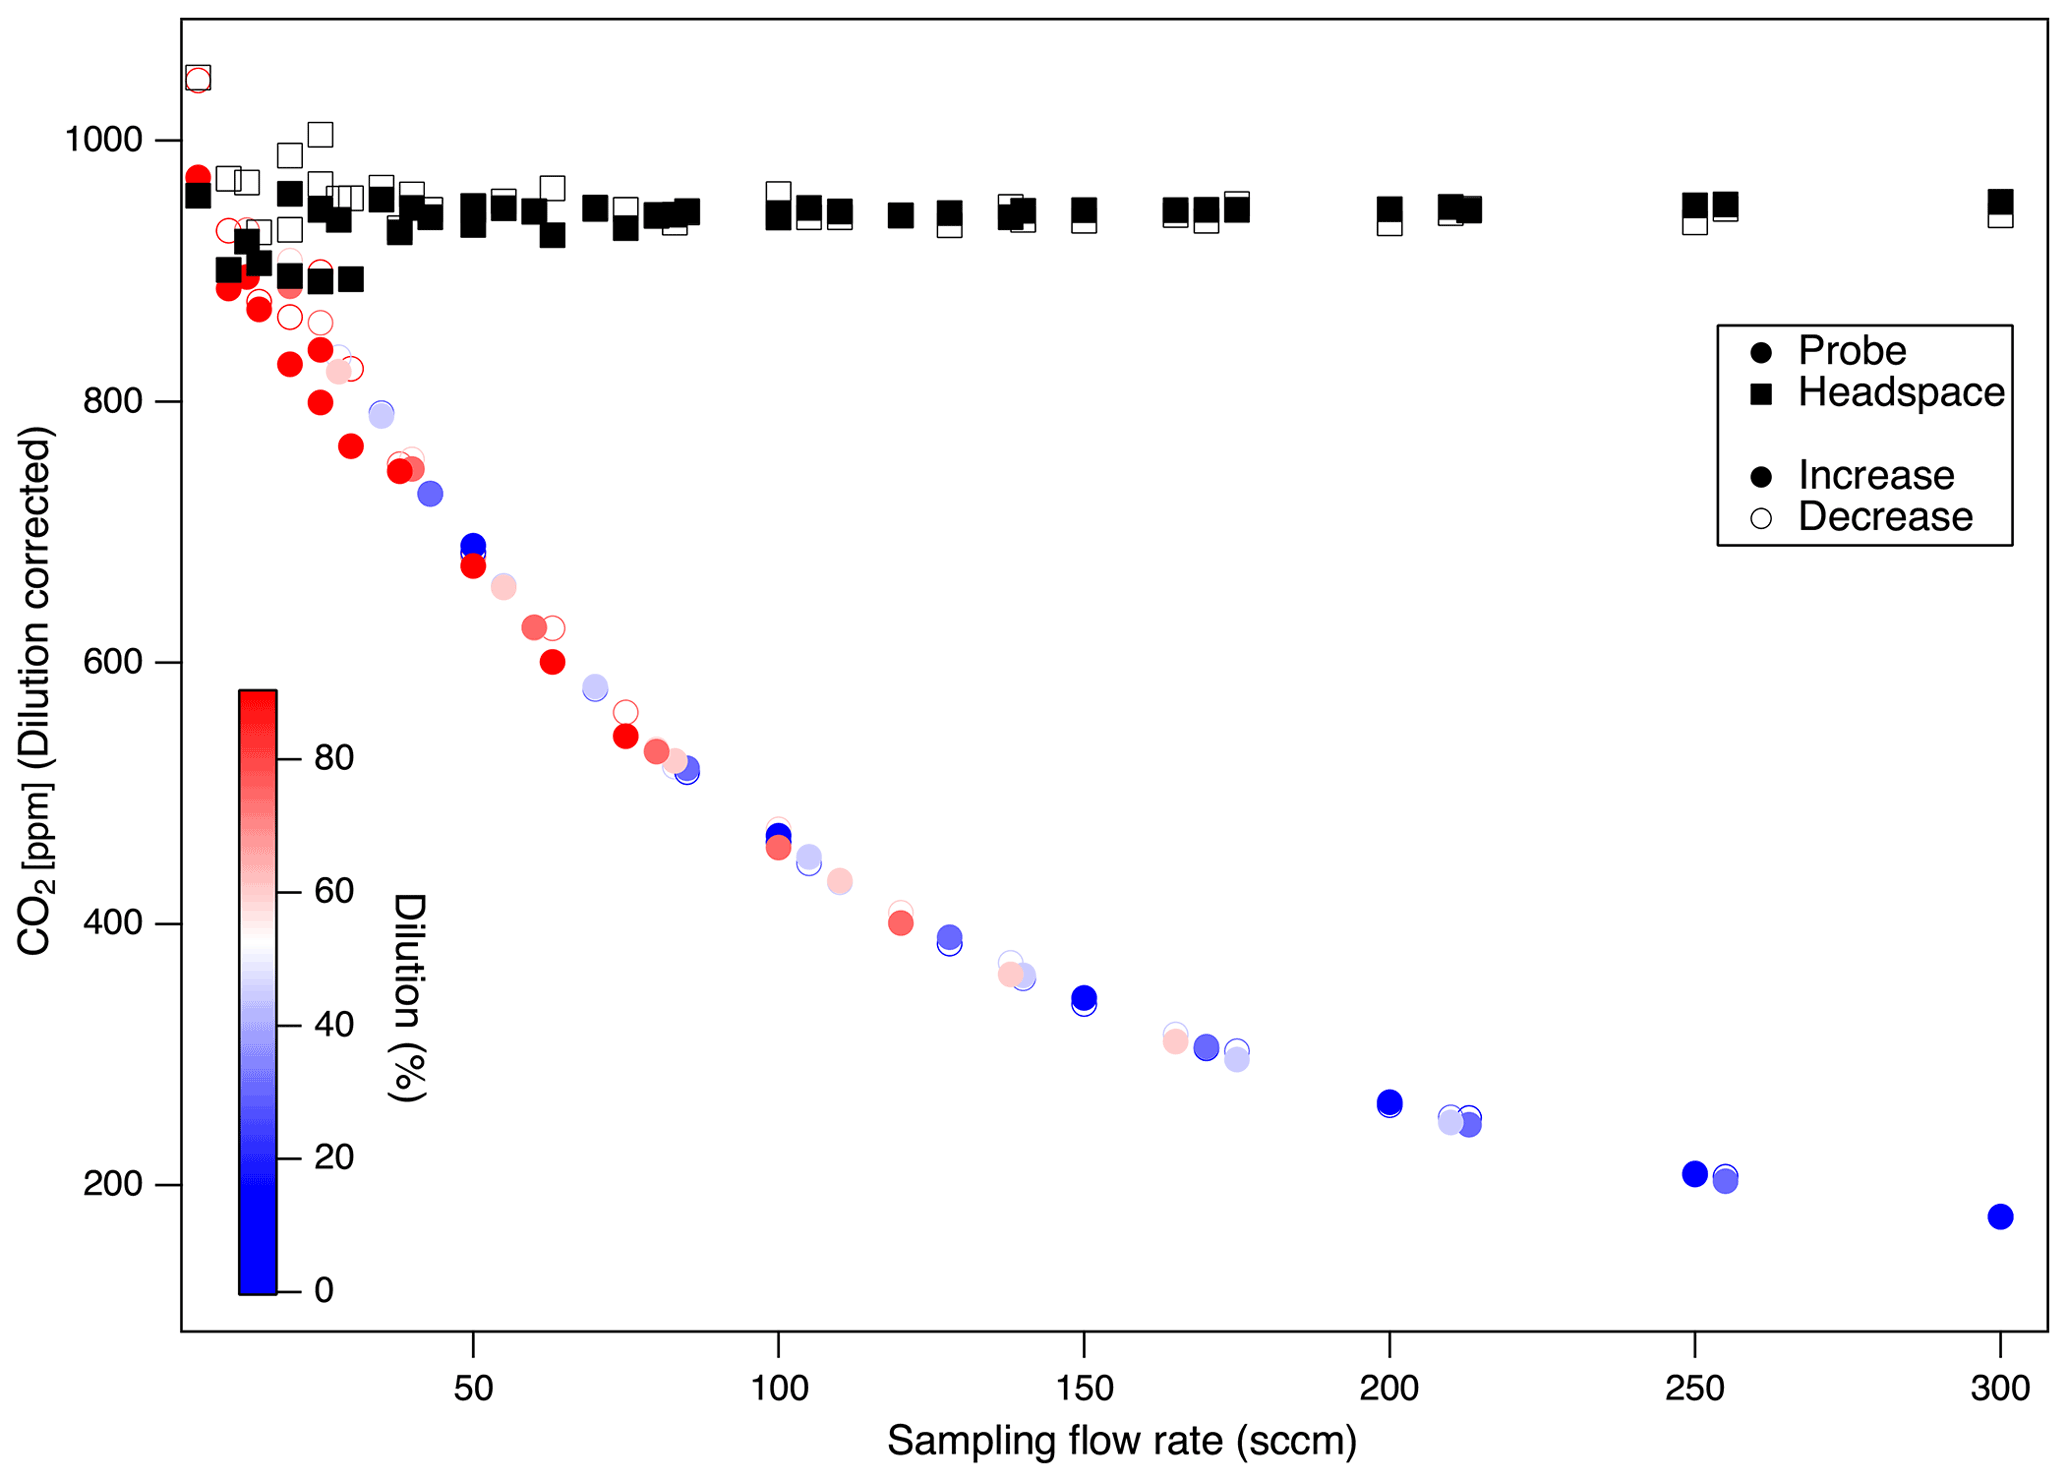
Figure 6Probe and headspace CO2 over a range of probe flow rates and dilution ratios (color), reflecting the recovered sample and true gas concentrations, respectively. Column soil gas concentrations (headspace) remained steady across the experiment, while gas concentrations sampled by the probe diverged from true values at high probe sampling flow rates. Similar patterns were observed for independent experiments run with the reverse sequence from low-to-high vs. high-to-low probe flow rates (open vs. closed symbols). CO2 concentrations are dilution corrected (System 1 dual).
Gas samples obtained by probes at low probe flow rates were most representative of soil gas as the slower flow rates allow more complete diffusive equilibration. We evaluated the impact of combinations of different total flow rates (from 50 to 300 sccm at 50 sccm increments) with sample dilution ratios (from 0 % to 90 % dilution at 15 % increments) resulting in probe sampling flow rates of between 5 and 300 sccm. These tests were conducted in the silica matrix with controlled soil gas composition (1000 ppm CO2) (Experiment 2). We calculated the residence time of carrier gas in the soil probe by considering the internal volume of the probes (V is 2.6–4.6 mL) and the range of flow rates evaluated (F is 5–300 sccm). This indicates that the residence time () could range from < 1 s for high flow rates to 55 s for the lowest flow rates and larger volume (5 sccm in probes P5, P8, P10). We found that observed soil probe concentrations decreased with increases in the probe flow rate (Figs. 6, 7), with no systematic influence of the dilution ratio. For the probe tested (Table 4), flow rates below 24.5 sccm produced representative samples (within 90 % of true concentration). We did not observe any clear drawbacks to sampling CO2 at flow rates < 50 sccm (Fig. 7).
Probe flow rates affected gases unequally and based on their diffusivity. Probe recovery was lower for CO2 with lower diffusivity than CO (molecular diffusion coefficients in air at 20 ∘C (CO2 0.14, CO 0.18) (Bzowski et al., 1990; Massman, 1998) (Fig. 7). The fractional recovery of true soil gas concentrations by probe gas sampling (i.e., probe : column headspace ratios) was higher (0.65) for CO than CO2 (0.2) at high flow rates (300 sccm). Additionally, the recovery ratios at specific flow rates were more scattered at a higher flow rate for CO. Regardless of the diffusion coefficient, both CO2 and CO reached equilibrium at low probe flow rates, but CO was well equilibrated over a 4× wider range (5–100 sccm) than CO2 (5–25 sccm). Moreover, for molecular isotopologues (e.g., 12CO2 vs. 13CO2), at increasing probe flow rates, the sampled CO2 δ13C appears to be lighter than the headspace control by ca. −6 ‰ (Fig. 8) at the highest probe flow rates. That this fractionation was observed relative to the headspace measurements implies it is derived from the probe rather than the rest of the sampling system (tubing, multiport valves, MFCs). These concentration and isotopic fractionation results underscore the need to ensure that the probe flow rate is sufficiently low to ensure full diffusive exchange between zero air and soil gas before the gas sample exits the probe.
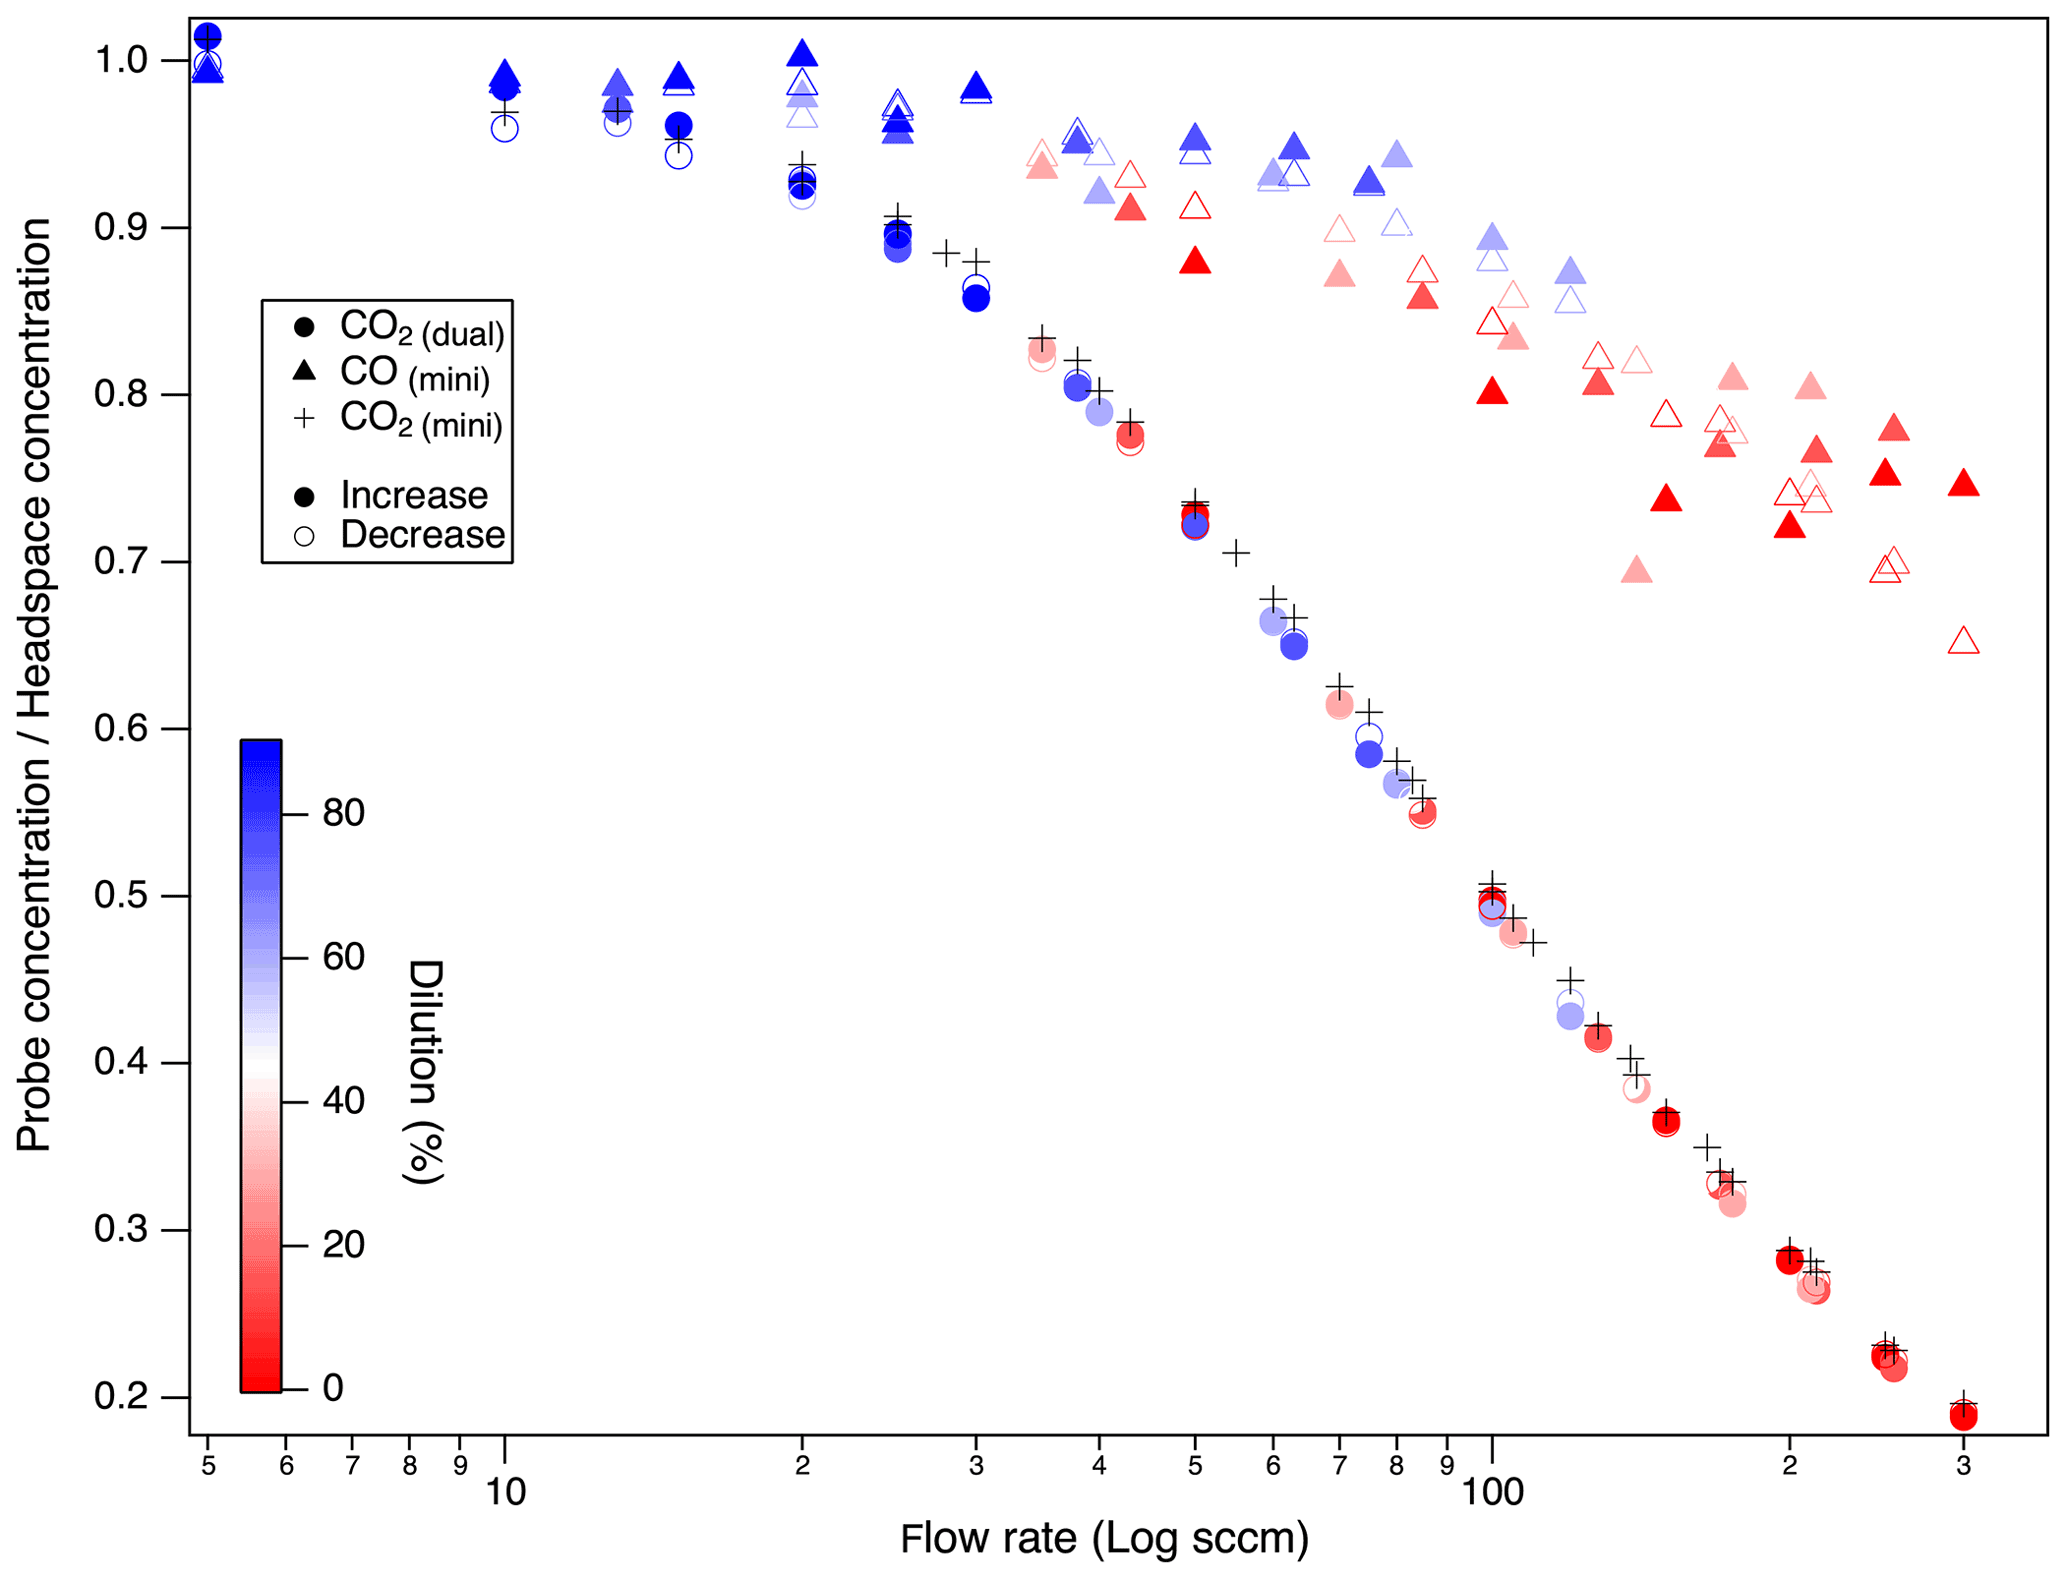
Figure 7Impact of probe sampling flow rate on the fractional recovery of true gas concentrations by probe gas sampling for trace gases with differing diffusivity (CO > CO2), represented as the fractional recovery (probe : headspace concentration ratio) during a test with a sequential increase in the probe flow rate (forward in filled symbols) followed by a test decreasing (reverse in open symbols) the flow rates. Dilution-corrected CO2 and CO in System 1.
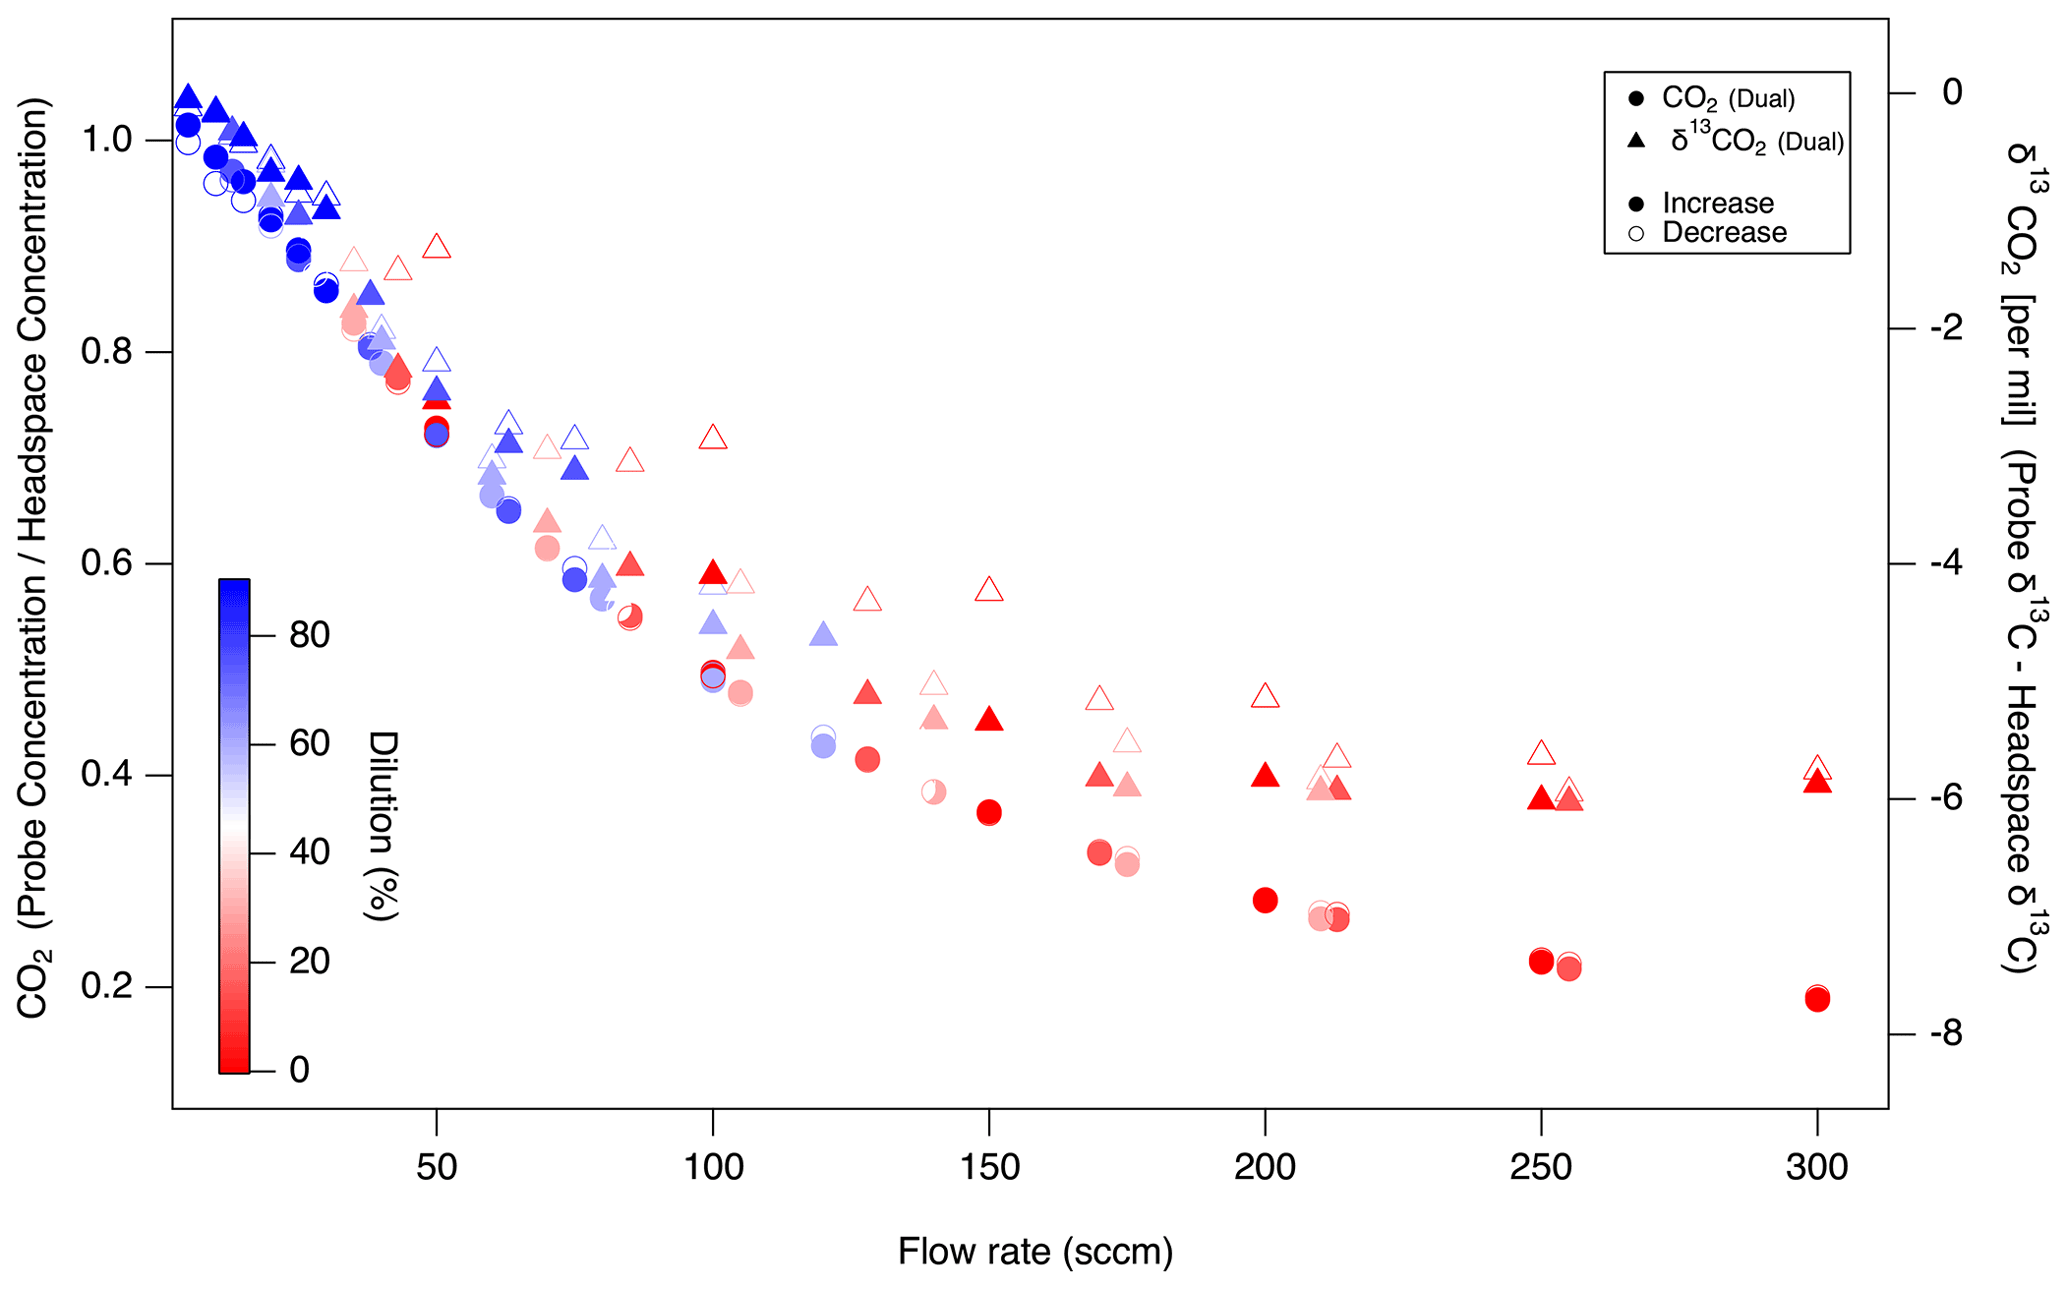
Figure 8Impact of probe sampling flow rate on the fractional recovery of true CO2 concentrations (left axis, circles) and the offset in true soil δ13C (right axis, triangles) by probe gas sampling. As in Fig. 7, sequential probe flow rate increase (filled symbols) and decrease (open symbols) tests are plotted together. Dilution corrected in System 1.
3.2.3 Demonstration with multiple probes (Experiment 3)
We upscaled the online diffusive probe sampling method in both System 1 and System 2 to automatically control multiple probes using flow rates (< 100 sccm) to measure soil gas concentrations and isotopic ratios. To fully constrain probe measurements in the silica matrix (Table 3), each probe was evaluated repeatedly over a full sampling cycle (∼ 25 m) to measure headspace–probe–headspace. In both systems, we could scale to sequential measurements of multiple probes with good sample recovery (e.g., minimal concentration loss, isotope fractionation). In particular, probe recovery of N2O isotopomers was within 3 ‰ of true headspace values, and equilibration of all trace gas species generally was near or above 85 % (Fig. 9). Multiprobe tests showed that the system has a high potential for scalable spatial resolutions and scalability.
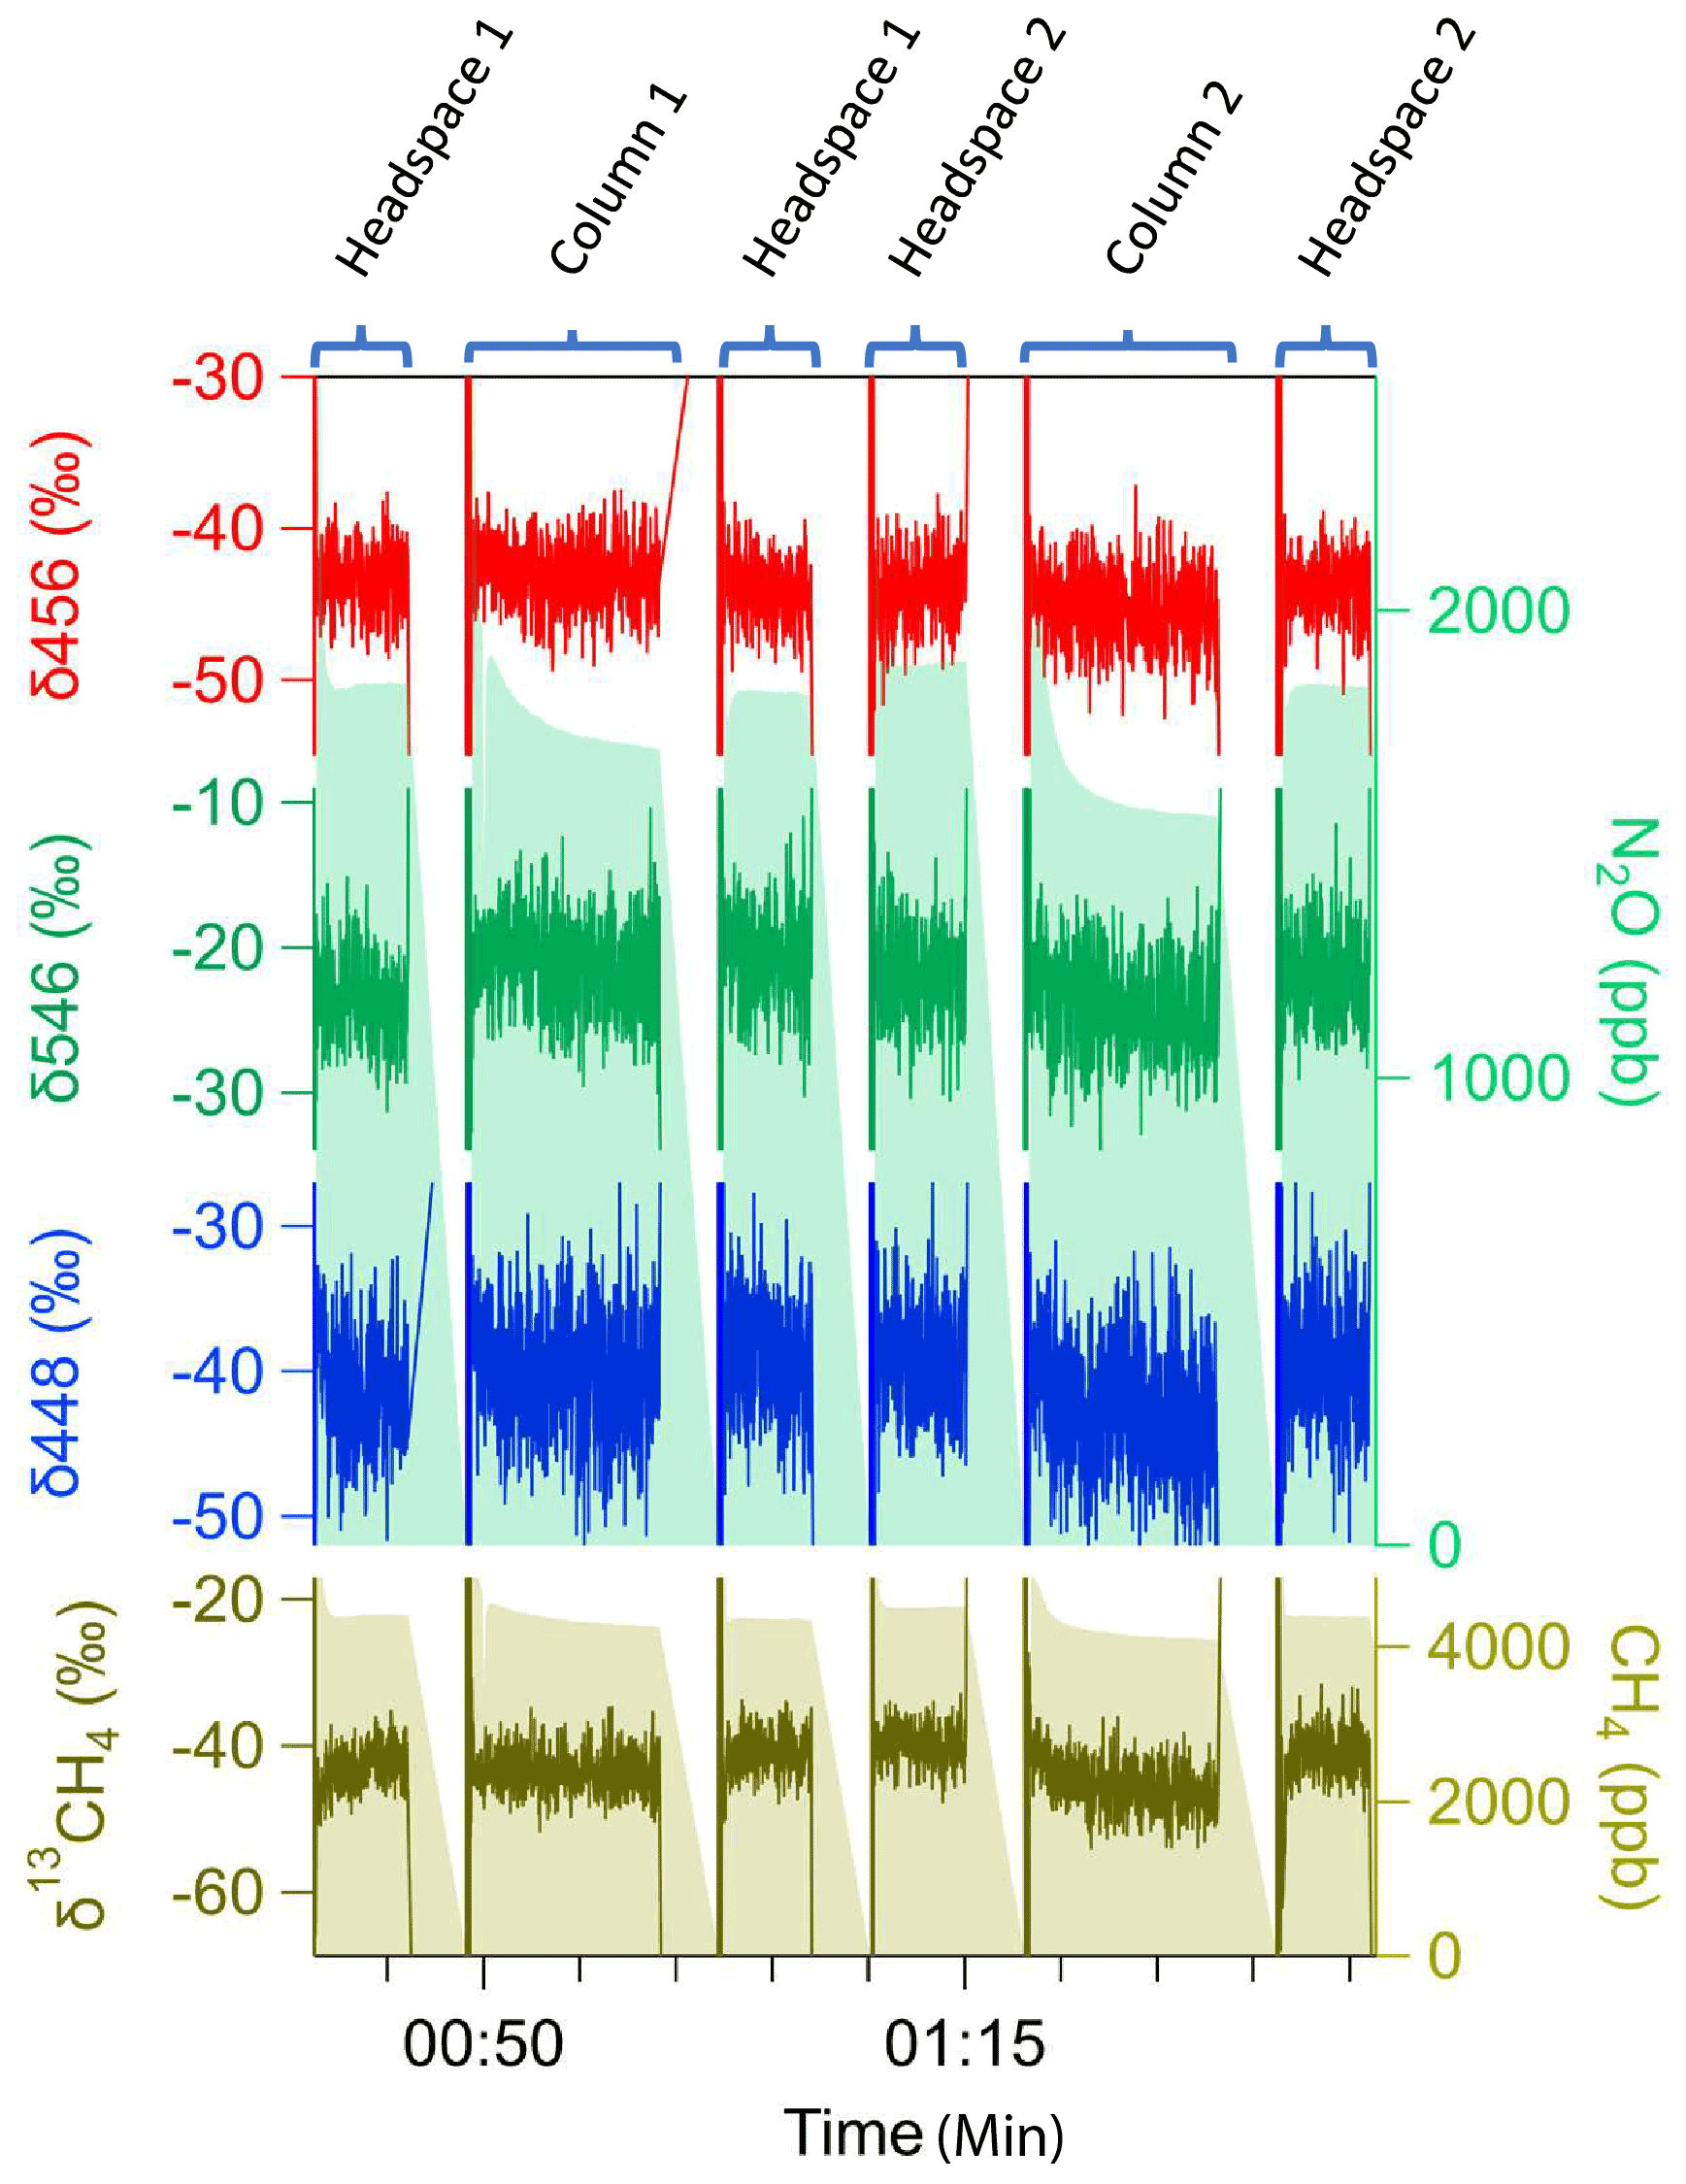
Figure 9Soil probe sampling approach upscaled to multiple probes (System 2). Multiprobe tests measured headspace–probe–headspace sequentially for (top panels) N2O (green shade, right side) including isotopic ratios for three N2O isotopomers δ456 (red), δ546 (green), and δ448 (blue) and (bottom panel) δ13C CH4 (brown, left axis) and CH4 (brown, right axis).
We used the multiprobe system to determine whether probes with different properties would exhibit the same flow dependency and, in particular, the effect of the characteristic pore size of an sPTFE probe on concentration recovery. The flow rate dependence of the different probes was determined with CO2 in silica sand (Fig. 10). We found that the flow rate dependency for one pore size (P1) predicted the general behavior of others (P2–P3) across a 5–10 µm pore size range. Unexpectedly, we did not find a clear link between the pore size and the fractional recovery of true soil CO2 concentrations for any given flow rate. For example, we might expect that a pore size of 10 µm would permit greater diffusion and favor probe equilibration; instead, the 8 µm probe produced a more equilibrated sample than either the 5 µm or the 10 µm (Fig. 10).
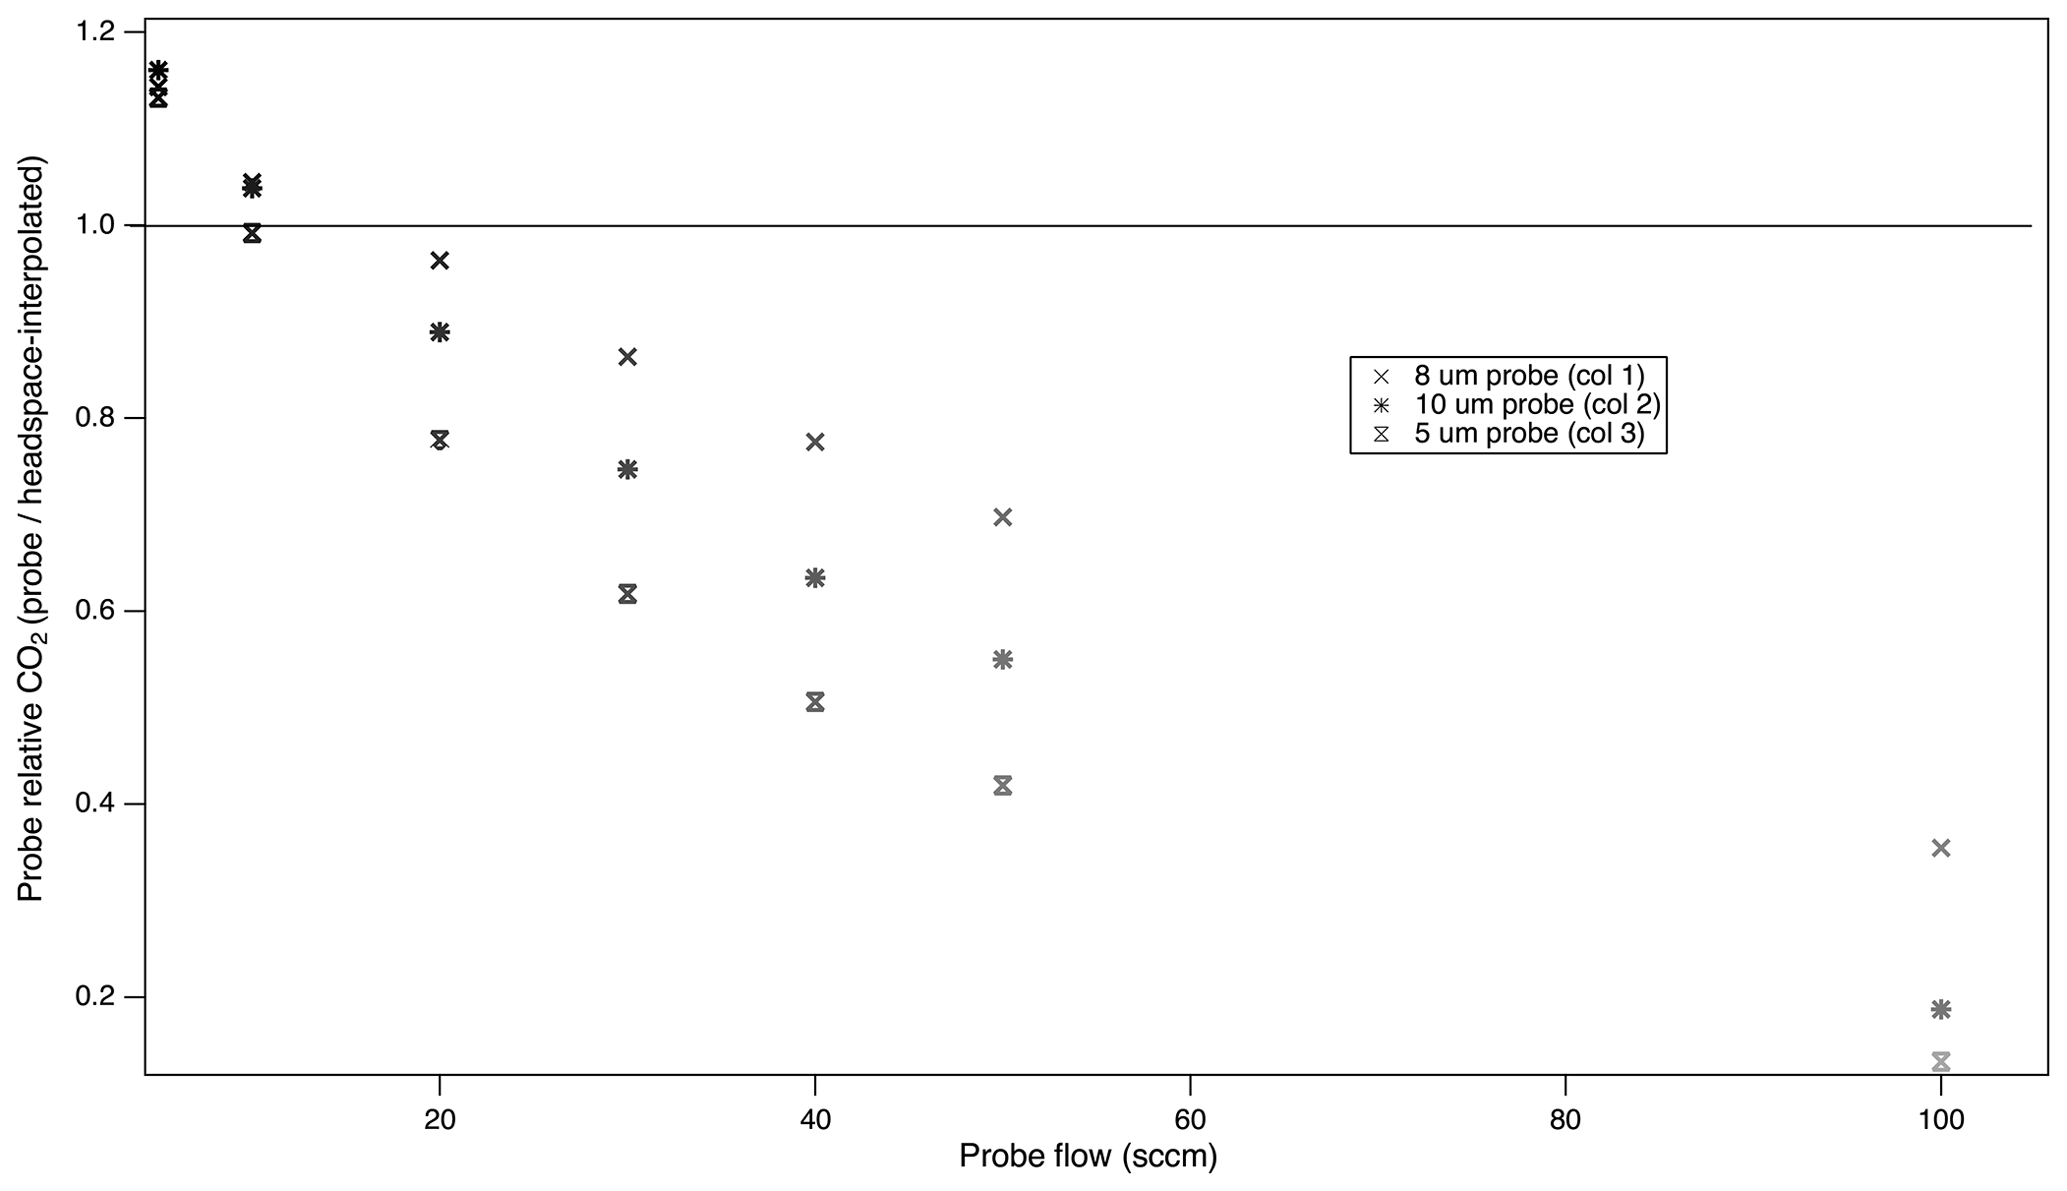
Figure 10Impact of probe pore size on the relationship between the probe sampling flow rate and fractional recovery of true soil gas concentrations. Multiprobe test with System 1. Column headspace–probe–headspace were measured sequentially, and headspace values were interpolated to calculate the fractional recovery.
3.2.4 Comparison of probe flow rate dependency in soil vs. silica (Experiment 3 and 4)
In System 2, at low probe flow rates the concentration measured from the probe was similar to the concentration in the headspace in the silica matrix. Probe flow rates above 25 sccm decreased probe concentration for both the 10 and the 25 µm pore sizes (Fig. 11). Similarly to System 1 (Fig. 10), the fractional recovery did not increase with pore size, and we did not find that the 25 µm pore size transferred more gas into the carrier flow. In tests at a higher probe flow in the silica matrix, the fraction of CH4 recovered in the probe was higher than for N2O, consistent with System 1 results (Fig. 7) and the known molecular diffusion rates of N2O and CH4 through soil, 0.14 and 0.19 cm2 s−1, respectively (Wang et al., 2014). Thus CH4 diffuses into the probe and replenishes the area around the probe more quickly during sampling than N2O.
In System 2, even in soil where controlled soil gas conditions were lacking (i.e., cannot constrain with headspace measurement), we observed a decline in measured soil gas concentrations with flow rate, similarly to the silica matrix experiments (Table 3).
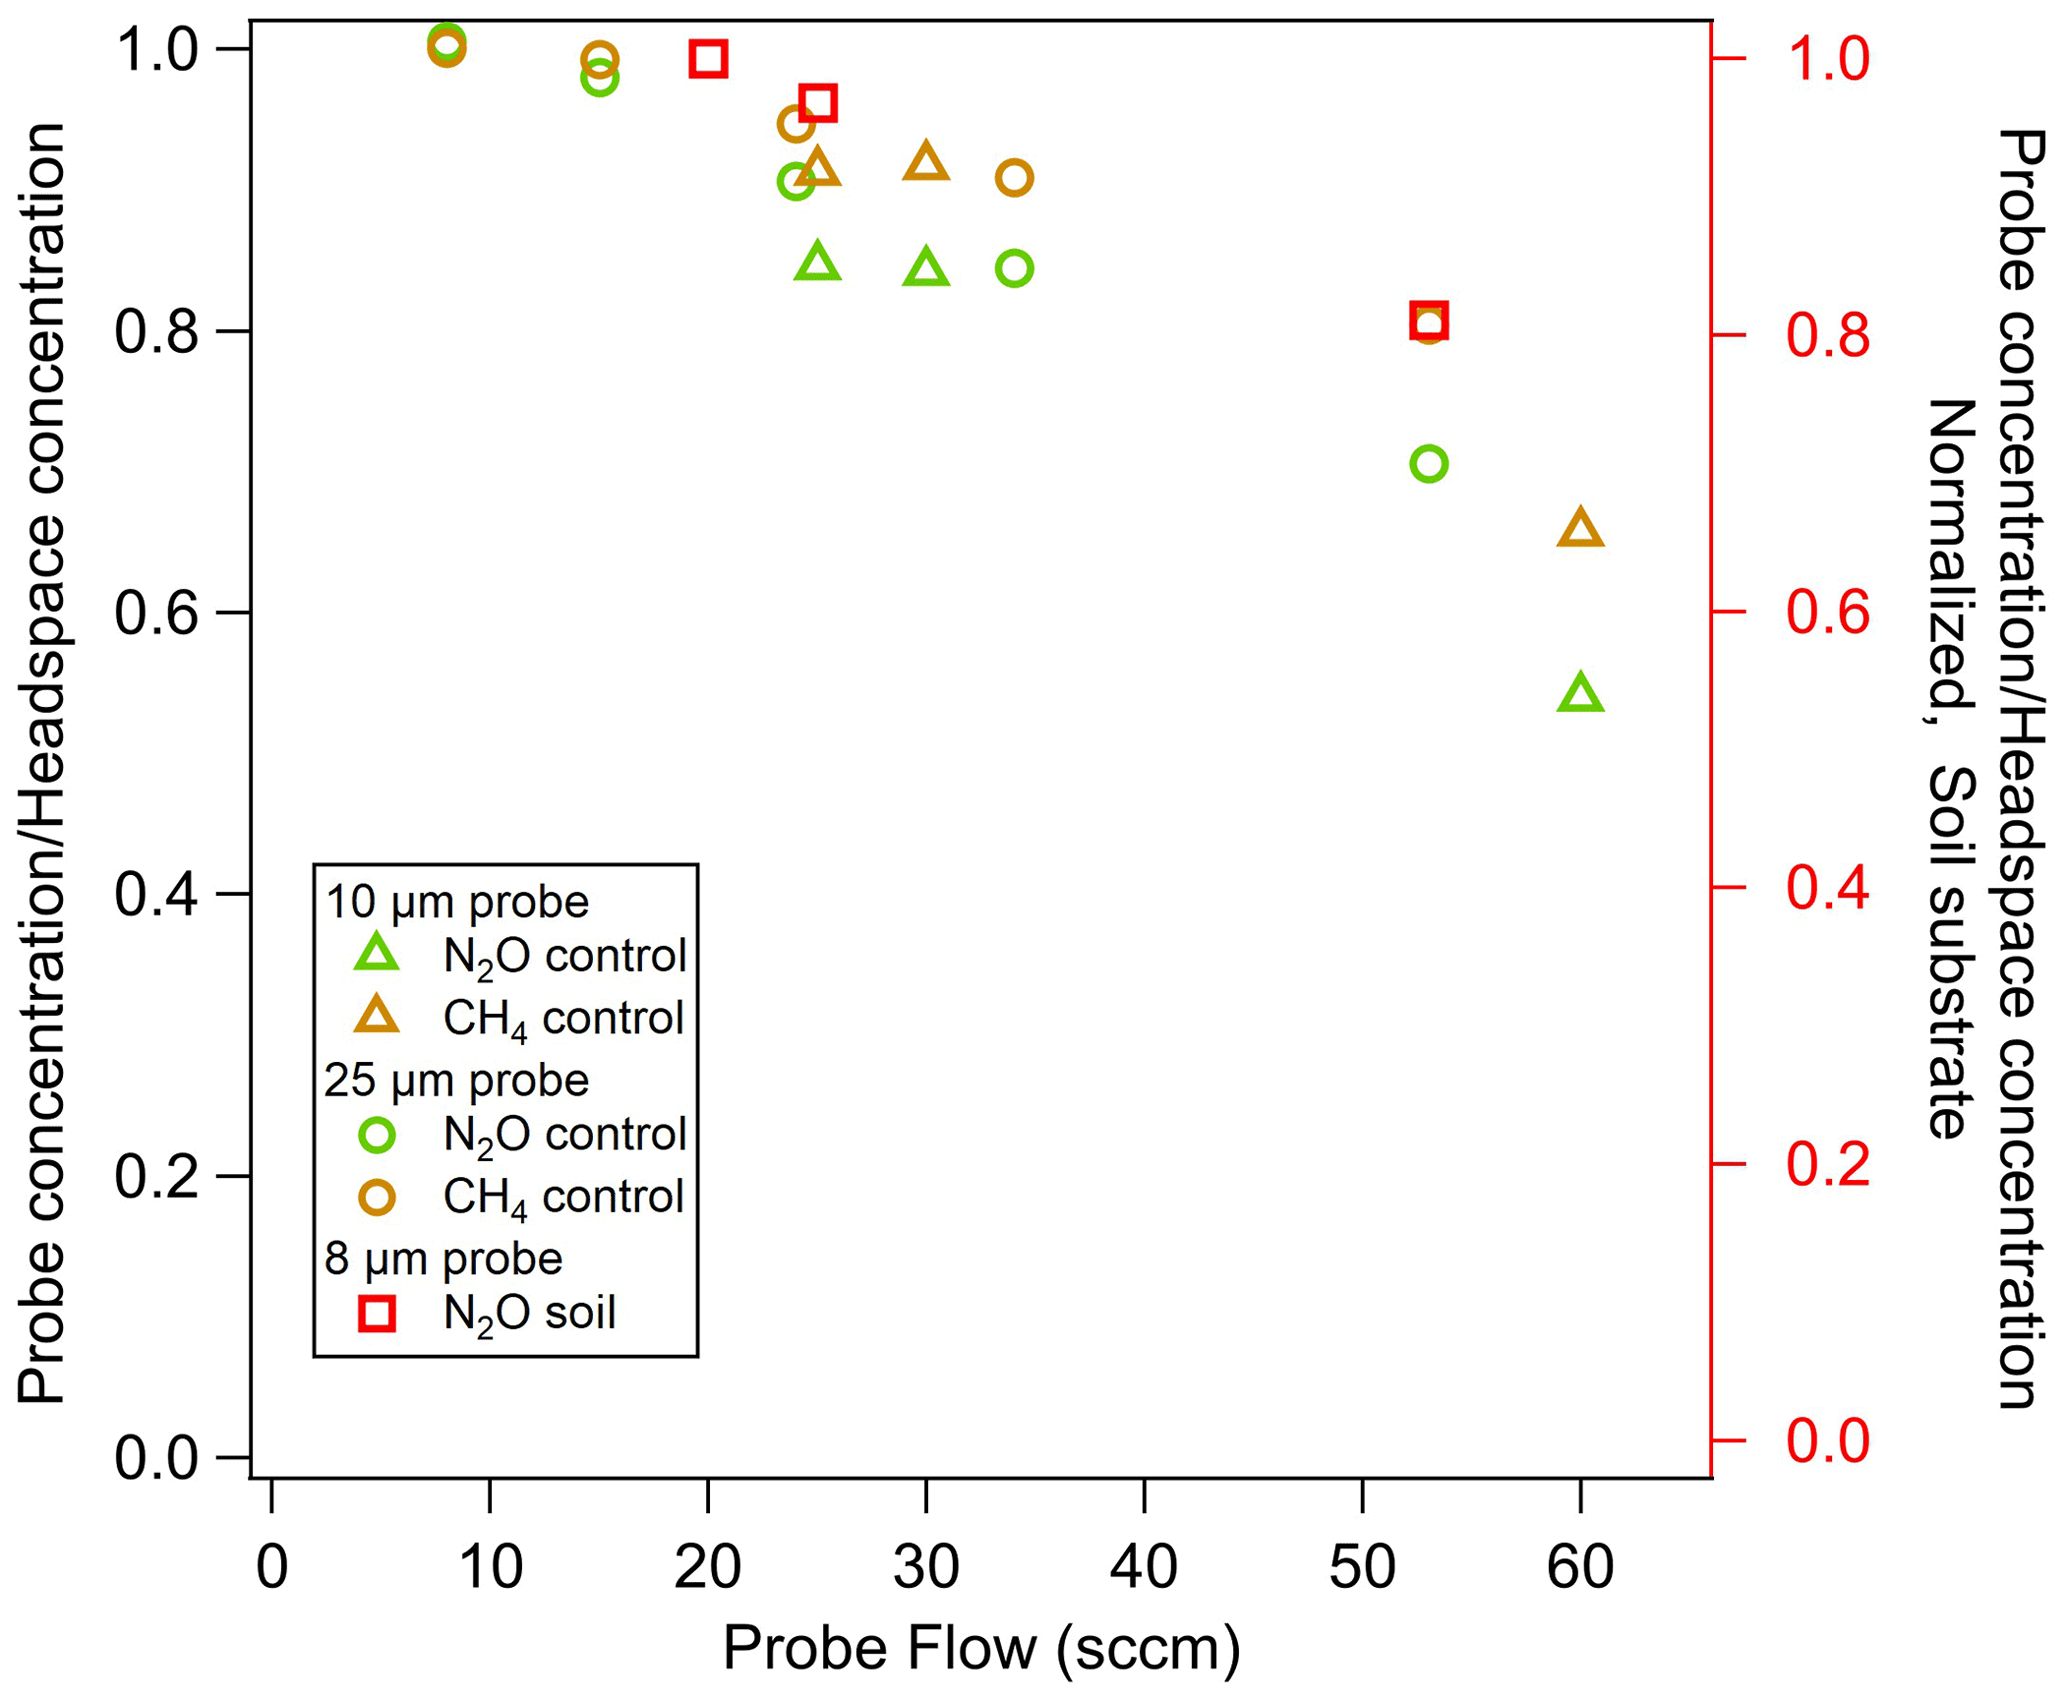
Figure 11Impact of the probe sampling flow rate, pore size, trace gas species, and soil matrix on the fractional recovery of true soil gas concentrations with probes. Fractional recovery of N2O (green) and CH4 (yellow) in a silica matrix with flowing control gas and a probe pore size of 10 µm (triangle) and 25 µm (circles). The recovery of N2O gas in soil at the field moisture level (red squares), normalized to high recovery, measured with a probe pore size of 8 µm. All measurements using System 2.
3.3 Application of sampling system to process studies and interpretation
Disturbance to and environmental variables in soil systems (pedosphere) strongly influence biogeochemical fluxes to and from the atmosphere that can be uniquely studied with probes. Following the system optimization (Sect. 3.2), we no longer controlled soil gas concentrations and rather focused on the behavior of real shifts in soil gas recovered by probes, which were no longer necessarily reflected by headspace concentrations. In the following tests, we manipulated key drivers of soil function (moisture and redox conditions) to elicit responses in soil microbial processes and soil gas concentrations to discover the in situ soil gas dynamics newly observable with our soil gas probe sampling system.
3.3.1 Impact of soil dry–wet cycle on N2O pulse dynamics and process identification (Experiment 5)
We used soil trace gas sampling and nitrogen isotopic mapping to identify real-time, in situ changes in N2O production pathways in response to soil wetting. Soil wetting induced a strong pulse in subsurface N2O concentrations, isotopic signatures, and site preference that was captured in detail with the N2O and CH4 TILDAS and real-time in situ soil gas probe sampling. We found that the isotopic ratios of all three N2O isotopomers (δ448, δ546, δ456), site preference, and N2O concentration responded to the wetting over the subsequent 36 h period. N2O rose from approximately 3 ppm to over 40 ppm, with a corresponding and slightly delayed response in isotopic signatures (Fig. 12). The dramatic increase in N2O required additional dilution at concentrations above the expected range of the TILDAS (> 20 ppm). The response of the two 15N-N2O isotopomers diverged enough to drive a shift in the site preference (SP) upward by approximately 4 ‰–6 ‰ before falling back down toward 2 ‰. After the peak, the decline in concentration and isotopic signatures was not explained by soil moisture, which was a relatively steady 25 %–30 % volumetric water content (VWC) throughout the period. N2O isotopes point to pathways such as hydroxylamine decomposition, chemodenitrification, nitrifier denitrification, or denitrifier denitrification. When mapped into a 3-dimensional isotope space (Fig. 12b) that is based upon previous observations of the SP, 15Nbulk, and 18O for a variety of different processes (Toyoda et al., 2017; Wei et al., 2019), the observed isotopic signature falls between chemodenitrification and bacterial denitrification. While the 15Nbulk, and 18O signals are dependent upon the substrate 15N and 18O compositions, the shift over the course of the rewetting measurement indicates a period of more denitrification (at higher SPs), then decreasing back to bacterial denitrification. Importantly, the observed range of SP values is well below the expected range for bacterial and archaeal nitrification (AOB, AOA), which are > 20 (off the scale in Fig. 12b).
In contrast to the dynamic response in N2O, soil CH4 concentrations remained low, leading to low signal-to-noise ratios in the detected 13C-CH4 isotopologue, and did not respond to wetting (data not shown). The dilution rate of the sample was increased by 1.9× at hour 18, resulting in a 1.9× reduction in N2O concentration measured by TILDAS (accounted for in Fig. 12). Despite the large change in concentration, the isotopic signatures barely changed, even after readjusting the dilution rate at hour 42, indicating that their concentration dependence had been well accounted for.

Figure 12(a) Soil wetting induced a pulsed response in soil N2O (shaded green) and its isotopic signals including δ448 (blue), δ15Nbulk (red), and site preference (purple). A soil column without a lid was wetted with the equivalent of 5.1 cm of rainfall. At 18 h after wetting the dilution was changed from 2:1 to 3.8:1, and at 41 h it was changed to 2.1:1, which is accounted for in the concentrations reported here. (b) Estimated map of N2O isotopic signatures of δ15Nbulk (x axis), δ18O (y axis), and site preference (z axis); circles represent probe measurements of the changes in the isotopic signatures with time (hours), indicating shifts into regions of different microbial activity (colored rectangles) (Table S3). On the x axis AOA (green rectangle) and AOB (purple rectangle) refer to nitrification from ammonia-oxidizing archaea and ammonia-oxidizing bacteria, respectively. The grey rectangle indicates fungal denitrification.
3.3.2 Stimulation of subsurface shifts in soil VOC production in response to redox shift (Experiment 6)
We measured a diverse suite of soil trace gases, including VOCs, to test whether we would observe consistent responses in real-time, in situ changes in multiple compounds to shifts in redox from anoxic to oxic conditions in soil. Shifting the soil redox environment from anoxic to oxic conditions induced a cascade of subsurface gas pulses in CO2, N2O, and VOCs that we measured by integrating TILDAS and Vocus analyzers with the real-time in situ soil gas probe sampling (Fig. 13). Before this experiment, the soil column was forced into anoxic conditions by advectively flushing with N2 through the control gas ports for 3.5 h; subsequently, conditions were driven oxic by flushing the system with UZA for a short time at time zero. Conversion to oxic conditions drove a pulse in N2O concentrations that was slow and considerably weaker (reaching 1.6 ppm after 72 h) than the wetting response (Experiment 5). The onset of oxic conditions brought a strong CO2 increase from 0.1 %–0.4 %, suggesting an increase in microbial respiration. Along with CO2 and N2O, we measured a cascade of responses in masses corresponding to different VOCs. As respiration and nitrogen processing increase, the larger VOCs exhibit either immediate loss (C9H18O, C11H20O, e.g., nonanal, methylborneol) or delayed loss (C10H16 (monoterpenes), C12H22O, e.g., geosmin) in the soil. In contrast, after 5 h, the sulfur-containing compounds methanethiol (CH4S) and dimethyl sulfide (C2H6SH) exhibited a surge in production. The approach captured different sensitivities and temporal responses to a shift in soil redox across a suite of soil gases that reflect different biochemical processes and their sensitivity to redox conditions.
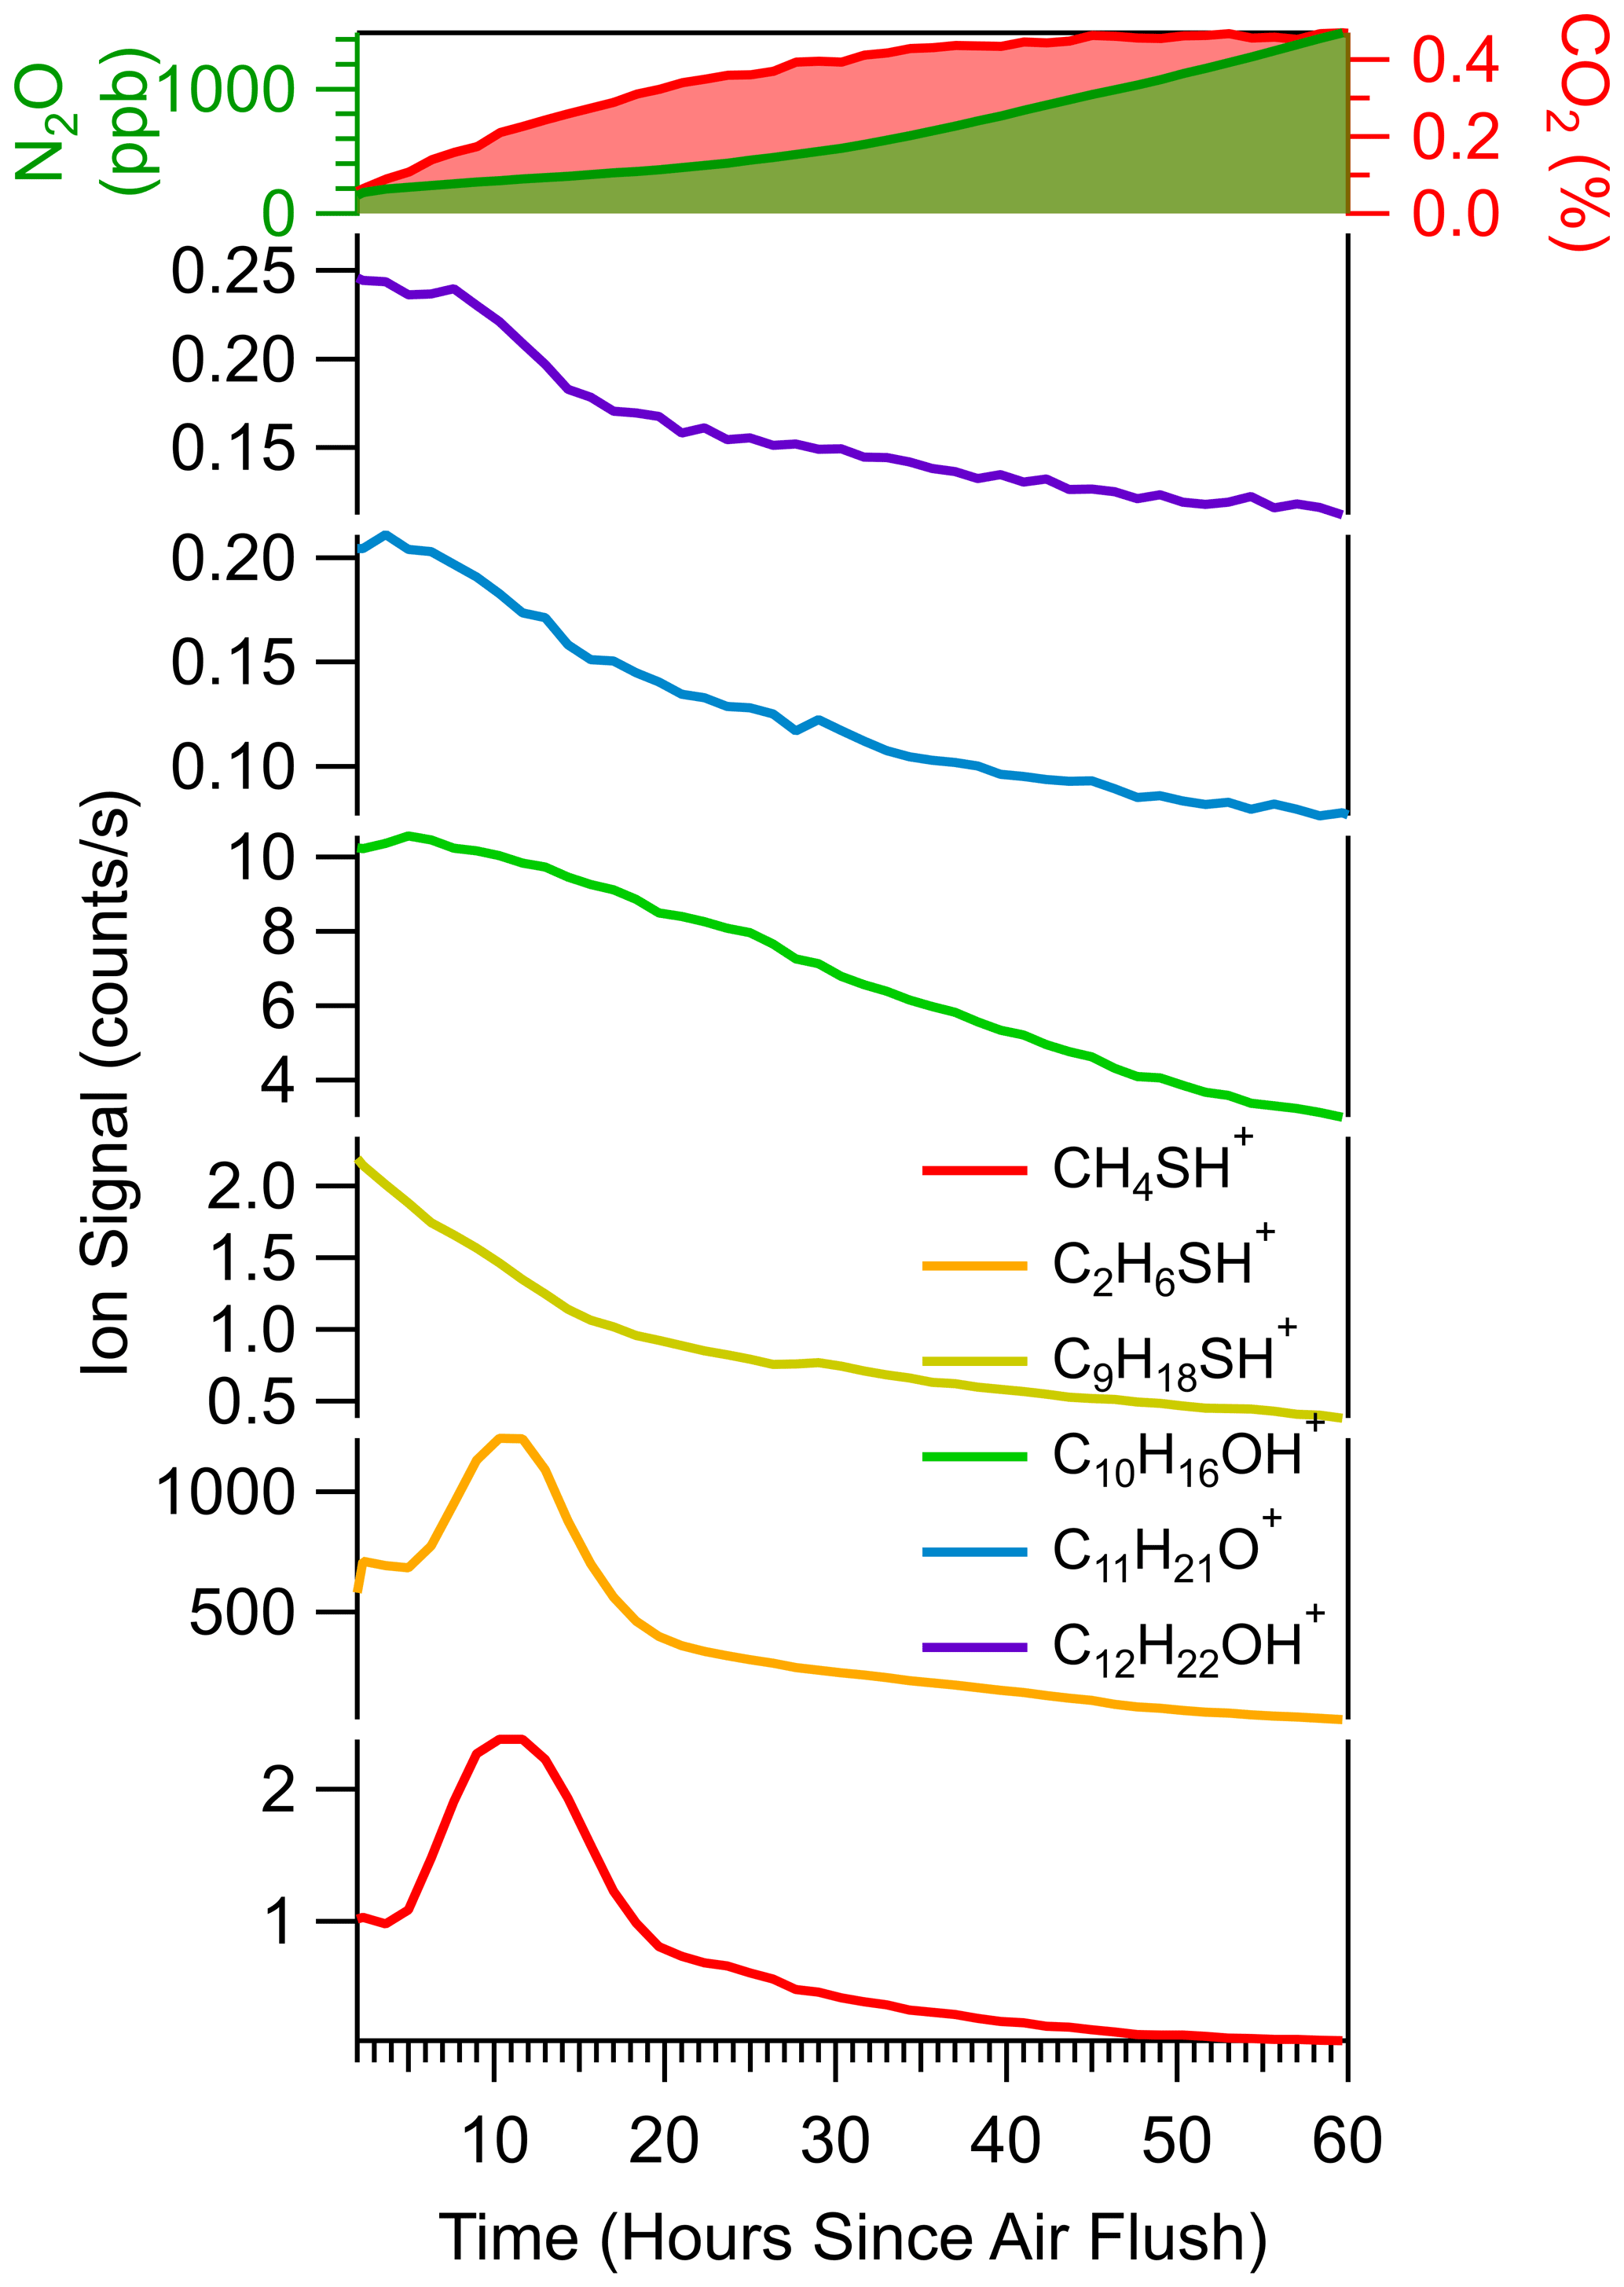
Figure 13A sudden change from anoxic to oxic soil conditions, induced by flushing with UZA, drives dynamic responses in N2O, CO2, and a variety of VOCs captured using the diffusion-based soil probe integrated with the TILDAS and Vocus analyzers. System 2 Experiment 6 with a Biosphere 2 Tropical Rainforest soil (Table S1).
We developed a new soil gas sampling system that integrated diffusive sPTFE soil probes with online, high-resolution trace gas analyzers. The versatile system detected changes in soil concentration and isotopic signatures of N2O and CH4 and VOCs that reflected shifting biogeochemical processes in response to environmental manipulation of soil moisture and redox.
4.1 Optimizing soil gas sampling
Probe sample gas recovery depended on the probe flow rate and the trace gas species, while the effect of dilution of the probe sample outflow on recovery was minimal. The probe flow rate determines the time available for carrier UZA to equilibrate with soil gas across the diffusive membrane as it flows through the probe: lower probe sampling flow rates allow more time to equilibrate than do high flow rates (Gut et al., 1998; Parent et al., 2013). By running tests in reverse order, we showed that the results were not dependent upon carryover or memory effects. Correspondingly, we observed that the fractional recovery of true soil gas concentrations declined exponentially with increased probe flow rates across all systems (Figs. 8 and 11), analytes (Fig. 7), and probe characteristics tested. The maximum probe flow rates that delivered well-equilibrated samples (> 90 % equilibrated) ranged from ∼ 25 to 100 sccm, depending on the system and, in particular, the molecule measured. Indeed, in both silica and the soil matrix, gas recovery was better for molecules with relatively higher molecular diffusivity (i.e., CO, CH4, 12C CO2) than paired analysis of those with lower diffusivity (i.e., CO2, N2O, 13C CO2) (Wang et al., 2014). Molecules with higher diffusivity move across the membrane and also replenish the area around the probe during sampling more quickly than those with lower diffusivity. As a result, the upper range of probe flow rates that produce representative gas samples will be higher for analytes with higher diffusivity and more restricted for slowly diffusing molecules. While isotopic fractionation was observed in some (CO2, Fig. 8) but not all (N2O, Fig. 9) tests, incomplete equilibration affected recovery of bulk concentration more strongly than the isotopic signature, suggesting that optimized probe sampling can produce isotopically representative samples with minimal fractionation. Finally, the representative pore size of sPTFE probes did not correlate with sample recovery, and all sizes quantitatively recovered > 90 % of the analyte concentration at optimized flow rates. The sPTFE material is produced with a characteristic pore size, which may not scale with the total pore density and could explain the lack of a pore size dependency across the 5–25 µm range tested.
4.2 Factors yielding a representative sample
One of the challenges in soil trace gas measurements is transferring a representative sample (Parent et al., 2013) from probes to fill the relatively large sample cell volumes of online analyzers (e.g., tens to hundreds of milliliters at reduced pressure). To address this issue, we reduced the effective volume of the TILDAS sample cell by designing a more compact cell with a volume-filling insert (Sect. 3.1). We also integrated online dilution into the sample transfer system after the probe, which increased the sample volume delivered to the sample cell without increasing probe flow rates. Dilution also helped reduce soil gas concentrations to within the range of sensitive trace gas analyzers and avoid condensation (none observed). Together, these modifications improved the transfer of representative soil gas samples to the cell, increased the cell turnover for a faster time response, and supported lower probe flow rates for better probe equilibration (Jochheim et al., 2018). Beyond flow-through sampling, these modifications may be particularly important in future approaches that transfer equilibrated soil gas “plugs” to an online analyzer for trapped-sample analysis. In addition, reducing sample demand also reduces the disruption of the soil probe measurement to the soil environment. The diffusive soil probes allow sample gas to diffuse into the probe from the soil environment but also allow the UZA carrier gas to diffuse out of the probe into the soil. Under controlled soil conditions (silica and advective flow), probe sampling caused a < 2 % decrease in soil CO2 concentrations, with a smaller impact at the low probe flow rates supported by our volume-reducing modifications. In real soil, the impact of carrier diffusion out of the probe could be larger where local gas concentrations are not replenished by advection but depend on local production, consumption, and diffusion. In addition to reducing sample volume, lowering the sampling frequency (return rate) may be especially important for helping to reduce the impact of the perturbation on the soil environment.
4.3 Transferability to multiple analyzers
The continuous online soil gas sampling approach is highly transferable across trace gases and instrument systems. Here, we successfully measured soil trace gases using two systems. Modifications to reduce sample volume requirements (i.e., online dilution, precise flow control, instrument modifications) are transferable to other analyzers beyond the TILDAS N2O–CH4 isotope analyzer. Although other laser absorption spectroscopy instruments like cavity ring-down spectrometers have been used to measure concentration and isotopic composition for trace gases like CO2 (Voglar et al., 2019), TILDAS can measure several species at a high sensitivity/spectral resolution with one instrument (McManus et al., 2015), are field deployable (McCalley et al., 2014; Roscioli et al., 2015; Saleska et al., 2006), and readily interface with the valving and flow control system designed here. Some analyzers (e.g., mass spectrometers) are destructive (PTR-MS ionizes molecules for analysis), preventing the closed-loop scheme sampling from being circulated. However, for other soil gas sampling methods (e.g., online gas chromatography and low-cost sensors), using a closed-loop system continues to be promising for approaches to decrease the impact on gas composition and chemistry during subsurface gas sampling.
Not only is the approach transferable across instruments, but we demonstrated that more than one instrument can be integrated for simultaneous soil probe sampling, e.g., Vocus PTR-TOF-MS for VOCs with N2O–CH4 TILDAS in parallel (System 2) and two TILDAS analyzers in series (System 1). This versatility can be extended to allow analysis of a suite of soil gases using existing TILDAS technology to study, for example, soil microbial N cycling (e.g., N2O, NO, NO2, NH3, HNO3, HONO, NH2OH), microbial trace gas scavenging (e.g., CO, OCS, CH4, O2), and other atmospherically relevant species (e.g., H2O2, HONO, N2H4, HCHO, HCOOH, CH3OH). These compounds represent metabolites for microbial communities and intermediates of metabolic pathways of carbon and nitrogen cycling. Coupling these instruments with soil probes will enable access to incompletely unexplored biological information that reflects metabolic and signaling processes in soil.
4.4 Considerations for field deployment of the system
The sPTFE probes maintained their hydrophobicity, structure, and performance throughout the (> 4 months of) operation in laboratory soil. In contrast, using silicone membranes, Panikov et al. (2007) found that the methane calibration factor differed between a dry and wet membrane. Similarly, Rothfuss and Conrad (1994) found memory effect issues when sampling high concentrations of CH4 with silicone and epoxy as soil–gas exchange barriers. Soil probes with PP membranes have been widely used to measure CO2 (Gangi et al., 2015; Gut et al., 1998; Jochheim et al., 2018) and with polyethylene (PE) for water isotopes in soil (Volkmann and Weiler, 2014; Volkmann et al., 2018) and tree xylem (Volkmann et al., 2016a). PP has been successfully used for water isotope analysis (Rothfuss et al., 2013, 2015). However, in our past experience (Till H. M. Volkmann, personal communication, 2017) PP and PE probes have shown decreased wall integrity during field deployment and long-term use (i.e., dents and cracks), causing gas and water leaks and compromising hydrophobicity in saturated media. Importantly, robust performance in this study did not require larger probes; our 15 cm probes are more rigid and smaller than previous probes that were typically 100 to 150 cm in length (Gut et al., 1998; Flechard et al., 2007; Parent et al., 2013; Rothfuss et al., 2013) and are easily installed via a small drill hole for small-resolution sampling. In some field applications, it may be more desirable to physically integrate (rather than resolve) variations in soil gas concentrations over a distance (e.g., for a representative concentration) using a long soil probe, which would help release the low-flow demands of the relatively short probes used here. Nevertheless, the smaller sPTFE soil probes described have potential to be both less disruptive to the soil ecosystem and more robust to soil structure and environmental changes for long-term measurements in the field.
The diffusive soil probe sampling system provides a time-dependent picture of soil gas dynamics. This contrasts with other methods, e.g., manual sampling with syringes (Kammann et al., 2001) and cartridges (Wester-Larsen et al., 2020), that are more likely to disturb the true soil gas concentration and may compromise sample integrity during transfer for offline laboratory analysis (Volkmann and Weiler, 2014). Manual sampling increases potential measurement error and is time-consuming and labor-intensive, particularly for high temporal or spatial (Wester-Larsen et al., 2020) coverage. Our integrated sample system can achieve unattended, automated sequential and long-term field soil gas sampling that is less time-consuming and less laborious.
In the field implementation of our system, there will nevertheless be tradeoffs between sampling frequency and disruption that should be fully considered. As noted above, diffusive soil sampling can alter soil gas by dilution, and sample transfer parameters should be optimized to obtain representative samples with minimal disruption. This may be especially important for distant sampling points that require longer tubing that may release more zero air into the soil during sample transfer to the analyzer. Therefore, future field studies should consider the biogeochemical implications of adding substrates to the subsurface, test inert carrier gases like He, and evaluate whether recirculating or flow-through approaches are more appropriate for each application. The different modules of the sampling system (Fig. 2) are flexible and can be adjusted to accommodate multiple probes, different measurement specifications, and soil and environmental factors in the field.
4.5 Subsurface gas measurements to capture and interpret environmental drivers of soil processes
Consistent with our technical hypothesis, the optimized soil gas sampling system integrated with novel N2O–CH4 TILDAS captured real-time responses in subsurface N2O isotopes to a soil wetting event (Sect. 3.3.1). Soil wetting is a powerful and well-studied driver of biogeochemical change in soils known to result in a rapid release of soil gases (Birch effect) (Birch, 1958; Leitner et al., 2017) and changes in denitrification emissions of N2O (Groffman et al., 2009). The soil probes, positioned at 20 cm below the soil surface, captured a significant increase in subsurface N2O concentration almost immediately after water was added to the column and a slow change in the isotopic signature that suggests a more gradual change in the subsurface processes producing N2O (Leitner et al., 2017; Van Haren et al., 2005). Our novel subsurface 15N site preference measurements showed SP signatures for N2O production between those that are characteristic of bacterial denitrification and chemodenitrification pathways (Sutka et al., 2006; Toyoda et al., 2017). As hypothesized, wetting caused a shift in the N2O production pathways relative to the dry condition, and this shift to a higher SP (preferentially enriched on the central N atom) was short-lived like the N2O emission pulse and relaxed back to pre-wetting levels in less than 2 d. These patterns show that the microbial (denitrification) and abiotic (chemodenitrification) pathways vary on long (days) and short (minutes/hours) timescales at this depth. This information can help guide when to collect soil cores to dig deeper into the mechanistic drivers through offline analytical approaches.
Diverse VOC compounds in the subsurface responded to a shift from soil anoxic to oxic conditions (Sect. 3.3.2). Redox shifts drive biochemical conversions driven by abiotic reactions (Lin et al., 2021) and microbial respiration or fermentation metabolism in soil (Peñuelas et al., 2014). As hypothesized, the temporal dynamics of various VOCs and small molecules (N2O, CO2) differed, including several fast-responding short-lived pulses and other slow, steady shifts over the 2.5 d measurement period. Numerous microbial metabolic pathways produce volatile molecules that reflect loss in metabolic pathways and can be difficult to capture with existing metabolomics methods (Honeker et al., 2021; Schulz-Bohm et al., 2015). Our system displayed the potential to capture hot moments of trace gas production that did not parallel steady rises in total microbial activity, for example as reflected by increases in heterotrophic soil respiration (CO2 emissions) with oxic conditions. Small molecules and VOCs contribute to soil nutrient cycling and therefore serve as valuable markers of different and highly specific microbial activity (Schulz-Bohm et al., 2015). For example geosmin and methylisoborneol are produced by actinomycetales (Citron et al., 2012; Peñuelas et al., 2014) under anoxic conditions, while sulfurous VOCs are produced in micro-anoxic sites in soil. Capturing a wide array of volatiles involved in microbial metabolism will increase the understanding of the impact and role of microbial VOC cycling in pedosphere–atmospheric interactions.
Versatile trace gas sampling systems that integrate soil probes and high-resolution trace gas analyzers bridge an existing gap in spatial (centimeters) and temporal (minutes) measurements of in situ concentrations and isotopic signatures of soil trace gases. We demonstrated the feasibility and versatility of an automated multiprobe analysis system for soil gas measurements of isotopic ratios of nitrous oxide (δ18O, δ15N, and the 15N site preference of N2O), methane (δ13C), and VOCs, all important gas-phase indicators of biological activity. This study showed that (1) the system has the potential to be used with other gas and isotope analyzers, (2) there was no evidence of any interference during the TILDAS–Vocus PTR-MS inline measurements, and (3) the nitrous oxide analyzer configuration achieved a reduced concentration dependency allowing determination of N2O isotopic measurements over a larger range in concentration. Importantly, the sampling system captured fluctuations in subsurface gas concentrations and isotopologues in response to rapid changes in environmental conditions. Specifically, it revealed dynamics of microbial metabolism that drive hot moments of gas emissions under variable soil moisture and redox conditions. These tests demonstrate the potential of this approach to reveal interconnections between the soil microbiome, its local environment, and the atmosphere.
The outlook is bright for integrating soil gas measurements with other data and models to unlock new understanding of soil microbial processes. Direct sampling of soil for subsequent laboratory incubations and analysis using multi-omics approaches is a sensitive and precise approach for identifying subsurface microbial populations and their potential metabolic function. Although both widely used approaches produce reliable and robust results, they are labor-intensive and destructive and incompatible with generating a well-resolved spatially dependent and time-dependent understanding of microbial activity in natural ecosystems. Similarly, current soil gas sampling methodologies face challenges in addressing the gap between time–space sampling (e.g., frequency and intensity), low bias in downstream analysis, and a need for proper reference materials. Isotopic signatures of trace soil gases, in conjunction with genomic and metabolomics approaches, can elucidate real-time biomarkers of microbial metabolisms in soil, leading to a better understanding of soil heterogeneity as a modulator of soil–microbe interactions and their responses to environmental factors and nutrient cycling. These efforts will help scale up soil trace gas monitoring and quantification of biogeochemical processes to improve soil modeling, soil management decisions, and soil health with high spatial and temporal resolutions.
Igor software was used under license. Igor scripts were used for data processing and analysis including Aerodyne Research Inc. proprietary scripts for parsing and averaging data and cannot be in a public repository. Other portions of Igor code used for plotting are available upon request. Raw measurement files (e.g., TILDAS and Vocus spectra) will be made available upon request. Processed data can be found at https://doi.org/10.25422/azu.data.13383014 (Gil Loaiza et al., 2021).
The supplement related to this article is available online at: https://doi.org/10.5194/bg-19-165-2022-supplement.
All authors made substantial contributions to the research. THMV, LKM, JRR and JHS conceptualized the idea and acquired funding. All authors participated in part or fully in developing prototypes, building experimental systems, and conducting experiments. JGL, LKM, JRR, and JHS contributed to the analyses and interpretation of data; JGL and LKM prepared the draft; all authors discussed the results and contributed to the final paper.
Aerodyne Research Inc. manufactures the TILDAS instrumentation and commercializes the Vocus PTR-TOF for applications in geosciences. Probes, sampling systems, and associated software are in development.
This report was prepared as an account of work sponsored by an
agency of the United States Government. Neither the United States Government
nor any agency thereof, nor any of their employees, makes any warranty,
express or implied, or assumes any legal liability or responsibility for the
accuracy, completeness, or usefulness of any information, apparatus,
product, or process disclosed or represents that its use would not infringe
privately owned rights. Reference herein to any specific commercial product,
process, or service by trade name, trademark, manufacturer, or otherwise
does not necessarily constitute or imply its endorsement, recommendation, or
favoring by the United States Government or any agency thereof. The views
and opinions of authors expressed herein do not necessarily state or reflect
those of the United States Government or any agency thereof.
Publisher’s note: Copernicus Publications remains neutral with regard to jurisdictional claims in published maps and institutional affiliations.
Till H. M. Volkmann was supported by Biosphere 2 through the office of the Senior Vice President for Research, Innovation and Impact at the University of Arizona. We thank Doug White and White Industries, Inc., for machining the probes. The authors gratefully acknowledge financial support from the Philecology Foundation for Biosphere 2 and the Landscape Evolutionary Observatory. Shuhei Ono at the Massachusetts Institute of Technology has shared with us calibrated reference gases for this study.
This research has been supported by the US Department of Energy, Office of Science, Small Business Innovation Research (SBIR) grant (award no. DE-SC0018459).
This paper was edited by Nicolas Brüggemann and reviewed by Daniel Epron, Albrecht Neftel, and two anonymous referees.
Abis, L., Loubet, B., Ciuraru, R., Lafouge, F., Houot, S., Nowak, V., Tripied, J., Dequiedt, S., Maron, P. A., and Sadet-Bourgeteau, S.: Reduced microbial diversity induces larger volatile organic compound emissions from soils, Sci. Rep., 10, 6104, https://doi.org/10.1038/s41598-020-63091-8, 2020.
Birch, H. F.: The effect of soil drying on humus decomposition and nitrogen availability, Plant Soil, 10, 9–31, 1958.
Burton, D. L. and Beauchamp, E. G.: Profile nitrous oxide and carbon dioxide concentrations in a soil subject to freezing, Soil Sci. Soc. Am. J., 58, 115–122, 1994.
Bzowski, J., Kestin, J., Mason, E. A., and Uribe, F. J.: Equilibrium and Transport Properties of Gas Mixtures at Low Density: Eleven Polyatomic Gases and Five Noble Gases, J. Phys. Chem. Ref. Data, 19, 1179–1232, 1990.
Citron, C. A., Gleitzmann, J., Laurenzano, G., Pukall, R., and Dickschat, J. S.: Terpenoids are widespread in actinomycetes: a correlation of secondary metabolism and genome data, Chembiochem, 13, 202–214, 2012.
Clough, T. J., Kelliher, F. M., Wang, Y. P., and Sherlock, R. R.: Diffusion of 15N-labelled N2O into soil columns: a promising method to examine the fate of N2O in subsoils, Soil Biol. Biochem., 38, 1462–1468, 2006.
Conrad, R.: Quantification of methanogenic pathways using stable carbon isotopic signatures: a review and a proposal, Org. Geochem., 36, 739–752, 2005.
DeSutter, T. M., Sauer, T. J., and Parkin, T. B.: Porous tubing for use in monitoring soil CO2 concentrations, Soil Biol. Biochem., 38, 2676–2681, 2006.
Dhanumalayan, E. and Joshi, G. M.: Performance properties and applications of polytetrafluoroethylene (PTFE) – a review Adv. Compos. Hybr. Mater., 1, 247–268, 2018.
Flechard, C. R., Neftel, A., Jocher, M., Ammann, C., Leifeld, J., and Fuhrer, J.: Temporal changes in soil pore space CO2 concentration and storage under permanent grassland, Agr. Forest Meteorol., 142, 66–84, 2007.
Gangi, L., Rothfuss, Y., Ogée, J., Wingate, L., Vereecken, H., and Brüggemann, N.: A New Method for In Situ Measurements of Oxygen Isotopologues of Soil Water and Carbon Dioxide with High Time Resolution, Vadose Zone J., 14, vzj2014.11.0169, https://doi.org/10.2136/vzj2014.11.0169, 2015.
Gonzalez-Meler, M. A., Rucks, J. S., and Aubanell, G.: Mechanistic insights on the responses of plant and ecosystem gas exchange to global environmental change: lessons from Biosphere 2, Plant Sci., 226, 14–21, 2014.
Groffman, P. M., Butterbach-Bahl, K., Fulweiler, R. W., Gold, A. J., Morse, J. L., Stander, E. K., Tague, C., Tonitto, C., and Vidon, P.: Challenges to incorporating spatially and temporally explicit phenomena (hotspots and hot moments) in denitrification models, Biogeochemistry, 93, 49–77, 2009.
Guenther, A., Hewitt, C. N., Erickson, D., Fall, R., Geron, C., Graedel, T., Harley, P., Klinger, L., Lerdau, M., Mckay, W. A., Pierce, T., Scholes, B., Steinbrecher, R., Tallamraju, R., Taylor, J., and Zimmerman, P.: A global model of natural volatile organic compound emissions, J. Geophys. Res., 100, 8873, https://doi.org/10.1029/94JD02950, 1995.
Gut, A., Blatter, A., Fahrni, M., Lehmann, B. E., Neftel, A., and Staffelbach, T.: A new membrane tube technique (METT) for continuous gas measurements in soils, Plant Soil, 198, 79–88, 1998.
Hirsch, A. I., Trumbore, S. E., and Goulden, M. L.: The surface CO2 gradient and pore-space storage flux in a high-porosity litter layer, Tellus B, 56, 312–321, https://doi.org/10.3402/tellusb.v56i4.16449, 2004.
Holter, P.: Sampling air from dung pats by silicone rubber diffusion chambers, Soil Biol. Biochem., 22, 995–997, 1990.
Honeker, L. K., Graves, K. R., Tfaily, M. M., Krechmer, J. E., and Meredith, L. K.: The volatilome: A vital piece of the complete soil metabolome, Front. Environ. Sci., 9, 649905, https://doi.org/10.3389/fenvs.2021.649905, 2021.
Insam, H. and Seewald, M. S. A.: Volatile organic compounds (VOCs) in soils, Biol. Fertil. Soils, 46, 199–213, 2010.
Jacinthe, P.-A. and Dick, W. A.: Use of silicone tubing to sample nitrous oxide in the soil atmosphere, Soil Biol. Biochem., 28, 721–726, 1996.
Jiao, S., Chen, W., Wang, J., Du, N., Li, Q., and Wei, G.: Soil microbiomes with distinct assemblies through vertical soil profiles drive the cycling of multiple nutrients in reforested ecosystems, Microbiome, 6, 1–13, 2018.
Jochheim, H., Wirth, S., and von Unold, G.: A multi-layer, closed-loop system for continuous measurement of soil CO2 concentration, J. Plant Nutr. Soil Sci., 181, 61–68, 2018.
Kammann, C., Grünhage, L., and Jäger, H.-J.: A new sampling technique to monitor concentrations of CH4, N2O and CO2 in air at well-defined depths in soils with varied water potential, Eur. J. Soil Sci., 52, 297–303, https://doi.org/10.1046/j.1365-2389.2001.00380.x, 2001.
Karbin, S., Guillet, C., Kammann, C. I., and Niklaus, P. A.: Effects of Long-Term CO2 Enrichment on Soil-Atmosphere CH4 Fluxes and the Spatial Micro-Distribution of Methanotrophic Bacteria, PLoS One, 10, e0131665, https://doi.org/10.1371/journal.pone.0131665, 2015.
Krämer, H. and Conrad, R.: Measurement of dissolved H2 concentrations in methanogenic environments with a gas diffusion probe, FEMS Microbiol. Ecol., 12, 149–158, 1993.
Krechmer, J., Lopez-Hilfiker, F., Koss, A., Hutterli, M., Stoermer, C., Deming, B., Kimmel, J., Warneke, C., Holzinger, R., Jayne, J., Worsnop, D., Fuhrer, K., Gonin, M., and de Gouw, J.: Evaluation of a New Reagent-Ion Source and Focusing Ion–Molecule Reactor for Use in Proton-Transfer-Reaction Mass Spectrometry, Anal. Chem., 90, 12011–12018, 2018.
Laemmel, T., Maier, M., Schack-Kirchner, H., and Lang, F.: An in situ method for real-time measurement of gas transport in soil : Monitoring of gas transport in soil, Eur. J. Soil Sci., 68, 156–166, 2017.
Leitner, S., Homyak, P. M., Blankinship, J. C., Eberwein, J., Jenerette, G. D., Zechmeister-Boltenstern, S., and Schimel, J. P.: Linking NO and N2O emission pulses with the mobilization of mineral and organic N upon rewetting dry soils, Soil Biol. Biochem., 115, 461–466, 2017.
Lin, Y., Campbell, A. N., Bhattacharyya, A., DiDonato, N., Thompson, A. M., Tfaily, M. M., Nico, P. S., Silver, W. L., and Pett-Ridge, J.: Differential effects of redox conditions on the decomposition of litter and soil organic matter, Biogeochemistry, 154, 1–15, https://doi.org/10.1007/s10533-021-00790-y, 2021.
Maier, M., Schack-Kirchner, H., Aubinet, M., Goffin, S., Longdoz, B., and Parent, F.: Turbulence Effect on Gas Transport in Three Contrasting Forest Soils, Soil Sci. Soc. Am. J., 76, 1518–1528, 2012.
Massman, W. J.: A review of the molecular diffusivities of H2O, CO2, CH4, CO, O3, SO2, NH3, N2O, NO, and NO2 in air, O2 and N2 near STP, Atmos. Environ., 32, 1111–1127, https://doi.org/10.1016/s1352-2310(97)00391-9, 1998.
MATLAB: 9.7.0.1190202, R2019b, Natick, Massachusetts, The MathWorks Inc., 2018.
McCalley, C. K., Woodcroft, B. J., Hodgkins, S. B., Wehr, R. A., Kim, E.-H., Mondav, R., Crill, P. M., Chanton, J. P., Rich, V. I., Tyson, G. W., and Saleska, S. R.: Methane dynamics regulated by microbial community response to permafrost thaw, Nature, 514, 478–481, 2014.
McClellan, M. J.: Estimating regional nitrous oxide emissions using isotopic ratio observations and a Bayesian inverse framework, Ph.D, Massachusetts Institute of Technology, available at: https://dspace.mit.edu/handle/1721.1/119986 (last access: 8 September 2020), 2018.
McManus, J. B., Nelson, D. D., and Zahniser, M. S.: Design and performance of a dual-laser instrument for multiple isotopologues of carbon dioxide and water, Opt. Express, 23, 6569–6586, 2015.
McSharry, C., Faulkner, R., Rivers, S., Shaffer, M. S. P., and Welton, T.: The chemistry of East Asian lacquer: A review of the scientific literature, Stud. Conserv., 52, 29–40, 2007.
Mohn, J., Wolf, B., Toyoda, S., Lin, C.-T., Liang, M.-C., Brüggemann, N., Wissel, H., Steiker, A. E., Dyckmans, J., Szwec, L., Ostrom, N. E., Casciotti, K. L., Forbes, M., Giesemann, A., Well, R., Doucett, R. R., Yarnes, C. T., Ridley, A. R., Kaiser, J., and Yoshida, N.: Interlaboratory assessment of nitrous oxide isotopomer analysis by isotope ratio mass spectrometry and laser spectroscopy: current status and perspectives, Rapid Commun. Mass Spectrom., 28, 1995–2007, 2014.
Munksgaard, N. C., Wurster, C. M., and Bird, M. I.: Continuous analysis of δ18 O and δD values of water by diffusion sampling cavity ring-down spectrometry: a novel sampling device for unattended field monitoring of precipitation, ground and surface waters, Rapid Commun. Mass Spectrom., 25, 3706–3712, https://doi.org/10.1002/rcm.5282, 2011.
Panikov, N. S., Mastepanov, M. A., and Christensen, T. R.: Membrane probe array: Technique development and observation of CO2 and CH4 diurnal oscillations in peat profile, Soil Biol. Biochem., 39, 1712–1723, 2007.
Parent, F., Plain, C., Epron, D., Maier, M., and Longdoz, B.: A new method for continuously measuring the δ13C of soil CO2 concentrations at different depths by laser spectrometry, Eur. J. Soil Sci., 64, 516–525, https://doi.org/10.1111/ejss.12047, 2013.
Penger, J., Conrad, R., and Blaser, M.: Stable carbon isotope fractionation by methylotrophic methanogenic archaea, Appl. Environ. Microbiol., 78, 7596–7602, 2012.
Peñuelas, J., Asensio, D., Tholl, D., Wenke, K., Rosenkranz, M., Piechulla, B., and Schnitzler, J. P.: Biogenic volatile emissions from the soil, Plant Cell Environ., 37, 1866–1891, 2014.
Petersen, S. O.: Diffusion probe for gas sampling in undisturbed soil, Eur. J. Soil Sci., 65, 663–671, 2014.
R Core Team: R: A language and environment for statistical computing, R Foundation for Statistical Computing, Vienna, Austria, available at: https://www.R-project.org/ (last access: 17 November 2020), 2017.
Raza, W., Mei, X., Wei, Z., Ling, N., Yuan, J., Wang, J., Huang, Q., and Shen, Q.: Profiling of soil volatile organic compounds after long-term application of inorganic, organic and organic-inorganic mixed fertilizers and their effect on plant growth, Sci. Total Environ., 607/608, 326–338, 2017.
Rock, L., Ellert, B. H., Mayer, B., and Norman, A. L.: Isotopic composition of tropospheric and soil N2O from successive depths of agricultural plots with contrasting crops and nitrogen amendments, J. Geophys. Res. D-Atmos., 112, D18, https://doi.org/10.1029/2006JD008330, 2007.
Roscioli, J. R., Yacovitch, T. I., Floerchinger, C., Mitchell, A. L., Tkacik, D. S., Subramanian, R., Martinez, D. M., Vaughn, T. L., Williams, L., Zimmerle, D., Robinson, A. L., Herndon, S. C., and Marchese, A. J.: Measurements of methane emissions from natural gas gathering facilities and processing plants: measurement methods, Atmos. Meas. Tech., 8, 2017–2035, https://doi.org/10.5194/amt-8-2017-2015, 2015.
Rothfuss, F. and Conrad, R.: Development of a gas diffusion probe for the determination of methane concentrations and diffusion characteristics in flooded paddy soil, FEMS Microbiol. Ecol., 14, 307–318, 1994.
Rothfuss, Y., Vereecken, H., and Brüggemann, N.: Monitoring water stable isotopic composition in soils using gas-permeable tubing and infrared laser absorption spectroscopy, Water Resour. Res., 49, 3747–3755, https://doi.org/10.1002/wrcr.20311, 2013.
Rothfuss, Y., Merz, S., Vanderborght, J., Hermes, N., Weuthen, A., Pohlmeier, A., Vereecken, H., and Brüggemann, N.: Long-term and high-frequency non-destructive monitoring of water stable isotope profiles in an evaporating soil column, Hydrol. Earth Syst. Sci., 19, 4067–4080, https://doi.org/10.5194/hess-19-4067-2015, 2015.
Rothman, L. S., Gordon, I. E., Babikov, Y., Barbe, A., Benner, D. C., Bernath, P. F., Birk, M., Bizzocchi, L., Boudon, V., Brown, L. R., Campargu, A., Chance, K., Cohen, E. A., Coudert, L. H., Devi, V. M., Drouin, B. J., Fayt, A., Flaud, J.-M., Gamache, R. R., Harrison, J. J., Hartmann, J.-M., Hill, C., Hodges, J. T., Jacquemart, D., Jolly, A., Lamouroux, J., Le Roy, R. J., Li, G., Long, D. A., Lyulin, O. M., Mackie, C. J., Massie, S. T., Mikhailenko, S., Müller, H. S. P., Naumenko, O. V., Nikitin, A. V., Orphal, J., Perevalov, V., Perrin, A., Polovtseva, E. R., Richard, C., Smith, M. A. H., Starikova, E., Sung, K., Tashkun, S., Tennyson, J., Toon, G. C., Tyuterev, V. G., and Wagner, G.: The HITRAN2012 molecular spectroscopic database, J. Quant. Spectrosc. Radiat. Transf., 130, 4–50, 2013.
Saleska, S. R., Shorter, J. H., Herndon, S., Jiménez, R., Barry McManus, J., William Munger, J., Nelson, D. D., and Zahniser, M. S.: What are the instrumentation requirements for measuring the isotopic composition of net ecosystem exchange of CO2 using eddy covariance methods?, Isot. Environ. Health Stud., 42, 115–133, https://doi.org/10.1080/10256010600672959, 2006.
Schimel, J. P.: Life in Dry Soils: Effects of Drought on Soil Microbial Communities and Processes, Annu. Rev. Ecol. Evol. Syst., 49, 409–432, https://doi.org/10.1146/annurev-ecolsys-110617-062614, 2018.
Schulz-Bohm, K., Zweers, H., de Boer, W., and Garbeva, P.: A fragrant neighborhood: volatile mediated bacterial interactions in soil, Front. Microbiol., 6, 1212, https://doi.org/10.3389/fmicb.2015.01212, 2015.
Schulz-Bohm, K., Gerards, S., Hundscheid, M., Melenhorst, J., de Boer, W., and Garbeva, P.: Calling from distance: attraction of soil bacteria by plant root volatiles, ISME J., 12, 1252–1262, 2018.
Snider, D. M., Venkiteswaran, J. J., Schiff, S. L., and Spoelstra, J.: From the Ground Up: Global Nitrous Oxide Sources are Constrained by Stable Isotope Values, PLOS ONE, 10, e0118954, https://doi.org/10.1371/journal.pone.0118954, 2015.
Sutka, R. L., Ostrom, N. E., Ostrom, P. H., Breznak, J. A., Gandhi, H., Pitt, A. J., and Li, F.: Distinguishing nitrous oxide production from nitrification and denitrification on the basis of isotopomer abundances, Appl. Environ. Microbiol., 72, 638–644, 2006.
Toyoda, S., Yoshida, N., and Koba, K.: Isotopocule analysis of biologically produced nitrous oxide in various environments, Mass Spectrom. Rev., 36, 135–160, 2017.
Van Haren, J. L. M., Handley, L. L., Biel, K. Y., Kudeyarov, V. N., McLain, J. E. T., Martens, D. A., and Colodner, D. C.: Drought-induced nitrous oxide flux dynamics in an enclosed tropical forest, Glob. Change Biol., 11, 1247–1257, 2005.
Voglar, G. E., Zavadlav, S., Levanič, T., and Ferlan, M.: Measuring techniques for concentration and stable isotopologues of CO2 in a terrestrial ecosystem: A review, Earth-Sci. Rev., 199, 102978, https://doi.org/10.1016/j.earscirev.2019.102978, 2019.
Volkmann, T. H. M. and Weiler, M.: Continual in situ monitoring of pore water stable isotopes in the subsurface, Hydrol. Earth Syst. Sci., 18, 1819–1833, https://doi.org/10.5194/hess-18-1819-2014, 2014.
Volkmann, T. H. M., Kühnhammer, K., Herbstritt, B., Gessler, A., and Weiler, M.: A method for in situ monitoring of the isotope composition of tree xylem water using laser spectroscopy, Plant Cell Environ., 39, 2055–2063, https://doi.org/10.1111/pce.12725, 2016a.
Volkmann, T. H. M., Haberer, K., Gessler, A., and Weiler, M.: High-resolution isotope measurements resolve rapid ecohydrological dynamics at the soil plant interface, New Phytol., 210, 839–849, 2016b.
Volkmann, T. H. M., Sengupta, A., Pangle, L. A., Dontsova, K., Barron-Gafford, G. A., Harman, C. J., Niu, G. Y., Meredith, L. K., Abramson, N., Meira Neto, A. A., Wang, Y., Adams, J. R., Breshears, D. D., Bugaj, A., Chorover, J., Cueva, A., DeLong, S. B., Durcik, M., Ferre, T. P. A., Hunt, E. A., Huxman, T. E., Kim, M., Maier, R. M., Monson, R. K., Pelletier, J. D., Pohlmann, M., Rasmussen, C., Ruiz, J., Saleska, S. R., Schaap, M. G., Sibayan, M., Tuller, M., van Haren, J. L. M., Zeng, X., and Troch, P. A.: Controlled experiments of hillslope coevolution at the Biosphere 2 Landscape Evolution Observatory: Toward prediction of coupled hydrological, biogeochemical, and ecological change, in: Hydrology of Artificial and Controlled Experiments, edited by: Jiu-Fu Liu, W.-Z. G., IntechOpen, 25–74, 2018.
Wang, Y., Hu, C., Ming, H., Oenema, O., Schaefer, D. A., Dong, W., Zhang, Y., and Li, X.: Methane, Carbon Dioxide and Nitrous Oxide Fluxes in Soil Profile under a Winter Wheat-Summer Maize Rotation in the North China Plain, PLoS ONE, 9, e98445, https://doi.org/10.1371/journal.pone.0098445, 2014.
Wei, J., Ibraim, E., Brüggemann, N., Vereecken, H., and Mohn, J.: First real-time isotopic characterisation of N2O from chemodenitrification, Geochim. Cosmochim. Ac., 267, 17–32, 2019.
Werle, P., Mucke, R., and Slemr, F.: The limits of signal averaging in atmospheric trace-gas monitoring by tunable diode-laser absorption spectroscopy (TDLAS), Appl. Phys. B, 57, 131–139, https://doi.org/10.1007/bf00425997, 1993.
Wester-Larsen, L., Kramshøj, M., Albers, C. N., and Rinnan, R.: Biogenic Volatile Organic Compounds in Arctic Soil: A Field Study of Concentrations and Variability With Vegetation Cover, J. Geophys. Res. Biogeosci., 125, e2019JG005551, https://doi.org/10.1029/2019JG005551, 2020.
Yoshida, N. and Toyoda, S.: Constraining the atmospheric N2O budget from intramolecular site preference in N2O isotopomers, Nature, 405, 330–334, 2000.