the Creative Commons Attribution 4.0 License.
the Creative Commons Attribution 4.0 License.
 | 31 Mar 2022
Predicting mangrove forest dynamics across a soil salinity gradient using an individual-based vegetation model linked with plant hydraulics
Masaya Yoshikai
Takashi Nakamura
Rempei Suwa
Sahadev Sharma
Rene Rollon
Jun Yasuoka
Ryohei Egawa
Kazuo Nadaoka
In mangrove forests, soil salinity is one of the most significant environmental factors determining forest distribution and productivity as it limits plant water uptake and carbon gain. However, salinity control on mangrove productivity through plant hydraulics has not been investigated by existing mangrove models. Here we present a new individual-based model linked with plant hydraulics to incorporate physiological characterization of mangrove growth under salt stress. Plant hydraulics was associated with mangroves' nutrient uptake and biomass allocation apart from water flux and carbon gain. The developed model was performed for two coexisting species – Rhizophora stylosa and Bruguiera gymnorrhiza – in a subtropical mangrove forest in Japan. The model predicted that the productivity of both species was affected by soil salinity through downregulation of stomatal conductance. Under low-soil-salinity conditions (< 28 ‰), B. gymnorrhiza trees grew faster and suppressed the growth of R. stylosa trees by shading that resulted in a B. gymnorrhiza-dominated forest. As soil salinity increased, the productivity of B. gymnorrhiza was significantly reduced compared to R. stylosa, which led to an increase in biomass of R. stylosa despite the enhanced salt stress (> 30 ‰). These predicted patterns in forest structures across the soil salinity gradient remarkably agreed with field data, highlighting the control of salinity on productivity and tree competition as factors that shape the mangrove forest structures. The model reproducibility of forest structures was also supported by the predicted self-thinning processes, which likewise agreed with field data. Aside from soil salinity, seasonal dynamics in atmospheric variables (solar radiation and temperature) were highlighted as factors that influence mangrove productivity in a subtropical region. This physiological principle-based improved model has the potential to be extended to other mangrove forests in various environmental settings, thus contributing to a better understanding of mangrove dynamics under future global climate change.
- Article
(4018 KB) - Full-text XML
-
Supplement
(6024 KB) - BibTeX
- EndNote


Mangrove forests grow in intertidal zones in tropical and subtropical regions (Giri et al., 2011) and store a large amount of carbon (C) especially in their soil, commonly referred to as “blue carbon”. It has roughly 4 times higher ecosystem-scale carbon stock than other forest ecosystems (Donato et al., 2011), characterizing them as globally important C sinks (Mcleod et al., 2011; Alongi, 2014; Taillardat et al., 2018; Sharma et al. 2020), therefore playing an important role in climate change mitigation. However, mangrove forests have declined worldwide; at least 35 % of the mangrove forests had disappeared in the 1980s and 1990s predominantly because of deforestation due to conversion to aquaculture ponds, rice fields, urban development, and palm oil plantations (Friess et al., 2019). Deforestation has been continuing until now particularly in Southeast Asia, with a recent estimate of mangrove loss rates between 0.11 %–0.70 % (Friess et al., 2019, 2020). The loss of mangrove soil C through mineralization following deforestation has been of concern as a source of carbon emission to the atmosphere in addition to the loss of C sequestration capacity (Atwood et al., 2017; Sharma et al. 2020; Adame et al., 2021). To facilitate effective mangrove conservation, management, and restoration, a better understanding of C sequestration rates and the soil C dynamics, hence mangrove blue C dynamics, under different environmental conditions and climate change is urgently needed.
While the mangrove soil C dynamics are complex and involve physical, biogeochemical, and ecological processes (Kristensen et al., 2008; Alongi, 2014; Bukoski et al. 2020) that still remain poorly understood, one of the most important variables determining soil C dynamics may be related to mangrove productivity. Mangroves supply their products, such as leaf litter and dead roots, to the soil C pool (Kristensen et al., 2008; Alongi, 2014; Ouyang et al., 2017), which are closely related to forest structural variables such as canopy height and above-ground biomass (AGB) (Saenger and Snedaker, 1993; Komiyama et al., 2008). Such autochthonous C accounts for a significant amount of total soil C in mangrove forests (Xiong et al., 2018; Sasmito et al., 2020). Therefore, the aim of this study is to successfully quantify and predict the biomass dynamics and growth processes of mangroves in different environmental conditions. These results would take a step forward in our understanding of mangrove C sequestration rate and soil C dynamics.
Although data and insights on mangrove AGB distributions in relation to environmental variables have recently increased (Simard et al., 2019; Roval et al., 2016, 2021), there is still no established way to predict the dynamics of mangrove AGB in the changing environmental conditions. Generally, the ecosystem's response to environmental variables is nonlinear, and biomass dynamics is cumulatively affected by a nonlinear response. Therefore, predicting the effect of one environmental variable on mangrove biomass dynamics is difficult if based only from the monitoring data on mangroves' biomass, which are exposed to the effects of multiple environmental variables. This makes the assessment of environmental impacts on mangrove biomass dynamics challenging if datasets from only the field-based monitoring approach are used.
The dynamic vegetation model (DVM) simulates vegetation or forest growth based on physiological principles that include processes such as tree competition, establishment, and mortality (Fisher et al., 2018). This model could be a way to overcome the limitation of field-based approach and predict mangrove biomass dynamics under multiple environmental variables. Various DVMs (e.g., big-leaf, cohort-based, individual-based) have been developed mainly for terrestrial ecosystems and have successfully reproduced the dynamics of various forests in the temperate, tropical, and boreal regions (Fisher et al., 2018). Recently, DVMs have advanced in physiological expression of stomatal conductance under water stress by incorporating a plant hydraulic model that explicitly solves plant water flux (Bonan et al., 2014; Xu et al., 2016; Li et al., 2021). Recent studies also identified plant hydraulics as a critical factor that determines the plants' biomass allocation pattern to leaves, stem, and roots (Magnai et al., 2000; Trugman et al., 2019b; Portkay et al., 2021), the variations of which could drive a significant variation in plant productivity (Trugman et al., 2019a).
In mangrove forests, the salt in soil porewater (soil salinity) is one of the significant environmental factors that determine the mangroves' distribution, productivity, structure, and zonation pattern (Ball and Farquhar, 1984; Clough and Sim, 1989; Sobrado, 2000; Ball, 2002; Suarez and Medina, 2005; Suwa et al., 2009; Barr et al., 2013; Nguyen et al., 2015). Therefore, it is essential to properly represent the effects of soil salinity on mangrove growth considering species differences in the tolerance of salinity in order to accurately predict the mangrove biomass dynamics. Soil salinity imposes highly negative water potential in the substrate, making the water acquisition energetically challenging for plants, which acts in a similar way to water stress (Reef and Lovelock, 2015). With this perspective, the theoretical works of Perri et al. (2017, 2019) demonstrated the importance of considering the plant hydraulics for predicting the photosynthetic and transpiration rates under salt stress. However, although there are several individual-based DVMs for mangroves (e.g., FORMAN by Chen and Twilley, 1998; Kiwi by Berger and Hildenbrandt, 2000; mesoFON by Grueters et al., 2014; and BETTINA by Peters et al., 2014), no model has yet considered salinity control role in photosynthesis and transpiration through plant hydraulics, suggesting room for improvement in the physiological representation of the mangrove biomass dynamics under the impacts of soil salinity. It is expected that the nutrient uptake rate is also affected by soil salinity through the regulated transpiration rate (Simunek and Hopmans, 2009), making nutrient availability one of the key factors controlling mangrove growth especially under high-soil-salinity conditions (Lovelock et al., 2004, 2006a, b; Feller et al., 2007; Reef et al., 2010). Nonetheless, the modeling studies have not explicitly considered the role of nutrient uptake in mangrove growth.
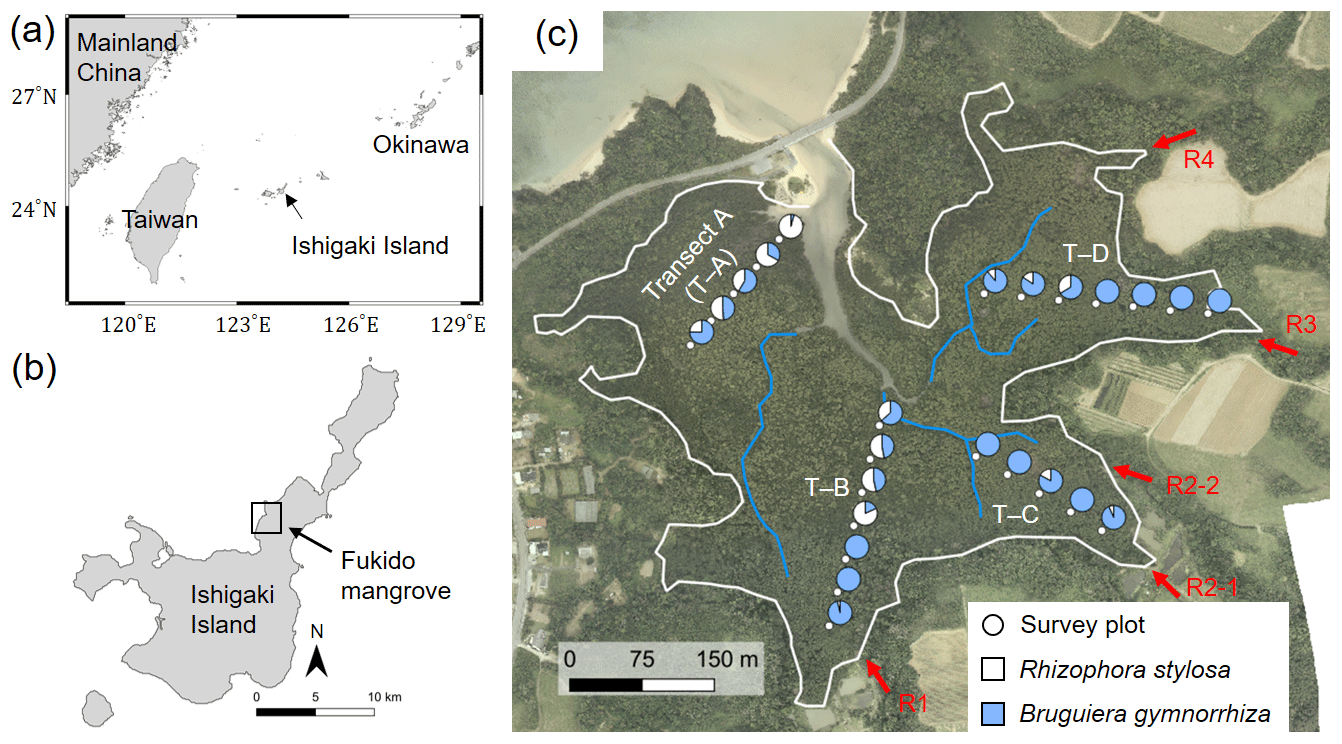
Figure 1(a) Location of Ishigaki Island; (b) location and (c) aerial photo of the study site – Fukido mangrove forest. The white line in panel (c) indicates the boundary of mangroves and other land covers where mangroves are assumed to inhabit the areas of elevation < 1.0 m + mean sea level, which was delineated based on a lidar-derived digital elevation model (DEM). The blue lines indicate small creeks. The circular makers indicate survey plots' locations along with four transects (T–A to T–D), while the pie charts indicate species composition in each plot. The red arrows indicate outlets of rivers flowing into the mangrove forest (R1 to R4). The aerial photo and DEM products were obtained from Asia Air Survey Co. Ltd., Japan. Shorelines are from Global Self-consistent, Hierarchical, High-resolution Geography Database (GSHHG).
Here we hypothesized that the individual-based DVM incorporating plant hydraulic traits can reasonably predict mangrove biomass, structure, and species zonation pattern across a soil salinity gradient without empirical expression of the soil salinity influence on mangrove productivity. Such model would advance the understanding of mangrove biomass dynamics under multiple environmental stresses, which ultimately influence the mangrove soil carbon dynamics. To test the hypothesis and contribute to the improvement of the physiological representation of mangrove growth specifically under soil salinity impacts, we developed a new individual-based DVM for the mangrove forest. The developed model is based on a terrestrial individual-based DVM – the SEIB-DGVM (Spatially-Explicit Individual-Based Dynamic Global Vegetation Model, Sato et al., 2007). We added a plant hydraulic model to SEIB-DGVM and coupled it with the photosynthetic model to consider the impacts of soil salinity on the mangrove water uptake and carbon gain. We also explicitly considered the role of nutrient uptake on biomass dynamics. Furthermore, a novel biomass allocation scheme linked with plant hydraulics and resource uptake rate was introduced as the mangroves' strategy to cope with salt stress and enhance the rate of production. We tested the developed model and determined the reproducibility of forest structures (e.g., species composition, biomass) in a subtropical mangrove forest in Japan with two coexisting species (Rhizophora stylosa and Bruguiera gymnorrhiza).
2.1 Study sites
Our study site for the model application is an estuarine mangrove of the Fukido River (Fukido mangrove forest) in Ishigaki Island, Japan (Fig. 1, 24∘20′ S, 124∘15′ E). The site is characterized as a subtropical region. According to the climatological normal data obtained by the Japan Meteorological Agency, the annual-mean air temperature is 24.5 ∘C, with a monthly average of 29.6 ∘C in July and 18.9 ∘C in January (see also Fig. 4). The mean monthly precipitation is 142 mm in July and 135 mm in January. Four small rivers (R1–R4) flow into the Fukido mangrove forest, while the river R2 has two outlets (Fig. 1c). The mean discharge rates of the rivers in October 2012 were less than 0.03 m3 s−1 for R1, R3, and R4 and around 0.05 m3 s−1 for R2 (Mori et al., unpublished data). The tide is semi-diurnal with the highest and lowest amplitude of 1.8 and 0.8 m, respectively (Egawa et al., 2021).
The site is vegetated by two species, R. stylosa and B. gymnorrhiza. The trees of R. stylosa dominated the seaward zone, especially areas close to the river mouth (Fig. 1c), while B. gymnorrhiza dominated the landward zone. The species R. stylosa is classified as a relatively salt-tolerant species, while B. gymnorrhiza is classified as a less salt-tolerant but shade-tolerant species (Putz and Chan, 1986; Sharma et al. 2012; Reef et al., 2015). According to Ohtsuka et al. (2019), the Fukido mangrove forest is a mature and intact mangrove forest designated as natural protection area by Ishigaki city, where distinct disturbances to the mangroves have not occurred since at least 1977 based on aerial photograph analysis.
2.2 Field data collection
We used the tree census data of the Fukido mangrove forest shown in Suwa et al. (2021) to assess model performance. The tree census data were collected from the survey plots established along four transects (T–A, T–B, T–C, and T–D), shown in Fig. 1c. The details of the survey protocol are described in Suwa et al. (2021). The stem biomass of individual trees (MS, g) was estimated from a common mangrove allometric equation proposed by Komiyama et al. (2005), which was validated with various mangrove species:
where ρ is the wood density (g cm−3), DBH is the stem diameter at breast height (m) divided by 100 for the unit conversion from meter to centimeter, and H is the tree height (m). However, tree height data were occasionally absent at some plots, especially along T–C and T–D, and in such cases, the tree height was estimated using a DBH–H allometric relationship (Fig. S1a and b in the Supplement). The AGB at each plot (Mg ha−1) was then calculated from the estimated stem biomass.
The crown diameter was also measured for some selected trees, besides the data shown in Suwa et al. (2021). The trees for crown measurement were randomly selected at each transect. The diameters parallel and perpendicular to the transect line were measured for each tree, and the crown diameter (Dcrown, m) was represented by the average of the values from the two directions. In total, crowns of 81 trees of R. stylosa and 103 trees of B. gymnorrhiza were measured (Supplement Fig. S1c and d).
Soil salinity and porewater dissolved inorganic nitrogen concentration (DIN) were also measured at each plot as environmental drivers of mangrove production. Soil samples were collected by inserting a PVC pipe into the soil at each plot, and soil porewater was extracted from the surface 10 cm soil sample. The porewater samples were kept frozen and brought to the laboratory for analysis. Salinity of the porewater (soil salinity) was measured using a salinity meter (PAL-SALT, ATAGO Co., Ltd., Japan), while DIN concentrations were measured using a QuAAtro 2-HR (SEAL Analytical Ltd., Germany, and BLTEC K.K., Japan). These measurements were conducted from August to September 2013. The summary of the environmental and vegetation variables at each plot is provided in Table S1 in the Supplement.
2.3 Model description
The mangrove growth model was formulated based on an individual-based model, SEIB-DGVM (Sato et al., 2007). The forest dynamics was represented by a 30 m × 30 m computational domain. In this domain, the irradiance distribution, tree establishment, death, and changes in plant morphology subsequent to growth were simulated (Sato et al., 2007). A feature of SEIB-DGVM is that it explicitly solves the effects of shading by neighboring trees on the light acquisition. The SEIB-DGVM thus provides the advantage in describing tree competition for light more than the other types of DVMs such as big-leaf or cohort-based models (Fisher et al., 2018). In SEIB-DGVM, the crown of each tree is represented by a cylindrical-shaped object divided by 0.1 m thick crown layers to account for the within-crown vertical variability in irradiance distribution. It is assumed that leaf biomass is evenly distributed in the crown layers.
Originally, the SEIB-DGVM defines four biomass pools – leaf, trunk, fine root, and stock (non-structural storage pool); the trunk includes both the above-ground stem and the below-ground coarse root (Sato et al., 2007). In this study, we considered the stem and coarse root separately to explicitly consider the role of coarse root turnover in the biomass dynamics (Castaneda-Moya et al., 2011; Adame et al., 2014). Additionally, we added a new biomass pool – the above-ground root, especially for Rhizophora species whose above-ground root, or “prop root”, could account for nearly 60 % of their AGB (Nishino et al., 2015; Vinh et al., 2019).
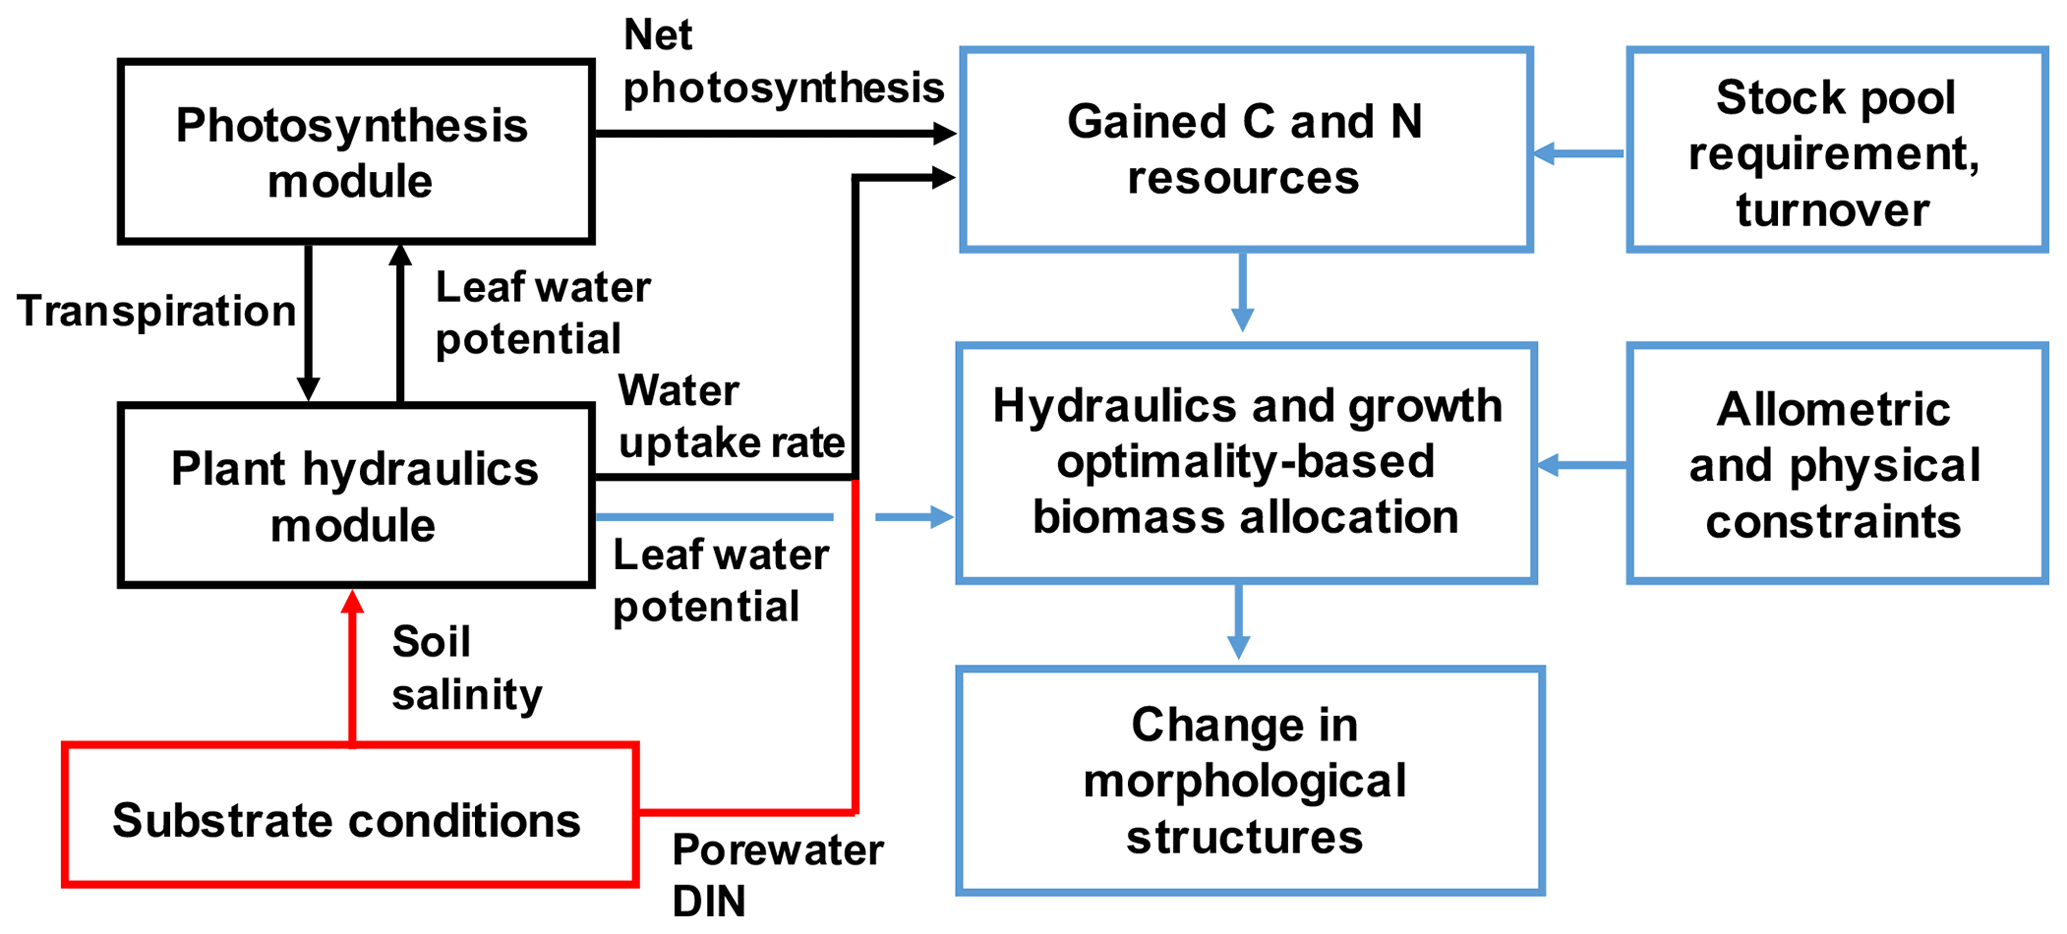
Figure 2The model framework newly added to SEIB-DGVM for describing mangrove growth. The red box and arrows indicate the substrate conditions given in the model. The black boxes and arrows indicate processes computed in the hourly time steps, while the blue ones are for the daily time step.
The original SEIB-DGVM does not have a plant hydraulic module, and the effects of soil water on stomatal conductance were empirically parameterized. It also does not account for plant nutrient uptake; thus, the plant growth depends solely on photosynthesis. The biomass allocation is modeled based on scaling law (Trugman et al., 2019a). In this study, these processes that control plant growth were almost entirely modified to describe mangrove growth under salt stress (Fig. 2). The following sections explain the modification of the SEIB-DGVM for this study related to plant hydraulics. Other modifications to the SEIB-DGVM are summarized in Notes S3 and S4.
2.3.1 Inclusion of plant hydraulic module
The plant hydraulic module implemented in this study is primarily based on the model developed by Xu et al. (2016) in a soil–plant–atmosphere continuum scheme. Here we describe essential processes in the plant hydraulic module which will be related to the new biomass allocation model in the next section.
Table 1Parameters constraining plant morphology, biomass proportion, and stoichiometry.
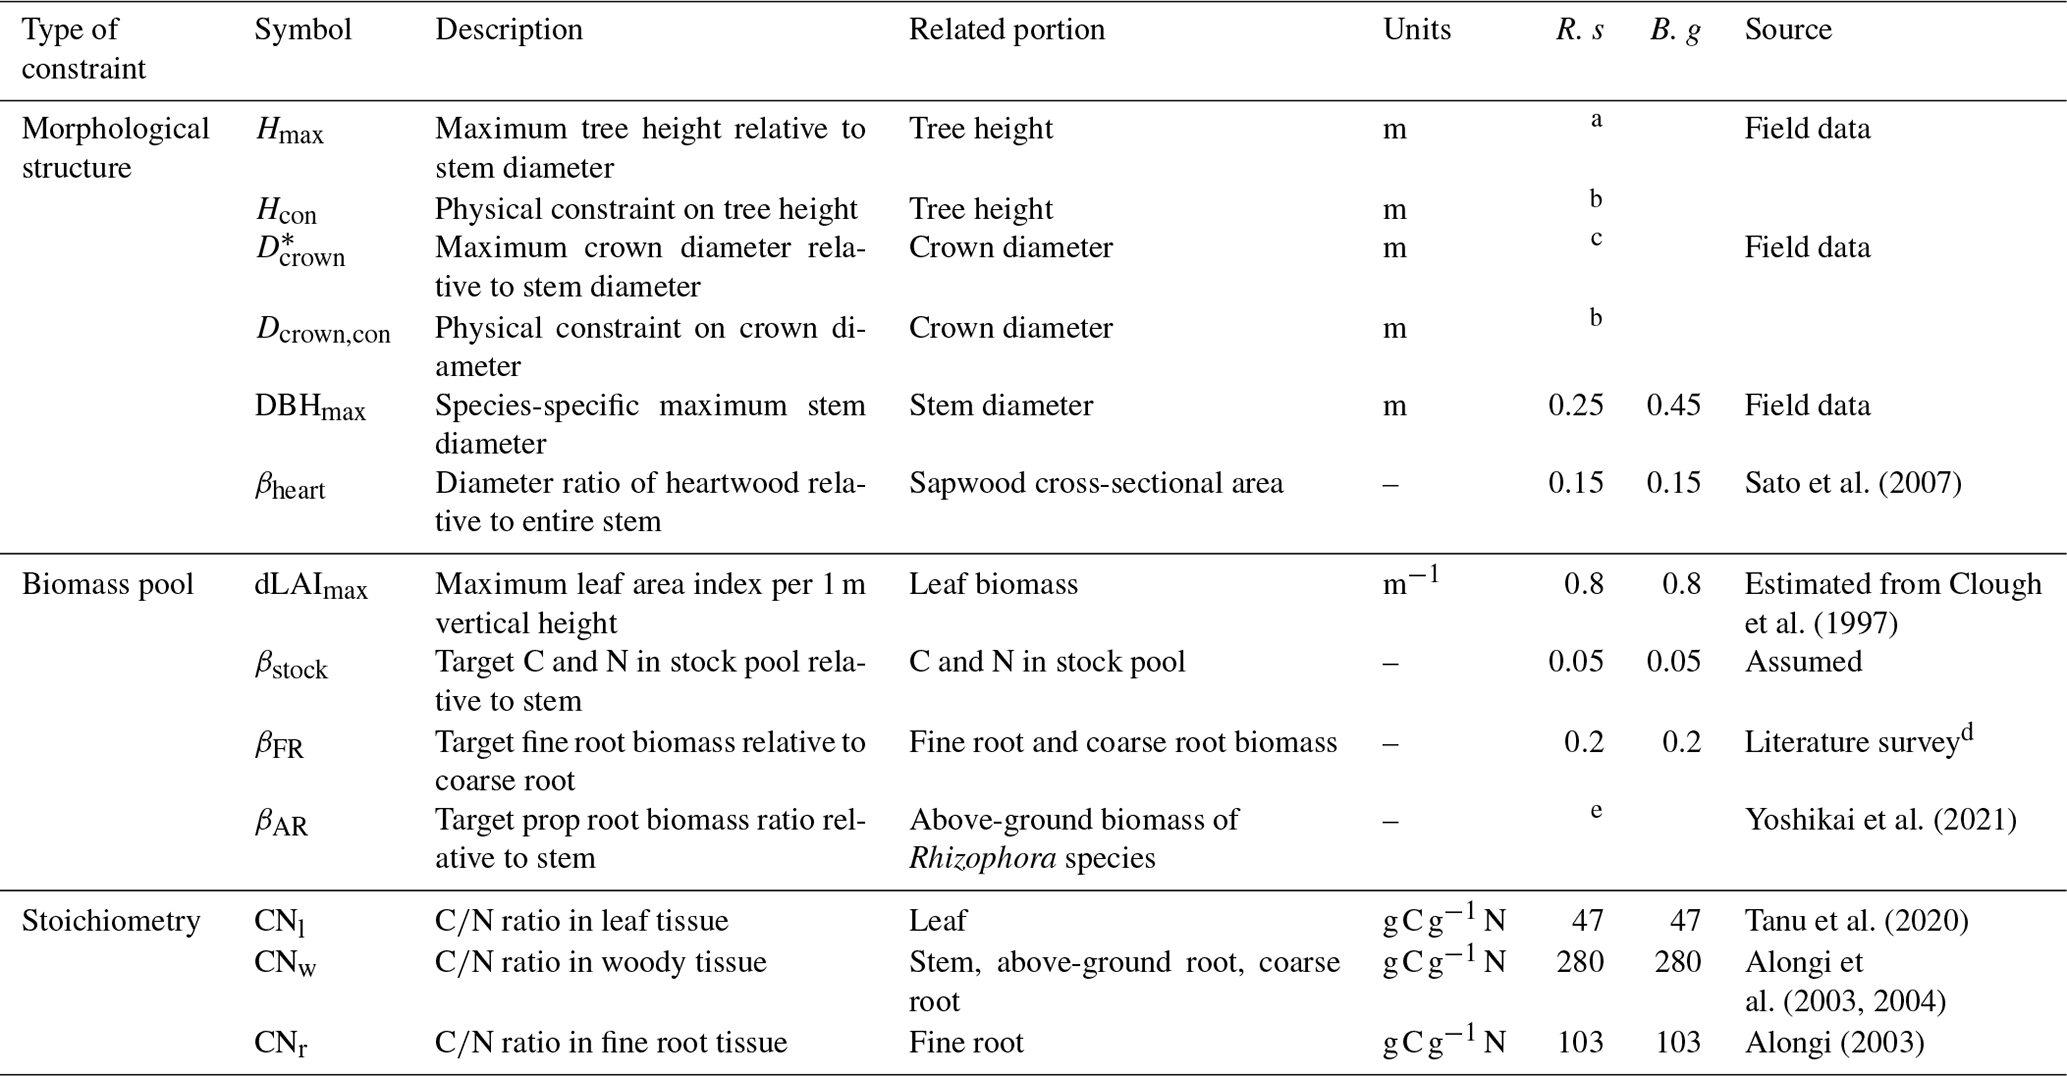
R. s: R. stylosa; B. g: B. gymnorrhiza.
a Derived from DBH–Hmax relationship. See Note S1 and Fig. S1 for details. b Computed in the model. See Fig. 3c and d. c Derived from DBH– relationship. See Note S1 and Fig. S1 for details. d Average of values reported in Tamooh et al. (2008), Castañeda-Moya et al. (2011), Adame et al. (2014), Robertson and Alongi et al. (2003), and Muhammad-Nor et al. (2019). e Estimated from prop root allometry in the Fukido mangrove forest. See Fig. S3.
The plant water uptake rate (≈ sap flow rate; Jsap, kg H2O per tree per second) is calculated as
where Rwhole is the whole-plant hydraulic resistance (MPa s tree kg−1 H2O), and Ψs and Ψl are the soil and leaf water potential (MPa), respectively; the Ψh = ρw g H 10−6, which is the gravitational water potential drop from the ground to the crown (MPa), where ρw is the water density (kg m−3) and g is the gravitational acceleration (m s−2). The parameter Ψs can be expressed as a sum of the matric potential and osmotic potential (Ψπ, MPa). The parameter Ψπ can be expressed as the difference in the osmotic potential between the soil and plant, which is linearly related to soil salinity and the partial uptake of the salt by mangroves represented by the salt filtration efficiency, ε (fraction) (Perri et al., 2017). Here, a constant water temperature value (25 ∘C) was used to compute Ψπ; however, note that sensitivity of Ψπ to change in temperature is significantly small compared to salinity. Alternatively, the matric potential is negligibly small compared to Ψπ in mangrove forests where the soil is usually water-saturated due to frequent tidal flooding (Perri et al., 2017). The parameter Rwhole can be expressed as the sum of the root to stem hydraulic resistance (Rroot) and the stem to leaf hydraulic resistance (Rstem), both expressed in (MPa s tree kg−1 H2O). The parameter Rroot is given by
where Rr is the fine root hydraulic resistance per unit biomass (MPa s g kg−1 H2O) and MFR is the fine root biomass (g per tree). The parameter Rstem is given by
where a1 is the correction factor for tree height (H) to water path length, Ksap is the stem hydraulic conductivity per unit sapwood area (), and Asap is the sapwood area of a tree (m2 sapwood area per tree), which is calculated from the DBH and diameter ratio of the heartwood relative to the entire stem (βheart, Table 1; Trugman et al., 2019b). The parameter Ksap can be expressed as a product of saturated xylem conductivity (Ksap,sat) and a factor representing the effect of xylem cavitation (Xu et al., 2016):
where P50 (MPa) is the water potential at which 50 % of the xylem conductivity is lost and a2 is an empirical parameter (dimensionless). The change in leaf water potential is governed by the equation
where Twhole is the whole-plant transpiration rate (kg H2O per tree per second), LA is the whole-plant leaf area (m2 leaf area per tree), and Cp is the plant capacitance (). The parameter Twhole is calculated by vertically integrating the product of the leaf-level transpiration rate and the leaf area in each crown layer. The leaf-level transpiration and photosynthetic rates and stomatal conductance are calculated using a leaf flux model of Bonan et al. (2014), where the stomatal conductance is estimated from an optimization approach of Cowan and Farquhar (1977) using the marginal water use efficiency (, where λ is the optimal water use efficiency (WUE), and An and E are the leaf net photosynthetic rate and the transpiration rate, respectively) and regulated by Ψl. See Note S4 in the Supplement for the detailed calculations of An and E, as well as the linkage to Ψl.
The processes for transpiration, photosynthesis, plant water uptake, and change in leaf water potential were computed in hourly time step (Fig. 2). Overall, high salinity increases sensitivity of the leaf water potential to plant transpiration (Eqs. 2 and 6), which in turn may cause stomatal closure even with a low transpiration rate. It also increases the optimal WUE value leading to lower stomatal conductance (Ball and Farquhar, 1984; Clough and Sim, 1989; Barr et al., 2014; Perri et al., 2019), thereby lowering the photosynthetic and transpiration rates.
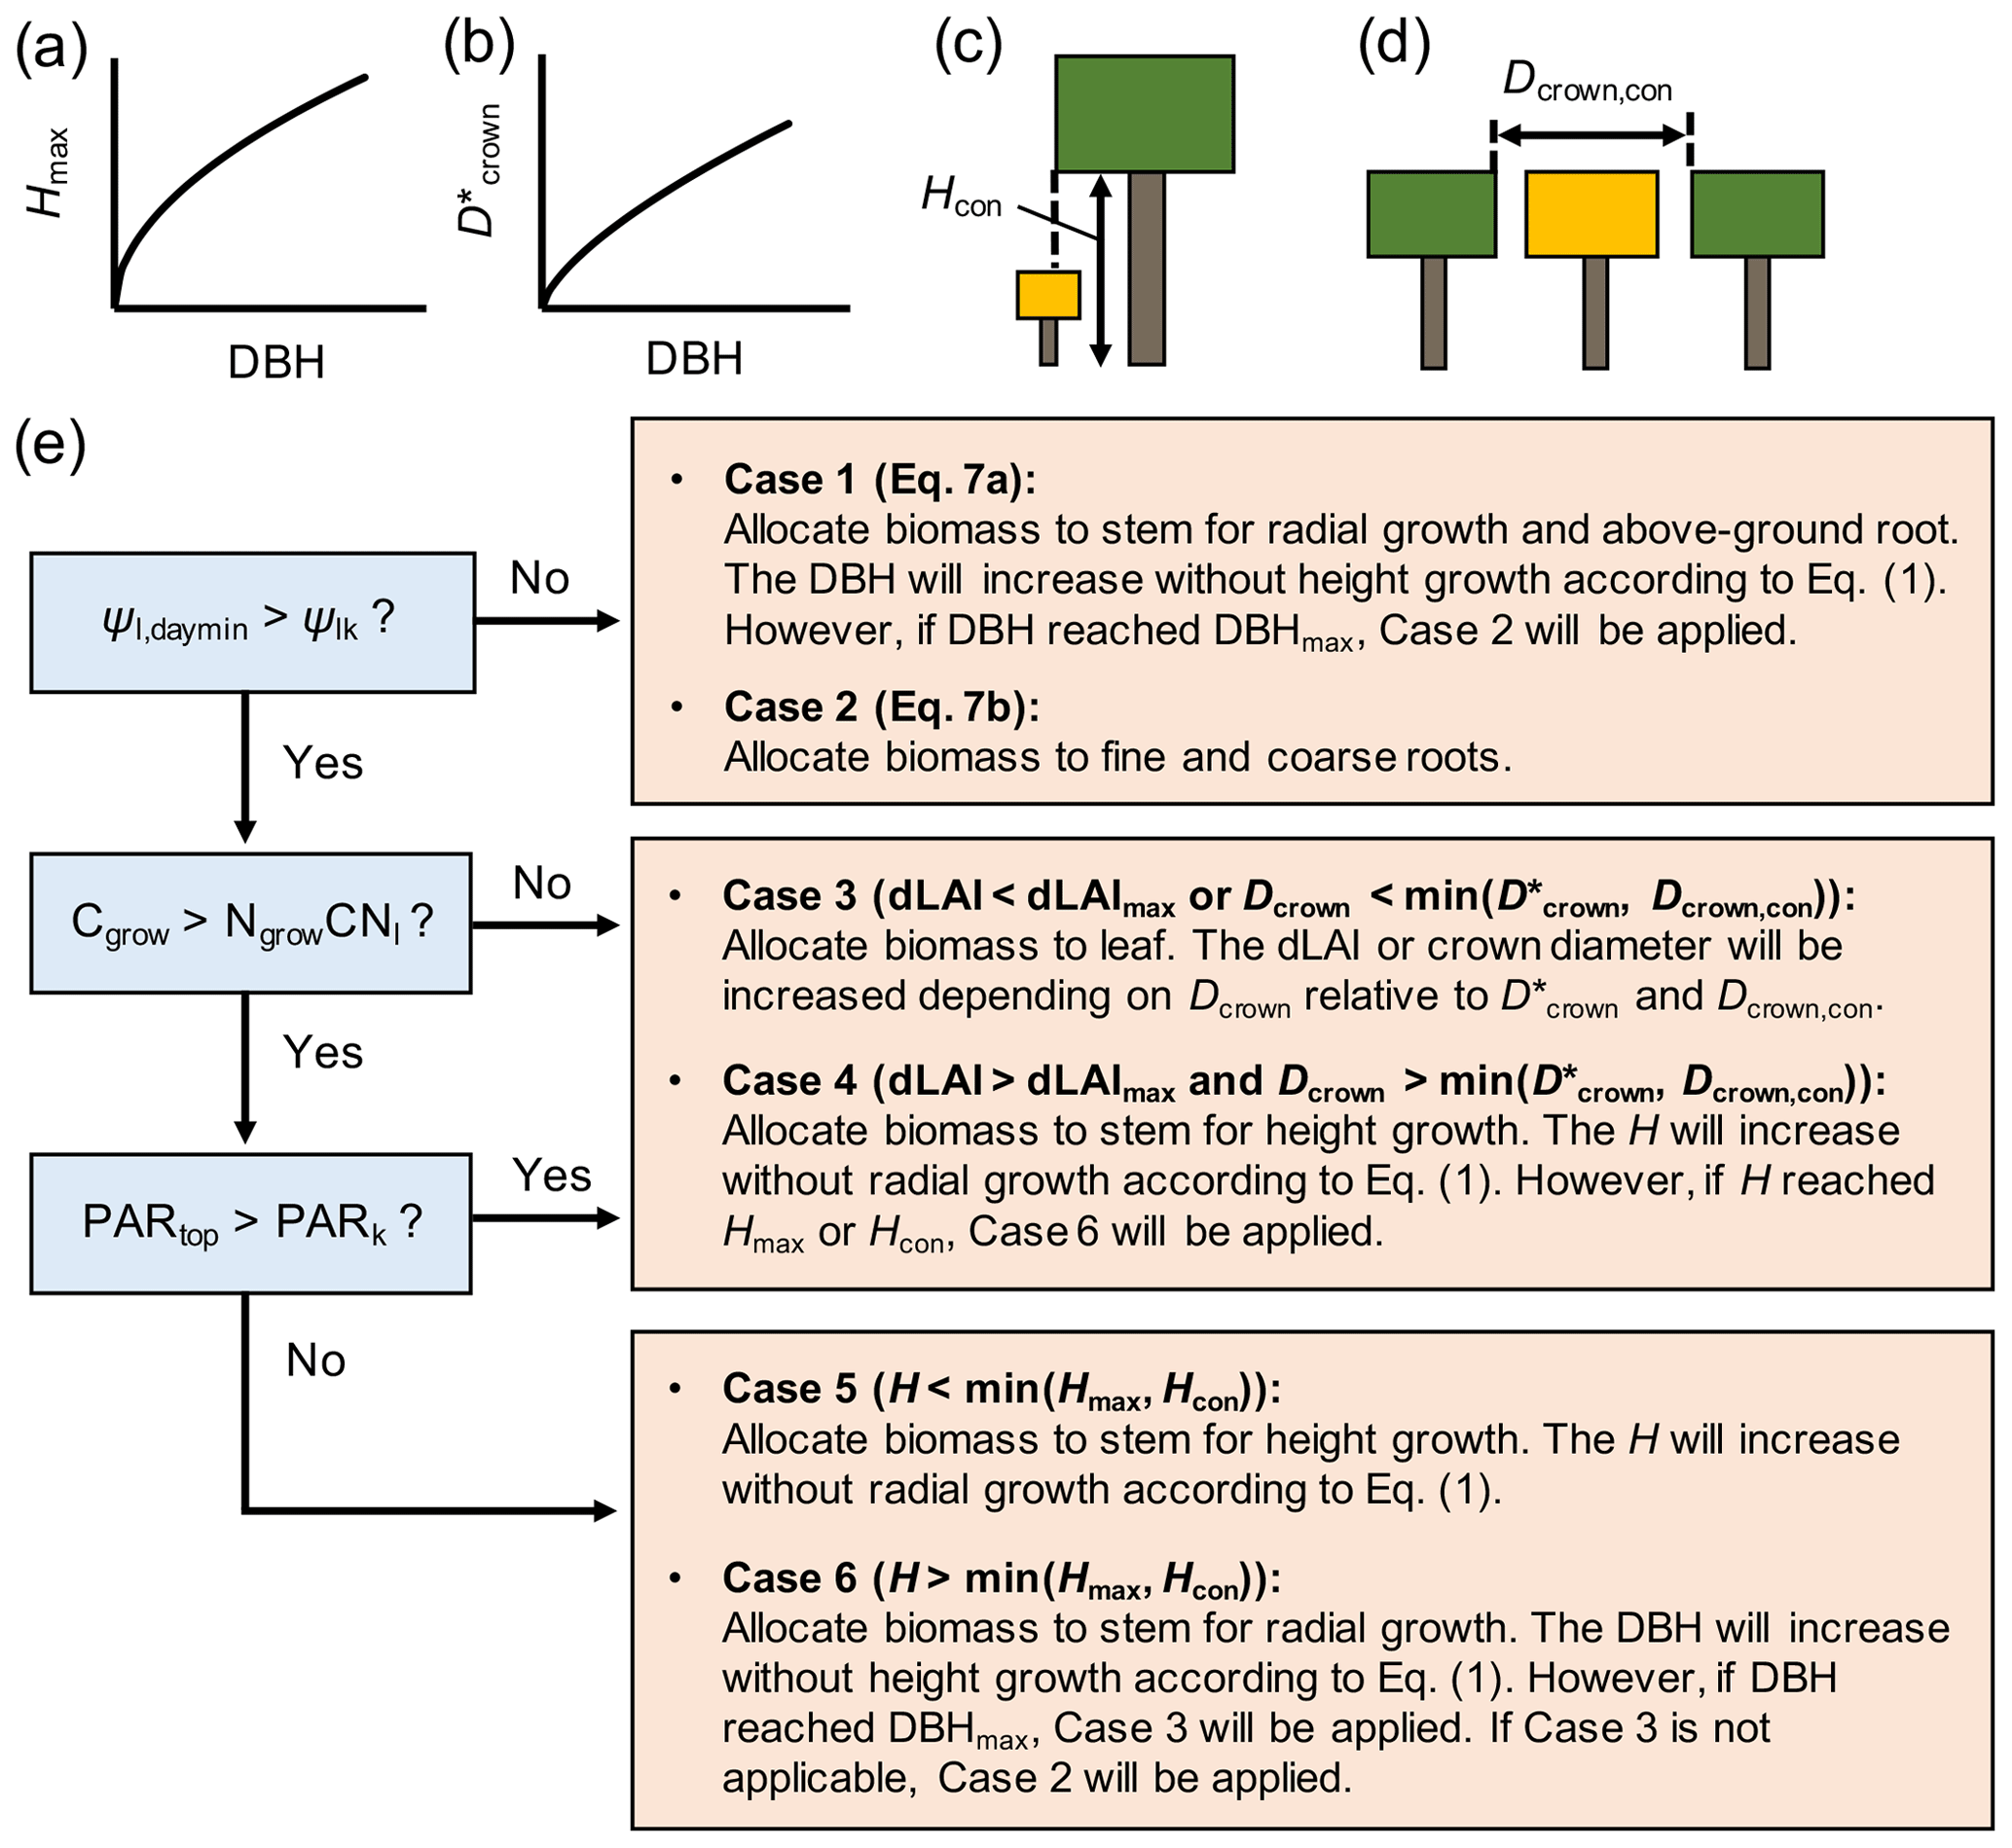
Figure 3Schematics of (a, b) allometric and (c, d) physical constraints on tree height (Hmax, Hcon) and crown diameter (, Dcrown,con), where the Hcon and Dcrown,con in panels (c) and (d) are for the tree with crown filled by yellow color and (e) the newly added biomass allocation scheme to SEIB-DGVM. See Note S1 for the derivation of allometric constraints from field data.
2.3.2 Inclusion of hydraulics and growth optimality-based biomass allocation
The biomass allocation occurs at the daily time step in the new biomass allocation scheme introduced in this study (Fig. 2). At each time step, four variables were considered for biomass allocation of individual trees – the daily C (Cgrow, g C per tree per day) and N (Ngrow, g N per tree per day) resources that can be used for tree growth, the daily minimum leaf water potential (Ψl,daymin, MPa), and the midday photosynthetically active radiation (PAR) at the crown top (PARtop, ). The Cgrow and Ngrow were computed from the daily C and N uptake rates, where the N uptake rate was calculated by multiplying the porewater DIN concentration and plant water uptake rate (see Note S5 in the Supplement for the detail). Biomass was allocated according to these variables to optimize the plant hydraulics and enhance the uptake rate of growth-limiting resource (C or N) under the constraints summarized in Table 1. Allometric and physical constraints were considered for H and Dcrown (Fig. 3a–d; see Note S1 in the Supplement for the derivation of the allometric constraints).
The parameters Cgrow and Ngrow are allocated to the respective biomass pools in a scheme shown in Fig. 3. We applied the concept that plants keep their favorable hydraulic conditions throughout the growth periods by adjusting the morphological structures (Magnai et al., 2000). In this regard, we introduced a parameter Ψlk – the critical leaf water potential (MPa) – at which plants aim to maintain their leaf water potential (note that Ψlk is different from Ψl,min at which plants close the stomata). It was then considered that when Ψl,daymin falls below Ψlk, the plant tries to reduce Rwhole by allocating biomass to either the fine root or stem, which reduces Rwhole more effectively (Case 1 and 2 in Fig. 3; note that decreases in Rstem and Rroot were expressed by a negative value):
where MFR,t and MS,t are the fine root and stem biomass (g per tree) at time step t (day), and dMFR and dMS are the daily biomass increment potential of fine root and stem (g per tree per day), respectively, which are limited by either of Cgrow and Ngrow and represented as
where CM is the carbon mass per unit dry weight in plant tissue (g C g−1 DW), Fgr is the growth respiration fraction, FCR,C and FCR,N are the fractions of Cgrow and Ngrow, respectively, to be allocated to the coarse root to realize βFR (target fine root biomass relative to coarse root; Table 1), FAR is the fraction of the resources to be allocated to the above-ground root to realize βAR (target prop root biomass relative to stem; Table 1, also see Fig. S3 in the Supplement) which was determined from an allometric model using DBH obtained in our study site by Yoshikai et al. (2021), and CNr and CNw are the CN ratios in fine root and woody tissue (g C g−1 N), respectively, that convert the unit of Ngrow to Cgrow. In Eq. (7), the is calculated from Eq. (3), while the dRstem/dMS is calculated from
where is obtained from Eq. (1) by calculating the increase in DBH with stem biomass increment dMS without height growth, and is given from Eqs. (4) and (5), where Ψl,daymin is used in Eq. (5). It should be noted that the variables Ψl,daymin, Cgrow, and Ngrow change with various factors including atmospheric and substrate variables and tree competition, and no absolute optimal biomass proportion achieves the condition = throughout the computational period. Also, due to the different CN ratios in fine root and woody tissues, the increment in stem biomass (dMS) with a unit N resource is greater than that of the fine root biomass (dMFR) under N-limited conditions (Eq. 8, Table 1).
Alternatively, if plants are not stressed by the lowered leaf water potential (Ψl,daymin > Ψlk), the resources are allocated to a plant organ that effectively increases the uptake rate of either C or N, limiting the growth rate. Under N-limited conditions, plants allocate biomass to the leaves to increase whole-plant transpiration capacity, which increases N uptake rate nearly proportionally (as suggested by Eq. S22 in the Supplement) (Case 3 in Fig. 3); this is considering that the limited uptake of N is due to the small transpiration rate rather than water uptake regulation by hydraulic resistance. The increase in leaf biomass increases Dcrown and dLAI (leaf area index per 1 m vertical height) depending on the crown diameter constraints ( and Dcrown,con; see Note S6 in the Supplement for the details). However, if the increase in leaf biomass is inhibited by dLAImax (maximum dLAI; Table 1) and crown diameter constraints, the resources are allocated to the stem for height growth, which in turn will make a new crown layer and eventually allow further leaf accommodation (Case 4 in Fig. 3). Under a C-limited condition, the limited C uptake rate may be attributed to low light availability or small whole-plant leaf area. In this regard, we introduced a criterion PARk, where the photosynthetic rate is reduced by half of the light-saturated photosynthetic rate, allowing the assumption that the limited C uptake rate is due to low light availability if PARtop is lower than PARk. In this case, the resources are allocated to the stem for height growth to acquire better light conditions under tree competition (Case 5 or 6 in Fig. 3); otherwise, the resources are allocated for an increase in leaf area (Case 3 or 4 in Fig. 3). Lastly, the residual Cgrow or Ngrow after the biomass allocation is allocated to the stock pool.
2.4 Simulation configuration
The model was applied to the Fukido mangrove forest to test its performance in reproducing the forest structural variables (species composition, mean DBH, and AGB). The model was forced with atmospheric variables (air temperature, relative humidity, atmospheric pressure, wind speed, and cloud fraction) and substrate conditions (soil salinity and porewater DIN). Direct and diffused solar radiation and longwave radiation were calculated in SEIB-DGVM from the given variables such as cloud fraction, air temperature, and latitude (Sato et al., 2007). The atmospheric variables for the Fukido mangrove forest given to the model were derived from a global reanalysis product JRA-55 (Kobayashi et al., 2015). For long-term simulation (i.e., more than 100 years), the yearly atmospheric variation in 2013, a year when the field data collection was conducted, was repeatedly given in the simulation.
Simulations with different soil salinity, or the “salinity gradient simulation”, which varied from 18 ‰ to 36 ‰ with 2 ‰ intervals, were conducted to reproduce the forest structural variables across a soil salinity gradient. For the porewater DIN, a spatially averaged DIN (average of DIN measured at the survey plots: 200 µmol L−1) was given to the model as the representative value of the porewater DIN in this forest. In each simulation, soil salinity and the porewater DIN were set as constant due to lack of data and model on the temporal variations in substrate conditions. We also conducted “plot-wise simulation”, or the simulation for each survey plot, by giving the measured soil salinity and porewater DIN at each plot. Note that the results shown in this paper are from the salinity gradient simulation; the results of the plot-wise simulation are provided in Fig. S5 in the Supplement and discussed later.
The initial condition was set as bare land (no vegetation) for all simulations. Tree establishment occurs at 1 m × 1 m grid cells at a yearly time step according to light condition at the forest floor and a parameter of establishment probability (Pestablish, ) prescribed for each species (Sato et al., 2007). The species that will establish at a grid cell is determined according to a fraction of total biomass of each species in the computational domain such that a species occupying a larger fraction has a higher probability of establishment. On the other hand, it is sometimes randomly determined by a probability Estrandom, where the value of Estrandom was set to 0.05 in this study. This corresponds to Scenario 4 in the tree establishment scheme in SEIB-DGVM (see Sato, 2015, for the details). We followed Sato et al. (2007) for the initial conditions (tree morphology and biomass proportion) of the established trees.
The SEIB-DGVM uses stochastic models for the processes of tree establishment and mortality, and for this reason the result of a simulation varies every time. In this regard, we conducted ensemble simulations (20 runs) for each soil salinity in the salinity gradient simulation and extracted the general trends.
Table 2Model parameters related to plant hydraulics and productivity.
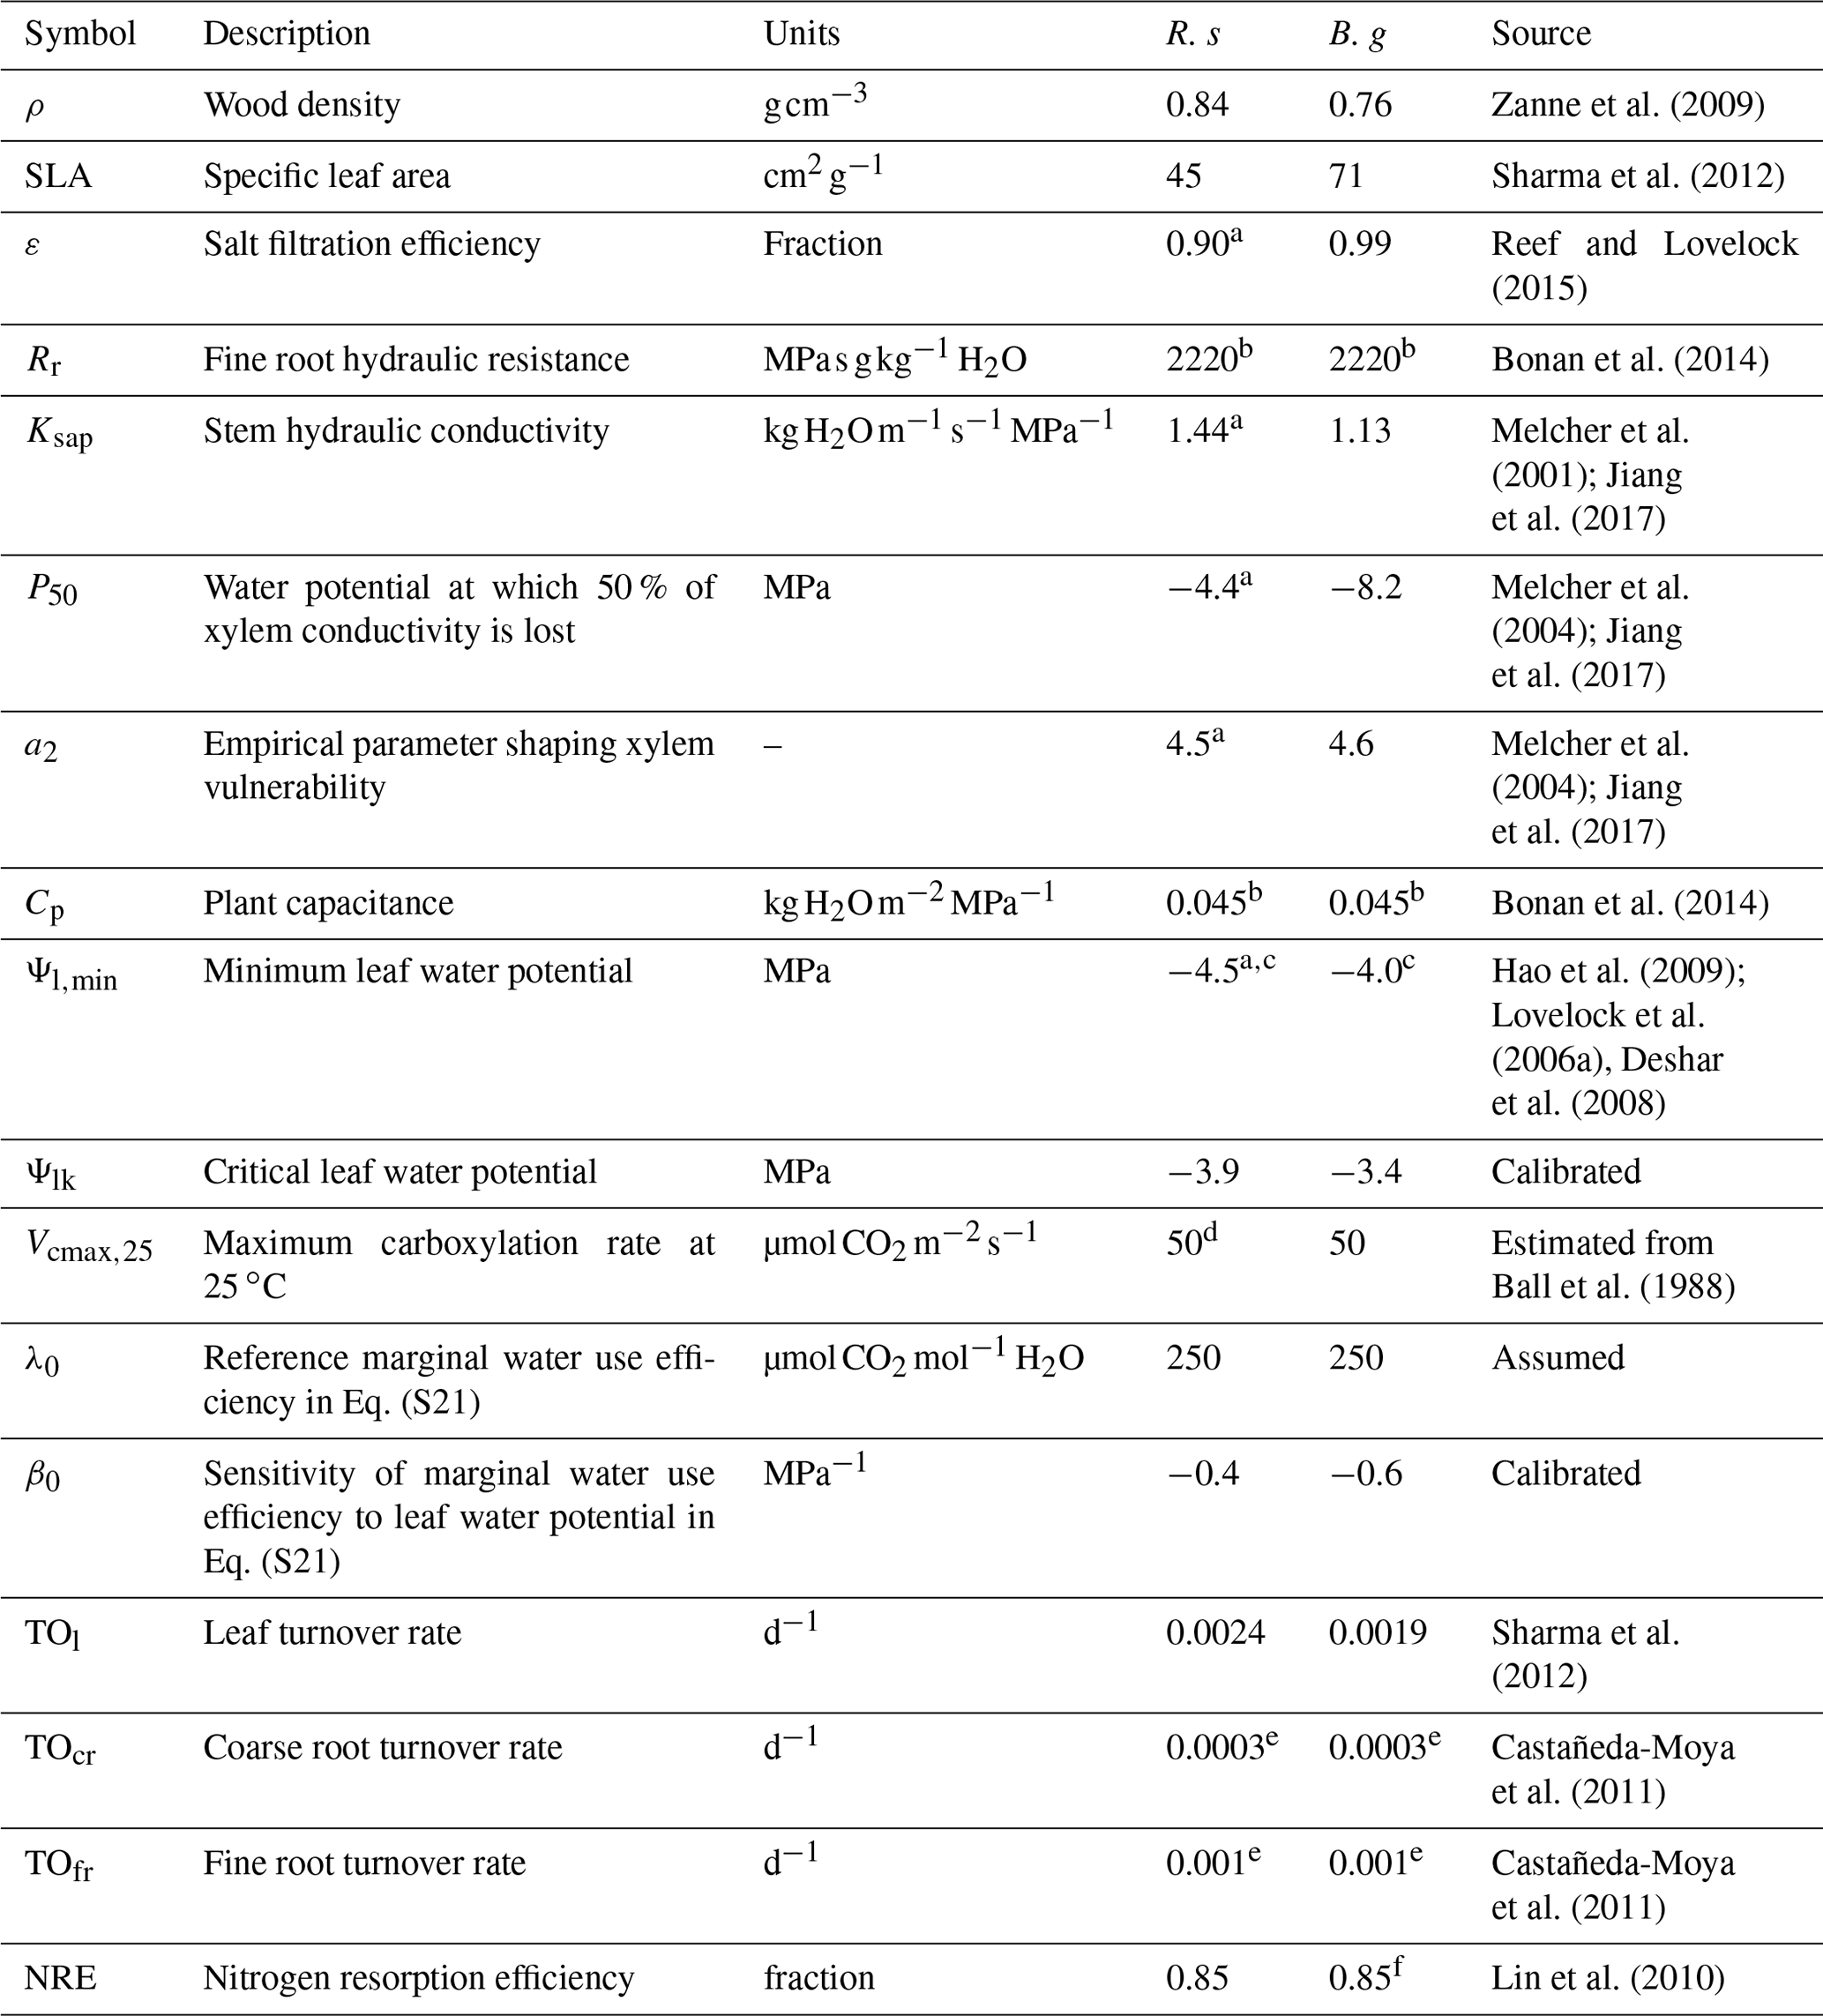
R. s: R. stylosa; B. g: B. gymnorrhiza.
a Value for Rhizophora mangle. b The value used for terrestrial forest ecosystem was applied due to lack of information. c The minimum of the reported values was adopted. d Value for Rhizophora apiculata. e The average value of data in Castañeda-Moya et al. (2011) was adopted. f Value for Rhizophora stylosa.
The model parameter settings related to plant hydraulics and productivity are summarized in Table 2. Other minor model parameters are summarized in Table S2 in the Supplement. The parameter values for the two species in the Fukido mangrove forest, R. stylosa and B. gymnorrhiza, were determined based on literature. If the data for a focal species were unavailable from the literature, the data from the genus or family were applied. Some parameter values were adapted from other mangrove genus or terrestrial ecosystems, and in this case, the same value was given to the two species (Table 2). The values of two plant hydraulic trait parameters – Ψlk (critical leaf water potential) and β0 (sensitivity of marginal WUE to leaf water potential in Eq. S21 in the Supplement; see Note S3) – were calibrated to reproduce the AGB and mean DBH of each species across the soil salinity gradient.
The Fukido mangrove forest's age is unknown, which makes the comparison between the model and field data difficult. However, considering that it is an old and mature forest intact at least since 1977 (Ohtsuka et al., 2019), we assumed that the forest structural variables of the Fukido mangrove forest are in steady states. We conducted long-term simulations for 450 years with this assumption, and we extracted the modeled DBH and AGB in steady states (> 300 years) and compared them with the field data.
Lastly, we performed sensitivity analysis of the plant hydraulic trait parameters (ε, P50, Ψlk, and β0) to see the relative importance of each parameter in reproducing the observed pattern of the forest structure, specifically AGB, across the soil salinity gradient. We changed the value of a target parameter of one species (either R. stylosa or B. gymnorrhiza) to the one determined for the other species, which is shown in Table 2, and ran the salinity gradient simulation. Note that to examine the sensitivity to Ψlk, we changed the values of Ψlk and Ψl,min to keep the buffer between the two parameter values. Also, to save on computational cost, we run only one simulation for each sensitivity test instead of the ensemble approach described above. Model sensitivities are shown in Fig. S6 in the Supplement.
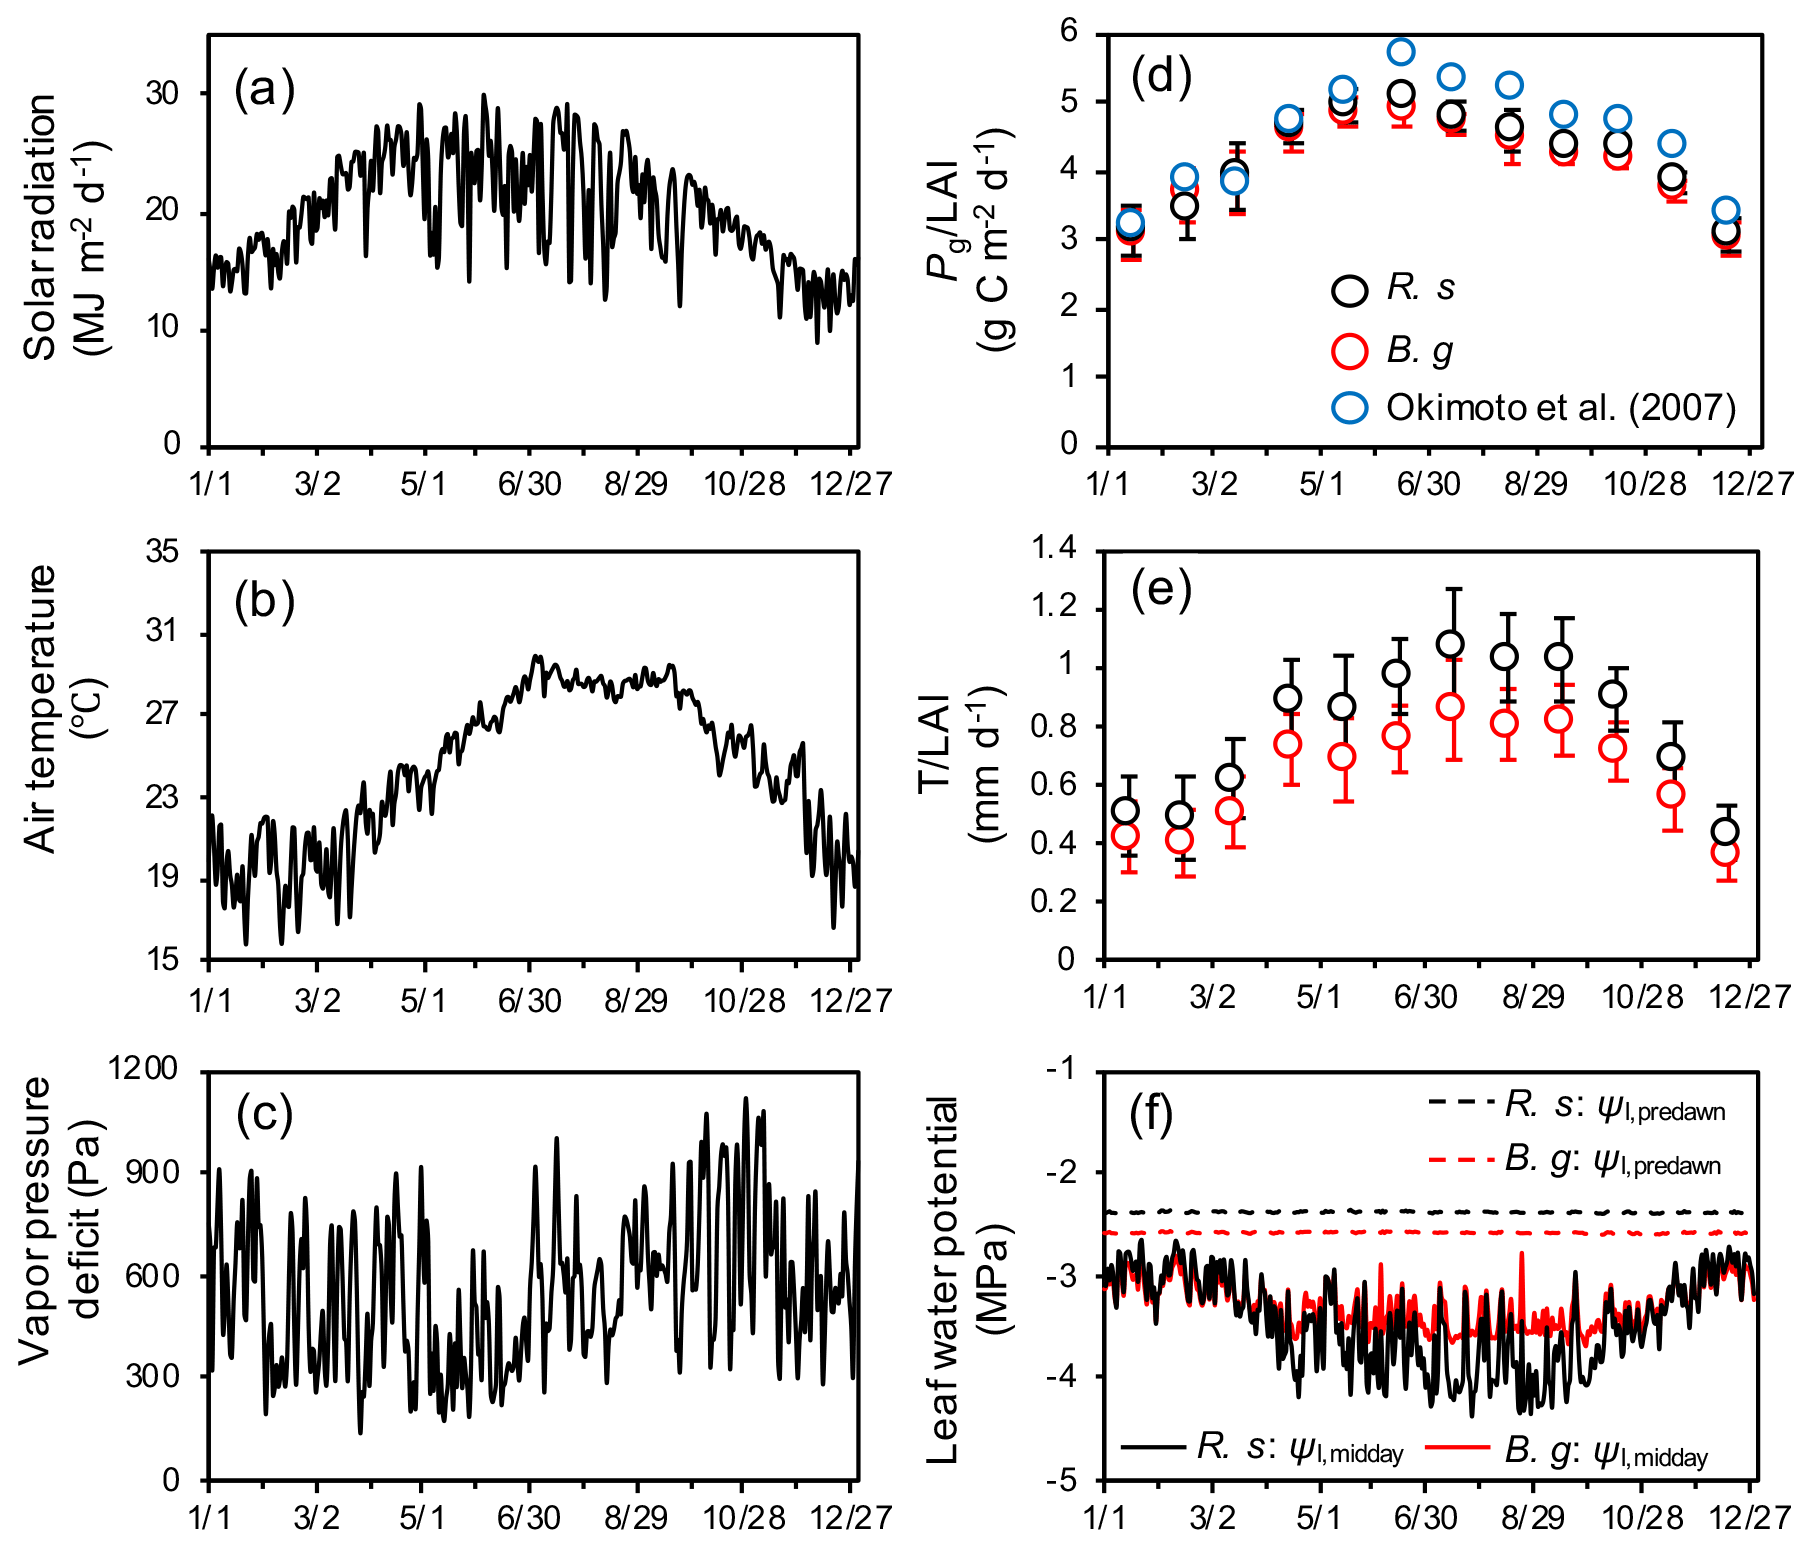
Figure 4Seasonal variations in atmospheric forcing variables: (a) solar radiation, (b) air temperature, and (c) vapor pressure deficit (VPD). Modeled seasonal dynamics: (d) monthly mean and standard deviation of species-specific gross photosynthetic rate (Pg, g C per square meter ground per day), (e) transpiration (T, mm d−1) normalized by leaf layer index (LAI, m2 m−2) of the respective species, and (f) midday (Ψl,midday) and predawn (Ψl,predawn) leaf water potential of each species. R. s: R. stylosa; B. g: B. gymnorrhiza. Solar radiation is expressed as daily sum, while air temperature and VPD are expressed as daily mean. The leaf water potential shown is the median value of individuals. Here, the modeled dynamics are from a simulation of soil salinity set as 30 ‰, and the results of a year when LAI reached 1.55 are shown. At this time, the LAIs of R. stylosa and B. gymnorrhiza are 0.87 and 0.68, respectively. In panel (d), seasonal variations in measured by Okiomoto et al. (2007) are also shown as reference, the data of which are from an area with LAI = 1.55 in the Fukido mangrove forest in 2000–2001.
3.1 Modeled seasonal and diurnal dynamics
Seasonal variations in atmospheric forcing variables and modeled species-specific gross photosynthetic rate (Pg) and transpiration (T) normalized by the leaf area index (LAI) and midday (Ψl,midday) and predawn (Ψl,predawn) leaf water potential are shown in Fig. 4. The modeled variables are from one of the ensemble simulations with soil salinity set as 30 ‰. The model demonstrated strong seasonality in photosynthesis and transpiration primarily due to seasonality in solar radiation and air temperature. The model predicted the peak of in June, with values ∼ 5.1 and 4.9 for R. stylosa and B. gymnorrhiza, respectively, and the peak of in July–September, with values ∼ 1.07 and 0.85 mm d−1 for each species, respectively. The and were predicted to be depressed during winter (December–February), with values ∼ 3.0 for both species and ∼ 0.43 and 0.36 mm d−1 for each species, respectively. We compared the modeled leaf-level Pg with the field-estimated values in the Fukido mangrove forest by Okimoto et al. (2007). Their measurements were conducted in an area where the LAI is 1.55, the same LAI as the one shown in Fig. 4d; thus, the effects of LAI on leaf-level Pg could be eliminated for comparison. Although the modeled of both species is slightly lower than the one obtained by Okimoto et al. (2007) (∼ 1.0 ), especially from June to August, overall, the model agreed well with their results.
The midday leaf water potential showed seasonal variations as with photosynthesis and transpiration (Fig. 4f). Due to the partial salt uptake of R. stylosa (as indicated by the lower ε value of this species, Table 2) that alleviates the osmotic potential difference between the soil and plant, the predawn leaf water potential of R. stylosa was constantly higher than that of B. gymnorrhiza (Fig. 4f). Rhizophora stylosa also showed larger magnitude of leaf water potential reduction at midday during summer compared to B. gymnorrhiza and higher leaf-level transpiration rate (Fig. 4e and f). During winter, due to the lowered transpiration rate, the leaf water potential reduction at midday was resultantly alleviated compared to summer.
Diurnal variations of the simulated photosynthesis, transpiration, and leaf water potential of the two species during summer and winter under two different salinity conditions (30 ‰ and 24 ‰) are shown in Fig. 5. Compared to 24 ‰ salinity, both species showed significantly lowered leaf-level transpiration rates under 30 ‰ salinity especially during summer (Fig. 5b and e), suggesting downregulation of stomatal conductance under high-soil-salinity conditions. On the other hand, the decrease in leaf-level photosynthetic rates was not significant (Fig. 5a and d). The leaf water potential during nighttime was lower when soil salinity was 30 ‰ compared to conditions when salinity was 24 ‰, due to the different osmotic potential in soil porewater. The leaf water potential, however, showed almost the same levels at midday during summer, which were close to the values of Ψlk determined for each species (Fig. 5c, Table 2). The reduction in leaf water potential to the level of Ψlk suggests the role of dynamic biomass allocation, which adjusts the whole-tree transpiration demands and hydraulic conductivity, in constraining the leaf water potential dynamics (Fig. 3). In contrast, the diurnal dynamics in leaf water potential during winter showed similar magnitude of reduction of the water potential at midday between the two soil salinity conditions (Fig. 5f).
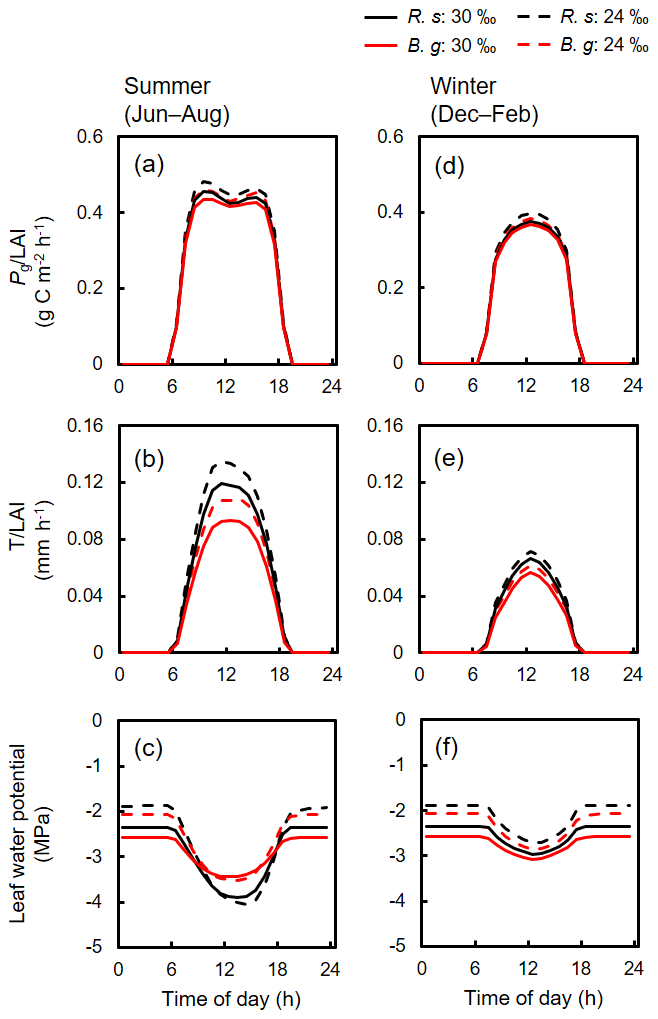
Figure 5Simulated averaged diurnal variations in (a, d) photosynthesis and (b, e) transpiration of R. stylosa (R. s) and B. gymnorrhiza (B. g) normalized with LAI of the respective species, and (c, f) leaf water potential of the two species for summer (June–August) and winter (December–February) under two soil salinity conditions (30 ‰ and 24 ‰). The variations under 30 ‰ soil salinity correspond to the results shown in Fig. 4. The variations under 24 ‰ soil salinity are from the results of a year that showed the same LAI (1.55). The diurnal variations in leaf water potential were derived based on the median value of individuals.
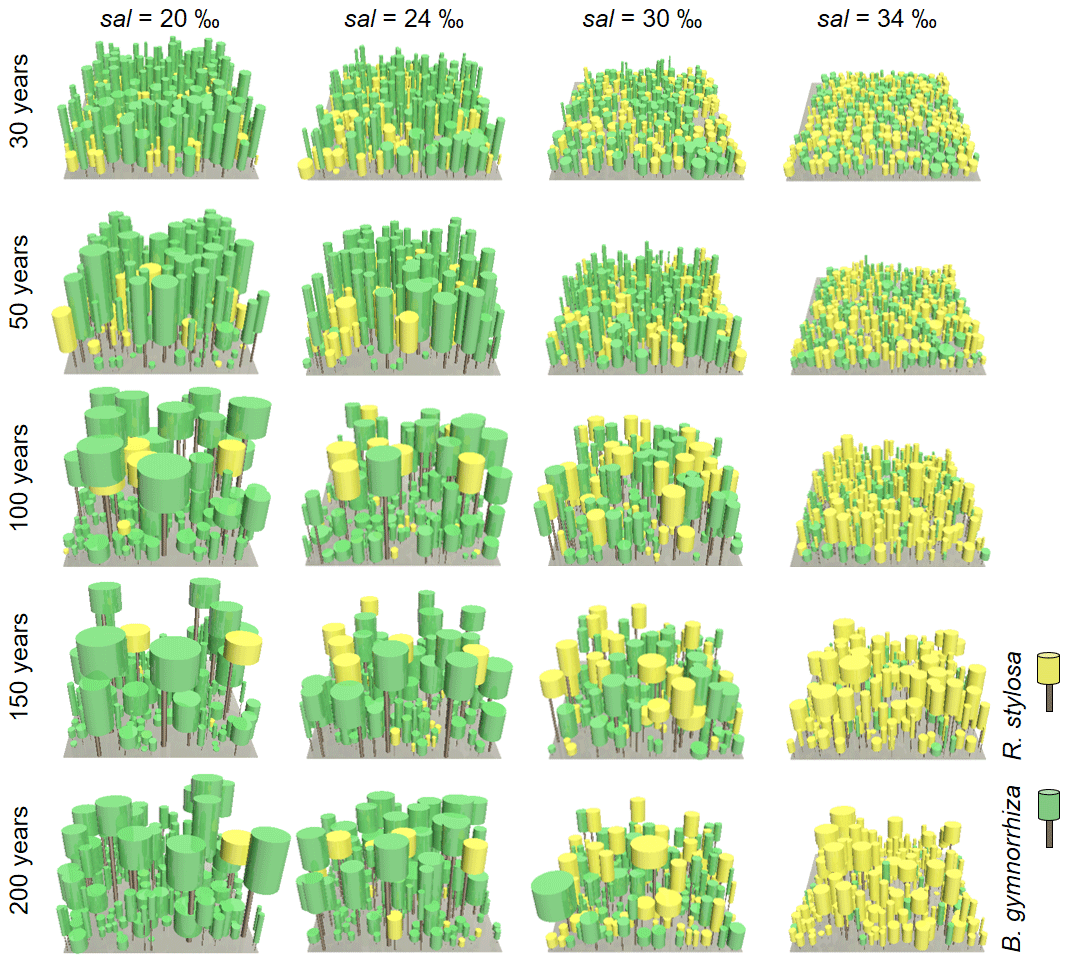
Figure 6Visualization of forest structures over 200 years under different soil salinity (sal), 20 ‰, 24 ‰, 30 ‰, and 34 ‰, taken from one of the ensemble simulations. The brown-colored objects represent the stem while the yellow- and green-colored objects represent the crowns of R. stylosa and B. gymnorrhiza, respectively. The forest floor shown is the 30 m × 30 m wide computational domain.
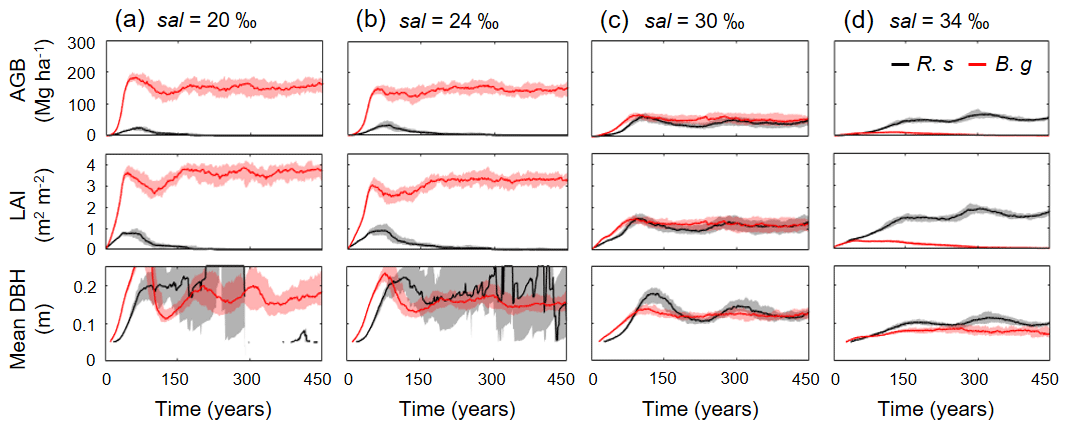
Figure 7Temporal dynamics in above-ground biomass (AGB), leaf area index (LAI), and mean diameter at breast height (DBH) of R. stylosa (R. s) and B. gymnorrhiza (B. g) in four soil salinity conditions: (a) 20 ‰, (b) 24 ‰, (c) 30 ‰, and (d) 34 ‰. Note that trees with DBH < 0.05 m were not included in the calculation of mean DBH. Solid lines show median and shading the 90th percentile from ensemble simulations.
3.2 Modeled biomass dynamics under different soil salinity
Figure 6 shows the changes in the forest structures for over 200 years under different soil salinity conditions, 20 ‰, 24 ‰, 30 ‰, and 34 ‰, from one of the ensemble simulations (the present-day average soil salinity of the survey plots is 28 ‰). The time-series results of AGB, LAI, and mean DBH of the two species are shown in Fig. 7. Trees with DBH < 0.05 m were not accounted for in the calculation of the mean DBH because it is sensitive to the presence of small trees. Overall, the model demonstrated the significant influence of soil salinity on species composition and forest structure.
The model predicted that B. gymnorrhiza dominates over R. stylosa when soil salinity is 20 ‰ or 24 ‰ (Fig. 7a and b). Under soil salinity of 20 ‰, the AGB of B. gymnorrhiza exponentially increased up to 200 Mg ha−1 after 60 years since the initial condition. It slightly decreased after that and was kept almost constant at 175 Mg ha−1 after 150 years. The LAI of this species showed almost the same trend with AGB, while the mean DBH showed fluctuation especially in the first 200 years (Fig. 7a). The sudden decrease in the mean DBH is attributed to the onset of formation of forest gaps resulting from deaths of large B. gymnorrhiza trees that promoted the establishment of small trees (Fig. 6). After the decrease in the mean DBH, it gradually increased again and saturated at 0.17 m (Fig. 6a). Alternatively, the AGB and LAI of R. stylosa were significantly lower than B. gymnorrhiza, with its peak at only 25 Mg ha−1 and 1 m2 m−2, respectively. This can also be seen in the decreasing number of R. stylosa trees subsequent to forest growth (Fig. 6). In contrast to AGB and LAI, the mean DBH of R. stylosa reached around 0.2 m after 75 years, as large as that of B. gymnorrhiza in steady state (Fig. 7a). This suggest that some R. stylosa trees can grow until mature conditions (see also Fig. 6), while trees of this species with DBH > 0.05 m disappeared in all ensemble simulations after 300 years (Fig. 7a). The trees of R. stylosa sometimes emerge due to the random factor in the establishment process, but most of the trees did not grow more than DBH of 0.05 m in the canopy of B. gymnorrhiza.
The trend in forest growth under 24 ‰ salinity was similar to that of 20 ‰ (Figs. 6 and 7b) but showed a slightly lower and higher peak for B. gymnorrhiza and R. stylosa, respectively, of the AGB, LAI, and mean DBH. This suggests decreased productivity of B. gymnorrhiza compared to 20 ‰ soil salinity and increased productivity of R. stylosa albeit with the increase in soil salinity. The survival rate of R. stylosa was higher than the results for 20 ‰, resulting in the high mean DBH of this species throughout the simulation period (Fig. 7b).
When the soil salinity was 30 ‰, the AGB of B. gymnorrhiza significantly decreased compared to the results for 20 ‰ and 24 ‰ salinities, becoming equivalent to those of R. stylosa (Fig. 7c). The LAI and mean DBH also showed a significant decrease, suggesting significantly lowered productivity of B. gymnorrhiza. The AGB and LAI of R. stylosa significantly increased compared to the results for 20 ‰ and 24 ‰, but the mean DBH significantly decreased.
The model predicted that B. gymnorrhiza cannot grow well at 34 ‰ soil salinity and that R. stylosa dominates under this salinity condition (Figs. 6 and 7d). Despite the further decrease in AGB, LAI, and mean DBH of B. gymnorrhiza, those of R. stylosa showed almost the same level for these parameters at 30 ‰ soil salinity.
3.3 Comparison between modeled and field-measured forest structural variables
Figure 8 shows the field-measured and modeled mean DBH and AGB of R. stylosa and B. gymnorrhiza across the soil salinity gradient. The field data clearly showed the effects of soil salinity on forest structural variables – decrease in mean DBH for both species and decrease in AGB of B. gymnorrhiza but increase in AGB of R. stylosa with increasing soil salinity. The model reproduced well the said patterns across the soil salinity gradient, and the values are within or close to the field data variations (Fig. 8). The change in species composition is also well reproduced, suggesting that the model can reproduce the forest structural variables across the soil salinity gradient.
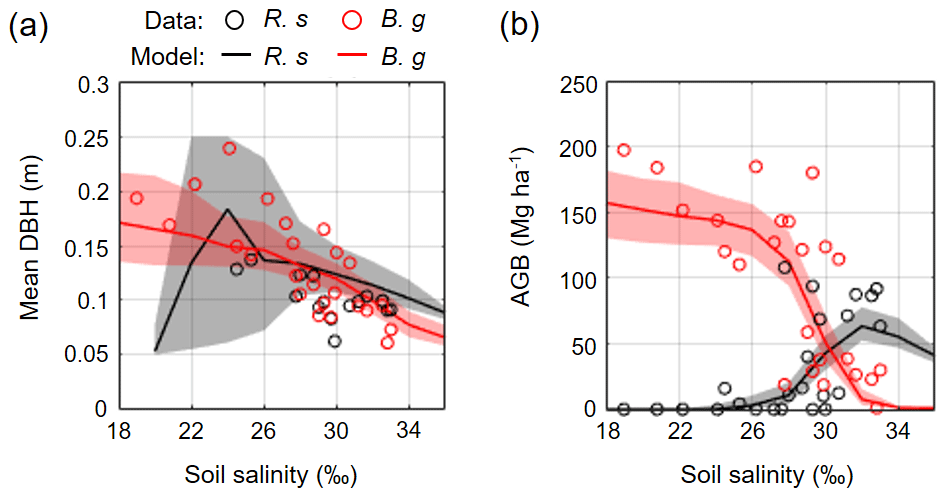
Figure 8Comparison of field-measured and modeled (a) mean DBH and (b) AGB of R. stylosa and B. gymnorrhiza along with soil salinity gradient. From each ensemble simulation, modeled mean DBH and AGB in steady states (> 300 years) were extracted and pooled for all ensembles, and the median (solid line) and the 90th percentile (shading) of the pooled samples are shown. Note that trees with DBH < 0.05 m were not included in the calculation of the mean DBH.
Figure 9 shows the field-measured and modeled relationship of tree density and mean individual stem biomass. Although there are some discrepancies between the model and field data especially for soil salinity conditions > 30 ‰, the model reproduced the overall pattern of the field data.
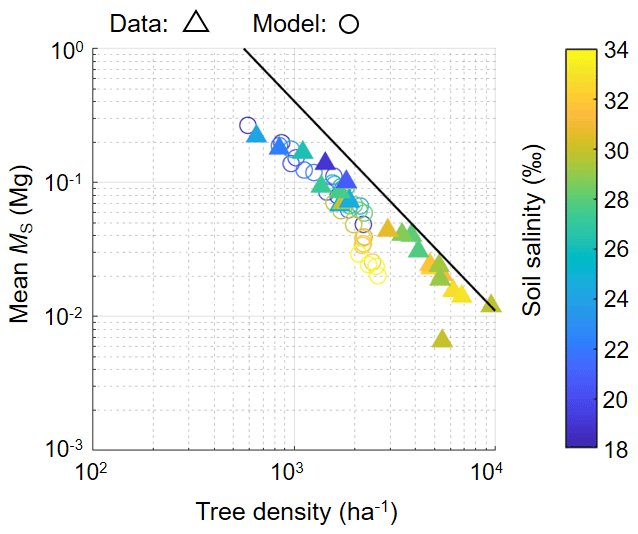
Figure 9The relationship of tree density and mean individual stem biomass (MS). Triangles show field data while circles show modeled values from one of the ensemble simulations with different soil salinity settings (from 18 ‰ to 34 ‰ with 2 ‰ increments) plotted from 300–450 years (with interval of 50 years), which are in steady states in terms of forest structural variables (see Fig. 7). Note that trees with DBH < 0.05 m were not counted in calculating tree density and mean MS. The line represents the full density curve proposed by Tabuchi et al. (2013): y = 20 389x−1.567.
4.1 Model performance
Forest growth is influenced by leaf-level and whole-plant CO2, water and nutrient fluxes, and forest-scale tree competition, which are all interconnected. The leaf-level fluxes were simulated using a well-established stomatal optimization scheme with the marginal WUE linked with leaf water potential (Bonan et al., 2014; Xu et al., 2016). The model predicted the distinct seasonal dynamics in photosynthesis and transpiration as well as leaf water potential in the Fukido mangrove forest (Figs. 4 and 5). The modeled seasonal variations in leaf-level photosynthesis () agreed well with the one measured by Okimoto et al. (2007) in this forest (Fig. 4d). Although there are no data on the seasonal variations in transpiration in this forest, studies on other subtropical mangrove forests, such as the Everglades National Park, Florida (Barr et al., 2014), and China (Liang et al., 2019), that incorporated the eddy-covariance approach also showed strong seasonality in transpiration, similar to the one predicted for the Fukido mangrove forest in this study (Fig. 4e). The evapotranspiration rate normalized by LAI in the Everglades measured by Barr et al. (2014) was 0.4–1.2 mm d−1, which is close to the variation of the modeled in the Fukido mangrove forest (Fig. 4e). These results suggest that the model produced realistic seasonal dynamics for transpiration in the Fukido mangrove forest.
Tree growth was driven by C and N uptake rates in the developed model resulting from the leaf-level and the whole-plant CO2 and water fluxes. The modeled growth rates at a soil salinity condition where B. gymnorrhiza is the dominant species (sal < 28 ‰) showed close values to the ones measured by Ohtsuka et al. (2019) at a B. gymnorrhiza-dominated site in the Fukido mangrove forest (Fig. S4 in the Supplement). This suggests that the model also reasonably predicted the growth rate of each species in addition to the leaf-level CO2 and water fluxes.
This model also showed reasonable reproducibility of the self-thinning process arising from tree competition. This was inferred from the decrease in tree density with the increase in individual tree biomass patterns based on the agreement of the measured and modeled tree density-mean MS relationship, except for those with soil salinity > 30 ‰ (Fig. 9). An exponent value close to was obtained, similar to what is observed in the Fukido mangrove forest (Suwa et al., 2021; Fig. 9) and in many mangrove forests as well (e.g., Analuddin et al., 2009; Deshar et al., 2012; Khan et al., 2013; Tabuchi et al., 2013; Azman et al. 2021). This was achieved by implementing the species-specific morphological traits especially the DBH– relationship (Fig. 3b; see also Note S1 and Fig. S1). The underestimation trend of modeled tree density at high soil salinity (> 30 ‰) where R. stylosa starts to dominate (Fig. 9) may be attributed to the inaccurate representation of the crown morphological trait of this species, which generally gives larger compared to observed values (see Note S1 and Fig. S1c). Basically, the crown diameters of individuals determine the tree accommodation spaces, and therefore the overestimated crown diameter may have resulted in the underestimation of the tree density. Crown size representation could be a factor that drives a large part of the uncertainty in DVMs (Meunier et al., 2021). Nevertheless, the data are remarkably scarce in the case of mangroves. The morphological traits of crown size should be investigated in future studies for a more realistic representation of mangroves' tree competition and forest dynamics in the model. It is also important to note that some variables of model prediction such as LAI, shoot / root biomass ratio, morphological plasticity in accordance to changes in environmental variables (as shown in Fig. S7 in the Supplement), and leaf water potential dynamics have not been validated due to lack of data, and future research is needed to address these aspects.
Overall, this is the first modeling study to introduce detailed physiological and mechanistic representations of the mangrove forest growth controlled by photosynthesis, water and nutrient (represented by DIN) uptake, and tree competition, and it is a realistic or accurate reproduction of mangrove growth processes. The remarkable agreement of modeled forest structures with field data across a soil salinity gradient validated our hypothesis – individual-based DVM incorporating plant hydraulic traits can reasonably predict mangrove growth processes under salt stress without empirical expression of the soil salinity influence on mangrove productivity. However, the model still does not account for the plant-to-soil feedback through water uptake, which has been identified by a mangrove-growth–groundwater-flow coupled model (Bathmann et al., 2021) as an important factor affecting both mangrove and substrate conditions (soil salinity). Alternatively, the said model also demonstrated that the forest structural variable and soil salinity dynamics could reach steady states after some time from the initial condition, a setting that is considered to describe the Fukido mangrove forest (Ohtsuka et al., 2019). Our modeling results, which did not include the plant-to-soil feedback, therefore may be valid only for the steady states and still hold uncertainty in the developmental stage. This further implies that model application may be limited only to mature mangrove forests, and further model improvement is needed for its application to forests during the developmental stage (after plantation) or during the recovery stage (after disturbances such as typhoons and deforestation).
4.2 Soil salinity and interspecific competition shaping the forest structural variables
Overall, the model explained that the changes in mean DBH and AGB of the two coexisting species with change in soil salinity are due to the difference in their salt tolerance and interspecific competition (Figs. 7 and 8). While the model predicted the contrasting changes of AGB of the two species, both species showed a decrease in productivity with an increase in soil salinity as seen in the monotonic decrease in DBH (Figs. 7 and 8). This decrease in productivity can be partly explained by the downregulation of stomatal conductance under high-soil-salinity conditions (Fig. 5). In addition, the changes in the biomass allocation pattern that increased the allocation to the stem and roots relative to leaves with an increase in soil salinity have influenced productivity (Fig. S7) – a pattern that reduced the whole-plant photosynthesis and transpiration and increased the carbon (through the stem and root respiration and root turnover) and nitrogen (through the root turnover) cost relative to the unit leaf area. It should be noted that such morphological plasticity with changes in soil salinity predicted by the model qualitatively agrees with the implications by other studies (e.g., Suwa et al., 2008, 2009; Vovides et al., 2014; Nguyen et al., 2015; Chatting et al., 2020), but future studies are needed for quantitative and systematic validation.
The sensitivity analysis of the plant hydraulics trait parameters provided some insights into the different salt tolerance of the two species that shaped the forest structures along the soil salinity gradient (Fig. S6). For example, it showed the substantial contribution of the partial salt uptake of R. stylosa, represented by the lower ε, to the salt tolerance of this species (Fig. S6a) at the possible expense of higher P50 value (Table 2, Fig. S6c and d), which is considered as the coordinated functional traits (Jiang et al., 2017). The model showed the highest sensitivity to the parameters Ψlk and Ψl,min (Fig. S6e and f), suggesting that the mangroves' capacity to reduce the leaf water potential is one of the most important functional traits characterizing their salt tolerance, as suggested by Reef and Lovelock (2015). The response of AGB to changes in Ψlk, a parameter controlling biomass allocation pattern, also indicates the substantial impact of biomass allocation dynamics influenced by salinity on plant productivity. On the other hand, the model showed minimal sensitivity to β0 (Fig. S6g and h). While the higher stomatal conductance of R. stylosa than B. gymnorrhiza (as shown in Figs. 4 and 5) qualitatively agreed with the implications by Clough and Sim (1989) and Reef and Lovelock (2015), the model results suggested that the choice of −0.6 for β0 already leads to efficient stomatal openings for photosynthesis compared to the case of −0.4 for β0 (Table 2). This may explain the small variations in the simulated leaf-level photosynthetic rates between the two species and among the different soil salinity levels (Figs. 4 and 5). Understanding the mangroves' stomatal behavior relative to soil salinity and covariation of leaf water potential and photosynthesis have not been well established from field data (Perri et al., 2019). Further field-based research and data implementation to the model are needed for better and more reliable representation of mangroves' stomatal conductance and associated regulation of photosynthesis under salt stress.
The model specifically predicted that B. gymnorrhiza competes over R. stylosa when soil salinity is favorably low for the growth of B. gymnorrhiza (sal < 28 ‰), an observation that is consistent with our field data and the data from other mangrove forests (Putz and Chan, 1986; Enoki et al., 2014). This result may be attributed to the following model parameter settings based on literature – higher wood density (ρ), smaller specific leaf area (SLA), and higher leaf turnover rate (TOl) of R. stylosa than B. gymnorrhiza (Table 2). Higher ρ indicates the requirement of higher biomass increase for the height or radial growth of the stem. Smaller SLA and higher TOl indicate the higher requirement of C and N to produce new leaf tissues or to keep the same amount of leaves, i.e., the need of R. stylosa for more C and N resources for growth compared to B. gymnorrhiza. The biomass requirement of prop roots, which lowers the biomass allocation to the stem (Fig. S3), and the smaller of R. stylosa compared to B. gymnorrhiza (Fig. S1c and d) may also have contributed to the former's lower growth rate. Consequently, B. gymnorrhiza grew faster and suppressed the growth of R. stylosa by severe shading (Figs. 6 and 7). The higher growth rate of B. gymnorrhiza compared to R. stylosa at relatively low-salinity conditions agrees with the study by Jiang et al. (2019).
Interestingly, our model was able to simulate unique conditions not previously reported by other modeling works. For instance, the model predicted that R. stylosa trees could grow until the mature conditions under the canopy of B. gymnorrhiza-dominated forest provided the chance of favorable light conditions, resulting in the high mean DBH but low AGB of this species at relatively low soil salinity (∼ 24 ‰) (Figs. 6 and 7). Simulating this kind of process may only be possible through the individual-based approach with calculations of detailed irradiance distribution as done by the SEIB-DGVM in this study. Alternatively, the model predicted the significantly lowered growth rate of B. gymnorrhiza at high-soil-salinity conditions (sal > 30 ‰) where B. gymnorrhiza cannot grow until mature conditions, which resulted in the low AGB and small mean DBH of this species. This reduced the suppression of B. gymnorrhiza on R. stylosa and generated the Rhizophora stylosa-dominated forest (Figs. 6 and 7). Despite the abundant population of R. stylosa, the sizes of individuals were relatively small due to high salt stress and resulted in the high AGB but small mean DBH of this species.
4.3 Effects of other factors and further model improvement
Besides soil salinity, this study highlighted the importance of atmospheric variables as important drivers controlling mangrove production. This is seen in the photosynthesis–transpiration seasonal dynamics with peak during summer (June–September) and depression during winter (November–March) (Fig. 4) that none of the previous mangrove modeling studies has examined yet. The model predicted winter depression primarily due to low solar radiation and air temperature. Specifically, low air temperature (< 20 ∘C) significantly reduced photosynthetic capacity – the maximum carboxylation rate and the maximum electron transport rate (Aspinwall et al., 2021); this, in turn, decreased the marginal WUE (), leading to the downregulation of stomatal conductance, a behavior of mangroves' stomata observed under low-temperature conditions (Akaji et al., 2019; Aspinwall et al., 2021). This resulted in the depression of photosynthesis and transpiration during this season. The significance of atmospheric control on stomatal conductance and associated dynamics in winter compared to salinity control is also highlighted in the similar magnitude of reduction of the leaf water potential at midday between the different soil salinity conditions in this season compared to summer (Fig. 5c and f). Such winter depression lowers the production of mangroves in subtropical regions and may be differentiated from tropical mangroves in terms of productivity. This could be a key factor in explaining and predicting the latitudinal gradients in mangroves' structural variables such as canopy height and AGB with the highest values at the equatorial region (Saenger and Snedaker, 1993; Simard et al., 2019; Rovai et al., 2021).
The model gave significantly better prediction of the AGB spatial distribution when the spatially averaged DIN concentrations were applied to the substrate condition compared to plot-wise DIN values (Fig. S5, plot-wise simulation). This suggests that N availability was better represented by the spatially averaged value in this study. Porewater DIN in mangrove forests is highly heterogeneous horizontally (Inoue et al., 2011) and vertically (Kristensen et al., 1998; Lee et al., 2008) even in very small scales such as 10 cm. The DIN measured from one soil core sample might not have captured the representative value at each plot due to such heterogeneity. Differences in the predicted AGB between the two cases highlight nutrient availability in affecting mangrove production and biomass dynamics in this forest. Therefore, an appropriate representation of nutrient availability is critical for accurate prediction of mangrove production. More detailed measurement of porewater nutrient concentrations in space and time is needed for a more reliable model prediction, and future works will account for this aspect. Similarly, future works should consider biogeochemical processes which control nutrient dynamics in the substrate. For example, the porewater of the Fukido mangrove forest is rich in ammonia compared to nitrate (Table S1), contrary to the groundwater flowing into this forest, which is rich in nitrate (Mori et al., unpublished data). This suggests that biogeochemical processes, such as mineralization of organic matter, N fixation, and denitrification (Reef et al., 2010), are important drivers controlling nutrient dynamics in the forest, which ultimately affects soil organic matter dynamics. These factors should therefore be taken into consideration in future works as one of the plant-to-soil feedbacks in addition to water uptake processes.
This paper presents a new individual-based model modified from SEIB-DGVM for a better physiological representation of mangrove growth under the impact of soil salinity. The plant hydraulics was incorporated and linked with the plant production process (C and N uptake) and biomass allocation. The developed model showed high reproducibility of the complex nonlinear patterns in species composition and forest structural variables in a subtropical mangrove forest shaped across a soil salinity gradient without empirical parameterizations of soil salinity influence on mangrove productivity. While there are still some important processes to be accounted for to further improve the model (e.g., plant-to-soil feedback and soil biogeochemical processes), the physiologically improved model predicted the various key ecological processes such as seasonal dynamics in photosynthesis and transpiration, interspecific competition, and self-thinning process, together with forest structure. Thus, including plant hydraulic traits that incorporate species differences in the ability to deal with salinity is critical and adequate for predicting the dominant dynamics in mangrove forests. Although the model has been tested using only two species in one site, owing to its physiological principles that do not hold empirical expressions of influences of environmental variables on mangrove productivity, it can be potentially extended to other mangrove species in various environmental settings. Therefore, it may contribute to predicting how the mangrove biomass dynamics will respond to future changes in global climate.
The model codes are available at https://doi.org/10.5281/zenodo.6388269 (Yoshikai, 2022).
The tree census data used in this study are published in Suwa et al. (2021). The tree crown data in Ishigaki Island and model output data can be made available upon reasonable request to the corresponding author.
The supplement related to this article is available online at: https://doi.org/10.5194/bg-19-1813-2022-supplement.
MY, TN, SS, and KN designed the study. SS and JY conducted the fieldwork. All authors contributed to model development, and MY performed the analyses. TN, RS, and KN contributed to result interpretation. MY wrote the manuscript, and SS contributed to reviewing and editing.
The contact author has declared that neither they nor their co-authors have any competing interests.
Publisher's note: Copernicus Publications remains neutral with regard to jurisdictional claims in published maps and institutional affiliations.
We are grateful to the Japan International Cooperation Agency (JICA) and Japan Science and Technology Agency (JST) through the Science and Technology Research Partnership for Sustainable Development Program (SATREPS) for financially supporting the project Comprehensive Assessment and Conservation of Blue Carbon Ecosystems and their Services in the Coral Triangle (BlueCARES). This work was also supported by JSPS KAKENHI grant numbers JP25257305, JP12F02371, JP15H02268, and JP20K14835. We thank Ryan Basina and Yasmin H. Primavera-Tirol for their help in collecting crown data in Bakhawan Ecopark, as well as Yennie Marini for providing the crown data in Karimunjawa Islands. We also thank Charissa Ferrera for providing language help. This study used the STPK library (http://www.gfd-dennou.org/arch/davis/stpk/index.htm.en, last access: 30 March 2022) in the developed model.
This research has been supported by the Science and Technology Research Partnership for Sustainable Development (BlueCARES) and the Japan Society for the Promotion of Science (grant nos. JP25257305, JP12F02371, JP15H02268, and JP20K14835).
This paper was edited by Alexandra Konings and reviewed by two anonymous referees.
Adame, M. F., Teutli, C., Santini, N. S., Caamal, J. P., Zaldívar-Jiménez, A., Hernández, R., and Herrera-Silveira, J. A.: Root biomass and production of mangroves surrounding a karstic oligotrophic coastal lagoon, Wetlands, 34, 479–488, 2014.
Adame, M. F., Connolly, R. M., Turschwell, M. P., Lovelock, C. E., Fatoyinbo, T., Lagomasino, D., Goldberg, L. A., Holdorf, H., Friess, D. A., Sasmito, S. D., Sanderman, J., Sievers, M., Buelow, C., Kauffman, J. B., Bryan-Brown, D., and Brown, C. J.: Future carbon emissions from global mangrove forest loss, Glob. Change Biol., 27, 2856–2866, 2021.
Akaji, Y., Inoue, T., Tomimatsu, H., and Kawanishi, A.: Photosynthesis, respiration, and growth patterns of Rhizophora stylosa seedlings in relation to growth temperature, Trees, 33, 1041–1049, 2019.
Alongi, D. M.: Carbon cycling and storage in mangrove forests, Annu. Rev. Mar. Sci., 6, 195–219, 2014.
Alongi, D. M., Clough, B. F., Dixon, P., and Tirendi, F.: Nutrient partitioning and storage in arid-zone forests of the mangroves Rhizophora stylosa and Avicennia marina, Trees, 17, 51–60, 2003.
Alongi, D. M., Wattayakorn, G., Tirendi, F., and Dixon, P.: Nutrient capital in different aged forests of the mangrove Rhizophora apiculata, Bot. Mar., 47, 116–124, 2004.
Analuddin, K., Suwa, R., and Hagihara, A.: The self-thinning process in mangrove Kandelia obovata stands, J. Plant Res., 122, 53–59, 2009.
Aspinwall, M. J., Faciane, M., Harris, K., O'Toole, M., Neece, A., Jerome, V., Colón, M., Chieppa, J., and Feller, I. C.: Salinity has little effect on photosynthetic and respiratory responses to seasonal temperature changes in black mangrove (Avicennia germinans) seedlings, Tree Physiol., 41, 103–118, 2021.
Atwood, T. B., Connolly, R. M., Almahasheer, H., Carnell, P. E., Duarte, C. M., Lewis, C. J. E., Irigoien, X., Kelleway, J. J., Lavery, P. S., Macreadie, P. I., Serrano, O., Sanders, C. J., Santos, I., Steven, A. D. L., and Lovelock, C. E.: Global patterns in mangrove soil carbon stocks and losses, Nat. Clim. Change, 7, 523–528, 2017.
Azman, M. S., Sharma, S., Shaharudin, M. A. M., Hamzah, M. L., Adibah, S. N., Zakaria, R. M., and MacKenzie, R. A.: Stand structure, biomass and dynamics of naturally regenerated and restored mangroves in Malaysia, Forest. Ecol. Manag., 482, 118852, https://doi.org/10.1016/j.foreco.2020.118852, 2021.
Ball, M., Cowan, I. R., and Farquhar, G. D.: Maintenance of leaf temperature and the optimisation of carbon gain in relation to water loss in a tropical mangrove forest, Funct. Plant Biol., 15, 263–276, 1988.
Ball, M. C.: Interactive effects of salinity and irradiance on growth: implications for mangrove forest structure along salinity gradients, Trees, 16, 126–139, 2002.
Ball, M. C. and Farquhar, G. D.: Photosynthetic and stomatal responses of two mangrove species, Aegiceras corniculatum and Avicennia marina, to long term salinity and humidity conditions, Plant Physiol., 74, 1–6, 1984.
Barr, J. G., Engel, V., Fuentes, J. D., Fuller, D. O., and Kwon, H.: Modeling light use efficiency in a subtropical mangrove forest equipped with CO2 eddy covariance, Biogeosciences, 10, 2145–2158, https://doi.org/10.5194/bg-10-2145-2013, 2013.
Barr, J. G., DeLonge, M. S., and Fuentes, J. D.: Seasonal evapotranspiration patterns in mangrove forests, J. Geophys. Res.-Atmos., 119, 3886–3899, 2014.
Bathmann, J., Peters, R., Reef, R., Berger, U., Walther, M., and Lovelock, C. E.: Modelling mangrove forest structure and species composition over tidal inundation gradients: The feedback between plant water use and porewater salinity in an arid mangrove ecosystem, Agr. Forest Meteorol., 308, 108547, 2021.
Berger, U. and Hildenbrandt, H.: A new approach to spatially explicit modelling of forest dynamics: spacing, ageing and neighbourhood competition of mangrove trees, Ecol. Model., 132, 287–302, 2000.
Berger, U., Rivera-Monroy, V. H., Doyle, T. W., Dahdouh-Guebas, F., Duke, N. C., Fontalvo-Herazo, Hildenbrandt, H., Koedam, H., Mehlig, N., Piou, C., and Twilley, R. R.: Advances and limitations of individual-based models to analyze and predict dynamics of mangrove forests: A review, Aquat. Bot., 89, 260–274, 2008.
Bonan, G. B., Williams, M., Fisher, R. A., and Oleson, K. W.: Modeling stomatal conductance in the earth system: linking leaf water-use efficiency and water transport along the soil–plant–atmosphere continuum, Geosci. Model Dev., 7, 2193–2222, https://doi.org/10.5194/gmd-7-2193-2014, 2014.
Bukoski, J. J., Elwin, A., MacKenzie, R. A., Sharma, S., Purbopuspito, J., Kopania, B., Apwong, M., Poolsiri, R., and Potts, M. D.: The role of predictive model data in designing mangrove forest carbon programs, Environ. Res. Lett., 15, 084019, https://doi.org/10.1088/1748-9326/ab7e4e, 2020.
Castañeda-Moya, E., Twilley, R. R., Rivera-Monroy, V. H., Marx, B. D., Coronado-Molina, C., and Ewe, S. M.: Patterns of root dynamics in mangrove forests along environmental gradients in the Florida Coastal Everglades, USA, Ecosystems, 14, 1178–1195, 2011.
Chatting, M., LeVay, L., Walton, M., Skov, M. W., Kennedy, H., Wilson, S., and Al-Maslamani, I.: Mangrove carbon stocks and biomass partitioning in an extreme environment, Estur. Coast. Shelf S., 244, 106940, https://doi.org/10.1016/j.ecss.2020.106940, 2020.
Chen, R. and Twilley, R. R.: A gap dynamic model of mangrove forest development along gradients of soil salinity and nutrient resources, J. Ecol., 86, 37–51, 1998.
Clough, B. and Sim, R. G.: Changes in gas exchange characteristics and water use efficiency of mangroves in response to salinity and vapour pressure deficit, Oecologia, 79, 38–44, 1989.
Clough, B. F., Ong, J. E., and Gong, W. K.: Estimating leaf area index and photosynthetic production in canopies of the mangrove Rhizophora apiculata, Mar. Ecol. Prog. Ser., 159, 285–292, 1997.
Cowan, I. R. and Farquhar, G. D.: Stomatal function in relation to leaf metabolism and environment, in: Integration of Activity in the Higher Plant, edited by: Jennings, D. H., Cambridge University Press, Cambridge, 471–505, 1977.
Deshar, R., Suwa, R., and Hagihara, A.: Leaf water potential of two mangrove species in different seasons and salinity conditions on Okinawa Island, Japan, Mangrove and Wetland Ecosystem, 6, 85–97, 2008.
Deshar, R., Sharma, S., Mouctar, K., Wu, M., Hoque, A. T. M. R., and Hagihara, A.: Self-thinning exponents for partial organs in overcrowded mangrove Bruguiera gymnorrhiza stands on Okinawa Island, Japan, Forest Ecol. Manag., 278, 146–154, 2012.
Donato, D. C., Kauffman, J. B., Murdiyarso, D., Kurnianto, S., Stidham, M., and Kanninen, M.: Mangroves among the most carbon-rich forests in the tropics, Nat. Geosci., 4, 293–297, 2011.
Egawa, R., Sharma, S., Nadaoka, K., and MacKenzie, R. A.: Burrow dynamics of crabs in subtropical estuarine mangrove forest, Estur. Coast. Shelf S., 252, 107244, 2021.
Enoki, T., Yasuda, K., and Kusumoto, B.: Aboveground net primary production and stand dynamics of mangroves along a river on Iriomote Island, southwestern Japan, Tropics, 23, 91–98, 2014.
Feller, I. C., Lovelock, C. E., and McKee, K. L.: Nutrient addition differentially affects ecological processes of Avicennia germinans in nitrogen versus phosphorus limited mangrove ecosystems, Ecosystems, 10, 347–359, 2007.
Fisher, R. A., Koven, C. D. anderegg, W. R., Christoffersen, B. O., Dietze, M. C., Farrior, C. E., Holm, J. A., Hurtt, G. C., Knox, R. G., Lawrence, P. J., Lichstein, J. W., Longo, M., Matheny, A. M., Medvigy, D., Muller-Landau, H. C., Powell, T. L., Serbin, S. P., Sato, H., Shuman, J. K., Smith, B., Trugman, A. T., Viskari, T., Verbeeck, H., Weng, E., Xu, C., Xu, X., Zhang, T., and Moorcroft, P. R.: Vegetation demographics in Earth System Models: A review of progress and priorities, Glob. Change Biol., 24, 35–54, 2018.
Friess, D. A., Rogers, K., Lovelock, C. E., Krauss, K. W., Hamilton, S. E., Lee, S. Y., Lucas, R., Primavera, J., Rajkaran, R., and Shi, S.: The state of the world's mangrove forests: past, present, and future, Annu. Rev. Env. Resour., 44, 89–115, 2019.
Friess, D. A., Yando, E. S., Abuchahla, G. M., Adams, J. B., Cannicci, S., Canty, S. W., Cavanaugh, K. C., Connolly, R. M., Cormier, N., Dahdouh-Guebas, F., Diele, K., Feller, I. C., Fratini, S., Jennerjahn, T. C., Lee, S. Y., Ogurcak, D. E., Ouyang, X., Rogers, K., Rowntree, J. K., Sharma, S., Sloey, T. M., and Wee, A. K.: Mangroves give cause for conservation optimism, for now, Curr. Biol., 30, R153–R154, 2020.
Giri, C., Ochieng, E., Tieszen, L. L., Zhu, Z., Singh, A., Loveland, T., Masek, J., and Duke, N.: Status and distribution of mangrove forests of the world using earth observation satellite data, Global Ecol. Biogeogr., 20, 154–159, 2011.
Grueters, U., Seltmann, T., Schmidt, H., Horn, H., Pranchai, A., Vovides, A. G., Peter, R., Vogt, J., Dahdouh-Guebas, F., and Berger, U.: The mangrove forest dynamics model mesoFON, Ecol. Model., 291, 28–41, 2014.
Hao, G. Y., Jones, T. J., Luton, C., Zhang, Y. J., Manzane, E., Scholz, F. G., Bucci, S. J., Cao, K-F., and Goldstein, G.: Hydraulic redistribution in dwarf Rhizophora mangle trees driven by interstitial soil water salinity gradients: impacts on hydraulic architecture and gas exchange, Tree Physiol., 29, 697–705, 2009.
Inoue, T., Nohara, S., Takagi, H., and Anzai, Y.: Contrast of nitrogen contents around roots of mangrove plants, Plant Soil, 339, 471–483, 2011.
Jiang, G. F., Goodale, U. M., Liu, Y. Y., Hao, G. Y., and Cao, K. F.: Salt management strategy defines the stem and leaf hydraulic characteristics of six mangrove tree species, Tree Physiol., 37, 389–401, 2017.
Jiang, Z., Guan, W., Xiong, Y., Li, M., Chen, Y., and Liao, B.: Interactive effects of intertidal elevation and light level on early growth of five mangrove species under Sonneratia apetala Buch. Hamplantation canopy: Turning monocultures to mixed forests, Forests, 10, 83, https://doi.org/10.3390/f10020083, 2019.
Khan, M. N. I., Sharma, S., Berger, U., Koedam, N., Dahdouh-Guebas, F., and Hagihara, A.: How do tree competition and stand dynamics lead to spatial patterns in monospecific mangroves?, Biogeosciences, 10, 2803–2814, https://doi.org/10.5194/bg-10-2803-2013, 2013.
Kobayashi, S., Ota, Y., Harada, Y., Ebita, A., Moriya, M., Onoda, H., Onogi, K., Kamahori, H., Kobayashi, C., Endo, H., Miyaoka, K., and Takahashi, K.: The JRA-55 reanalysis: General specifications and basic characteristics, J. Meteorol. Soc. Jpn.. Ser. II, 93, 5–48, 2015.
Komiyama, A., Poungparn, S., and Kato, S.: Common allometric equations for estimating the tree weight of mangroves, J. Trop. Ecol., 21, 471–477, 2005.
Komiyama, A., Ong, J. E., and Poungparn, S.: Allometry, biomass, and productivity of mangrove forests: A review, Aquat. Bot., 89, 128–137, 2008.
Kristensen, E., Jensen, M. H., Banta, G. T., Hansen, K., Holmer, M., and King, G. M.: Transformation and transport of inorganic nitrogen in sediments of a southeast Asian mangrove forest, Aquat. Microb. Ecol., 15, 165–175, 1998.
Kristensen, E., Bouillon, S., Dittmar, T., and Marchand, C.: Organic carbon dynamics in mangrove ecosystems: a review, Aquat. Bot., 89, 201–219, 2008.
Lee, R. Y., Porubsky, W. P., Feller, I. C., McKee, K. L., and Joye, S. B.: Porewater biogeochemistry and soil metabolism in dwarf red mangrove habitats (Twin Cays, Belize), Biogeochemistry, 87, 181–198, 2008.
Li, L., Yang, Z. L., Matheny, A. M., Zheng, H., Swenson, S. C., Lawrence, D. M., Barlage, M., Yan, B., McDowell, N. G., and Leung, L. R.: Representation of Plant Hydraulics in the Noah-MP Land Surface Model: Model Development and Multiscale Evaluation, J. Adv. Model. Earth Sy., 13, e2020MS002214, https://doi.org/10.1029/2020MS002214, 2021.
Liang, J., Wei, Z., Lee, X., Wright, J. S., Cui, X., Chen, H., and Lin, G.: Evapotranspiration Characteristics Distinct to Mangrove Ecosystems Are Revealed by Multiple-Site Observations and a Modified Two-Source Model, Water Resour. Res., 55, 11250–11273, 2019.
Lin, Y. M., Liu, X. W., Zhang, H., Fan, H. Q., and Lin, G. H.: Nutrient conservation strategies of a mangrove species Rhizophora stylosa under nutrient limitation, Plant Soil, 326, 469–479, 2010.
Lovelock, C. E., Feller, I. C., McKee, K. L., Engelbrecht, B. M., and Ball, M. C.: The effect of nutrient enrichment on growth, photosynthesis and hydraulic conductance of dwarf mangroves in Panama, Funct. Ecol., 18, 25–33, 2004.
Lovelock, C. E., Ball, M. C., Choat, B., Engelbrecht, B. M., Holbrook, N. M., and Feller, I. C.: Linking physiological processes with mangrove forest structure: phosphorus deficiency limits canopy development, hydraulic conductivity and photosynthetic carbon gain in dwarf Rhizophora mangle, Plant Cell Environ., 29, 793–802, 2006a.
Lovelock, C. E., Ball, M. C., Feller, I. C., Engelbrecht, B. M., and Ling Ewe, M.: Variation in hydraulic conductivity of mangroves: influence of species, salinity, and nitrogen and phosphorus availability, Physiol. Plantarum, 127, 457–464, 2006b.
Magnani, F., Mencuccini, M., and Grace, J.: Age-related decline in stand productivity: the role of structural acclimation under hydraulic constraints, Plant Cell Environ., 23, 251–263, 2000.
Mcleod, E., Chmura, G. L., Bouillon, S., Salm, R., Björk, M., Duarte, C. M., Lovelock, C. E., Schlesinger, W. H., and Silliman, B. R.: A blueprint for blue carbon: toward an improved understanding of the role of vegetated coastal habitats in sequestering CO2, Front. Ecol. Environ., 9, 552–560, 2011.
Melcher, P. J., Goldstein, G., Meinzer, F. C., Yount, D. E., Jones, T. J., Holbrook, N. M., and Huang, C. X.: Water relations of coastal and estuarine Rhizophora mangle: xylem pressure potential and dynamics of embolism formation and repair, Oecologia, 126, 182–192, 2001.
Meunier, F., Krishna Moorthy, S. M., Peaucelle, M., Calders, K., Terryn, L., Verbruggen, W., Liu, C., Saarinen, N., Origo, N., Nightingale, J., Disney, M., Malhi, Y., and Verbeeck, H.: Using terrestrial laser scanning to constrain forest ecosystem structure and functions in the Ecosystem Demography model (ED2.2), Geosci. Model Dev. Discuss. [preprint], https://doi.org/10.5194/gmd-2021-59, in review, 2021.
Muhammad-Nor, S. M., Huxham, M., Salmon, Y., Duddy, S. J., Mazars-Simon, A., Mencuccini, M., Meir, P., and Jackson, G.: Exceptionally high mangrove root production rates in the Kelantan Delta, Malaysia; An experimental and comparative study, Forest Ecol. Manag., 444, 214–224, 2019.
Nguyen, H. T., Stanton, D. E., Schmitz, N., Farquhar, G. D., and Ball, M. C.: Growth responses of the mangrove Avicennia marina to salinity: development and function of shoot hydraulic systems require saline conditions, Ann. Bot-London, 115, 397–407, 2015.
Nishino, Y., Fujimoto, K., Ryuichi, T., Hirata, Y., Ono, K., Taniguchi, S., Ogawa, T., and Lihpai, S.: Estimation of aboveground biomass in a Rhizophora stylosa forest with densely developed prop roots in Pohnpei Island, Federated States of Micronesia, Mangrove Science, 9, 17–25, 2015.
Ohtsuka, T., Tomotsune, M., Suchewaboripont, V., Iimura, Y., Kida, M., Yoshitake, S., Kondo, M., and Kinjo, K.: Stand dynamics and aboveground net primary productivity of a mature subtropical mangrove forest on Ishigaki Island, south-western Japan, Regional Studies in Marine Science, 27, 100516, https://doi.org/10.1016/j.rsma.2019.100516, 2019.
Okimoto, Y., Nose, A., Katsuta, Y., Tateda, Y., Agarie, S., and Ikeda, K.: Gas exchange analysis for estimating net CO2 fixation capacity of mangrove (Rhizophora stylosa) forest in the mouth of river Fukido, Ishigaki Island, Japan, Plant Prod. Sci., 10, 303–313, 2007.
Ouyang, X., Lee, S. Y., and Connolly, R. M.: The role of root decomposition in global mangrove and saltmarsh carbon budgets, Earth-Sci. Rev., 166, 53–63, 2017.
Perri, S., Viola, F., Noto, L. V., and Molini, A.: Salinity and periodic inundation controls on the soil-plant-atmosphere continuum of gray mangroves, Hydrol. Process., 31, 1271–1282, 2017.
Perri, S., Katul, G. G., and Molini, A.: Xylem–phloem hydraulic coupling explains multiple osmoregulatory responses to salt stress, New Phytol., 224, 644–662, 2019.
Peters, R., Vovides, A. G., Luna, S., Grüters, U., and Berger, U.: Changes in allometric relations of mangrove trees due to resource availability–A new mechanistic modelling approach, Ecol. Model., 283, 53–61, 2014.
Potkay, A., Trugman, A. T., Wang, Y., Venturas, M. D., Anderegg, W. R., Mattos, C. R., and Fan, Y.: Coupled whole-tree optimality and xylem hydraulics explain dynamic biomass partitioning, New Phytol., 230, 2226–2245, 2021.
Putz, F. E. and Chan, H. T.: Tree growth, dynamics, and productivity in a mature mangrove forest in Malaysia, Forest Ecol. Manag., 17, 211–230, 1986.
Reef, R. and Lovelock, C. E.: Regulation of water balance in mangroves, Ann. Bot-London, 115, 385–395, 2015.
Reef, R., Feller, I. C., and Lovelock, C. E.: Nutrition of mangroves, Tree Physiol., 30, 1148–1160, 2010.
Robertson, A. I. and Alongi, D. M.: Massive turnover rates of fine root detrital carbon in tropical Australian mangroves, Oecologia, 180, 841–851, 2016.
Rovai, A. S., Riul, P., Twilley, R. R., Castañeda-Moya, E., Rivera-Monroy, V. H., Williams, A. A., Simard, M., Cifuentes-Jara, M., Lewis, R. R., Crooks, S., Horta, P. A., Schaeffer-Novelli, Y., Cintrón, G., Pozo-Cajas, M., and Pagliosa, P. R.: Scaling mangrove aboveground biomass from site-level to continental-scale, Global Ecol. Biogeogr., 25, 286–298, 2016.
Rovai, A. S., Twilley, R. R., Castañeda-Moya, E., Midway, S. R., Friess, D. A., Trettin, C. C., Bukoski, J. J., Stovall, A. E. L., Pagliosa, P. R., Fonseca, A. L., Mackenzie, R. A., Aslan, A., Sasmito, S. D., Sillanpää, M., Cole, T. G., Purbopuspito, J., Warren, M. W., Murdiyarso, D., Mofu, W., Sharma, S., Hong Tinh, P., and Riul, P.: Macroecological patterns of forest structure and allometric scaling in mangrove forests, Global Ecol. Biogeogr., 30, 1000–1013, 2021.
Saenger, P. and Snedaker, S. C.: Pantropical trends in mangrove above-ground biomass and annual litterfall, Oecologia, 96, 293–299, 1993.
Sasmito, S. D., Kuzyakov, Y., Lubis, A. A., Murdiyarso, D., Hutley, L. B., Bachri, S., Friess, D. A., Martius, C., and Borchard, N.: Organic carbon burial and sources in soils of coastal mudflat and mangrove ecosystems, Catena, 187, 104414, https://doi.org/10.1016/j.catena.2019.104414, 2020.
Sato, H.: SEIB-DGVM v2.80 online description document, http://seib-dgvm.com (last access: 27 March 2022), 2015.
Sato, H., Itoh, A., and Kohyama, T.: SEIB–DGVM: A new Dynamic Global Vegetation Model using a spatially explicit individual-based approach, Ecol. Model., 200, 279–307, 2007.
Sharma, S., Kamruzzaman, M., Hoque, A. R., and Hagihara, A.: Leaf phenological traits and leaf longevity of three mangrove species (Rhizophoraceae) on Okinawa Island, Japan, J. Oceanogr., 68, 831–840, 2012.
Sharma, S., MacKenzie, R. A., Tieng, T., Soben, K., Tulyasuwan, N., Resanond, A., Blate, G., and Litton, C. M.: The impacts of degradation, deforestation and restoration on mangrove ecosystem carbon stocks across Cambodia, Sci. Total Environ., 706, 135416, https://doi.org/10.1016/j.scitotenv.2019.135416, 2020.
Simard, M., Fatoyinbo, L., Smetanka, C., Rivera-Monroy, V. H., Castañeda-Moya, E., Thomas, N., and Van der Stocken, T.: Mangrove canopy height globally related to precipitation, temperature and cyclone frequency, Nat. Geosci., 12, 40–45, 2019.
Šimůnek, J. and Hopmans, J. W.: Modeling compensated root water and nutrient uptake, Ecol. Model., 220, 505–521, 2009.
Sobrado, M. A.: Leaf photosynthesis of the mangrove Avicennia germinans as affected by NaCl, Photosynthetica, 36, 547–555, 2000.
Suárez, N. and Medina, E.: Salinity effect on plant growth and leaf demography of the mangrove, Avicennia germinans L., Trees, 19, 722–728, 2005.
Suwa, R., Analuddin, K., Khan, M. N. I., and Hagihara, A.: Structure and productivity along a tree height gradient in a Kandelia obovata mangrove forest in the Manko Wetland, Okinawa Island, Japan, Wetl. Ecol. Manag., 16, 331–343, 2008.
Suwa, R., Deshar, R., and Hagihara, A.: Forest structure of a subtropical mangrove along a river inferred from potential tree height and biomass, Aquat. Bot., 91, 99–104, 2009.
Suwa, R., Rollon, R., Sharma, S., Yoshikai, M., Albano, G. M. G., Ono, K., Adi, N. S., Ati, R. N. A., Kusumaningtyas, M. A., Kepel, T. L., Maliao, R. J., Primavera-Tirol, Y. H., Blanco, A. C., and Nadaoka, K.: Mangrove biomass estimation using canopy height and wood density in the South East and East Asian regions, Estur. Coast. Shelf S., 248, 106937, https://doi.org/10.1016/j.ecss.2020.106937, 2021.
Tabuchi, R. and Unyavejchewin, S. B.: Development of mangrove stands in Southeast Asia: with special reference to the west coast of the Malay Peninsula, Global Environ. Res, 17, 215–221, 2013.
Taillardat, P., Friess, D. A., and Lupascu, M.: Mangrove blue carbon strategies for climate change mitigation are most effective at the national scale, Biol. Letters, 14, 20180251, https://doi.org/10.1098/rsbl.2018.0251, 2018.
Tamooh, F., Huxham, M., Karachi, M., Mencuccini, M., Kairo, J. G., and Kirui, B.: Below-ground root yield and distribution in natural and replanted mangrove forests at Gazi bay, Kenya, Forest Ecol. Manag., 256, 1290–1297, 2008.
Tanu, F. Z., Asakura, Y., Takahashi, S., Hinokidani, K., and Nakanishi, Y.: Variation in Foliar δ15N Reflects Anthropogenic Nitrogen Absorption Potential of Mangrove Forests, Forests, 11, 133, https://doi.org/10.3390/f11020133, 2020.
Trugman, A. T., Anderegg, L. D. L., Sperry, J. S., Wang, Y., Venturas, M., and Anderegg, W. R. L.: Leveraging plant hydraulics to yield predictive and dynamic plant leaf allocation in vegetation models with climate change, Glob. Change Biol., 25, 4008–4021, 2019a.
Trugman, A. T., Anderegg, L. D. L., Wolfe, B. T., Birami, B., Ruehr, N. K., Detto, M., Bartlett, M. K., and Anderegg, W. R. L.: Climate and plant trait strategies determine tree carbon allocation to leaves and mediate future forest productivity, Glob. Change Biol., 25, 3395–3405, 2019b.
Vinh, T., Marchand, C., Linh, T. V. K., Vinh, D. D., and Allenbach, M.: Allometric models to estimate above-ground biomass and carbon stocks in Rhizophora apiculata tropical managed mangrove forests (Southern Viet Nam), Forest Ecol. Manag., 434, 131–141, 2019.
Vovides, A. G., Vogt, J., Kollert, A., Berger, U., Grueters, U., Peters, R., Lara-Domínguez, A. L., and López-Portillo, J.: Morphological plasticity in mangrove trees: salinity-related changes in the allometry of Avicennia germinans, Trees, 28, 1413–1425, 2014.
Xiong, Y., Liao, B., and Wang, F.: Mangrove vegetation enhances soil carbon storage primarily through in situ inputs rather than increasing allochthonous sediments, Mar. Pollut. Bull., 131, 378–385, 2018.
Xu, X., Medvigy, D., Powers, J. S., Becknell, J. M., and Guan, K.: Diversity in plant hydraulic traits explains seasonal and inter-annual variations of vegetation dynamics in seasonally dry tropical forests, New Phytol., 212, 80–95, 2016.
Yoshikai, M.: MasayaYoshikai/SEIB_mangrove (v1.0.0), Zenodo [code], https://doi.org/10.5281/zenodo.6388269, 2022.
Yoshikai, M., Nakamura, T., Suwa, R., Argamosa, R., Okamoto, T., Rollon, R., Basina, R., Primavera-Tirol, Y. H., Blanco, A. C., Adi, N. S., and Nadaoka, K.: Scaling relations and substrate conditions controlling the complexity of Rhizophora prop root system, Estur. Coast. Shelf S., 248, 107014, https://doi.org/10.1016/j.ecss.2020.107014, 2021.
Zanne, A. E., Lopez-Gonzalez, G., Coomes, Ilic, J., Jansen, S., D.A., Lewis, S. L., Miller, R. B., Swenson, N. G., Wiemann, M. C., and Chave, J.: Data from: Towards a worldwide wood economics spectrum, https://doi.org/10.5061/dryad.234, 2009.