the Creative Commons Attribution 4.0 License.
the Creative Commons Attribution 4.0 License.
 | 27 Apr 2022
Evaluating alternative ebullition models for predicting peatland methane emission and its pathways via data–model fusion
Shuang Ma
Lifen Jiang
Rachel M. Wilson
Jeff P. Chanton
Scott Bridgham
Shuli Niu
Colleen M. Iversen
Avni Malhotra
Jiang Jiang
Xingjie Lu
Yuanyuan Huang
Jason Keller
Xiaofeng Xu
Daniel M. Ricciuto
Paul J. Hanson
Understanding the dynamics of peatland methane (CH4) emissions and quantifying sources of uncertainty in estimating peatland CH4 emissions are critical for mitigating climate change. The relative contributions of CH4 emission pathways through ebullition, plant-mediated transport, and diffusion, together with their different transport rates and vulnerability to oxidation, determine the quantity of CH4 to be oxidized before leaving the soil. Notwithstanding their importance, the relative contributions of the emission pathways are highly uncertain. In particular, the ebullition process is more uncertain and can lead to large uncertainties in modeled CH4 emissions. To improve model simulations of CH4 emission and its pathways, we evaluated two model structures: (1) the ebullition bubble growth volume threshold approach (EBG) and (2) the modified ebullition concentration threshold approach (ECT) using CH4 flux and concentration data collected in a peatland in northern Minnesota, USA. When model parameters were constrained using observed CH4 fluxes, the CH4 emissions simulated by the EBG approach (RMSE = 0.53) had a better agreement with observations than the ECT approach (RMSE = 0.61). Further, the EBG approach simulated a smaller contribution from ebullition but more frequent ebullition events than the ECT approach. The EBG approach yielded greatly improved simulations of pore water CH4 concentrations, especially in the deep soil layers, compared to the ECT approach. When constraining the EBG model with both CH4 flux and concentration data in model–data fusion, uncertainty of the modeled CH4 concentration profiles was reduced by 78 % to 86 % in comparison to constraints based on CH4 flux data alone. The improved model capability was attributed to the well-constrained parameters regulating the CH4 production and emission pathways. Our results suggest that the EBG modeling approach better characterizes CH4 emission and underlying mechanisms. Moreover, to achieve the best model results both CH4 flux and concentration data are required to constrain model parameterization.
- Article
(2937 KB) - Full-text XML
-
Supplement
(77 KB) - BibTeX
- EndNote


Methane (CH4) emissions from wetlands constitute roughly one third of the global CH4 budget (Denman et al., 2007; Saunois et al., 2020). Methane, following production under anoxic conditions, is stored belowground, oxidized into CO2 by methanotrophs, or emitted into the atmosphere as CH4. The emission of CH4 is a major concern given its sustained-flux global warming potential (SGWP) of 45 (Neubauer and Megonigal, 2015). Methane emissions from wetlands cannot be simply estimated from production rates as more than 50 % of methane can be oxidized during transport to the atmosphere in various ecosystems (Conrad and Rothfuss, 1991; Teh et al., 2005; Segarra et al., 2015). The global wetland CH4 oxidation sink has been estimated to be 40 %–70 % of CH4 production, and it can dominate wetland CH4 cycling (Megonigal et al., 2004). The oxidation sink depends substantially on the CH4 emission pathways due to their different oxidation rates (Blodau, 2002).
Methane is produced at depth in the soil and then transported to the atmosphere via three primary pathways: ebullition, plant-mediated transport, and diffusion. Ebullition is the least vulnerable to oxidation as it allows CH4 to quickly ascend in a bubble that bypasses the aerobic and anaerobic zones (Epstein and Plesset, 1950). Gases such as CH4 can be released into the atmosphere by vascular plants (particularly sedges) after being transported through intercellular spaces (molecular diffusion) or aerenchymous tissues. Although plant-transported CH4 bypasses aerobic zones of the soil, 20 %–90 % of plant-transported CH4 can be oxidized in the rhizosphere or within the aerenchymous tissues where gaseous oxygen is present (Schipper and Reddy, 1996; Ström et al., 2005; Laanbroek 2010). Diffusive transport through the peat column is the slowest transport method, and therefore, CH4 is most susceptible to oxidation as it spends the longest time transiting the aerobic and anaerobic zones (Chanton and Dacey, 1991; Megonigal et al., 2004). The relative importance of each pathway determines how much CH4 is oxidized before it leaves the soil. Uncertainties in the relative contributions of these pathways to CH4 emission can lead to large errors in the predictions of total CH4 emissions (Bridgham et al., 2013). Despite their importance, the relative contributions of the CH4 emission pathways have not been well quantified by either experimental or modeling approaches until recently (Ricciuto et al., 2021; Yuan et al., 2021).
Experimental data on the relative importance of CH4 emission pathways are limited due to spatiotemporal heterogeneity and the difficulty in directly measuring the different pathways (Klapstein et al., 2014; Iwata et al., 2018). While most state-of-the-art land surface models (LSMs) incorporate CH4 emission and differentiate the three transport pathways, information on the relative contribution of each pathway from modeling studies is still limited, and none of such studies has estimated the uncertainty or accuracy of the relative contributions of the emission pathways to net CH4 emission (Bridgham et al., 2013). Comparisons between modeling approaches and empirical CH4 data suggest that emission pathways may not be well captured by LSMs. For example, plant-mediated CH4 transport by vascular species measured at northern peatlands accounted for 30 %–98 % of the total CH4 emission (Shannon et al., 1996; Waddington et al., 1996), whereas model-estimated proportions in the similar ecosystems were all above 65 % (Tang et al., 2010; Wania et al., 2010). Empirical estimates also suggested that diffusion could range from 9 % to 60 % of the total CH4 flux (Barber et al., 1988; Shea et al., 2010; Iwata et al., 2018). In contrast, modeled contributions from diffusion were always below 40 % (Tang et al., 2010; Wania et al., 2010; Peltola et al., 2018). More dramatically, modeling approaches estimated that ebullition constituted only 0 %–10 % of net CH4 flux in natural vegetated wetlands (Tang et al., 2010; Wania et al., 2010; Peltola et al., 2018), much lower than the 10 %–64 % that was measured in experimental studies (Glaser et al., 2004; Tokida et al., 2007a, b). The uncertainties in simulated relative contributions of the pathways to net CH4 emission in LSMs are mainly due to the lack of in situ information, inadequate representation of CH4 processes, and unconstrained parameters used to describe emission pathways (Bridgham et al., 2013; Melton et al., 2013).
Since net CH4 emissions depend on transport mode, all the emission pathways must first be represented correctly in ecosystem models in order to simulate CH4 emission accurately (Blodau, 2002; Tang et al., 2010). Compared to diffusion and plant-mediated CH4 transport, ebullition is less certain and could be the main reason for the mismatch between simulated and observed CH4 concentrations in deep soil layers (Peltola et al., 2018). This is because diffusion is described with Fick's law and Henry's law, which have been widely used and well tested, and plant-mediated pathway happens only within the rooting depth, which is typically shallow in wetlands with a high water table level (Iversen et al., 2018). Ebullition makes a significant contribution to the total CH4 emissions in some wetlands (Christensen et al., 2003; Yu et al., 2014). However, this process has not been incorporated well into most state-of-the-art LSMs. Mechanistically, CH4 ebullition occurs when the buoyancy force of a bubble exceeds the retention force. During ascent, the bubbles exchange gas with the surrounding pore water, and some of the bubbles become trapped, allowing CH4 to re-dissolve or be oxidized within the confining layer. In modeling studies, ebullition is commonly estimated using the ebullition concentration threshold (ECT) approach. In ECT, when the pore water CH4 concentration is larger than a defined threshold, the excess CH4 is directly released into the atmosphere (Walter and Heimann, 2000; Zhuang et al., 2004; Wania et al., 2010; Riley et al., 2011; Xu et al., 2016). However, this approach ignores the possibility of a CH4 bubble moving into a less saturated layer where it can subsequently dissolve and possibly be oxidized, potentially overestimating ebullition. Other methods for modeling ebullition include the ebullition pressure threshold (EPT) or the ebullition bubble growth volume threshold (EBG) to trigger ebullition (Tang et al., 2010; Zhang et al., 2012). For the EPT method, bubbles form when the CH4 concentration exceeds a certain threshold. The EBG method describes how temperature, pressure, and gas exchange alter the bubble volume and uses maximum bubble volume as a threshold to trigger ebullition events (Fechner-Levy and Hemond, 1996; Kellner et al., 2006; Zhang et al., 2012). Peltola et al. (2018) compared these modeling approaches and concluded that EBG should be incorporated into LSMs instead of ECT or EPT given its most realistic representation of the observed temporal variability in CH4 emissions. However, the ability of the EBG approach to represent the relative importance of CH4 emission pathways has not been evaluated against observations.
A more realistic projection of the emission pathways requires not only an improved model structure but also more appropriate parameter values (Wania et al., 2010; Riley et al., 2011; Shi et al., 2018). Data–model fusion directly informs process-based models by synthesizing multisource data streams and thus can help determine parameter values that lie within biophysically realistic ranges and reduce model uncertainty (Williams et al., 2009; Keenan et al., 2013; Shi et al., 2015a; Liang et al., 2018). Previous studies have found that sporadic measurements of net CH4 emissions were only useful to constrain a few model parameters, and data assimilation with only CH4 emission (flux-based) data did not help reduce the uncertainties in emission pathways (Bridgham et al., 2013; Ma et al., 2017). In our previous study, we found that monthly CH4 emission data could only constrain CH4 production-related parameters such as temperature sensitivity (Q10) and basal production rate of CH4 production (Ma et al., 2017). While direct measures of CH4 emission pathways are rare, depth-specific pore water CH4 concentration profiles can help elucidate the relative importance of CH4 emission pathways. Indeed, measured CH4 concentration profiles are critical for constraining the responsive parameters associated with CH4 emission pathways because in process-based CH4 models, all the three emission pathways are calculated based on the CH4 concentration in each soil layer.
To date, few modeling studies have considered CH4 concentration data for structural improvement or parameter optimization (Zhuang et al., 2004; Wania et al., 2010; Riley et al., 2011; Zhu et al., 2014). In those studies that compared simulation results to observed pore water CH4 concentrations, the simulated concentration profiles did not agree well with observations despite good agreements between simulated and observed CH4 emission data (Walter and Heimann, 2000; Tang et al., 2010). Thus, when CH4 emission pathway parameters are calibrated using only net CH4 flux data, models may not realistically represent CH4 production, oxidation, and emission pathways. The exclusion of concentration profile data results in poorly constrained model parameters due to equifinality, in which multiple combinations of parameters result in similar flux predictions. This can cause misunderstanding of the mechanisms of CH4 processes. It will be problematic to use these not-yet-well-calibrated parameter sets for climate change predictions or extrapolating CH4 fluxes from the site level to larger spatial and temporal scales as these intermediate processes may have different responses to perturbations in climate.
To address these uncertainties, we evaluated the performance of two state-of-the-art methods for modeling ebullition, EBG and ECT, against the observed net CH4 fluxes and pore water CH4 concentration profiles in a northern Minnesota peatland. We also compared the strength of the flux-based data and pool-based data in constraining the parameters using data–model fusion. We hypothesized that (1) the EBG approach can reproduce the observed pore water CH4 profiles better than the ECT approach given its more mechanical representations of bubble formation, gas exchange, and release and (2) pore water CH4 concentration data offer more information for model parameters to reduce the uncertainties in simulated CH4 emission and its pathways.
Table 1The SPRUCE site data used in this study.
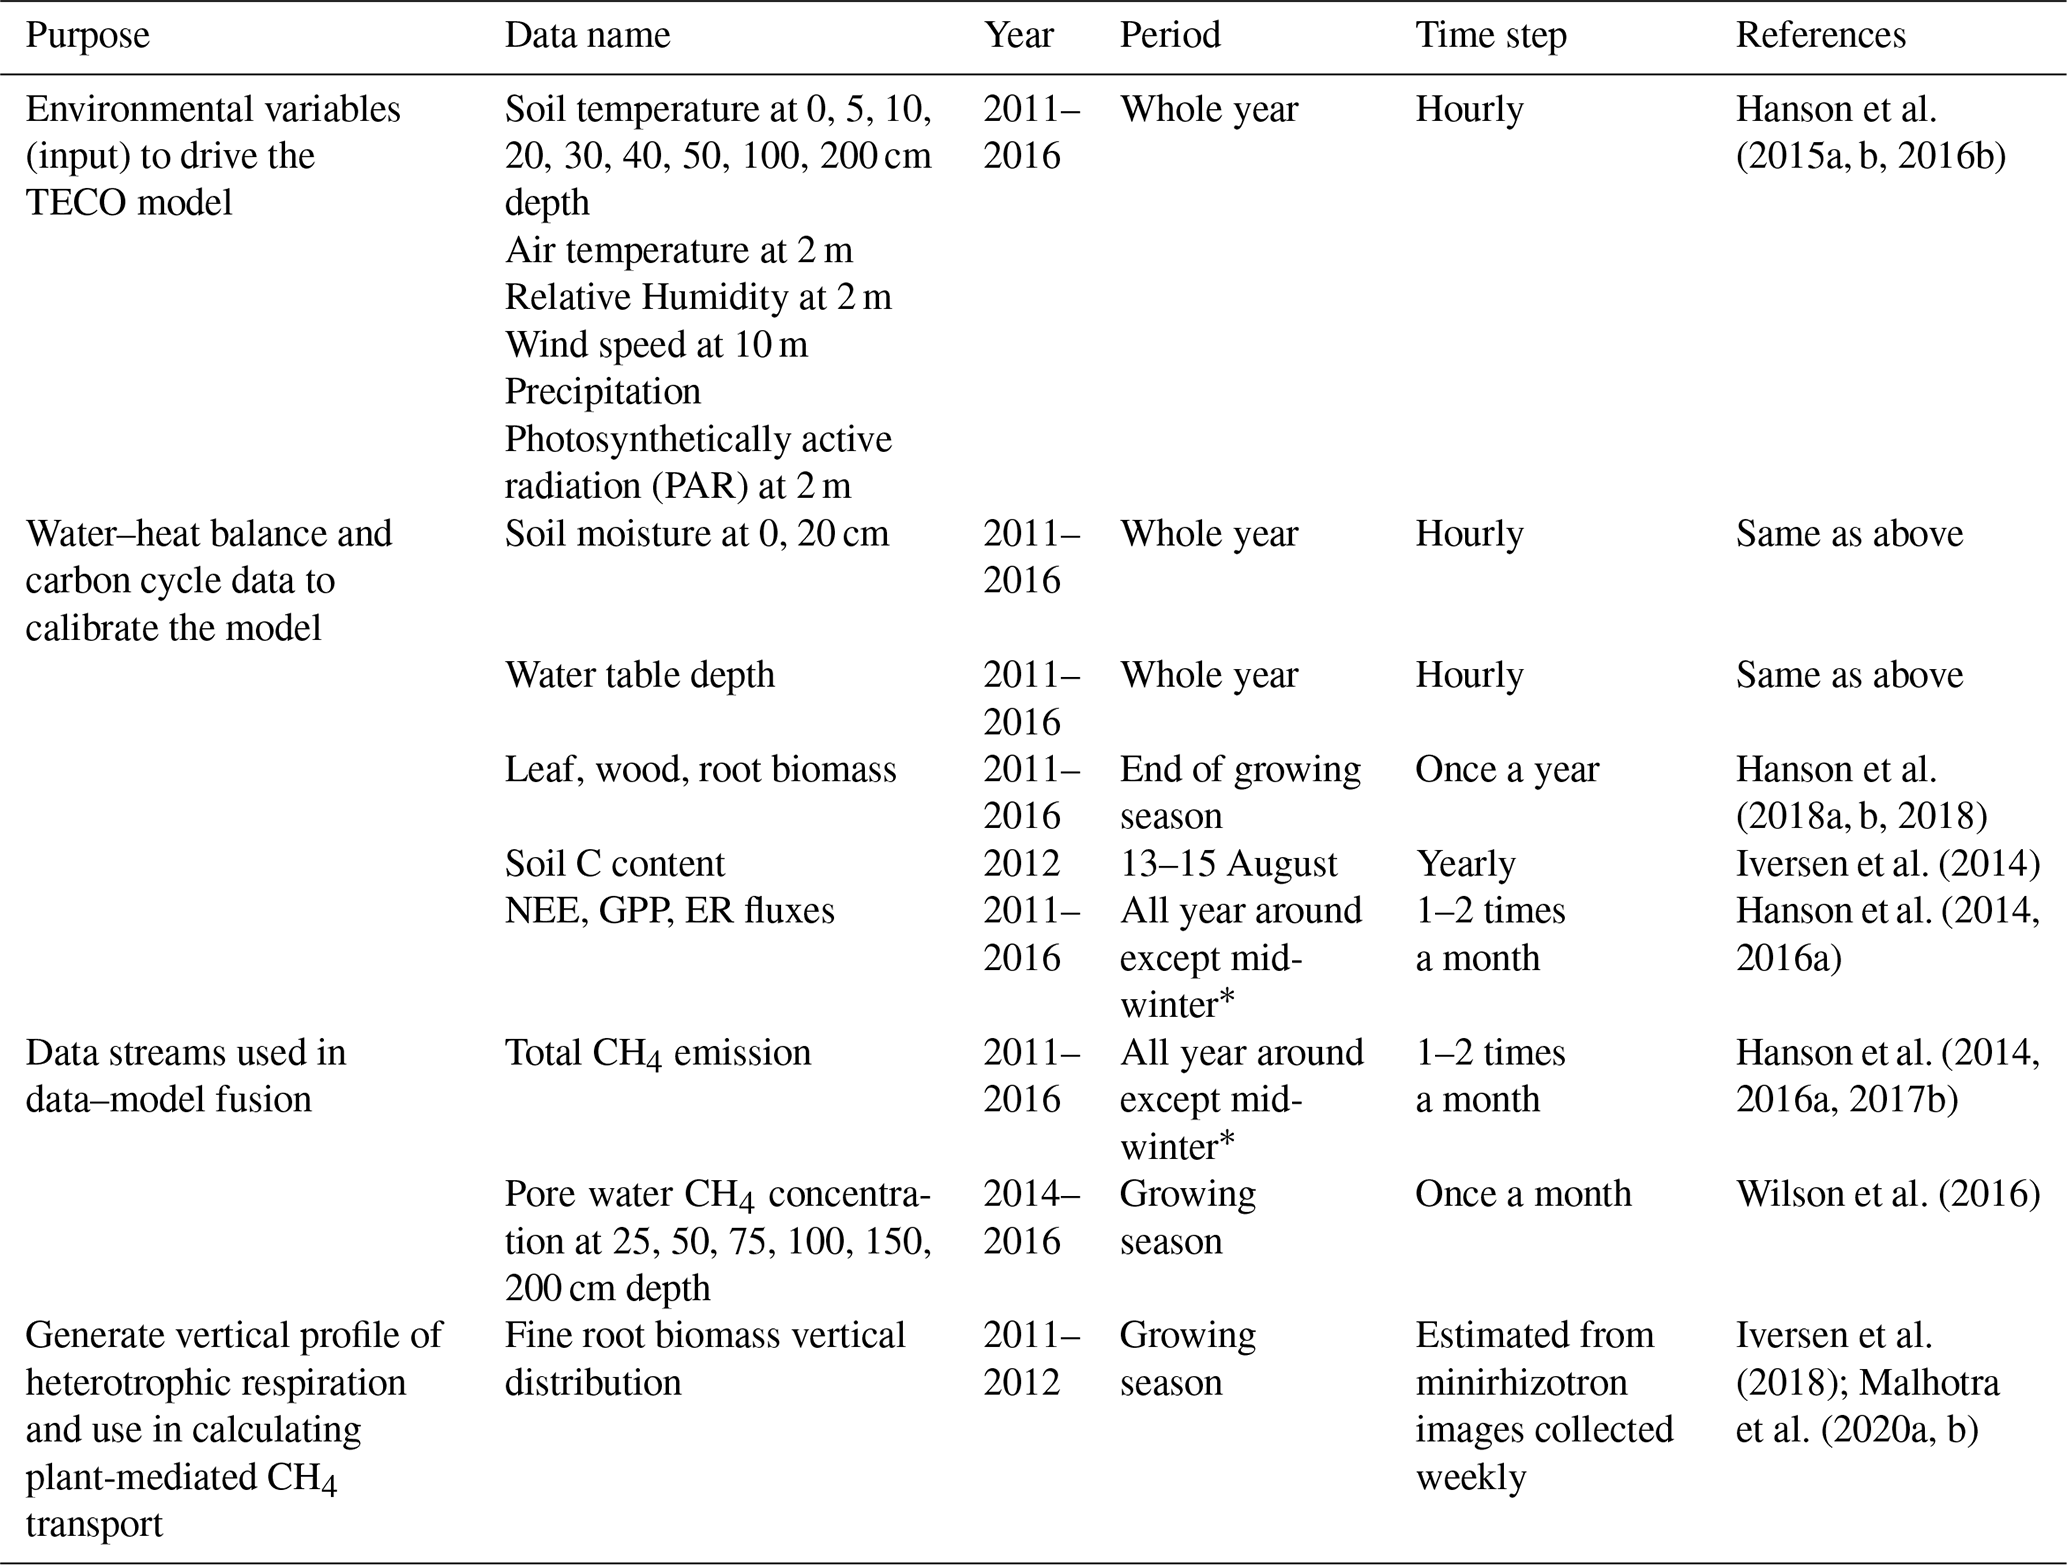
∗ Total CH4 emissions were measured in August, September, and October 2011, May through November 2012, July, September, and October 2013, June through December 2014, April through November 2015, and March through December 2016.
2.1 Site and measurements
The data we used to calibrate our model were collected from the Spruce and Peatland Responses Under Changing Environments (SPRUCE) experiment, which is conducted in the 8.1 ha S1 bog in northern Minnesota in the USDA Forest Service Marcell Experimental Forest (47∘30.476′ N, 93∘27.162′ W) to study the responses of northern peatlands to climate warming and elevated atmospheric CO2 concentration (Hanson et al., 2017a). The mean annual temperature from 1961 to 2009 at the SPRUCE site was 3.4 ∘C, and the mean annual precipitation was 780 mm (Sebestyen et al., 2011). The mean peat depth is 2–3 m (Parsekian et al., 2012). The dominant plant species include Picea mariana, Larix laricina, a variety of ericaceous shrubs, and Sphagnum sp. moss. The graminoids Carex trisperma and Eriophorum vaginatum, as well as the forb Maianthemum trifolium, have seasonal dieback of their aboveground tissues in this peatland. Whole-ecosystem warming levels of +0, +2.25, +4.5, +6.75, and +9 ∘C are paired with two CO2 treatments (ambient or ∼ 400 ppm and 900 ppm) in open-top infrastructures (12 m × 8 m). Deep peat warming began in June 2014, aboveground warming began in August 2015, and elevated CO2 treatments began in June 2016. In this study, however, all observed data we used were only from ambient plots (no infrastructures and no warming treatment) for our research goals, and we did not explore the warming effects on CH4 processes. Modeling CH4 emissions in response to warming and elevated CO2 at this experiment site can be found in Yuan et al. (2021). A complete list of data streams used in this study is included in Table 1.
Environmental variables, including soil temperature, air temperature, relative humidity, wind speed, precipitation, and photosynthetically active radiation plots, were used as model input data. Measurements of environmental variables in ambient plots started in 2011. Soil temperature and moisture in different layers, water table depth (Hanson et al., 2015a, b, 2016b), carbon pools (leaf, wood, root, and peat soil; Hanson et al., 2018a, b; Norby and Childs, 2018; Norby et al., 2019), and community-scale fluxes, including gross primary production (GPP), net ecosystem exchange (NEE), ecosystem respiration (ER), and CH4 flux data (Hanson et al., 2014; Hanson et al., 2016a, 2017b), were used to calibrate the modeled water–heat balance and carbon cycle similarly as in our earlier studies (Huang et al., 2017; Ma et al., 2017; Jiang et al., 2018).
CH4 fluxes and pore water CH4 concentrations were used for data assimilation. We averaged the data from all ambient plots measured on the same dates to represent the site-level CH4 emissions and concentration profiles. Variations among different ambient plots were not considered in this study. In total, 45 daily CH4 emission measurements were obtained from ambient plots from 2011 to 2016. In situ pore water CH4 concentrations were measured monthly during the growing seasons in 2014–2016 (11 profiles in total) with the pore water samples collected from a series of piezometers permanently installed in the plots at 25, 50, 75, 100, 150, and 200 cm depths, respectively (Wilson et al., 2016). Piezometers consisted of a < 1 cm diameter pipe that limited diffusion. A total of 24 h prior to sampling, piezometers were pumped dry and allowed to recharge naturally so that the sampled water would not have been in prolonged contact with the atmosphere prior to collection. A perforated stainless-steel tube was inserted into the peat to collect samples within 0–25 cm depth. Samples were immediately filtered in the field through 0.7 µM Whatman glass-fiber filters and stored in pre-evacuated, septum-sealed glass vials. Phosphoric acid (1 mL, 20 %) was added to preserve each sample during shipment to Florida State University for analyzing CH4 concentrations.
2.2 Model description
2.2.1 Overview of TECO_SPRUCE
For this study, we used the process-based biogeochemistry model TECO_SPRUCE (Terrestrial ECOsystem model at the SPRUCE site). The model was built with six major modules running at an hourly time step: canopy photosynthesis, soil water dynamics, plant growth, soil thermal dynamics, soil carbon–nitrogen (N) transfer, and soil CH4 dynamics. A detailed description of these modules can be found in Weng and Luo (2008), Shi et al. (2015b), Huang et al. (2017), and Ma et al. (2017). Here we give a brief description of these modules but describe in detail how we calculated CH4 ebullition with the EBG and ECT approaches.
The canopy photosynthesis module was mainly derived from a two-leaf model. It couples surface energy, water, and carbon fluxes. Leaf photosynthesis is estimated based on the Farquhar photosynthesis model (Farquhar et al., 1980) and the Ball and Berry stomatal conductance model (Ball et al., 1987). The soil water dynamic module has 10 soil layers and simulates water table level and soil moisture dynamics using rainfall, snowmelt, evapotranspiration, and runoff. Evaporative losses of water and associated latent heat are regulated by soil moisture in the first layer and atmospheric demand. Transpiration is determined by stomatal conductance and soil water content of the layers with roots present. When precipitation exceeds water recharge to soil water holding capacity, runoff occurs. The water table level is estimated using a simple bucket model as described by Granberg et al. (1999). The plant growth module calculates the allocation of photosynthesis carbon to individual plant pools (foliage, stem, and root), plant growth, plant respiration, phenology, and carbon transfer to the litter and soil carbon pools. Leaf onset is regulated by growing degree days (GDDs), and leaf senescence is determined by low-temperature and/or dry soil conditions. Phenology is represented by the seasonal variations in leaf area index (LAI) with LAI < 0.1 indicating the end of the growing season. The soil thermal dynamics module simulates snow cover, freezing depth, and soil temperature in 10 layers. The soil C–N transfer module simulates the movement of C and N from plants to two litter pools and three soil pools through litterfall, litter decomposition, and soil organic matter mineralization. Carbon fluxes from the litter and soil carbon pools are based on residence time and pool size of each C pool (Luo and Reynolds, 1999).
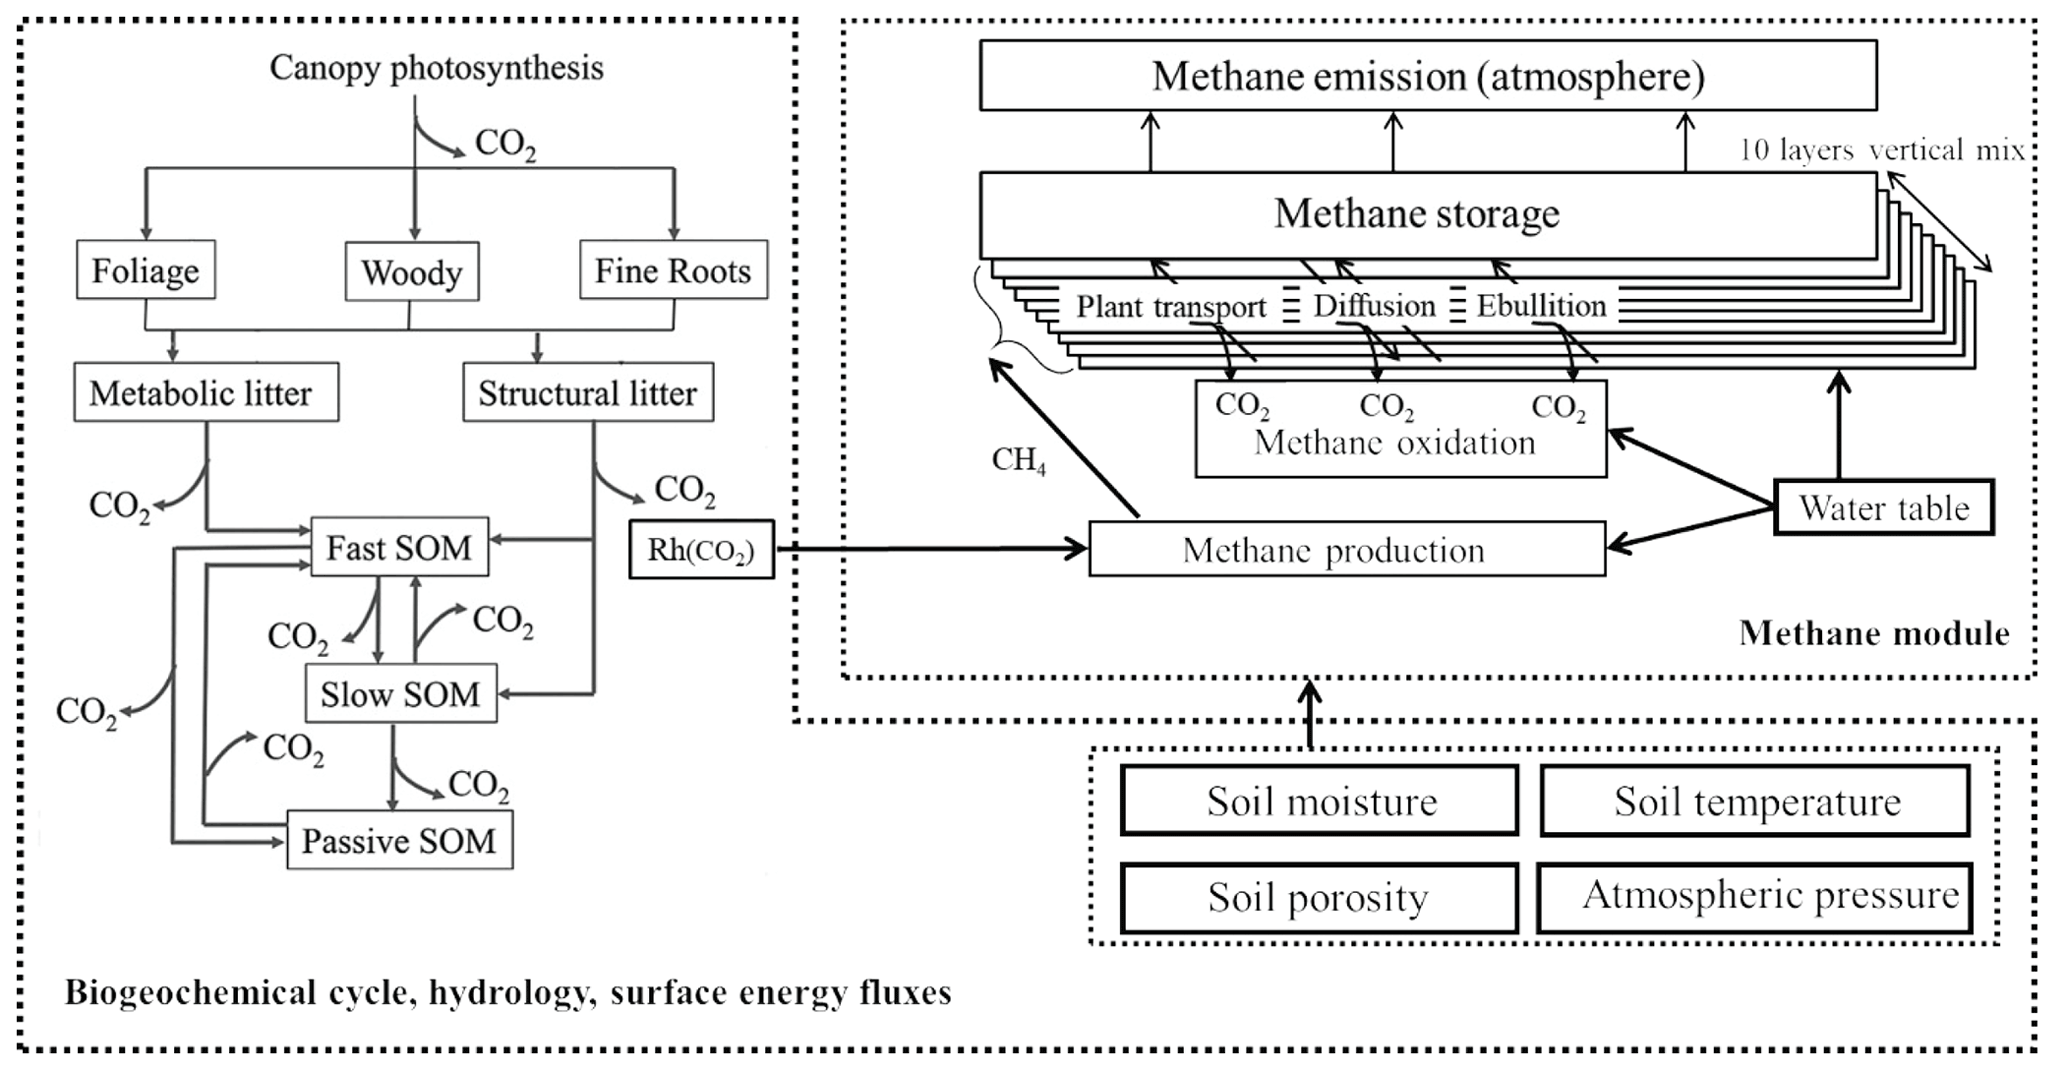
The CH4 module simulates the transient, vertical dynamics of CH4 production, oxidation, and belowground transport (via ebullition, plant-mediated transport, and diffusion), as well as CH4 emissions at the soil surface–atmosphere interface (Fig. 1). The soil column is divided into 10 layers with each of the first five layers being 10 cm thick, whereas each of the rest of the layers are 20 cm thick. Within each soil layer, CH4 concentration dynamics are calculated by a transient reaction equation with CH4 production, CH4 oxidation, released bubbles, plant-mediated transport, and the diffusion of CH4 into and out of this soil layer from the lower and upper soil layer or the atmosphere for the first layer. Similar to CLM4Me (Riley et al., 2011), LPJ-WHyMe (Spahni et al., 2011; Wania et al., 2010), and TRIPLEX-GHG (Zhu et al., 2014) models, we assume that CH4 production (Pro) within the catotelm is directly related to heterotrophic respiration from soil and litter (Rh, ) via the following equation:
where is an ecosystem-specific conversion scaler describing the fraction of anaerobically mineralized C atoms becoming CH4. The parameters fstp, fpH, and fred are environmental scalers, representing the effects of soil temperature, pH, and redox potential, respectively, on CH4 production. Total emission of CH4 from the soil to the atmosphere is calculated as the sum of CH4 ebullition from saturated soil layers, plant-mediated CH4 emissions from all the soil layers, and the diffused flux from the first soil layer into the atmosphere. A sensitivity test was done to decide which parameters need to be optimized by data–model fusion (Ma et al., 2017), and more detailed descriptions on the CH4 module can be found in Ma et al. (2017).
The original method used in TECO_SPRUCE for the ebullition process was the constant concentration threshold method (Walter and Heimann, 2000; Ma et al., 2017). However, a number of factors such as atmospheric pressure, water table level, and temperature have been shown to affect ebullition (Beckmann et al., 2004; Kellner et al., 2006; Tokida et al., 2007a). Here, we used two new methods, i.e., the modified concentration threshold method (ECT) and the bubble growth volume threshold method (EBG), to describe CH4 ebullition. In both methods, direct ebullition into the atmosphere can take place only when the water table level is at or above the soil surface; otherwise, CH4 in bubbles is added to the soil layer just above the water table and then continues to diffuse through the soil layers to the atmosphere. Below we describe these two methods in detail.
2.2.2 Ebullition approach based on the concentration threshold (TECO_SPRUCE_ECT)
With the concentration threshold approach, we assume that bubbles form when the CH4 concentration exceeds a certain threshold based on the equilibrium concentration defined by Henry's law. Instead of using a constant value for the threshold, in this study, we allowed the threshold to fluctuate with atmospheric pressure, water column pressure, and soil temperature, following the method proposed by Wania et al. (2010). The maximum solubility of CH4 at a given temperature was calculated using a statistical model used by Yamamoto et al. (1976) based on the empirical data:
where V is the Bunsen solubility coefficient, defined as the volume of gas dissolved per volume of water at atmospheric pressure and a given temperature. The volume of CH4 dissolved per volume of water was converted into grams using the ideal gas law:
where is the maximum concentration threshold (g C m−3), P is the sum of the atmospheric and hydrostatic pressures (Pa), V is the Bunsen solubility coefficient as in Eq. (2), the constant C is the atomic weight of carbon (12 g mol−1), the gas constant R is 8.3145 , and T is the temperature (K). Then the CH4 ebullition flux can be calculated using the following equation:
where Ebu(z,t) is the ebullition flux of CH4 (g C h−1) to the lowest air layer, Kebu is a rate constant of 1.0 h−1 (Walter and Heimann, 2000; Zhuang et al., 2004, 2006), and [CH4](z,t) is the pore water CH4 concentration in soil depth z at model time step t.
2.2.3 Ebullition approach based on the bubble growth volume threshold (TECO_SPRUCE _EBG)
In contrast to the concentration threshold approach, the EBG approach uses bubble volume as a threshold to trigger ebullition events (Fechner-Levy and Hemond 1996), and it has been applied to model CH4 ebullition (Kellner et al., 2006; Zhang et al., 2012; Peltola et al., 2018). The total bubble volume in each soil layer is calculated and updated continuously based on the ideal gas law and Henry's law. In detail, if CH4 concentration exceeds the limit that the water can withhold based on Henry's law, then excess CH4 is converted to a gaseous volume calculated using the predefined bubble CH4 mixing ratio (f). This gaseous volume is divided evenly into a certain number of bubbles (Nbub). Nbub is a unitless tuning parameter ranging between 5 and 500 in each 10 cm thick soil layer and 10 and 1000 in each 20 cm thick soil layer, which essentially controls the mass exchange rate between the gas volume and the pore water. The CH4 exchange between the stationary bubbles and the pore water (Qebu) is calculated using the equation proposed by Epstein and Plesset (1950):
where r is the radius of a bubble (m), Dw is the CH4 diffusion coefficient in water (m2 s−1) calculated using the quadratic curve of observed diffusivities against temperatures (Broecker and Peng, 1974), Vw is the amount of water in this layer (m3), cw is dissolved CH4 concentration in the pore water, and Hcc is the dimensionless Henry solubility of CH4 calculated following Sander (1999). P, R, and T are the same as in Eq. (3). A negative value of Qebu indicates CH4 transfer from the bubbles back to the pore water. This reverse gas exchange mechanism has not been included in other ebullition methods but has been revealed as an important process in empirical studies (McGinnis et al., 2006; Rosenberry et al., 2006). The ebullition flux Ebu(z,t) is then calculated when the bubble volume at a certain depth (z) exceeds the volume threshold (Vmax) within the time step t:
where Vmaxfraction is the free-phase gas-filled fraction of the pore space in the soil layer above which ebullition occurs, cb is the CH4 concentration in a bubble (mol m−3), VB is the total volume of all bubbles, and ΔVB is the change in the total volume due to the diffusive gas exchange in Eq. (5). The amount of CH4 in all bubbles after each time step is
where f is the predefined bubble CH4 mixing ratio as mentioned earlier, and is the updated total bubble volume after each time step. Excess bubbles will be released into the lowest air layer within one time step unless they are trapped in the soil profile. To determine if a bubble will be trapped, we adopted an approach similar to Peltola et al. (2018), assuming that the probability for a bubble to be trapped within a certain soil layer is a predefined constant number (bubprob); thus the bubbles formed in deeper layers would have a larger probability of being trapped during ascent. In contrast, all other ebullition modeling methods assume that no bubbles will get trapped.
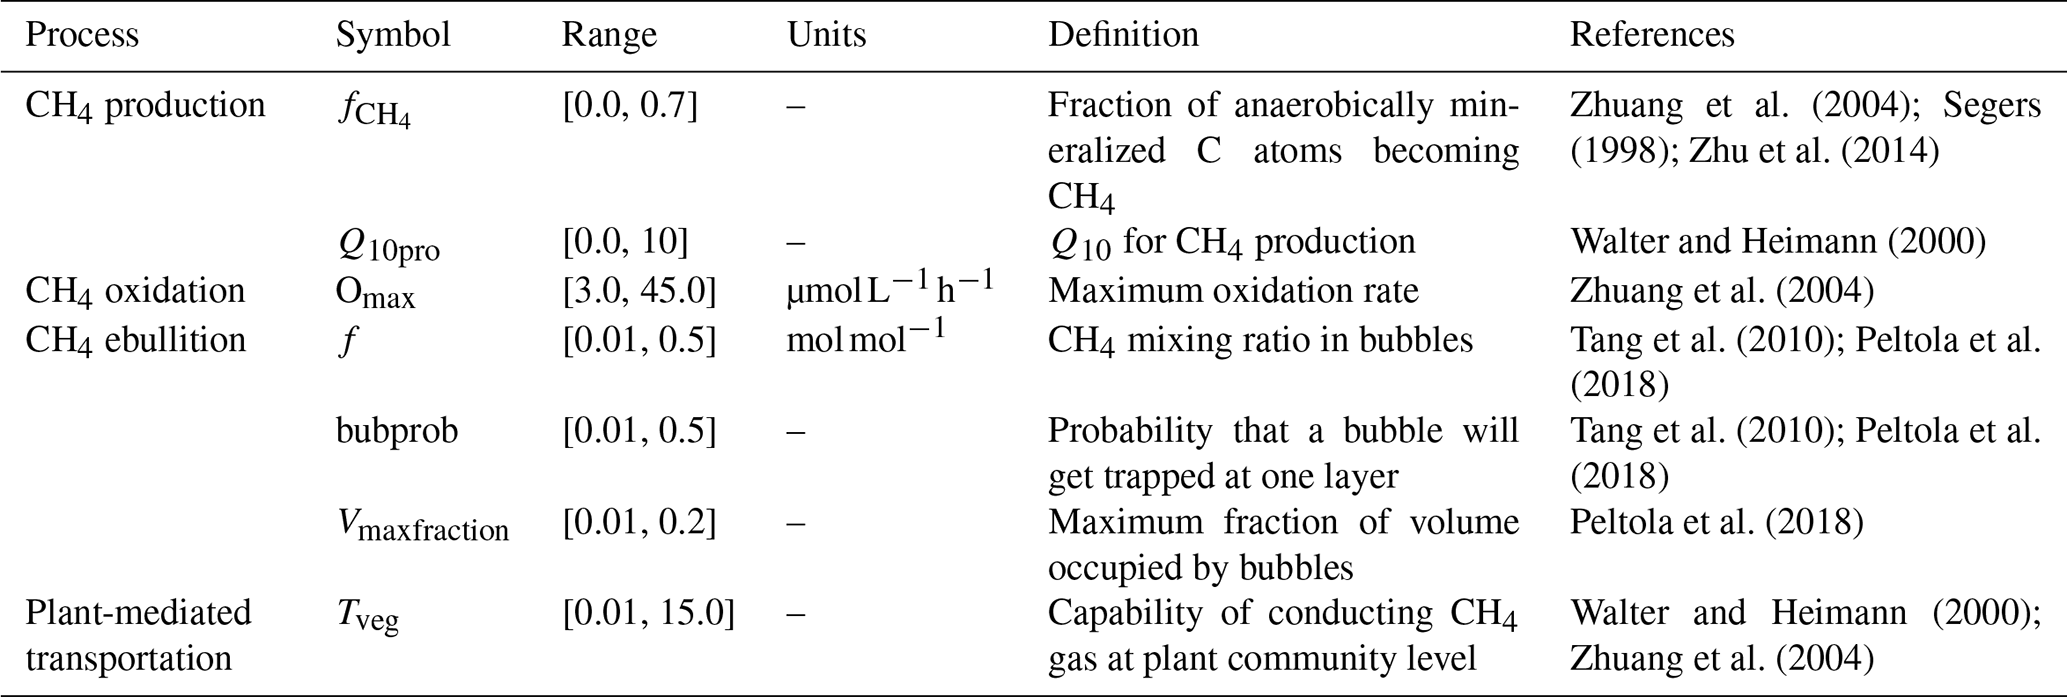
The values of bubprob, f, and Vmaxfraction are dependent on the soil texture, porosity, water content, etc. and have been found to significantly affect the modeled CH4 fluxes, the layers where bubbles were formed, and the number of ebullition events (Zhang et al., 2012; Peltola et al., 2018). The tuning parameter, Nbub, however, has a minimal effect on modeled ebullition (Peltola et al., 2018). In this study, we used the empirical values measured from other sites or the values used in other models as the prior ranges of bubprob, f, and Vmaxfraction in our models (Table 2). Then we constrained these parameter values via data–model techniques so that the model estimation of the ebullition process was more accurate.
2.3 Data–model fusion
We used the Markov chain Monte Carlo (MCMC) method based on the Metropolis–Hasting algorithm (Metropolis et al., 1953) to optimize the posterior distribution of parameters and explore model uncertainty. Both the observed data and simulated results were rescaled to a daily emission unit for comparison. The prior range for each parameter was assumed to be uniformly distributed, which indicates that all values within the range have equal likelihood. We also assumed that errors between observations and model simulations independently follow a normal distribution with a zero mean. The cost function weights the mismatch between observations and the modeled corresponding variables, represented by
where Zi(t) is the ith observation stream at time t, X(t) is the model simulated value, and σi(t) is the standard deviation of observation error estimates.
The parameter space was explored for 50 000 iterations during the optimization process. The new parameter value at the current step was based on the accepted parameter in the previous step by a proposed distribution. The current value was accepted if the observation–model difference was reduced or otherwise passed with a random probability. We ran five chains of 50 000 simulations and used the Gelman–Rubin statistic (Gelman and Rubin, 1992) to check the convergence of sampling chains. The first half of the accepted parameters were discarded as the burn-in period, and the second half were used for posterior analysis. More details on sampling and the cost function can be found in Xu et al. (2006).
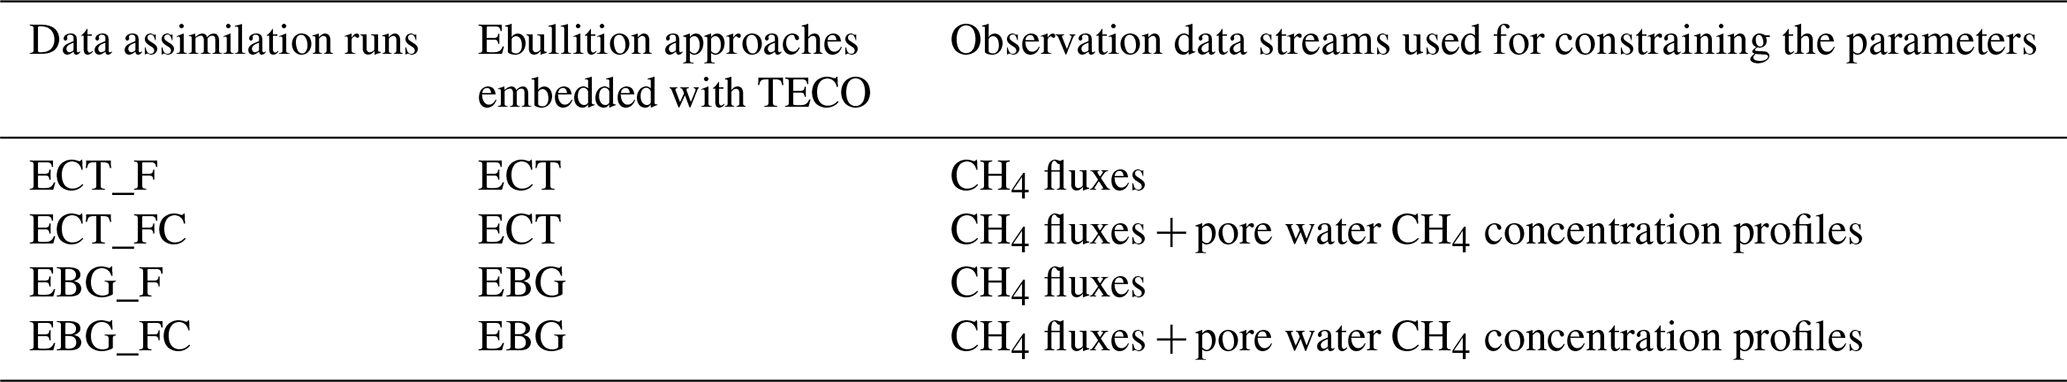
Parameters directly regulating CH4 emission pathway and belowground dynamics and their prior ranges used for data assimilation are listed in Table 2. Specifically, we selected four parameters (i.e., , Q10pro, Omax, and Tveg) from the TECO_SPRUCE_ECT and seven parameters (all the seven parameters in Table 2) from the TECO_SPRUCE_EBG during data assimilation. The prior ranges were determined by combining information from empirical measurements or modeling studies from peatland ecosystems. The in situ CH4 emission and pore water CH4 concentration data from ambient plots (Table 1) were used as observations to constrain model parameters. In order to evaluate how a proper model structure and constrained parameter values help improve model-simulated CH4 emission pathways, we conducted four data assimilation runs with the TECO_SRUCE model, as shown in Table 3.
We illustrate the improvement from model structure by comparing ECT_F and EBG_F, which were calibrated using the observed CH4 flux data. Then we compare results from EBG_F and EBG_FC to show the ability of pore water CH4 concentration data to help constrain the parameters related to the CH4 emission pathways. Model performance was evaluated against the observed data using root mean square error (RMSE). Model uncertainties in pore water CH4 concentrations were quantified as the standard deviation across all soil layers in each of the model runs listed in Table 3.
Table 4Parameter values for the posterior distribution of parameters.
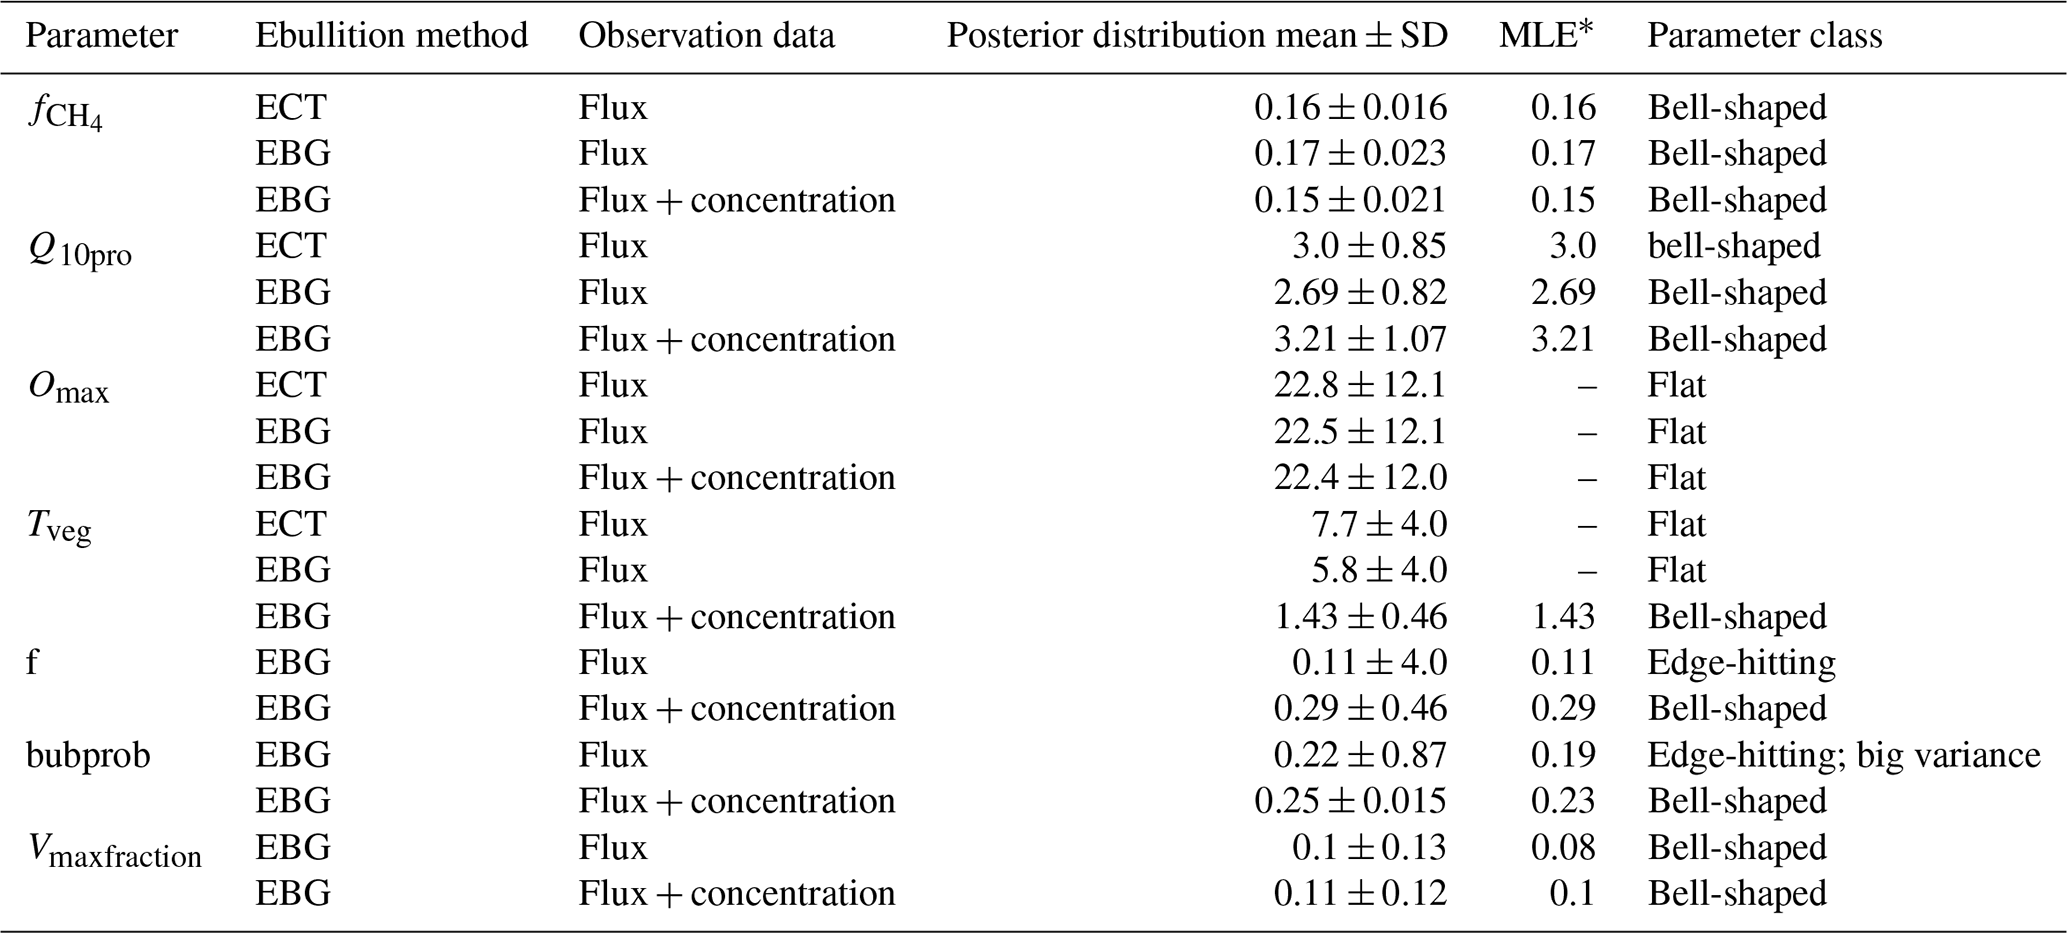
∗ MLE: maximum likelihood estimation.
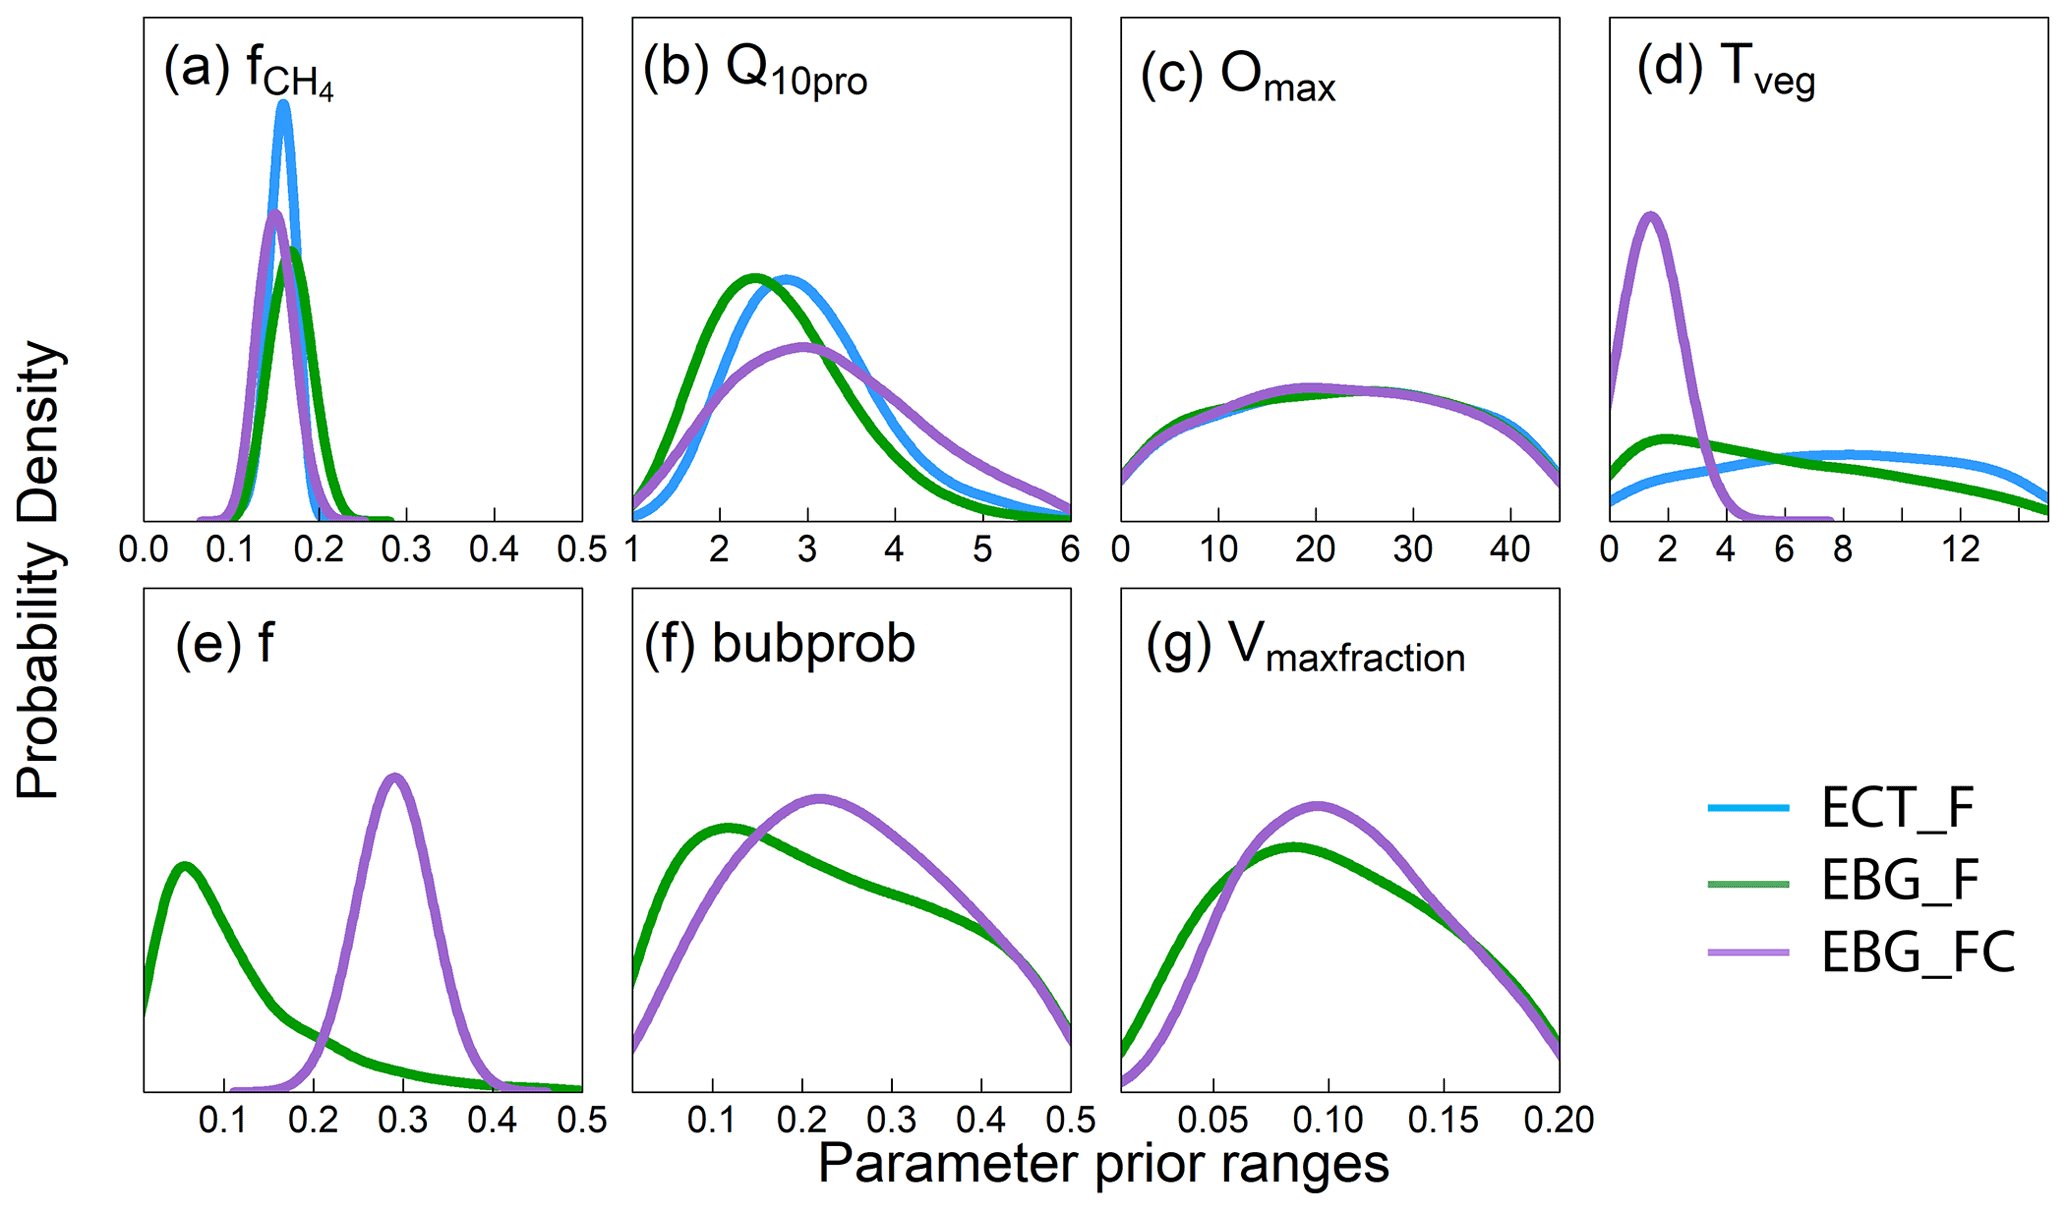
Figure 2Posterior distribution of parameters that govern methane emission processes from data–model fusion. Parameters are defined in Table 2. Panels (a) and (b) are parameters related to methane production, (c) is a parameter related to methane oxidation, (d) is a parameter related to plant transport, and (e–g) are parameters related to ebullition. X axes indicate the prior ranges of parameters used for data–model fusion. The blue lines are the parameter posterior distributions (PPDs) from the ECT model structure trained with CH4 emission data (ECT_F). The green lines are the PPDs from the EBG model structure trained with CH4 emission data (EBG_F). The purple lines are the PPDs from EBG trained with both CH4 emission and CH4 concentration data (EBG_FC). Well-constrained parameters have a unimodal distribution, whereas poorly constrained parameter distributions tend to be flat.
3.1 Parameter optimization using CH4 flux data with different model structures
The CH4 production-related parameters, (fraction of anaerobically mineralized C atoms becoming CH4) and Q10pro (temperature sensitivity of CH4 production), were constrained using the CH4 emission flux data for both TECO_SPRUCE_ECT and TECO_SPRUCE_EBG (Table 4, Fig. 2a and b). However, the maximum likelihood estimates (MLEs) for parameters varied between the two models (Table 4), with slightly increased from 0.16 to 0.17 and Q10pro decreased from 3.0 to 2.69 in the EBG approach compared to the ECT approach. In contrast, Omax and Tveg were not constrained in either model with large uncertainties in model-estimated CH4 oxidation and plant transport parameters (Table 4, Fig. 2c and d).
Of the three ebullition-related parameters used only in the EBG approach, when assimilating only the CH4 emission flux data, Vmaxfraction (maximum fraction of volume occupied by bubbles) was constrained with a unimodal shaped posterior distribution (Fig. 2g), f(CH4 mixing ratio in bubbles) was edge hitting with a marginal distribution downward (Fig. 2e), and bubprob (probability that a bubble will get trapped at a certain soil layer) was constrained with a wide, slightly domed distribution (Fig. 2f).
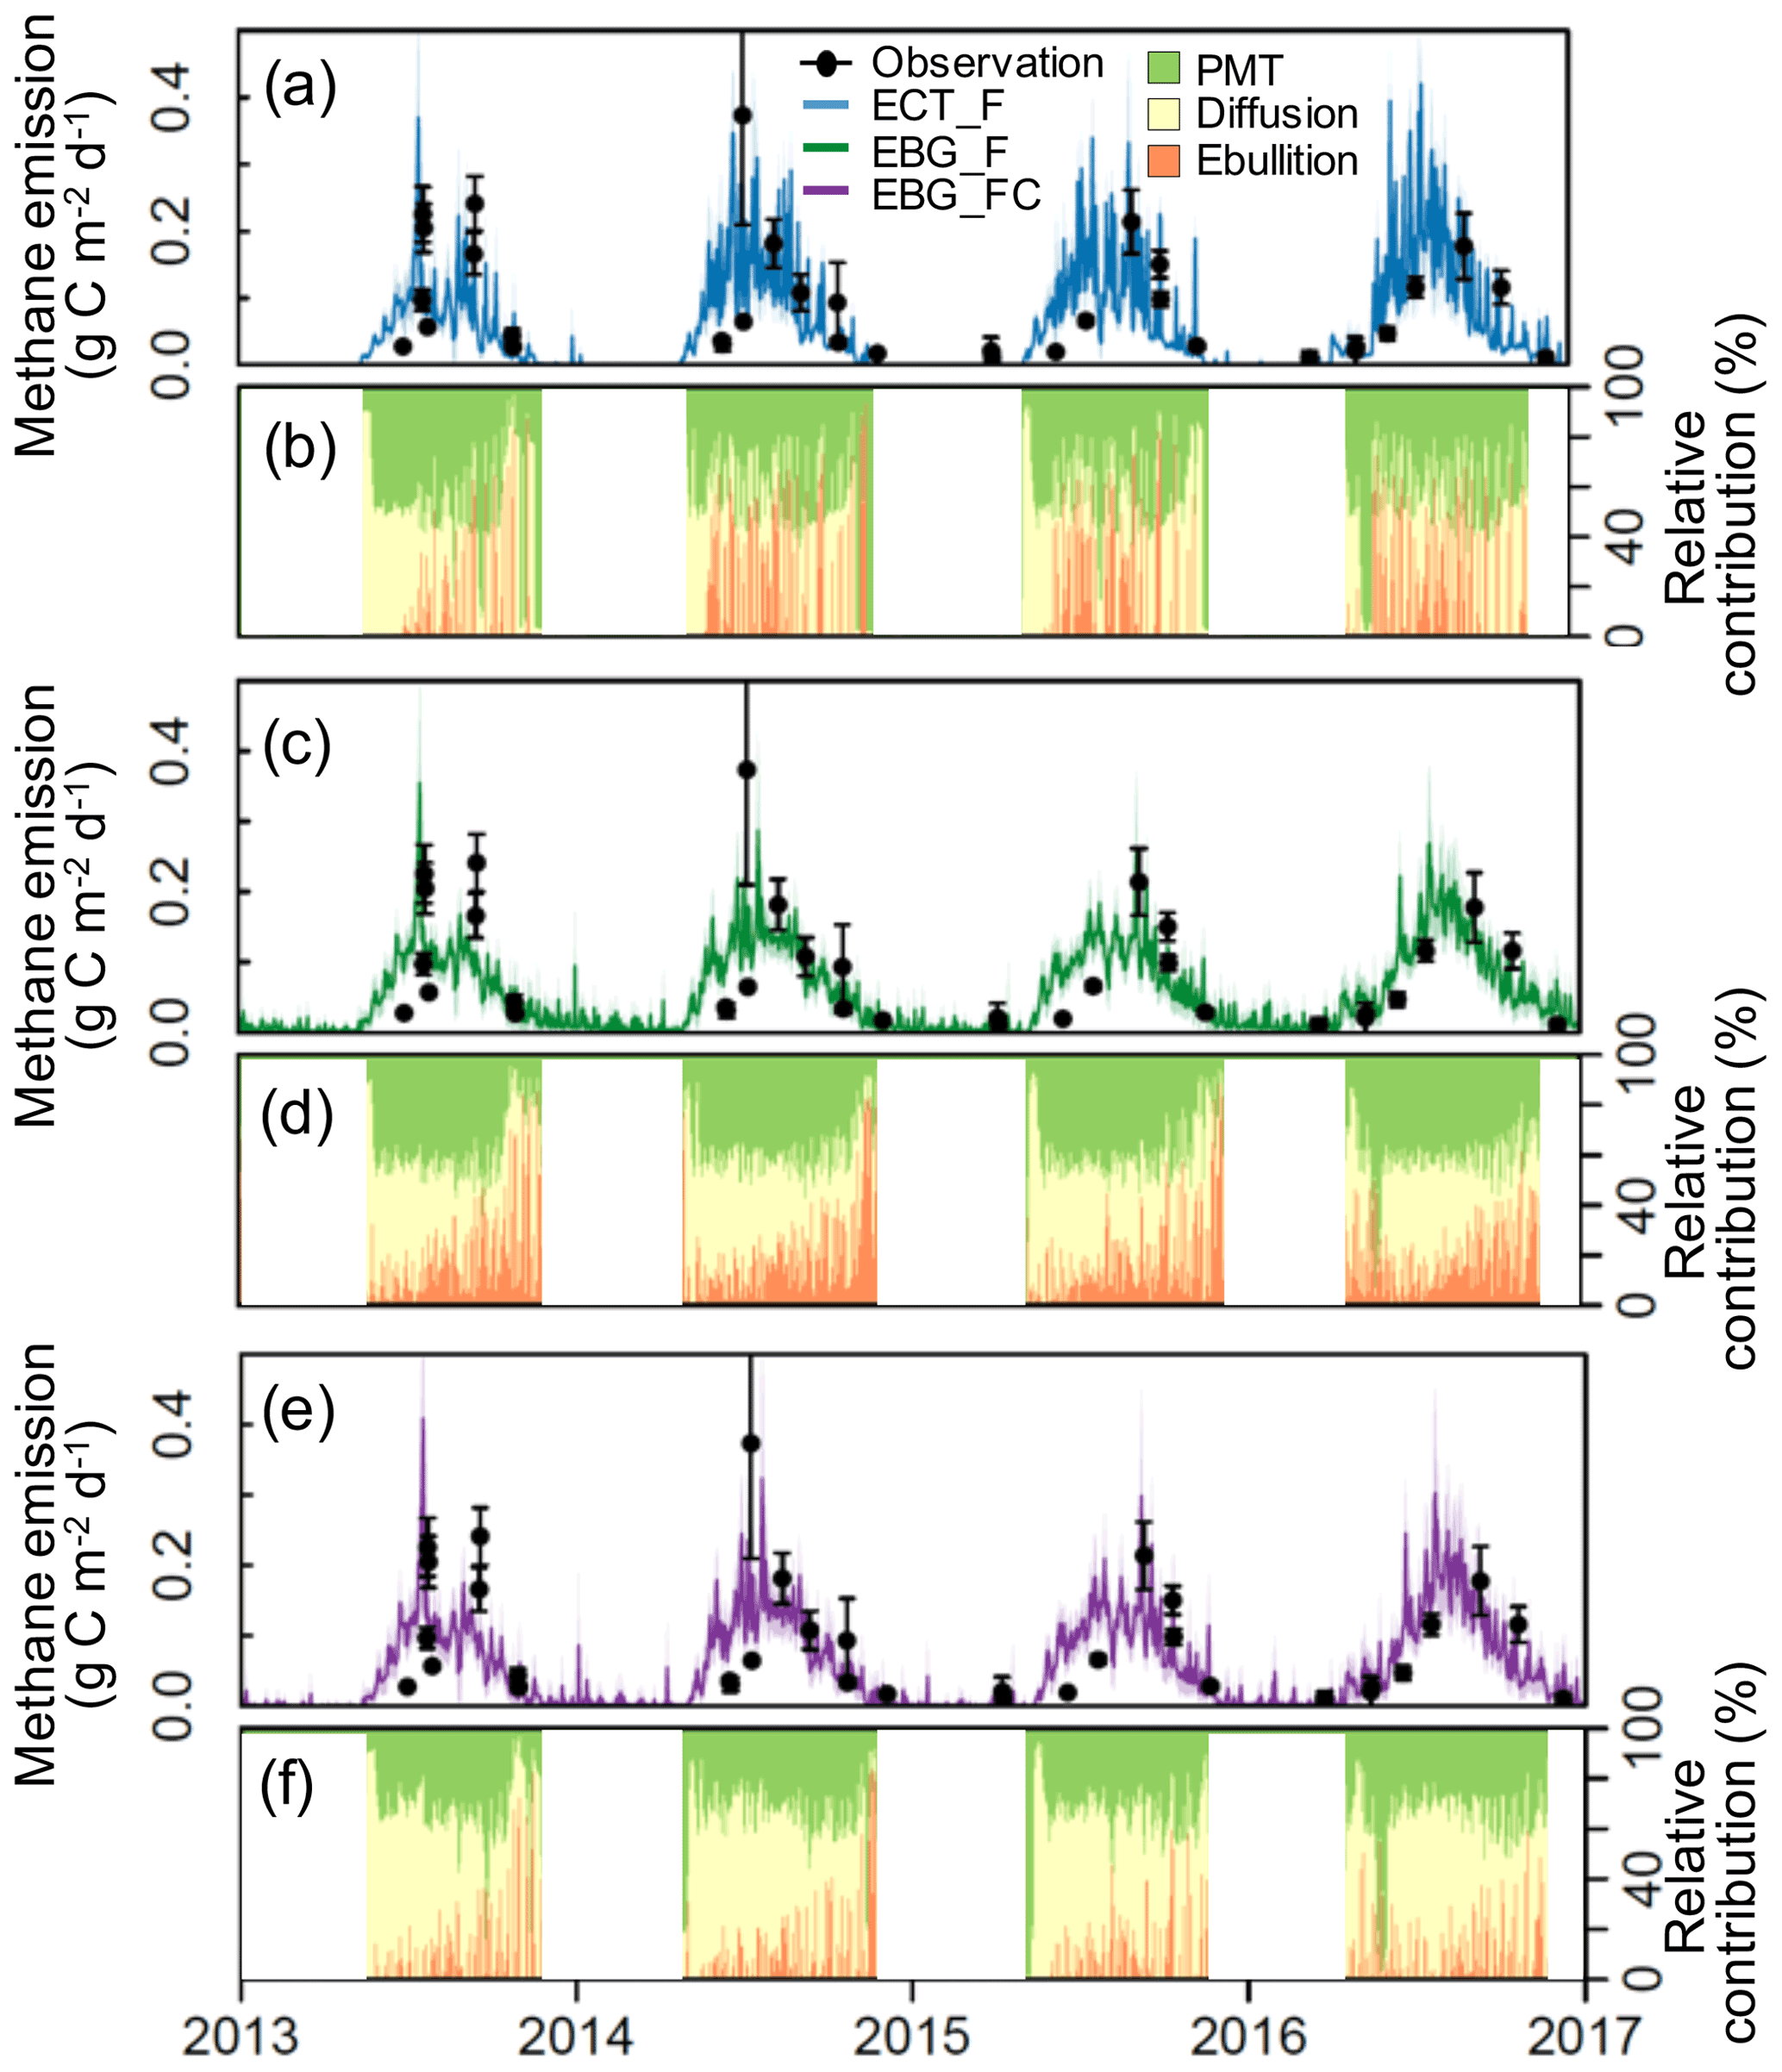
Figure 3Observed versus modeled methane emissions (a, c, and e) and simulated relative contributions (%) of plant-mediated transportation (PMT), diffusion, and ebullition under ambient conditions (b, d, and f). Black dots are observed CH4 emissions from static chamber measurements. Error bars are the standard errors. Blue lines are ECT-model-simulated CH4 emissions based on the parameter probability distributions (PPDs) constrained by CH4 flux data (ECT_F, RMSE = 0.61). Green lines are EBG-model-simulated CH4 emissions based on the PPDs constrained by CH4 flux data (EBG_F, RMSE = 0.53). Purple lines are EBG-model-simulated emissions based on the PPDs constrained by both CH4 flux and concentration data (EBG_FC, RMSE = 0.52). The mid-lines and shaded areas correspond to the means and standard deviations, respectively, from 500 model simulations with parameters randomly drawn from the posterior distributions. Relative contributions (%) are the daily mean values calculated from the simulations.
3.2 Evaluations of model structures against the observed data
Using CH4 emission data to constrain the parameters, EBG-simulated CH4 emissions (RMSE = 0.53, Fig. 3c) had a better agreement with observations than ECT (RMSE = 0.61, Fig. 3a). In addition, EBG simulated a smaller seasonal variability in CH4 emissions (Fig. 3c) than ECT (Fig. 3a). The simulated contributions from plant-mediated transport, diffusion, and ebullition were 40.7 ± 8.0 %, 35.7 ± 8.7 %, and 23.5 ± 9.4 %, respectively, in ECT_F (Fig. 3b) and 38.4 ± 13.9 %, 38.7 ± 9.9 %, and 22.7 ± 9.4 %, respectively, in EBG_F (Fig. 3d). Compared to ECT (Fig. 3b), EBG simulated a smaller contribution from ebullition but more frequent ebullition events (Fig. 3d).
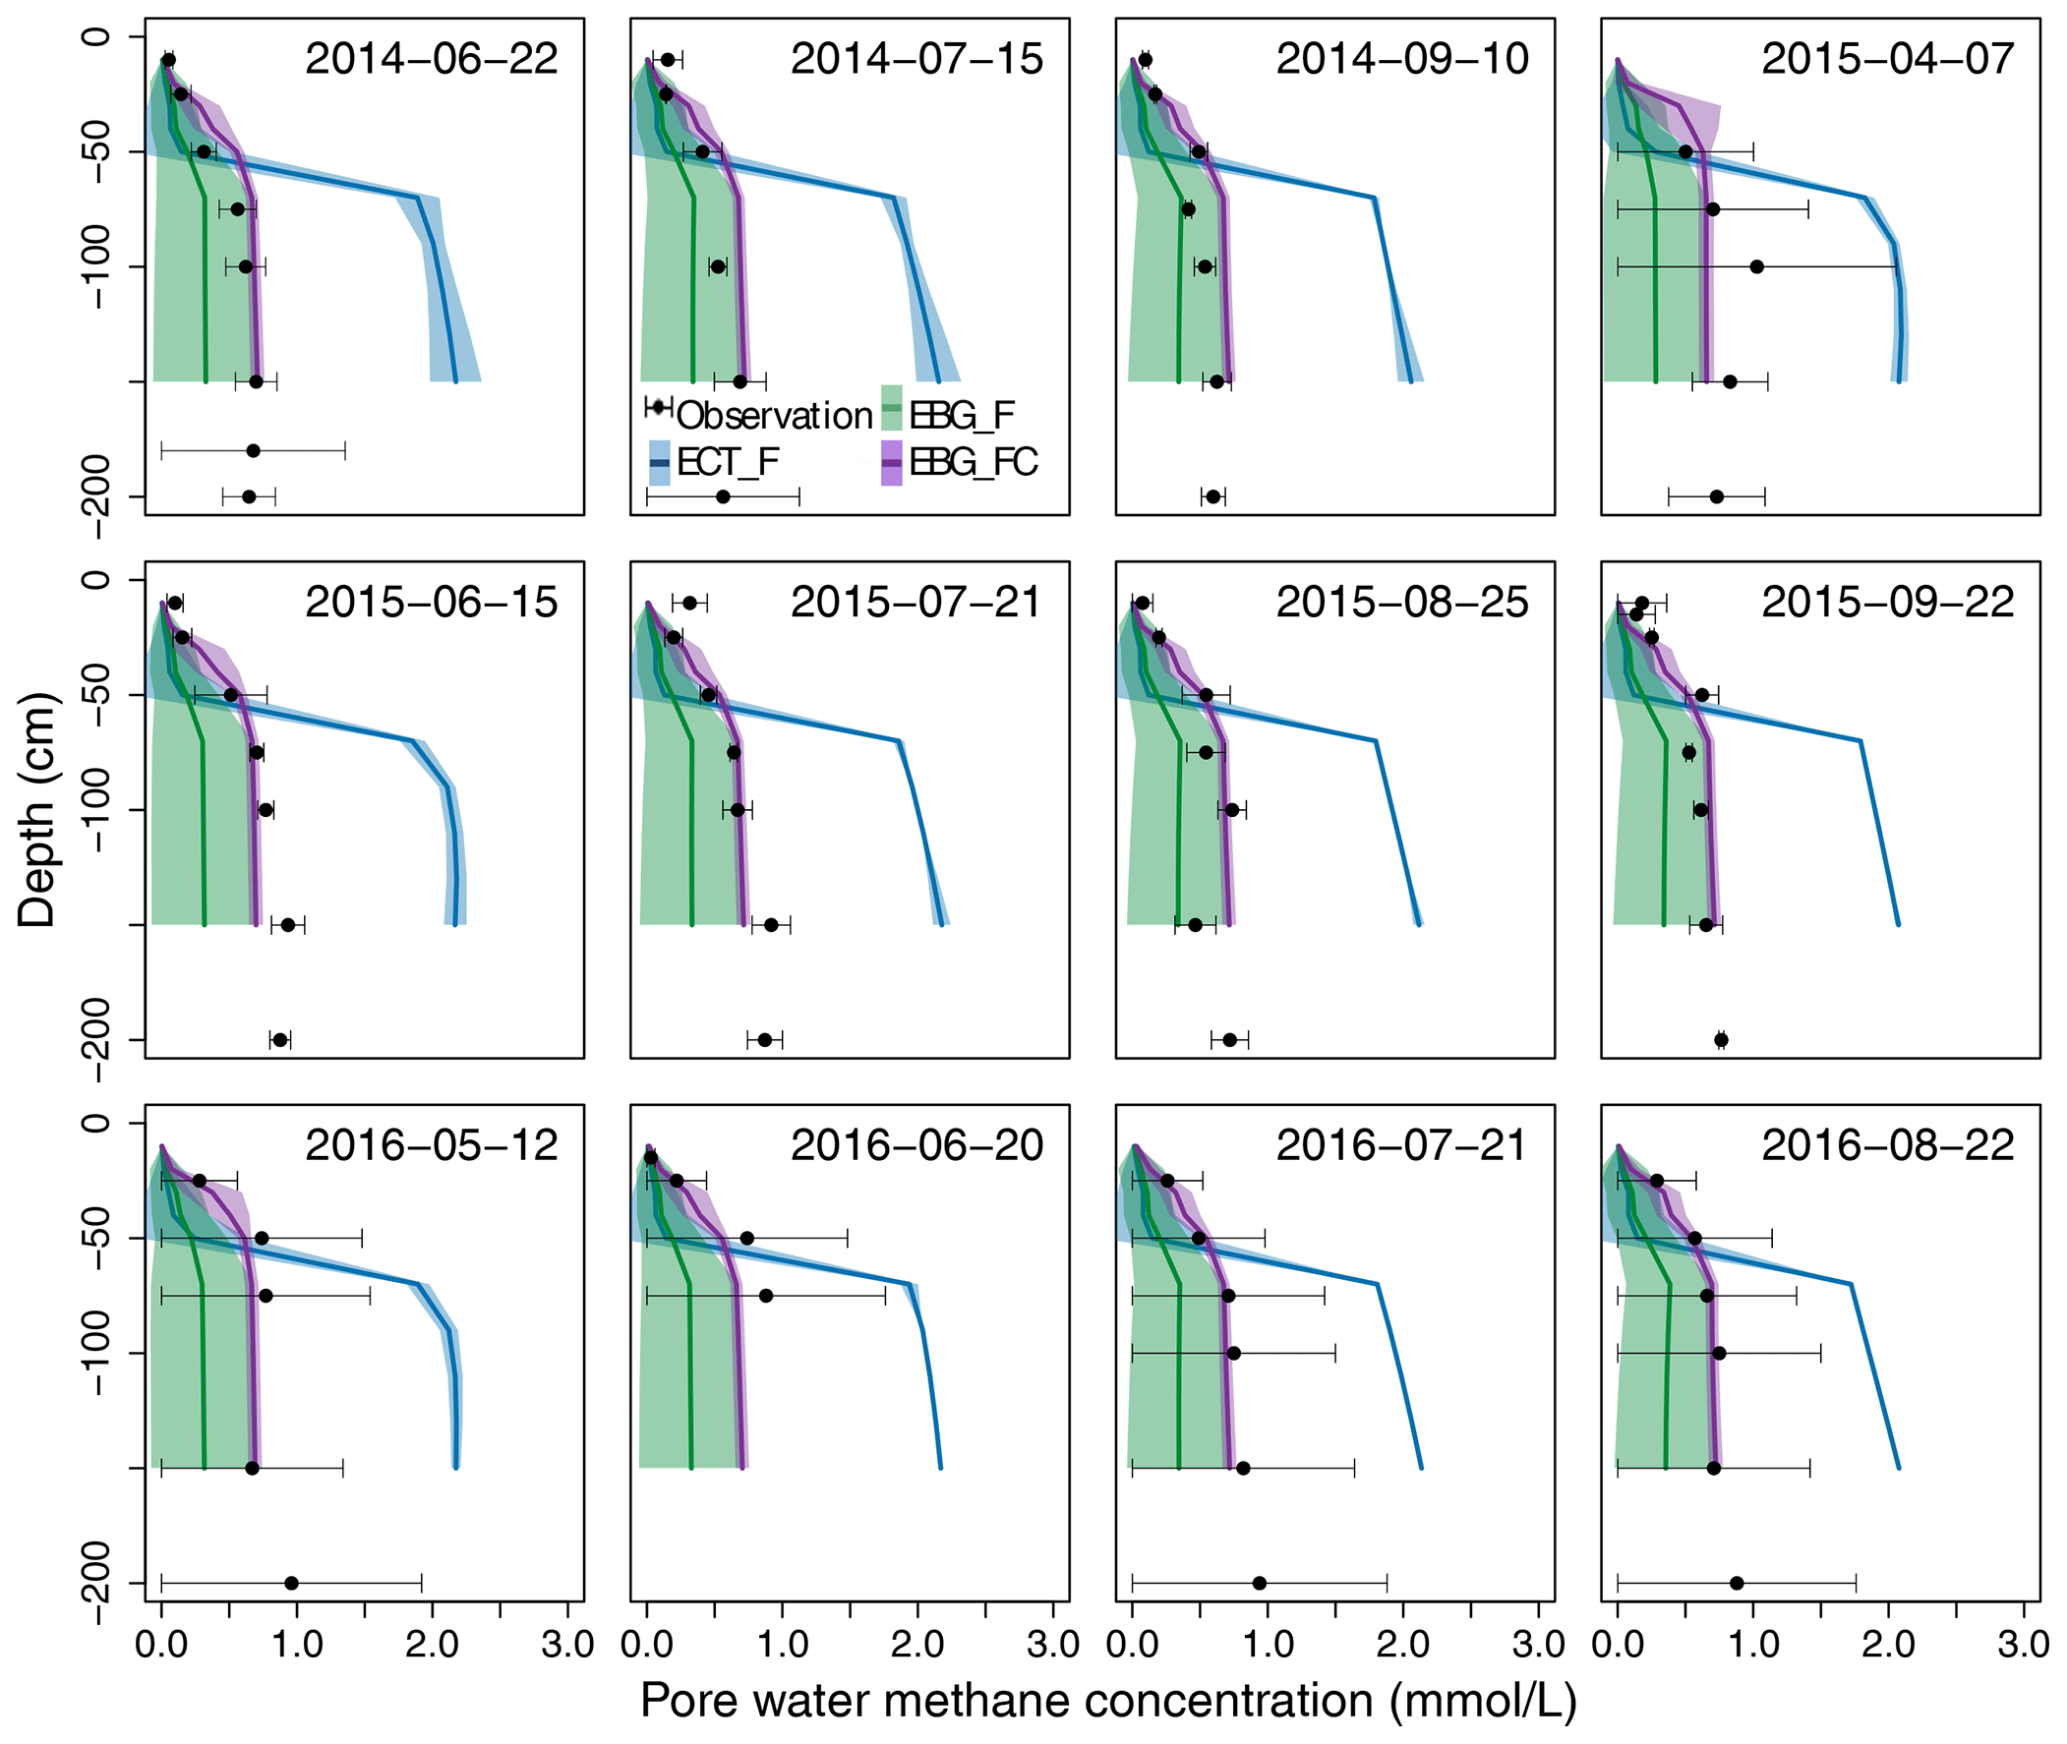
Figure 4Observed versus simulated pore water CH4 concentration profiles. Black dots are observed concentrations measured from piezometer samples. Blue lines are the ECT-model-simulated concentrations based on the parameter probability distributions (PPDs) constrained by CH4 flux data (ECT_F). Green lines are the EBG-model-simulated concentrations based on the PPDs constrained by CH4 flux data (EBG_F). Purple lines are the EBG-model-simulated concentrations based on the PPDs constrained by both CH4 flux and concentration data (EBG_FC). All mid-lines and shaded areas correspond to the means and standard deviations, respectively, from 500 model simulations with parameters randomly drawn from the posterior distributions.
The ECT model constrained by CH4 flux data could not reproduce well the patterns of the observed pore water CH4 concentrations, especially in the deep peat layers (RMSE = 0.77, Fig. 4, ECT_F). When calibrated by CH4 flux data alone, the EBG approach for ebullition captured deep layer CH4 concentrations much better than the ECT approach (RMSE = 0.33, Fig. 4, EBG_F). The observed concentration profiles lay within the 95 % probability intervals and the means were comparable to observed patterns. However, the EBG model structure simulated a relatively large range of CH4 concentration profiles, especially in the deep peat layers, mainly due to the unconstrained Tveg and bubprob controlling the plant transport and ebullition pathways, respectively (Fig. 2, EBG_F).
3.3 Comparison of the flux- and pool-based data in constraining the parameters for simulating CH4 processes
For the ECT approach, as described earlier, assimilating the observed CH4 flux could constrain parameters such as and Q10pro. However, when using both observed CH4 flux and concentration data to constrain the parameters of TECO_SPRUCE_ECT (i.e., the ECT_FC run), no parameter set was accepted within the observational uncertainty range, indicating that the ECT model structure failed to simultaneously simulate the dynamics of CH4 emissions and pore water CH4 concentrations.
In contrast to the ECT approach, incorporation of pore water CH4 concentration data in the EBG approach greatly improved parameter estimations. While Tveg and bubprob were not constrained by flux-based observation data alone (Table 4, Fig. 2, EBG_F), they were well constrained to a unimodal distribution when both CH4 flux and pore water CH4 concentration data streams were used in the data–model fusion (Table 4, Fig. 2, EBG_FC). Compared to EBG_F, the parameter Tveg was well constrained to a very small range of 1.43 ± 0.46, and the parameter bubprob was also well constrained to a range of 0.25 ± 0.015 with less uncertainty under EBG_FC (Table 4, Fig. 2). The parameter decreased from 0.17 in EBG_F to 0.15 in EBG_FC, whereas Q10pro increased from 2.69 in EBG_F to 3.21 in EBG_FC (Table 4, Fig. 2). Moreover, the formerly constrained range of parameter f under EBG_F shifted from 0.11 ± 4.0 to 0.29 ± 0.46 when the pore water CH4 concentration information was added into data assimilation. All the emission pathway-related parameters (Tveg, bubprob, f, and Vmaxfraction) were well constrained once the pore water CH4 concentration profile information was added to data–model fusion. However, incorporation of the pore water CH4 concentration data in data assimilation with the TECO_SPRUCE_EBG did not improve the constraint of Omax.
In terms of the model's performance in fitting observed CH4 emission patterns, the two parameterization methods for the EBG approach were comparable, with RMSE of 0.53 under EBG_F and RMSE of 0.52 under EBG_FC (Fig. 3c and e). However, the simulated contributions from plant-mediated transport, diffusion, and ebullition by EBG_FC, which were 31.8 ± 4.9 %, 58.1 ± 5.1 %, and 9.9 ± 6.1 %, respectively (Fig. 3f), varied greatly from those simulated by EBG_F (Fig. 3d). The contribution from ebullition under EBG_FC was much less than that under EBG_F (Fig. 3d). CH4 flux and concentration data together reduced the uncertainty of the modeled CH4 concentration profiles by 78 %–86 % compared to the flux data alone for data–model fusion, with RMSE reducing from 0.33 in EBG_F to 0.12 in EBG_FC (Fig. 4). The uncertainty in modeled CH4 concentration profiles was decreased mainly due to the well-constrained parameters regulating the CH4 production and emission pathways (Fig. 2a, b, and d–g).
In this study, we evaluated two alternative model structures with two data streams, i.e., CH4 emission and pore water CH4 concentration data, in simulating peatland CH4 emission and its pathways.
4.1 Better representing CH4 emission and pore water CH4 concentrations by the ebullition bubble growth (EBG) model
Previous studies suggested that the EBG method of modeling ebullition agreed better with the observed temporal variability in CH4 emissions (R2= 0.63) when compared with the ECT (R2= 0.56) and EPT (R2= 0.35) methods (Peltola et al., 2018). We also found that the EBG-simulated CH4 emissions (RMSE = 0.53) had a better agreement with observations than the ECT method (RMSE = 0.61). Ebullition events simulated by EBG had a higher frequency but a smaller magnitude than those obtained from ECT, which is consistent with on-site minirhizotron observations of small bubbles around fine roots (Fig. S1 in the Supplement). Although the ECT method was able to simulate a similar seasonal pattern of CH4 emissions as EBG, the mean annual CH4 emission was 17.8 % lower compared with the EBG method. Peltola et al. (2018) reported that the different ebullition modeling approaches simulated significantly different amount of CH4 stored belowground and distinctly different distributions of CH4 along the soil profiles. In line with their results, we found that the ECT method produced much higher pore water CH4 concentrations than the EBG method, especially in the deep layers (Fig. 4).
Of the few modeling studies that compared results with observed belowground CH4 concentration, Walter et al. (2001) simulated CH4 concentration with an early generation ECT method. This method used a constant concentration threshold that was tuned to match the observed concentration data, but they also found discrepancies with observed data (only CH4 concentrations within the first 50 cm soil were compared). Tang et al. (2010) compared the EPT method with the early generation ECT method and found that EPT had an improved CH4 concentration profile, although a mismatch in the concentration profile remained, especially from the model that best reproduced observed CH4 emissions. The recently developed land surface model (LSM) with a new microbial-functional group-based CH4 module incorporated, i.e., the ELM_SRUCE model, used the modified ECT method for the ebullition process but incorporated the acetoclastic and hydrogenotrophic pathways for methanogenesis, as well as anaerobic and aerobic oxidations (Ricciuto et al., 2021). This model could accurately predict the seasonal cycle of CH4 production and net fluxes, but CH4 concentrations in soil layers deeper than 1 m were still not well simulated (Ricciuto et al., 2021) and led to different estimates of emission pathways (23.5 % for plant-mediated transportation (PMT), 15.0 % for diffusion, and 61.5 % for ebullition) from our study (31.8 ± 4.9 % for PMT, 58.1 ± 5.1 % for diffusion, and 9.9 ± 6.1 % for ebullition). In our study, when training the modified ECT model with both CH4 emission and pore water concentration data, no parameter set was accepted, which suggested that the ECT method was not able to simultaneously reproduce both the magnitude of observed CH4 fluxes and the patterns of pore water CH4 concentrations no matter the combinations of parameters used. In contrast, the EBG method could capture observed CH4 emissions and the patterns of pore water CH4 concentration profiles simultaneously (Figs. 3 and 4).
Moreover, we found that although both the ECT and EBG methods were able to represent the general patterns of observed CH4 emissions, the flux-constrained parameter distributions varied between the two methods. For example, increased, but Q10pro decreased in EBG compared to ECT (Table 4, Fig. 2), which might be attributed to the confounding effects of missing/inappropriate model structures on parameter estimation because different combinations of model parameter values or structures can give similar model outputs (Williams et al., 2009). More studies are needed to further explore model structures and parameter optimization methods to best simulate CH4 production and emission processes and the underlying mechanisms.
4.2 Pool-based CH4 concentration data reduced the uncertainty of the emission pathways
Our study suggests that even using a more reasonable model structure, i.e., EBG, parameter sets that resulted in good simulations of CH4 emissions did not necessarily reproduce a realistic pore water concentration profile (Figs. 3 and 4). By comparing the parameter posterior distributions trained by observed CH4 emissions with and without observed pore water concentration profiles using the same model structure, TECO_SPRUCE_EBG, we revealed that CH4 emission data could constrain the CH4 production-related parameters and Q10pro and ebullition-related parameter Vmaxfraction very well. The ebullition-related parameter f was edge hitting, but parameter bubprob and plant transport-related parameter Tveg remained unconstrained, causing large uncertainty in simulated ebullition and plant-mediated transport (Table 4). However, by training the model with both CH4 emission and pore water CH4 concentration data, the parameters regulating CH4 production, plant transport, and ebullition were all well constrained (Fig. 2). This is because the vertical concentration profile of CH4 is a balance between the dynamic CH4 production, oxidation, and three emission pathways. The constrained parameters contributed to a more accurate estimation of pore water CH4 concentration (RMSE = 0.12) and better-constrained emission pathways (Table 4, Fig. 4).
Previous studies have emphasized the importance of combining carbon-pool data with carbon-flux data to improve estimated ecosystem carbon exchange. For example, Richardson et al. (2010) reported the initial leaf pool size could not be constrained until biomass information was combined with flux data. Du et al. (2015) also found that carbon flux data could constrain parameters reflecting instant responses to environmental changes such as temperature sensitivity, while pool-based data mainly contained information that could help constrain transfer coefficients. GPP and ER data could effectively constrain parameters that were directly related to flux data, such as the temperature sensitivity of heterotrophic respiration, the carbon allocation to leaves, and leaf turnover rate (Fox et al., 2009). In our study, the CH4 emission data mainly constrained parameters that represented instant responses to temperature change (Q10pro) and input rate from the source pool (). The pore water CH4 concentration data contributed to constraining the allocation rates of CH4 to the different emission pathways. Due to the different information contained between CH4 flux and concentration data, we highly recommend that both types of measurements should be made when possible and that both data streams should be used when constraining CH4 models.
It needs to be noted that there is a large disagreement in simulated relative contribution by ebullition between CH4 flux-data-constrained models (i.e., 0.13 % by the ECT approach with a constant concentration threshold (Ma et al., 2017), 23.5 % by the modified ECT approach with varied concentration thresholds in our study, and 22.7 % by the EBG approach in our study, as well as the EBG approach constrained with both CH4 flux and concentration data (9.9 %) (Figure 3). This suggests the urgent need of observed data for separating these relative contributions in field experiments, possibly through (1) having continuous total emission flux measurement (Susiluoto et al., 2018) despite being hard to deploy and calibrate in the field, (2) separately measuring diffusive, plant-mediated-transport, and ebullition fluxes despite being technically challenging, and (3) measuring belowground CH4 concentration profile as suggested in our study. At the SPRUCE experiment site, starting in the summer of 2022, two auto-chambers with a footprint of 0.2 m2 will be deployed in each plot to measure CO2 and CH4 fluxes. Along with the continued CH4 profile measurement, these whole set of observations will provide the opportunity to further evaluate these discussed approaches for improving model simulations.
4.3 Broader impacts and implications
Large uncertainties exist in understanding future wetland CH4 emissions in response to projected climate change, which result from inappropriate model structure and insufficient parameterizations even after the uncertainties in wetland areas are considered (Melton et al., 2013; Luo and Schuur, 2020). Decades of modeling research on CH4 has evolved to a stage that the emission pathways are explicitly calculated with various complexities, but determining the accuracy and uncertainty of individual pathways still requires more research (Xu et al., 2016). Currently, models fail to reproduce diffusive fluxes by more than 40 % mainly due to the lack of validations by the pore water CH4 concentrations (Tang et al., 2010; Riley et al., 2011). In LSMs, plant transport exclusively dominates CH4 emission in all wetland types tested (Tang et al., 2010; Wania et al., 2010; Peltola et al., 2018). However, according to the experimental studies, each of the three emission pathways can dominate, depending on the wetland type, vascular plant coverage, and the height of the water table (Whiting and Chanton, 1992, Shannon et al., 1996). By assimilating empirical data of both CH4 flux and pore water CH4 concentration data, our data–model fusion study proposes a more reasonable model structure and more robust parameter estimates with greatly reduced uncertainties.
Our results also implicate barriers of current CH4 modeling studies and suggest future directions for both modeling and experimental efforts, namely (1) the under-described CH4 processes in models and (2) the lack of observational data to constrain key CH4 processes in the models. More explicit CH4 processes are needed in modeling CH4 emission and its pathways. For example, in this study, the maximum aerobic oxidation rate (Omax) was always poorly constrained with wide, slightly domed distributions (Fig. 2c) regardless of what observation data were being assimilated into the models. This poor constraint might partly result from the missing anaerobic oxidation process in the models. In current process-based models, much of the descriptions of CH4 dynamics in wetland soils are based on the premise that the oxidation of CH4 occurs only in aerobic environments (Wania et al., 2010; Riley et al., 2011; Bridgham et al., 2013). However, the anaerobic oxidation of CH4 may be an important sink for CH4, sometimes reducing emissions by over 50 % in experimental studies (Smemo and Yavitt, 2011; Gupta et al., 2013; Segarra et al., 2015). Recently, a microbial-functional-group-based CH4 model was developed accounting for both aerobic and anaerobic CH4 oxidations, and this model has been validated against the concentration of CH4 and CO2 from incubation data (Xu et al., 2015). In Xu et al. model, 7 out of total 33 key CH4 process parameters control CH4 oxidation, and their values vary widely across different ecosystems and environmental conditions. The incorporation of anaerobic CH4 oxidation into LSMs may help improve the calculations of CH4 oxidation if the uncertainties from these CH4-oxidation-related parameters can be reduced.
While more comprehensive and process-based models for simulating all the processes or mechanisms involved in CH4 emissions are laudable, observations on such specific processes are critical to constrain parameters and reduce model uncertainty. Without sufficient data to evaluate such processes or to calibrate models, developing such complex models to explicitly simulate these processes could also introduce large uncertainties. Increased model complexity only contributes to the improved forecasting if parameters can be calibrated adequately by observed data (Famiglietti et al., 2021). If there were not enough observational data for model calibrations, increased complexity can lead to even worse forecast skills than the intermediate-complexity models (Shi et al., 2018; Famiglietti et al., 2021). Currently, similar to our model, many process-based biogeochemistry models (e.g., CLM, LPJ, TRPLEX, JULES, TEM) also use a parameter that varies with soil conditions to describe the potential ratio of CO2 becoming CH4 (), which is due partly to the limitation of data availability. Another example of observational data hindering model development is the unconstrained parameters to calculate plant-mediated transport. Although new algorithms and parameters to calculate plant aerenchyma transport have been added to LSMs to represent this mechanism more realistically, the parameters such as tiller radius, number of tillers, cross-section area of tillers, and the tiller porosity are highly idealized and poorly constrained (Wania et al., 2010; Riley et al., 2011). In the TECO_SPRUCE model used in this study, the parameter Tveg was used as a proxy of the ability of the whole plant community (e.g., biomass and abundance) to emit CH4. Root growth was simulated by a phenological process using LAI and temperature, and in situ fine root profile measurements were used as a proxy for vertical rooting distributions (Iversen et al., 2018). Tveg was well constrained by the observed CH4 emission and concentration data at a range of 1.43 ± 0.46, which indicated that the ability of the plant community to emit CH4 at this site was low (compared to its prior knowledge of 0.01–15, Table 2). Empirical measurements of plant-mediated CH4 transport at the same study site supported our model results (Scott Bridgham, personal communications). This finding can also be explained given that the diversity and abundance of aerenchymous plants at our study site were low, similar to many other northern ombrotrophic bogs.
Understanding relative contributions of CH4 emission pathways is critical to mechanistically model future CH4 dynamics. Acknowledging that pore water CH4 concentration is the driving force for each emission pathway, we evaluated the ability of two ebullition modeling approaches to reproduce observed CH4 emissions and pore water concentration profiles at a large-scale manipulated experimental site in a northern Minnesota, USA, peatland. The ebullition bubble growth volume threshold approach (EBG) fits the observed CH4 emissions and CH4 concentration profiles much better than the modified ebullition concentration threshold approach (ECT), especially for CH4 concentrations in the deeper soil layers. By assimilating the net CH4 emission and belowground CH4 concentration data into the models, we substantially reduced the uncertainties of modeled CH4 emissions from the emission pathways involved. While net CH4 efflux data are often the only data stream for CH4 model validations, we recommend that more attention be given to in situ measurements of the pore water CH4 concentrations and assimilations of the concentration data for model parameterization. Since the relative ratio of the emission pathways (ebullition, plant-mediated transport, and diffusion) determines how much CH4 is oxidized before leaving the soil due to their different transport rates and vulnerability to oxidation, we also suggest that the EBG approach should be incorporated into land surface models (LSMs) so that the projections of both CH4 emission and its transport processes are more realistic in response to climate change scenarios. Future studies should also include anaerobic CH4 oxidation into LSMs and constrain its parameters to better predict wetland CH4 emissions.
All data sets from this study are publicly available at project websites. Relevant measurements were obtained from the SPRUCE web page (http://mnspruce.ornl.gov/, last access: 23 April 2022), as well as the archival ftp site (ftp://sprucedata.ornl.gov, last access: 23 April 2022). The data can be acquired upon reasonable request. Results used to generate figures are available at https://doi.org/10.5281/zenodo.5722449 (Ma et al., 2021).
The supplement related to this article is available online at: https://doi.org/10.5194/bg-19-2245-2022-supplement.
SM and YL designed the project. SM, JJ, YH, and XL carried out modeling study. RMW, JPC, CMI, AM, PJH, and SB provided experimental data for model evaluations and parameter optimization. SM, LJ, and YL prepared the manuscript. All authors contributed to analyzing and interpreting the modeling results, as well as improving the manuscript.
The contact author has declared that neither they nor their co-authors have any competing interests.
Publisher's note: Copernicus Publications remains neutral with regard to jurisdictional claims in published maps and institutional affiliations.
Part of this research was carried out at the Jet Propulsion Laboratory, California Institute of Technology, under a contract with the National Aeronautics and Space Administration. We thank Zhenggang Du's help with discussing the data–model fusion techniques.
This work was primarily funded by subcontract 4000158404 from Oak Ridge National Laboratory to Northern Arizona University. Oak Ridge National Laboratory is managed by UT-Battelle, LLC, for the U.S. Department of Energy under contract DE-AC05-00OR22725. The SPRUCE (Spruce and Peatland Responses Under Changing Environments) project is supported by the Biological and Environmental Research program in the U.S. Department of Energy's Office of Science.
This paper was edited by Akihiko Ito and reviewed by two anonymous referees.
Ball, J. T., Woodrow, I. E., and Berry, J. A.: A model predicting stomatal conductance and its contribution to the control of photosynthesis under different environmental conditions, in: Progress in Photosynthesis Research: Volume 4 Proceedings of the VIIth International Congress on Photosynthesis Providence, Rhode Island, USA, 10–15 August 1986, edited by: Biggins, J., Springer Netherlands, Dordrecht, Netherlands, 221–224, https://doi.org/10.1007/978-94-017-0519-6_48, 1987.
Barber, T. R., Burke, R. A., and Sackett, W. M.: Diffusive flux of methane from warm wetlands, Global Biogeochem. Cy., 2, 411–425, https://doi.org/10.1029/GB002i004p00411, 1988.
Beckmann, M., Sheppard, S. K., and Lloyd, D.: Mass spectrometric monitoring of gas dynamics in peat monoliths: effects of temperature and diurnal cycles on emissions, Atmos. Environ., 38, 6907–6913, https://doi.org/10.1016/j.atmosenv.2004.08.004, 2004.
Blodau, C.: Carbon cycling in peatlands – A review of processes and controls, Environ. Rev., 10, 111–134, https://doi.org/10.1139/a02-004, 2002.
Bridgham, S. D., Cadillo-Quiroz, H., Keller, J. K., and Zhuang, Q.: Methane emissions from wetlands: biogeochemical, microbial, and modeling perspectives from local to global scales, Glob. Change Biol., 19, 1325–1346, https://doi.org/10.1111/gcb.12131, 2013.
Broecker, W. S. and Peng. T. H.: Gas exchange rates between air and sea, Tellus, 26, 21–35, https://doi.org/10.3402/tellusa.v26i1-2.9733, 1974.
Chanton, J. P. and Dacey, J. W.: Effects of vegetation on methane flux, reservoirs, and carbon isotopic composition, in: Trace Gas Emissions by Plants, edited by: Sharkey, T. D., Holland, E. A., and Mooney, H. A., Academic Press, San Diego, USA, 65–89, https://doi.org/10.1016/B978-0-12-639010-0.50008-X, 1991.
Christensen, T. R., Panikov, N., Mastepanov, M., Joabsson, A., Stewart, A., Öquist, M., Sommerkorn, M., Reynaud, S., and Svensson, B.: Biotic controls on CO2 and CH4 exchange in wetlands–a closed environment study, Biogeochemistry, 64, 337–354, https://doi.org/10.1023/A:1024913730848, 2003.
Conrad, R. and Rothfuss, F.: Methane oxidation in the soil surface layer of a flooded rice field and the effect of ammonium, Biol. Fert. Soils, 12, 28–32, https://doi.org/10.1007/BF00369384, 1991.
Denman, K. L., Brasseur, G., Chidthaisong, A., Ciais, P., Cox, P. M., Dickinson, R. E., Hauglustaine, D., Heinze, C., Holland, E., Jacob, D., Lohmann, U., Ramachandran, S., da Silva Dias, P. L., Wofsy, S. C., and Zhang, X.: Couplings between changes in the climate system and biogeochemistry, in: Climate Change 2007: The Physical Science Basis. Contribution of Working Group I to the Fourth Assessment Report of the Intergovernmental Panel on Climate Change, edited by: Solomon, S., Qin, D., Manning, M., Chen, Z., Marquis, M., Averyt, K. B., Tignor M., and Miller H. L., Cambridge University Press, Cambridge, UK and New York, NY, USA, https://www.ipcc.ch/site/assets/uploads/2018/02/ar4-wg1-chapter7-1.pdf (last access: 23 April 2022), 2007.
Du, Z., Nie, Y., He, Y., Yu, G., Wang, H., and Zhou, X.: Complementarity of flux- and biometric-based data to constrain parameters in a terrestrial carbon model, Tellus B, 24102, https://doi.org/10.3402/tellusb.v67.24102, 2015.
Epstein, P. S. and Plesset, M. S.: On the Stability of Gas Bubbles in Liquid–Gas Solutions, J. Chem. Phys., 18, 1505–1509, https://doi.org/10.1063/1.1747520, 1950.
Famiglietti, C. A., Smallman, T. L., Levine, P. A., Flack-Prain, S., Quetin, G. R., Meyer, V., Parazoo, N. C., Stettz, S. G., Yang, Y., Bonal, D., Bloom, A. A., Williams, M., and Konings, A. G.: Optimal model complexity for terrestrial carbon cycle prediction, Biogeosciences, 18, 2727–2754, https://doi.org/10.5194/bg-18-2727-2021, 2021.
Farquhar, G. D., von Caemmerer, S., and Berry, J. A.: A biochemical model of photosynthetic CO2 assimilation in leaves of C3 species, Planta, 149, 78–90, https://doi.org/10.1007/BF00386231, 1980.
Fechner-Levy, E. J. and Hemond, H. F.: Trapped methane volume and potential effects on methane ebullition in a northern peatland, Limnol. Oceanogr., 41, 1375–1383, https://doi.org/10.4319/lo.1996.41.7.1375, 1996.
Fox, A., Williams, M., Richardson, A. D., Cameron, D., Gove, J. H., Quaife, T., Ricciuto, D., Reichstein, M., Tomelleri, E., Trudinger, C. M., and Van Wijk, M. T.: The REFLEX project: Comparing different algorithms and implementations for the inversion of a terrestrial ecosystem model against eddy covariance data, Agr. Forest Meteorol., 149, 1597–1615, https://doi.org/10.1016/j.agrformet.2009.05.002, 2009.
Gelman, A. and Rubin. D. B.: Inference from iterative simulation using multiple sequences, Stat. Sci., 7, 457–472, https://doi.org/10.1214/ss/1177011136, 1992.
Glaser, P. H., Chanton, J. P., Morin, P., Rosenberry, D. O., Siegel, D. I., Ruud, O., Chasar, L. I., and Reeve, A. S.: Surface deformations as indicators of deep ebullition fluxes in a large northern peatland, Global Biogeochem. Cy., 18, GB1003, https://doi.org/10.1029/2003GB002069, 2004.
Granberg, G., Grip, H., Löfvenius, M. O., Sundh, I., Svensson, B. H., and Nilsson, M.: A simple model for simulation of water content, soil frost, and soil temperatures in boreal mixed mires, Water Resour. Res., 35, 3771–3782, https://doi.org/10.1029/1999WR900216, 1999.
Gupta, V., Smemo, K. A., Yavitt, J. B., Fowle, D., Branfireun, B., and Basiliko, N.: Stable isotopes reveal widespread anaerobic methane oxidation across latitude and peatland Ttype, Environ. Sci. Technol., 47, 8273–8279, https://doi.org/10.1021/es400484t, 2013.
Hanson, P. J., Phillips, J. R., Riggs, J. S., Nettles, W. R., and Todd, D. E.: SPRUCE large-collar in situ CO2 and CH4 flux data for the SPRUCE experimental plots, Carbon Dioxide Information Analysis Center, Oak Ridge National Laboratory, U. S. Department of Energy, Oak Ridge, Tennessee, USA., https://doi.org/10.3334/CDIAC/spruce.006, 2014.
Hanson, P. J., Riggs, J. S., Dorrance, C., Nettles, W. R., and Hook, L. A.: SPRUCE environmental monitoring data: 2010–2016, Carbon Dioxide Information Analysis Center, Oak Ridge National Laboratory, U. S. Department of Energy, Oak Ridge, Tennessee, USA, https://doi.org/10.3334/CDIAC/spruce.001, 2015a.
Hanson, P. J., Riggs, J. S., Nettles, W. R., Krassovski, M. B., and Hook, L. A.: SPRUCE Deep Peat Heating (DPH) environmental data, February 2014 through July 2105, Oak Ridge National Laboratory, TES SFA, U. S. Department of Energy, Oak Ridge, Tennessee, USA, https://doi.org/10.3334/CDIAC/spruce.013, 2015b.
Hanson, P. J., Gill, A. L., Xu, X., Phillips, J. R., Weston, D. J., Kolka, R. K., Riggs, J. S., and Hook, L. A.: Intermediate-scale community-level flux of CO2 and CH4 in a Minnesota peatland: putting the SPRUCE project in a global context, Biogeochemistry, 129, 255–272, https://doi.org/10.1007/s10533-016-0230-8, 2016a.
Hanson, P. J., Riggs, J. S., Nettles, W. R., Krassovski, M. B., and Hook, L. A.: SPRUCE Whole Ecosystems Warming (WEW) environmental data beginning August 2015, Oak Ridge National Laboratory, TES SFA, U. S. Department of Energy, Oak Ridge, Tennessee, USA., https://doi.org/10.3334/CDIAC/spruce.032, 2016b.
Hanson, P. J., Riggs, J. S., Nettles, W. R., Phillips, J. R., Krassovski, M. B., Hook, L. A., Gu, L., Richardson, A. D., Aubrecht, D. M., Ricciuto, D. M., Warren, J. M., and Barbier, C.: Attaining whole-ecosystem warming using air and deep-soil heating methods with an elevated CO2 atmosphere, Biogeosciences, 14, 861–883, https://doi.org/10.5194/bg-14-861-2017, 2017a.
Hanson, P. J., Phillips, J. R., Riggs, J. S., and Nettles, W. R.: SPRUCE large-collar in situ CO2 and CH4 flux data for the SPRUCE experimental plots: Whole-ecosystem-warming, Carbon Dioxide Information Analysis Center, Oak Ridge National Laboratory, U. S. Department of Energy, Oak Ridge, Tennessee, USA, https://doi.org/10.3334/CDIAC/spruce.034, 2017b.
Hanson, P. J., Phillips, J. R., Wullschelger, S. D., Nettles, W. R., Warren, J. M., Ward, E. J.: SPRUCE tree growth assessments of Picea and Larix in S1-Bog plots and SPRUCE experimental plots beginning in 2011, Oak Ridge National Laboratory, TES SFA, U. S. Department of Energy, Oak Ridge, Tennessee, USA, https://doi.org/10.25581/spruce.051/1433836, 2018a.
Hanson, P. J., Phillips, J. R., Brice, D. J., and Hook, L. A.: SPRUCE shrub-layer growth assessments in S1-Bog plots and SPRUCE experimental plots beginning in 2010, Oak Ridge National Laboratory, TES SFA, U. S. Department of Energy, Oak Ridge, Tennessee, USA, https://doi.org/10.25581/spruce.052/1433837, 2018b.
Huang, Y., Jiang, J., Ma, S., Ricciuto, D., Hanson, P. , and Luo. Y.: Soil thermal dynamics, snow cover, and frozen depth under five temperature treatments in an ombrotrophic bog: Constrained forecast with data assimilation, J. Geophys. Res.-Biogeo., 122, 2046–2063, https://doi.org/10.1002/2016JG003725, 2017.
Iversen, C. M., Hanson, P. J., Brice, D. J., Phillips, J. R., McFarlane, K. J., Hobbie, E..A., and Kolka, R. K.: SPRUCE Peat Physical and Chemical Characteristics from Experimental Plot Cores, 2012, Oak Ridge National Laboratory, TES SFA, U. S. Department of Energy, Oak Ridge, Tennessee, USA, https://doi.org/10.3334/CDIAC/spruce.005, 2014.
Iversen, C. M., Childs, J., Norby, R. J., Ontl, T. A., Kolka, R. K., Brice, D. J., McFarlane, K. J., and Hanson. P. J.: Fine-root growth in a forested bog is seasonally dynamic, but shallowly distributed in nutrient-poor peat, Plant Soil, 424, 123–143, https://doi.org/10.1007/s11104-017-3231-z, 2018.
Iwata, H., Hirata, R., Takahashi, Y., Miyabara, Y., Itoh, M., and Iizuka, K.: Partitioning Eddy-Covariance Methane Fluxes from a Shallow Lake into Diffusive and Ebullitive Fluxes, Bound.-Lay Meteorol., 169, 413–428, https://doi.org/10.1007/s10546-018-0383-1, 2018.
Jiang, J., Huang, Y., Ma, S., Stacy, M., Shi, Z., Ricciuto, D. M., Hanson, P. J., and Luo, Y.: Forecasting responses of a northern peatland carbon cycle to elevated CO2 and a gradient of experimental warming, J. Geophys. Res.-Biogeo., 123, 1057–1071, https://doi.org/10.1002/2017JG004040, 2018.
Keenan, T. F., Davidson, E. A., Munger, J. W., and Richardson, A. D.: Rate my data: quantifying the value of ecological data for the development of models of the terrestrial carbon cycle, Ecol. Appl., 23, 273–286, https://doi.org/10.1890/12-0747.1, 2013.
Kellner, E., Baird, A. J., Oosterwoud, M., Harrison, K., and Waddington, J. M.: Effect of temperature and atmospheric pressure on methane (CH4) ebullition from near-surface peats, Geophys. Res. Lett., 33, L18405, https://doi.org/10.1029/2006GL027509, 2006.
Klapstein, S. J., Turetsky, M. R., McGuire, A. D., Harden, J. W., Czimczik, C. I., Xu, X., Chanton, J. P., and Waddington. J. M.: Controls on methane released through ebullition in peatlands affected by permafrost degradation, J. Geophys. Res.-Biogeo., 119, 418–431, https://doi.org/10.1002/2013JG002441, 2014.
Laanbroek, H. J.: Methane emission from natural wetlands: interplay between emergent macrophytes and soil microbial processes. A mini-review, Ann. Bot., 105, 141–153, https://doi.org/10.1093/aob/mcp201, 2010.
Liang, J., Xia, J., Shi, Z., Jiang, L., Ma, S., Lu, X., Mauritz, M., Natali, S. M., Pegoraro, E., Penton, C. R., Plaza, C., Salmon, V. G., Celis, G., Cole, J. R., Konstantinidis, K. T., Tiedje, J. M., Zhou, J., Schuur, E. A. G., and Luo, Y.: Biotic responses buffer warming-induced soil organic carbon loss in Arctic tundra, Glob. Change Biol., 24, 4946–4959, https://doi.org/10.1111/gcb.14325, 2018.
Luo, Y. and Reynolds, J. F.: Validity of extrapolating field CO2 experiments to predict carbon sequestration in natural ecosystems, Ecology, 80, 1568–1583, https://doi.org/10.1890/0012-9658(1999)080[1568:VOEFCE]2.0.CO;2, 1999.
Luo, Y. Q. and Schuur, E. A. G.: Model parameterization to represent processes at unresolved scales and changing properties of evolving systems, Glob. Change Biol., 26, 1109–1117, https://doi.org/10.1111/gcb.14939, 2020.
Ma, S., Jiang, J., Huang, Y., Shi, Z., Wilson, R. M., Ricciuto, D., Sebestyen, S. D., Hanson, P. J., and Luo, Y.: Data-constrained projections of methane fluxes in a northern Minnesota peatland in response to elevated CO2 and warming, J. Geophys. Res.-Biogeo., 122, 2841–2861, https://doi.org/10.1002/2017JG003932, 2017.
Ma, S., Jiang, L., Wilson, R. M., Chanton, J. P., Bridgham, S., Niu, S., Iversen, C. M., Malhotra, A., Jiang, J., Lu, X., Huang, Y., Keller, J., Xu, X., Ricciuto, D. M., Hanson, P. J., and Luo, Y.: Evaluating alternative ebullition models for predicting peatland methane emission and its pathways via data-model fusion, Zenodo [code and data set], https://doi.org/10.5281/zenodo.5722449, 2021.
Malhotra, A., Brice, D., Childs, J., Graham, J. D., Hobbie, E. A., Vander Stel, H., Feron, S. C., Hanson, P. J., and Iversen, C. M.: Peatland warming strongly increases fine-root growth, P. Natl. Acad. Sci. USA, 117, 17627–17634, 2020a.
Malhotra, A., Brice, D. J., Childs, J., Vander Stel, H. M., Bellaire, S. E., Kraeske, E., Letourneou, S. M., Owens, L., Rasnake, L. M., and Iversen, C. M.: SPRUCE Production and Chemistry of Newly-Grown Fine Roots Assessed Using Root Ingrowth Cores in SPRUCE Experimental Plots beginning in 2014, Oak Ridge National Laboratory, TES SFA, U. S. Department of Energy, Oak Ridge, Tennessee, USA, https://mnspruce.ornl.gov/datasets/ (last access: 23 April 2022), 2020b.
McGinnis, D. F., Greinert, J., Artemov, Y., Beaubien, S. E., and Wüest. A.: Fate of rising methane bubbles in stratified waters: How much methane reaches the atmosphere?, J. Geophys. Res.-Oceans, 111, C09007, https://doi.org/10.1029/2005JC003183, 2006.
Megonigal, J. P., Hines, M., and Visscher, P.: Anaerobic metabolism: linkages to trace gases and aerobic processes, in: Biogeochemistry, edited by: Schlesinger, W. H., Elsevier-Pergamon, Oxford, UK, 317–424, https://doi.org/10.1016/B0-08-043751-6/08132-9, 2004.
Melton, J. R., Wania, R., Hodson, E. L., Poulter, B., Ringeval, B., Spahni, R., Bohn, T., Avis, C. A., Beerling, D. J., Chen, G., Eliseev, A. V., Denisov, S. N., Hopcroft, P. O., Lettenmaier, D. P., Riley, W. J., Singarayer, J. S., Subin, Z. M., Tian, H., Zürcher, S., Brovkin, V., van Bodegom, P. M., Kleinen, T., Yu, Z. C., and Kaplan, J. O.: Present state of global wetland extent and wetland methane modelling: conclusions from a model inter-comparison project (WETCHIMP), Biogeosciences, 10, 753–788, https://doi.org/10.5194/bg-10-753-2013, 2013.
Metropolis, N., Rosenbluth, A. W., Rosenbluth, M. N., Teller, A. H., and Teller, E.: Equation of state calculations by fast computing machines, J. Chem. Phys., 21, 1087, https://doi.org/10.1063/1.1699114, 1953.
Neubauer, S. C. and Megonigal, J. P.: Moving beyond global warming potentials to quantify the climatic role of ecosystems, Ecosystems, 18, 1000–1013, https://doi.org/10.1007/s10021-015-9879-4, 2015.
Norby, R. J. and Childs, J.: SPRUCE: Sphagnum Productivity and Community Composition in the SPRUCE Experimental Plots, Oak Ridge National Laboratory, TES SFA, U.S. Department of Energy, Oak Ridge, Tennessee, USA, https://doi.org/10.25581/spruce.049/1426474, 2018.
Norby, R. J., Childs, J., Hanson, P. J., and Warren, J. M.: Rapid loss of an ecosystem engineer: Sphagnum decline in an experimentally warmed bog, Ecol. Evol., 9, 12571–12585, 2019.
Parsekian, A. D., Slater, L., Ntarlagiannis, D., Nolan, J., Sebesteyen, S. D., Kolka, R. K., and Hanson, P. J.: Uncertainty in peat volume and soil carbon estimated using ground-penetrating radar and probing, Soil Sci. Soc. Am J., 76, 1911–1918, https://doi.org/10.2136/sssaj2012.0040, 2012.
Peltola, O., Raivonen, M., Li, X., and Vesala, T.: Technical note: Comparison of methane ebullition modelling approaches used in terrestrial wetland models, Biogeosciences, 15, 937–951, https://doi.org/10.5194/bg-15-937-2018, 2018.
Ricciuto, D. M., Xu, X. F., Shi, X. Y., Wang, Y. H., Song, X., Schadt, C. W., Griffiths, N. A., Mao, J. F., Warren, J. M., Thornton, P. E., Chanton, J., Keller, J. K., Bridgham, S. D., Gutknecht, J., Sebestyen, S. D., Finzi, A., Kolka, R., and Hanson, P. J.: An integrative model for soil biogeochemistry and methane processes: I. Model structure and sensitivity analysis, J. Geophys. Res.-Biogeo., 126, e2019JG005468, https://doi.org/10.1029/2019JG005468, 2021.
Richardson, A. D., Williams, M., Hollinger, D. Y., Moore, D. J. P., Dail, D. B., Davidson, E. A., Scott, N. A., Evans, R. S., Hughes, H., Lee, J. T., Rodrigues, C., and Savage, K.: Estimating parameters of a forest ecosystem C model with measurements of stocks and fluxes as joint constraints, Oecologia, 164, 25–40, https://doi.org/10.1007/s00442-010-1628-y, 2010.
Riley, W. J., Subin, Z. M., Lawrence, D. M., Swenson, S. C., Torn, M. S., Meng, L., Mahowald, N. M., and Hess, P.: Barriers to predicting changes in global terrestrial methane fluxes: analyses using CLM4Me, a methane biogeochemistry model integrated in CESM, Biogeosciences, 8, 1925–1953, https://doi.org/10.5194/bg-8-1925-2011, 2011.
Rosenberry, D. O., Glaser, P. H., and Siegel. D. I.: The hydrology of northern peatlands as affected by biogenic gas: current developments and research needs, Hydrol. Process., 20, 3601–3610, https://doi.org/10.1002/hyp.6377, 2006.
Sander, R.: Compilation of Henry's law constants for inorganic and organic species of potential importance in environmental chemistry, Citeseer, 1999.
Saunois, M., Stavert, A. R., Poulter, B., Bousquet, P., Canadell, J. G., Jackson, R. B., Raymond, P. A., Dlugokencky, E. J., Houweling, S., Patra, P. K., Ciais, P., Arora, V. K., Bastviken, D., Bergamaschi, P., Blake, D. R., Brailsford, G., Bruhwiler, L., Carlson, K. M., Carrol, M., Castaldi, S., Chandra, N., Crevoisier, C., Crill, P. M., Covey, K., Curry, C. L., Etiope, G., Frankenberg, C., Gedney, N., Hegglin, M. I., Höglund-Isaksson, L., Hugelius, G., Ishizawa, M., Ito, A., Janssens-Maenhout, G., Jensen, K. M., Joos, F., Kleinen, T., Krummel, P. B., Langenfelds, R. L., Laruelle, G. G., Liu, L., Machida, T., Maksyutov, S., McDonald, K. C., McNorton, J., Miller, P. A., Melton, J. R., Morino, I., Müller, J., Murguia-Flores, F., Naik, V., Niwa, Y., Noce, S., O'Doherty, S., Parker, R. J., Peng, C., Peng, S., Peters, G. P., Prigent, C., Prinn, R., Ramonet, M., Regnier, P., Riley, W. J., Rosentreter, J. A., Segers, A., Simpson, I. J., Shi, H., Smith, S. J., Steele, L. P., Thornton, B. F., Tian, H., Tohjima, Y., Tubiello, F. N., Tsuruta, A., Viovy, N., Voulgarakis, A., Weber, T. S., van Weele, M., van der Werf, G. R., Weiss, R. F., Worthy, D., Wunch, D., Yin, Y., Yoshida, Y., Zhang, W., Zhang, Z., Zhao, Y., Zheng, B., Zhu, Q., Zhu, Q., and Zhuang, Q.: The Global Methane Budget 2000–2017, Earth Syst. Sci. Data, 12, 1561–1623, https://doi.org/10.5194/essd-12-1561-2020, 2020.
Schipper, L. A. and Reddy, K. R.: Determination of methane oxidation in the rhizosphere of Sagittaria lancifolia using methyl fluoride, Soil Sci. Soc. Am. J., 60, 611–616, https://doi.org/10.2136/sssaj1996.03615995006000020039x, 1996.
Sebestyen, S. D., Dorrance, C., Olson, D. M., Verry, E. S., Kolka, R. K., Elling, A. E., and Kyllander, R.: Long-term monitoring sites and trends at the Marcell Experimental Forest, CRC Press, New York, USA, 2011.
Segarra, K. E. A., Schubotz, F., Samarkin, V., Yoshinaga, M. Y., Hinrichs, K. U., and Joye, S. B.: High rates of anaerobic methane oxidation in freshwater wetlands reduce potential atmospheric methane emissions, Nat. Commun., 6, 7477, https://doi.org/10.1038/ncomms8477, 2015.
Segers, R.: Methane production and methane consumption: A review of processes underlying wetland methane fluxes, Biogeochemistry, 41, 23–51, http://www.jstor.org/stable/1469307 (last access: 20 April 2022), 1998.
Shannon, R. D., White, J. R., Lawson, J. E., and Gilmour, B. S.: Methane efflux from emergent vegetation in peatlands, J. Ecol., 84, 239–246, https://doi.org/10.2307/2261359, 1996.
Shea, K., Turetsky, M. R., and Waddington, J. M.: Quantifying diffusion, ebullition, and plant-mediated transport of CH4 in Alaskan peatlands undergoing permafrost thaw, American Geophysical Union, Washington, DC, USA, 2010.
Shi, Z., Xu, X., Hararuk, O., Jiang, L., Xia, J., Liang, J., Li D., and Luo, Y.: Experimental warming altered rates of carbon processes, allocation, and carbon storage in a tallgrass prairie, Ecosphere, 6, art210, https://doi.org/10.1890/ES14-00335.1, 2015a.
Shi, Z., Yang, Y., Zhou, X., Weng, E., Finzi, A. C., and Luo, Y.: Inverse analysis of coupled carbon-nitrogen cycles against multiple datasets at ambient and elevated CO2, J. Plant Ecol., 103, 1131–1140, https://doi.org/10.1093/jpe/rtv059, 2015b.
Shi, Z., Crowell, S., Luo, Y. Q., and Moore III. B.: Model structures amplify uncertainty in predicted soil carbon responses to climate change, Nat. Commun., 9, 2171, https://doi.org/10.1038/s41467-018-04526-9, 2018.
Smemo, K. A. and Yavitt, J. B.: Anaerobic oxidation of methane: an underappreciated aspect of methane cycling in peatland ecosystems?, Biogeosciences, 8, 779–793, https://doi.org/10.5194/bg-8-779-2011, 2011.
Spahni, R., Wania, R., Neef, L., van Weele, M., Pison, I., Bousquet, P., Frankenberg, C., Foster, P. N., Joos, F., Prentice, I. C., and van Velthoven, P.: Constraining global methane emissions and uptake by ecosystems, Biogeosciences, 8, 1643–1665, https://doi.org/10.5194/bg-8-1643-2011, 2011.
Ström, L., Mastepanov, M., and Christensen, T. R.: Species-Specific Effects of vascular plants on carbon turnover and methane emissions from wetlands, Biogeochemistry, 75, 65–82, http://www.jstor.org/stable/20055258 (last access: 20 April 2022), 2005.
Susiluoto, J., Raivonen, M., Backman, L., Laine, M., Makela, J., Peltola, O., Vesala, T., and Aalto, T.: Calibrating the sqHIMMELI v1.0 wetland methane emission model with hierarchical modeling and adaptive MCMC, Geosci. Model Dev., 11, 1199–1228, https://doi.org/10.5194/gmd-11-1199-2018, 2018.
Tang, J., Zhuang, Q., Shannon, R. D., and White, J. R.: Quantifying wetland methane emissions with process-based models of different complexities, Biogeosciences, 7, 3817–3837, https://doi.org/10.5194/bg-7-3817-2010, 2010.
Teh, Y. A., Silver, W. L., and Conrad. M. E.: Oxygen effects on methane production and oxidation in humid tropical forest soils, Glob. Change Biol., 11, 1283–1297, https://doi.org/10.1111/j.1365-2486.2005.00983.x, 2005.
Tokida, T., Miyazaki, T., Mizoguchi, M., Nagata, O., Takakai, F., Kagemoto, A., and Hatano, R.: Falling atmospheric pressure as a trigger for methane ebullition from peatland, Global Biogeochem. Cy., 21, GB2003, https://doi.org/10.1029/2006GB002790, 2007a.
Tokida, T., Mizoguchi, M., Miyazaki, T., Kagemoto, A., Nagata, O., and Hatano. R.: Episodic release of methane bubbles from peatland during spring thaw, Chemosphere, 70, 165–171, https://doi.org/10.1016/j.chemosphere.2007.06.042, 2007b.
Waddington, J. M., Roulet, N. T., and Swanson, R. V.: Water table control of CH4 emission enhancement by vascular plants in boreal peatlands, J. Geophys. Res.-Atmos., 101, 22775–22785, https://doi.org/10.1029/96JD02014, 1996.
Walter, B. P. and Heimann, M.: A process-based, climate-sensitive model to derive methane emissions from natural wetlands: Application to five wetland sites, sensitivity to model parameters, and climate, Global Biogeochem. Cy., 14, 745–765, https://doi.org/10.1029/1999GB001204, 2000.
Walter, B. P., Heimann, M., and Matthews, E.: Modeling modern methane emissions from natural wetlands: 1. Model description and results, J. Geophys. Res., 106, 34189–34206, https://doi.org/10.1029/2001JD900165, 2001.
Wania, R., Ross, I., and Prentice, I. C.: Implementation and evaluation of a new methane model within a dynamic global vegetation model: LPJ-WHyMe v1.3.1, Geosci. Model Dev., 3, 565–584, https://doi.org/10.5194/gmd-3-565-2010, 2010.
Weng, E. and Luo, Y.: Soil hydrological properties regulate grassland ecosystem responses to multifactor global change: A modeling analysis, J. Geophys. Res.-Biogeo., 113, G03003, https://doi.org/10.1029/2007JG000539, 2008.
Whiting, G. J. and Chanton, J. P.: Plant-dependent CH4 emission in a subarctic Canadian fen, Global Biogeochem. Cy., 6, 225–231, https://doi.org/10.1029/92GB00710, 1992.
Williams, M., Richardson, A. D., Reichstein, M., Stoy, P. C., Peylin, P., Verbeeck, H., Carvalhais, N., Jung, M., Hollinger, D. Y., Kattge, J., Leuning, R., Luo, Y., Tomelleri, E., Trudinger, C. M., and Wang, Y.-P.: Improving land surface models with FLUXNET data, Biogeosciences, 6, 1341–1359, https://doi.org/10.5194/bg-6-1341-2009, 2009.
Wilson, R. M., Hopple, A. M.. Tfaily, M. M.. Sebestyen, S. D.. Schadt, C. W.. Pfeifer-Meister, L.. Medvedeff, C.. McFarlane, K. J.. Kostka, J. E.. Kolton, M.. Kolka, R. K.. Kluber, L. A.. Keller, J. K.. Guilderson, T. P.. Griffiths, N. A., Chanton, J. P.. Bridgham, S. D., and Hanson, P. J.: Stability of peatland carbon to rising temperatures, Nat. Commun., 7, 13723, https://doi.org/10.1038/ncomms13723, 2016.
Xu, T., White, L., Hui, D., and Luo, Y.: Probabilistic inversion of a terrestrial ecosystem model: Analysis of uncertainty in parameter estimation and model prediction, Global Biogeochem. Cy., 20, GB2007, https://doi.org/10.1029/2005GB002468, 2006.
Xu, X., Elias, D. A., Graham, D. E., Phelps, T. J., Carrol, S. L., Wullschleger, S. D., and Thornton, P. E.: A microbial functional group based module for simulating methane production and consumption: Application to an incubation permafrost soil, J. Geophys. Res.-Biogeo., 120, 1315–1333, https://doi.org/10.1002/2015JG002935, 2015.
Xu, X., Yuan, F., Hanson, P. J., Wullschleger, S. D., Thornton, P. E., Riley, W. J., Song, X., Graham, D. E., Song, C., and Tian, H.: Reviews and syntheses: Four decades of modeling methane cycling in terrestrial ecosystems, Biogeosciences, 13, 3735–3755, https://doi.org/10.5194/bg-13-3735-2016, 2016.
Yamamoto, S., Alcauskas, J. B., and Crozier, T. E.: Solubility of methane in distilled water and seawater, J. Chem. Eng. Data, 21, 78–80, https://doi.org/10.1021/je60068a029, 1976.
Yu, Z., Slater, L. D., Schäfer, K. V. R., Reeve, A. S., and Varner, R. K.: Dynamics of methane ebullition from a peat monolith revealed from a dynamic flux chamber system, J. Geophys. Res.-Biogeo., 119, 1789–1806, https://doi.org/10.1002/2014JG002654, 2014.
Yuan, F. H., Wang, Y. H., Ricciuto, D. M., Shi, X. Y., Yuan, F. M., Hanson, P. J., Bridgham, S., Keller, J., Thornton, P. E., and Xu, X. F.: An integrative model for soil biogeochemistry and methane processes. II: Warming and elevated CO2 effects on peatland CH4 Emissions, J. Geophys. Res.-Biogeo., 126, e2020JG005963, https://doi.org/10.1029/2020JG005963, 2021.
Zhang, Y., Sachs, T., Li, C., and Boike, J.: Upscaling methane fluxes from closed chambers to eddy covariance based on a permafrost biogeochemistry integrated model, Glob. Change Biol., 18, 1428–1440, https://doi.org/10.1111/j.1365-2486.2011.02587.x, 2012.
Zhu, Q., Liu, J., Peng, C., Chen, H., Fang, X., Jiang, H., Yang, G., Zhu, D., Wang, W., and Zhou, X.: Modelling methane emissions from natural wetlands by development and application of the TRIPLEX-GHG model, Geosci. Model Dev., 7, 981–999, https://doi.org/10.5194/gmd-7-981-2014, 2014.
Zhuang, Q., Melillo, J. M., Kicklighter, D. W., Prinn, R. G., McGuire, A. D., Steudler, P. A., Felzer, B. S., and Hu, S.: Methane fluxes between terrestrial ecosystems and the atmosphere at northern high latitudes during the past century: A retrospective analysis with a process-based biogeochemistry model, Global Biogeochem. Cy., 18, GB3010, https://doi.org/10.1029/2004GB002239, 2004.
Zhuang, Q., Melillo, J. M., Sarofim, M. C., Kicklighter, D. W., McGuire, A. D., Felzer, B. S., Sokolov, A., Prinn, R. G., Steudler, P. A., and Hu, S.: CO2 and CH4 exchanges between land ecosystems and the atmosphere in northern high latitudes over the 21st century, Geophys. Res. Lett., 33, L17403, https://doi.org/10.1029/2006GL026972, 2006.