the Creative Commons Attribution 4.0 License.
the Creative Commons Attribution 4.0 License.
 | 30 May 2022
Mass concentration measurements of autumn bioaerosol using low-cost sensors in a mature temperate woodland free-air carbon dioxide enrichment (FACE) experiment: investigating the role of meteorology and carbon dioxide levels
Aileen B. Baird
Edward J. Bannister
A. Robert MacKenzie
Forest environments contain a wide variety of airborne biological particles (bioaerosols), including pollen, fungal spores, bacteria, viruses, plant detritus, and soil particles. Forest bioaerosol plays a number of important roles related to plant and livestock health, human disease and allergenicity, and forest and wider ecology and are thought to influence biosphere–atmosphere interactions via warm and cold cloud formation. Despite the importance of bioaerosols, there are few measurements of forest aerosol, and there is a lack of understanding of how climate change will affect forest bioaerosol in the future.
We installed low-cost optical particle counters (OPCs) to measure particles in the size range between 1 and 10 µm (PM10–PM1) for a period of 2 months in autumn 2018 at the Birmingham Institute of Forest Research (BIFoR) free-air carbon dioxide enrichment (FACE) facility. In the paper, we propose that the PM10–PM1 (particulate matter) metric is a good proxy for bioaerosols because of the bioaerosol representative size range, the location of the study site (a woodland in a rural location), the field measurement taking place during the season of peak fungal activity, and the low hygroscopicity of the particles measured. The BIFoR FACE facility fumigates three 700 m2 areas of the forest with an additional 150 ppm CO2 above ambient levels with minimal impacts on other potential environmental drivers such as temperature, humidity, and wind. This experimental set-up enabled us to investigate the effect of environmental variables, including elevated CO2 (eCO2), on bioaerosol proxy concentrations and to evaluate the performance of the low-cost OPCs in a forested environment.
Operating the low-cost OPCs during autumn 2018, we aimed to capture predominantly the fungal bioaerosol season. Across the experimental duration, the OPCs captured both temporal and spatial variation in bioaerosol concentrations. Aerosol concentrations were affected by changing temperatures and wind speeds but, contrary to our initial hypothesis, not by relative humidity. We detected no effect of the eCO2 treatment on total bioaerosol concentrations, but a potential suppression of high-concentration bioaerosol events was detected under eCO2. In-canopy atmospheric dispersion modelling indicates that the median spore dispersion distance is sufficiently small that there is little mixing between treatment and control experiments. Our data demonstrate the suitability of low-cost OPCs, interpreted with due caution, for use in forests and so opens the possibility of forest bioaerosol monitoring in a wider range of habitats to a wider range of researchers at a modest cost.
- Article
(1223 KB) - Full-text XML
-
Supplement
(1493 KB) - BibTeX
- EndNote


Aerobiology investigates the production, transport, and removal of airborne biological particles such as bacterial, fungal, and viral microbes; plant pollen; and soil and plant debris. Fungal spores form a large proportion of the bioaerosol population, with ground level concentrations typically of 10 000–50 000 spores m−3 (compared with 1000–2000 pollen grains m−3) (Sesartic and Dallafior, 2011, and references therein). Modelling suggests that fungal spores form approximately 23 % of bioaerosol mass globally (Heald and Spracklen, 2009). Understanding the dispersal of fungal spores is essential not only for understanding fungal ecology and their direct relevance to the forest plant and soil communities but also for understanding human disease and allergens, plant and crop health, and livestock health, as well as the role played by bioaerosols in ice nucleation and cloud condensation (Pöschl, 2005; Reinmuth-Selzle et al., 2017; Sesartic and Dallafior, 2011). The significant influence of airborne fungal particles on forest biology is often overlooked.
Spores are produced by fungi as propagules during asexual and sexual reproduction (Læssøe and Petersen, 2019). Fungal spores are varied in shape and size, with typical diameters of 1–30 µm, although their diameters can vary from 1–1000 µm (Fröhlich-Nowoisky et al., 2009; Halbwachs and Bässler, 2015; Jones and Harrison, 2004). Spore dispersal is a complex process, affected by size and shape of the spores, meteorological and ecological factors, and the life history of the fungus. Fungi which produce below-ground fruit bodies, as well as some mycorrhizal fungi without sporocarps, rarely have spores in significant concentrations in the air and are more commonly spread by animals. Above-ground fungal fruiting bodies with active release mechanisms or tall stipes may release spores higher into the air (Biedermann and Vega, 2020; Dressaire et al., 2016; Halbwachs and Bässler, 2015; Horton, 2017; Kivlin et al., 2014; Lilleskov and Bruns, 2005; Stephens and Rowe, 2020). Spore size, shape, and ornamentation influence their dispersal, with smaller and/or less dense spores able to travel further, although even very large spores may be dispersed by the air (Chaudhary et al., 2020; Norros et al., 2014, 2012). In addition to the spore and fungal characteristics, the meteorology and ecology of the environment both significantly influence spore dispersal (Halbwachs and Bässler, 2015; Oneto et al., 2020). Mature forests generally have complex, multi-layered canopies which affect airflow through the forest, in addition to altering temperature and relative humidity (RH) variability (Bannister et al., 2022; Gilbert and Reynolds, 2005; Norros et al., 2014).
Meteorological factors have also been shown to impact airborne fungal communities significantly. Several studies have measured concentrations of airborne fungal spores in the UK (largely in cities), investigating diurnal and seasonal variables as well as meteorological variables on fungal spores. The effects are almost always species-specific, with a broader seasonal trend of fungal spore concentrations being highest in late summer and autumn (Hollins et al., 2004; O'Connor et al., 2014; Sadyś et al., 2016a, 2014). Larger European studies (e.g. Grinn-Gofroń et al., 2019) and reviews have shown that the two most influential meteorological variables for airborne fungal spore concentrations are temperature and RH (Jones and Harrison, 2004; Moore-Landecker, 2011).
As well as being affected on shorter timescales by meteorological factors, airborne fungal concentrations can also be affected by climate change, both due to increases in CO2 concentrations and the corresponding increase in temperature, although effects on fungi may vary depending on the species (Burge, 2002). Wolf et al. (2003) tested the response of 11 arbuscular mycorrhizal (AM) fungi to eCO2 at the BioCON (Biodiversity, CO2, and Nitrogen) FACE (free-air carbon dioxide enrichment) grassland experiment, with only a single Glomus species producing additional spores in the soil. Wolf et al. (2010) demonstrated an increase in spore production from Alternaria alternata (a common airborne allergen) under eCO2 in a growth chamber. Similarly, in an aspen tree (Populus tremuloides) open-topped chamber eCO2 experiment, Klironomos et al. (1997) found that airborne fungal spore concentrations increased, which they suggested was due to corresponding increases in spore concentrations in the leaf litter.
In addition to direct changes in spore production, it is possible that fungal sporocarp production, and therefore spore production, could also increase due to climate change. Ecological measurements show the autumn fungal fruiting seasons in Europe have become longer over the last 50 years. The fungal fruiting season starts earlier and finishes later due to climate change, in addition to more fungi having an additional spring fruiting season (Gange et al., 2007; Kauserud et al., 2012). This climate-induced phenology change has also been demonstrated in a corresponding increase in the airborne fungal spore season (Sadyś et al., 2016b). These large changes in the fungal season were mainly attributed to temperature increases; however, regarding the aspen FACE experiment, it was found that ectomycorrhizal fungi sporocarp production increased under eCO2, so it seems possible that CO2 impacts fungal sporocarp production independently of temperature (Andrew and Lilleskov, 2009). All of these demonstrated changes in fungal phenology, sporocarp production, and sporulation suggest that bioaerosol concentrations are also likely to change under eCO2. Even if these findings are fungal-species-specific, they have potentially wide-ranging effects for forested habitats.
The studies described above demonstrate that fungi are likely to change spore and sporocarp production under eCO2 ranging from 192–600 ppm, in addition to the significant changes witnessed in fungal growing seasons under the current anthropogenic increases and broader climate effects. Even if these findings are fungal-species-specific, they indicate that fungal bioaerosols concentrations can be expected to change under eCO2, with potentially wide-ranging effects for forested habitats (Baird and Pope, 2021). However, none of the above studies were completed in complex mature woodlands, with the experiments being completed in laboratories; open-topped chambers; or, in the case of the aspen FACE experiment, a young plantation forest. Mature and ancient woodlands represent a more complex and diverse environment, which are likely to respond differently to eCO2 than the plantations of young trees on agricultural soil studied in earlier FACE experiments (Norby et al., 2016). There are also few studies of forest airborne-spore concentration responses to eCO2, with the majority of studies focussing on sporocarp production.
In order to study airborne forest fungal bioaerosols under eCO2 in a mature temperate woodland, we installed low-cost optical particle counters (OPCs) for the BIFoR (Birmingham Institute of Forest Research) FACE experiment during autumn 2018. We assume that the bioaerosols can be represented by measured difference between PM10 and PM1 mass concentrations, as detailed in the Methods section.
Our hypotheses were the following:
- A.
Hourly fungal bioaerosol concentrations will correlate with hourly weather conditions (wind, RH, and temperature).
- B.
Fungal bioaerosol concentrations will increase in woodland patches treated with eCO2 for 2 years.
2.1 BIFoR FACE
The BIFoR FACE experiment is located in a 19.1 ha mature oak forest in Staffordshire, UK. The overall aim of the FACE experiment is to mimic the effects of anthropogenic climate change by increasing the CO2 concentrations in areas of the forest by 150 ppm above ambient levels (∼ 400 ppm) (MacKenzie et al., 2020; Norby et al., 2016). This set-up is one of only two FACE experiments in mature forests worldwide, and it provides a unique experiment to study mature temperate woodland. In the context of bioaerosols, this experiment allows for the investigation of the direct and indirect effects of eCO2 in a minimally disturbed forest environment (Hart et al., 2019).
As shown in the site map in Fig. 1, the CO2 enrichment set-up consists of nine roughly circular “arrays” of three types, each array being approximately 30 m in diameter. Arrays 1, 4, and 6 are fumigated with additional CO2, increasing the atmospheric CO2 by 150 ppm above ambient levels (to approximately 550 ppm). The CO2, pre-mixed with air, is released into the tree canopies, using pipes running the height of 25 m tall towers around the perimeter of the array. Arrays 2, 3, and 5 have the same tower set-up but fumigate only with air. Arrays 7, 8 and 9 are “ghost” arrays without any fumigation infrastructure. Arrays 1–6 are grouped into three treatment pairs, based on pre-fumigation vegetation and soil biochemistry analysis, each with a single elevated CO2 and single ambient CO2 array. The array pairs are as follows: 1 and 3, 2 and 4, and 5 and 6. The present study used arrays 1–6 only, measuring in each pair of arrays consecutively. Fumigation occurs during the oak growing season, approximately 1 April to 31 October during daylight hours. In 2018, CO2 fumigation ended on the 31 October 2018 at sundown.
The predominant tree species in the woodland is Quercus robur (English oak), with Corylus avellana (hazel) forming a distinct understory layer. Other tree species present include Acer pseudoplatanus (sycamore), Crataegus monogyna (common hawthorn), and Ilex spp. (holly). A recent vegetation survey, in 2019, was completed to determine the major ground plant species: Rubus fruticosus (bramble), Phegopteris connectilis (beech fern), Hedera sp. (ivy), and grasses where the canopy has been opened for access rides (Gemma Platt, personal communication, 2019). Hanging and fallen deadwood is left in place except where it poses a direct health-and-safety risk.
In order to focus on the fungal bioaerosol component, we took measurements during the autumn, when pollen and non-fungal spore counts from the dominant vegetation were likely to be low. For example, the pollen counts are highest in spring for the two dominant tree species at the BIFoR FACE site. The UK oak pollen season can range from March to July and lasts for 4–8 weeks, with peak concentrations usually occurring in May (Grundström et al., 2019). The hazel pollen season falls earlier in the year, starting as early as January, peaking in February or March (2020). For ground cover species, the grass pollen season peaks in the summer months, sometimes extending into early September (2020), with P. connectilis sporulation peaking in mid July until mid September (Page, 1997). None of these pollen and fern sporulation seasons coincide with our measurement period. Our measurement period coincides with the fungal fruiting season at BIFoR (see below), as well as previously measured peaks in UK fungal spore concentrations (Davies et al., 1963).
Monthly macrofungal surveys were completed during the OPC measurement period. The protocol for the macrofungal survey can be found in Van Norman et al. (2008). These surveys revealed that the annual peak of fungal fruiting in 2018 occurred across September and October at the BIFoR FACE site. Species fruiting in October 2018 included but were not limited to the following: Lactarius quietus (oakbug milkcap); at least one Russula (brittlegill) species; Lycoperdon perlatum (common puffball); Mycena rosea (rosy bonnet) and other Mycena species; Auricularia auricula (jelly ear); Hypholoma fasciculare (sulfur tuft); Xylaria hypoxylon (candlesnuff fungus); and a number of resupinate fungi, including several Stereum species. All of these fungi produce spores in the range of 3–9 µm, matching the measurement capabilities of the OPCs (Læssøe and Petersen, 2019). Auricularia auricula is an exception; it was observed but produces larger, 16–18 µm long spores likely outside the OPC size window.

Figure 1Map of the BIFoR forest and FACE facility located in Staffordshire (UK) adapted from Hart et al. (2019). The green area shows the whole 19.1 ha Mill Haft woodland, 7.3 ha of which is controlled by the University of Birmingham. The access road is shown as a thick black line. Circles represent scientific research arrays. Orange arrays 1, 4, and 6 are surrounded with 25 m tall towers. CO2 levels inside the array are raised by fumigation to 150 ppm above ambient (from ∼ 400 to ∼ 550 ppm). Blue arrays 2, 3, and 5 have similar towers but are an infrastructure control, spraying out air with current ambient concentrations of CO2. Grey arrays 7, 8, and 9 are non-infrastructure controls, with no towers or fumigation. Treatment and control arrays 1–6 are paired as follows: 1 and 3, 2 and 4, and 5 and 6. The landscape surrounding the BIFoR FACE site is predominantly young tree plantations of mixed broadleaves and conifers (MacKenzie et al., 2020).
2.2 Instrumentation
In this study, we use optical particle counters, OPC-N2 sensors (Alphasense, Essex, UK) which count and size particles between 0.3 and 10 µm in diameter. The sensors are described in detail by Crilley et al. (2018) and Sousan et al. (2016). In brief, the OPCs count the number of particles and use particle light scattering to determine particle size using Mie scattering approximations (an de Hulst, 1957). To calculate particle mass concentration, particles are assumed to be of uniform spherical shape; the density is assumed to be 1.65 g cm−3; and the refractive index is assumed to be 1.5+i0. The values for density and refractive index are the taken from the standard settings of the OPC. The choice of particle density and refractive index has implications for the derived mass concentrations; however comparison between measurements taken within the woodland should be self-consistent. It is noted that fungal spores, the target of this study, are often ellipsoidal in shape and can be defined by a short and long axis diameter. Different fungal species generate spores with different shapes, sizes, and density. The assumptions used by the OPC are typically wrong on a single-particle (or bioaerosol) basis but should approach reality on an ensemble-averaged basis.
The sensors do not explicitly discriminate between particle types, so in order to discriminate between fungi and other smaller particles (bacteria and anthropogenic aerosols), we excluded data from particles smaller than 1 µm in diameter, measuring from 1 µm up to the maximum 10 µm measuring capacity of the OPCs. This size discrimination, in conjunction with the experimental location and seasonal timing of the experiment, makes it highly likely the majority of bioaerosols being captured are predominantly of fungal origin.
One of the key concerns raised for the sensing of any aerosol type using low-cost OPCs is that they can report artificially high readings under high-RH conditions. Hygroscopic aerosols take up water from the surrounding gaseous environment as a function of RH, with greater water uptake at higher RH. To compare the abundance of aerosol under different environmental conditions, it is preferable to use a “dry” aerosol concentration, with the hygroscopic growth due to water removed. To parameterize particle hygroscopicity, κ-Köhler theory is used, which describes the particle hygroscopicity using the single hygroscopicity parameter kappa (κ) (Petters and Kreidenweis, 2007). Pope (2010) details how κ-Köhler theory can be used to link particle mass to hygroscopicity by Eq. (1):
where aw is equilibrium RH expressed as a decimal, m is the wet aerosol mass, m0 is the dry aerosol mass, and ρw and ρp are the density of water and the dry particulate, respectively. The value of κ can be found by curve fitting of the pollen humidograms ( versus aw).
Biological particles such as fungal spores and pollen have been demonstrated to be hygroscopic, although they typically have a low kappa (κ) value, with the κ value of pollen typically around 0.05–0.1 as opposed to a κ value of approximately 0.3 for average anthropogenic aerosols (Griffiths et al., 2012; Pope, 2010). Due to the hygroscopicity of fungal aerosols, high relative humidity can result in a high mass concentration reading in sensors, such as the low-cost OPCs, which do not warm or dry the air. This hygroscopic effect has been explored using low-cost OPCs in urban environments by Crilley et al. (2020) and Crilley et al. (2018), where they used a calibration factor to correct for RH effects.
2.3 Instrument installation, bias checking, and calibration
We used a pair of low-cost OPCs to study bioaerosols at the BIFoR FACE site. The two OPCs used were controlled to take measurements every 60 s using a Raspberry Pi computer (Crilley et al., 2018, based on Hagan and the py-opc contributors, 2017). The OPCs and accompanying instrumentation were installed at 2 m height in a pair of BIFoR FACE arrays at a time (according to the pairing detailed in Sect. 2.1), between 9 November and 13 December 2018, as per Table 1. The air inlet for each optical particle counter was orientated towards the south-west in order to face the predominant wind direction for the site (Hart et al., 2019). The air flows through the instrument at a rate of 5.5 L min−1.
Two Tinytag Plus 2 TGP-4500 (Gemini data loggers, Chichester, UK) units were used to measure RH and temperature alongside the low-cost OPCs. The units measure temperature from −25 to +85 ∘C using an internally mounted thermistor, with the manufacturers stating an accuracy of 0.01 ∘C or better. Under field conditions, the Tinytag sensors closely follow temperature measurements taken by a weather station located at 2 m height in array 1, with the mean temperature measured by the Tinytags measuring within 0.4 ∘C of the weather station. RH is measured using an externally mounted capacitive sensor, from 0 %–100 % RH, with a manufacturer stated accuracy of ±3.0 % RH at 25 ∘C. Tinytag units were placed on the top of the OPCs, with the RH sensor facing in the same direction as the OPC inlet.
Above-canopy wind speed was measured using two-dimensional ultrasonic anemometers (WMT700, Vaisala) ∼ 1 m above the canopy (∼ 25 m height) on the northernmost tower of array 1. Below-canopy wind speed and direction (∼ 2 m height) were measured using 03002-L Wind Sentry Set (Campbell Scientific, Loughborough, UK) located to the right of the metal walkway near the entrance of array 1. The manufacturer-stated minimum-threshold wind speed was 0.8 m s−1 for the Campbell anemometer, with 2 m height wind speeds below this minimum threshold considered zero for the purposes of this experiment.
Table 1Table listing the dates and locations of equipment installation across the experimental duration at the BIFoR FACE site. Both optical particle counters (OPCs) and Tinytag relative humidity and temperature sensors were installed simultaneously.
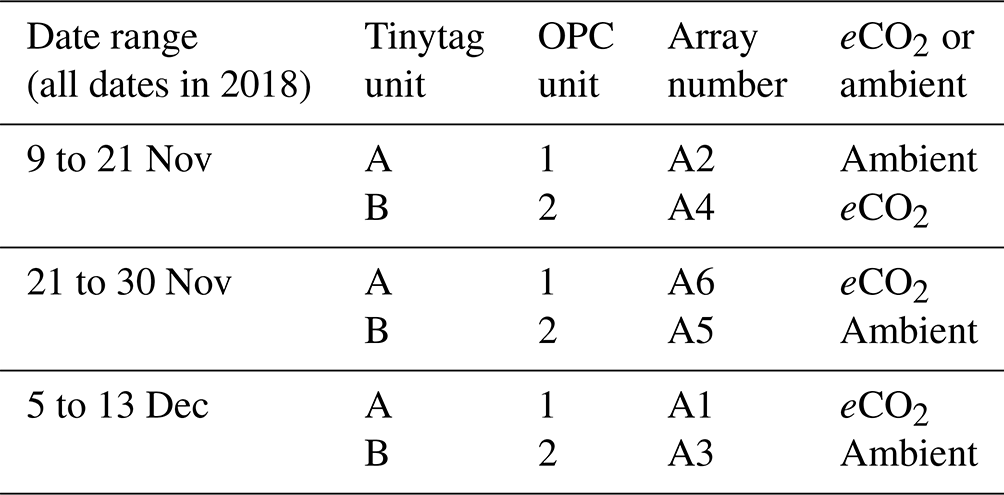
Both the pair of OPCs and Tinytags were installed for a 6 d side-by-side intercomparison period at 1.5 m height in array 1 of the BIFoR FACE site from 30 November 2018 until 5 December 2018. Using the data from this intercomparison week, bias calibration factors were calculated.
No bias factor was applied to the temperature data from the Tinytag units. RH data from the Tinytags were first filtered to remove any measurements lower than 50 % and greater than 99 %, and a calibration bias factor of 1.03 was applied to Tinytag unit B to make the two units consistent with each other. A similar calibration was performed on the particulate matter (PM) data collected by the OPCs, with the data from OPC 1 being increased by a bias factor of 1.45. Bias factors were calculated from the 6 d side-by-side period, with the factor applied to the data from the full measurement period of 37 d. This bias correction ensured the two OPCs were consistent with each other.
For both the Tinytag and OPC pairs, the consistency between the two instruments, rather than absolute calibration, was more important to allow for observation of differences between two different locations. Hence one instrument of each pair was bias-corrected to the other instrument of the pair. However, a comparison outside of the forest environment was completed between the low-cost OPCs and a TSI 3330 (a reference grade OPC), with the low-cost OPCs measuring within 25 % of the TSI without any humidity corrections, which is considered a good performance for the low-cost sensors (Crilley et al., 2020, 2018).
2.4 Spore dispersal model
We developed a conceptual model to help interpret the OPC results from the BIFoR FACE site. Within dense forests, the mean horizontal wind speed U inflects around the tops of the trees, increasing approximately exponentially with height below the inflection and logarithmically with height above it (Realistic forests and the modeling of forest-atmosphere exchange, 2021; Cionco, 1965; Finnigan, 2000; Raupach et al., 1996). Mean horizontal wind velocity U at each height z inside the canopy can, therefore, be approximated via Eq. (2):
where hc is the mean height of the trees and is U at hc. The attenuation coefficient a accounts for the flow's response to the density of the forest and tends to increase with increasing leaf area index (LAI) and flexibility of the plant elements (Cionco, 1978; Kaimal and Finnigan, 1994). The exponential relationship in Eq. (2) does not hold in forests with a sparse trunk space and open edges, e.g. many pine plantations, for which a secondary wind velocity maximum occurs below the main crown (Baldocchi and Meyers, 1988). However, it provides a reasonable first approximation for a forest such as that at the BIFoR FACE site, with extensive understorey growth and closed edges during the leaf-on season.
We adapt the model of Nathan et al. (2002) by using this exponential velocity profile to obtain a rough estimate of the horizontal distance over which spores disperse in a dense forest D. We consider spores evenly distributed within small air parcels within the canopy airspace. D equals the distance an air parcel carrying spores travels between the time of release (t0=0) and the time at which the spores in the parcel settle on the ground (t1). As a simplification, here we consider spore “release” to include both detachment by the mean wind and the point at which spores begin to settle back to the ground after being swept upwards by short intense gusts (Aylor, 1978). For a spore falling at an average settling velocity, vs, , where hr is the height of spore release. The vertical position of spores within an air parcel during settling at time t is . Substituting this expression into Eq. (2), we generate Eq. (3):
The horizontal distance over which the spores disperse is therefore
which, taking and U(t) from Eq. (3), gives
This model assumes the mean wind profile has already adjusted to the presence of the forest, for example, after passing into the forest from surrounding rural areas (see below).
We specified the mean height of the trees as 25 m to reflect those at the BIFoR FACE site. Reported values of a for forests fall within a relatively narrow range of around 1.5–4.8 (Cionco, 1978; Amiro, 1990; Su et al., 1998). We took a=2.5, as measured for forests of similar LAI to the BIFoR FACE site (Su et al., 1998). Sensitivity testing (not shown) indicated that using higher and lower values of a, respectively, decreased and increased the occurrence of spores travelling long distances but had little effect on the modal value of D; i.e. using a lower a thickened the right tail of the probability density function of D but affected its peak relatively little.
We performed a stochastic ensemble of model runs (n= 1 000 000) in R
(version 4.0.3, http://cran.r-project.org, last access: 14 May 2021) with low (0–2 m s−1), low-medium (med-l) (2–3 m s−1), high-medium (med-h) (3–4 m s−1), and high (4–6 m s−1) mean wind speeds at the top of the
canopy . We considered only spores in the bottom 10 m of the
forest airspace, i.e. hr in the range 0–10 m. Strong turbulent fluxes
of momentum, as well as scalar quantities such as spores, occur in the upper region
of forest canopies (Finnigan, 2000; Belcher et al.,
2012), which this simplified model cannot capture. Mean settling velocity vs was specified in the range 0.001–0.005 m s−1, taking reported
values for fungal spores in the size range 1–10 µm (Di-Giovanni et al., 1995;
Tesmer and Schnittler, 2007). For each model run, for we specified a random
value of , hr and vs from a uniform distribution within
each of these ranges (using the runif function in R).
2.5 Comparison of measured bioaerosol proxy with regional-scale data from Copernicus Atmosphere Monitoring Service (CAMS) global reanalysis (EAC4) data
To test the assumption that PM10–PM1 mass concentration is representative of bioaerosols, the measured PM10–PM1 time series is compared with Copernicus Atmosphere Monitoring Service (CAMS) global reanalysis (EAC4) data as a measure of regional aerosol activity influencing the study site. The Copernicus Atmosphere Monitoring Service (CAMS) reanalysis is the latest global reanalysis dataset of atmospheric composition produced by the European Centre for Medium-Range Weather Forecasts (ECMWF), consisting of three-dimensional time-consistent atmospheric composition fields, including aerosols and chemical species (Inness et al., 2019). The nearest available grid point from the EAC4 dataset (lat 52.75, long −2.50) to the BIFoR site (lat 52.81, long −2.32) and the same time period as the ambient and eCO2 measurements were used. The spatial resolution of the reanalysis data is 80 km. The PM10–PM1 metric is calculated from the EAC4 estimates of PM10 and PM1. In addition to the EAC4 PM10–PM1 estimate, we also use the aerosol optical depth (AOD) estimates from EAC4, including total AOD, the AOD attributed to dust aerosol, the AOD attributed to sea salt aerosol, and the AOD attributed to sulfate aerosol (Benedetti et al., 2009; Morcrette et al., 2009). All AODs were for the wavelength of 550 nm.
2.6 Data processing, visualization, and analysis
All data analysis was completed in R version 4.0.3 (R Core Team,
2020), with figures created using openair and ggplot (Carslaw and
Ropkins, 2012; Wickham, 2016). Relationships between PM10–PM1
concentrations and RH, temperature, and wind speed (Figs. 2, 3, and
6) were visualized using scatter plots and smoothed loess curves,
generated in ggplot. Box plots with mean PM10–PM1 (and interquartile
ranges) were generated to visualize differences in bioaerosol concentrations
between eCO2 and ambient arrays. Scatter plots with regression lines
were generated for Fig. 7 and for the figures in the Supplement.
Data were non-normally distributed; therefore Kruskal–Wallis tests were used to test for statistically significant differences between the eCO2 and ambient arrays in Sect. 3.2.
3.1 Hypothesis A: hourly fungal bioaerosol concentrations will correlate with hourly weather conditions (wind, RH, and temperature)
During the experimental period, there was a total of 46.3 mm of precipitation, with a median temperature of 7.7 ∘C within the forest. The lowest recorded temperature was −1.8 ∘C, and the highest was 15.8 ∘C. The average daily temperature peak (and the lowest RH point) occurred at approximately 13:00 local time. RH throughout the measurement period was typically high, with the median and mean measured between 89 %–91 % RH across the duration of the experiment, with the lowest recorded measurement at 63 % RH. Wind speed patterns followed each other closely above and below the canopy, with below canopy measurements significantly lower. The mean wind speed above the canopy was 2.7 m s−1, whereas below the canopy it was 0.4 m s−1.
Figure 2a shows the relationship between RH and bioaerosol concentrations at the BIFoR FACE site: the curve is almost horizontal from 75 %–90 % RH, where at 90 % it rapidly increases, most likely indicating the particles becoming exponentially hygroscopic at very high humidities. This sudden increase in particle size at very high humidities demonstrates a clear hygroscopic effect; we therefore performed a correction factor to the data from Crilley et al. (2018), using κ values of either 0.3 or 0.1 (Griffiths et al., 2012; Pope, 2010). Before correction, the median hourly PM10–PM1 concentration under eCO2 conditions was 15.7, and under ambient conditions it was 16.7 µg m−3 (Fig. 2a). After the application of the Crilley et al. (2018) correction factor using a κ value of 0.3, this decreased to a median of 5.3 µg m−3 under eCO2 and 5.9 µg m−3 at ambient CO2 concentrations (Fig. 2b), and using a κ value of 0.1, the median was 9.3 µg m−3 under eCO2, and 10.1 µg m−3 under ambient conditions (Fig. 2c). The ratio between the mean concentrations obtained from the eCO2 and ambient plots depends upon whether the Crilley et al. (2018) correction factor is used and what value is used for κ. The values are 94 %, 90 %, and 92 % for the uncorrected ratio, the ratio using κ=0.3, and the ratio using κ=0.1, respectively. A comparison of the data before and after correction is shown in Fig. 2d, e, and f. Due to the decrease in PM concentrations, with respect to RH, shown using a κ value of 0.3, the data corrected using a κ value of 0.1 were used for all further analyses, as this was deemed more appropriate given the likely particle composition (low-hygroscopicity bioaerosols). After correction to remove the instrument artefacts, there was no clear effect of RH on bioaerosol concentrations. If the observed median concentrations of PM10–PM1, using the Crilley et al. (2018) correction with a κ value of 0.1, were solely composed of idealized spherical fungal spores with radius of 3 µm and a density of 1.65 g mL−1, this would equate to spore concentration of approximately 50 000 spores m−3, which falls at the high end of Sesartic and Dallafior (2011) estimate of ground level spore concentrations of 10 000–50 000 m−3.
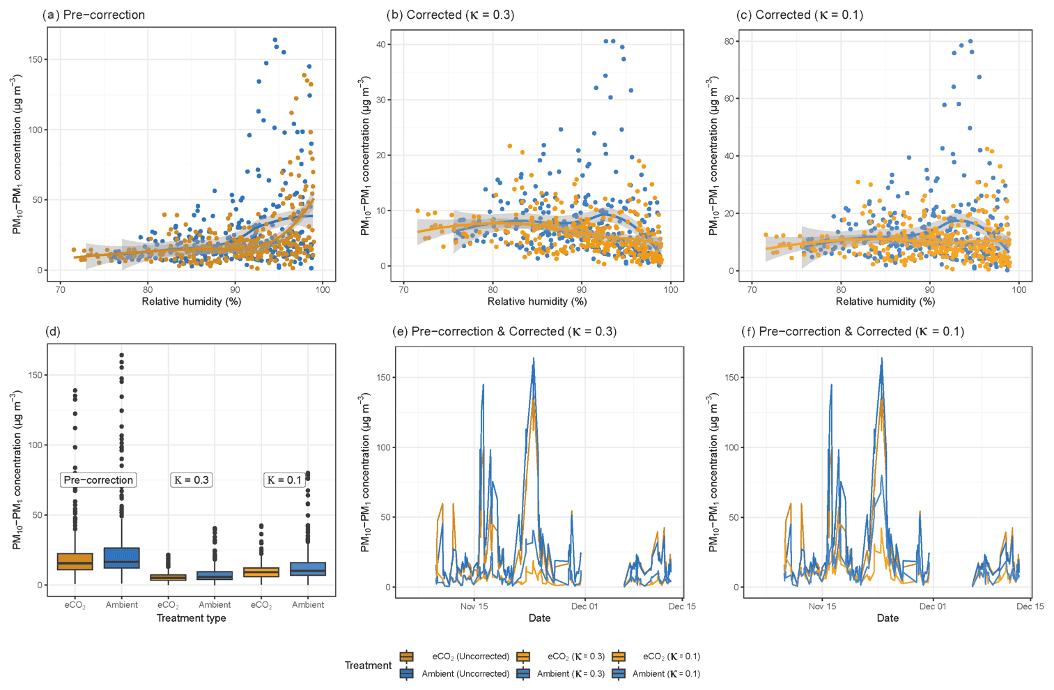
Figure 2Relative humidity and bioaerosol concentrations (PM10–PM1) at the BIFoR FACE site in autumn 2018. Panel (a) shows PM10–PM1 concentrations with increasing RH without any correction applied. Panels (b) and (c) plot the same data as panel (a); however a correction factor from Crilley et al. (2018) has been applied to the bioaerosols data to correct for the hygroscopic effect of the particles, with panel (b) using a κ value of 0.3 and panel (c) using a κ value of 0.1. Panels (a), (b), and (c) all have loess curves fitted (Wickham et al., 2019). Panels (d), (e), and (f) compare the data before and after corrections. All the plots show PM10–PM1 concentrations under ambient conditions (arrays 2, 3, and 5) in blue colours and eCO2 conditions (arrays 1, 4, and 6) in orange colours. Pre-correction data are dark orange and blue; corrected data using a κ value of 0.3 are mid blue and mid orange; and the corrected data using a κ value of 0.1 use the lightest blue and orange. All panels use hourly averages of PM10–PM1 concentrations.
The effects of wind speed and direction on the bioaerosol concentrations were also investigated in depth. Anemometers were located both above (25 m height) and below (2 m height) the canopy, with below-canopy measurements broadly following those above the canopy but measuring significantly lower at the lower height (Fig. 3a). Above the canopy, the hourly wind speed never dropped below 0.8 m s−1, whereas recorded speeds of 0 m s−1 (i.e. below anemometer threshold) were common below the canopy. The maximum hourly wind speed above the canopy was 7.05 m s−1, compared with 2.59 m s−1 below the canopy.
Bioaerosol concentrations demonstrated high variability under changing wind
speeds; however, a possible U-shaped curve was observed, with higher
bioaerosol concentrations at the lowest and highest wind speeds measured, as
shown in Fig. 3b and c. This effect was
shown using the wind speeds taken from both above (25 m) and below (2 m) the
canopy. Figure 4 shows the effect of wind speed and
direction on bioaerosol concentrations using openair polar bivariate plots (Carslaw and Ropkins, 2012). Observed wind speed patterns follow
broadly similar trends between each pair of arrays, with the majority of
medium concentration (green-yellow) bioaerosol
activity occurring in the south-western and south-eastern quadrants and only low (blue)
concentrations under northerly winds. Peaks in bioaerosol concentration
(presumed high-sporulation events) are visible in red, with some events
being replicated across both eCO2 treatment and control (e.g. the south-western
quadrant event in A5 and A6) and other high-PM events only occurring in a
single array (e.g. the south-eastern quadrant event in A4). Detecting high-PM events in a single array at a distinct time shows that the OPCs can
detect differences between the BIFoR FACE arrays.
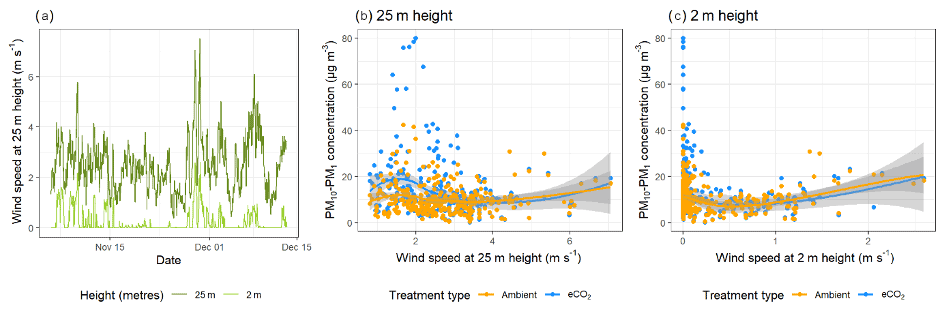
Figure 3Wind speed and bioaerosol concentrations at the BIFoR FACE site in autumn 2018. Panel (a) shows the hourly average wind speeds above (25 m height) and below (2 m height) the canopy across the experimental duration. Wind speed data at 25 m height are in dark green, and data from 2 m height are in light green. Panel (b) compares hourly average PM10–PM1 concentrations with hourly average wind speeds measured at 25 m height, and panel (c) compares the same PM10–PM1 concentrations using wind speeds measured at 2 m height. Panels (b) and (c) both have loess lines of fit (Wickham et al., 2019), with data from ambient arrays (arrays 2, 3, and 5) in blue and data from eCO2 arrays (arrays 1, 4, and 6) in orange.
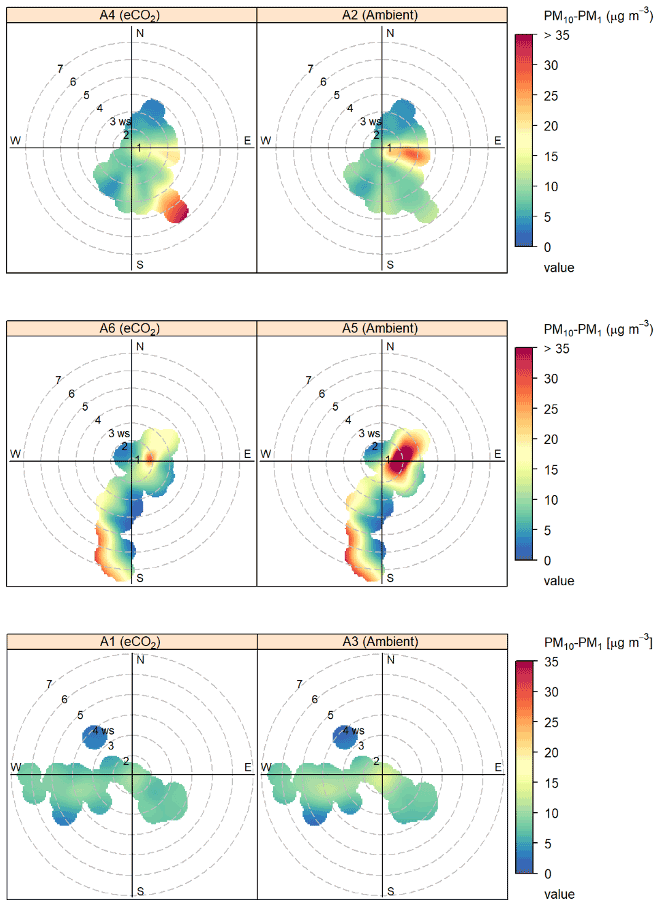
Figure 4Polar bivariate plots from openair displaying bioaerosol concentrations
(PM10–PM1), wind speed, and wind direction across the autumn 2018
experimental duration at the BIFoR FACE site (Carslaw and Ropkins, 2012).
Each row of plots shows the data collected in each of the pairs of arrays
(one eCO2, one ambient) in which the pair of OPCs were located. Dates of
OPC installation in each array pair are detailed in Table 1. Bioaerosols
were measured using OPCs at 2 m height, and wind data were taken from
anemometers at 25 m height. Colour gradients display the concentrations of
bioaerosols detected, with low concentrations shown in blue–green colours,
mid concentrations in yellow, and high concentrations in orange–red.
To investigate the relationship between spore dispersal and wind speed further, we used the model outlined in Sect. 2.4 to investigate the horizontal distance over which spores disperse D. The model was run (n= 1 000 000) for spore release heights (hr) of 2, 5, and 10 m. Figure 5 shows the probability density functions of D under four wind speed scenarios: low, low-medium, medium-high, and high. As would be expected, generally, the lower the spore release height and wind speed, the shorter the overall distance travelled by spores. Most wind conditions experienced at the BIFoR FACE site fall under the scenario of “low” wind speed (black lines), for which the modal distance travelled by spores was less than 20 m for all release heights (Fig. 5). With the arrays having diameters of 25–30 m, this means that under typical conditions, we could expect spores to stay within the array they were released in, or, at least, they are very unlikely to be transported into neighbouring arrays (i.e. a spore released under eCO2 is unlikely to be measurable in an ambient array in low-wind conditions). However, at higher wind speeds, a heavy tail is present on each of the plots, indicating that spores are more likely to travel much greater distances at higher wind speeds, potentially causing mixing between the arrays. Finally, we looked at PM10–PM1 concentrations under changing temperature (Fig. 6). There was a small positive relationship between temperature and bioaerosol concentrations, with PM10–PM1 concentrations of around 5 µg m−3 at the lowest temperatures (1–3 ∘C), increasing up to 10 µg m−3 at the highest temperatures of 12–13 ∘C.

Figure 5Model outputs of probability density functions for distance travelled by spores in a forested environment. Panels (a), (b), and (c) had different spore release heights (hr) inputted into the model – 2, 5, and 10 m, respectively. Solid lines are in different colours for each of the low (black), low–medium (blue), medium–high (yellow), and high (red) (wind speed) cases. Dashed lines show modal D (distance) travelled by the spores. n = 1 000 000 for each case.
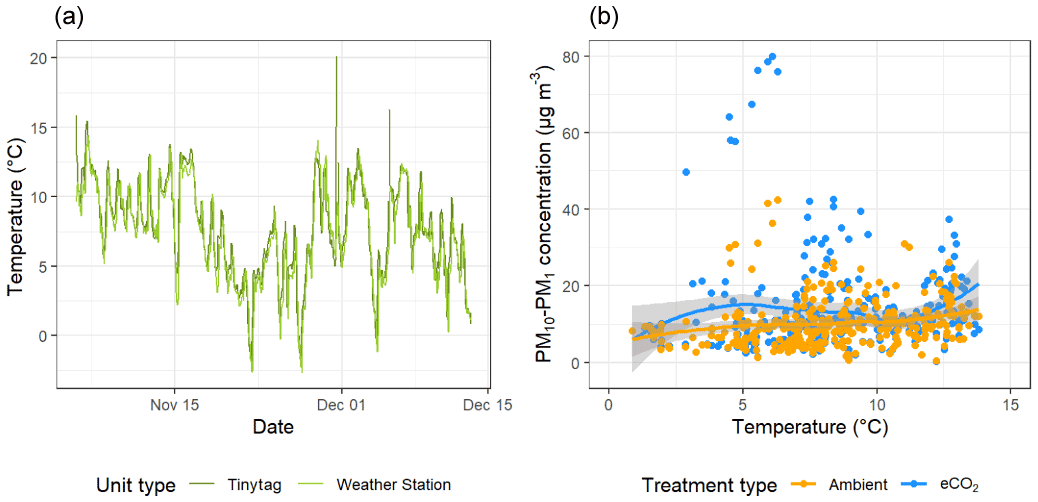
Figure 6Temperature and bioaerosol (PM10–PM1) concentrations across the experimental duration at the BIFoR FACE site. Panel (a) shows temperature data, with mean temperature measured by Tinytag sensors shown in dark green and light green showing data collected by the array 1 weather station. Panel (b) compares temperature data with bioaerosol concentrations with data from ambient arrays (arrays 2, 3, and 5) in blue and data from eCO2 arrays (arrays 1, 4, and 6) in orange with both treatment types fitted with a loess line (Wickham et al., 2019).
3.2 Hypothesis B: fungal bioaerosol concentrations will increase in woodland patches treated with eCO2 for 2 years
Figure 7 shows six plots comparing PM10–PM1 concentrations between the eCO2 (orange) and ambient (blue) arrays. When comparing total concentrations across the entire measurement period (Fig. 7a, b, and c), there was no significant difference (p=0.489) between the eCO2 treatment and ambient; however a heavy tail is present in the ambient arrays. To investigate this relationship further, we separated out the data into low-bioaerosol-concentration conditions (<10 µg m−3) and high bioaerosol concentrations ( µg m−3) (Fig. 7d, e, and f). When bioaerosol concentration is low (Fig. 7d and e), there was no significant difference between the eCO2 and ambient treatments (p=0.689). These low concentrations likely represent background levels of aerosols that are consistent throughout the forest. However, when selecting for high-concentration events, there was a significant effect seen, whereby eCO2 treatment suppressed concentrations of high-bioaerosol events (p=0.023) (Fig. 7d and f).
The boxplot in panel (a) shows that there is no significant difference between the medians of eCO2 treatment versus the control; however, there were slightly higher bioaerosol concentrations shown under ambient conditions. Panel (b) shows a time series of the data, demonstrating that bioaerosol concentrations match extremely closely between the two treatment groups. The small difference in the overall medians can be largely attributed to the PM10–PM1 concentration difference between the eCO2 and ambient conditions during the largest bioaerosol event around 22 November (during the second measurement period, shown shaded in grey), where the ambient array (shown in blue) measures higher than the eCO2 array in orange.
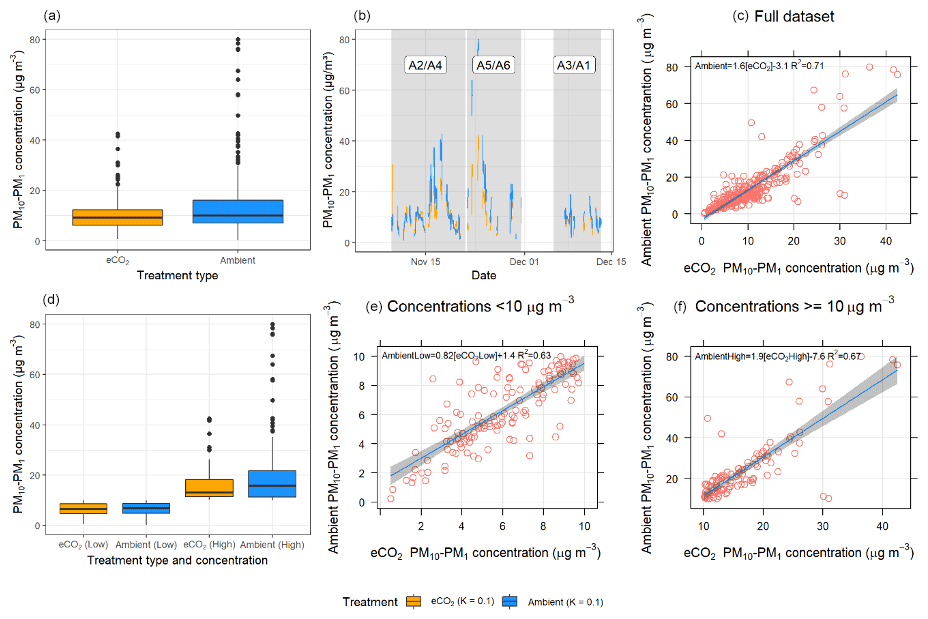
Figure 7Bioaerosol concentrations across the experimental duration in ambient (arrays 2, 3, and 5) and eCO2 (arrays 1, 4, and 6) arrays. eCO2 treatment is shown in orange; ambient control is in blue. Panels (a), (b), and (c) include the full dataset, with no significant difference shown between the eCO2 treatment and control. Panels (d), (e), and (f) split the dataset into low (<10 µg m−3) and high (>=10 µg m−3) bioaerosol concentrations. When the data are split in this way, there was no significant difference between treatments under low bioaerosol concentrations. However, when bioaerosol concentrations were high, concentrations were significantly lower under eCO2 treatment.
3.3 Comparison of the measured bioaerosol proxy with regional-scale data from Copernicus Atmosphere Monitoring Service (CAMS) global reanalysis (EAC4) data
It can be seen in Fig. 8 that the EAC4 estimate of regional PM10–PM1 does not correlate with the PM10–PM1 measured within the forest. Hence, we believe the measured PM10–PM1 is local to woodland and not representative of the regional air mass. The Pearson correlation between the measured PM10–PM1 in the ambient and eCO2 arrays and the EAC4 estimates is −0.03 and 0.03, respectively, highlighting negligible correlation between the measured and EAC4 time series. To look for further possible correlations between the measured PM10–PM1 and estimated aerosol properties, correlative analysis was conducted on the measured PM10–PM1 with the aerosol optical depth (AOD) estimates from EAC4 consisting of the total AOD, the AOD attributed to dust aerosol, the AOD attributed to sea salt aerosol, and the AOD attributed to sulfate aerosol. Similar to the EAC4 PM10–PM1 product, there were no non-negligible correlations with the AOD products, with Pearson correlation values ranging from −0.16 to 0.23. See the Supplement for more information about the correlation plots provided in Figs. S1 to S11.
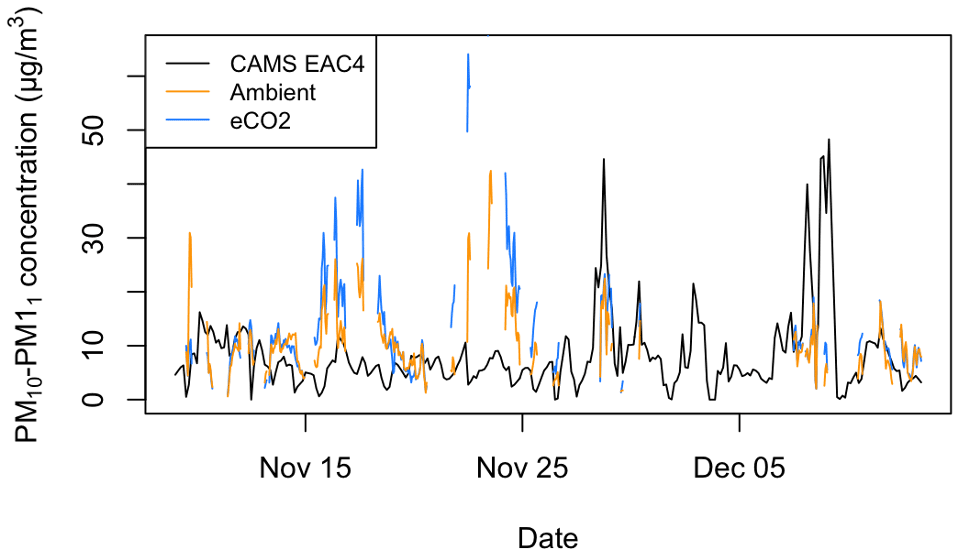
Figure 8Time series data of the PM10–PM1 mass concentrations measured in the ambient and eCO2 arrays and provided by the Copernicus Atmosphere Monitoring Service (CAMS) global reanalysis (EAC4) dataset. The BIFoR data contain only data collected when RH < 99 %.
In support of hypothesis A, we found that various meteorological variables affected bioaerosol concentrations. The RH before correction was of particular importance, especially as the low-cost OPCs do not have any warming or drying capacity and therefore are susceptible to recording higher mass concentrations of aerosols under high-humidity conditions as particles swell with additional water (Crilley et al., 2018). We found that the RH percentage threshold for significant particle swelling was 90 %–95 %, which is a much higher RH value than would be expected for anthropogenic aerosols, which typically contain more hygroscopic components including salts, and therefore provides evidence that the measured PM10–PM1 fraction represents a predominantly biological source. In their study investigating effects of RH on fungal spore swelling, Reponen et al. (1996) demonstrated a similar effect whereby a significant swelling of fungal spores was seen but only at very high humidities (greater than 90 %). We believe this threshold for particle swelling further demonstrates that we are recording a biological source. This hygroscopic evidence is in addition to the ecological and phenological evidence for spores being the dominant source within the PM10–PM1 size fraction during the measurement period.
After correction, we did not see any effect of RH on fungal spore concentrations. The evidence in the literature for the relationship between spore concentrations and RH is mixed, probably largely due to species-specific effect. Some fungal species are dependent on high RH to develop spores (and then release spores by rain droplets), whereas other species release spores in response to a drop in RH (Jones and Harrison, 2004; Li and Kendrick, 1995). The high diversity of fungal species at BIFoR (each with possibly varying responses to RH) could result in this flat line. Another possible explanation is that the fungi never experience low-RH conditions due to the constant high RH at the BIFoR FACE site, potentially with the RH never dropping low enough to trigger a burst of spore release. Finally, it is important to mention that although the Crilley et al. (2018) correction is an essential part of using low-cost sensors in a high-humidity environment, the high swelling threshold of fungal spores means that the κ value of 0.3 (or even 0.1) may be inappropriately high for biological particles such as these. As shown in Fig. 2, after correcting the data, the PM10–PM1 concentrations decrease after 95 % RH, although this effect is smaller when using a κ value of 0.1. For future studies, calibrating the low-cost OPCs against a reference grade instrument in the experimental environment in order to provide a calibrated κ value would be an appropriate measure, enabling a more thorough investigation of the RH dependence, and improve the accuracy of the Crilley et al. (2018) correction for bioaerosols (Crilley et al., 2020).
We measured an approximately U-shaped curve of bioaerosol concentrations in response to wind speed, with the highest PM10–PM1 concentrations being displayed at low and high wind speeds. This likely indicates a balance between spore release mechanisms and mixing of low-aerosol air. At low wind speeds, there is minimal movement of air through the forest, so any spores released do not travel significant distances. At high wind speeds, there is much higher movement of air, which decreases concentrations by carrying spores further; however, spore release by wind could also be increased (Dressaire et al., 2016). At medium wind speeds, a balance between these two effects occurs, maintaining bioaerosol concentrations at a lower level (Jones and Harrison, 2004). Our model demonstrated that under low-wind-speed conditions, spores are most likely to travel a relatively short distance, suggesting that between-array mixing was unlikely under the meteorological conditions experienced during the measurement period. Particle release height (hr) had a significant impact on the distance travelled by a particle, which is an important consideration given the source of bioaerosols. For example, fungal spores are likely to have a significantly lower hr value than pollen, which, based on our model, would significantly impact the distance travelled by the different bioaerosol types. Due to the complexity of the forest environment, there are a number of aspects which the model did not capture which could alter the distance travelled by a spore. Complex wind dynamics such as ejections (infrequent but strong upward gusts of air) and turbulence around forest edges could increase the distance travelled by a spore, as well as varied spore release dynamics between fungi (Dressaire et al., 2016; Norros et al., 2014). The model also assumes a spatially representative wind speed profile, which does not account for local velocity effects induced by gaps, clearings, and changes in canopy density. These local effects may be important near the ground, where wind speeds are generally low. However, the distance travelled could also be shorter than modelled; for example, the model does not capture spore deposition onto forest surfaces other than the ground, spores being swept downwards by gusts, and changes with wet versus dry deposition.
The data demonstrated a decrease in bioaerosol concentrations at lower temperatures, which is the expected response within the range of temperatures we observed in a woodland of this type (Gange et al., 2007). The number of fungal sporocarps present across the duration of the experiment decreased, and it is therefore logical to expect that spore production would also consequently decrease. For future studies, it would be interesting to begin measurements earlier in the fungal season, allowing us to capture the peak of sporocarp production, as well as the end of the active eCO2 fumigation at the FACE experiment.
Regarding hypothesis B, to our knowledge, this is the first assessment of bioaerosols in any forest FACE experiment to date and therefore provides valuable data contributing to the understanding of the forest environment at the BIFoR FACE site as well as more broadly in the context of forests and FACE experiments. We did not see a significant effect of eCO2 on total aerosol concentrations. However, when data were split into low and high aerosol concentrations, two differing responses were demonstrated. Under low concentrations, there was no significant effect of eCO2 treatment; we therefore think these low concentrations represent the background concentrations of aerosols present both inside and in the wider environment around the forest. However, when high concentrations of bioaerosols were detected, eCO2 treatment resulted in a suppression of PM10–PM1 concentrations. This is demonstrated in a number of larger sporulation events during the experimental period, for example the large sporulation event peaking on 22 November, where although both arrays showed the sporulation event, the magnitude of this event was significantly different between eCO2 and ambient conditions.
This evidence, as well as the eCO2 dispersal data from Hart et al. (2019) and the modal spore travel distances shown in our model, suggests to us that this experimental set-up is capable of detecting differences between the eCO2 and ambient arrays. It is apparent that at background concentrations these differences are not present between arrays; however there may be a response to eCO2 during large sporulation events. This could be for a number of reasons, the primary reason being that the experiment was in the very early stages of fumigation (year 2 of 10 total years planned), and there might be a lag expected in fungal responses, as they are most likely responding indirectly to eCO2 via changes in leaf litter and soil. Although the literature states a small number of cases of where individual fungal species do respond directly to eCO2, it is likely that the main effects would be secondary, for example, competition between autotrophs and heterotrophs for nutrients or an increase in leaf litter production resulting in an increase the population of decomposer fungi. There is evidence for increased autotrophic productivity under eCO2 at the BIFoR FACE site in the form of increased leaf-scale photosynthesis (Gardner et al., 2020) and fine-root production (Ziegler et al., 2021). Whether this increased autotrophic productivity primes or competes with fungal activity requires further work. Continuing to monitor bioaerosol concentrations throughout the 10+-year experimental duration of the BIFoR FACE experiment, along with monitoring in other FACE experiments, will be key to understanding how eCO2 affects bioaerosol concentrations in the long term.
Another possible reason for not picking up an eCO2 response in fungal bioaerosols in the full dataset is that the maximum diameter of the particles that can be detected by the OPCs is 10 µm, which does exclude several fungal species, including those known to be present in the BIFoR forest during the experimental duration. However, we note that many common woodland spore species are smaller than 10 µm, including the following species observed in the forest: Lactarius quietus, Russula species, Lycoperdon perlatum, Mycena rosea, other Mycena species, Auricularia auricula, Hypholoma fasciculare, Xylaria hypoxylon, and various Stereum species. In addition to the observed species, many spores commonly observed to be airborne in the UK, including Cladosporium, Ganoderma, and Aspergillus species (Sadyś et al., 2016a), have diameters less than 10 µm. If a response to eCO2 is species-specific, then it is possible that we are missing an effect in fungi with larger spores. It is also possible that although the total and background aerosol concentrations were stable under eCO2, the aerosol composition could have been different (e.g. altered ratios of fungal species present), which we were not able to detect using the OPCs. Varying fungal species between the ambient and eCO2 arrays could therefore be responsible for the differing response we detected during sporulation events. In order to determine definitive particle composition, other techniques such as detectors using fluorescence or DNA sequencing of biological material are required (Fröhlich-Nowoisky et al., 2016; Gosselin et al., 2016; Healy et al., 2012). Finally, our experimental measurement period occurred outside of the eCO2 fumigation season, and therefore the main growing season of the trees, which could have reduced any direct effects of the eCO2, although, given the likely cumulative effect of the eCO2 treatment over the growing season and the fact that our measurements were focussed on the period of peak sporulation, it seems more likely that our measurements were well-timed to observe any treatment effects.
We have demonstrated that low-cost OPCs are suitable for measuring PM10–PM1 concentrations in forests or other high-humidity environments. We demonstrate that the PM10–PM1 metric is a good proxy for bioaerosols because of the bioaerosol representative size range, the location of the study site (a woodland in a rural location), the field measurement taking place during the season of peak fungal activity, and the low hygroscopicity of the particles measured. Through comparison with the EAC4 estimate of PM10–PM1 we highlight that the woodland measurements do not follow regional air pollution trends and that the observed PM10–PM1 concentrations are likely from woodland sources. The findings from this study have consequences for other research into the aerobiology of forests and also open up the bioaerosol research field to a wider array of locations and researchers. The low-cost sensors measured significant swelling in PM10–PM1-sized particles at very high RH, which we corrected for using a calibration factor from Crilley et al. (2018). For future work, generating a κ value using a reference grade instrument in situ would improve accuracy (Crilley et al., 2020). Temperature, wind speed, and wind direction were all shown to affect bioaerosol concentrations; however, we did not see any effect of RH (post-correction). Treatment with eCO2 may repress concentrations of bioaerosols during high sporulation events (p=0.023); however this significant difference was not detected across all concentrations of aerosols (p=0.489). Therefore, further investigation later in the 10+-year experimental duration is warranted, as well as investigation of forest bioaerosols in other forest FACE experiments globally. The use of the PM10–PM1 metric as a proxy for bioaerosols, in woodland and other settings, should be further evaluated through future experiments that unambiguously measure bioaerosol concentrations.
Data supporting this publication are openly available from the UBIRA eData repository at https://doi.org/10.25500/edata.bham.00000688 (Baird et al., 2021). The data provided are the hourly data with the inter-unit calibration bias factor applied.
The supplement related to this article is available online at: https://doi.org/10.5194/bg-19-2653-2022-supplement.
ABB and FDP designed the bioaerosol study as part of the FACE programme designed by ARM. ABB collected and analysed the OPC data and prepared the manuscript. EJB wrote the model. All co-authors discussed the results and contributed to writing the manuscript.
The contact author has declared that neither they nor their co-authors have any competing interests.
Publisher's note: Copernicus Publications remains neutral with regard to jurisdictional claims in published maps and institutional affiliations.
The BIFoR FACE facility is a research infrastructure project supported by the JABBS Foundation and the University of Birmingham. Aileen B. Baird is supported by a Natural Environment Research Council (NERC) studentship through the DREAM programme (grant no. NE/M009009/1). Edward J. Bannister is supported by a NERC studentship through the CENTA programme (Central England NERC Training Alliance; grant no.NE/L002493/1). A. Robert MacKenzie gratefully acknowledges support from NERC (grant nos. NE/S015833/1 and NE/S002189/1). Francis D. Pope gratefully acknowledges support from EPSRC (Engineering and Physical Sciences Research Council; grant no. EP/T030100/1). Thanks go to the British Pteridological Society for their literature recommendations and advice on fern phenology.
This research has been supported by the Natural Environment Research Council (grant nos. NE/M009009/1, NE/L002493/1, NE/S015833/1, and NE/S002189/1) and the Engineering and Physical Sciences Research Council (grant no. EP/T030100/1).
This paper was edited by Nicolas Brüggemann and reviewed by Branko Sikoparija, Madeleine Petersson Sjögren, and Chunmao Zhu.
https://www.worcester.ac.uk/about/academic-schools/school-of-science-and-the-environment/science-and-the-environment-research/national-pollen-and-aerobiology-research-unit/pollen-calendar.aspx, last access: 16 July 2020.
Amiro, B. D.: Comparison of turbulence statistics within three boreal forest canopies, Bound.-Lay. Meteorol., 51, 99–121, https://doi.org/10.1007/BF00120463, 1990.
Andrew, C. and Lilleskov, E. A.: Productivity and community structure of ectomycorrhizal fungal sporocarps under increased atmospheric CO2 and O3, Ecol. Lett., 12, 813–822, https://doi.org/10.1111/j.1461-0248.2009.01334.x, 2009.
Aylor, D. E.: Dispersal in Time and Space: Aerial Pathogens, in: Plant Disease: An Advanced Treatise, edited by: Horsfall, J. G. and Cowling, E. B., Academic Press, New York, 159–179, https://doi.org/10.1016/0048-3575(79)90101-9, 1978.
Baird, A. B. and Pope, F. D.: “Can't see the forest for the trees”: The importance of fungi in the context of UK tree planting, https://doi.org/10.1002/fes3.371, 2021.
Baird, A. B., Pope, F. D., Bannister, E. J., and MacKenzie, A. R.: BIFoR FACE 2018 bioaerosols data, University of Birmingham [data set], https://doi.org/10.25500/edata.bham.00000688, 2021.
Bannister, E. J., MacKenzie, A. R., and Cai, X. M.: Realistic Forests and the Modeling of Forest‐Atmosphere Exchange, Rev. Geophys., 60, e2021RG000746, https://doi.org/10.1029/2021RG000746, 2022.
Baldocchi, D. D. and Meyers, T. P.: Turbulence structure in a deciduous forest, Bound.-Lay. Meteorol., 43, 345–364, 1988.
Bannister, E. J., MacKenzie, A. R., and Cai, X. M.: Realistic Forests and the Modeling of Forest‐Atmosphere Exchange, Rev. Geophys., 60, e2021RG000746, https://doi.org/10.1029/2021RG000746, 2022.
Belcher, S. E., Harman, I. N., and Finnigan, J. J.: The Wind in the Willows: Flows in Forest Canopies in Complex Terrain, Annu. Rev. Fluid Mech., 44, 479–504, https://doi.org/10.1146/annurev-fluid-120710-101036, 2012.
Benedetti, A., Morcrette, J.-J., Boucher, O., Dethof, A., Engelen, R. J., Fisher, M., Flentje, H., Huneeus, N., Jones, L., Kaiser, J. W., Kinne, S., Mangold, A., Razinger, M., Simmons, A. J., and Suttie, M.: Aerosol analysis and forecast in the European Centre for Medium-Range Weather Forecasts Integrated Forecast System: 2. Data assimilation, J. Geophys. Res.-Atmos., 114, D13205, https://doi.org/10.1029/2008JD011115, 2009.
Biedermann, P. H. W. and Vega, F. E.: Ecology and Evolution of Insect–Fungus Mutualisms, Annu. Rev. Entomol., 65, 431–455, https://doi.org/10.1146/annurev-ento-011019-024910, 2020.
Burge, H. A.: An update on pollen and fungal spore aerobiology, Reviews And Feature Articles: Current Reviews Of Allergy And Clinical Immunology, 110, 544–552, https://doi.org/10.1067/mai.2002.128674, 2002.
Carslaw, D. C. and Ropkins, K.: openair – an R package for air quality data analysis, Environ. Modell. Softw., 27–28, 52–61, 2012.
Chaudhary, V. B., Nolimal, S., Sosa-Hernández, M. A., Egan, C., and Kastens, J.: Trait-based aerial dispersal of arbuscular mycorrhizal fungi, New Phytol., 228, 238–252, https://doi.org/10.1111/nph.16667, 2020.
Cionco, R. M.: A Mathematical Model for Air Flow in a Vegetative Canopy, J. Appl. Meteorol. Clim., 4, 517–522, https://doi.org/10.1175/1520-0450(1965)004<0517:ammfaf>2.0.co;2, 1965.
Cionco, R. M.: Analysis of canopy index values for various canopy densities, Bound.-Lay. Meteorol., 15, 81–93, https://doi.org/10.1007/BF00165507, 1978.
Crilley, L. R., Shaw, M., Pound, R., Kramer, L. J., Price, R., Young, S., Lewis, A. C., and Pope, F. D.: Evaluation of a low-cost optical particle counter (Alphasense OPC-N2) for ambient air monitoring, Atmos. Meas. Tech., 11, 709–720, https://doi.org/10.5194/amt-11-709-2018, 2018.
Crilley, L. R., Singh, A., Kramer, L. J., Shaw, M. D., Alam, M. S., Apte, J. S., Bloss, W. J., Hildebrandt Ruiz, L., Fu, P., Fu, W., Gani, S., Gatari, M., Ilyinskaya, E., Lewis, A. C., Ng'ang'a, D., Sun, Y., Whitty, R. C. W., Yue, S., Young, S., and Pope, F. D.: Effect of aerosol composition on the performance of low-cost optical particle counter correction factors, Atmos. Meas. Tech., 13, 1181–1193, https://doi.org/10.5194/amt-13-1181-2020, 2020.
Davies, R. R., Denny, M. J., and Newton, L. M.: A Comparison Hetween the Summer and Autumn Air-Sporas at London and Liverpool, Allergy, 18, 131–147, https://doi.org/10.1111/j.1398-9995.1963.tb03156.x, 1963.
Di-Giovanni, F., Kevan, P. G., and Nasr, M. E.: The variability in settling velocities of some pollen and spores, Grana, 34, 39–44, https://doi.org/10.1080/00173139509429031, 1995.
Dressaire, E., Yamada, L., Song, B., and Roper, M.: Mushrooms use convectively created airflows to disperse their spores, P. Natl. Acad. Sci. USA, 113, 2833–2838, https://doi.org/10.1073/pnas.1509612113, 2016.
Finnigan, J.: Turbulence in Plant Canopies, Annu. Rev., 32, 519–571, 2000.
Fröhlich-Nowoisky, J., Pickersgill, D. A., Despres, V. R., and Pöschl, U.: High diversity of fungi in air particulate matter, P. Natl. Acad. Sci. USA, 106, 12814–12819, https://doi.org/10.1073/pnas.0811003106, 2009.
Fröhlich-Nowoisky, J., Kampf, C. J., Weber, B., Huffman, J. A., Pöhlker, C., Andreae, M. O., Lang-Yona, N., Burrows, S. M., Gunthe, S. S., Elbert, W., Su, H., Hoor, P., Thines, E., Hoffmann, T., Després, V. R., and Pöschl, U.: Bioaerosols in the Earth system: Climate, health, and ecosystem interactions, Atmos. Res., 182, 346–376, https://doi.org/10.1016/j.atmosres.2016.07.018, 2016.
Gange, A. C., Gange, E. G., Sparks, T. H., and Boddy, L.: Rapid and Recent Changes in Fungal Fruiting Patterns, Science, 316, 71–71, https://doi.org/10.1126/science.1137489, 2007.
Gardner, A., Ellsworth, D. S., Crous, K. Y., Pritchard, J., and MacKenzie, A. R.: Is photosynthetic enhancement sustained through three years of elevated CO2 exposure in 175-year-old Quercus robur?, Tree Physiol., 42, 130–144, https://doi.org/10.1093/treephys/tpab090, 2022.
Gilbert, G. S. and Reynolds, D. R.: Nocturnal Fungi: Airborne Spores in the Canopy and Understory of a Tropical Rain Forest, Biotropica, 37, 462–464, 2005.
Gosselin, M. I., Rathnayake, C. M., Crawford, I., Pöhlker, C., Fröhlich-Nowoisky, J., Schmer, B., Després, V. R., Engling, G., Gallagher, M., Stone, E., Pöschl, U., and Huffman, J. A.: Fluorescent bioaerosol particle, molecular tracer, and fungal spore concentrations during dry and rainy periods in a semi-arid forest, Atmos. Chem. Phys., 16, 15165–15184, https://doi.org/10.5194/acp-16-15165-2016, 2016.
Griffiths, P. T., Borlace, J.-S., Gallimore, P. J., Kalberer, M., Herzog, M., and Pope, F. D.: Hygroscopic growth and cloud activation of pollen: a laboratory and modelling study, Atmos. Sci. Lett., 13, 289–295, https://doi.org/10.1002/asl.397, 2012.
Grinn-Gofroń, A., Nowosad, J., Bosiacka, B., Camacho, I., Pashley, C., Belmonte, J., De Linares, C., Ianovici, N., Manzano, J. M. M., Sadyś, M., Skjøth, C., Rodinkova, V., Tormo-Molina, R., Vokou, D., Fernández-Rodríguez, S., and Damialis, A.: Airborne Alternaria and Cladosporium fungal spores in Europe: Forecasting possibilities and relationships with meteorological parameters, Sci. Total Environ., 653, 938–946, https://doi.org/10.1016/j.scitotenv.2018.10.419, 2019.
Grundström, M., Adams-Groom, B., Pashley, C. H., Dahl, Å., Rasmussen, K., de Weger, L. A., Thibaudon, M., Fernández-Rodríguez, S., Silva-Palacios, I., and Skjøth, C. A.: Oak pollen seasonality and severity across Europe and modelling the season start using a generalized phenological model, Sci. Total Environ., 663, 527–536, https://doi.org/10.1016/j.scitotenv.2019.01.212, 2019.
Hagan, D. H. and the py-opc contributors: py-opc, GitHub [code], https://github.com/dhhagan/py-opc (last access: 27 January 2021), 2017.
Halbwachs, H. and Bässler, C.: Gone with the wind – a review on basidiospores of lamellate agarics, Mycosphere, 6, 78–112, https://doi.org/10.5943/mycosphere/6/1/10, 2015.
Hart, K. M., Curioni, G., Blaen, P., Harper, N. J., Miles, P., Lewin, K. F., Nagy, J., Bannister, E. J., Cai, X. M., Thomas, R. M., Krause, S., Tausz, M., and MacKenzie, A. R.: Characteristics of Free Air Carbon Dioxide Enrichment of a Northern Temperate Mature Forest, Glob. Change Biol., 26, 1023–1037, https://doi.org/10.1111/gcb.14786, 2019.
Heald, C. L. and Spracklen, D. V.: Atmospheric budget of primary biological aerosol particles from fungal spores, Geophys. Res. Lett., 36, L09806, https://doi.org/10.1029/2009GL037493, 2009.
Healy, D. A., O'Connor, D. J., and Sodeau, J. R.: Measurement of the particle counting efficiency of the “Waveband Integrated Bioaerosol Sensor” model number 4 (WIBS-4), J. Aerosol Sci., 47, 94–99, https://doi.org/10.1016/j.jaerosci.2012.01.003, 2012.
Hollins, P. D., Kettlewell, P. S., Atkinson, M. D., Stephenson, D. B., Corden, J. M., Millington, W. M., and Mullins, J.: Relationships between airborne fungal spore concentration of Cladosporium and the summer climate at two sites in Britain, Int. J. Biometeorol., 48, 137–141, https://doi.org/10.1007/s00484-003-0188-9, 2004.
Horton, T. R.: Spore Dispersal in Ectomycorrhizal Fungi at Fine and Regional Scales, in: Biogeography of Mycorrhizal Symbiosis, edited by: Tedersoo, L., Springer International Publishing, Cham, 61–78, https://doi.org/10.1007/978-3-319-56363-3_3, 2017.
Hulst, H. C. and van de Hulst, H. C.: Light scattering by small particles, John Wiley and Sons, New York, 1957.
Inness, A., Ades, M., Agustí-Panareda, A., Barré, J., Benedictow, A., Blechschmidt, A.-M., Dominguez, J. J., Engelen, R., Eskes, H., Flemming, J., Huijnen, V., Jones, L., Kipling, Z., Massart, S., Parrington, M., Peuch, V.-H., Razinger, M., Remy, S., Schulz, M., and Suttie, M.: The CAMS reanalysis of atmospheric composition, Atmos. Chem. Phys., 19, 3515–3556, https://doi.org/10.5194/acp-19-3515-2019, 2019.
Jones, A. M. and Harrison, R. M.: The effects of meteorological factors on atmospheric bioaerosol concentrations – a review, Sci. Total Environ., 326, 151–180, https://doi.org/10.1016/j.scitotenv.2003.11.021, 2004.
Kaimal, J. C. and Finnigan, J. J.: Atmospheric boundary layer flows – their structure and measurement, Oxford University Press, New York, https://doi.org/10.16085/j.issn.1000-6613.2012.02.016, 1994.
Kauserud, H., Heegaard, E., Buntgen, U., Halvorsen, R., Egli, S., Senn-Irlet, B., Krisai-Greilhuber, I., Damon, W., Sparks, T., Norden, J., Hoiland, K., Kirk, P., Semenov, M., Boddy, L., and Stenseth, N. C.: Warming-induced shift in European mushroom fruiting phenology, P. Natl. Acad. Sci. USA, 109, 14488–14493, https://doi.org/10.1073/pnas.1200789109, 2012.
Kivlin, S. N., Winston, G. C., Goulden, M. L., and Treseder, K. K.: Environmental filtering affects soil fungal community composition more than dispersal limitation at regional scales, Fungal Ecol., 12, 14–25, https://doi.org/10.1016/j.funeco.2014.04.004, 2014.
Klironomos, J. N., Rillig, M. C., Allen, M. F., Zak, D. R., Pregitzer, K. S., and Kubiske, M. E.: Increased levels of airborne fungal spores in response to Populus tremuloides grown under elevated atmospheric CO2, Can. J. Bot., 75, 1670–1673, https://doi.org/10.1139/b97-880, 1997.
Læssøe, T. and Petersen, J. H.: Fungi of Temperate Europe, Princeton University Press, 2019.
Li, D.-W. and Kendrick, B.: A year-round study on functional relationships of airborne fungi with meteorological factors, Int. J. Biometeorol., 39, 74–80, https://doi.org/10.1007/BF01212584, 1995.
Lilleskov, E. A. and Bruns, T. D.: Spore dispersal of a resupinate ectomycorrhizal fungus, Tomentella sublilacina, via soil food webs, Mycologia, 97, 762–769, https://doi.org/10.1080/15572536.2006.11832767, 2005.
MacKenzie, A. R., Krause, S., Hart, K. M., Thomas, R. M., Blaen, P. J., Hamilton, R. L., Curioni, G., Quick, S. E., Kourmouli, A., Hannah, D. M., and Comer‐Warner, S. A.: BIFoR FACE: Water-soil-vegetation-atmosphere data from a temperate deciduous forest catchment, including under elevated CO2, Hydrol. Process., 35, e14096, https://doi.org/10.1002/hyp.14096, 2021.
Moore-Landecker, E.: Fungal Spores, in: eLS, American Cancer Society, https://doi.org/10.1002/9780470015902.a0000378.pub2, 2011.
Morcrette, J.-J., Boucher, O., Jones, L., Salmond, D., Bechtold, P., Beljaars, A., Benedetti, A., Bonet, A., Kaiser, J. W., Razinger, M., Schulz, M., Serrar, S., Simmons, A. J., Sofiev, M., Suttie, M., Tompkins, A. M., and Untch, A.: Aerosol analysis and forecast in the European Centre for Medium-Range Weather Forecasts Integrated Forecast System: Forward modeling, J. Geophys. Res.-Atmos., 114, D06206, https://doi.org/10.1029/2008JD011235, 2009.
Nathan, R., Horn, H. S., Chave, J., and Levin, S. A.: Mechanistic models for tree seed dispersal by wind in dense forests and open landscapes, in: Seed dispersal and frugivory: ecology, evolution and conservation, Third International Symposium-Workshop on Frugivores and Seed Dispersal, São Pedro, Brazil, 6–11 August 2000, edited by: Levey, D. J., Silva, W. R., and Galetti, M., CABI, Wallingford, 69–82, https://doi.org/10.1079/9780851995250.0069, 2002.
Norby, R. J., De Kauwe, M. G., Domingues, T. F., Duursma, R. A., Ellsworth, D. S., Goll, D. S., Lapola, D. M., Luus, K. A., MacKenzie, A. R., Medlyn, B. E., Pavlick, R., Rammig, A., Smith, B., Thomas, R., Thonicke, K., Walker, A. P., Yang, X., and Zaehle, S.: Model-data synthesis for the next generation of forest free-air CO2 enrichment (FACE) experiments, New Phytol., 209, 17–28, https://doi.org/10.1111/nph.13593, 2016.
Norros, V., Penttilä, R., Suominen, M., and Ovaskainen, O.: Dispersal may limit the occurrence of specialist wood decay fungi already at small spatial scales, Oikos, 121, 961–974, https://doi.org/10.1111/j.1600-0706.2012.20052.x, 2012.
Norros, V., Rannik, Ü., Hussein, T., Petäjä, T., Vesala, T., and Ovaskainen, O.: Do small spores disperse further than large spores?, Ecology, 95, 1612–1621, https://doi.org/10.1890/13-0877.1, 2014.
O'Connor, D. J., Sadyś, M., Skjøth, C. A., Healy, D. A., Kennedy, R., and Sodeau, J. R.: Atmospheric concentrations of Alternaria, Cladosporium, Ganoderma and Didymella spores monitored in Cork (Ireland) and Worcester (England) during the summer of 2010, Aerobiologia, 30, 397–411, https://doi.org/10.1007/s10453-014-9337-3, 2014.
Oneto, D. L., Golan, J., Mazzino, A., Pringle, A., and Seminara, A.: Timing of fungal spore release dictates survival during atmospheric transport, P. Natl. Acad. Sci. USA, 117, 5134–5143, https://doi.org/10.1073/pnas.1913752117, 2020.
Page, C. N.: The Ferns of Britain and Ireland, 2nd Edn., CUP, 540 pp., 1997.
Petters, M. D. and Kreidenweis, S. M.: A single parameter representation of hygroscopic growth and cloud condensation nucleus activity, Atmos. Chem. Phys., 7, 1961–1971, https://doi.org/10.5194/acp-7-1961-2007, 2007.
Pope, F. D.: Pollen grains are efficient cloud condensation nuclei, Environ. Res. Lett., 5, 044015, https://doi.org/10.1088/1748-9326/5/4/044015, 2010.
Pöschl, U.: Atmospheric Aerosols: Composition, Transformation, Climate and Health Effects, Angew. Chem. Int. Edit., 44, 7520–7540, https://doi.org/10.1002/anie.200501122, 2005.
Raupach, M. R., Finnigan, J. J., and Brunet, Y.: Coherent Eddies and Turbulence in Vegetation Canopies: The Mixing-Layer Analogy, Bound.-Lay Meteorol., 25th Anniversary Volume, 351–382, https://doi.org/10.1007/978-94-017-0944-6_15, 1996.
R Core Team: R: A Language and Environment for Statistical Computing, R Foundation for Statistical Computing, Vienna, Austria, https://www.R-project.org (last access: 27 April 2022), 2020.
Reinmuth-Selzle, K., Kampf, C. J., Lucas, K., Lang-Yona, N., Fröhlich-Nowoisky, J., Shiraiwa, M., Lakey, P. S. J., Lai, S., Liu, F., Kunert, A. T., Ziegler, K., Shen, F., Sgarbanti, R., Weber, B., Bellinghausen, I., Saloga, J., Weller, M. G., Duschl, A., Schuppan, D., and Pöschl, U.: Air Pollution and Climate Change Effects on Allergies in the Anthropocene: Abundance, Interaction, and Modification of Allergens and Adjuvants, Environ. Sci. Technol., 51, 4119–4141, https://doi.org/10.1021/acs.est.6b04908, 2017.
Reponen, T., Willeke, K., Ulevicius, V., Reponen, A., and Grinshpun, S. A.: Effect of relative humidity on the aerodynamic diameter and respiratory deposition of fungal spores, Atmos. Environ., 30, 3967–3974, https://doi.org/10.1016/1352-2310(96)00128-8, 1996.
Sadyś, M., Skjøth, C. A., and Kennedy, R.: Back-trajectories show export of airborne fungal spores (Ganoderma sp.) from forests to agricultural and urban areas in England, Atmos. Environ., 84, 88–99, https://doi.org/10.1016/j.atmosenv.2013.11.015, 2014.
Sadyś, M., Adams-Groom, B., Herbert, R. J., and Kennedy, R.: Comparisons of fungal spore distributions using air sampling at Worcester, England (2006–2010), Aerobiologia, 32, 619–634, https://doi.org/10.1007/s10453-016-9436-4, 2016a.
Sadyś, M., Kennedy, R., and West, J. S.: Potential impact of climate change on fungal distributions: analysis of 2 years of contrasting weather in the UK, Aerobiologia, 32, 127–137, https://doi.org/10.1007/s10453-015-9402-6, 2016b.
Sesartic, A. and Dallafior, T. N.: Global fungal spore emissions, review and synthesis of literature data, Biogeosciences, 8, 1181–1192, https://doi.org/10.5194/bg-8-1181-2011, 2011.
Sousan, S., Koehler, K., Hallett, L., and Peters, T. M.: Evaluation of the Alphasense optical particle counter (OPC-N2) and the Grimm portable aerosol spectrometer (PAS-1.108), Aerosol. Sci. Tech., 50, 1352–1365, https://doi.org/10.1080/02786826.2016.1232859, 2016.
Stephens, R. B. and Rowe, R. J.: The underappreciated role of rodent generalists in fungal spore dispersal networks, Ecology, 101, e02972, https://doi.org/10.1002/ecy.2972, 2020.
Su, H. B., Shaw, R. H., Pawu, K. T., Moeng, C. H., and Sullivan, P. P.: Turbulent statistics of neutrally stratified flow within and above a sparse forest from large-eddy simulation and field observations, Bound.-Lay. Meteorol., 88, 363–397, https://doi.org/10.1023/A:1001108411184, 1998.
Tesmer, J. and Schnittler, M.: Sedimentation velocity of myxomycete spores, Mycol. Prog., 6, 229–234, https://doi.org/10.1007/s11557-007-0539-8, 2007.
Van Norman, K., Lippert, J., Rivers-Pankratz, D., Holmes, R., and Mayrsohn, C.: Sporocarp Survey Protocol for Macrofungi, version 1.0, Portland, OR, Interagency Special Status/Sensitive Species Program, U.S. Department of Interior, Bureau of Land Management, Oregon/Washington and U.S. Department of Agriculture, Forest Service, Region 6, 16 pp., 2008.
Wickham, H.: ggplot2: Elegant Graphics for Data Analysis, 2016.
Wickham, H., Averick, M., Bryan, J., Chang, W., McGowan, L. D., François, R., Grolemund, G., Hayes, A., Henry, L., Hester, J., Kuhn, M., Pedersen, T. L., Miller, E., Bache, S. M., Müller, K., Ooms, J., Robinson, D., Seidel, D. P., Spinu, V., Takahashi, K., Vaughan, D., Wilke, C., Woo, K., and Yutani, H.: Welcome to the Tidyverse, J. Open. Source Softw., 4, 1686, https://doi.org/10.21105/joss.01686, 2019.
Welcome to the Tidyverse: https://tidyverse.tidyverse.org/articles/paper.html, last access: 11 May 2021.
Wolf, J., Johnson, N. C., Rowland, D. L., and Reich, P. B.: Elevated CO2 and plant species richness impact arbuscular mycorrhizal fungal spore communities, New Phytol., 157, 579–588, 2003.
Wolf, J., O'Neill, N. R., Rogers, C. A., Muilenberg, M. L., and Ziska, L. H.: Elevated atmospheric carbon dioxide concentrations amplify Alternaria alternate sporulation and total antigen production, Environ. Health Persp., 118, 1223–1228, https://doi.org/10.1289/ehp.0901867, 2010.
Ziegler, C., Kulawska, A., Kourmouli, A., Hamilton, L., Shi, Z., MacKenzie, A. R., Dyson, R. J., and Johnston, I. G.: Quantification and uncertainty of root growth stimulation by elevated CO2 in mature temperate deciduous forest, BioRxiv [preprint], https://doi.org/10.1101/2021.04.15.440027, 2021.