the Creative Commons Attribution 4.0 License.
the Creative Commons Attribution 4.0 License.
 | 31 May 2022
Sources of nitrous oxide and the fate of mineral nitrogen in subarctic permafrost peat soils
Maija E. Marushchak
Tobias Rütting
Elizabeth M. Baggs
Tibisay Pérez
Alexander Novakovskiy
Tatiana Trubnikova
Dmitry Kaverin
Pertti J. Martikainen
Christina Biasi
Nitrous oxide (N2O) emissions from permafrost-affected terrestrial ecosystems have received little attention, largely because they have been thought to be negligible. Recent studies, however, have shown that there are habitats in the subarctic tundra emitting N2O at high rates, such as bare peat (BP) surfaces on permafrost peatlands. Nevertheless, the processes behind N2O production in these high-emission habitats are poorly understood. In this study, we established an in situ 15N-labeling experiment with two main objectives: (1) to partition the microbial sources of N2O emitted from BP surfaces on permafrost peatlands and (2) to study the fate of ammonium and nitrate in these soils and in adjacent vegetated peat (VP) surfaces showing low N2O emissions. Our results confirm the hypothesis that denitrification is mostly responsible for the high N2O emissions from BP. During the study period, denitrification contributed ∼ 79 % of the total N2O emissions from BP, whereas the contribution from ammonia oxidation was less (about 19 %). Both gross N mineralization and gross nitrification rates were higher in BP than in VP, with high ratios and a low water content likely limiting N transformation processes and, consequently, N2O production in the latter soil type. Our results show that multiple factors contribute to high N2O production in BP surfaces on permafrost peatlands, with the most important factors being the absence of plants, an intermediate to high water content and a low ratio, which all affect the mineral-N availability for soil microbes, including those producing N2O. The process understanding produced here is important for the development of process models that can be used to evaluate future permafrost–N feedbacks to the climate system.
- Article
(1106 KB) - Full-text XML
-
Supplement
(806 KB) - BibTeX
- EndNote


The arctic and subarctic regions store more than 50 % of the Earth's soil carbon (C) pool (1330–1580 Pg) (Schuur et al., 2015). A possible increase in the release of the greenhouse gases carbon dioxide (CO2) and methane (CH4) from these carbon stocks to the atmosphere as a result of increased decomposition processes (aerobic and anaerobic) under a changing climate has been intensively studied (Schuur et al., 2009, 2015; Schädel et al., 2016). However, arctic soils not only store a huge amount of C, they also have a large nitrogen (N) reservoir (conservative estimate for 0–3 m of 67 Pg N) (Harden et al., 2012), although little is known about the potential of this N to be released as the strong greenhouse gas nitrous oxide (N2O). Globally, soils are important N2O sources responsible for 60 % of emissions worldwide (Ciais et al., 2013). Traditionally, it has been suggested that N2O emissions from arctic soils are negligible because of the low concentrations of mineral N in soils underlain by permafrost (Ma et al., 2007; Takakai et al., 2008; Siciliano et al., 2009; Goldberg et al., 2010). However, this generalization has been challenged by the identification of hotspots of N2O on raised permafrost peatlands (Repo et al., 2009; Marushchak et al., 2011) and by measurements of high N2O concentrations (Abbott and Jones, 2015) and high N2O emissions (Marushchak et al., 2021) in mineral tundra soils following permafrost thaw. A field warming experiment in a permafrost peatland further showed that soil warming (average increase of 0.95 ∘C) promotes N2O release not just from bare peat (BP) hotspots but also from adjacent vegetated surfaces that do not emit N2O under the present climate (Voigt et al., 2017a). In addition, results from mesocosms and soil incubation studies have shown that arctic soils have the potential for high N2O emissions after permafrost thawing (∼ 3–4 mg N2O m−2 d−1; Elberling et al., 2010; Voigt et al., 2017b). In a recent review, it was concluded that the emissions of N2O from permafrost soils could be up to 1.27 Tg N2O-N yr−1, which represents 11.6 % of total N2O emissions from natural soils (Voigt et al., 2020). Thus, N2O emissions from permafrost soils can no longer be ignored.
Even though there is increasing evidence of N2O production from permafrost soils, with potential global importance (Voigt et al., 2020), mechanisms underlying the release of this strong greenhouse gas remain largely unclear. A better understanding of N2O production from permafrost soils is needed to evaluate the role that the arctic and subarctic regions play in the global N2O budget at present and in the future. Under the present climate, N2O emissions from the bare surfaces of permafrost peatland (−0.24 to 31 mg N2O m−2 d−1) (Repo et al., 2009; Voigt et al., 2017a; Gil et al., 2017) – presently the strongest known sources of N2O from the Arctic – can achieve similar magnitudes per unit area to those from temperate and boreal agricultural soils (Maljanen et al., 2010) and tropical forests soils (Werner et al., 2007). It is thought that these hotspots have developed through frost action and wind erosion (Kaverin et al., 2016). The absence of vegetation as well as the low ratio and intermediate soil water content (∼ 60 % water-filled pore space; WFPS) have been suggested to be the key environmental factors associated with the high N2O emissions from these BP surfaces (Repo et al., 2009). Generally, the main processes responsible for N2O production in soils are nitrification (ammonia oxidation) and the nitrate-reducing pathway of denitrification, which tend to predominate under suboxic and anaerobic conditions, respectively (Baggs, 2011). In unfertilized, natural ecosystems with low atmospheric deposition of N, like the Arctic, nitrate produced during nitrification is the main N source for denitrification. Therefore, these two processes are tightly coupled in arctic soils (Siljanen et al., 2019). Low ratios of the bulk soil in these systems (23±2; Repo et al., 2009) may favor net N mineralization and nitrification, and an intermediate soil water status may allow both aerobic (including nitrification) and anaerobic (including denitrification) processes to take place simultaneously. The lack of vegetation and, consequently, N uptake by plants means better availability of mineral N for soil microbes. All in all, the BP environment can be considered conducive to microbial N2O production in both nitrification and denitrification.
Although we have some understanding of the factors controlling N turnover and N availability for microbes in the permafrost peat soils, the role of various microbial processes in N2O production in these soils is still limited. It is important to get more information on these processes in order to be able to better predict the responses of N2O emissions from arctic ecosystems to climate-induced changes. For example, an increase in the soil water content, as predicted for regions such as Alaska (Douglas et al., 2020), will affect the dominant microbial pathways. Nitrification and denitrification are controlled differently by environmental factors, most importantly soil moisture. Compared with nitrification, denitrification usually releases more N2O under wetter, more anaerobic conditions and has been suggested as the key process for N2O production in BP surfaces (Repo et al., 2009). This is supported by results from laboratory incubations where nitrate addition stimulated N2O production under anoxic conditions (Palmer et al., 2011). On the other hand, isotope analysis of N2O (15N natural abundance and site preference values) from these hotspots in tundra in a dry year with low net emissions suggested that ammonia-oxidizing nitrifiers could play a major role under dry conditions (Gil et al., 2017). However, the limitations of such natural-abundance approaches are well documented (Decock and Six, 2013; Toyoda et al., 2017; Gil et al., 2017) and include overlapping source signals and changing isotope fingerprints under variable environmental conditions. With respect to overcoming these limitations, 15N-enrichment approaches provide the ability to quantify and distinguish microbial sources of N2O in situ, particularly ammonia oxidation and denitrification (Stevens et al., 1997; Baggs, 2011). This approach also enables the tracing of 15N through the plant–soil system, providing valuable information on N processes including gross turnover rates and N uptake by plants (Gardner and Drinkwater, 2009; Harrison et al., 2012; Wild et al., 2015). In particular, data on gross N turnover rates, including gross ammonification and nitrification, are still rare from the Arctic (Ramm et al., 2022).
In this study, we conducted an in situ 15N-enrichment experiment using a single- and double-15N-labeled ammonium nitrate method (Baggs et al., 2003) with a virtual core injection technique (Rütting et al., 2011). Our objectives were, first, to partition between denitrification and nitrification as sources of N2O emitted from the N2O hotspots (bare peat) located on permafrost peatlands and, second, to trace the fate of applied 15N in BP and adjacent vegetated peat (VP). VP has shown low N2O emissions in previous studies. Thus, we hypothesized the following:
-
Denitrification is the predominant pathway of N2O production in the BP, when emissions are high under typical climatic conditions.
-
A major proportion of the added 15N is released as nitrogenous gases from BP, but microbial immobilization is the most important sink of N in VP, indicating that competition for N is a key regulator of N2O in these peatlands.
-
In addition to the absence of vegetation, lower ratios and a higher water content support higher N turnover rates in BP (compared with VP) and are important factors leading to higher N2O fluxes in these soils.
2.1 Study site and soil characteristics
The experiment was carried out at the Seida study site which is located in subarctic northwestern Russia (67∘03′ N, 62∘57′ E) in the discontinuous permafrost zone. Some common geographical features occurring in the discontinuous and sporadic permafrost zone are the so-called palsas and peat plateaus (Seppälä, 2011; Sannel and Kuhry, 2011; Borge et al., 2017). They are formed by permafrost aggradation, which lifts the peat surface, leading to drier conditions than the surrounding unfrozen peatland surface (Seppälä, 2003). As a result of wind abrasion, parts of the palsas and peat plateaus lack vegetation (Seppälä, 2003). The unvegetated bare peat (BP) surfaces that were studies here are located on a large peat plateau characteristic of the Seida area, are round in shape with an average diameter of 20 m, and have only sporadic bryophytes and lichens (Kaverin et al., 2016). The growing season in the study region lasts approximately 3 months, from mid–late June to early–mid September. The mean annual precipitation is 505 mm, and the mean annual air temperature is −5.8 ∘C. The warmest month is usually July, with a mean air temperature of 12.5 ∘C, followed by August, with a mean air temperature of 9.4 ∘C (30-year averages of data from the weather station at Vorkuta; 67∘48′ N, 64∘01′ E; Komi Republican Center for Hydrometeorological and Environmental Monitoring). The mean precipitation sum for the period from July to September is 121 mm. Additional information on the site characteristics and climatic conditions can be found in Repo et al. (2009), Marushchak et al. (2013) and Biasi et al. (2014). In 2010, when our study was undertaken, the warmest month was July, with a mean air temperature of 12.9 ∘C, which was similar to the long-term mean, whereas August was warmer than the long-term mean. The maximum daily air temperature (22 ∘C) was registered in August. The cumulative precipitation for the period from July to September was close to the long-term average (113 mm). Most of the rainfall took place during mid-August, which resulted in a high soil water content at this time.
BP surfaces consist mainly of decomposed fen peat, whereas VP surfaces have typical bog vegetation including vascular plants (e.g., Ledum decumbens, Rubus chamaemorus and Vaccinium uliginosum), mosses (e.g., Sphagnum and Dicranum sp.) and lichens (e.g., Cladina sp.) (Table 1).
Table 1Soil characteristics of the topsoil (0–10 cm) of bare peat (BP) and vegetated peat (VP) soil.
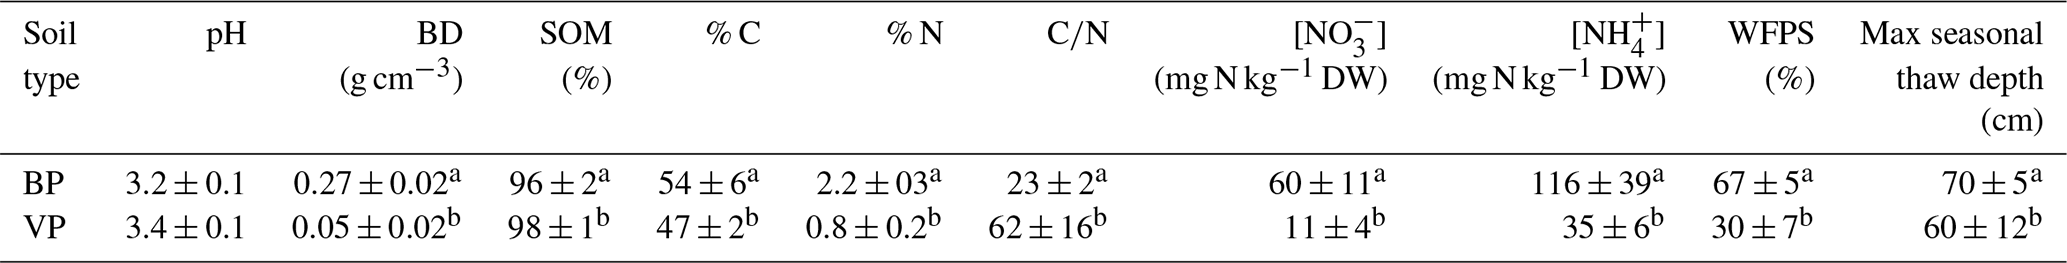
Values are mean ± 1 SE for the sampling period during the growing seasons in 2007, 2008 (Marushchak et al., 2011) and 2010 (this study). Different letters indicate statistically significant differences between surface types (p<0.005). n=3 for each soil type. The abbreviations used in the table are as follows: BD – bulk density, SOM– soil organic matter, DW – dry weight and WFPS – water-filled pore space.
2.2 15N-enrichment experiment
2.2.1 Experimental design
The study took place during the growing season in 2010, between 21 July and 13 August (24 d). The 15N-labeling experiment was conducted in situ on BP and adjacent VP in three replicates per treatment type (n=3). The soil surfaces were selected based on their contrasting N2O emission rates reported in previous field campaigns at the site (2007–2008; Repo et al., 2009; Marushchak et al., 2011). BP surfaces are known to act as N2O hotspots in contrast to VP surfaces where the N2O fluxes are low.
Following the approach previously applied by Baggs et al. (2003), the experiment comprised three different 15N-labeling treatments with either single or double 15N labeling: 14NH4 15NO3 (Treatment 1 – T1), 15NH4 14NO3 (Treatment 2 – T2) and 15NH4 15NO3 (Treatment 3 – T3). Each treatment was applied at 98 at. % 15N. Briefly, we used T1 with an 15N-NO label to calculate gross nitrification and to quantify N2O emissions produced by nitrate reduction in denitrification. Nitrous oxide emissions from nitrification were estimated using the difference in 15N-N2O flux between T3 (15NH4 15NO3) and T1 (14NH4 15NO3). T2 (15NH4 14NO3) was used to calculate gross mineralization and to account for 15N-N2O fluxes from 15N-NH after it had been first nitrified to 15N-NO. The approach is based on the assumptions of negligible nitrate ammonification (DNRA) and negligible remineralization of 15NH4 within the first 72 h (Braun et al., 2018). The application rate of the labeling solutions was adjusted to soil inorganic-N concentrations in 2007–2008 using previously determined bulk densities, and it corresponded to approximately 50 % of the native extractable N pools in the soils during the growing season (Table 1). For VP, the labeling solutions were applied at a rate of 5 mg NO-N kg−1 dry soil (1 µg N cm−2) and 17 mg NH-N kg−1 dry soil (2 µg N cm−2), whereas the application rates were 30 mg NO-N kg−1 dry soil (10 µg N cm−2) and 58 NH-N kg−1 dry soil (20 µg N cm−2) for BP. The total quantity of mineral N added never exceeded the maximum NO or NH content found in the native, unamended soils.
The 15N solutions were added in situ to the depth of 0–6 cm, adopting the virtual core injection technique described by Rütting et al. (2011). For the 15N labeling and sampling, a 20 cm × 20 cm subplot was demarcated within each plot. Inside these subplots, a smaller area (16 cm × 16 cm) was marked with sticks, and this template was used for N addition and soil sampling. For the injection of 15N solutions, 49 syringes (1 mL) were attached to a plastic frame within the template in a regular 7×7 grid layout to release the 15N solutions from the syringes into the soil as uniformly as possible (both horizontally and vertically). As the 15N-labeled areas were to be sampled destructively for each of the seven sampling occasions, the label injection was repeated seven times in each replicate plot at randomly selected locations. The total number of injections amounted to 126 (2 surface types × 3 replicates ×3 15N treatments × 7 sampling occasions). For logistical reasons, it took 2 d (21–22 July 2010) to complete all of the 15N applications, but both VP and BP soils were always labeled at the same time for each treatment to ensure comparable results for the two soil types.
After the 15N addition, the following samples were taken at 0, 1 and 24 h and at 3, 5, 9, 15 and 24 d: surface gas flux samples for N2O concentration and 15N-N2O isotopic analyses as well as soil samples for mineral N (NH and NO, total N (TN) and 15N enrichment in these three N pools. In addition, we collected all aboveground plants as well as roots from VP surfaces on the same days. All samples were analyzed for N concentrations and 15N enrichments as described below.
2.2.2 Gas sampling and analysis
Emissions of 15N-N2O were determined using the static-chamber technique (Heikkinen et al., 2002). A circular plastic collar was inserted to the soil 1 h before the gas sampling and, for the measurement, a small polyvinyl chloride (PVC) chamber (diameter: 10 cm; volume: 920 cm3) was attached to the collar. The chamber had an inlet (polyamide nylon tube) equipped with a three-way stopcock (Steritex® 3W, CODAN Ltd, UK) for gas sampling. Gas samples were taken for analyses of N2O concentrations and 15N-N2O content twice: once before closing the chamber (ambient conditions, t=0) just above the soil surface and a second time 40 min after closure from chamber headspace. The N2O fluxes were calculated from the concentration difference between the two sampling points. The two-point measurement method was chosen because of the small chamber volume which prevented taking several samples during the measurement. This methodology was compared against the static-chamber technique with four to five sampling points within 40 min used at the site during this experiment and previous sampling campaigns (Repo et al., 2009; Marushchak et al., 2011; Gil et al., 2017). The test showed that the concentration increase during the 40 min measurement time was linear and that the two methods give essentially similar results. Samples were taken using a polypropylene syringe with a Luer lock tip (Terumo®, Tokyo, Japan) fitted with a three-way stopcock (as above). Temperature inside the chamber was recorded at the beginning and at the end of each closure period.
For analysis of N2O concentrations, gas samples of 20 mL were transferred into 12 mL pre-evacuated Exetainer vials equipped with butyl rubber septa (Labco Ltd, UK) on the same day as sampling. Concentrations of N2O were analyzed 1–2 months later at the University of Eastern Finland. A leakage test with a standard gas showed that leakage for N2O was negligible (≤ 3 % over the storage period). The concentration of N2O was measured with a gas chromatograph, as described in Gil et al. (2017).
Samples for 15N-N2O determination were stored in 60 mL gas-tight glass flasks (Supelco, UK), and their ratios were determined at the Stable Isotope Facility at the University of California, Davis, using a Delta V Plus isotope ratio mass spectrometer (IRMS) operated in continuous-flow mode (Thermo Scientific, Bremen, Germany) coupled with an online pre-concentrator and a GasBench (Thermo Finnigan, Bremen, Germany). The 15N-N2O flux rates were calculated from linear regression slope fitted to the atom percent excess of 15N of the samples against time.
2.2.3 Soil sampling and analyses
Immediately after gas sampling, soil samples were taken by pushing a PVC tube (length: 15 cm; diameter: 5 cm; volume: 70 cm3) into the soil (0–10 cm) at the center of the labeling subplot area. Soil samples were sieved, homogenized and extracted with KCl (2M) on the day of collection, and extracts were preserved frozen for later analysis of concentrations of NH-N, NO-N and their 15N enrichments. A subsample of the soil was dried at 60 ∘C and preserved for later analysis of total N and its 15N enrichment. The concentrations of NH and NO in the extracts were measured by spectrophotometry (Wallac data analyzer) using a microtiter plate format, following the protocol of Fawcett and Scott (1960) for NH (630 nm) and the Griess method for NO (544 nm) (Miranda et al., 2001). The 15N enrichment in mineral N was determined by the micro-diffusion method (Herman et al., 1995) and analyzed on an elemental analyzer coupled to an isotope ratio mass spectrometer (EA-IRMS), which included a Thermo Finnigan DELTAplusXP IRMS, a FlashEA 1112 series elemental analyzer and a ConFlo III open-split interface (Thermo Finnigan, Bremen, Germany) at the University of Eastern Finland. The 15N data were expressed as the atom percent of 15N excess relative to the natural 15N abundance of NO and NH in the soils from the non-labeled plots. Dried bulk soil samples were also analyzed for total N and 15N concentrations using the same EA-IRMS, and the atom percent 15N excess values were calculated. The reproducibility of 10 standard runs (EA-IRMS) was typically better than 0.5 ‰ (1σ, n=10).
2.2.4 Plant sampling and analyses
The aboveground parts of plant and roots were quantitatively sampled from the labeled VP plots. Aboveground parts of plants were cut at the soil surface level and classified into higher plants (e.g., Betula nana, Ledum decumbens, Rubus chamaemorus, and Vaccinium uliginosum) and lower plants (e.g., Sphagnum and Dicranum sp.). Roots were removed by hand and rinsed with water to wash off any soil. The aboveground parts of plants and roots were then oven dried in the field laboratory, weighed and stored until further processing at the University of Eastern Finland. There, the aboveground biomass and roots were milled to fine powder (MM 301, Retsch, Haan, Germany), and the total N and 15N contents in shoot and root material were determined by the EA-IRMS system described above.
2.3 Calculations
2.3.1 Mass balance approach for estimating 15N-label recovery
To assess 15N partitioning and losses in the evaluated pools during the sampling period, we determined a mass balance which consisted of calculating the recovery of applied 15N into the different ecosystem components (plants, soil and N2O) for each sampling point. We used area-based N pool size estimates and changes in the 15N content of the individual components following 15N addition. All calculations were done using atom percent excess values, which were obtained by subtracting the natural abundance of each component (plants, including higher and lower plants; soil; and gas flux), measured before the labeling started (1σ, n=12; approx. 0.3663 at. % 15N for all), from the atom percent 15N values measured after labeling.
The mass of 15N recovered in each ecosystem component was determined as follows:
- i.
We calculated the 15N mass recovered per soil area (µg 15N cm−2) for each sampling time (e.g., at 0, 1 and 24 h and at 3, 5, 9, 15 and 24 d) in each component (plants, soil or N2O – cumulative fluxes of 15N-N2O) by multiplying the total pool size by the atom percent excess.
- ii.
Total 15N recovery at a given time was calculated as the sum of the total mass of 15N recovered in all of the components. The calculation was somewhat different for BP (Eq. 1) and VP (Eq. 2). As VP had negligible N2O emissions, this component was ignored in the final mass balance calculations, and as there were no plants on BP, this component was excluded in calculation of the total 15N recovery there.
Thus, for BP,
For VP,
where
The relative 15N recovery in each component (Eq. 4) was calculated by dividing the 15N mass recovered in each component by the total label applied:
Here, we report total 15N recovery for each surface type (BP and VP) as well as the relative 15N recovery for each ecosystem component (in BP – soil and N2O flux; in VP – plants and soil). Only data from T1 (14NH4 15NO3) and T2 (15NH4 14NO3) were used for the mass balance calculation (T3 was the sum of T1 and T2; data not shown).
2.3.2 Source partitioning of N2O emitted from BP surfaces
To quantify the relative contribution of nitrification and denitrification to the overall N2O fluxes from BP, we used the single- and double-15N-labeled ammonium nitrate method, previously introduced by Baggs et al. (2003). The calculation was made individually for each plot (n=3) and sampling point (n=7). We report the averages by day after the labeling and for the entire sampling period of 24 d. The contribution of different microbial sources to the total N2O flux was calculated as outlined in the following.
The 15N-N2O emitted from T1 plots (labeled with 14NH4 15NO3) was assumed to represent the N2O emission derived from denitrification (D) (Eq. 5):
For the N2O flux derived from denitrification of 15NH after it was nitrified to 15NO (N2OD−T2), we used data from T1 (labeled with 14NH4 15NO3) and T2 plots (labeled with 15NH4 14NO3). We assumed that the ratio of 15N-N2O to the enrichment of the substrate pool (15NO) was similar in T1 and T2, and we calculated N2OD−T2 based on a direct relationship (Eq. 6):
The N2O flux derived from nitrification was then calculated as the difference between the 15N-N2O emitted from the double-labeled T3 plots (labeled with 15NH4 15NO3; denitrification and nitrification) and T1 plots (labeled with 14NH4 15NO3; only denitrification) minus the N2O flux derived from 15NH after it was nitrified to 15NO (Eq. 7):
The total 15N-N2O emission was calculated as the sum of N2O derived from denitrification (N2OD and N2ODD−T2) and N2O derived from nitrification (N2ON), which was used to calculate the percent contribution of each process. The assumptions behind this methodology were as follows: (1) there was no significant dissimilatory NO reduction to NH (DNRA; or nitrate ammonification) nor remineralization as 15N-NH from microbial biomass; and (2) when using highly enriched isotopic tracers, the isotopic composition of the N2O evolved is not significantly affected by fractionation.
2.3.3 Gross N turnover rates
The experimental setup allowed us also to calculate gross mineralization, gross nitrification rates, and N consumption for VP and BP with the isotope pool dilution method (Kirkham and Bartholomew, 1954). We applied the pool dilution method in situ, coupled with our virtual core technique and following the protocol suggested by Rütting et al. (2011).
The gross N transformation rates were calculated from data from T1 (15N-NO; nitrification) and T2 (15N-NH; ammonification) between time points 24 and 72 h (3 d) after labeling. This time period was selected for the following three reasons. First, gross nitrification rates for BP were constant during this period (Fig. S3 in the Supplement), and constant process rates are a prerequisite for estimating gross N transformation rates by Kirkham and Bartholomew (1954). Second, the changes in the 15N atom percent excess of NO from day 5 (120 h) in BP surfaces suggest quick cycles of abiotic fixation and release of NO (Figs. 3, S4); therefore, a shorter time period for the calculations is recommended to minimize errors due recycling of the label by assimilation to microbial biomass and remineralization (Braun et al., 2018). Finally, the first time point of measurement (between 1 h and 1 d after label application) could not be included in the calculations, as that often resulted in negative gross N transformation, most likely because the label was not yet evenly distributed in the soil.
Equations (8) and (9) of Kirkham and Bartholomew (1954, 1955) were used for the estimation of the gross mineralization/nitrification rate (m) and the gross consumption rate (c):
Here, M0 = initial 14+15N pool, N pool at time 1, Ho = initial 15Nexcess pool, H1 = 15Nexcess pool at time 1 and t = time. All values are in micrograms of nitrogen per gram of dry soil.
The methodology of Kirkham and Bartholomew (1954) relies on the following assumptions: (1) mineralization and immobilization rates remain constant during the interval between successive measurements, (2) the ratio in the efflux is proportional to that of the labeled pool, and (3) immobilized labeled N is not remobilized during the experimental period (as mentioned above).
2.3.4 Water-filled pore space (WFPS)
Soil water-filled pore space (WFPS) in the topsoil was calculated using Eq. (11). For this, soil moisture sensor data (in mV) measured with a ML3 ThetaProbe (Delta-T Devices, Cambridge, UK) was converted to volumetric water content (θv), applying a sensor calibration as instructed by the manufacturer (see Gil et al., 2017, their supplementary material). Bulk density (BD) was measured in the field from volumetric soil samples. Particle density (PD) was estimated from soil organic matter content (SOM), as previously described (Marushchak et al., 2011). The total porosity (TP) was calculated using Eq. (10).
2.4 Statistical analyses
Data were first tested for a normal distribution using the normality test available in the SigmaPlot software (Systat Software, San Jose, CA). As most of the data were not normally distributed, a Kruskal–Wallis test was used to determine the significance of the experimental factors (surface type, 15N treatment, soil properties and air temperature) on N2O emissions. The Kruskal–Wallis test was followed by a pairwise Mann–Whitney significant difference test in the 15N recovery between treatments (15N-NO and 15N-NH) in each component (soil, plants and N2O) and among N transformation rates between soil surface types. To explore the role of soil characteristics, the mineral-N content and the N transformation rates as drivers of in situ N2O fluxes, we used a Spearman correlation analysis (IBM SPSS statistics software, version 23.0, and JMP® Pro, version 14, SAS Institute).
3.1 Physicochemical characteristics of the soils
Physicochemical characteristics of BP and VP surfaces are summarized in Table 1. BP surfaces had a higher bulk density than VP surfaces as well as a particularly higher N content, resulting in much lower ratios in BP compared with VP. Both soils had a similar low pH value (mean of 3.4±0.3). The water content was highly variable but, on average, higher in BP, with WFPS values ranging from 42 % to 81 % (mean of 67 ±5 %). In VP surfaces, the WFPS values ranged from 10 % to 57 %, with a mean of 30 ± 7 %. In BP, the nitrate and ammonium contents (60 ± 11 mg N kg−1 dry soil and 116 ± 39 mg N kg−1 dry soil, respectively) were higher than in VP (11 ± 4 mg N kg−1 dry soil and 35 ± 6 mg N kg−1 dry soil, respectively) (all values are mean ± SE).
3.2 N2O emissions
Total N2O and 15N-N2O fluxes followed approximately similar patterns across all BP plots, with the highest N2O fluxes measured between day of the year (DOY) 210 and 215 (between 3 and 9 d after 15N application) (Figs. 1, 3c). This peak in N2O fluxes was observed when the temperature (T) values of the air (∼ 18 ∘C) and topsoil (5 cm; 13 ∘C) were highest. BP surfaces showed net N2O release throughout the experimental period, ranging between 0.1 and 31.8 mg N2O m−2 d−1 (mean of 9.8 ± 1.8 mg N2O m−2 d−1; n=44) and were on average about 3 times higher than those from adjacent, non-labeled BP areas (mean of 3.2 ± 0.5 mg N2O m−2 d−1; n=34; Fig. 1). The highest 15N-N2O flux in BP was measured from T3 (15NH4 15NO3; p<0.05; Figs. 1, 3c). The N2O fluxes from the VP surfaces were low throughout the sampling period and showed frequent uptake of N2O (negative fluxes). The N2O fluxes in VP from the 15N-labeled plots ranged from −1.6 to 4.3 mg N2O m−2 d−1 (mean of mg N2O m−2 d−1; n=55) and were not significantly different from zero nor significantly different from adjacent non-labeled VP areas (data not shown).
N2O fluxes were positively correlated with air T (R2=0.357; p<0.005), the NH concentration in soil (R2=0.423; p<0.001) and CO2 fluxes (R2=0.399; p<0.005). 15N2O fluxes from labeled plots showed a similar positive correlation with air T to those for N2O fluxes (R2=0.391, p<0.005).
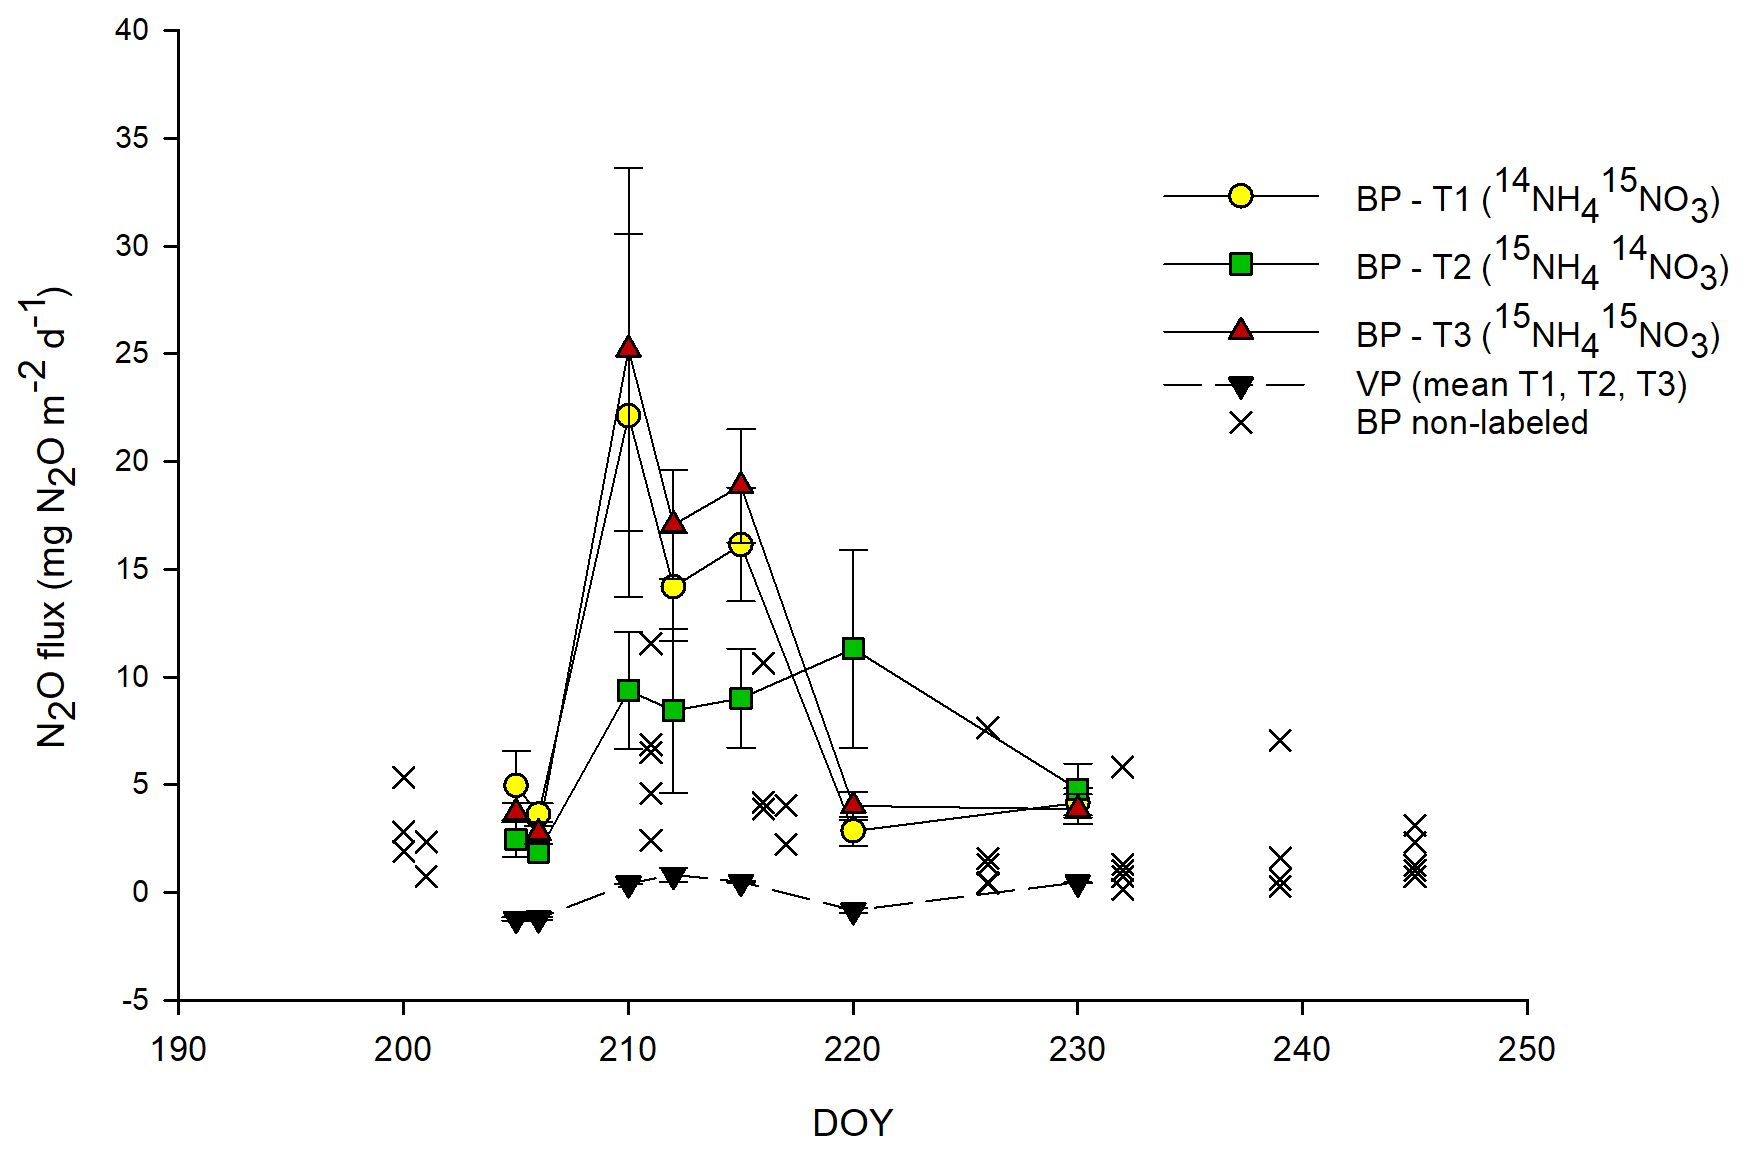
Figure 1Total N2O fluxes from labeled plots. For bare peat (BP) soils (in color), N2O fluxes are mean values ± SE (n=3) for each treatment; for vegetated peat (VP) soils (black triangles), the mean N2O flux of three plots and three treatments is shown. For comparison, N2O fluxes from BP non-labeled plots (×) located nearby are also shown (long-term experiment; permanent chambers, multiple sampling points). The abbreviations used in the figure are as follows: DOY – day of the year, T1 – Treatment 1 (14NH4 15NO3), T2 – Treatment 2 (15NH4 14NO3) and T3 – Treatment 3 (15NH4 15NO3). Error bars for VP data points are smaller than the scale.
3.3 15N recovery
The total amount of 15N recovered in the soil, vegetation and N2O were calculated for T1 (15N-NO) and T2 (15N-NH). In general, the total recovery was close to 100 % for the first 24 h after labeling and gradually decreased to 42 % for BP and 75 % for VP by the end of the 24 d experiment (Fig. S1). On day 3, total recovery of 15N was lower than expected; although we have no explanation for these findings, this low recovery did not significantly impact the main results, which were calculated from 15N in mineral-nutrient pools (more details below). Immediately after labeling (24 h), 92 % (VP) and 100 % (BP) of the applied 15N was recovered in the bulk peat soil. By the end of the experiment, most of the label across VP and BP was still found in the bulk peat soil in both treatments, as shown in the relative proportion of each component (Fig. 2).
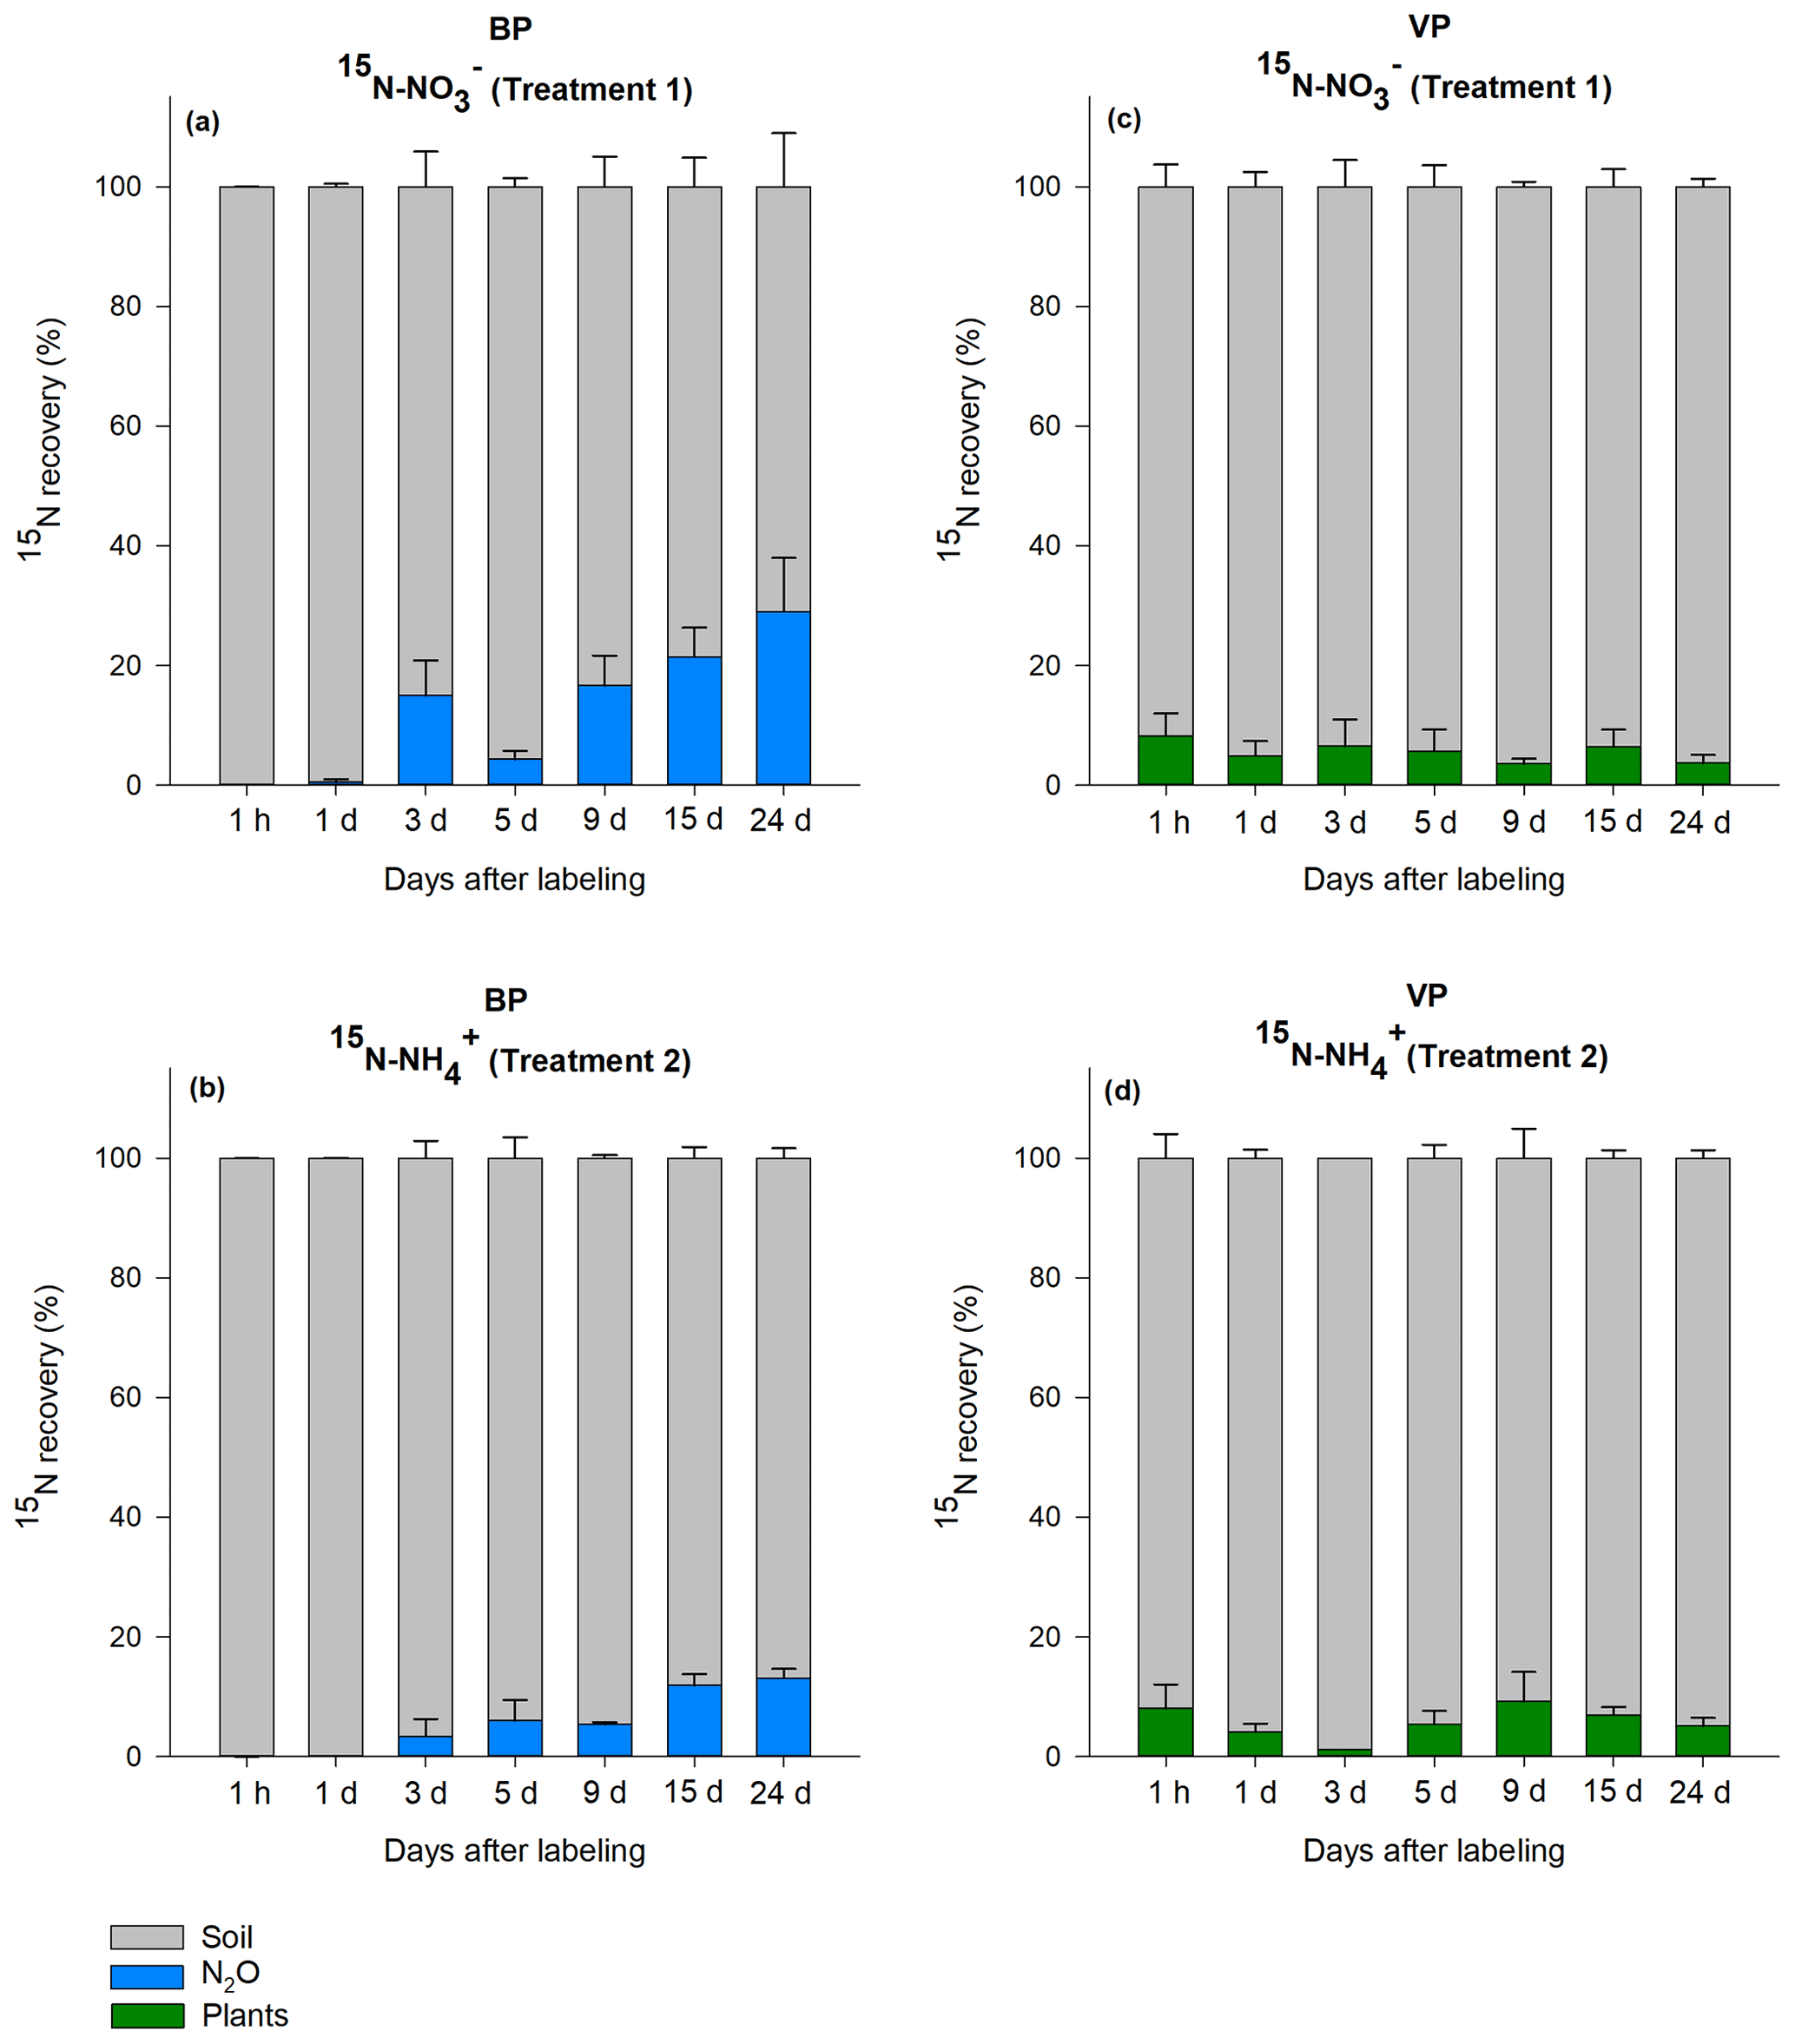
Figure 2Relative distribution of the 15N label recovered from the bare peat (BP) and vegetated peat (VP) soil for T1 (NH4 15NO3) and T2 (15NH4NO3). Data are mean values ± SE (n=3).
In VP, the proportion of 15N recovered in plants 24 d after labeling was on average 6±2 % (n=42) in both T1 (15N-NO) and T2 (15N-NH), with no significant difference between the treatments. The relative proportion of the label recovered in vegetation did not show a consistent trend over the experimental period, varying from 1 % to 9 % (Fig. 2c, d). Most of the 15N in vegetation was retained in mosses and lichens (3 % to 4 %), followed by roots of higher plants (2 %) and aboveground parts of higher plants (0.2 %) (Fig. S2).
As the N2O emissions from VP were negligible (Fig. 1), the 15N enrichment of N2O flux was not determined for this soil type. In BP, the 15N enrichment of the N2O flux was detected 3 d after labeling, with a cumulative increase with time (Fig. 2a, b). The maximum 15N recovery in the cumulative N2O flux from BP was observed toward the end of the experiment (day 24) from T1 (15N-NO) (24±9 %; n=3). On average, the label recovered in 15N-N2O was higher in the T1 (15N-NO) plots (13±2 %; n=3) than in the T2 (15N-NH) plots (6±1 %; n=3, p<0.05). The maximum relative amount of 15N recovery in N2O in BP surfaces was about 3.5 and 1.5 times higher than the maximum 15N recovery in plants in VP for T1 and T2, respectively.
3.4 15N concentrations of inorganic-N pools and N2O as well as microbial sources of N2O emitted from bare permafrost peatlands
In T1 (15N-NO), the highest 15N-NO concentration was measured 1 d after labeling (0.8±0.5 mg 15N-NO kg−1 of dry soil; Fig. 3b). In the same treatment, the 15N concentration of the NH pool was negligible during the 24 d of the experiment (∼ 0.1 mg 15N-NH kg−1 dry soil), indicating that there was no reduction of nitrate to ammonium.
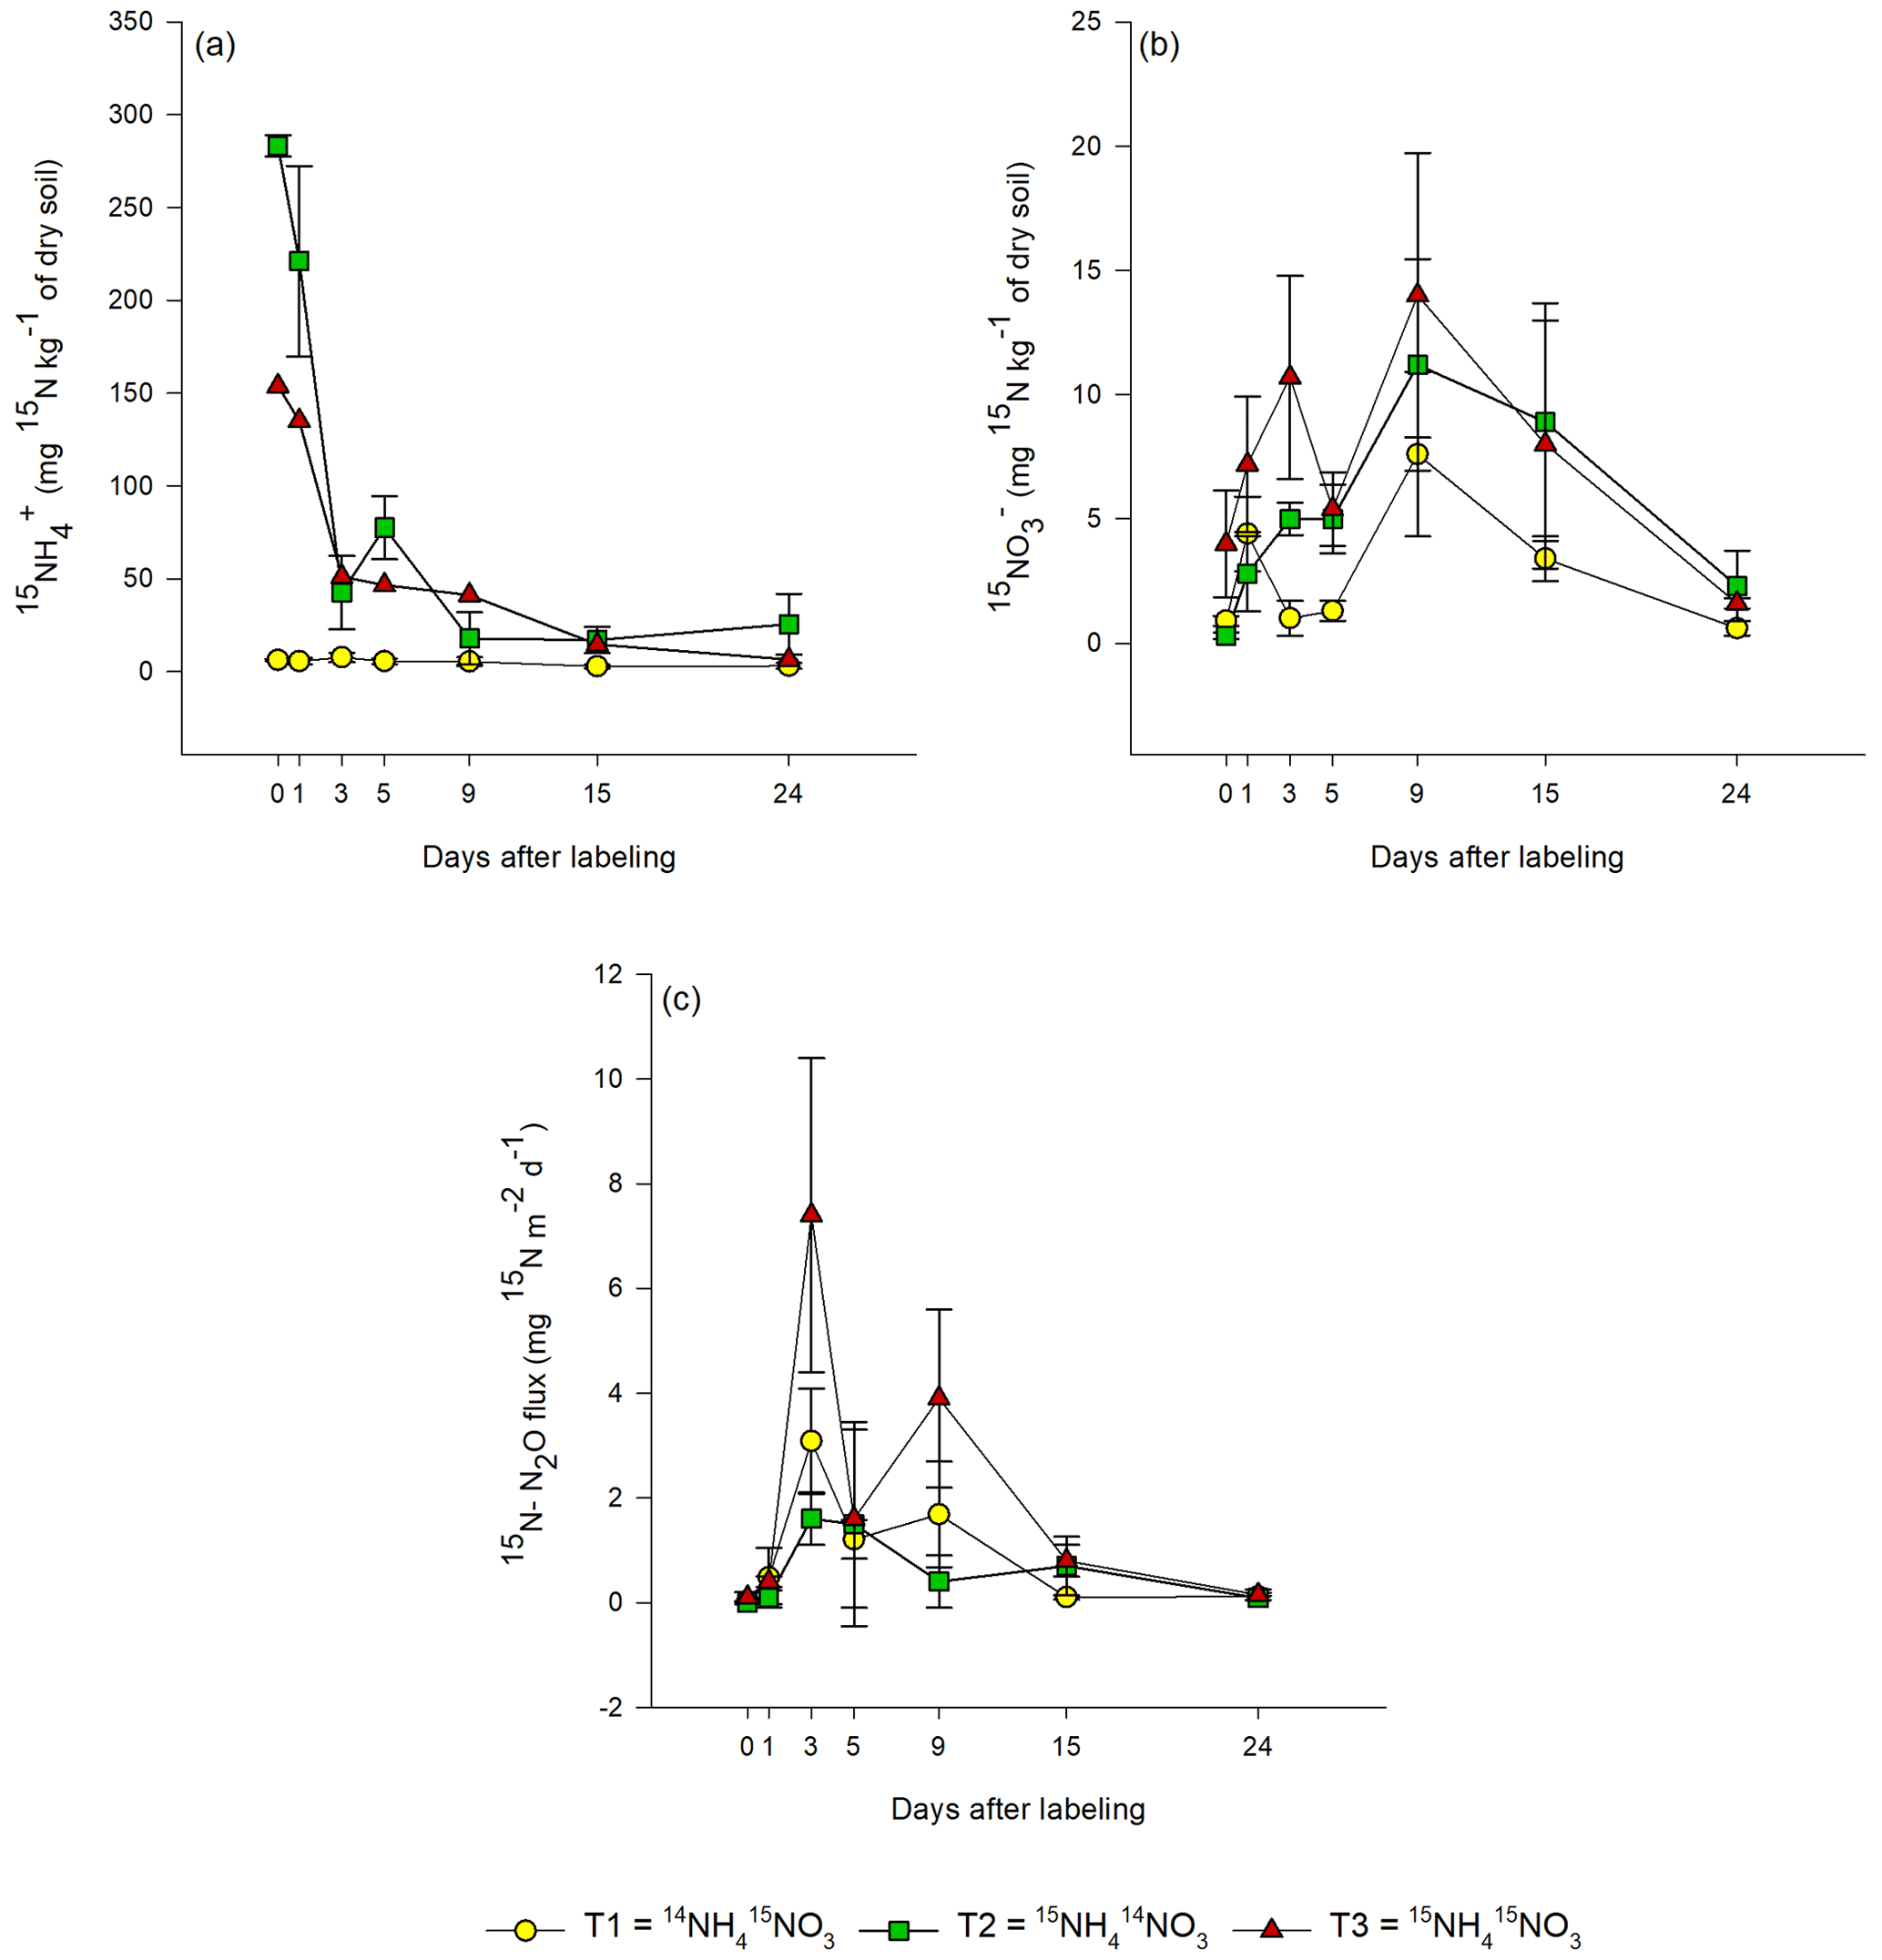
Figure 3Evolution of the 15N concentration in (a–b) extractable inorganic-N pools (NH and NO) and (c) N2O emissions from bare peat (BP) soil during the 24 d of the experiment for all labeling scenarios: T1 – Treatment 1 (14NH4 15NO3), T2 – Treatment 2 (15NH4 14NO3) and T3 – Treatment 3 (15NH4 15NO3). Day 0 denotes 1 h after labeling. Data are mean values ± 1 SE (n=3).
In T2 (15N-NH), the concentration of 15N-NH decreased exponentially over time (Fig. 3a). In the same treatment, 15NO gradually increased during the first 9 d after labeling and then decreased thereafter until the end of the experiment.
In T3 (15NH4 15NO3), the 15N-NO3 concentration of soil showed a similar trend as in T1, but the 15N concentrations were higher (Fig. 3b). The 15NH concentrations in T3 showed a similar trend as in T2, but the 15N concentrations were lower in T3. In nearly all treatments, a second smaller peak was detected in the 15N concentrations of the added substrate on day 5, 9 or 15.
The 15N concentration in N2O showed similar patterns for all treatments. In T3, the highest 15N-N2O flux (7±3 mg 15N-N2O m−2 d−1) was measured on day 3 after labeling (Fig. 3c). The same was also true for T1, but the 15N flux was lower (3±1 mg 15N-N2O m−2 d−1). In T2, the peak in 15N2O flux (1.6±0.5 mg 15N-N2O m−2 d−1) was lower and occurred later, between 3 and 5 d after the application of the label. In all treatments, a second smaller peak in 15N2O was observed, but it occurred (about 2 d) earlier in T1 and T3 than in T2. The 15N2O values correlated positively with the 15NO values from all treatments (R2=0.5453; p<0.05; Fig. S3), but no correlation between 15NH and 15N2O was observed.
The results of the source partitioning of N2O emissions from BP (Fig. 4) show that denitrification was the primary source, contributing 79 ± 6 % (n=21) of the total 15N-N2O emissions on average. In T2 (15NH4 14NO3), there was 15N in the NO pool, indicating that the applied 15N-NH was nitrified and released as 15N-N2O in a coupled nitrification–denitrification process. The contribution of ammonia oxidation to the overall N2O flux was ∼ 20 %. During the period of high N2O fluxes (3 d after 15N application), the contribution of nitrification was particularly low. However, when N2O emissions were low towards the end of the experiment, nitrification reached a maximum contribution of 55 %.
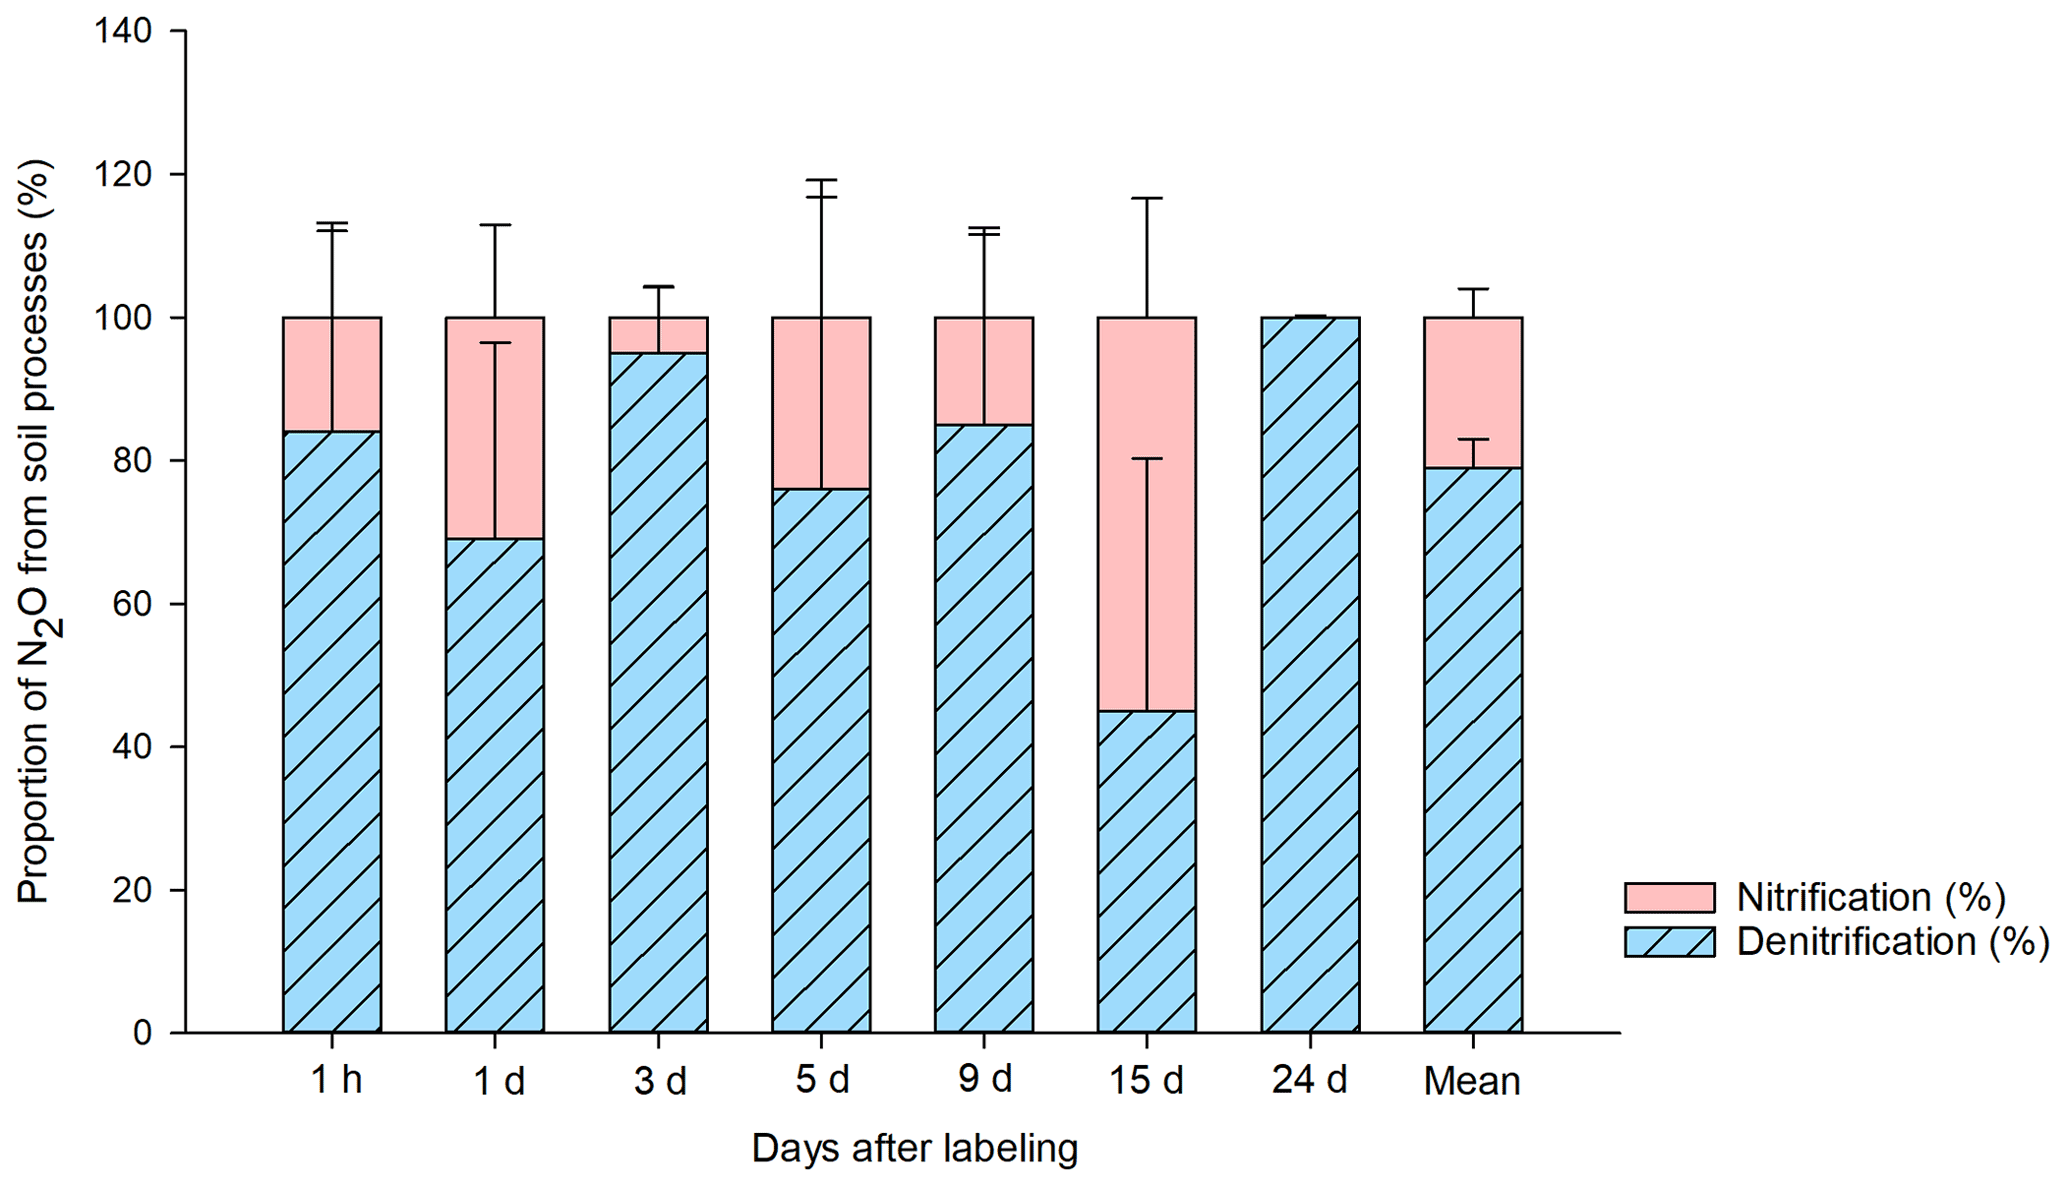
Figure 4Proportion of N2O (%) produced in the bare peat (BP) soil by denitrification and nitrification during the study period. The source partitioning was done following the previously described single- and double-15N-labeled ammonium nitrate method (Baggs et al., 2003). The source contribution is calculated from 15N2O emitted and the 15NO pool in the soil, in relation to the total amount of 15N label applied to the soil (Wrage et al., 2005). The calculation was done individually by plot (n=3) and sampling point (n=7), and the average of three plots is reported with respect to days after labeling. The mean value for the entire 24 d sampling period is also shown.
3.5 Gross N turnover rates
As described in Sect. 2.3.3, we chose to report gross mineralization and nitrification rates for the period between 24 and 72 h. During this time period, the gross mineralization and nitrification rates were constant and positive, and we could assume negligible recycling of the 15N label via microbial biomass back to the mineral-N pool (Braun et al., 2018). For method comparison purposes, we show the gross mineralization and nitrification rates calculated for different periods in Tables S1 and S2 in the Supplement. We note that variability in the results depending on the time period chosen for the calculations was higher for gross nitrification rates than for gross mineralization, rendering higher uncertainties in the nitrification data. However, the comparison between VP and BP, which is the focus here, is independent of the chosen calculation method and is valid. Further, high variability in gross N turnover rates is quite common in field labeling studies (e.g., Cookson et al., 2002; Harty et al., 2017). The high variability in our data could also simply reflect the spatial variation at the site between the subplots destructively sampled at different time points.
Gross mineralization and nitrification rates in BP were higher than in VP (p<0.01; Table 2). In BP, gross mineralization rates were 4 times higher than gross nitrification rates. Gross nitrification rates in VP surfaces were negligible. NH consumption rates were similar to gross mineralization rates for both surface types and higher in BP, while NO consumption only took place in BP surface and not in VP. See Tables S1 and S2, for gross N transformation rates calculated on a soil weight basis.
Table 2Gross N transformation rates from bare peat (BP) and vegetated peat (VP) calculated from mineral-N pools in the soil.
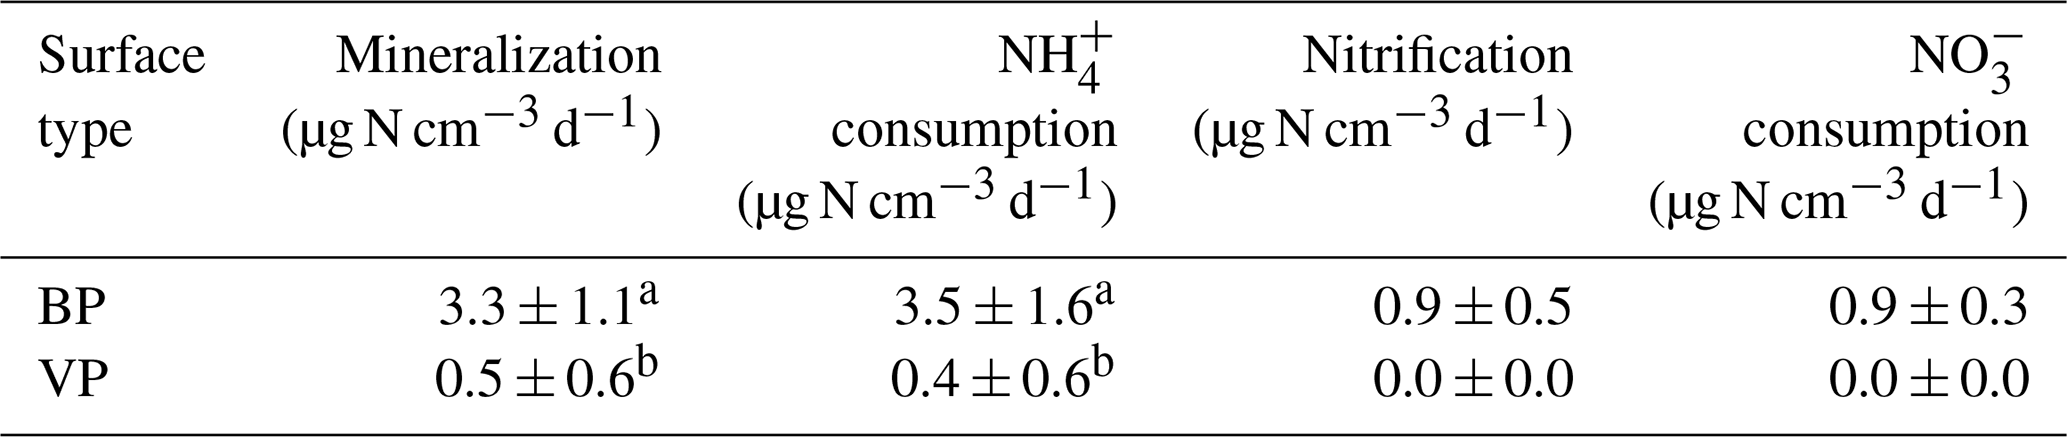
Values are mean ± 1 SE. n=3. Different letters indicate statistically significant differences between the surface types (p<0.05).
4.1 N2O flux rates from BP and VP soils
Similar to previous studies at the research site, the N2O fluxes from non-labeled reference plots were higher from BP (mean of 3.2 ± 0.5 mg N2O m−2 d−1) than from VP, where N2O fluxes were negligible throughout the sampling period (mean of mg N2O m−2 d−1). The emission rates were highest at the warmest air temperatures (R2=0.357; p<0.005). Nitrous oxide fluxes from BP are comparable to the emissions generally reported from drained boreal peatlands used for agriculture (0.1–15.1 mg N2O m−2 d−1) (Maljanen et al., 2010) and from tropical forests (0.09–2.5 mg N2O m−2 d−1). Tropical forests are among the most important natural terrestrial ecosystems in terms of N2O emissions (Werner et al., 2007), whereas it has been generally assumed that N2O emissions from arctic soils are negligible. Contrary to this general pattern, the results here confirm the earlier findings that there are surfaces in the Arctic, namely BP soils on permafrost peatlands, with the potential to emit substantial amounts of N2O (Repo et al., 2009; Marushchak et al., 2011; Voigt et al., 2017a).
The bulk N2O fluxes from the 15N-labeling subplots were on average 3 times higher than those from adjacent, non-labeled BP areas. The concentration of inorganic N was at most doubled by adding labeled NO and/or NH, but the final nutrient content never exceeded the maximum content of native NO or NH observed in the soil (data not shown). The bulk N2O fluxes from the labeled plots (∼ 10 mg N2O m−2 d−1) were still within the range of N2O fluxes observed in previous years from BP surfaces (1.9–31 mg N2O m−2 d−1) (Repo et al., 2009; Marushchak et al., 2011). The differences in the N2O fluxes from BP labeled and non-labeled plots could also be attributed to the natural spatial variation in the N2O fluxes within the BP surfaces, which can be large, even on small spatial scales (<1 m; Jenie Gil, personal observation, 2010–2011; data not shown). The N2O emissions from labeled and non-labeled plots had similar responses to change in temperature (R2=0.391, p<0.005), which was likely the major factor controlling the temporal variation in the N2O fluxes from BP surfaces during the study period. Even if some stimulation occurred, this likely did not affect the relative contribution of different microbial pathways to the total N2O emissions because BP surfaces were not limited by N during the study period (see discussion below).
4.2 Gross mineralization and nitrification rates from BP and VP soils
Gross mineralization and nitrification rates were higher in BP than in VP (Table 2) This can be explained by the lower ratio in BP (Booth et al., 2005) and the higher WFPS, which seemed to favor N turnover, supporting the third hypothesis of this study. The low NO consumption in BP suggests that microbial demands are met in BP surfaces. This suggestion agrees with the findings of Diáková et al. (2016), who observed significantly higher net N mineralization rates in BP compared with VP, indicating that microbial communities in BP had a surplus of available N. Gross mineralization, nitrification and NO consumption in VP are negligible, indicating severe N limitations in these soils.
Gross N mineralization rates in BP (3.3±1.1 µg N cm−3 d−1) were higher compared with the gross mineralization rates reported for boreal peatlands (1–2 µg N cm−3 d−1) (Westbrook and Devito, 2004), and they were within the range reported for mineral tundra soils (mineral and organic horizon; 0.1–9 µg N cm−3 d−1) (Biasi et al., 2005; Meyer et al., 2006; Buckeridge and Jefferies, 2007; Marushchak et al., 2011) and organic layers of spruce forest soil (1–4 µg N cm−3 d−1) (Brüggemann et al., 2005; Zeller et al., 2008). The gross N mineralization and nitrification rates of BP expressed per gram of dry weight (12.3±4.2 and 3.2±1.9 µg N g−1 d−1; Table S1b) were also comparable to rates found in boreal, temperate and tropical soils (Booth et al., 2005), and they were in line with results from previous studies from arctic ecosystems and permafrost-affected soils (e.g., Kaiser et al., 2007; Wild et al., 2015; Ramm et al., 2022). These relatively high N turnover rates contradict the general idea that organic-N cycling dominates in cold ecosystems and that mineral-N cycling is of low importance (Schimel and Bennett, 2004). Instead, it seems that gross N mineralization rates and gross nitrification rates can be high in arctic and subarctic ecosystems if conditions are favorable (e.g., low ratio, high % N and suitable water content; Booth et al., 2005; Ramm et al., 2022). In VP, the gross N turnover rates were negligible and, thus, lower than rates reported from BP or from other arctic ecosystems (Alves et al., 2013). The fact that the largest part of 15N was found in the bulk soil immediately after label addition (see below) suggests quick cycles of abiotic fixation and release of NO in the peat soils, which could have made detection of gross nitrification rates in soils with low turnover rates (such as VP) difficult. Nevertheless, it is clear that the differences in mineral-N cycling are an important factor explaining the differences in N2O fluxes between BP and VP.
4.3 The fate of mineral N and factors affecting N2O production
The total recovery of applied 15N within 24 h was close to 100 % in both studied surface types. The recovery percentage decreased during the course of the experiment in both VP and BP, which might have been a consequence of lateral and vertical leaching of N forms within the soils, particularly in the case of 15NO (Clough et al., 2001). Moreover, part of the label could have been lost as gaseous fluxes of NO and N2, which were not measured here. Both downward leaching and gaseous N losses as NO and N2 were likely higher in BP than in VP because of effective plant N uptake and microbial immobilization in VP. Indeed, the total recovery of 15N was higher in VP than in BP surfaces during the whole 24 d experiment (∼ 79 % vs. ∼ 62 %, respectively). It is also likely that 15N might have increasingly accumulated as 15N-N2O and 15N-N2 in pore water/gas in BP. Soil gas concentrations of N2O can be very high (up to 4500 ppb), particularly in BP (Gil et al., 2017). However, as more than 60 % and 80 % of 15N was recovered in VP and BP, respectively, we did account for all of the major sinks of NO and NH in both soils throughout the 24 d experiment.
In both VP and BP, the largest relative proportion of the 15N label after 24 d of experiment was observed in bulk peat (71 %–92 % of total 15N recovered), comprising physically adsorbed, dissolved, chemically or electrochemically fixed, and microbially immobilized 15N. Peatlands are known to be able to efficiently retain nutrients to deal with low N inputs, which allows them to function as nutrient buffers (Vikman et al., 2010). Recovery of 15N in bulk peat was higher for 15NH than for 15NO (Fig. 2a, b). This suggests that the fixation of nutrients to SOM is one of the main reasons for the high retention of 15N, as soil particles are negatively charged (Schlesinger, 1997) and the fixation capacity is high under acidic conditions (Huber et al., 2002). This is supported by other studies that have found evidence of the similarly high fixation of nutrients, particularly of 15NH, to organic peat material (e.g., Münchmeyer et al., 2000). Microbial immobilization is likely another reason for high 15N recovery in bulk soil in BP and VP, as NH and NO consumption rates were as high as production rates in both soils, as obtained from the pool dilution approach (Table 2; see discussion below). Rapid uptake of 15N by microbes in soils with low N in arctic and subarctic ecosystems has been documented during the first days after the addition of a label in previous experiments (Nordin et al., 2004; Sørensen et al., 2008).
It has been shown that, in the short term, plants compete poorly for available soil N, but this competition depends on the season and many other factors (Grogan and Jonasson, 2003; Nordin et al., 2004). In our 3-week study period, the average 15N uptake by plants (vascular plants and mosses) of ∼ 6 % was of the same order of magnitude as in reports from other arctic ecosystems (1 % to 5 % within 4 h for up to 12 weeks; Grogan and Jonasson, 2003; Nordin et al., 2004). The fact that 15N in plants did not constantly increase in our experiment (Fig. S2) suggests that the label, once incorporated into the soil, is only slowly released in plant-available forms, as also put forward by others (Sørensen et al., 2008). Generally, following the soil, most of the label was recovered in mosses (3 %–4 %), followed by roots (∼ 1 % to 3 %) and aboveground vascular plant parts (<1 %) in VP. The relatively large difference in 15N observed between mosses and vascular plants might be related to the difference in their mechanism for nutrient acquisition. Mosses principally derive N from atmospheric deposition (e.g., wet deposition) but also from soil N, and their nutrient acquisition is passive and is thought to relate to their pattern of water uptake (Ayres et al., 2006). As the 15N tracers were added in a water solution, this should have facilitated the uptake of the 15N label by mosses in VP surfaces, which penetrate the upper soil column where the label was injected.
It has been shown that plants from different ecosystems, including arctic ecosystems, can show N uptake flexibility between forms of N (organic N, NO and NH) based on environmental conditions and species competition (McKane et al., 2002; Gao et al., 2020). In our study, there was no difference in the plant uptake of 15N-NO and 15N-NH in VP surfaces. The 15N in plants was determined for the bulk and not for individual species; thus, it is possible that discrimination between the N forms based on species-specific preferences could take place (Gao et al., 2020).
In BP, where plants were absent, 24 % of the applied 15N was detected in the cumulative N2O emission at the end of the experiment. Thus, the recovery of the label in N2O in BP is up to 3-fold larger than the relative portion of label observed in plants in VP (maximum value of ∼ 9 %). This confirms our second hypothesis that a higher proportion of the added 15N is released in gaseous form in BP than is taken up by plants and immobilized in VP. It suggests that competition for N is an important regulator of N2O in these peatlands and that plants control the emissions of this strong greenhouse gas to some extent. This has been observed before for a restored boreal peatland with various levels of nitrate addition and plant coverage and for a drained forested peatland, where the presence of roots halved N2O emission (Silvan et al., 2005; Holz et al., 2016). It is also supported by recent results from a mesocosms study which showed that the presence of vegetation limited N2O emissions from a permafrost peatland by ∼ 90 % (Voigt et al., 2017b). On the other hand, in BP, where plants are absent, microbes are not limited by N and excess mineral N is highly available for microbial N2O production processes, such as nitrification and denitrification (Schimel and Bennett, 2004). The differences in N2O emissions between BP and VP are further a direct consequence of the variable production rates of mineral-N forms, with much lower gross N mineralization and nitrification rates in VP than in BP likely due to the higher ratios of the soils. Another important factor limiting N2O production in VP is likely the low WFPS (29 % ± 1 %; Table 1) and, thus, high aeration status of peat, which deceases the denitrification potential (Firestone and Davidson, 1989). The higher WFPS in BP, on the other hand, creates ideal conditions for mineralization, nitrification and denitrification to take place (Liimatainen et al., 2018). To conclude, in VP, which has a low ratio and high aeration status, N2O production is limited by low mineralization, nitrification and denitrification rates as well as plant N uptake and immobilization of N. Thus, we find strong support for the second hypothesis in this study.
4.4 Microbial source of N2O emitted from the BP surfaces
The source-partitioning approach suggests the general dominance of denitrification processes (∼ 79 %) as a source of N2O in BP surfaces. The results of the source-partitioning approach are also corroborated by the higher 15N-N2O fluxes after the application of 15N-NO compared with the application of 15N-NH. The soil properties and N dynamics also hint at denitrification pathways being dominant in BP surfaces, where the high NO content and the intermediate to high soil moisture conditions cause high N2O emissions via denitrification, as also suggested previously (Repo et al., 2009; Palmer et al., 2011; Marushchak et al., 2011). Palmer et al. (2011) detected a high number of functional genes involved in denitrification in these soils as well as the high potential for denitrification. A few highly specialized taxa using acetate as their energy source, mostly belonging to the family of Burkholderiaceae (co-occurring with Rhodanobacter sp.), seem to be responsible for most of the denitrification occurring in these acidic soils (Hetz and Horn, 2021). Thus, the first hypothesis of this study was supported by our labeling study and the source-partitioning approach. On a side note, we cannot clearly explain the second peak that we found in 15N2O and several inorganic 15N pools in BP, but this could be due to the immobilization and later recycling of added 15N by microbes and by abiotic fixation (Braun et al., 2018).
Despite the clear dominance of denitrification, the relative contribution of total nitrification to the N2O emissions from BP surfaces (∼ 20 %) was still significant and could be particularly important during drier summers (low soil water content) and at the end of the growing season when the N2O emissions are generally lower, as shown here and also in Gil et al. (2017). In 2011, we found evidence of nitrification-derived N2O via 15N natural-abundance approaches in an exceptionally dry year in Seida, during which time the WFPS of BP was almost 20 % less than in 2010 (this study) and N2O emissions were much lower (Gil et al., 2017). However, nitrifier denitrification can be ruled out as a possible source of N2O in these soils, as we now know that peat ammonia-oxidizing archaea (AOA) are responsible for ammonia oxidation and ammonia-oxidizing bacteria (AOB) are lacking in Seida (Siljanen et al., 2019; Hetz and Horn, 2021). AOA are not capable of denitrification, in contrast with AOB. However, nitrite produced by AOA could allow abiotic production of N2O by chemical denitrification, where nitrite reacts with SOM under acidic conditions, which prevail in the studied peat soils (Kappelmeyer et al., 2003).
As the physical and chemical conditions in the studied permafrost peat surfaces are favorable for both nitrification and denitrification, it is possible that adjacent aerobic and anaerobic microhabitats enabled both ammonia oxidation and denitrification to occur and produce N2O. Furthermore, nitrate/nitrite from nitrification is used as an electron acceptor in denitrification. Nitrous oxide production through a coupled nitrification–denitrification process is typical of C-rich soils (Siljanen et al., 2019). This is supported by our data from T2, where the 15N label from 15N-NH appeared in the N2O flux after a short time lag. As the balance between nitrification and denitrification in soils influences N2O emission strength, with higher N2O emissions associated with denitrification, an increased soil water content, as predicted for Alaska (Douglas et al., 2020), might stimulate N2O emissions from sites with high N availability.
The N2O emission rates from the BP surfaces (mean of 3 mg N2O m−2 d−1) were high, as hypothesized, whereas N2O emissions from VP were negligible throughout the sampling period. In VP, N2O production was limited by the low inorganic-N content and low delivery of N from SOM, as opposed to BP. For both VP and BP, most of the 15N label was recovered in the bulk peat, followed by the N2O flux in BP and by plants in VP. The recovery of the label was larger in the N2O in BP than in plants in VP. This suggests that competition for mineral N between plants and microbes limits the N2O release in VP, along with low mineralization and nitrification rates as a result of the high ratio. In addition, a low bulk density (high porosity) and low water content limit N2O production by anaerobic denitrification in VP, whereas the soil moisture content in BP is favorable for denitrification.
The source partitioning of N2O from BP surfaces supports the role of denitrification as the dominant process behind the high N2O emissions from BP during the study period. However, it also showed that nitrifying processes are taking place in BP and emit some N2O. Thus, nitrification is also a key process involved in N2O production in these soils, both directly and indirectly through the NO supply for denitrification. With future warming, increased rainfall and permafrost thaw, anaerobic conditions might become more prevalent across the Arctic, which may cause increased N2O release. In addition to soil moisture changes, abrupt permafrost thaw and thermokarst cause disturbances to the vegetation cover, which may improve the N availability for soil microbes, including those producing N2O. On the other hand, overall trends towards increasing plant growth in a warming Arctic might slow down N2O release in the long term. The net effect of all of these changes on N2O emissions from permafrost regions are currently unknown and should, therefore, be the focus of future studies. It is important to consider these processes in N-cycling models for permafrost regions, which are currently being developed.
Most of the data are provided in the figures and tables in the paper and Supplement; any additional data may be obtained from Jenie Gil (jenie.gillugo@uef.fi).
The supplement related to this article is available online at: https://doi.org/10.5194/bg-19-2683-2022-supplement.
CB, EMB, TR and PJM designed the study. JG, MEM, CB, TT and AN conducted the field work. DK and AN provided access to and expertise on the study sites and supported the project with respect to field logistics. JG and CB conducted laboratory analysis and data processing. JG wrote the first version of the paper with contributions from CB and TP, and all co-authors provided input on the text and figures as well as contributing to discussions on the scientific content of the paper.
The contact author has declared that neither they nor their co-authors have any competing interests.
Publisher’s note: Copernicus Publications remains neutral with regard to jurisdictional claims in published maps and institutional affiliations.
This study was financially supported by the Academy of Finland, project CryoN 2010–2014 “Mechanisms underlying large N2O emissions from cryoturbated peat surfaces in tundra” (decision no. 132045). We acknowledge further funding from the European Union 7th Framework Programme, project PAGE21 (contract no. GA282700); the Academy of Finland, project NOCA (decision no. 314630); EMPIR, project SIRS “Metrology for stable isotope reference standards” (project no. 16ENV06 SIRS); and DEFROST – the Nordic Centre of Excellence program “Impacts of changing cryosphere – depicting ecosystem–climate feedbacks from permafrost, snow and ice”. We are also grateful to the ESF consortium for supporting project CryoCARB through productive discussions. Jenie Gil acknowledges salary funding from the doctoral program of the University of Eastern Finland (during 2014), a personal grant awarded by the Finnish Cultural Foundation (2015), and funding from the Academy of Finland/Vilho, Yrjö ja Kalle Väisälän Foundation (2016). The authors also wish to thank Jouko Pokela, Slava Hozainov, Igor Marushchak, Natalia Kaneva and Henry Mora for their invaluable help during the fieldwork. The anonymous reviewers are acknowledged for their insightful comments and suggestions that contributed significantly to improving the paper. For the purpose of open access, the author E. M. Baggs has applied a Creative Commons Attribution (CC BY) license to any author-accepted manuscript version arising from this submission.
This research has been supported by the Academy of Finland (decision nos. 132045 and 314630), the European Metrology Programme for Innovation and Research (project no. 16ENV06 SIRS) and the European Union 7th Framework Programme, project PAGE21 (contract no. GA282700).
This paper was edited by Sara Vicca and reviewed by two anonymous referees.
Abbott, B. W. and Jones, J. B.: Permafrost collapse alters soil carbon stocks, respiration, CH4, and N2O in upland tundra, Glob. Change Biol., 21, 4570–4587, https://doi.org/10.1111/gcb.13069, 2015.
Alves, R. J. E., Wanek, W., Zappe, A., Richter, A., Svenning, M. M., Schleper, C., and Urich, T.: Nitrification rates in Arctic soils are associated with functionally distinct populations of ammonia-oxidizing archaea, ISME J., 7, 1620–1631, 2013.
Ayres, E., van der Wal, R., Sommerkorn, M., and Bardgett, R. D.: Direct uptake of soil nitrogen by mosses, Biol. Letters, 2, 286–288, https://doi.org/10.1098/rsbl.2006.0455, 2006.
Baggs, E. M.: Soil microbial sources of nitrous oxide: recent advances in knowledge, emerging challenges and future direction, Curr. Opin. Env. Sust., 3, 321–327, https://doi.org/10.1016/j.cosust.2011.08.011, 2011.
Baggs, E. M., Richter, M., Cadisch, G., and Hartwig, U. A.: Denitrification in grass swards is increased under elevated atmospheric CO2, Soil Biol. Biochem., 35, 729–732, https://doi.org/10.1016/s0038-0717(03)00083-x, 2003.
Biasi, C., Wanek, W., Rusalimova, O., Kaiser, C., Meyer, H., Barsukov, P., and Richter, A.: Microtopography and plant-cover controls on nitrogen dynamics in hummock tundra ecosystems in Siberia, Arct. Antarct. Alp. Res., 37, 435–443, https://doi.org/10.1657/1523-0430(2005)037[0435:mapcon]2.0.co;2, 2005.
Biasi, C., Jokinen, S., Marushchak, M. E., Hamalainen, K., Trubnikova, T., Oinonen, M., and Martikainen, P. J.: Microbial Respiration in Arctic Upland and Peat Soils as a Source of Atmospheric Carbon Dioxide, Ecosystems, 17, 112–126, https://doi.org/10.1007/s10021-013-9710-z, 2014.
Booth, M. S., Stark, J. M., and Rastetter, E.: Controls on nitrogen cycling in terrestrial ecosystems: A synthetic analysis of literature data, Ecol. Monogr., 75, 139–157, https://doi.org/10.1890/04-0988, 2005.
Borge, A. F., Westermann, S., Solheim, I., and Etzelmüller, B.: Strong degradation of palsas and peat plateaus in northern Norway during the last 60 years, The Cryosphere, 11, 1–16, https://doi.org/10.5194/tc-11-1-2017, 2017.
Braun, J., Mooshammer, M., Wanek, W., Prommer, J., Walker, T. W. N., Rutting, T., and Richter, A.: Full N-15 tracer accounting to revisit major assumptions of N-15 isotope pool dilution approaches for gross nitrogen mineralization, Soil Biol. Biochem., 117, 16–26, https://doi.org/10.1016/j.soilbio.2017.11.005, 2018.
Brüggemann, N., Rosenkranz, P., Papen, H., Pilegaard, K., and Butterbach-Bahl, K.: Pure stands of temperate forest tree species modify soil respiration and N turnover, Biogeosciences Discuss., 2, 303–331, https://doi.org/10.5194/bgd-2-303-2005, 2005.
Buckeridge, K. M. and Jefferies, R. L.: Vegetation loss alters soil nitrogen dynamics in an Arctic salt marsh, J. Ecol., 95, 283–293, https://doi.org/10.1111/j.1365-2745.2007.01214.x, 2007.
Ciais, P., Sabine, C., Bala, G., Bopp, L., Brovkin, V., Canadell, J., Chhabra, A., DeFries, R., Galloway, J., Heimann, M., Jones, C., Le Quéré, C., Myneni, R. B., Piao S., and Thornton, P.: Carbon and Other Biogeochemical Cycles, in: Climate Change 2013: The Physical Science Basis. Contribution of Working Group I to the Fifth Assessment Report of the Intergovernmental Panel on Climate Change, edited by: Stocker, T. F., Qin, D., Plattner, G.-K., Tignor, M., Allen, S. K., Boschung, J., Nauels, A., Xia, Y., Bex, V., and Midgley, P. M., Cambridge University Press, Cambridge, United Kingdom and New York, NY, USA, 465–570, https://www.ipcc.ch/site/assets/uploads/2018/02/WG1AR5_Chapter06_FINAL.pdf (last access: 23 May 2022), 2013.
Clough, T. J., Sherlock, R. R., Cameron, K. C., Stevens, R. J., Laughlin, R. J., and Muller, C.: Resolution of the N-15 balance enigma?, Aust. J. Soil Res., 39, 1419–1431, https://doi.org/10.1071/sr00092, 2001.
Cookson, W., Cornforth, I. S., and Rowarth, J. S.: Winter soil temperature (2–15 ∘C) effects on nitrogen transformations in clover green manure amended or unamended soils; a laboratory and field study, Soil Biol. Biochem., 34, 1401–1415, https://doi.org/10.1016/S0038-0717(02)00083-4, 2002.
Decock, C. and Six, J.: How reliable is the intramolecular distribution of N-15 in N2O to source partition N2O emitted from soil?, Soil Biol. Biochem., 65, 114–127, https://doi.org/10.1016/j.soilbio.2013.05.012, 2013.
Diáková, K., Biasi, C., Čapek, P., Martikainen, P. J., Marushchak, M. E., Patova, E. N., and Šantrčková, H.: Variation in N2 Fixation in Subarctic Tundra in Relation to Landscape Position and Nitrogen Pools and Fluxes, Arct. Antarct. Alp. Res., 48, 111–125, https://doi.org/10.1657/AAAR0014-064, 2016.
Douglas, T. A., Turetsky, M. R., and Koven, C. D.: Increased rainfall stimulates permafrost thaw across a variety of Interior Alaskan boreal ecosystems, Npj Climate and Atmospheric Science, 3, 28, https://doi.org/10.1038/s41612-020-0130-4, 2020.
Elberling, B., Christiansen, H. H., and Hansen, B. U.: High nitrous oxide production from thawing permafrost, Nat. Geosci., 3, 332–335, https://doi.org/10.1038/ngeo803, 2010.
Fawcett, J. K. and Scott, J. E.: A Rapid and precise method for the determination of urea, Journal of Clinical Pathodology, 13, 156–159, 1960.
Firestone, M. and Davidson, E.: Microbiological basis of NO and N2O production and consumption in soil, in: Exchange of Trace Gases between Terrestrial Ecosystems and the Atmosphere, edited by: Andreae, M. O. and Schimel, D. S., John Wiley & Sons., New York, 7–21, ISBN: 10 0471925519, 1989.
Gao, L., Cui, X. Y., Hill, P. W., and Guo, Y. F.: Uptake of various nitrogen forms by co-existing plant species in temperate and cold-temperate forests in northeast China, Appl. Soil Ecol., 147, 103398, https://doi.org/10.1016/j.apsoil.2019.103398, 2020.
Gardner, J. B. and Drinkwater, L. E.: The fate of nitrogen in grain cropping systems: a meta-analysis of N-15 field experiments, Ecol. Appl., 19, 2167–2184, https://doi.org/10.1890/08-1122.1, 2009.
Gil, J., Perez, T., Boering, K., Martikainen, P. J., and Biasi, C.: Mechanisms responsible for high N2O emissions from subarctic permafrost peatlands studied via stable isotope techniques, Global Biogeochem. Cy., 31, 172–189, https://doi.org/10.1002/2015gb005370, 2017.
Goldberg, S. D., Knorr, K. H., Blodau, C., Lischeid, G., and Gebauer, G.: Impact of altering the water table height of an acidic fen on N2O and NO fluxes and soil concentrations, Glob. Change Biol., 16, 220–233, https://doi.org/10.1111/j.1365-2486.2009.02015.x, 2010.
Grogan, P. and Jonasson, S.: Controls on annual nitrogen cycling in the understory of a subarctic birch forest, Ecology, 84, 202–218, https://doi.org/10.1890/0012-9658(2003)084[0202:coanci]2.0.co;2, 2003.
Harden, J. W., Koven, C. D., Ping, C. L., Hugelius, G., McGuire, A. D., Camill, P., Jorgenson, T., Kuhry, P., Michaelson, G. J., O'Donnell, J. A., Schuur, E. A. G., Tarnocai, C., Johnson, K., and Grosse, G.: Field information links permafrost carbon to physical vulnerabilities of thawing, Geophys. Res. Lett., 39, L15704, https://doi.org/10.1029/2012gl051958, 2012.
Harrison, M. D., Groffman, P. M., Mayer, P. M., and Kaushal, S. S.: Nitrate removal in two relict oxbow urban wetlands: a N-15 mass-balance approach, Biogeochemistry, 111, 647–660, https://doi.org/10.1007/s10533-012-9708-1, 2012.
Harty, M. A., McGeough, K. L. , Carolan, R., Müller, C., Laughlin, R. J., Lanigan, G. J., Richards, K. G., and Watson, C. J.: Gross nitrogen transformations in grassland soil react differently to urea stabilisers under laboratory and field conditions, Soil Biol. Biochem., 109, 23–34, https://doi.org/10.1016/j.soilbio.2017.01.025, 2017.
Heikkinen, J. E. P., Elsakov, V., and Martikainen, P. J.: Carbon dioxide and methane dynamics and annual carbon balance in tundra wetland in NE Europe, Russia, Global Biogeochem. Cy., 16, 62-1–62-15, https://doi.org/10.1029/2002gb001930, 2002.
Herman, D. J., Brooks, P. D. , Ashraf, M., Azam, F. and Mulvaney, R. M.: Evaluation of methods for nitrogen-15 analysis of inorganic nitrogen in soil extracts. II. Diffusion methods, Commun. Soil Sci. Plan., 26, 1675–1685, 1995.
Hetz, S. A. and Horn, M. A.: Burkholderiaceae Are Key AcetateAssimilators During Complete Denitrification in Acidic Cryoturbated Peat Circles of the Arctic Tundra, Front. Microbiol., 12, 628269, https://doi.org/10.3389/fmicb.2021.628269, 2021.
Holz, M., Aurangojeb, M., Kasimir, A., Boeckx, P., Kuzyakov, Y., Klemedtsson, L., and Rutting, T.: Gross Nitrogen Dynamics in the Mycorrhizosphere of an Organic Forest Soil, Ecosystems, 19, 284–295, https://doi.org/10.1007/s10021-015-9931-4, 2016.
Huber, C., Oberhauser, A., and Kreutzer, K.: Deposition of ammonia to the forest floor under spruce and beech at the Hoglwald site, Plant Soil, 240, 3–11, https://doi.org/10.1023/a:1015825024164, 2002.
Kaiser, C., Meyer, H., Biasi, C., Rusalimova, O., Barsukov, P., and Richter, A.: Conservation of soil organic matter through cryoturbation in arctic soils in Siberia, J. Geophys. Res.-Biogeo., 112, G02017, https://doi.org/10.1029/2006jg000258, 2007.
Kappelmeyer, U., Kuschk, P., and Stottmeister, U.: Model experiments on the influence of artificial humic compounds on chemodenitrification, Water Air Soil Poll., 147, 317–330, https://doi.org/10.1023/a:1024518027312, 2003.
Kaverin, D. A., Pastukhov, A. V., Lapteva, E. M., Biasi, C., Marushchak, M., and Martikainen, P.: Morphology and properties of the soils of permafrost peatlands in the southeast of the Bol'shezemel'skaya tundra, Eurasian Soil Sci., 49, 498–511, https://doi.org/10.1134/s1064229316050069, 2016.
Kirkham, D. and Bartholomew, W.: Equations for following nutrient transformations in soil, utilizing tracer data, Soil Sci. Soc. Am. J., 18, 33–34, 1954.
Kirkham, D. and Bartholomew, W.: Equations for following nutrient transformations in Soil, utilizing tracer data: II, Soil Sci. Soc. Ame. J., 19, 189–192, 1955.
Liimatainen, M., Voigt, C., Martikainen, P. J., Hytonen, J., Regina, K., Oskarsson, H., and Maljanen, M.: Factors controlling nitrous oxide emissions from managed northern peat soils with low carbon to nitrogen ratio, Soil Biol. Biochem., 122, 186–195, https://doi.org/10.1016/j.soilbio.2018.04.006, 2018.
Ma, W. K., Schautz, A., Fishback, L. A. E., Bedard-Haughn, A., Farrell, R. E., and Siciliano, S. D.: Assessing the potential of ammonia oxidizing bacteria to produce nitrous oxide in soils of a high arctic lowland ecosystem on Devon Island, Canada, Soil Biol. Biochem., 39, 2001–2013, https://doi.org/10.1016/j.soilbio.2007.03.001, 2007.
Maljanen, M., Sigurdsson, B. D., Guðmundsson, J., Óskarsson, H., Huttunen, J. T., and Martikainen, P. J.: Greenhouse gas balances of managed peatlands in the Nordic countries – present knowledge and gaps, Biogeosciences, 7, 2711–2738, https://doi.org/10.5194/bg-7-2711-2010, 2010.
Marushchak, M. E., Pitkamaki, A., Koponen, H., Biasi, C., Seppala, M., and Martikainen, P. J.: Hot spots for nitrous oxide emissions found in different types of permafrost peatlands, Glob. Change Biol., 17, 2601–2614, https://doi.org/10.1111/j.1365-2486.2011.02442.x, 2011.
Marushchak, M. E., Kiepe, I., Biasi, C., Elsakov, V., Friborg, T., Johansson, T., Soegaard, H., Virtanen, T., and Martikainen, P. J.: Carbon dioxide balance of subarctic tundra from plot to regional scales, Biogeosciences, 10, 437–452, https://doi.org/10.5194/bg-10-437-2013, 2013.
Marushchak, M. E., Kerttula, J., Diáková, K., Faguet, A., Gil, J., Grosse, G., Knoblauch, C., Lashchinskiy, N., Martikainen, P. J., Morgenstern, A., Nykamb, M., Ronkainen, J. G., Siljanen, H. M. P., van Delden, L., Voigt, C., Zimov, N., Zimov, S., and Biasi, C.: Thawing Yedoma permafrost is a neglected nitrous oxide source, Nat. Commun., 12, 7107, https://doi.org/10.1038/s41467-021-27386-2, 2021.
McKane, R. B., Johnson, L. C., Shaver, G. R., Nadelhoffer, K. J., Rastetter, E. B., Fry, B., Giblin, A. E., Kielland, K., Kwiatkowski, B. L., Laundre, J. A., and Murray, G.: Resource-based niches provide a basis for plant species diversity and dominance in arctic tundra, Nature, 415, 68–71, https://doi.org/10.1038/415068a, 2002.
Meyer, H., Kaiser, C., Biasi, C., Hammerle, R., Rusalimova, O., Lashchinsky, N., Baranyi, C., Daims, H., Barsukov, P., and Richter, A.: Soil carbon and nitrogen dynamics along a latitudinal transect in Western Siberia, Russia, Biogeochemistry, 81, 239–252, https://doi.org/10.1007/s10533-006-9039-1, 2006.
Miranda, K. M., Espey, M. G., and Wink, D. A.: A rapid, simple spectrophotometric method for simultaneous detection of nitrate and nitrite, Nitric Oxide-Biol. Ch., 5, 62–71, https://doi.org/10.1006/niox.2000.0319, 2001.
Münchmeyer, U., Russow, R., and Augusti, J.: Net and Gross Nitrogen Mineralization in Drained and Reflooded Fen Soils, Isot. Environ. Heal. S., 36, 79–98, https://doi.org/10.1080/10256010008032934, 2000.
Nordin, A., Schmidt, I. K., and Shaver, G. R.: Nitrogen uptake by arctic soil microbes and plants in relation to soil nitrogen supply, Ecology, 85, 955–962, https://doi.org/10.1890/03-0084, 2004.
Palmer, K., Biasi, C., and Horn, M. A.: Contrasting denitrifier communities relate to contrasting N2O emission patterns from acidic peat soils in arctic tundra, ISME J., 6, 1058–1077, https://doi.org/10.1038/ismej.2011.172, 2011.
Ramm, E., Liu, C. Y., Ambus, P., Butterbach-Bahl, K., Hu, B., Martikainen, P. J., Marushchak, M. E, Mueller, C. W., Rennenberg, H., Schloter, M., Siljanen, H. M. P., Voigt, C., Werner, C., Biasi, C., and Dannenmann, M.: A review of the importance of mineral nitrogen cycling in the plant-soil-microbe system of permafrost-affected soils-changing the paradigm, Environ. Res. Lett., 17, 013004, https://doi.org/10.1088/1748-9326/ac417e, 2022.
Repo, M. E., Susiluoto, S., Lind, S. E., Jokinen, S., Elsakov, V., Biasi, C., Virtanen, T., and Martikainen, P. J.: Large N2O emissions from cryoturbated peat soil in tundra, Nat. Geosci., 2, 189–192, https://doi.org/10.1038/ngeo434, 2009.
Rütting, T., Huygens, D., Staelens, J., Muller, C., and Boeckx, P.: Advances in N-15-tracing experiments: new labelling and data analysis approaches, Biochem. Soc. T., 39, 279–283, https://doi.org/10.1042/bst0390279, 2011.
Sannel, A. B. K. and Kuhry, P. : Warming-induced destabilization of peat plateau/thermokarst lake complexes, J. Geophys. Res., 116, G03035, https://doi.org/10.1029/2010JG001635, 2011.
Schädel, C., Bader, M. K. F., Schuur, E. A. G., Biasi, C., Bracho, R., Capek, P., De Baets, S., Diakova, K., Ernakovich, J., Estop-Aragones, C., Graham, D. E., Hartley, I. P., Iversen, C. M., Kane, E. S., Knoblauch, C., Lupascu, M., Martikainen, P. J., Natali, S. M., Norby, R. J., O'Donnell, J. A., Chowdhury, T. R., Santruckova, H., Shaver, G., Sloan, V. L., Treat, C. C., Turetsky, M. R., Waldrop, M. P., and Wickland, K. P.: Potential carbon emissions dominated by carbon dioxide from thawed permafrost soils, Nat. Clim. Change, 6, 950–953, https://doi.org/10.1038/nclimate3054, 2016.
Schimel, J. P. and Bennett, J.: Nitrogen mineralization: Challenges of a changing paradigm, Ecology, 85, 591–602, https://doi.org/10.1890/03-8002, 2004.
Schlesinger, W. H.: Biogeochemistry. An Analysis of Global Change, 2nd Edn., Academic Press, Toronto, San Diego, London, Boston, New York, Sydney, Tokyo, 1997.
Schuur, E. A. G., Vogel, J. G., Crummer, K. G., Lee, H., Sickman, J. O., and Osterkamp, T. E.: The effect of permafrost thaw on old carbon release and net carbon exchange from tundra, Nature, 459, 556–559, https://doi.org/10.1038/nature08031, 2009.
Schuur, E. A. G., McGuire, A. D., Schädel, C., Grosse, G., Harden, J. W., Hayes, D. J., Hugelius, G., Koven, C. D., Kuhry, P., Lawrence, D. M., Natali, S. M., Olefeldt, D., Romanovsky, V. E., Schaefer, K., Turetsky, M. R., Treat, C. C., and Vonk, J. E.: Climate change and the permafrost carbon feedback, Nature, 520, 171–179, https://doi.org/10.1038/nature14338, 2015.
Siciliano, S. D., Ma, W. K., Ferguson, S., and Farrell, R. E.: Nitrifier dominance of Arctic soil nitrous oxide emissions arises due to fungal competition with denitrifiers for nitrate, Soil Biol. Biochem., 41, 1104–1110, https://doi.org/10.1016/j.soilbio.2009.02.024, 2009.
Siljanen, H. M. P., Alves, R. J. E., Ronkainen, J. G., Lamprecht, R. E., Bhattarai, H. R., Bagnoud, A., Marushchak, M. E., Martikainen, P. J., Schleper, C., and Biasi, C.: Archaeal nitrification is a key driver of high nitrous oxide emissions from arctic peatlands, Soil Biol. Biochem., 137, 107539, https://doi.org/10.1016/j.soilbio.2019.107539, 2019.
Silvan, N., Tuittila, E. S., Kitunen, V., Vasander, H., and Laine, J.: Nitrate uptake by Eriophorum vaginatum controls N2O production in a restored peatland, Soil Biol. Biochem., 37, 1519–1526, https://doi.org/10.1016/j.soilbio.2005.01.006, 2005.
Seppälä, M.: Surface abrasion of palsas by wind action in Finnish Lapland, Geomorphology, 52, 141–148, https://doi.org/10.1016/S0169-555X(02)00254-4, 2003.
Seppälä, M.: Synthesis of studies of palsa formation underlining the importance of local environmental and physical characteristics, Quaternary Res., 75, 366–370, https://doi.org/10.1016/j.yqres.2010.09.007, 2011.
Sørensen, P. L., Clemmensen, K. E., Michelsen, A., Jonasson, S., and Strom, L.: Plant and microbial uptake and allocation of organic and inorganic nitrogen related to plant growth forms and soil conditions at two subarctic tundra sites in Sweden, Arct. Antarct. Alp. Res., 40, 171–180, https://doi.org/10.1657/1523-0430(06-114)[sorensen]2.0.co;2, 2008.
Stevens, R. J., Laughlin, R. J., Burns, L. C., Arah, J. R. M., and Hood, R. C.: Measuring the contributions of nitrification and denitrification to the flux of nitrous oxide from soil, Soil Biol. Biochem., 29, 139–151, https://doi.org/10.1016/s0038-0717(96)00303-3, 1997.
Takakai, F., Desyatkin, A. R., Lopez, C. M. L., Fedorov, A. N., Desyatkin, R. V., and Hatano, R.: CH4 and N2O emissions from a forest-alas ecosystem in the permafrost taiga forest region, eastern Siberia, Russia, J. Geophys. Res.-Biogeo., 113, G02002, https://doi.org/10.1029/2007jg000521, 2008.
Toyoda, S., Yoshida, N., and Koba, K.: Isotopocule analysis of biologically produced nitrous oxide in various environments, Mass Spectrom. Rev., 36, 135–160, https://doi.org/10.1002/mas.21459, 2017.
Vikman, A., Sarkkola, S., Koivusalo, H., Sallantaus, T., Laine, J., Silvan, N., Nousiainen, H., and Nieminen, M.: Nitrogen retention by peatland buffer areas at six forested catchments in southern and central Finland, Hydrobiologia, 641, 171–183, https://doi.org/10.1007/s10750-009-0079-0, 2010.
Voigt, C., Lamprecht, R. E., Marushchak, M. E., Lind, S. E., Novakovskiy, A., Aurela, M., Martikainen, P. J., and Biasi, C.: Warming of subarctic tundra increases emissions of all three important greenhouse gases – carbon dioxide, methane, and nitrous oxide, Glob. Change Biol., 23, 3121–3138, https://doi.org/10.1111/gcb.13563, 2017a.
Voigt, C., Marushchak, M. E., Lamprecht, R. E., Jackowicz-Korczynski, M., Lindgren, A., Mastepanov, M., Granlund, L., Christensen, T. R., Tahvanainen, T., Martikainen, P. J., and Biasi, C.: Increased nitrous oxide emissions from Arctic peatlands after permafrost thaw, P. Natl. Acad. Sci. USA, 114, 6238–6243, https://doi.org/10.1073/pnas.1702902114, 2017b.
Voigt, C., Marushchak, M. E., Abbott, B. W., Elberling, B., Siciliano, S. D., Sonnentag, O., Stewart, K. J., Yang, Y., and Martikainen, P. E.: Nitrous oxide emissions from permafrost-affected soils, Nat. Rev. Earth Environ., 1, 420–434, https://doi.org/10.1038/s43017-020-0063-9, 2020.
Werner, C., Butterbach-Bahl, K., Haas, E., Hickler, T., and Kiese, R.: A global inventory of N2O emissions from tropical rainforest soils using a detailed biogeochemical model, Global Biogeochem. Cy., 21, GB3010, https://doi.org/10.1029/2006gb002909, 2007.
Westbrook, C. J. and Devito, K. J.: Gross nitrogen transformations in soils from uncut and cut boreal upland and peatland coniferous forest stands, Biogeochemistry, 68, 33–49, https://doi.org/10.1023/B:BIOG.0000025739.04821.8e, 2004.
Wild, B., Schnecker, J., Knoltsch, A., Takriti, M., Mooshammer, M., Gentsch, N., Mikutta, R., Alves, R. J. E., Gittel, A., Lashchinskiy, N., and Richter, A.: Microbial nitrogen dynamics in organic and mineral soil horizons along a latitudinal transect in western Siberia, Global Biogeochem. Cy., 29, 567–582, https://doi.org/10.1002/2015gb005084, 2015.
Wrage, N., van Groenigen, J. W., Oenema, O., and Baggs, E. M.: A novel dual-isotope labelling method for distinguishing between soil sources of N2O, Rapid Commun. Mass Sp., 19, 3298–3306, https://doi.org/10.1002/rcm.2191, 2005.
Zeller, B., Liu, J. X., Buchmann, N., and Richter, A.: Tree girdling increases soil N mineralization in two spruce stands, Soil Biol. Biochem., 40, 1155–1166, https://doi.org/10.1016/j.soilbio.2007.12.009, 2008.