the Creative Commons Attribution 4.0 License.
the Creative Commons Attribution 4.0 License.
 | 02 Jun 2022
Response of vegetation and carbon fluxes to brown lemming herbivory in northern Alaska
Jessica Plein
Rulon W. Clark
Kyle A. Arndt
Walter C. Oechel
Douglas Stow
Donatella Zona
The warming of the Arctic is affecting the carbon cycle of tundra ecosystems. Most research on carbon fluxes from Arctic tundra ecosystems has focused on abiotic environmental controls (e.g., temperature, rainfall, or radiation). However, Arctic tundra vegetation, and therefore the carbon balance of these ecosystems, can be substantially impacted by herbivory. In this study we tested how vegetation consumption by brown lemmings (Lemmus trimucronatus) can impact carbon exchange of a wet-sedge tundra ecosystem near Utqiaġvik, Alaska during the summer and the recovery of vegetation during the following summer. We placed brown lemmings in individual enclosure plots and tested the impact of lemmings' herbivory on carbon dioxide (CO2) fluxes, methane (CH4) fluxes, and the normalized difference vegetation index (NDVI) immediately after lemming removal and during the following growing season. During the first summer of the experiment, lemmings' herbivory reduced plant biomass (as shown by the decrease in the NDVI) and decreased net CO2 uptake while not significantly impacting CH4 emissions. CH4 emissions were likely not significantly affected due to CH4 being produced deeper in the soil and escaping from the stem bases of the vascular plants. The summer following the lemming treatments, NDVI and net CO2 fluxes returned to magnitudes similar to those observed before the start of the experiment, suggesting a complete recovery of the vegetation and a transitory nature of the impact of lemming herbivory. Overall, lemming herbivory has short-term but substantial effects on carbon sequestration by vegetation and might contribute to the considerable interannual variability in CO2 fluxes from tundra ecosystems.
- Article
(2254 KB) - Full-text XML
-
Supplement
(808 KB) - BibTeX
- EndNote


The Arctic is warming at about three times the rate of the global average (IPCC, 2021), impacting tundra vegetation and the carbon cycle. Vegetation influences the carbon stored in the tundra ecosystem through the exchange of carbon dioxide (CO2) and methane (CH4) from the soil into the atmosphere via respiration or by CO2 uptake through photosynthesis. One of the largest natural reservoirs of organic carbon in the world is stored within Arctic soils, containing approximately 1300 Pg of soil organic carbon (Hugelius et al., 2014). Once soils thaw, microbes can convert stored carbon into greenhouse gases that enter the atmosphere, contributing to global warming (McGuire et al., 2009; Schuur et al., 2008). This positive feedback could have dramatic effects on warming rates, and these effects are why most carbon cycle research in tundra systems focuses on abiotic controls on carbon fluxes (Kwon et al., 2019; Oechel et al., 2014; Sturtevant et al., 2012; Zona et al., 2010). Most of the studies investigating the patterns and controls on the carbon balance from Arctic ecosystems have focused on the environmental controls on CO2 and CH4 while overlooking the role of herbivory. Since herbivores remove photosynthetic tissues of vegetation, herbivory should substantially decrease the ability of vegetation to photosynthesize and sequester CO2 (Metcalfe and Olofsson, 2015). The decrease in vascular plant cover should also decrease CH4 emissions, given that aerenchyma in sedges (Carex aquatilis is the dominant vascular plant and sedge in our study site; Davidson et al., 2016) facilitate the escape of CH4 from deeper anoxic soil layers into the atmosphere (Dias et al., 2010; McEwing et al., 2015; Ström et al., 2003; Whiting and Chanton, 1993). In addition to transport, vascular plants also affect the release of labile carbon from photosynthetic tissues, which in turn stimulates CH4 emission (Bhullar et al., 2014; McEwing et al., 2015; Ström et al., 2003; Tan et al., 2015). Investigating the impacts of herbivory on Arctic vegetation and its recovery after herbivory would contribute to a refined understanding of the response of tundra ecosystems to climate change.
Small rodents, especially lemmings, in the Arctic tundra of Alaska are important herbivorous consumers of plants and prey species for larger animals (Le Vaillant et al., 2018). Throughout the Arctic, lemmings are by far the most abundant and widespread rodent species, and are identified as keystone species in tundra environments (Krebs, 2011). As dominant year-round grazers in the tundra, lemmings may heavily impact plant productivity (Olofsson et al., 2014). The site of our research, Utqiaġvik, Alaska, was an ideal site for studying the impact of lemmings on vegetation, as it has been reported that brown lemmings (Lemmus trimucronatus) deplete 100 times more primary production than caribou, a much larger herbivorous mammal that migrates throughout the Alaskan Arctic (Batzli et al., 1980). Due to their life history characteristics and abundance, lemmings can have a significant influence on the surrounding environment. Lemmings experience cyclic population dynamics where their population density oscillates, changing community interactions (Soininen et al., 2017). Lemming grazing during population peaks can dramatically affect vegetation (Olofsson et al., 2012) and therefore greenhouse gas fluxes from Arctic tundra. Given the amount of vegetation consumed by lemmings, their presence could have substantial impacts on the carbon balance of tundra ecosystems. However, despite the role of lemmings as keystone herbivores, the direct impact of their vegetation consumption on the carbon cycle of Arctic tundra in Alaska is still largely unknown, with few published studies evaluating the role of lemming herbivory on the Arctic carbon balance and vegetation (Lara et al., 2017; Lindén et al., 2021; Metcalfe and Olofsson, 2015; Min et al., 2021).
Most of the studies analyzing the effects of lemmings on vegetation have focused on ecosystem functioning in the absence of lemmings (Lara et al., 2017; Lindén et al., 2021; Min et al., 2021), the impacts of lemming waste products and carcasses on nutrient cycling and vegetation (McKendrick et al., 1980; Roy et al., 2020), the disturbance to soil via turnover by burrowing and fecal production (McKendrick et al., 1980), and recruitment and loss of forest vegetation (Ericson, 1977). The current body of literature does not explore the direct impact of lemming presence on carbon cycling and vegetation recovery, leaving a crucial gap in our understanding of how one of the main herbivores influences this rapidly changing ecosystem, especially in light of Arctic warming. Since population cycles vary by species and region (Reid et al., 1995), qualitative predictions on how brown lemmings would alter Arctic vegetation and carbon cycling are uncertain.
In this study, we used enclosures to directly quantify impacts of lemming herbivory on tundra carbon cycling, both immediately after herbivory and during the following growing season to examine vegetation recovery after 1 year. Thus far, very few studies (Johnson et al., 2011; Lara et al., 2017; Lindén et al., 2021; long-term exclosures) have investigated the effect of lemming herbivory on the tundra carbon cycle, including the timing of recovery of vegetation after lemming herbivory. By using enclosures to manipulate the number of lemmings per plot and observe a direct impact of lemming presence during peak annual activity, our study quantified the short-term effects of vegetation removal from lemming herbivory on carbon fluxes and the timing of vegetation recovery in the Alaskan Arctic.
The short-term effects of brown lemmings' herbivory on Arctic vegetation and carbon fluxes and longer-term recovery are critical to understand how lemmings might influence tundra environments. For this purpose, we measured the impact of brown lemmings on vegetation in summer 2018 across a variety of plots in a wet-sedge tundra ecosystem in the Alaskan Arctic. Then, in summer 2019, we measured vegetation in the plots again to evaluate vegetation recovery from lemmings' grazing. The goal of this experiment was to understand (1) how brown lemmings affect vegetation through herbivory and disturbance, and therefore how they could impact the Arctic tundra carbon cycle and photosynthetic capacity of vegetation, and (2) the rate of vegetation recovery after brown lemming herbivory.
We hypothesized that lemmings, given their high rate of vegetation consumption, would have a negative impact on net CO2 sequestration by vegetation, but due to the rapid regrowth of the annual vascular plants they preferentially consume, the vegetation would fully recover in terms of biomass and CO2 sequestration the growing season following grazing. We expected CH4 emission to decrease in response to herbivory, given the reduction in the biomass of vascular plants. Our broader goals were to increase our understanding of how the foraging behaviors of these herbivores impacted CO2 and CH4 fluxes and the photosynthetic capacity of plants in the Alaskan Arctic environment, which we hoped would further public interest in the understanding of complex interactions in the Arctic and relationships that may exist between climate change, herbivory, and predator–prey interactions.
2.1 Study location
This study was carried out in Utqiaġvik (formerly Barrow), Alaska (Fig. 1a). Located in the Arctic Coastal Plain, Utqiaġvik comprises polygonal ground (flat-, low-, and high-center ice-wedge polygons) that covers roughly 65 % of the land cover (Billings and Peterson, 1980). The major vegetation type at this site is graminoid-dominated wetlands, consisting of mosses, lichens, graminoids (grasses), and wet sedges (Davidson et al., 2016).
The study area was located near the Barrow Atmospheric Baseline Observatory, an atmospheric monitoring site managed by the National Oceanic and Atmospheric Administration (NOAA) (Fig. 1b), approximately 2 km south of the Arctic Ocean (71∘19′21.10′′ N: 156∘36′33.04′′ W). This site was near a pre-established remote flux and meteorological tower monitored by the Global Change Research Group (Goodrich et al., 2016) and had substantial lemming populations relative to other Arctic tundra areas in Alaska (Ott and Currier, 2012).
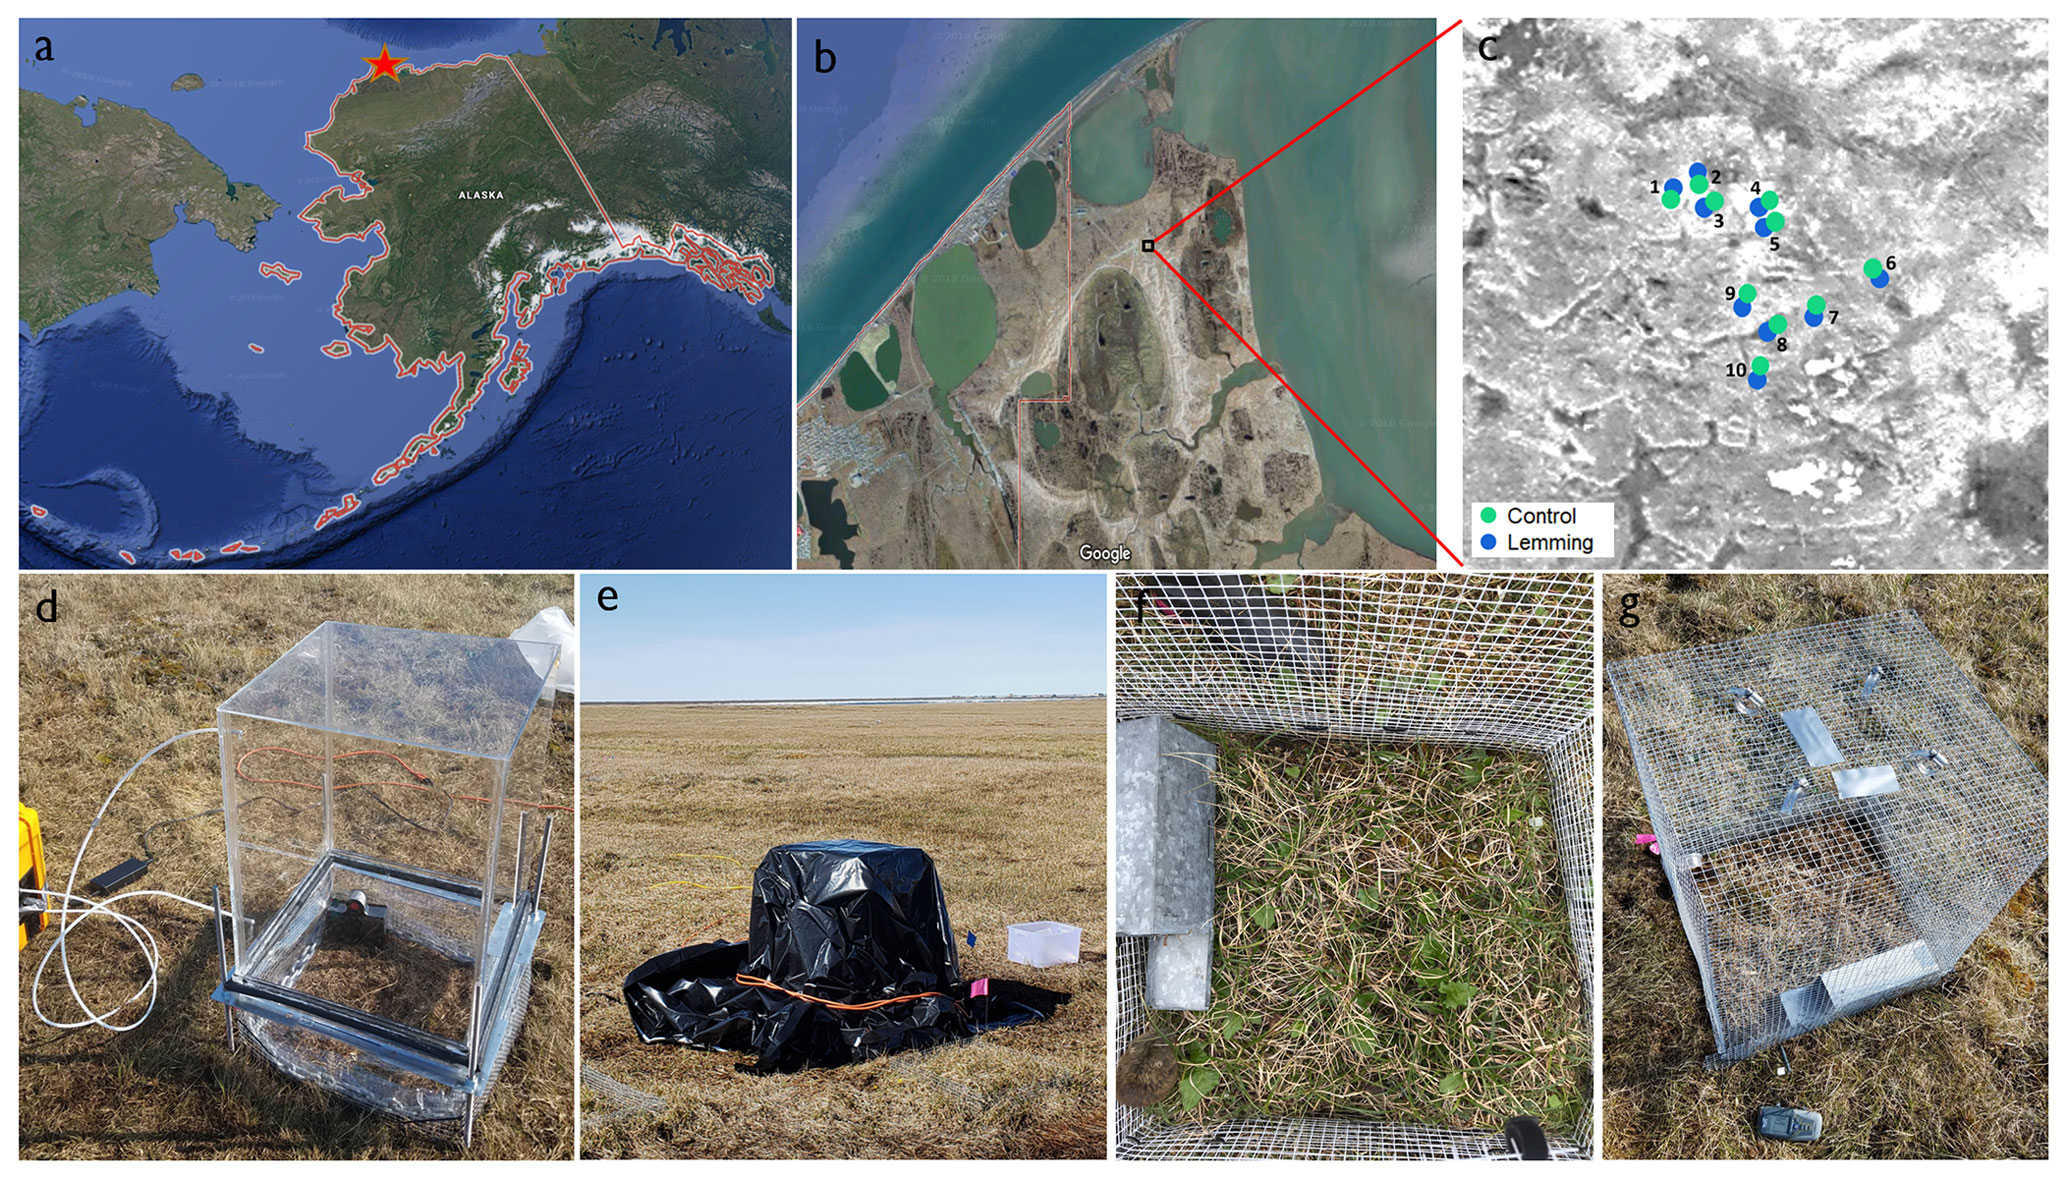
Figure 1(a) The location of the study site, Utqiaġvik (Barrow), in Alaska (© Google Maps 2018, imagery from TerraMetrics) represented by a red star, (b) location of the sampling site (© Google Maps 2018, imagery from TerraMetrics), (c) distribution of the sampling plots on an image created using the coordinates of the plots in the statistical program R (Worldview-3 panchromatic imagery taken 24 July 2016, Maxar Technologies), (d) chamber used for the greenhouse gas flux measurements, (e) chamber covered by light-blocking material, and (f, g) enclosures installed at each of the plots during the manipulation experiment.
2.2 Brown lemmings as a study species
Within the Arctic ecosystem of Alaska there are two species of lemmings: brown lemmings (L. trimucronatus) and northern collared lemmings (Dicrostonyx groenlandicus). Brown lemmings tend to be distributed among lower and middle Arctic tundra subzones (Stenseth, 1999). Although both brown and collared lemmings are found in Utqiaġvik, brown lemmings are more abundant in this region due to their preference for wetter habitats with relatively high-quality vegetation from lowlands (Batzli et al., 1983). Northern collared lemmings occupy drier habitats and, as a result, are not as profuse and influential on vegetation in wet regions of the Alaskan Arctic such as Utqiaġvik (Batzli et al., 1983; Krebs et al., 2011; Morris et al., 2000).
2.2.1 Brown lemming consumption habits
Brown lemmings mostly consume graminoids in the summer and mosses in the winter (Batzli and Jung, 1980). Brown lemmings can consume much more than predicted by general trends of terrestrial vertebrates (EPPO, 1994), consuming up to eight times their body weight each day (Stenseth and Ims, 1993). Thus, their extreme capacity for consumption, combined with their cyclic elevated population densities in the region, can result in high vegetation removal. To wit, during winter lemmings destroy or uproot up to 90 %–100 % of surrounding aboveground biomass within their foraging range (Stenseth and Ims, 1993). Arctic vegetation consumed by lemmings is generally nutrient poor (Batzli et al., 1980). Brown lemming digestive efficiency tends to be low, digesting only about 30 % of ingested food (Batzli et al., 1980). Due to consistent year-round activity and their small body size, lemmings also have a high metabolic rate. Low nutrient content, low digestive efficiency, and a high metabolic rate result in lemmings requiring a high rate of food intake for survival.
To reduce the risk of detection by predators (snowy owl, parasitic jaeger (i.e., arctic skua), arctic fox, and ermine), lemmings forage on small areas near their burrows and maximize their foraging in these areas until their primary food source is depleted, at which point they move to a new area of vegetation near a burrow or runway (Erlinge et al., 2011). This behavior shapes their foraging habits and leads to a higher concentration of grazing on vegetation close to burrows and runways (Erlinge et al., 2011). As a result, approximately 95 %–100 % of graminoid shoots are repeatedly clipped by lemmings occupying burrows and visiting runways in the immediate vicinity of the vegetation, and as the distance from the burrows and runways increases, clipping becomes patchier and the intensity of clipping on vegetation decreases (Batzli et al., 1980).
2.2.2 Brown lemming population
Populations of brown lemmings tend to reach peak densities every 3–5 years and then steeply decline (Stenseth, 1999). Interactions between lemming populations as fast-growing consumers and plant populations as slowly recovering resources represents a bitrophic system (Ims and Fuglei, 2005). In this system, vegetation could be heavily damaged by overgrazing during peak years of lemming abundance.
A report on the monitoring of lemming abundance and distribution (Ott and Currier, 2012) estimated brown lemming density near Utqiaġvik in 2012 to range from 5 to 65 lemmings per hectare. However, basic population density estimates may underestimate the impact lemmings have on some vegetation due to an increased concentration in grazing very close to burrows and runways (Erlinge et al., 2011). To estimate abundance, Ott and Currier (2012) also used baited Sherman traps, a live-trapping technique that may lead to an underestimate of the actual population density for this species, as brown lemmings are not readily recaptured using baited Sherman traps. We found manual capture techniques to be much more effective than baited traps.
2.3 Sampling plan and experimental design
We performed this experiment over two summer growing seasons. During the first season (summer 2018), we used enclosures to ensure even lemming herbivory pressure in each of our experimental plots. We manually captured the lemmings used in this first season shortly after peak growing season (3–10 August), coinciding with accelerated lemming reproduction and peak population density. We captured the lemmings in close proximity to our sampling sites while conducting visual encounter surveys, and secured them in Sherman traps with cotton nestlets and vegetation (grasses and sedges). Our samples included both juvenile and adult life stages. We released or avoided capturing any sick, very slow, or noticeably pregnant lemmings. After capture, we relocated lemmings to the study site for inclusion in the experiment. Like voles (close relatives of lemmings), lemmings have distinct preferences for habitats containing their preferred food items (Batzli and Henttonen, 1990), which we specifically selected for when designing the location of the experimental plots in this study in order to represent realistic effects of lemming herbivory.
We established 10 plot sets for this experiment. Each of the 10 plot sets included a lemming plot paired to a control (no-lemming) plot nearby (20 plots in 10 sets total) (Fig. 1c). Each plot contained different vegetation types (mosses, lichens, graminoids, and wet sedges), and the control and lemming plot in each plot set was ensured to be as similar in composition as possible in order to minimize biases due to spatial heterogeneity in vegetation and other landscape characteristics influencing vegetation and carbon fluxes (a more in-depth analysis of these vegetation types was completed by Davidson et al., 2016). We placed control plots within 1 m of their paired lemming plot to keep environmental factors as similar as possible within plot sets; we placed plot sets approximately 3 m away from each other. Plots were 50×50 cm in size; in each plot we dug a galvanized hardware cloth with a 0.5 in. grid down through the thawed soil to the permafrost and up to 60 cm above the surface (Fig. 1f and g). We selected the size of these plots to be consistent with a similar lemming exclosure experiment by Eskelinen and Virtanen (2005) in Finland. This size was also similar but a bit larger than the experimental plots in the study by Lara et al. (2017) near Utqiaġvik, Alaska, which used 30×30 cm chamber bases within their exclosures. Control plots not only excluded lemmings for the duration of the experiment, but also served as a control for the soil and vegetation disturbance resulting from digging galvanized hardware cloth into the soil. Plots that included lemmings also included a top portion of hardware cloth that prevented lemmings from escaping via climbing and prevented predators from removing the lemmings during the experiment. Inside each enclosure with a lemming was a locked-open Sherman trap with cotton nestlets for protection from environmental elements.
Because rodents may experience physiological stress after being captured (Fauteux et al., 2018a), prior to the experiment we kept the lemmings in small individual cages made of hardware cloth with a locked-open Sherman trap for shelter, cotton nestlets for warmth, and vegetation for nutrition for at least 1 h to help them acclimate. After this acclimation period, we placed the lemmings in their individual plots for 16 h. We based the duration of the experiment on field trials we carried out for several weeks before the start of the experiment. These trials showed that 16 h was enough time to observe an average impact on the vegetation, visually similar to the effect lemmings have on areas near their burrows, but was not too long as to result in complete vegetation consumption, unrepresentative of most areas where lemmings forage. Our field trials revealed that keeping lemmings inside the enclosure for longer than 16 h (which varied with lemming size) led to a complete vegetation removal, an extreme scenario only observed in the very close proximity of the burrows and not representative of most of their foraging areas. We released the lemmings at the end of all these experiments in proximity to the locations where they had been captured.
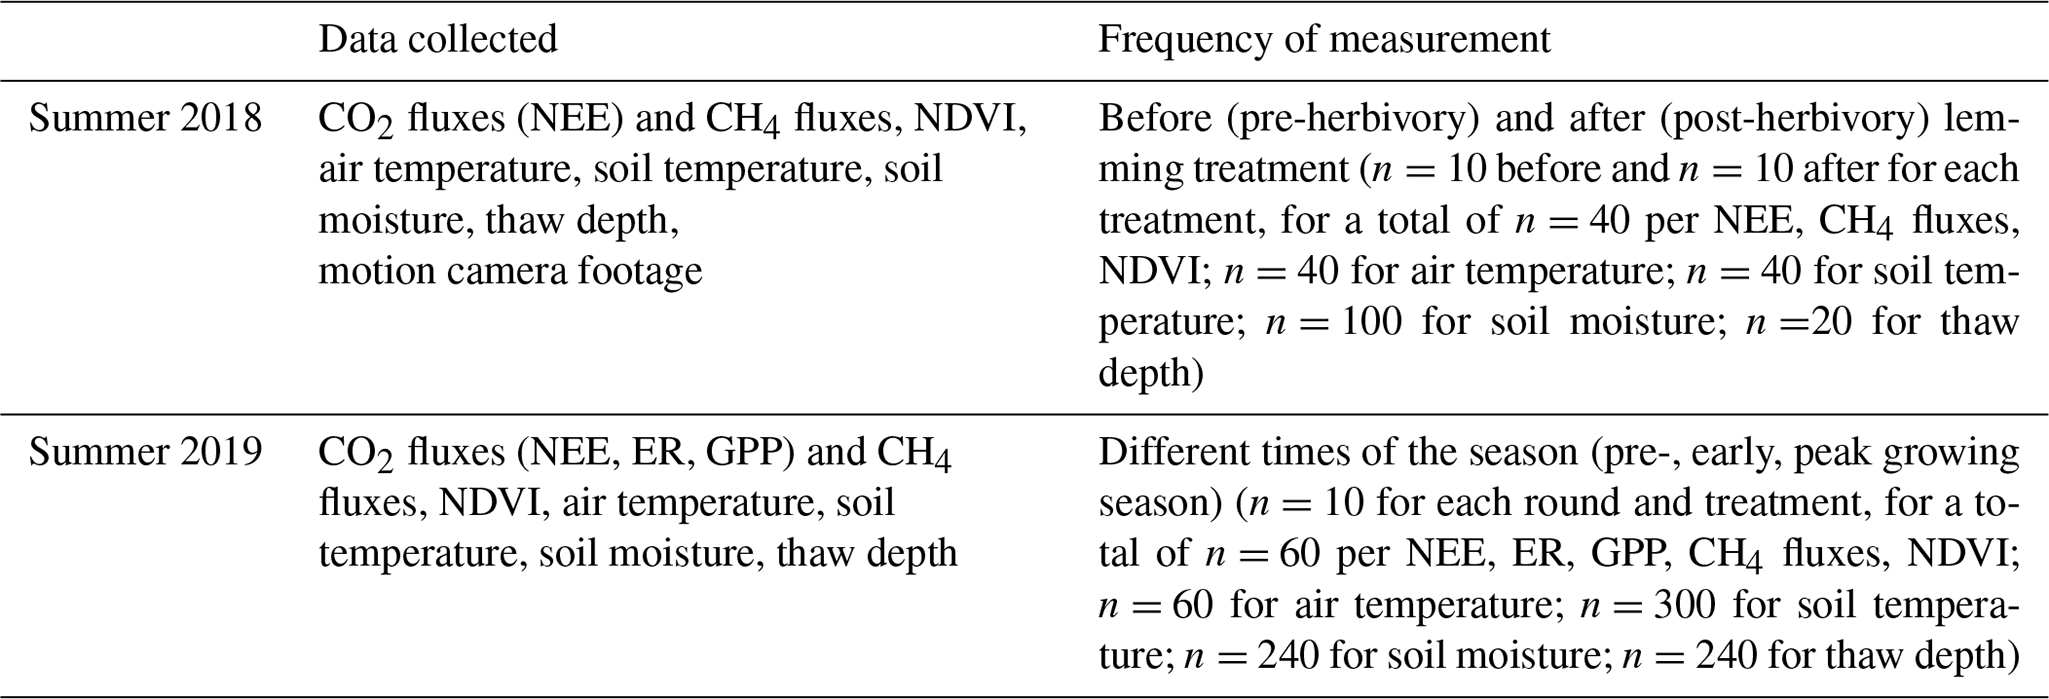
The subsequent season (summer 2019), we revisited the sample plots to measure the impact of lemmings 1 year after their grazing (24 June–7 August). During this season, we did not capture any lemmings, nor did we perform any additional manipulation. To be able to assess longer-term impacts of the manipulations carried out the previous summer, we collected measurements throughout the following summer (Table 1) to represent pre-, early, and peak growing season (hereafter defined as “rounds”). Sampling was carried out to monitor the timing of regrowth of photosynthetic tissue and recovery of the plants at different times of the season in 2019: 24–29 June (round one: pre-growing season), 9–19 July (round two: early growing season), and 29 July–7 August (round three: peak growing season).
Table 1Types of data collected and when they were measured during summer 2018 and summer 2019. All data were collected while lemmings were not present inside the experimental plots, except for the motion camera footage. NEE is defined as net ecosystem exchange, ER as ecosystem respiration, GPP as gross primary production, and NDVI as the normalized difference vegetation index.
There could have been other sources of herbivory (such as caribou), but these sources are not as frequent in these northernmost areas of the Arctic Coastal Plain. Additional sources of disturbance to vegetation could have originated from a drastic change in environmental conditions, such as extreme temperatures, extremely dry conditions, etc.; however, these would not have selectively removed the vascular plants while not affecting the moss layer, which is what we observed in this experiment.
2.4 Greenhouse gas fluxes and environmental variables measurements
We used a Los Gatos Research (LGR) Ultraportable Greenhouse Gas Analyzer (UGGA Model 915-0011) to measure CO2 and CH4 concentrations (currently, global mean atmospheric concentrations for CO2 and CH4 are approximately 417 ppm and 1909 ppb, respectively; NOAA GML, 2022) and air temperature over time in all plots during both summer seasons (2018 and 2019). We measured CO2 and CH4 concentrations 1 d after lemming removal from the plots in summer 2018 (exact time varied based on weather conditions and when plots were measured in temporal relation to other plots) and during the different rounds of the growing season in summer 2019. To collect measurements, we built a clear plexiglass acrylic chamber (Davidson et al., 2016; McEwing et al., 2015) to enclose the plots once the aboveground portion of the caging had been detached and the lemming had been removed (Fig. 1d). This chamber was placed on a metal frame positioned in the ground outside of the plots and had clear polyvinyl material weighed down by heavy metal chains to produce a seal inside the chamber. These measurements were performed in a closed loop, where tubes connected the chamber to the gas analyzer and then air was circulated back to the chamber. We positioned a small fan inside the chamber to ensure appropriate air mixing. We collected greenhouse gas concentrations in the absence of lemmings.
We used the rate of concentration change to calculate carbon fluxes using the chamber volume and area covered by vegetation (i.e., responsible for the carbon emission or uptake) as a function of time, as described in McEwing et al. (2015). The CO2 concentration change allowed us to calculate the net balance between the carbon uptake from photosynthesis and the carbon loss from respiration, also defined as the net ecosystem exchange (NEE), before and after the first summer's manipulations (2018), as previously described, and to track the seasonal development of NEE during the second summer (2019). In the second summer, we used a light-blocking material to cover the chamber (Fig. 1e) for determining CO2 ecosystem respiration (ER) and gross primary production (GPP) from NEE, calculated following Eq. (1):
and using the sign convention suggested by Chapin III et al. (2006). Since plant growth and photosynthetic uptake is restricted to the summer months in these Arctic ecosystems, we used GPP to indicate “the total amount of CO2 “fixed” by land plants per unit time through the photosynthetic reduction of CO2 into organic compounds” (Gough, 2011) during the time of measurements, rather than as an annual measurement.
We also measured a variety of environmental variables before and after each portion of the experiment (summer 2018) and during each round (summer 2019). These environmental variables included air temperature recorded by the LGR gas analyzer, soil temperature measured with a Thomas Scientific Traceable Kangaroo thermometer, soil water content recorded by a FieldScout soil moisture meter, and thaw depth using a metal probe marked every 5 cm. We examined these variables as controls that may explain shifts in CO2 and CH4 fluxes within the study area and to monitor if plots in each of the sets experienced similar abiotic conditions. This assured potential differences in carbon fluxes were due to our manipulation, and not different environmental conditions of various plots.
2.5 Camera footage and hyperspectral measurements
We quantified the impact of lemming herbivory and burrowing on vegetation using a Spectra Vista Corporation (SVC) HR-512i spectroradiometer, which measured spectral reflectance and recorded a picture of the vegetation being scanned. The spectroradiometer yielded hyperspectral measurements for vegetation in the 338.9–1075.1 nm spectral range with 512 bands and a bandwidth of ≤ 1.5 nm. We used the internal global positioning system (GPS) of the spectroradiometer to record geographic coordinates (latitude and longitude) for all plots to an accuracy of 2.5 m. We collected hyperspectral measurements in the absence of lemmings.
We measured total reflected spectral exitance from a blank white reference panel right before sampling each plot set (approximately every 20–30 scans, or 10–15 min) to estimate spectral irradiance based on reflectance calibration information provided for the reference panel. We recorded spectral surface reflectance before and after each experimental treatment (summer 2018) and at different times during the season in the following summer (2019) and used it to calculate the narrow-band normalized difference vegetation index (NDVI) to compare the photosynthetic capacity of vegetation in the plots. The NDVI is calculated as the normalized difference between reflectance in the near infrared wavelengths (800.5 nm) and red wavelengths (680.2 nm). Lower values of NDVI indicate no living vegetation and higher values indicate more green biomass.
We recorded a time-lapse of various parts of the experiment using a Brinno MAC200DN outdoor camera to collect motion-sensor video footage of lemming activity. The camera also allowed for revisitation and surface cover characterizations of the plots to classify and quantify vegetation types within each plot and assess how grazing had affected vegetation. We did not systematically record all trials on video, but instead used this technology as a qualitative tool to visually document the activity of the lemmings.
2.6 Statistical analyses
We used the statistical program R, version 3.5.1 (R Core Team, 2019), for our statistical analyses. We tested for normality using a Shapiro–Wilk normality test. The 2018 data were normally distributed (NEE P=0.489, NDVI P=0.816), except the CH4 data (P<0.001), which were right-skewed, so we log-transformed the CH4 data to help normalize them (P=0.284). After this transformation, we used linear mixed-effects models (with the package “nlme”; Pinheiro et al., 2018) to test for the significance between the different treatments. For the 2019 data, we used both linear mixed-effects models and non-parametric Kruskal–Wallis tests because we could not make all the data normal using the same transformation method (log transformation, square root transformation) for every round during the season. We also tested for equal variance using an F test and found there was no significant difference between the variances (treatments) in 2018 (NEE P=0.172, CH4 flux P=0.810, NDVI P=0.100) and 2019 (NEE P=0.441, ER P=0.650, GPP P=0.852, CH4 flux P=0.346, NDVI P=0.951).
We tested multiple variations of the linear mixed-effects models using the methods for model selection in ecology described in Zuur et al. (2009). We then plotted the models to examine the residuals of the data and found them to not appear heteroscedastic. For the 2018 models, we used treatment (control, lemming plots), time (before, after experiment), and their interaction as fixed factors in the models; for the 2019 models, we used treatment (control, lemming plots), round (pre-, early, and peak growing season), and their interaction as fixed factors in the models. In all analyses we used the plot identification (1C, 1E, 2C, 2E, etc.) nested within the plot set (1–10) as random factors. Mixed models allow us to account for temporal and spatial pseudoreplication and to test the significance of the interactions among factors. When fixed factors were significant, we conducted a pairwise analysis via a Tukey post-hoc test (with the package “emmeans”; Lenth et al., 2019) to investigate the interacting effects in the model.
To identify the effect of the manipulation on carbon fluxes and NDVI, we applied the linear mixed-effects models and tested for differences in each environmental variable before and after lemming exposure in summer 2018. We then used the statistical analyses to help us explore if the post-lemming experimental plots showed a significant change in carbon fluxes and NDVI when compared with pre-lemming experimental plots (2018), and whether the carbon fluxes and NDVI varied between treatments the following growing season (2019). Our analysis of the NDVI from spectral indexes provided us with information on changes in plant biomass before and after each manipulation in summer 2018 and vegetation regrowth in summer 2019.
3.1 Environmental variables
Environmental controls on CO2 and CH4 fluxes such as air temperature, soil temperature, thaw depth, and soil moisture were similar between the control and experimental plots in 2018 (Fig. A1a–h) and 2019 (Fig. A1i–p). During summer 2018, air temperature (P=0.542), soil temperature (P=0.960), thaw depth (P=0.683), and soil moisture (P=0.619) were not significantly different between control plots and lemming plots; during summer 2019, air temperature (P=0.887), soil temperature (P=0.060), thaw depth (P=0.512), and soil moisture (P=0.387) were not significantly different between the control and lemming treatments.
3.2 Carbon fluxes
The presence of lemmings significantly impacted CO2 fluxes (i.e., NEE) during summer 2018 when the lemming enclosure treatment was implemented. Before the treatment, calculated NEE (Fig. 2a) and CH4 fluxes (Fig. 3a) for the control and lemming plots were similar. After the lemming experiment (and removal of the lemmings from the experimental plots), the net CO2 uptake decreased significantly (P<0.001; Fig. 2a). In this context, net CO2 uptake by vegetation, or carbon dioxide sequestration, was the removal of CO2 from the atmosphere and its storage in the above- and belowground biomass through photosynthesis after accounting for the carbon loss through respiration. Therefore, when lemmings consumed the photosynthetic tissues of the vegetation (aboveground biomass), the vegetation was no longer able to uptake CO2 from the atmosphere, and NEE (the net ecosystem exchange equivalent to the net CO2 fluxes) approached either zero or became less negative. (A negative sign implies more carbon removal from the atmosphere.) By the end of summer 2018, the effect of brown lemmings' herbivory changed the mean NEE for lemming plots from −0.074 ± 0.012 gC-CO2m−2 h−1 (i.e., net CO2 sequestration) to 0.003 ± 0.012 gC-CO2m−2 h−1 (i.e., net CO2 fluxes were around zero). Contrary to what we expected, CH4 flux values did not significantly differ between control plots and plots subjected to lemmings' herbivory (P=0.989; Fig. 3a).
In summer 2019, we measured NEE and CH4 fluxes again, and additionally calculated ER and GPP. During this second summer of measurements, results of the linear mixed-effects models for NEE, ER, GPP, and CH4 fluxes were all not significantly different between control and lemming plots (NEE P=0.834, Fig. 2b; ER P=0.742, Fig. 4a; GPP P=0.716, Fig. 4b; CH4 flux P=0.869, Fig. 3b). These results were consistent with those of the Kruskal–Wallis test, which found there was no significant difference between the treatments in 2019, either by testing the data set all together (NEE P=0.769, ER P=0.221, GPP P=0.513, CH4 flux P=0.824) or separating it for different times of the season (rounds) and testing each time separately (pre-growing season: NEE P=0.245, ER P=0.672, GPP P=0.296, CH4 flux P=0.728; early growing season: NEE P=0.853, ER P=0.600, GPP P=0.558, CH4 flux P=0.638; peak growing season: NEE P=0.293, ER P=0.366, GPP P=0.212, CH4 flux P=0.970).
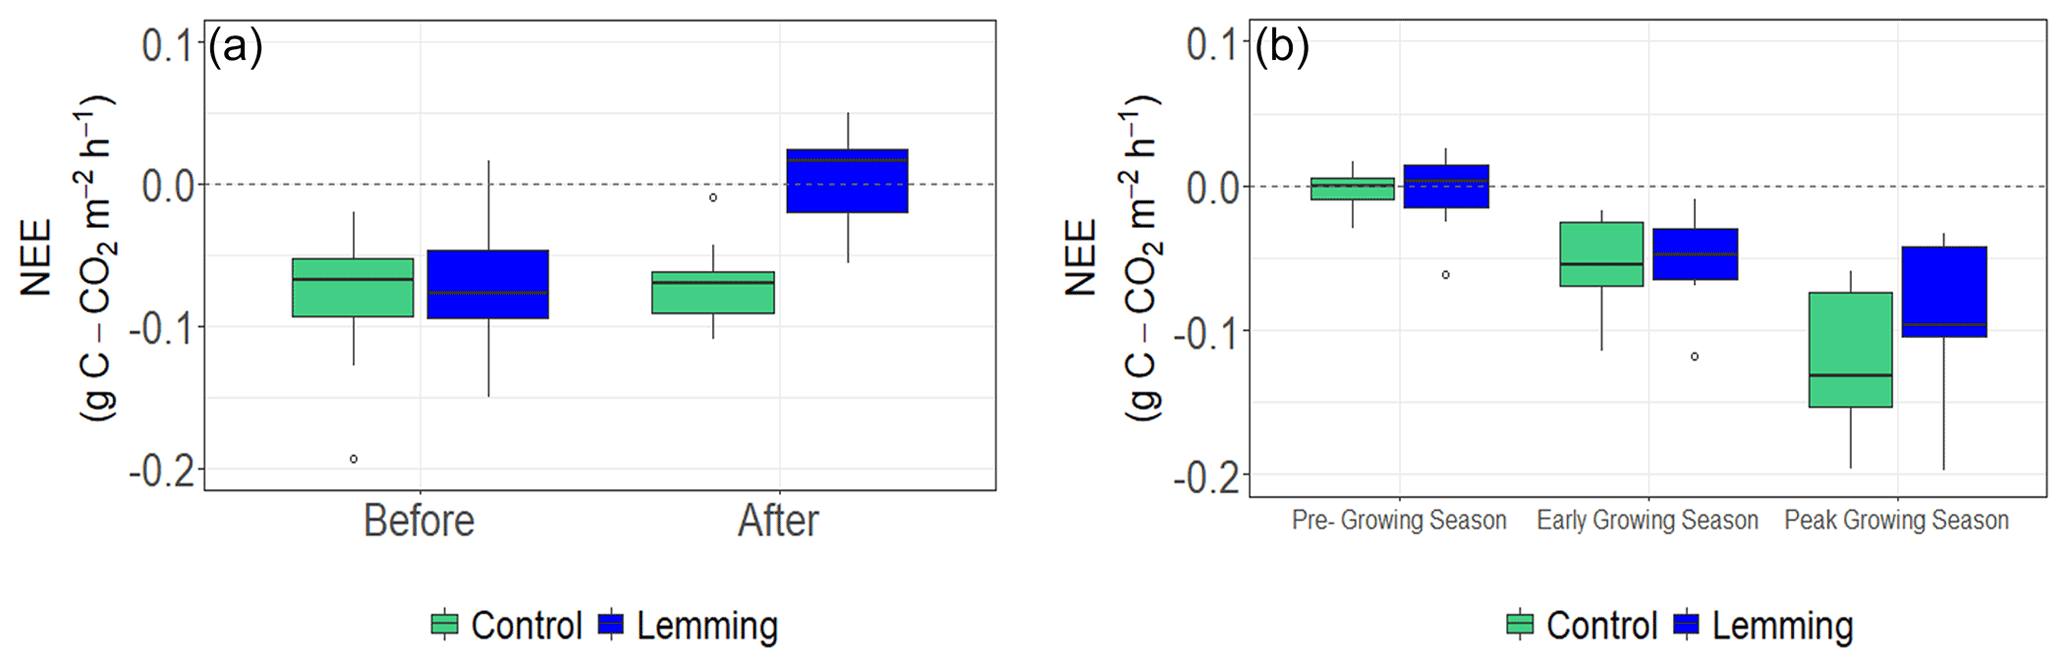
Figure 2Box and whisker plots of 2018 and 2019 NEE for the control and lemming plots. Negative flux values indicate carbon sequestration/uptake from the atmosphere by vegetation through photosynthesis and positive flux values indicate carbon emission/loss into the atmosphere. (a) Median NEE for plots before and after the experiment in summer 2018 (T=4.62, P<0.001), and (b) median NEE for plots during the three rounds of measurements in summer 2019 (T=0.21, P=0.834).

Figure 3Box and whisker plots of 2018 and 2019 CH4 fluxes for control and lemming plots. Negative flux values indicate uptake from the atmosphere and positive flux values indicate emission to the atmosphere. (a) Median CH4 flux for plots before and after the experiment in summer 2018 (T=0.01, P=0.989), and (b) median CH4 flux for plots during the three rounds of measurements in summer 2019 (, P=0.869).
3.3 Hyperspectral surface reflectance and NDVI
Spectral reflectance derived from spectroradiometric radiances generally increased across visible and near infrared wavelengths after lemmings' vegetation removal (Fig. S1 in the Supplement). Before placing lemmings in enclosures, control and lemming plots exhibited similar surface reflectance values, while reflectance curves showed more substantial separation after lemming removal (Fig. S1). Analyzing the surface reflectance of the same control and lemming plots revisited in summer 2019 revealed that the reflectance values for these different treatments were alike in each plot set, similar to what was observed before the beginning of the manipulation experiment (Fig. S2b in the Supplement).
To better quantify the changes in reflectance, we calculated the NDVI in all the control and treatment plots in both summer 2018 and 2019. Following lemming removal in the first summer, lemming plots had significantly lower NDVI than the control plots (P=0.015; Fig. 5a), consistent with the decrease in green biomass observed in the photographs collected before and after placing the lemmings in the treatments' enclosure (Fig. S1), and with the decreases in net CO2 uptake (see NEE close to zero after lemming vegetation consumption; Fig. 2a). The effect of brown lemmings' herbivory changed the mean NDVI for lemming plots from 0.551 ± 0.021 to 0.465 ± 0.021. During the second summer, median NDVI values of all plots were similar (Fig. 5b). Results of the linear mixed-effects model reveals that during this time, there was no significant difference in NDVI when comparing control plots with lemming plots (P=0.692), which is consistent with the results of the Kruskal–Wallis test that found no significant difference between the treatments in 2019 either by testing the data set all together (P=0.694) or separating it for different times of the season (rounds) and testing each time separately (pre-growing season: P=0.260; early growing season: P=0.418; peak growing season: P=0.283). There was a significant difference in NDVI across the rounds (P<0.001), which coincides with the increased green biomass observed in collected photographs from pre- to early to peak growing season (Fig. S2a in the Supplement).
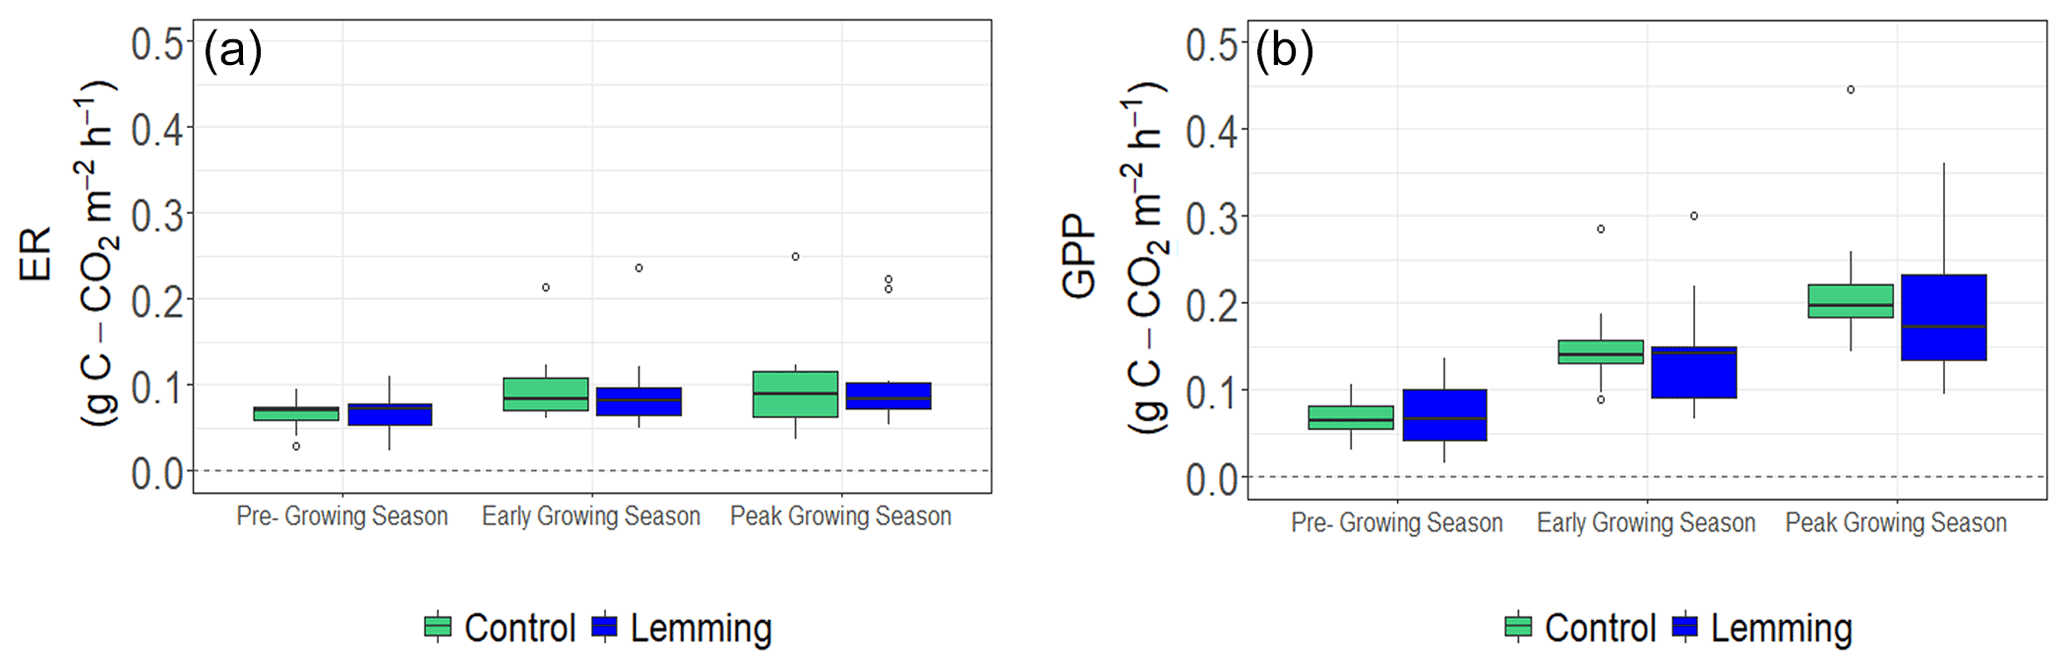
Figure 4Box and whisker plots of ER and GPP for control and lemming plots during the three rounds of data collection in summer 2019. Positive flux values indicate a positive respiration (carbon loss into the atmosphere) and a positive carbon uptake by vegetation through photosynthesis. (a) Median ER (, P=0.742), and (b) median GPP (, P=0.716). The signs of ER and GPP are always positive, but if ER is more than GPP, then the ecosystem is a carbon source into the atmosphere (with a positive sign of NEE).

Figure 5Box and whisker plots of 2018 and 2019 NDVI values for control and lemming plots. (a) Median NDVI for plots before and after the experiment in summer 2018 (, P=0.015), and (b) median NDVI for plots during the three rounds of measurements in summer 2019 (T=0.41, P=0.692). Higher vascular plant green biomass in the pre-lemming treatment plots presented NDVI values in the 0.6–0.7 range, whereas post-lemming treatment plots in 2018 exhibit NDVI values around 0.5.
We found, within a short-term enclosure experiment, that brown lemmings' herbivory significantly decreased net CO2 uptake immediately after consumption of vegetation while surprisingly not affecting CH4 fluxes. Consumption of photosynthetically active plant tissue by lemmings impacted the ability of the vegetation to sequester CO2, nullifying CO2 uptake by tundra vegetation. The lack of significant difference in the evaluated environmental variables (air temperature, soil temperature, soil moisture, and thaw depth) between the control and lemming treatment plots suggests that these factors did not play a significant role in the difference in net CO2 fluxes before and after the treatments during the first summer. Therefore, we assume that the vegetation removal was the main reason for the decrease in the ability of the ecosystem to sequester carbon. Unfortunately, the design of this experiment, mostly focusing on the aboveground measurements (except for the soil temperature, soil moisture, and thaw depth), did not allow for identifying the contribution of belowground increased decomposition from the aboveground vegetation removal.
Notably, lemmings' herbivory did not affect CH4 fluxes, even though sedges have an important role in facilitating CH4 transport from deeper soil layers (and ultimately emissions into the atmosphere) in tundra ecosystems (Lai, 2009; McEwing et al., 2015), and also provide substrate for methanogenesis, which should increase CH4 production and emission (Bridgham et al., 2013). The lack of a significant effect on CH4 fluxes may have been due to the location of vegetation removal on consumed plants. Kelker and Chanton (1997) showed that the location of the clipping of vegetation affects the CH4 emissions: belowground clipping at the root–shoot or porewater–root boundary is more likely to impact CH4 emission, but aboveground clipping is less likely to affect CH4 emission. This differential effect is likely related to the location of CH4 escape though vegetation, which is just at the root–shoot or porewater–root boundary (Kelker and Chanton, 1997). Moreover, vegetation can have an impact on stimulating CH4 through labile carbon exuded by the roots (McEwing et al., 2015; Ström et al., 2003; Zona et al., 2009). Methanogenesis is fueled by labile carbon, aiding in CH4 production in the Arctic (Tan et al., 2015). Labile carbon released by root exudation depends on photosynthetic activity of vegetation and ultimately stimulates CH4 emission (Bhullar et al., 2014; Ström et al., 2003). The lack of response of CH4 emissions to vegetation removal could be explained by the large soil carbon stored in these permafrost soils (Hugelius et al., 2014). A decrease in labile carbon exudation due to vegetation removal from herbivory may have not been limiting CH4 emissions, consistent with a lack of response in CH4 emissions with a labile carbon addition in these sites (von Fischer et al., 2007; Zona et al., 2009).
Moreover, when measured shortly after the lemming treatment, the CH4 emission in the plots may have been inhibited by lemming urine. Ammonium from urine has been linked to an increase in CH4 production (Lin et al., 2009); however, it has been found that CH4 fluxes can initially result in a mean negative flux shortly after the addition of urine to the system (Boon et al., 2014). The timing in which we measured the greenhouse gases after the lemming treatments falls within the initial window of time found by Boon et al. (2014) to have this effect; thus, urine produced by the lemmings in the plots may have nullified the positive CH4 emissions via the aerenchyma. Without further investigation into the soil chemistry, it is difficult to determine which mechanisms of herbivore–plant interactions resulted in the lack of significance in CH4 emission.
As expected, the biomass of vegetation decreased during summer 2018 due to the impact of lemming consumption (Fig. S1). The control and experimental plots before the lemming treatment had relatively high and similar mean NDVI values (Fig. S1), suggesting their biomass had similar values (Goswami et al., 2015). Vegetation removal by brown lemmings significantly lowered the mean NDVI of the plots subjected to lemming herbivory. By summer 2019, the mean NDVI value of these same lemming plots indicated that the vegetation was fully recovered from the lemmings' impact the previous summer. Measurements collected the summer following our herbivory experiment (2019) revealed that the vegetation recovery after brown lemming disturbance was rapid and quickly regrew to a condition comparable to that found in 2018, prior to lemming consumption. Since lemmings mostly consume vascular plants, such as graminoids and sedges, in the summer and avoid non-vascular and slower growth vegetation, such as mosses and lichens (Batzli et al., 1980), the preferential consumption of annual grasses and sedges likely led to the rapid recovery of the photosynthetic capacity of vegetation we observed in just 1 year. From analysis of the motion-sensor video footage, we observed lemming foraging within the plots was representative of these vegetation preferences. This is consistent with the vegetation being mostly dominated by grasses and sedges in the sites of this research (Davidson et al., 2016).
While our experiment showed a potentially substantial impact of lemming herbivory on the CO2 fluxes from these tundra ecosystems, we did not address the impact of varying degrees of intensity of herbivory and population cycling of brown lemmings on carbon fluxes and photosynthetic capacity of different vegetation communities. Roy et al. (2020) found that herbivore presence can alter communities of vegetation differently, as herbivores play a role in regulating a variety of plant species. These herbivores can lead to significant changes in the abundance of vegetation types, allowing for the potential of the tundra during the peak growing season to switch between a carbon source to sink in the absence of herbivory (Min et al., 2021). Since brown lemmings rely on a high rate of food intake to sustain growth and reproduction (Batzli et al., 1980) and experience population cycles with distinct seasonal and multiannual density fluctuations (Reid et al., 1995; Stenseth, 1999), rapid consumption of plant matter by lemmings as sustenance during population peaks may significantly contribute to shifts in plant communities and, thus, carbon cycle changes.
Since lemming population densities vary in response to multiple environmental factors (Fauteux et al., 2015; Soininen et al., 2017), predicting a “normal” level of herbivory for this species is very challenging. Reports on estimated brown lemming density have found their local density to range from 5 to 65 lemmings per hectare (Ott and Currier, 2012; Alaskan Arctic) and about zero to nine lemmings per hectare (Fauteux et al., 2015; Canadian Arctic), which is variable and may be an underestimate due to the use of live trapping, as mentioned previously. Moreover, in addition to space, it is important to consider time: we only kept lemmings inside the plots for 16 h and there was no effect of lemming herbivory for the remainder of the experiment. The most relevant comparison we could find to define the degree of herbivory observed was the effect on vegetation near lemming burrows and runways in a similar ecosystem (e.g., Siberian tundra; Erlinge et al., 2011). Given the sparsity of available literature and data from these understudied Arctic ecosystems, it is difficult to categorize our lemming treatment as having some sort of “normal” or “heavy” impact on vegetation, which would be required to explore legacy effects of lemming herbivory.
Lemming populations may also vary in response to regulation by predators (Fauteux et al., 2018b), and predation risk may change lemming physiological response and foraging behavior (Hawlena and Schmitz, 2010). In many terrestrial systems, indirect effects of predator presence on herbivores have been shown to have dramatic effects on vegetation consumption (Apfelbach et al., 2005; Borowski, 1998), with resulting behavioral changes rippling through the ecosystem (Ripple and Beschta, 2003). Given the substantial impact of lemming herbivory on the tundra carbon balance, indirect cues indicating predator presence may alter lemming behavior and thus vegetation. If predator cues elicit a fear response in the lemmings, thereby decreasing the time spent consuming vegetation, this change in behavior may decrease the severity of lemmings' impact on vegetation and carbon cycling, specifically their negative effect on CO2 sequestration. The influence of predator–prey interactions on herbivory, and how they further impact vegetation and carbon fluxes in the Arctic tundra, should be quantified by future studies to better understand multifaceted interactions in the Arctic (see Supplement).
We show that there is an immediate effect of lemmings on plant biomass and net CO2 uptake by Arctic vegetation, but not on CH4 fluxes in areas where lemmings forage. However, impacts on vegetation are temporary, and plant biomass and net CO2 uptake can recover to previous conditions by the end of the subsequent growing season. To further our understanding of the complex interactions in the Arctic, it is vital to also explore the longer-term feedbacks that may exist between climate change, herbivory, and predator–prey interactions. The effects of warming on snow cover and plant growth, as crucial environmental resources to lemmings, could lead to drastic population changes for lemmings, and the longer-term effect of lemmings' herbivory on vegetation might not be captured by a short-term manipulation. It is also critical to link the long-term lemming population fluctuations to potential shifts in vegetation and climate change. Additionally, climate change is likely to also alter the abundance, behavior, or even occurrence of predators of lemmings, which may in turn impact lemming abundance and foraging behaviors. For these purposes, longer-term and broader scale ecological data would be particularly valuable to build on the short-term effects highlighted in this study.
Overall, our study suggests that brown lemmings have the ability to significantly alter vegetation by consuming photosynthetic tissue, which hinders carbon sequestration by the vegetation and shifts CO2 fluxes in the areas surrounding their burrows and runways. We report that this effect is short-lived due to the preferential consumption by lemmings of plant species that quickly regrow and recover by the next growing season. However, the duration of the impacts of lemming herbivory may change in different vegetation communities, as various plant species might be affected differently. Thus, it is relevant to examine the effects of lemmings on a wide range of ecosystems to make regional estimates of their short-term influence on net CO2 fluxes and NDVI. Future research should also more carefully quantify the interactions between lemmings, their predators, and carbon cycling in the Arctic tundra ecosystem, which might explain some of the substantial interannual variability in the tundra CO2 fluxes not explained by environmental variables alone.
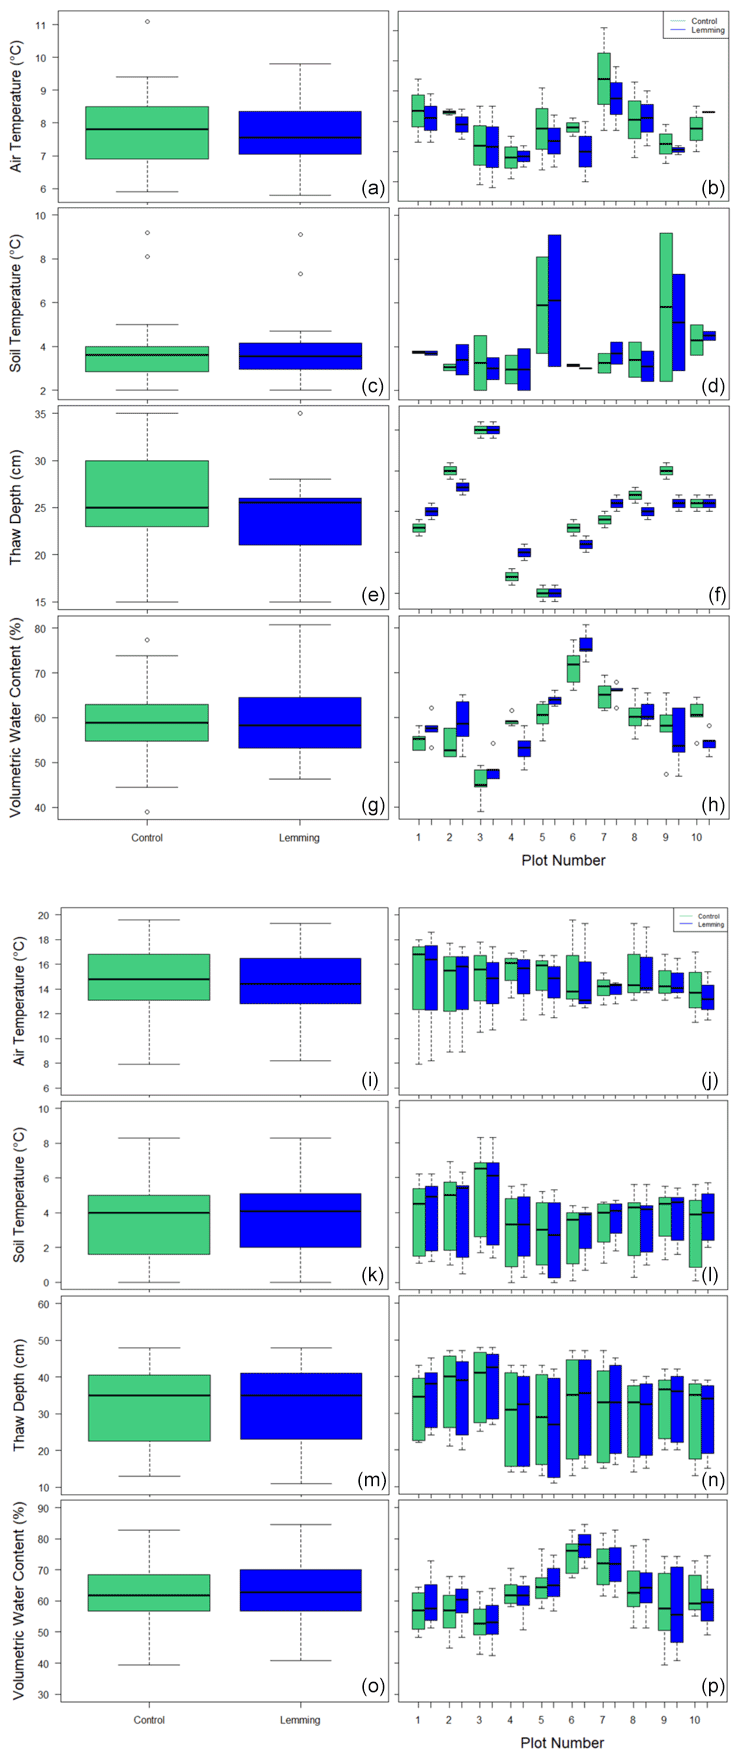
Figure A1Box and whisker plots of environmental variables across treatment plots during (a–h) summer 2018 and (i–p) summer 2019. Environmental variables include (a, i) air temperature for the entire data set, (b, j) air temperature by plot, (c, k) soil temperature for the entire data set, (d, l) soil temperature by plot, (e, m) thaw depth for the entire data set, (f, n) thaw depth by plot, (g, o) soil moisture for the entire data set, and (h, p) soil moisture by plot.
R codes generated for data analysis during this study will be archived to the Arctic Data Center by the corresponding author upon the journal's request.
Data on carbon fluxes, NDVI, and environmental variables analyzed during this study have been archived to the Arctic Data Center at https://doi.org/10.18739/A2S17ST8F (Plein et al., 2022). All relevant data are included as figures in the paper, and raw data may be made available upon request.
The supplement related to this article is available online at: https://doi.org/10.5194/bg-19-2779-2022-supplement.
Study conception and design were carried out by JP, RWC, WCO, and DZ. Material preparation, data collection, and data processing were completed by JP. Data scripts and codes were written by JP, KAA, and DZ. Data analysis was performed by JP and DZ. The drafts of the paper were written by JP and all authors commented on previous versions of the manuscript. All authors read and approved the final paper.
The contact author has declared that neither they nor their co-authors have any competing interests.
Publisher’s note: Copernicus Publications remains neutral with regard to jurisdictional claims in published maps and institutional affiliations.
We thank the Global Change Research Group for equipment use, field support, and suggestions on the project design. We also thank Nicholas Barber for help with statistical analyses, George Aguiar at Archipelago Farms for reindeer urine collection (see Supplement), and Lupita Barajas, Marco Montemayor, Thao Tran, and Brian Graybill for their efforts with field set-up/take-down and measurements. The authors thank the Polar Geospatial Center for the geospatial support. We express gratitude to NOAA for providing access to their observatory site, and especially Bryan Thomas for his expertise and guidance at the site. We thank the Ukpeaġvik Iñupiat Corporation (UIC) for the use of their laboratory, radios, and storage. The authors are also thankful to the Iñupiat people for sharing their culture and home with us. The welfare of the animals (lemmings) used in this study is indicated in the Alaska Department of Fish and Game permits 18-167 and 19-131 and the Institutional Animal Care and Use Committee (IACUC) Animal Protocol Form #16-08-014C.
This research has been supported by the Office of Polar Programs of the National Science Foundation (NSF) (award nos. 1204263, 1702797, and 1932900) with additional logistical support funded by the NSF Office of Polar Programs, by the NASA ABoVE (grant nos. NNX15AT74A and NNX16AF94A) Program, by the European Union's Horizon 2020 research and innovation program under grant agreement no. 727890, by the Natural Environment Research Council (NERC) UAMS Grant (NE/P002552/1), and by the NOAA Cooperative Science Center for Earth System Sciences and Remote Sensing Technologies (NOAA-CESSRST) under the Cooperative Agreement Grant (grant no. NA16SEC4810008).
This paper was edited by Paul Stoy and reviewed by V.M. Maire and two anonymous referees.
Apfelbach, R., Blanchard, C. D., Blanchard, R. J., Hayes, R. A., and McGregor, I. S.: The effects of predator odors in mammalian prey species: a review of field and laboratory studies, Neurosci. Biobehav. R., 29, 1123–1144, https://doi.org/10.1016/j.neubiorev.2005.05.005, 2005.
Batzli, G. O. and Henttonen, H.: Demography and resource use by microtine rodents near Toolik Lake, Alaska, USA, Arctic Alpine Res., 22, 51–64, https://doi.org/10.2307/1551720, 1990.
Batzli, G. O. and Jung, H. J. G.: Nutritional ecology of microtine rodents: resource utilization near Atkasook, Alaska, Arctic Alpine Res., 12, 483–499, https://doi.org/10.2307/1550496, 1980.
Batzli, G. O., White, R. G., MacLean, S. F., Pitelka, F. A., and Collier, B. D.: The herbivore-based trophic system, In: Brown, J., Miller, P. C., Tieszen, L. L., and Bunnell, F. L.: An Arctic ecosystem: the coastal tundra at Barrow, Alaska, Dowden, Hutchinson & Ross, Inc., Stroudsburg, PA, 335–410, https://doi.org/10.1575/1912/222, 1980.
Batzli, G. O., Pitelka, F. A., and Cameron, G. N.: Habitat use by lemmings near Barrow, Alaska, Ecography, 6, 255–262, https://doi.org/10.1111/j.1600-0587.1983.tb01089.x, 1983.
Bhullar, G. S., Edwards, P. J., and Venterink, H. O.: Influence of different plant species on methane emissions from soil in a restored Swiss wetland, PLoS ONE, 9, e89588, https://doi.org/10.1371/journal.pone.0089588, 2014.
Billings, W. D. and Peterson, K. M.: Vegetational change and ice-wedge polygons through the thaw lake cycle in Arctic Alaska, Arctic Alpine Res., 12, 413–432, https://doi.org/10.2307/1550492, 1980.
Boon, A., Robinson, J. S., Chadwick, D. R., and Cardenas, L. M.: Effect of cattle urine addition on the surface emissions and subsurface concentrations of greenhouse gases in a UK peat grassland, Agr. Ecosyst. Environ., 186, 23–32, https://doi.org/10.1016/j.agee.2014.01.008, 2014.
Borowski, Z.: Influence of predator odour on the feeding behaviour of the root vole (Microtus oeconomus Pallas, 1776), Can. J. Zool., 76, 1791–1794, https://doi.org/10.1139/z98-094, 1998.
Bridgham, S. D., Cadillo-Quiroz, H., Keller, J. K., and Zhuang, Q.: Methane emissions from wetlands: biogeochemical, microbial, and modeling perspectives from local to global scales, Glob. Change Biol., 19, 1325–1346, https://doi.org/10.1111/gcb.12131, 2013.
Chapin III, F. S., Woodwell, G. M., Randerson, J. T., Rastetter, E. B., Lovett, G. M., Baldocchi, D. D., Clark, D. A., Harmon, M. E., Schimel, D. S., Valentini, R., Wirth, C., Aber, J. D., Cole, J. J., Goulden, M. L., Harden, J. W., Heimann, M., Howarth, R. W., Matson, P. A., McGuire, A. D., Melillo, J. M., Mooney, H. A., Neff, J. C., Houghton, R. A., Pace, M. L., Ryan, M. G., Running, S. W., Sala, O. E., Schlesinger, W. H., and Schulze, E.-D.: Reconciling carbon-cycle concepts, terminology, and methods, Ecosystems, 9, 1041–1050, https://doi.org/10.1007/s10021-005-0105-7, 2006.
Davidson, S. J., Sloan, V. L., Phoenix, G. K., Wagner, R., Fisher, J. P., Oechel, W. C., and Zona, D.: Vegetation type dominates the spatial variability in CH4 emissions across multiple Arctic tundra landscapes, Ecosystems, 19, 1116–1132, https://doi.org/10.1007/s10021-016-9991-0, 2016.
Dias, A. T. C., Hoorens, B., Van Logtestijn, R. S. P., Vermaat, J. E., and Aerts, R.: Plant species composition can be used as a proxy to predict methane emissions in peatland ecosystems after land-use changes, Ecosystems, 13, 526–538, https://doi.org/10.1007/s10021-010-9338-1, 2010.
Ericson, L.: The influence of voles and lemmings on the vegetation in a coniferous forest during a 4-year period in northern Sweden, PhD dissertation, Umeå University, Umeå, Sweden, Larsson & Co., ISBN 91-85410-02-0, 1977.
Erlinge, S., Hasselquist, D., Högstedt, G., Seldal, T., Frodin, P., and Svensson, M.: Lemming-food plant interactions, density effects, and cyclic dynamics on the Siberian Tundra, Arctic, 64, 421–428, https://doi.org/10.14430/arctic4141, 2011.
Eskelinen, A. and Virtanen, R.: Local and regional processes in low-productive mountain plant communities: the roles of seed and microsite limitation in relation to grazing, Oikos, 110, 360–368, https://doi.org/10.1111/j.0030-1299.2005.13579.x, 2005.
EPPO (European Plant Protection Organization): Decision-making scheme for the environmental risk assessment of plant protection products, EPPO Bull., 24, 37–87, https://doi.org/10.1111/j.1365-2338.1994.tb01051.x, 1994.
Fauteux, D., Gauthier, G., and Berteaux, D.: Seasonal demography of a cyclic lemming population in the Canadian Arctic, J. Anim. Ecol., 84, 1412–1422, https://doi.org/10.1111/1365-2656.12385, 2015.
Fauteux, D., Gauthier, G., Berteaux, D., Palme, R., and Boonstra, R.: High Arctic lemmings remain reproductively active under predator-induced elevated stress, Oecologia, 187, 657–666, https://doi.org/10.1007/s00442-018-4140-4, 2018a.
Fauteux, D., Gauthier, G., Slevan-Tremblay, G., and Berteaux, D.: Life in the fast lane: learning from the rare multiyear recaptures of brown lemmings in the High Arctic, Arct. Sci., 4, 146–151, https://doi.org/10.1139/as-2017-0017, 2018b.
Goodrich, J. P., Oechel, W. C., Gioli, B., Moreaux, V., Murphy, P. C., Burba, G., and Zona, D.: Impact of different eddy covariance sensors, site set-up, and maintenance on the annual balance of CO2 and CH4 in the harsh Arctic environment, Agr. Forest Meteorol., 228, 239–251, https://doi.org/10.1016/j.agrformet.2016.07.008, 2016.
Goswami, S., Gamon, J., Vargas, S., and Tweedie, C.: Relationships of NDVI, Biomass, and Leaf Area Index (LAI) for six key plant species in Barrow, Alaska, PeerJ PrePrints, 3, e913v1, https://doi.org/10.7287/peerj.preprints.913v1, 2015.
Gough, C. M.: Terrestrial primary production: Fuel for life, Nat. Educ. Knowl., 3, p. 28, 2011.
Hawlena, D. and Schmitz, O. J.: Herbivore physiological response to predation risk and implications for ecosystem nutrient dynamics, P. Natl. Acad. Sci. USA, 107, 15503–15507, https://doi.org/10.1073/pnas.1009300107, 2010.
Hugelius, G., Strauss, J., Zubrzycki, S., Harden, J. W., Schuur, E. A. G., Ping, C.-L., Schirrmeister, L., Grosse, G., Michaelson, G. J., Koven, C. D., O'Donnell, J. A., Elberling, B., Mishra, U., Camill, P., Yu, Z., Palmtag, J., and Kuhry, P.: Estimated stocks of circumpolar permafrost carbon with quantified uncertainty ranges and identified data gaps, Biogeosciences, 11, 6573–6593, https://doi.org/10.5194/bg-11-6573-2014, 2014.
Ims, R. A. and Fuglei, E.: Trophic interaction cycles in tundra ecosystems and the impact of climate change, BioScience, 55, 311–322, https://doi.org/10.1641/0006-3568(2005)055[0311:TICITE]2.0.CO;2, 2005.
IPCC (Intergovernmental Panel on Climate Change): Climate change 2021: the physical science basis, Working group I contribution to the sixth assessment report of the Intergovernmental Panel on Climate Change, Cambridge University Press, New York, NY, https://doi.org/10.1017/9781009157896, 2021.
Johnson, D. R., Lara, M. J., Shaver, G. R., Batzli, G. O., Shaw, J. D., and Tweedie, C. E.: Exclusion of brown lemmings reduces vascular plant cover and biomass in Arctic coastal tundra: resampling of a 50+ year herbivore exclosure experiment near Barrow, Alaska, Environ. Res. Lett., 6, 045507, https://doi.org/10.1088/1748-9326/6/4/045507, 2011.
Kelker, D. and Chanton, J.: The effect of clipping on methane emissions from Carex, Biogeochemistry, 39, 37–44, https://doi.org/10.1023/A:1005866403120, 1997.
Krebs, C. J.: Of lemmings and snowshoe hares: the ecology of northern Canada, P. R. Soc. Lond. B., 278, 481–489, https://doi.org/10.1098/rspb.2010.1992, 2011.
Krebs, C. J., Reid, D., Kenney, A. J., and Gilbert, S.: Fluctuations in lemming populations in north Yukon, Canada, 2007–2010, Can. J. Zool., 89, 297–306, https://doi.org/10.1139/z11-004, 2011.
Kwon, M. J., Jung, J. Y., Tripathi, B. M., Göckede, M., Lee, Y. K., and Kim, M.: Dynamics of microbial communities and CO2 and CH4 fluxes in the tundra ecosystems of the changing Arctic, J. Microbiol., 57, 325–336, https://doi.org/10.1007/s12275-019-8661-2, 2019.
Lai, D. Y. F.: Methane dynamics in northern peatlands: a review, Pedosphere, 19, 409–421, https://doi.org/10.1016/S1002-0160(09)00003-4, 2009.
Lara, M. J., Johnson, D. R., Andresen, C., Hollister, R. D., and Tweedie, C. E.: Peak season carbon exchange shifts from a sink to a source following 50+ years of herbivore exclusion in an Arctic tundra ecosystem, J. Ecol., 105, 122–131, https://doi.org/10.1111/1365-2745.12654, 2017.
Le Vaillant, M., Erlandsson, R., Elmhagen, B., Hörnfeldt, B., Eide, N. E., and Angerbjörn, A.: Spatial distribution in Norwegian lemming Lemmus lemmus in relation to the phase of the cycle, Polar Biol., 41, 1391–1403, https://doi.org/10.1007/s00300-018-2293-6, 2018.
Lenth, R., Singmann, H., Love, J., Buerkner, P., and Herve, M.: R Core Team (2019), Emmeans: estimated marginal means, R package version 1.3.3, The Comprehensive R Archive Network (CRAN), https://CRAN.R-project.org/package=emmeans (last access: 2 May 2020), 2019.
Lin, X., Wang, S., Ma, X., Xu, G., Luo, C., Li, Y., Jiang, G., and Xie, Z.: Fluxes of CO2, CH4, and N2O in an alpine meadow affected by yak excreta on the Qinghai-Tibetan plateau during summer grazing periods, Soil Biol. Biochem., 41, 718–725, https://doi.org/10.1016/j.soilbio.2009.01.007, 2009.
Lindén, E., Gough, L., and Olofsson, J.: Large and small herbivores have strong effects on tundra vegetation in Scandinavia and Alaska, Ecol. Evol., 11, 12141–12152, https://doi.org/10.1002/ece3.7977, 2021.
McEwing, K. R., Fisher, J. P., and Zona, D.: Environmental and vegetation controls on the spatial variability of CH4 emission from wet-sedge and tussock tundra ecosystems in the Arctic, Plant Soil, 388, 37–52, https://doi.org/10.1007/s11104-014-2377-1, 2015.
McGuire, A. D., Anderson, L. G., Christensen, T. R., Dallimore, S., Guo, L., Hayes, D. J., Heimann, M., Lorenson, T. D., Macdonald, R. W., and Roulet, N.: Sensitivity of the carbon cycle in the Arctic to climate change, Ecol. Monogr., 79, 523–555, https://doi.org/10.1890/08-2025.1, 2009.
McKendrick, J. D., Batzli, G. O., Everett, K. R., and Swanson, J. C.: Some effects of mammalian herbivores and fertilization on tundra soils and vegetation, Arctic Alpine Res., 12, 565–578, https://doi.org/10.2307/1550501, 1980.
Metcalfe, D. B. and Olofsson, J.: Distinct impacts of different mammalian herbivore assemblages on Arctic tundra CO2 exchange during the peak of the growing season, Oikos, 124, 1632–1638, https://doi.org/10.1111/oik.02085, 2015.
Min, E., Wilcots, M. E., Shahid, N., Gough, L., McLaren, J. R., Rowe, R. J., Rastetter, E. B., Boelman, N. T., and Griffin, K. L.: Herbivore absence can shift dry heath tundra from carbon source to sink during peak growing season, Environ. Res. Lett., 16, 024027, https://doi.org/10.1088/1748-9326/abd3d0, 2021.
Morris, D. W., Davidson, D. L., and Krebs, C. J.: Measuring the ghost of competition: insights from density-dependent habitat selection on the coexistence and dynamics of lemmings, Evol. Ecol. Res., 2, 41–67, 2000.
NOAA GML: National Oceanic and Atmospheric Administration (NOAA) Global Monitoring Laboratory (GML): Carbon Cycle Greenhouse Gases, https://gml.noaa.gov/ccgg/trends/, last access: 21 March 2022.
Oechel, W. C., Laskowski, C. A., Burba, G., Gioli, B., and Kalhori, A. A.: Annual patterns and budget of CO2 flux in an Arctic tussock tundra ecosystem, J. Geophys. Res.-Biogeo., 119, 323–339, https://doi.org/10.1002/2013JG002431, 2014.
Olofsson, J., Tommervik, H., and Callaghan, T. V.: Vole and lemming activity observed from space, Nat. Clim. Change, 2, 880–883, https://doi.org/10.1038/nclimate1537, 2012.
Olofsson, J., Oksanen, L., Oksanen, T., Tuomi, M., Hoset, K. S., Virtanen, R., and Kyrö, K.: Long-term experiments reveal strong interactions between lemmings and plants in the Fennoscandian Highland tundra, Ecosystems, 17, 606–615, https://doi.org/10.1007/s10021-013-9740-6, 2014.
Ott, K. E. and Currier, K. D.: Monitoring lemming abundance and distribution near Barrow, Alaska, 2012, in: Technical report to U.S. Fish and Wildlife Service, Fairbanks Fish and Wildlife Field Office, edited by: Ott, K. E. and Currier, K. D., Fairbanks, AK, U.S. Fish & Wildlife Service, 2012.
Pinheiro, J., Bates, D., DebRoy, S., and Sarkar, D.: R Core Team (2019), Nlme: linear and nonlinear mixed effects models, R package version 3.1-137, The Comprehensive R Archive Network (CRAN), https://CRAN.R-project.org/package=nlme (last access: 2 May 2020), 2018.
Plein, J., Zona, D., Clark, R., Arndt, K., Oechel, W., and Stow, D.: Brown Lemming Herbivory Experiment Data, Alaskan Arctic (summers 2018, 2019), Arctic Data Center [data set], https://doi.org/10.18739/A2S17ST8F, 2022.
R Core Team: R: a language and environment for statistical computing, Vienna, Austria, R Foundation for Statistical Computing, https://www.r-project.org/ (last access: 2 May 2020), 2019.
Reid, D. G., Krebs, C. J., and Kenney, A.: Limitation of collared lemming population growth at low densities by predation mortality, Oikos, 73, 387–398, https://doi.org/10.2307/3545963, 1995.
Ripple, W. J. and Beschta, R. L.: Wolf reintroduction, predation risk, and cottonwood recovery in Yellowstone National Park, Forest Ecol. Manag., 184, 299–313, https://doi.org/10.1016/S0378-1127(03)00154-3, 2003.
Roy, A., Suchocki, M., Gough, L., and McLaren, J. R.: Above- and belowground responses to long-term herbivore exclusion, Arct. Antarct. Alp. Res., 52, 109–119, https://doi.org/10.1080/15230430.2020.1733891, 2020.
Schuur, E. A. G., Bockheim, J., Canadell, J. G., Euskirchen, E., Field, C. B., Goryachkin, S. V., Hagemann, S., Kuhry, P., Lafleur, P. M., Lee, H., Mazhitova, G., Nelson, F. E., Rinke, A., Romanovsky, V.E., Shiklomanov, N., Tarnocai, C., Venevsky, S., Vogel, J. G., and Zimov, S. A.: Vulnerability of permafrost carbon to climate change: implications for the global carbon cycle, BioScience, 58, 701–714, https://doi.org/10.1641/B580807, 2008.
Soininen, E. M., Zinger, L., Gielly, L., Yoccoz, N. G., Henden, J. A., and Ims, R. A.: Not only mosses: lemming winter diets as described by DNA metabarcoding, Polar Biol., 40, 2097–2103, https://doi.org/10.1007/s00300-017-2114-3, 2017.
Stenseth, N. C.: Population cycles in voles and lemmings: density dependence and phase dependence in a stochastic world, Oikos, 87, 427–461, https://doi.org/10.2307/3546809, 1999.
Stenseth, N. C. and Ims, R. A.: The biology of lemmings, London: Published for the Linnean Society of London, Academic Press, ISBN 0126660204, 1993.
Ström, L., Ekberg, A., Mastepanov, M., and Christensen, T. R.: The effect of vascular plants on carbon turnover and methane emissions from a tundra wetland, Glob. Change Biol., 9, 1185–1192, https://doi.org/10.1046/j.1365-2486.2003.00655.x, 2003.
Sturtevant, C. S., Oechel, W. C., Zona, D., Kim, Y., and Emerson, C. E.: Soil moisture control over autumn season methane flux, Arctic Coastal Plain of Alaska, Biogeosciences, 9, 1423–1440, https://doi.org/10.5194/bg-9-1423-2012, 2012.
Tan, Z., Zhuang, Q., and Anthony, K. W.: Modeling methane emissions from arctic lakes: model development and site-level study, J. Adv. Model. Earth Sy., 7, 459–483, https://doi.org/10.1002/2014MS000344, 2015.
von Fischer, J. C., Ames, G., Rhew, R., and Oechel, W. C.: Methane emission rates from the Arctic coastal tundra at Barrow: temporal and spatial variability and response to an experimental carbon addition, 10–14 Dec 2007, San Francisco, California, USA, American Geophysical Union Fall Meeting 2007, EOS Trans. AGU, Fall Meet. Suppl., Abstract # B51C-0609, https://abstractsearch.agu.org/meetings/2007/FM/B51C-0609.html (last access: 15 May 2022), 2007.
Whiting, G. J. and Chanton, J. P.: Primary production control of methane emission from wetlands, Nature, 364, 794–795, https://doi.org/10.1038/364794a0, 1993.
Zona, D., Oechel, W. C., Kochendorfer, J., Paw U, K. T., Salyuk, A. N., Olivas, P. C., Oberbauer, S. F., and Lipson, D. A.: Methane fluxes during the initiation of a large-scale water table manipulation experiment in the Alaskan Arctic tundra, Global Biogeochem. Cy., 23, GB2013, https://doi.org/10.1029/2009GB003487, 2009.
Zona, D., Oechel, W. C., Peterson, K. M., Clements, R. J., PAW U, K. T., and Ustin, S. L.: Characterization of the carbon fluxes of a vegetated drained lake basin chronosequence on the Alaskan Arctic Coastal Plain, Glob. Change Biol., 16, 1870–1882, https://doi.org/10.1111/j.1365-2486.2009.02107.x, 2010.
Zuur, A. F., Ieno, E. N., Walker, N. J., Saveliev, A. A., and Smith, G. M.: Mixed effects models and extensions in ecology with R, Springer Science+Business Media, LLC, New York, NY, https://doi.org/10.1007/978-0-387-87458-6, 2009.