the Creative Commons Attribution 4.0 License.
the Creative Commons Attribution 4.0 License.
 | 15 Jun 2022
Massive warming-induced carbon loss from subalpine grassland soils in an altitudinal transplantation experiment
Matthias Volk
Matthias Suter
Anne-Lena Wahl
Seraina Bassin
Climate change is associated with a change in soil organic carbon (SOC) stocks, implying a feedback mechanism on global warming. Grassland soils represent 28 % of the global soil C sink and are therefore important for the atmospheric greenhouse gas concentration.
In a field experiment in the Swiss Alps we recorded changes in the ecosystem organic carbon stock under climate change conditions, while quantifying the ecosystem C fluxes at the same time (ecosystem respiration, gross primary productivity, C export in plant material and leachate water). We exposed 216 grassland monoliths to six different climate scenarios (CSs) in an altitudinal transplantation experiment. In addition, we applied an irrigation treatment (+12 % to 21 % annual precipitation) and an N deposition treatment (+3 and +15 kg N ha−1 yr−1) in a factorial design, simulating summer-drought mitigation and atmospheric N pollution.
In 5 years the ecosystem C stock, consisting of plant C and SOC, dropped dramatically by about −14 % ( g C m−2) with the CS treatment representing a +3.0 ∘C seasonal (April–October) warming. N deposition and the irrigation treatment caused no significant effects. Measurements of C fluxes revealed that ecosystem respiration increased by 10 % at the +1.5 ∘C warmer CS site and by 38 % at the +3 ∘C warmer CS site (P≤0.001 each), compared to the CS reference site with no warming. However, gross primary productivity was unaffected by warming, as were the amounts of exported C in harvested plant material and leachate water (dissolved organic C). As a result, the 5-year C flux balance resulted in a climate scenario effect of g C m−2 at the +3.0 ∘C CS, similar to the C stock climate scenario effect. It is likely that this dramatic C loss of the grassland is a transient effect before a new, climate-adjusted steady state is reached.
- Article
(2579 KB) - Full-text XML
- Companion paper
- BibTeX
- EndNote


The organic C stock contained in soils has long been recognized both as a substantial sink for anthropogenic CO2 emissions and also as particularly sensitive to global warming (Schlesinger, 1977; Post et al., 1982). Indeed, today grassland soils are one of the largest terrestrial CO2 sinks, because they contain a pool of 661 Pg C (ca. 28 % of total global soil C; Jobbágy and Jackson, 2000) or >80 % of C contained in the atmosphere. For Europe, this huge soil organic carbon (SOC) stock was predicted to decrease by 6 %–10 % during the 21st century as a response to climate change (Smith et al., 2005). Thus, a shrinking sink for atmospheric CO2 would create a positive feedback loop with globally rising temperatures, which makes research on C cycle responses vital for improving projections of how fast the climate will change (Hoeppner and Dukes, 2012).
Storage of organic C (OC) is positively related to plant growth. Thus, increased plant growth may be expected to have a similarly positive effect on ecosystem C sequestration (Vitousek et al., 1997). For example, Ammann et al. (2009) found higher C sequestration in an intensively managed compared to an extensively managed grassland. In forests productivity increases following atmospheric N deposition, revealing a strong positive correlation with C sequestration (Magnani et al., 2007). Beyond edaphic factors, the grassland OC turnover is driven to a large degree by temperature, so that warmer soils have lower SOC contents. This effect can be observed along latitudinal gradients (Jones et al., 2005), as well as along altitudinal gradients.
This leads to the apparently paradox situation that less productive ecosystems support larger soil C sinks. In Swiss grasslands for example, more than 58 % of SOC is stored at 1000–2000 m a.s.l. (37 % of the total area), and despite the very shallow and cold soils 24 % of SOC is found above 2000 m altitude (21 % of the total area; Leifeld et al., 2005, 2009). As a result the 1000–2000 m a.s.l. region stores 3.6 times more SOC per unit land area compared to the <1000 m a.s.l. region, and the >2000 m a.s.l. region stores 2.7 times more SOC.
Under current global warming, the cold regions of high altitude and high latitude are most strongly affected (Core writing team, IPCC, 2014), and predicting the fate of the large biological CO2 sink of low-productivity grasslands in a changing climate is of highest relevance. In these environments of largely temperature-limited plant growth, rising temperatures have two antagonistic effects on the soil C sequestration process: first, warming favors productivity, resulting in increased availability of organic matter. This effect is strongest at intermediate warming levels and becomes smaller at warming levels that cause seasonal water shortage (Volk et al., 2021). Although grassland may respond differently to warming depending on soil moisture availability (Liu et al., 2018) and species composition (Van der Wal and Stien, 2014), in cold environments the warming response on productivity is generally positive (Rustad et al., 2001). Second, warming favors heterotrophic soil life, thus accelerating the decomposition of plant residues (Zhou et al., 2009). If the change of the rate of productivity and the rate of decomposition are not equal, the grassland soil will behave either as a C sink or a C source for the atmosphere until a new equilibrium is reached.
In addition, air pollution in the form of atmospheric N deposition may constitute a fertilization effect. The N deposition rate is commonly very low at sites far away from agriculture and fossil fuel burning (<5 kg N ha−1 yr−1, Rihm and Kurz, 2001), but can reach >40 kg N ha−1 yr−1 elsewhere in Switzerland (Rihm and Achermann, 2016). As a consequence, fast-growing species are favored and plant growth is promoted (Vitousek et al., 1997; Bobbink et al., 2010; Phoenix et al., 2012; Volk et al., 2014). Alone and in interaction, warming and N deposition therefore increase the ecosystem plant productivity potential and lead to a larger input of organic carbon to the terrestrial carbon sink.
However, the highly complex interactions of climate parameters (e.g., water availability and temperature) and pollution factors (e.g., N) have led to assume that the C sink of terrestrial ecosystems may also turn into a substantial source of atmospheric CO2 (Lu et al., 2011; Heimann and Reichstein, 2008). Evidence from a subalpine grassland experiment shows that changes in aboveground plant productivity are not an appropriate predictor for changes in SOC content: yield increases caused by a N fertilization of 14 kg N ha−1 yr−1 resulted in SOC gains, but already a fertilization of 54 kg N ha−1 yr−1 resulted in net SOC losses, relative to control (Volk et al., 2018). Such effects were driven by a strongly increased ecosystem respiration (ER) that overcompensated for the increased substrate input (Volk et al., 2011). In agreement, a recent interannual comparison of subalpine grassland based on different annual mean temperatures has also shown that plant productivity was positively correlated to temperature, while the ecosystem CO2 balance, namely net ecosystem productivity (NEP), was negatively correlated (Volk et al., 2016).
In this paper, we quantify the response of a subalpine grassland ecosystem C budget in the face of multiple climate change factors that may favor plant productivity. We present a comprehensive set of data related to relevant C flux pathways to illuminate mechanisms controlling the ecosystem C sink and source properties. In a 5-year field experiment in the central Swiss Alps, a climate scenario treatment was established that resulted in warming. In addition, to uncouple potential temperature effects from temperature-driven soil moisture effects and to consider effects of atmospheric N deposition, a two-level irrigation treatment and a three-level N treatment were set up in a factorial design. Using a transplantation approach along an altitudinal gradient to accomplish the climate scenario treatment, we affected not only temperatures, but also the length of snow cover and the growing period. The long duration of the experiment provided a large between-year weather variability. Because the investigated grasslands had developed under a low-intensity management that was unaltered for decades if not centuries, we considered the SOC stock to be in a steady state on a mid- and long-term perspective. We hypothesized the following:
-
Under a climate scenario (CS) similar to the present climate, changes in productivity and decomposition will compensate each other and result in small or no changes in the SOC stock over 5 years.
-
CS with strong temperature increases significantly alter the SOC stock towards a sink or a source, depending on whether plant productivity or SOC decomposition is affected more by climate change effects.
-
Irrigation mitigates effects of water shortage due to warming, and N deposition reduces possible N limitation of microbial activity, both factors thus exhibiting a favorable effect on decomposition and reducing the SOC stock.
This study on ecosystem C fluxes is part of the AlpGrass experiment, and the Materials section refers only to those aspects relevant to the study of the C fluxes. We refer to Volk et al. (2021) for more details on the experimental design. Details on the gas exchange measurement and parameterization are provided in Appendix A.
The experiment used grassland monoliths to investigate climate change effects on the soil carbon stock of subalpine grassland ecosystems in the central Alps. At six sites with summer livestock grazing (within ≤55 km distance) in the canton Graubünden, Switzerland, areas of 1 ha on southerly exposed, moderate slopes at an altitude of ca. 2150 m a.s.l. were selected. These sites of origin shared very similar climatic conditions but represented a wide range of soil properties and plant communities. Detailed information on soil properties and species composition of the different origins can be found in Wüst-Galley et al. (2021).
Monoliths of 0.1 m2 surface area ( cm) were excavated at randomly generated positions at the sites of origin and placed into precisely fitting, well-drained plastic boxes. A total of 216 monoliths were transported from their respective site of origin to the common AlpGrass experimental site in November 2012 and remained there until the final harvest in October 2017.
2.1 Experimental site and treatment design
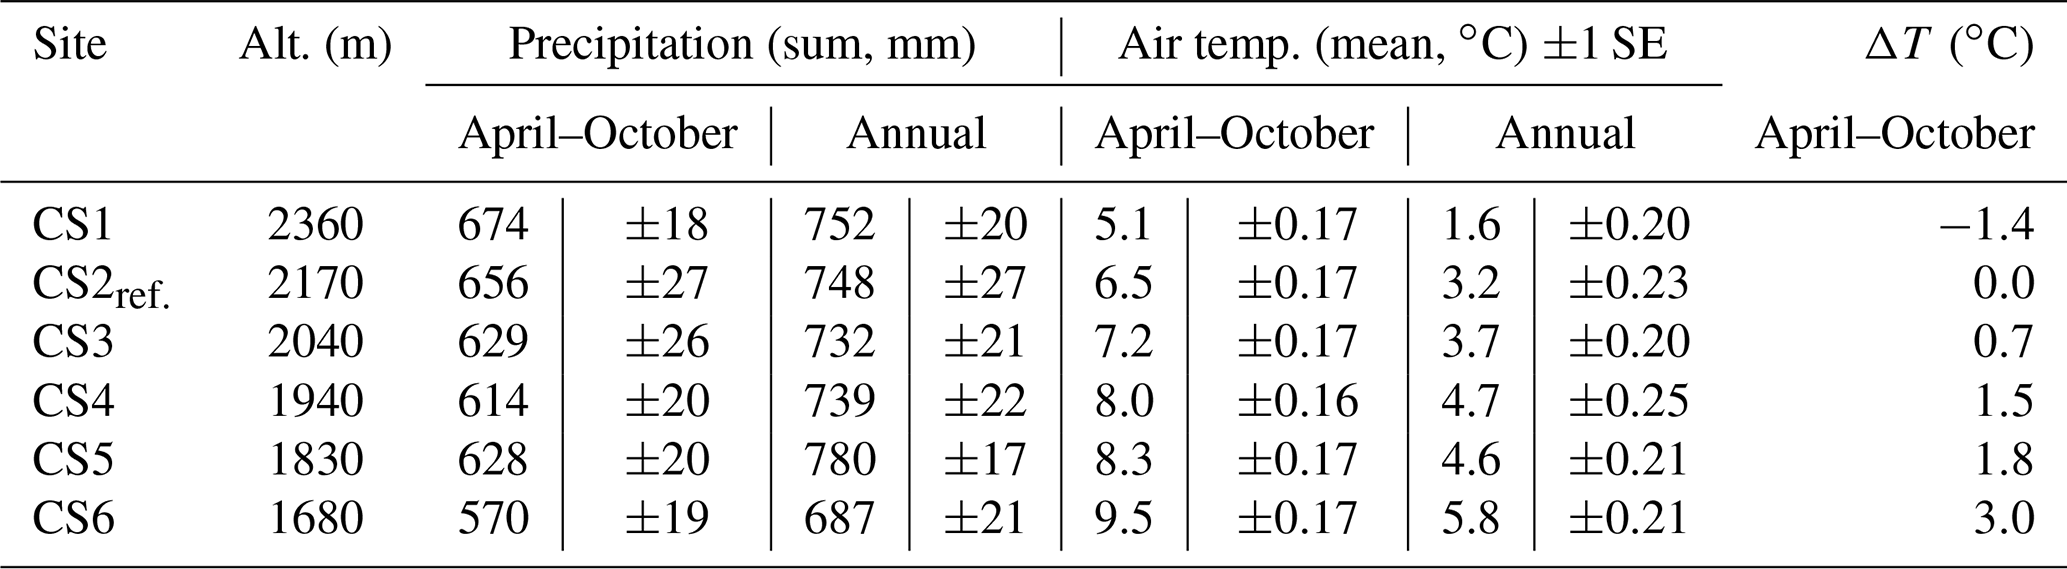
The AlpGrass experiment is located close to Ardez in the Lower Engadine Valley (Graubünden, Switzerland). The site covers a 680 m altitudinal gradient on the south slope of Piz Cotschen (3029 m), ranging from montane forest (WGS 84 46.77818∘ N, 10.17143∘ E) to subalpine grassland (WGS 84 46.79858∘ N, 10.17843∘ E). We located six separate climate scenario sites (CS) at different altitudes (CS1: 2360 m, CS2: 2170 m, CS3: 2040 m, CS4: 1940 m, CS5: 1830 m, CS6: 1680 m a.s.l.). CS2 was chosen as a reference site (hereafter CS2reference), because it had the same altitude as the sites of origin. The snow-free period lasts approximately from May to October, with a mean growing season (April to October) air temperature of 6.5 ∘C (Table 1).
Table 1Climate parameters at the climate scenario sites (CSs) between 2012 and 2017. Precipitation sums for climate scenario sites, aggregated from April to October and annually. Mean air temperature from April to October and for the whole year. Air temperature difference (ΔT) April–October for respective CSs compared to CS2reference (CS2ref.).
At each of the six CSs, 36 monoliths (six from each of six sites of origin) were installed in the ground within their drained plastic boxes, level with the surrounding soil surface, resulting in a total of 216 transplanted monoliths. Monoliths in their containers were set side by side without a gap. To prevent the invasion of new species or genotypes, the surroundings of the monolith array were frequently mown.
In addition to the climate scenario treatment, an irrigation and an N deposition treatment were set up in a full-factorial design at each CS. One-half of the 36 monoliths received only ambient precipitation, and the other half received additional water during the growing season. Within both irrigation treatment levels monoliths were subjected to three levels of N deposition. At the CS sites, irrigation and N treatments were set up in a randomized complete block design (six blocks each containing all six irrigation and N treatment combinations).
2.2 Climate scenario site (CS) treatment
The climate scenario treatment was induced by the different altitudes of the CSs at the AlpGrass site, where monoliths from the sites of origin were installed. As a result, the transplanted monoliths experienced distinctly different climatic conditions (Table 1). To describe the climate scenarios, we focused on the mean growing period temperature from April to October, instead of the annual mean temperature. The temperature under the snow cover was ca. 0 ∘C at all CSs. The CS temperature treatment was defined as the deviation from CS2reference temperature.
2.3 Irrigation treatment
A two-level irrigation treatment was set up to distinguish the warming effect from the soil moisture effect, driven by warming. Precipitation equivalents to 20 mm were applied to the monoliths under the irrigation treatment in four to six applications throughout the growing period. Depending on the year, this treatment amounted to 80–120 mm or 12 %–21 % of the recorded precipitation sum during the growing periods.
2.4 N deposition treatment
The N deposition treatment simulated an atmospheric N deposition from air pollution, equivalent of +3 and +15 kg N ha−1 yr−1, on top of the background deposition (3.3 kg and 4.3 kg N ha−1 yr−1 at CS2reference and CS6, respectively). Twelve times during the growing period, 200 mL ammonium nitrate () in water solution was applied per monolith. Monoliths of the N deposition control group received pure water.
2.5 Environmental conditions
At all CSs, air temperature, relative humidity (Hygroclip 2, Rotronic, Switzerland) and precipitation were measured (ARG100, Campbell Scientific, UK). Global radiation (GR) as W m−2 was measured at CS2reference and CS6 using Hukseflux LP02-05 thermopile pyranometers. Soil temperature and soil water content (SWC) were measured at 8 cm depth (CS655 reflectometer, Campbell Scientific, UK). At CS2reference and the lowest CS6, these parameters were obtained in 18 monoliths each and at two points in the surrounding grassland per site, using time domain reflectometers (TDRs) with 12 cm rods (CS655, Campbell Scientific, UK). In all other CSs, six monoliths each were equipped with such TDRs. All parameters were integrated for 10 min originally and later averaged for longer periods if necessary.
Ambient wet N deposition was 3.3 kg N ha−1 yr−1 at CS2reference and 4.3 kg N ha−1 yr−1 at the lowest CS6. Wet deposition was collected using bulk samplers (VDI 4320 Part 3, 2017; see Thimonier et al., 2019) from April 2013 to April 2015. Nitrate (NO) was analyzed by ion chromatography (ICS-1600, Dionex, USA), and NH was analyzed using a flow injection analyzer (FIAstar 5000, Foss, Denmark) followed by UV–vis photometry detection (SN EN ISO 11732).
2.6 Plant productivity
Aboveground plant material, including mosses and lichens, was cut annually at 2 cm above the soil at canopy maturity. Accordingly, mean harvest dates for CS1 to CS6 were 12 August, 26 July, 22 July, 14 July, 9 July and 5 July, respectively. Plant productivity responses to the climate scenario, N deposition and irrigation treatments were presented in Volk et al. (2021). In addition at the end of the experiment in the fall of 2017, total aboveground plant material was harvested including all stubble, and root mass was assessed using two 5 cm diameter soil cores to 10 cm depth per monolith. For the above- and belowground fraction, C content was measured with a elemental analyzer, which allowed calculation of shoot and root C on a mass basis. Tests for effects of N deposition on mean plant C content revealed no significant differences, and a common value of 47 % was implied (see Bassin et al., 2015, for details on the calculation). Based on these data, shoot and root C stock in 2017 was calculated as well as the 5 years of cumulative shoot C that was harvested 2 cm above the soil over the experimental period. In the context of this study productivity is expressed as g C m−2 per time unit.
2.7 Net ecosystem productivity (NEP)
Net ecosystem CO2 exchange (NEE) was measured in fortnightly to monthly intervals from 2013 to 2017 in day and night campaigns, covering the complete growing season. We utilized dynamic CO2 concentration, non-flowthrough, transparent acrylic chambers, fit to cover the whole grassland monolith including a fully developed canopy (Volk et al., 2011). All recorded concentration measurements were tested for linearity and omitted if R2<0.95. Thus, reduced assimilation or respiration due to chamber effects (CO2 substrate depletion, overheating, reduced diffusion gradient) could be safely excluded during the measurement (2 min per monolith).
For the 5-year parameterization of climate scenario effects on NEE, we focused on a subset of monoliths from the control treatment group (no N deposition, no irrigation) that provided the highest measurement frequency (six control monoliths from each CS2reference, CS4, CS6; 18 monoliths in total). Doing so, the dynamic developments of vegetation phenology and drought events were well represented. We used global radiation and soil temperature at 8 cm depth to model gross primary productivity (GPP) and ecosystem respiration (ER) between measurement campaigns, in accordance with Volk et al. (2011, 2016). The light response curve of GPP was derived at CS2reference, and the temperature response of ER was established for CS2reference, CS4 and CS6 separately, using an exponential function after Lloyd and Taylor (1994) and Ammann et al. (2007). NEP then resulted in GPP minus ER for a given time unit. For more information on the gas exchange measurement and parameterization, please refer to Appendix A.
Lacking NEE data during the snow-covered period, a potential ER substrate limitation during the winter was not accounted for, since respiration rates were on an extremely low level due to low temperatures. Accordingly, temperature-normalized ER during the snow-covered period was modeled to remain constant between the last fall measurement and the first measurement of the new growing period, just after snowmelt.
2.8 Soil organic carbon stock
In October 2012, 0–10 cm soil cores (5 cm diameter) were obtained in the grassland immediately beside the monolith's excavation site. Again in October 2017, two soil cores within each monolith were sampled to 10 cm depth to study the change of SOC stock and belowground biomass during the 5-year experimental phase. All samples were dried and sieved (2 mm).
We measured soil organic C and N contents by elemental analysis (oxidation of C-CO2 and N-NO2 in an O2 stream and subsequent reduction of NO2-N2 by a copper–tungsten granule). Separation of CO2 and N2 was accomplished by gas chromatography–thermal conductivity detector (GC-TCD) and quantification using acetanilid as an external standard (Hekatech Euro EA 3000, Wegberg, Germany). Samples were free of carbonate, so total C equals organic C. These data allowed the calculation of SOC stock in 2012 and 2017 as well as the SOC stock change over the 5 experimental years.
2.9 Dissolved organic C (DOC)
Monolith containers at CS2reference, CS4 and CS6 were equipped as lysimeters to collect leachates. During 2014, 2015 and 2016 leachates were pumped from underground tanks. Respective volumes were recorded, and combined aliquots per monolith were used for DOC analysis (NDIR detection following thermal-catalytic oxidation at 850 ∘C; DIMATOC 2000, Essen, Germany).
2.10 Data analyses
Data were modeled for C stocks and C fluxes. SOC stock data were available for 2012 and 2017, to calculate the SOC stock change over the 5 experimental years. We used SOC stock change as the primary variable for the analyses of the CS treatment effect. Shoot and root C stock data were available only from the destructive harvest at the end of the experiment in 2017. Using linear mixed-effects models, SOC stock change and root and shoot C stock in 2017 were modeled as a function of climate scenario site (CS, factor with six levels), irrigation (factor with two levels) and N deposition (factor with three levels), including all interactions. Block (36 levels: six CSs with six blocks each) and site of origin (six sites) were modeled as random factors (random intercepts). For root and shoot C stock, no data were available for CS1 and for the intermediate N deposition treatment, and so the number of these factors' levels was reduced accordingly. The Kenward–Roger method was applied to determine the approximate denominator degrees of freedom of fixed effects (Kenward and Roger, 1997), and the marginal and conditional R2 values of the model were computed following Nakagawa and Schielzeth (2013). Differences in the responses between single CSs and CS2reference were tested based on the model contrasts (post hoc Wald t tests without applying multiple comparisons).
Temperature effects on SOC stock change and root and shoot C stock data were also modeled directly as a function of temperature change, induced by the climate change treatment using generalized additive models (GAMs). Generalized additive models had to be used because simple linear models could not appropriately handle this relationship. The GAMs included a fixed intercept and a smooth term for temperature change. In the case of root and shoot C stock, the gamma function with log-link was chosen as the underlying distribution; following this amendment, model validation revealed that the assumptions of GAMs were met. The GAMs for the three response variables were modeled twice: first using all monoliths and second using only the control monoliths that received neither irrigation nor additional N. The latter was done to receive a direct comparison to the C flux data, which were measured only on control monoliths.
Regarding C fluxes, GPP, ER and NEP of CS2reference, CS4 and CS6 at the end of the 5 experimental years were analyzed with a multivariate linear mixed-effects model that took into account potential correlation among GPP, ER and NEP, calculated per monolith (controls only). It turned out that any correlation between the three categories of C fluxes was close to zero. Differences in GPP, ER and NEP between each CS4 and CS6 against CSreference were tested based on the model contrasts (post hoc Wald t tests without applying multiple comparisons). Moreover, differences in the 5-year cumulative shoot C and leachate C between each CS4 and CS6 against CS2reference were assessed with t tests.
Finally, we calculated the net ecosystem C balance to estimate the climate change effect by comparing the ecosystem C budget of CS4 (+1.5 ∘C) and CS6 (+3 ∘C) against CS2reference using two alternative approaches: a comparison based on carbon stock and a comparison based on carbon flux. For both approaches, only control monoliths were used, and differences of CS4 and CS6 against CS2reference were evaluated with t tests. All data were analyzed with the statistics software R, version 4.1.0 (R Core Team, 2021) and packages lme4 for linear-mixed effect models (Bates et al., 2015) and mgcv for GAMs (Wood, 2017).
3.1 Soil organic C stock is much lower at high temperatures
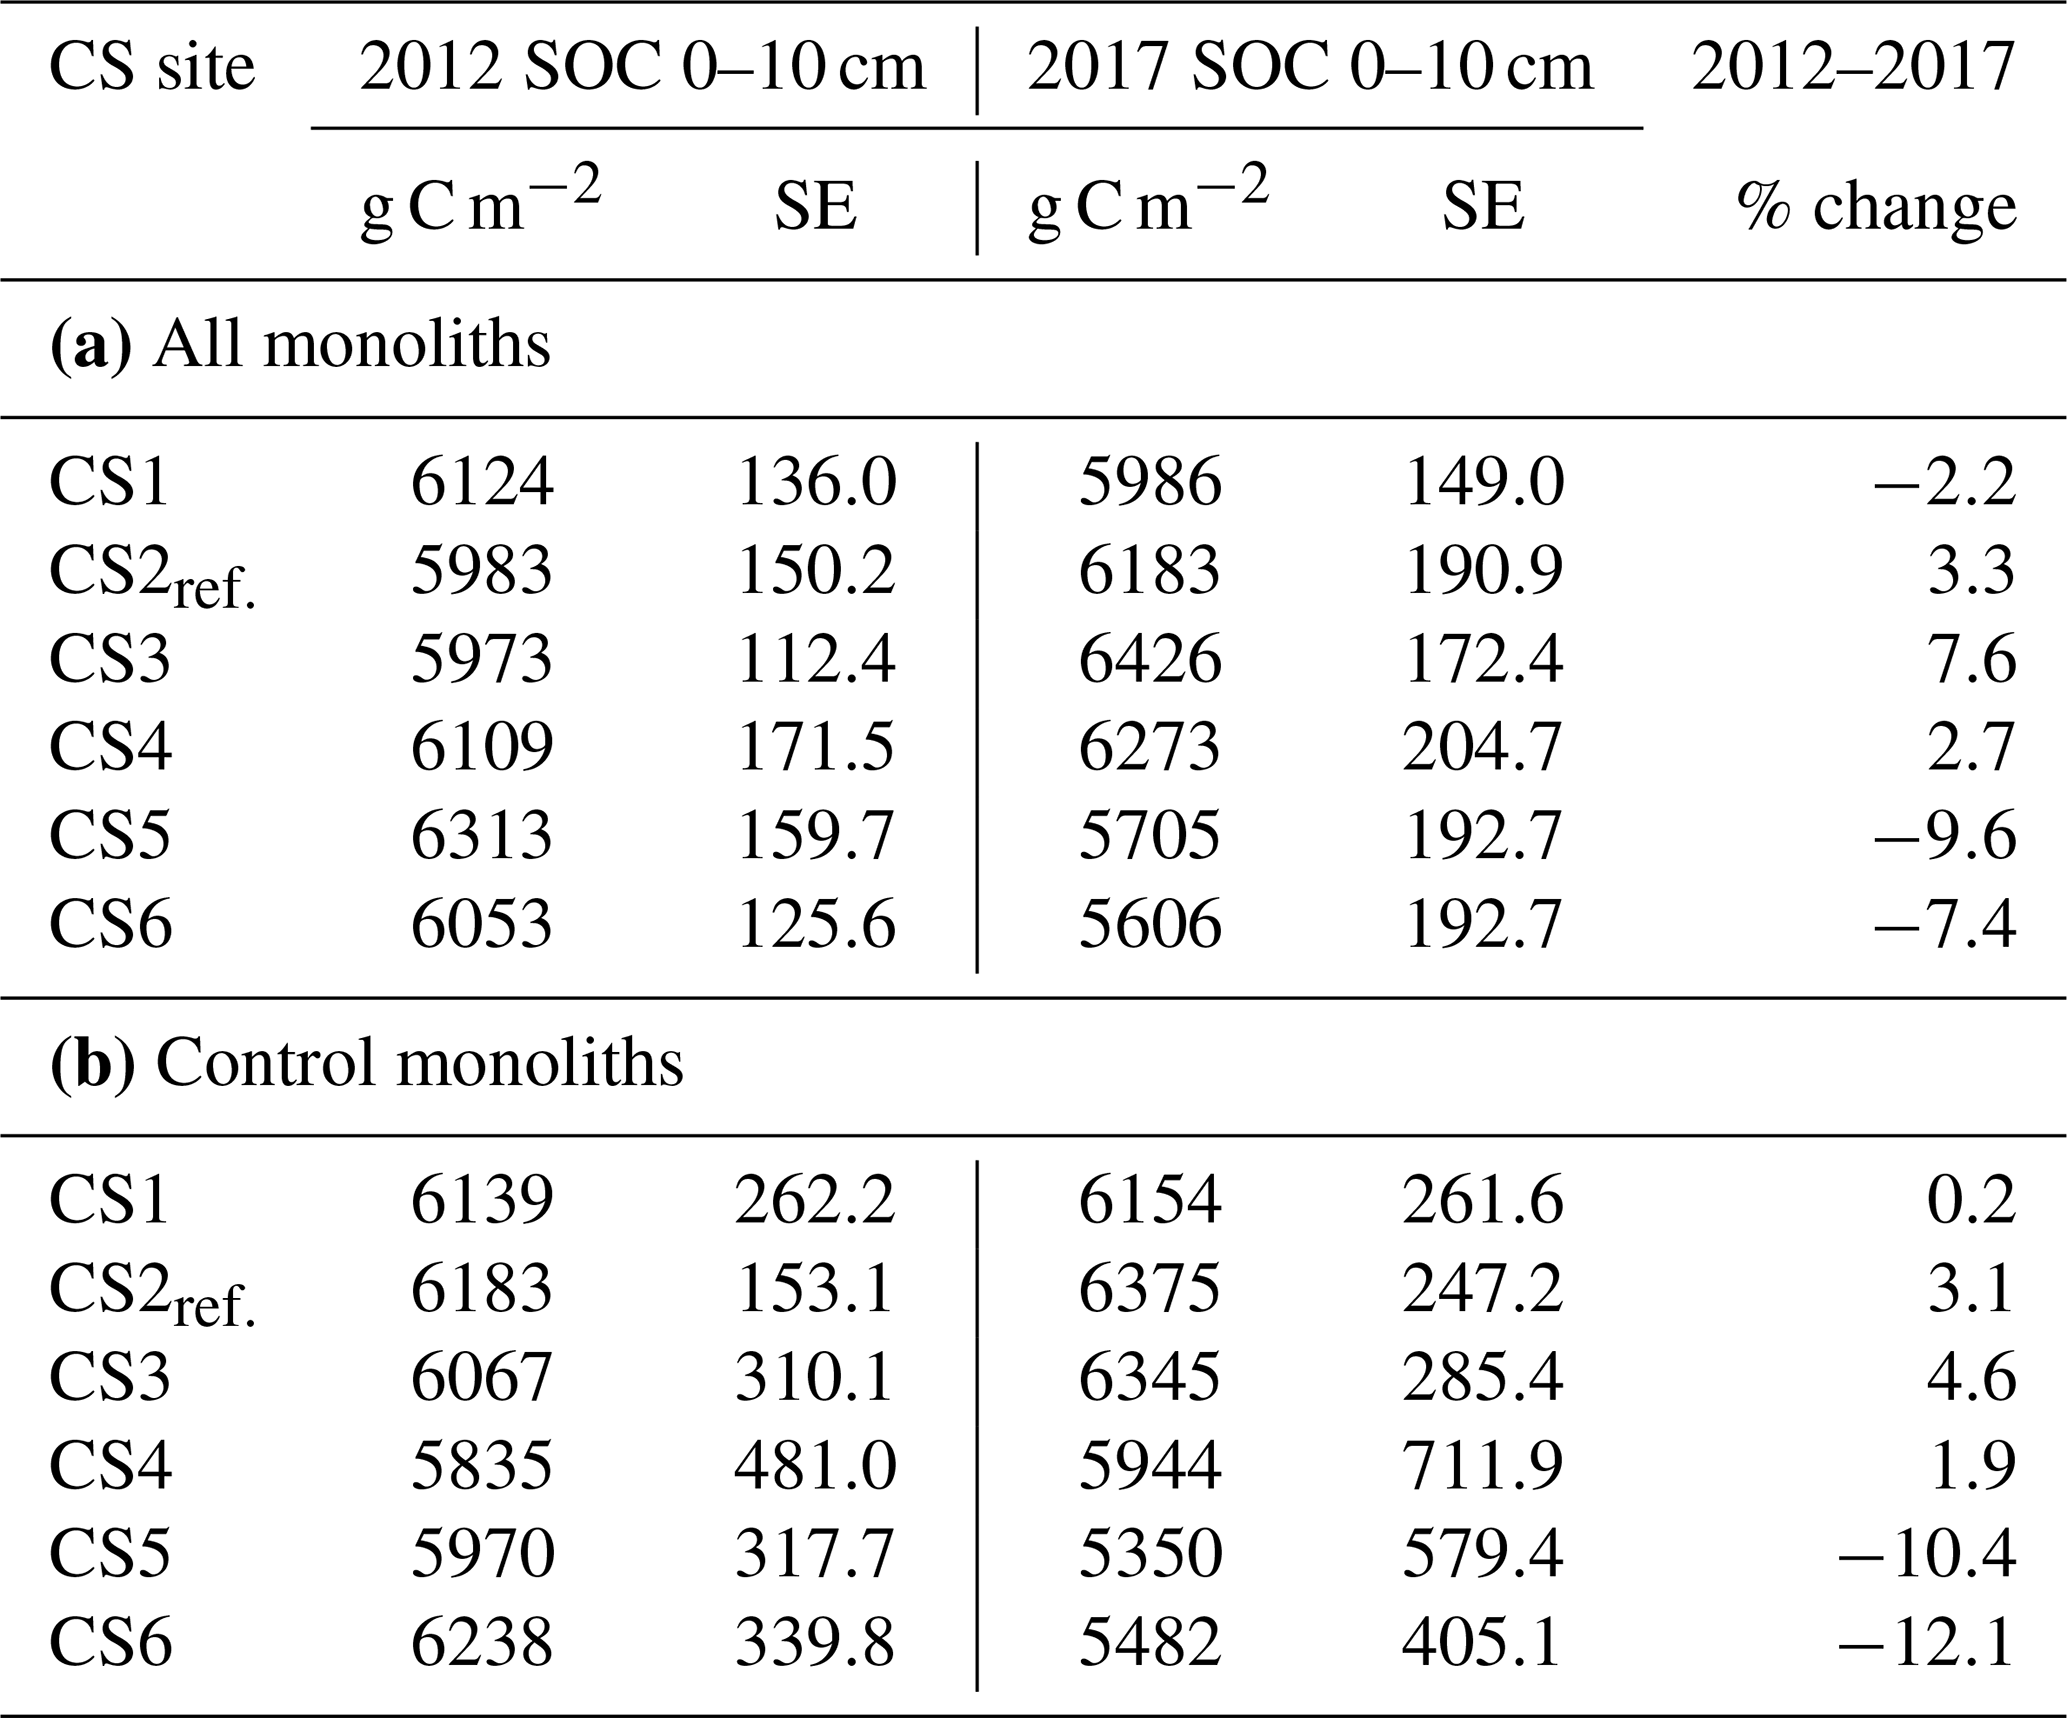
We detected significant effects of the climate scenario (CS) treatment on soil organic C (SOC) stock (Table 2, Appendix Table B1). Across all monoliths, the cooling associated with CS1 left the SOC stock largely unchanged. At CS2reference and the first two warming levels CS3 and CS4, SOC stock gains of +200g m−2, +453 and +164 g m−2, respectively, were observed (Fig. 1a, Table 2a). Specifically tested, none of these SOC stock changes at CS1, CS3 and CS4 were significantly different from CS2reference (P>0.1 each). However, at the increasingly warmer CS5 and CS6, the SOC stock was dramatically reduced by −608 and −447 g m−2 after 5 years (Fig. 1a, Table 2a, P≤0.004 each, against CS2reference).
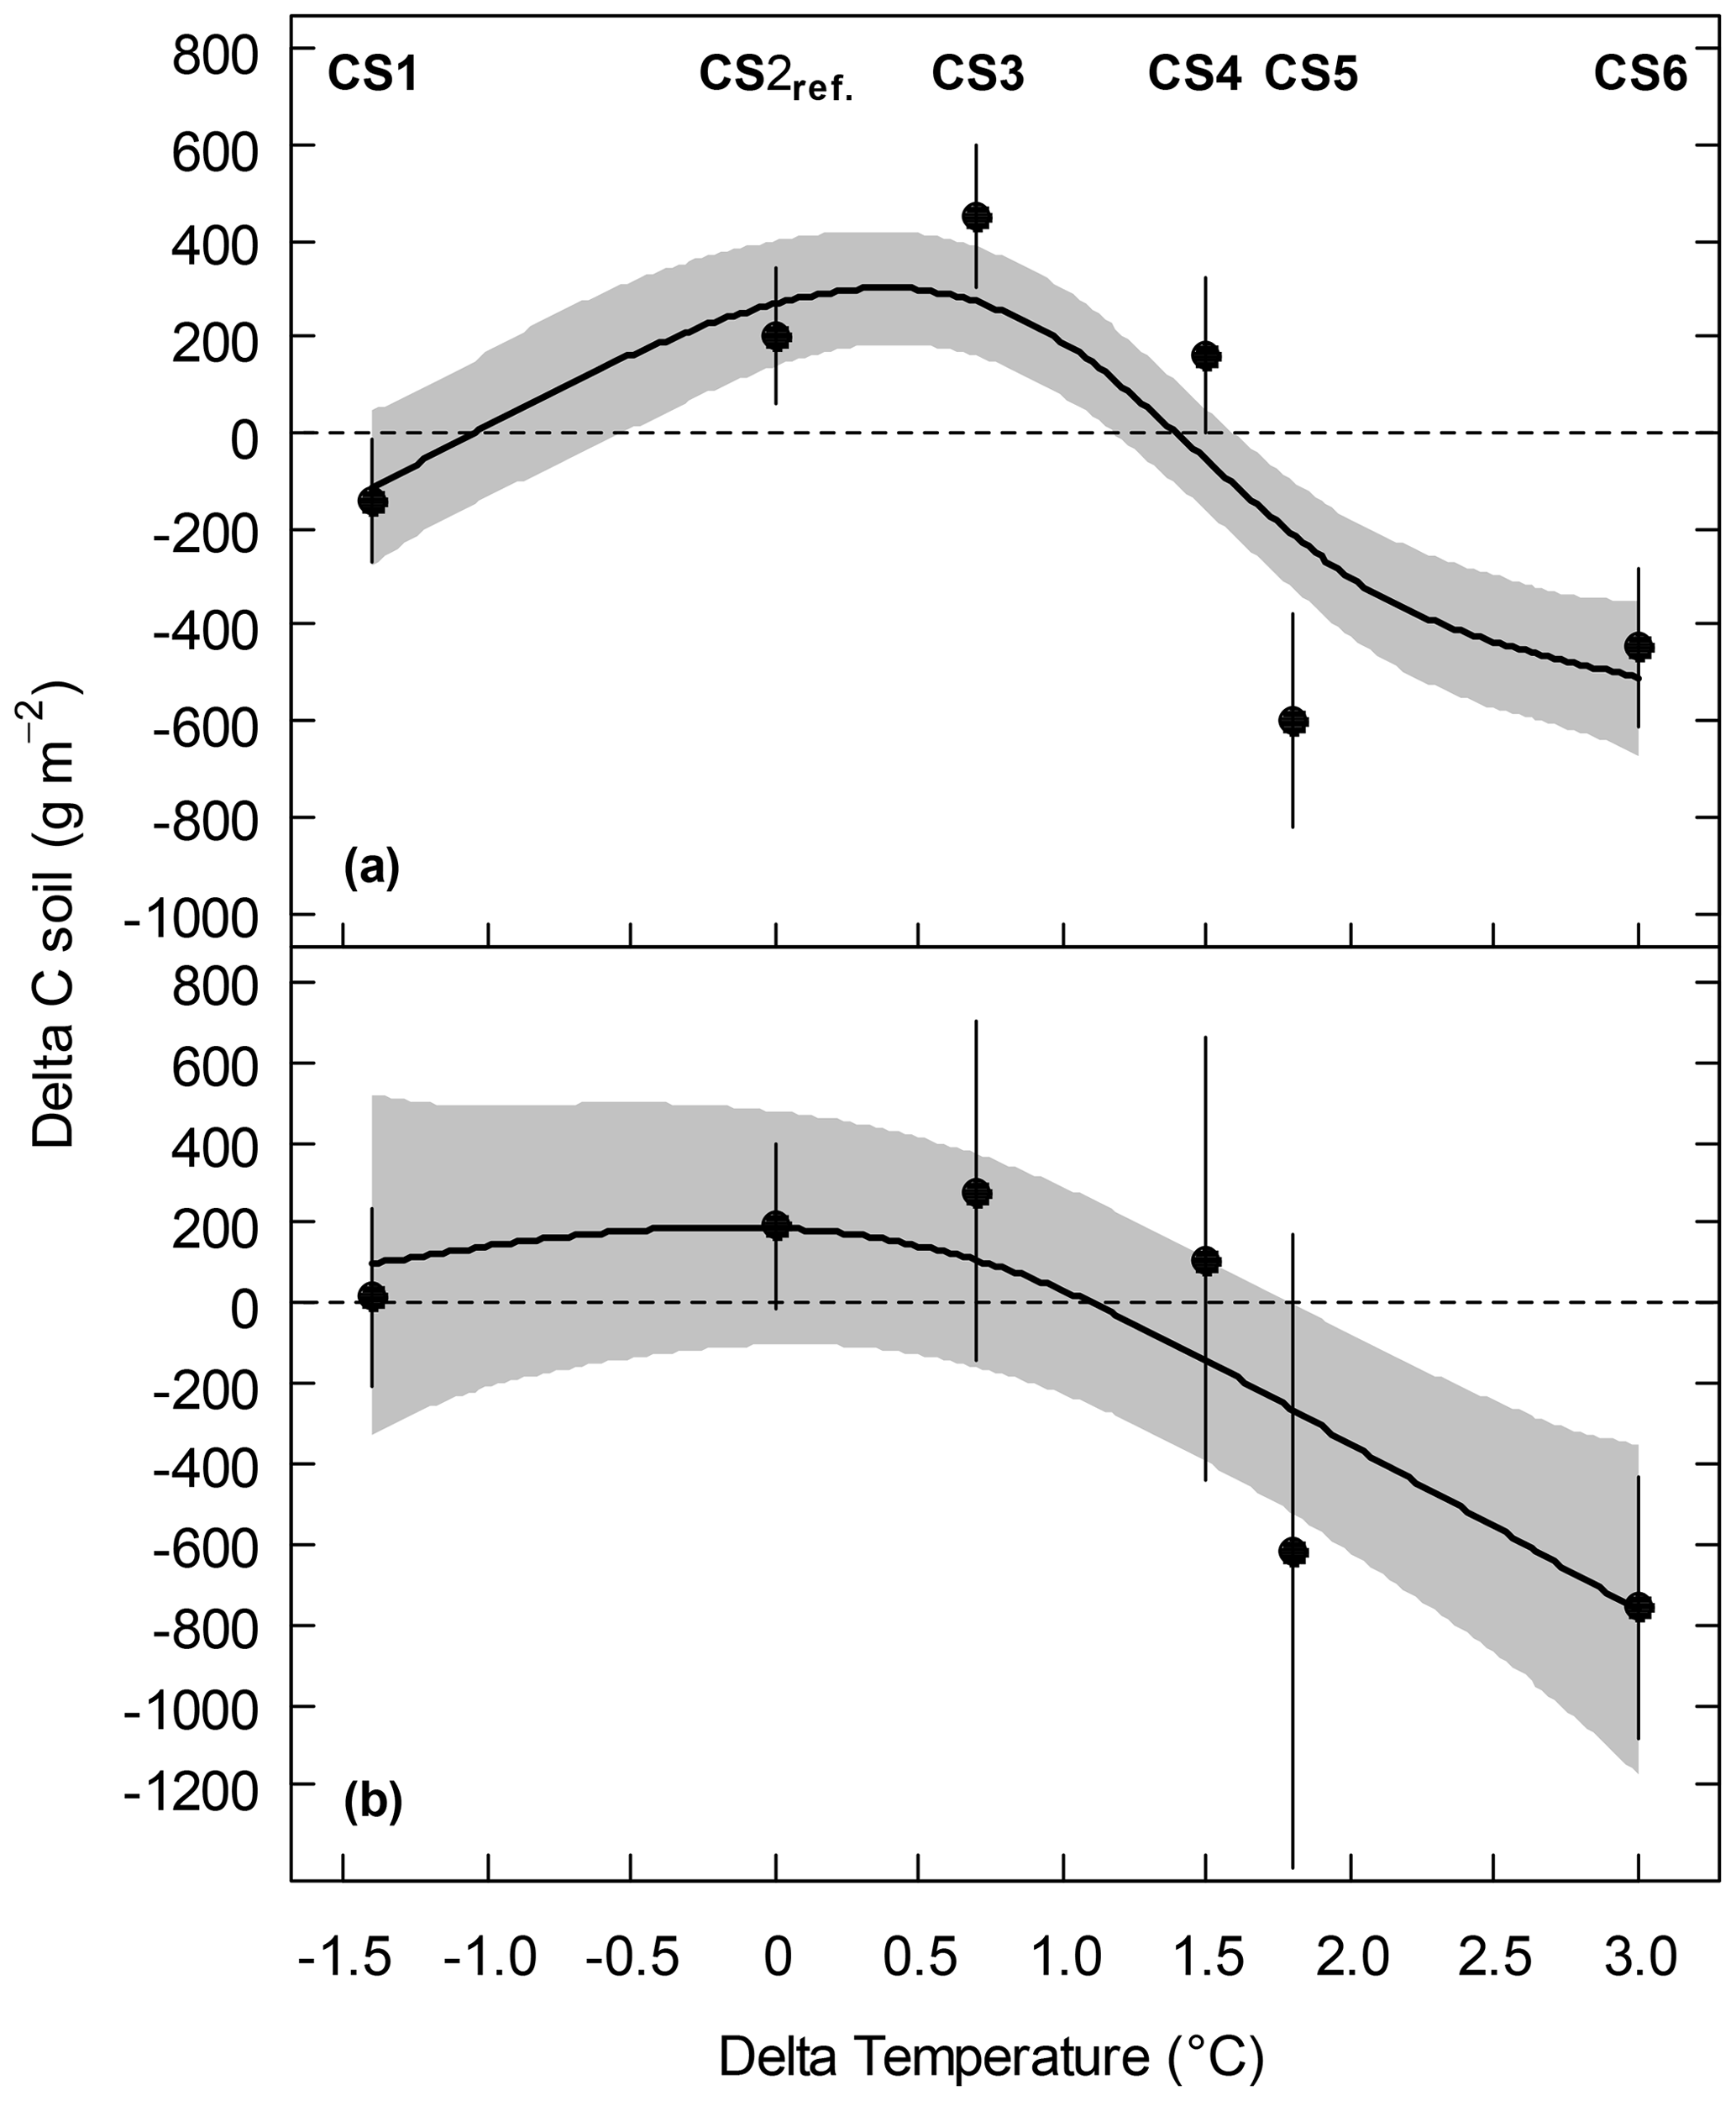
Figure 1SOC stock change (Delta C soil) of subalpine grassland between 2012 and 2017 at six climate scenario sites (CS) as a function of the temperature change (Delta temperature of the April–October mean) induced by the climate change treatment. (a) All monoliths, pooled across the irrigation and N treatments, and (b) control monoliths only that received neither irrigation nor additional N. Symbols are means ±1 SE, and predicted lines are based on a generalized additive model (GAM) to all monoliths per group (±1 SE, grey shaded). See Appendix Table B4 for the GAM summary.
Table 2SOC stock (g C m−2) at the beginning of the experiment and after 5 years of climate scenario treatment at six climate scenario (CS) sites. Data refer to (a) all monoliths, pooled across the irrigation and N treatments, and (b) control treatment that received neither irrigation nor additional N. SOC in 2012 did not significantly differ among the six CS sites (ANOVA: all monoliths: , P=0.082; control monoliths: , P=0.676).
No significant effects on SOC stock changes were associated with the irrigation and the N deposition treatments (Appendix Fig. A1, Table B1). Considering only the control monoliths, which received neither irrigation nor additional N, the same patterns appeared, although with larger standard errors due to smaller sample size (Fig. 1b, Table 2b).
3.2 Plant C stock belowground parallels soil organic C
In the final 2017 harvest, across all monoliths moderate warming at CS3 resulted in an increased root C stock of +166 g m−2 (P=0.021, against CS2reference), while root C stock at CS4 equaled that of CS2reference (P=0.998, Fig. 2a). By contrast, root C stock was significantly reduced in the warmer CS5 and CS6 sites (P<0.001 each, against CS2reference), without an equivalent decrease in shoot C stock (P>0.2 for all single CSs against CS2reference, Fig. 2a). The root shoot ratios of plant C stocks were (from CS2reference to CS6) 3.4, 3.5, 3.7, 1.8 and 2.1. Thus, compared to the CS2reference site, the relative allocation of C to roots was reduced by about half in CS5 (−48 %) and CS6 (−39 %), indicating that intensive warming has strongly changed the root shoot ratio in favor of the shoots (Fig. 2a). Neither the irrigation nor the N deposition treatment had an effect on root and shoot C stock in 2017 after 5 years of treatment (Appendix Tables B2 and B3).
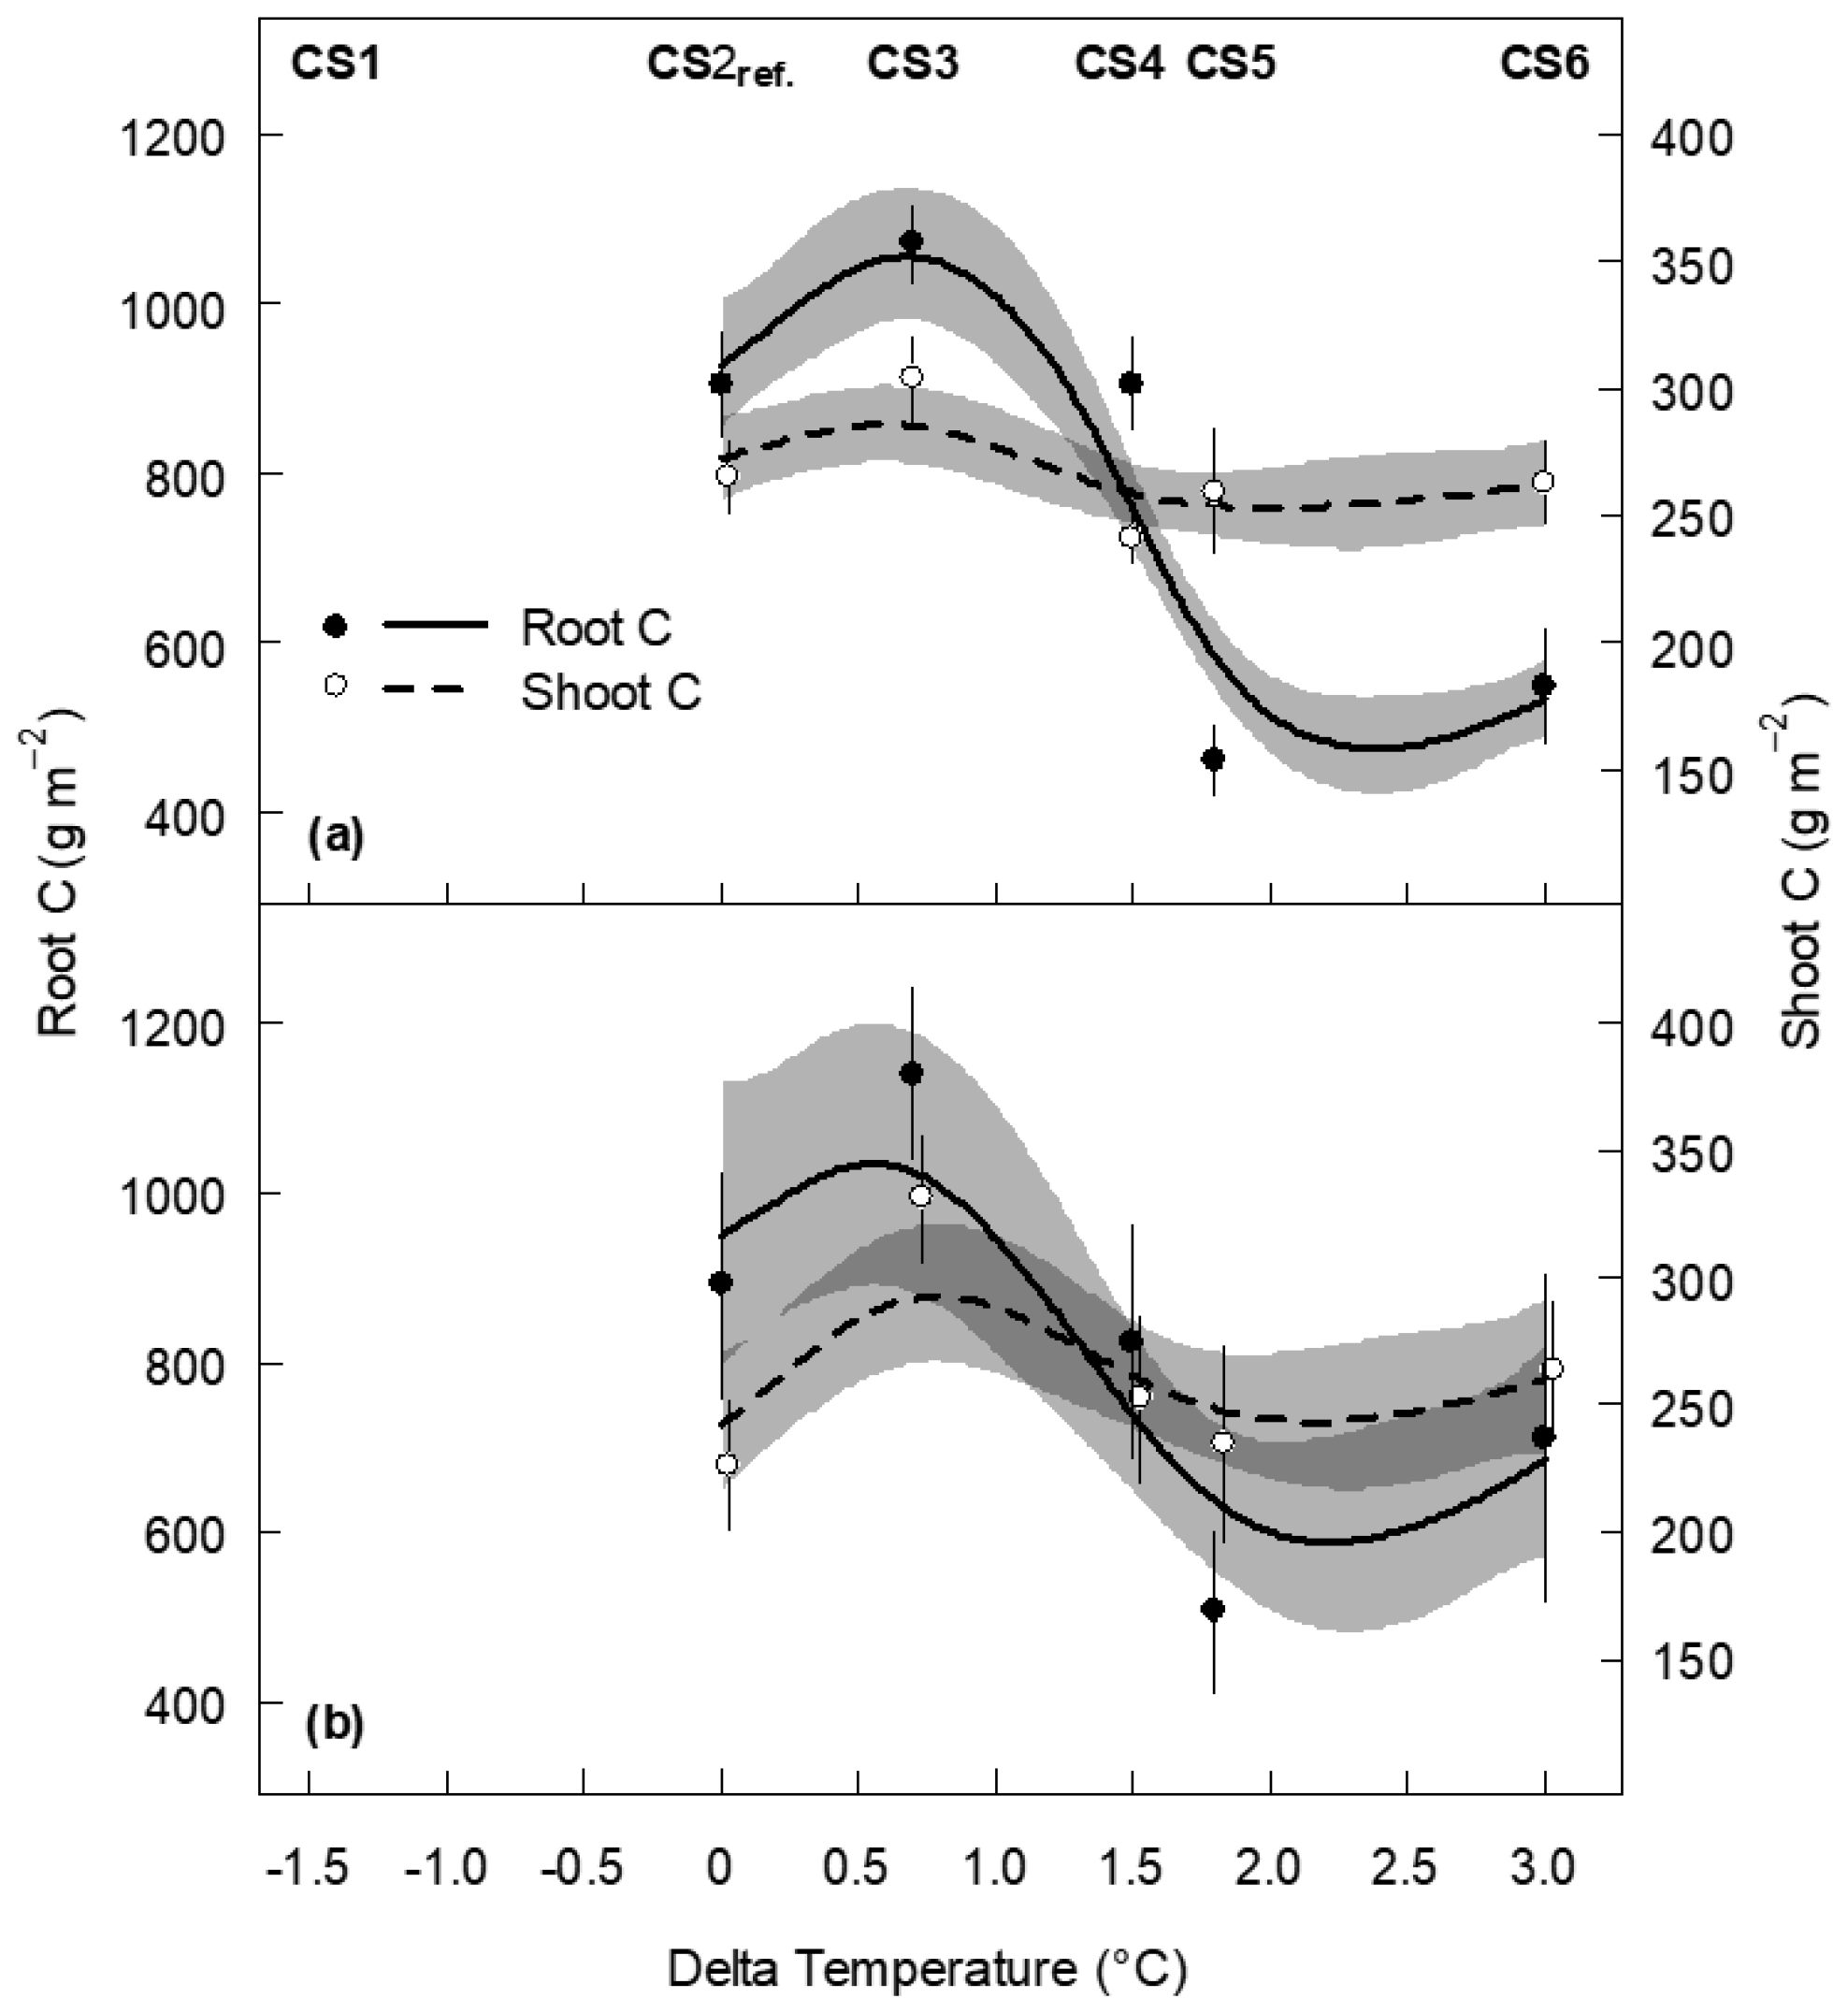
Figure 2Root and shoot carbon stock of subalpine grassland at five climate scenario sites (CSs) as a function of the temperature change (Delta temperature of the April–October mean) induced by the climate scenario treatment. Data are from 2017, after 5 years of experimental duration. (a) All monoliths, pooled across the irrigation and N treatments and (b) control monoliths only that received neither irrigation nor additional N. Symbols are means ±1 SE, and predicted lines are based on a generalized additive model to all monoliths per group (±1 SE, grey shaded; dark grey indicates the cross section of the two SE bands). See Appendix Tables B5 and B6 for the GAM summaries. No data were available for the CS1 site. Overlapping means and SEs are shifted horizontally to improve their visibility, and note the different y axes for root and shoot C.
Regarding the control monoliths group, the CS treatments revealed similar effects on each root and shoot C compared to all monoliths, although the reduction of root C stock at CS6 was somewhat less pronounced (Fig. 2b).
3.3 Increased ecosystem respiration draws down net ecosystem productivity C balance
Seasonal temperature, soil moisture and canopy development determined the magnitude of gross primary productivity (GPP) and ecosystem respiration (ER) during 5 years at the three climate scenario sites CS2reference, CS4 and CS6, where NEE was measured and parameterized (Appendix Fig. A2). Cumulative GPP CO2 gains were not affected by the climate scenario treatment, but over time trajectories of cumulative ER CO2 losses were significantly different from CS2reference in the warmest climate scenario CS6 (+38 %) (Fig. 3). As a result, we found an ER-driven change of the NEP balance with climate scenario. While NEP was consistently positive in CS2reference and CS4 (season +1.5 ∘C), there was a critical climate step between CS4 and CS6 (season +3.0 ∘C), resulting in a negative 5-year NEP of −586 g C m−2 at CS6 (Fig. 4).
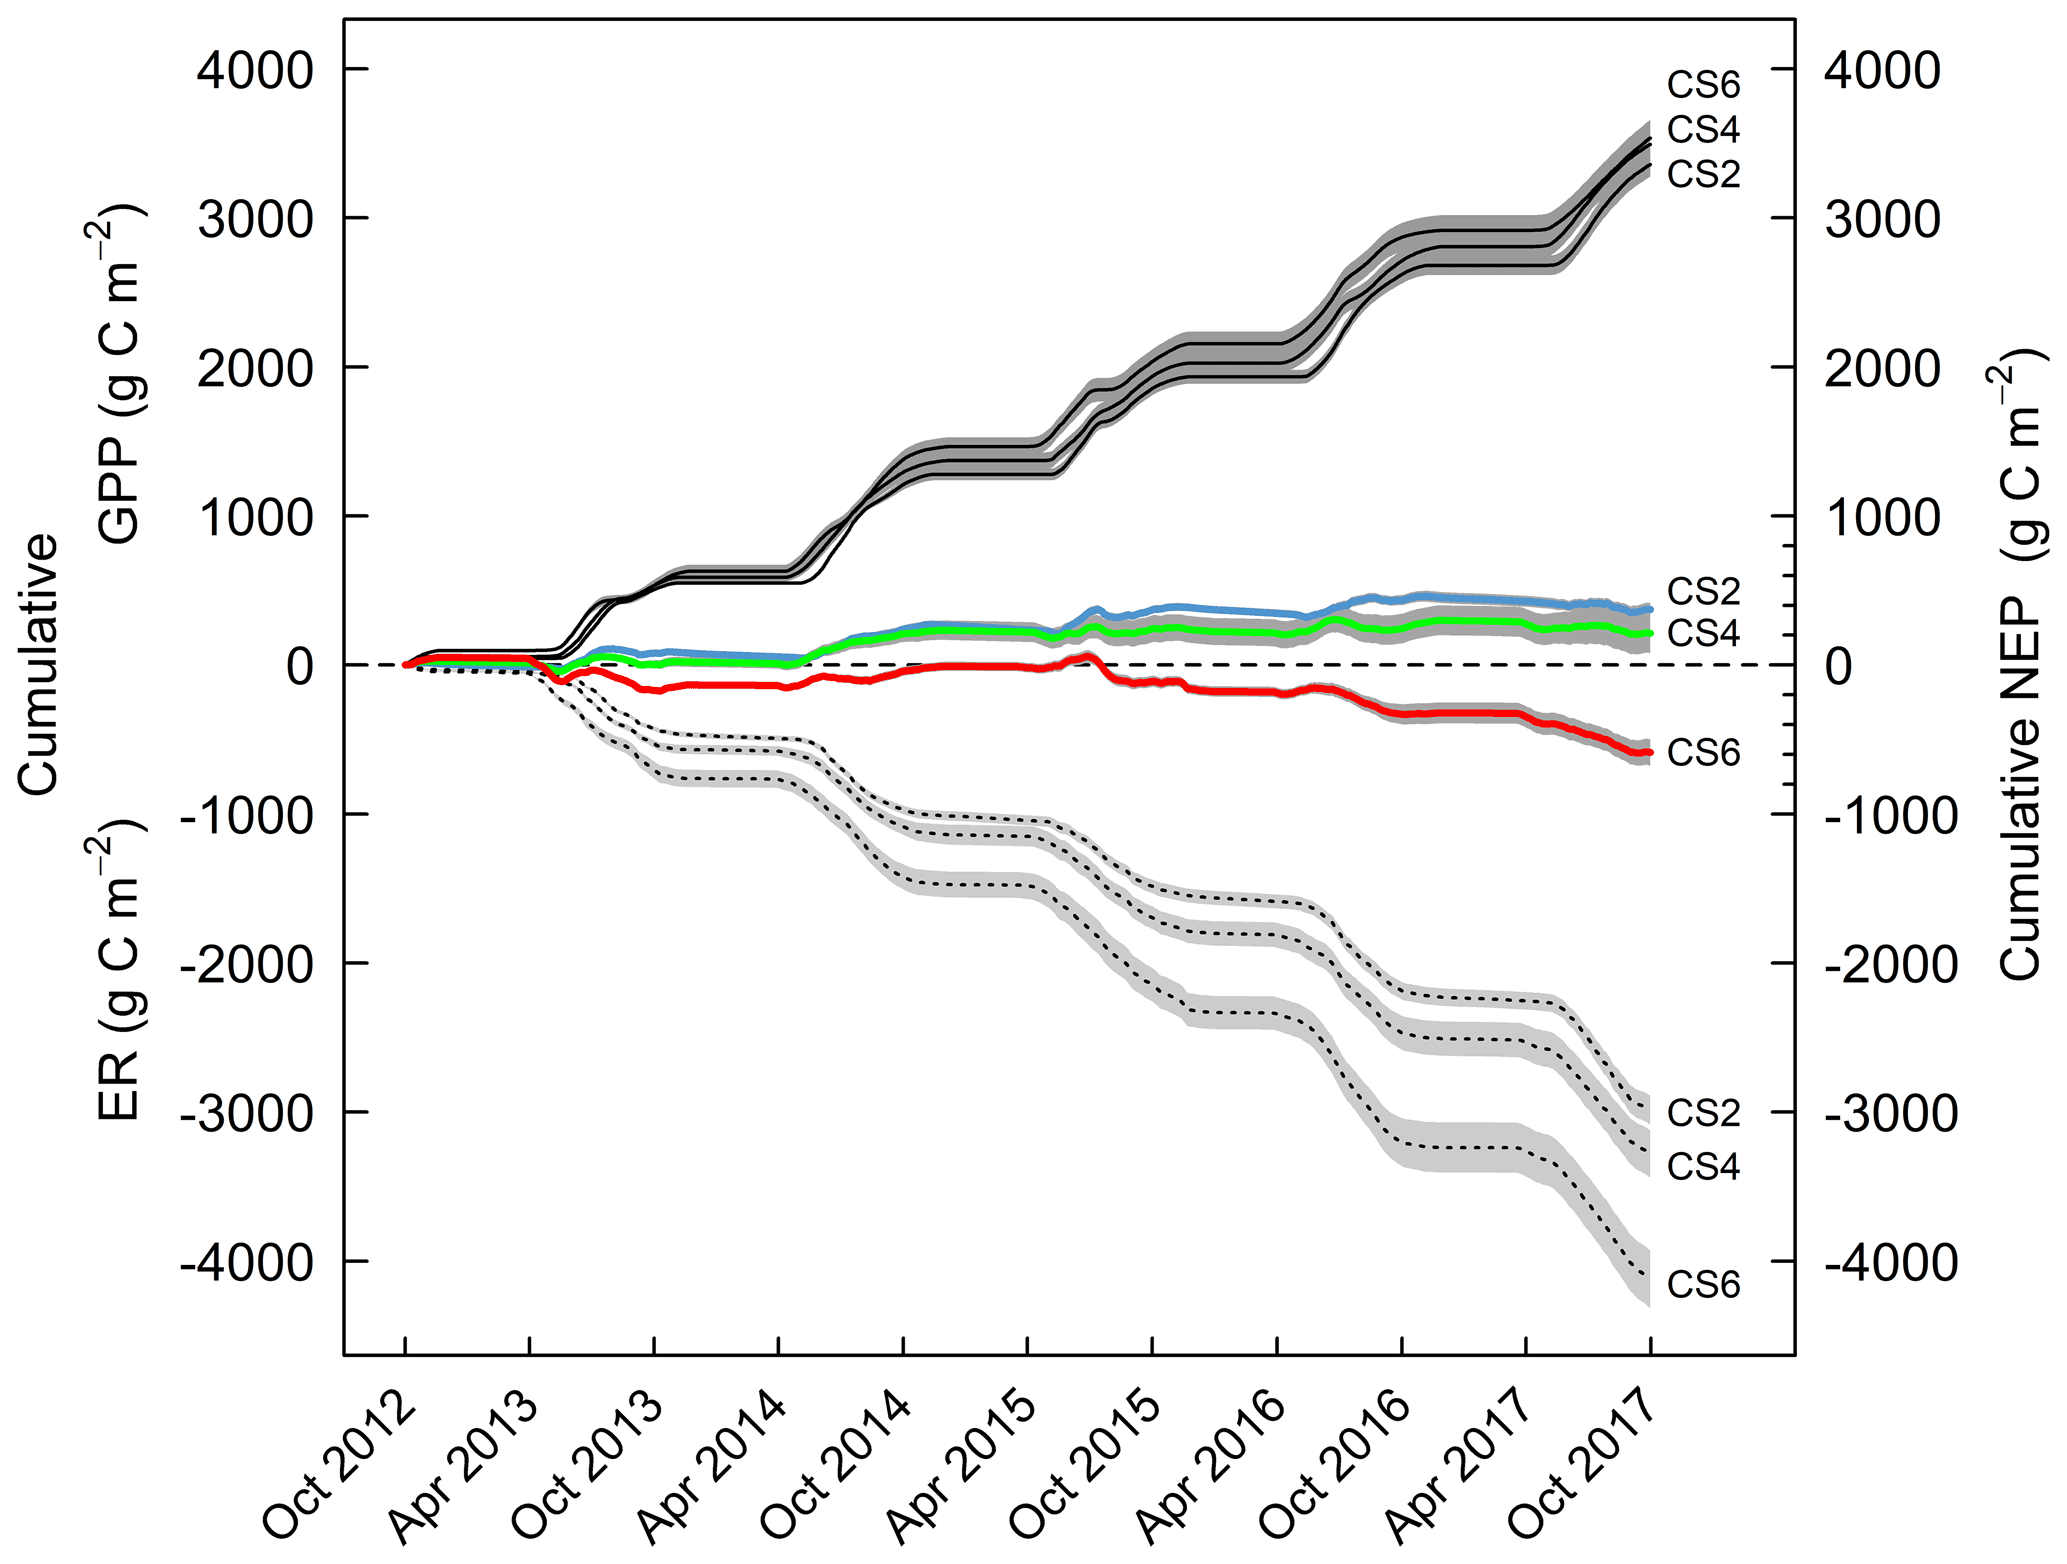
Figure 3Cumulative trajectory of gross primary productivity (GPP, solid lines), ecosystem respiration (ER, dashed lines) and net ecosystem productivity (NEP, colored lines) at three climate scenario sites from October 2012 to September 2017. Displayed are means ±1 SE (shaded grey) of the control treatment that received neither irrigation nor additional N.
3.4 Cumulative shoot C harvested and leachate C lost
Cumulative shoot C harvested over the 5 experimental years and cumulative losses of leachate C were small relative to the cumulative ER losses: cumulative shoot C was about of ER, and leachate C less than (Table 3b). Cumulative shoot C harvested at CS4 and CS6 was each not significantly different from that at CS2reference (P>0.5 each), and the same held true for cumulative losses of leachate C (P>0.5 for CS4 and CS6).
Table 3Net ecosystem C balance for CS2reference, CS4 and CS6, alternatively based on C stocks (a) and C fluxes (b). Data for all stocks and fluxes are means ±1 SE from the same six control monoliths per CS that received neither irrigation nor additional N.
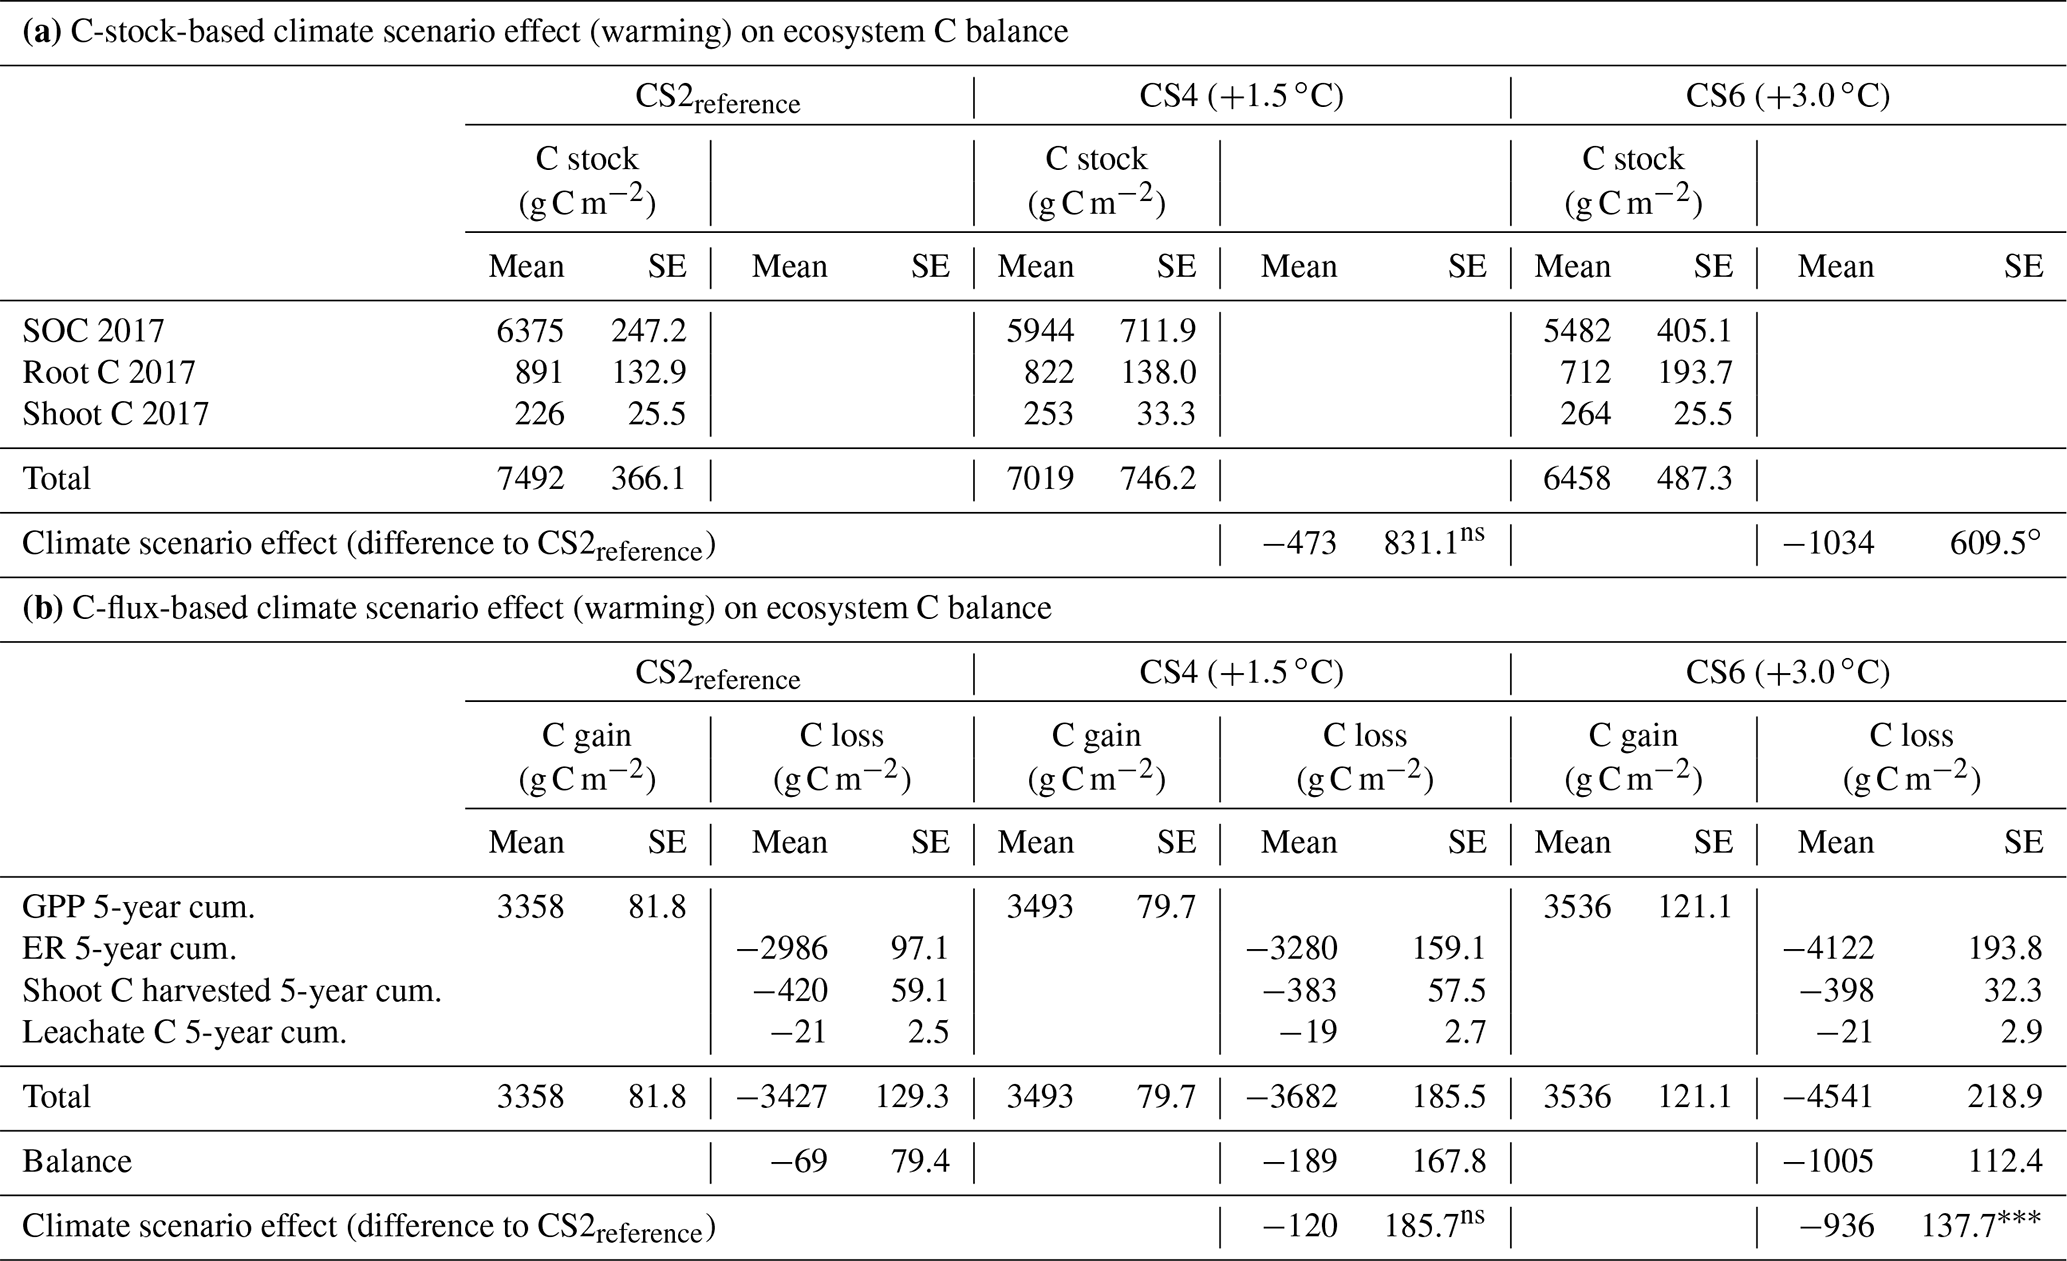
cum.: cumulative. P<0.001. ∘ P=0.12. ns (not significant) P>0.2.
3.5 C stock changes matched cumulated C fluxes in net ecosystem C balance
The net ecosystem C balance largely agreed between the two approaches (Table 3). Compared to CS2reference, the C stock method assigned a −473 g C m−2 balance to the CS4 site (t10=0.57, P=0.581) and a −1034 g C m−2 balance to the CS6 site (t=1.70, P=0.12). In comparison, the C-flux-based method revealed a −120 g C m−2 balance at the CS4 site (t10=0.65, P=0.530) and a −936 g C m−2 balance at the CS6 site (t=6.81, P<0.001). Taken together, while some, but not significant, C loss was associated with a seasonal warming of +1.5 ∘C, both approaches demonstrated a massive C loss with a seasonal warming of +3.0 ∘C.
Physical and chemical soil properties limit the potential maximum size of the SOC stock. While belowground biomass turnover rate, root exudates and aboveground litter production rate determine the major C input rate, the C output rate is determined by decomposition of OC through soil microbiota. Both C input and output strongly depend on temperature and water availability. As a consequence of the altitudinal transplantation, the climatic conditions at the climate change CS sites were radically different compared to CS2reference. Thus depending on the climate scenario, the parameters that drove C input and output have changed simultaneously, and the grassland has either acted as a marginal C sink or a strong C source. Only during the long winter period was the warming treatment effectively suspended, and climatic conditions under the snow cover were very similar. For a discussion of the importance of winter vs. summer warming please, see Kreyling et al. (2019).
It is important to note that our description of the C balance temperature response is not based on soil temperature, but based on air temperature change, because it is the reference to describe climate change effects on ecosystems. Also, under field conditions there is no single soil temperature, but an extremely dynamic, diurnal soil depth temperature gradient that drives the CO2 evolution from various organic matter fractions with different temperature sensitivities (Conant et al., 2011; Subke and Bahn, 2010).
4.1 The C stock of soil and plants
By integrating the C stock changes of a grassland ecosystem with intact C input pathways, our study avoids many of the shortfalls that impair the prediction of the fate of the terrestrial soil C sink, such as monitoring the temperature sensitivity of SOC decomposition in incubated soils (Crowther et al., 2016).
At the moderately warmer CS3 and CS4 and at the colder CS1, SOC stocks were not significantly different from CS2reference that was used as the reference site. The quite substantial, yet not significant, SOC stock gain at CS3 may suggest the chance for a net soil C sink at increased seasonal mean temperatures up to 0.7 ∘C. This hypothesis is supported by the increased root C stock found there (P=0.021, Fig. 2a). We suggest that mitigation of the thermal growth limitation has increased plant productivity (Volk et al., 2021) and created a larger potential for plant OC input. Assuming that the root turnover rate is not reduced, this means that the input of OC to the soil has increased.
At extreme warming climate scenarios, the dynamics of root OC stock were strikingly similar to SOC stock change, and both were substantially reduced at CS5 and CS6 (compare Figs. 1 and 2). This indicates that under these climatic conditions a reduced supply of organic material from belowground plant fractions is one likely reason for the shrinking SOC stock at CS5 and CS6. Importantly though, because SOC derives from dead plant material, OC supply to the soil does not depend directly on the plant standing C stock, but on the turnover rate of this C stock. We suggest that in our study the allocation pattern at the control site CS2reference is representative for the high ratio commonly found at high altitudes (e.g., Leifeld et al., 2013). It is thus likely that the reduced belowground biomass at the warmer CS reflects an increased turnover rate of belowground plant material and the associated C stock and a transition towards a new functional root–shoot equilibrium (Poorter et al., 2012) with a lower ratio, typical for low altitudes. Although there can be compensatory root growth and C storage in the subsoil below 10 cm depth (Jia et al., 2019), we assume that in our grassland there is only a small compensation potential for topsoil SOC stock losses in these depths, because the soils are only ca. 20 cm deep in total. In agreement, a similar response pattern, but much larger in scale, was reported from a large, natural geothermal warming grassland experiment in Iceland (Poeplau et al., 2017): 0.7 ∘C warming increased topsoil SOC by 22 %, while further warming led to dramatic SOC stock decreases.
The N resource is of great importance for plant productivity and microbial decomposition of SOC. For example in a similar subalpine grassland (Alp Flix experiment), a 10 and 50 kg N ha−1 yr−1 deposition treatment led to a 9 % and 31 % increase in plant productivity, respectively (Volk et al., 2011). In the same experiment, there was a strong N-related increase in SOC stock at low deposition rates up to 10 kg N ha−1 yr−1 and smaller increases at high deposition rates up to 50 kg N ha−1 yr−1 (Volk et al., 2016). Yet, in the present study with a maximum deposition treatment of 15 kg N ha−1 yr−1, we observed neither a plant response (Volk et al., 2021) nor a SOC response (Table A1), suggesting no mitigation of a (presumed) N limitation of plant productivity or microbial activity. As a result, also the 15 kg N treatment appears to be below the critical load for a change of the SOC stock. Still, this conclusion needs to be viewed with caution because N effects on SOC stock could change over longer timescales. For example, in the Alp Flix experiment it was shown that, after 7 years of exposure, most of the added N was taken up by plants and did not reach soil N pools (Bassin et al., 2015). This implies that N availability for soil microorganisms may not have changed with our 15 kg N ha−1 yr−1 treatment after 5 years but may do so after a longer lag phase.
Water availability is an essential factor for the ecosystem response to warming (compare below), but the irrigation treatment in our experiment yielded no effect. We assume that the applied amount was insufficient to make a difference, in particular at the warmer CSs, because we deem it likely that water was a limiting factor there. For details on water availability at the climate scenarios and the effect of irrigation on aboveground plant productivity, please refer to Volk et al. (2021; Table 2). Thus, results from the current experiment must leave it open whether mitigation of water shortage due to warming would change SOC stocks.
Warming, nitrogen and water must also be expected to affect plant species composition, which in turn may affect ecosystem C fluxes. In a very similar environment Bassin et al. (2009) studied 11 key plant species of a subalpine pasture and found only very small responses of growth to N deposition, except for the cyperaceous Carex sempervirens. Within the experiment described here, Wüst-Galley et al. (2021) predicted an increased grass cover at the expense of forbs and legumes with rising temperatures and N deposition, while they found increased sedge cover with cooler temperatures and N deposition. In consequence, changes in plant species composition in response to the applied climate change scenarios can be assumed, but attempting to predict effects on the ecosystem C stock would be highly speculative.
4.2 CO2 fluxes (GPP, ER, NEP)
Lacking other pathways of OC input, such as manure applications for fertilization, the single source for all OC contained in our grassland ecosystem is photosynthetic assimilates (GPP). Despite a positive effect of warming on aboveground plant productivity (Volk et al., 2021), the 5-year GPP flux – quantifying the total amount of assimilated C – was not significantly different between climate scenario treatments CS2reference and CS4 and CS6 each (Fig. 4). This result is in good agreement with a meta-analysis of C flux of 70 grassland sites (Wang et al., 2019).
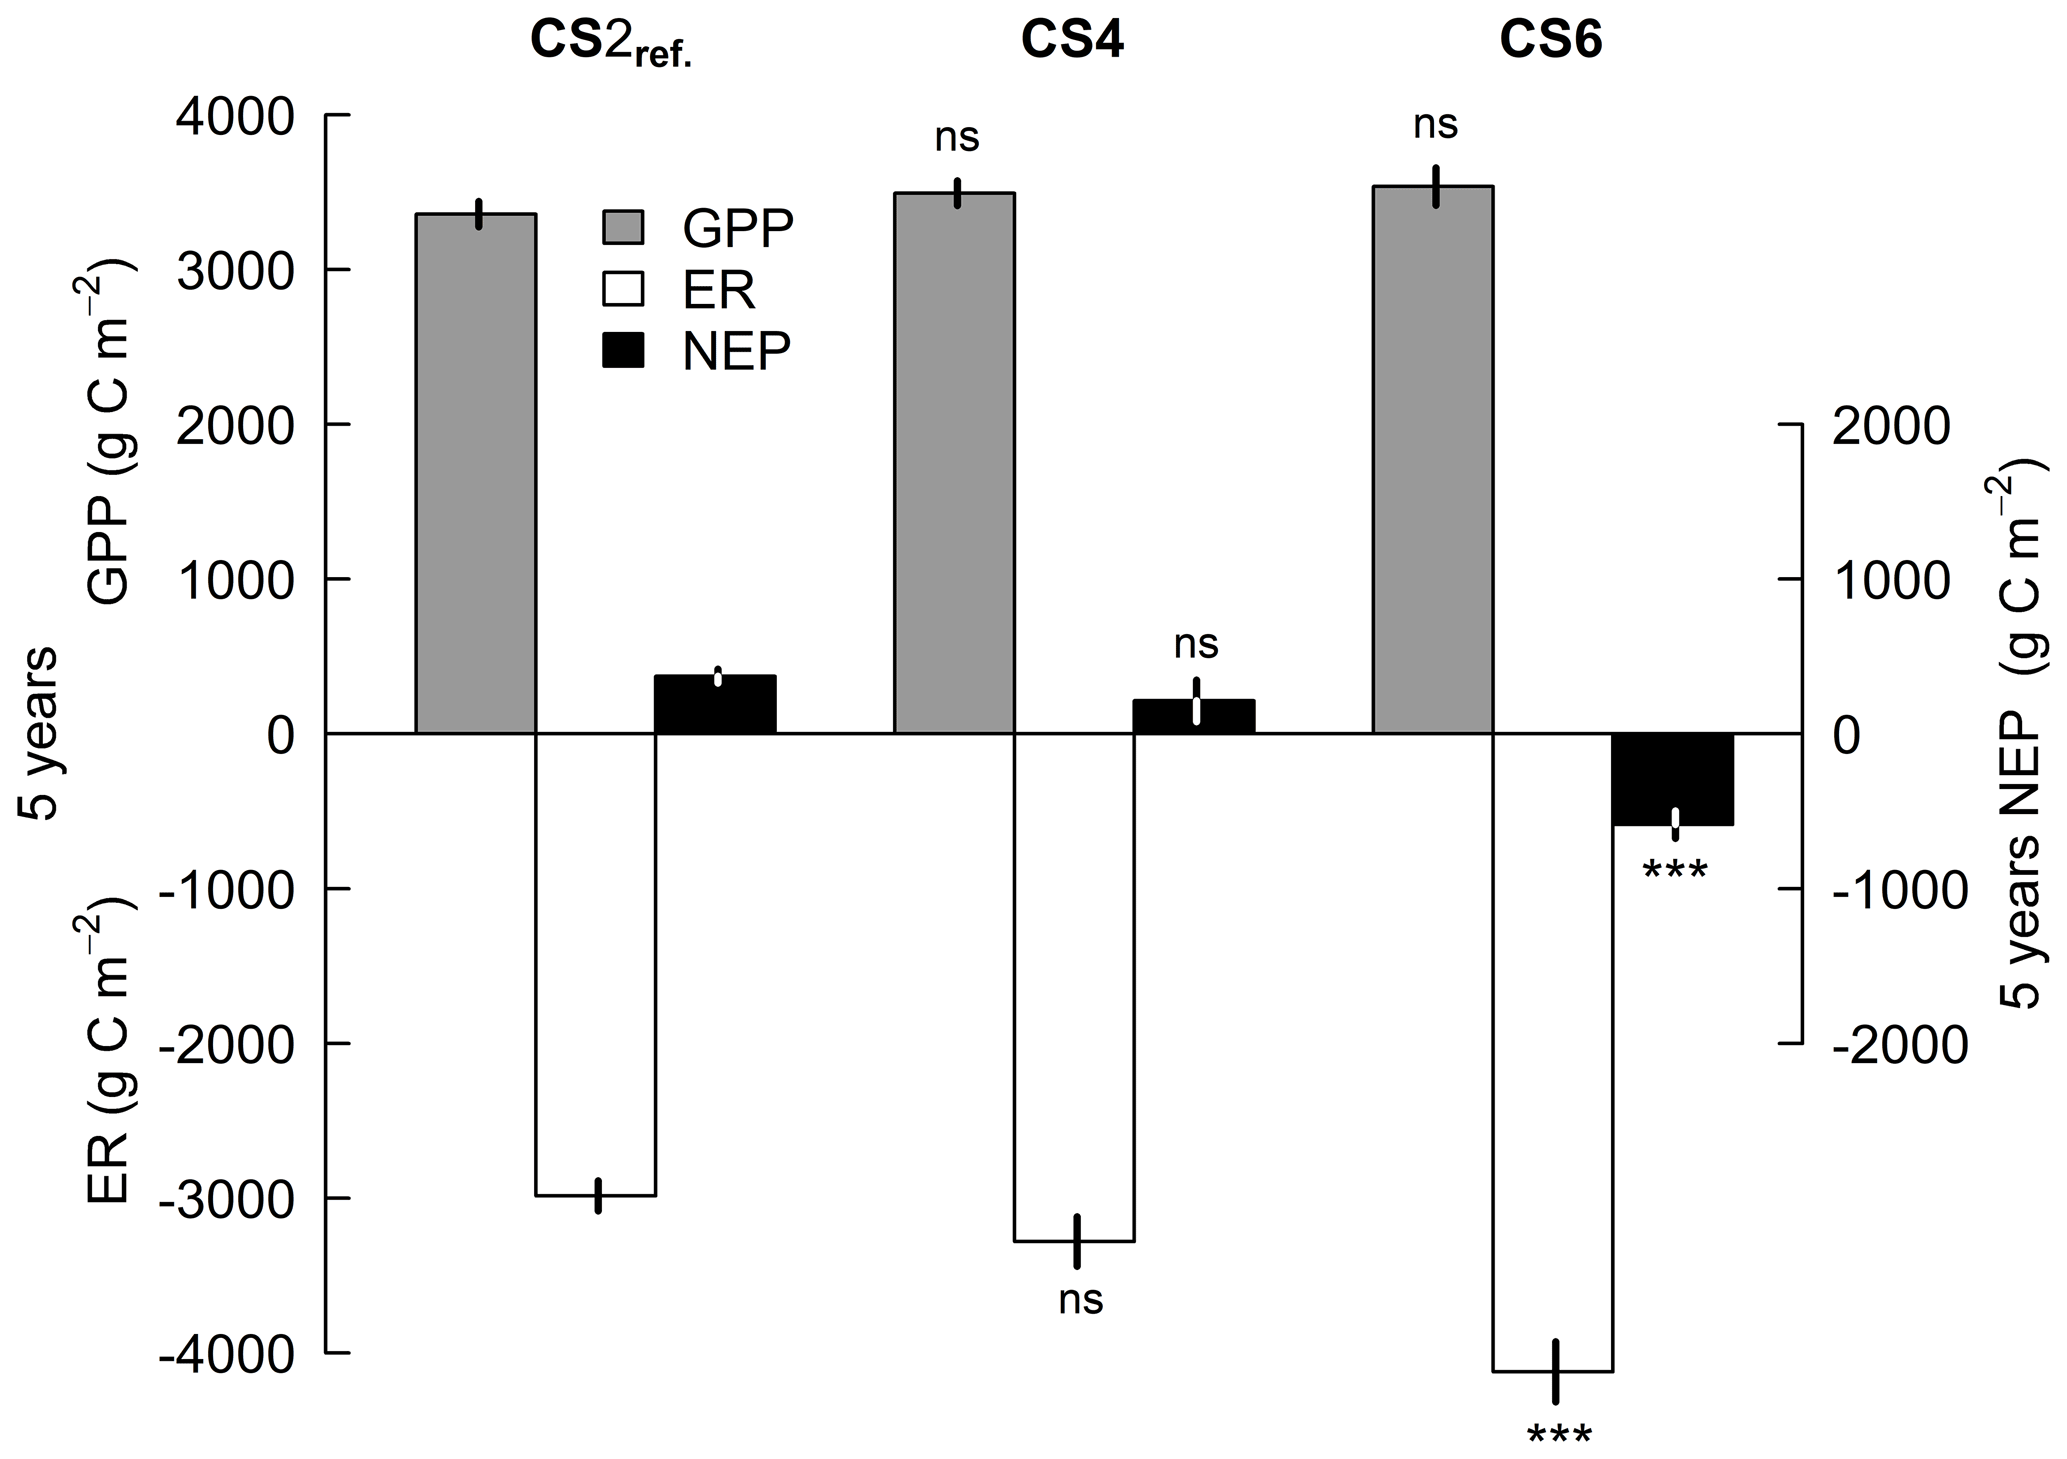
Figure 4C flux balance of 5-year totals of gross primary productivity (GPP), ecosystem respiration (ER) and net ecosystem productivity (NEP) at three climate scenario sites. Displayed are means ±1 SE of the control treatment that received neither irrigation nor additional N. Significance tests are against CS2reference within each C flux category; moreover, all three means to NEP were significantly different from zero (P<0.05). P<0.001. ns P>0.1.
The annual mean ER observed at CS4 was very similar (656 g C m−2) compared to the soil respiration of 729 g C m−2 that Bahn et al. (2008) reported from a grassland site that had the same altitude. However, ER at CS6 developed quite differently: the ecosystem respiration metabolized 1136 g C m−2 more in 5 years compared to CS2reference (Table 3b). Since soil respiration at in situ measurements is mostly driven by young OM (≥90 %; Giardina et al., 2004), we assume that except for autotrophic respiration mostly all of the substrate for the ER observed here originated from the topsoil. For a small part, the substrate for a higher ER at higher temperatures must also derive from decaying belowground plant material that became obsolete with the new, temperature-adjusted allocation patterns. Assuming a similar biomass turnover rate at the different CSs and lacking other sources, we argue that only previously protected SOC may have supplied the remaining substrate for the C loss via ER.
The asymmetric response of GPP and ER to warming in our experiment resulted in a substantially negative CO2 balance, i.e., a negative NEP. By contrast, GPP and ER responded equivalently to warming in a mixed-grass prairie (C3 forbs and C4 grasses), yielding no change in NEP (Xu et al., 2016). Further, in the Alp Flix experiment on subalpine grassland, Volk et al. (2016) reported that the lowest NEPs were found in warm and dry years, while NEP was highest in a cool and moist year. Also, the warming of a tallgrass prairie suggested ecosystem C losses in dry years but C gains in wet years (Jung et al., 2019; but see also Reynolds et al., 2015, for a situation when warming and drought lead to reduced ER). Analogously, in experiments containing an elevated CO2 fumigation treatment that led to water saving effects, warming stimulated ER only under elevated CO2 (Ryan et al., 2015). We thus conclude that the wide range of possible NEP responses to warming depends on the warming benefit vs. water limitation trade-off when the temperature is rising.
4.3 Consistency of C stock changes vs. cumulated C fluxes
Because the C balance for CS2reference represents the situation without a climate scenario effect, comparison with the C balance at CS4 and CS6 reflects the effect of 5 years of climate scenario treatment, alternatively based on the 2012–2017 C stock changes (Table 3a) and on the 5-year cumulated C fluxes (Table 3b). All three CSs were evenly affected by potential management or inter-annual weather effects, so that the climate scenario effect alone is estimated. Theory demands that the climate scenario effect, calculated from SOC plus plant C stock, must match the respective effect based on C flux balances, given that all relevant pathways of C input and output were successfully covered. Our data impressively demonstrate such a congruence (Table 3). In absolute terms the ecosystem 5-year C loss due to the climate effect was ca. 1 kg C m−2 at CS6 (+3 ∘C) in agreement with both methods. This means, that 14 % of the previously stored greenhouse gas CO2 has now been returned to the atmosphere.
In contrast, other mountain grassland studies that present annual C balances often report C sinks. These studies mostly use eddy covariance measurements and have no multi-level treatments or replications that would allow to test a mechanistic hypothesis against the ecosystem response or assign a between-subject error to the reported fluxes.
For example, a recent analysis of net greenhouse gas (GHG) balances (including N2O and CH4) at 14 managed grassland sites resulted in C sinks between 70 and 4671 g CO2-eq. m−2 yr−1. Fluxes of non-gaseous C like manure or harvested biomass were, however, not provided (Hörtnagel et al., 2018). Rogger et al. (2022) reported a mean net biome production (NBP) gain of 154(±80) g C m−2 yr−1 from a 15-year data set at a site at 1000 m a.s.l. in Switzerland (including, e.g., harvest- and fertilization-related C fluxes), which represents a C sequestration of ca. 2.3 kg m−2 during the entire experiment. Also in the European GREENGRASS network (nine sites, including very intensively managed grassland), the annual C storage NBP in the grassland plots was on average 104(±73) g C m−2 yr−1 (Soussana et al., 2007). Finally, in a comprehensive 10-year comparison between an extensive (ecosystem was a C source) and an intensive grassland (ecosystem was a C sink), effects of management and weather on annual NBP were of similar magnitude (Ammann et al., 2020). Yet, in none of these studies were SOC stocks measured.
In comparison, in an overview of the all-European CARBOMONT project Berninger et al. (2015) did not identify substantial C sink properties, but they find that “especially the natural mountain grasslands in our study were quite close to carbon neutrality”. In our 5-year experiment, the equivalent value based on C flux measurements at CS2reference indicated a mean C source of 14 g C m−2 yr−1, essentially undistinguishable from zero (Table 3b).
Taken together, we suspect that substantial C sequestration situations cannot be considered typical in permanent mountain grasslands, but that a deviation from a zero balance indicates either a weather-driven year-to-year variability or an unaccounted for agricultural management effect. This implies that annual C budgets often represent a spotlight on a highly dynamic transition phase of the ecosystem OC stock.
Short-term grassland warming studies like our experiment must be regarded with caution when used to make long-term predictions, but analyses from the Icelandic ForHot experiment rated the parameter “SOC stock” to be a stable and consequently a useful predictor for the future state of the ecosystem already after 5–8 years of warming treatment (Walker et al., 2020). Because temperature sensitivity does not increase with soil depth (Pries et al., 2017) or varying recalcitrance of organic matter (Conen et al., 2006), topsoil temperature responses are also representative for subsoil responses. Thus, we assume that we missed no pathway of additional C input to supply the substrate consumed by increased ER and present a valid balance here.
Consequently, with respect to stocks and fluxes, we expect three alternative developments under sustained warming.
- a.
The remaining SOC stock is sufficiently protected to resist further decomposition at high rates, and ER will soon decrease.
- b.
Despite a very recalcitrant remaining SOC stock, the positive biomass response at intermediate climate scenarios not covered in this three-level comparison may supply sufficient new, labile OC from plants, and ER may remain high, with no further decline of the SOC stock.
- c.
The more active microbial community succeeds in accessing even more of the previously protected SOC stock for decomposition, and ER will remain high, leading to a further decline of the SOC stock.
The small change in the SOC stock at the CS2reference site after 5 years supports our initial assumption that the grassland was in (or close to) a steady-state situation. The warming climate scenario treatments led to up to 14 % reduced C stocks of the grassland ecosystem in 5 years, with a critical level between 1.5 and 3.0 ∘C seasonal warming. Independent ecosystem C flux measurements confirmed this result and showed that there was no equivalent productivity increase to compensate for the strongly increased ER, itself an indicator of accelerated decomposition. In the view of resource limitation, we suggest that the dramatic C loss of the grassland is a transient effect before a new, climate-adjusted steady state is reached.
A1 CO2 flux sign convention
Throughout this study we adopt an ecosystem perspective when stating gas fluxes. This implies that gross primary productivity (GPP) has a positive value, while ecosystem respiration (ER) has a negative value. Net ecosystem exchange (NEE) is positive when GPP > ER. Analogously, net ecosystem productivity (NEP) for a given time is positive, if the ecosystem is accumulating C.
A2 NEE
At 7–12 d yr−1, on snow-free days between April and December, NEE was measured for 5 years. NEEday measurements were done in full sunlight, between ca. 2 h before and after solar noon (clear-sky, midday conditions). NEEnight measurements were started no earlier than 1 h after sunset.
To measure NEE, we used a dynamic CO2 concentration, non-flowthrough cuvette made of transparent polyacrylics (30 cm × 40 cm × 35 cm). An infrared CO2 probe (GMP343 diffusion model, Vaisala, Vantaa, Finland) connected to a handheld control and logger unit (MI70 Indicator, Vaisala) was mounted inside the cuvette to directly measure the chamber [CO2]. A small fan created moderate turbulence inside the cuvette (0.5–0.8 m s−1) to facilitate air mixing. During the measurement, the cuvette was tightly sealed to the rim of the box containing the monolith using a cell foam band.
After placement of the chamber we waited a few moments for a continuous CO2 concentration trend to develop, and then data recording was started. CO2 concentration changes were measured at 5 s intervals during a 2 min measurement period per monolith. The first 10 s of data was omitted in subsequent measurements to allow for initial adjustment of chamber [CO2]. The quality of the measurement was considered acceptable if a linear regression of [CO2] vs. time during the following 110 s yielded R2 of 0.95 or better, indicating strictly linear changes in chamber [CO2]. The short measurement period was chosen to minimize changes in environmental conditions inside the chamber and avoid fogging of the cuvette at high evapotranspiration rates. CO2 concentration did not drop below 340 ppm or rise above 500 ppm. For each flux measurement, soil temperature of the respective monolith was recorded at 8 cm depth, using a handheld electric thermometer.
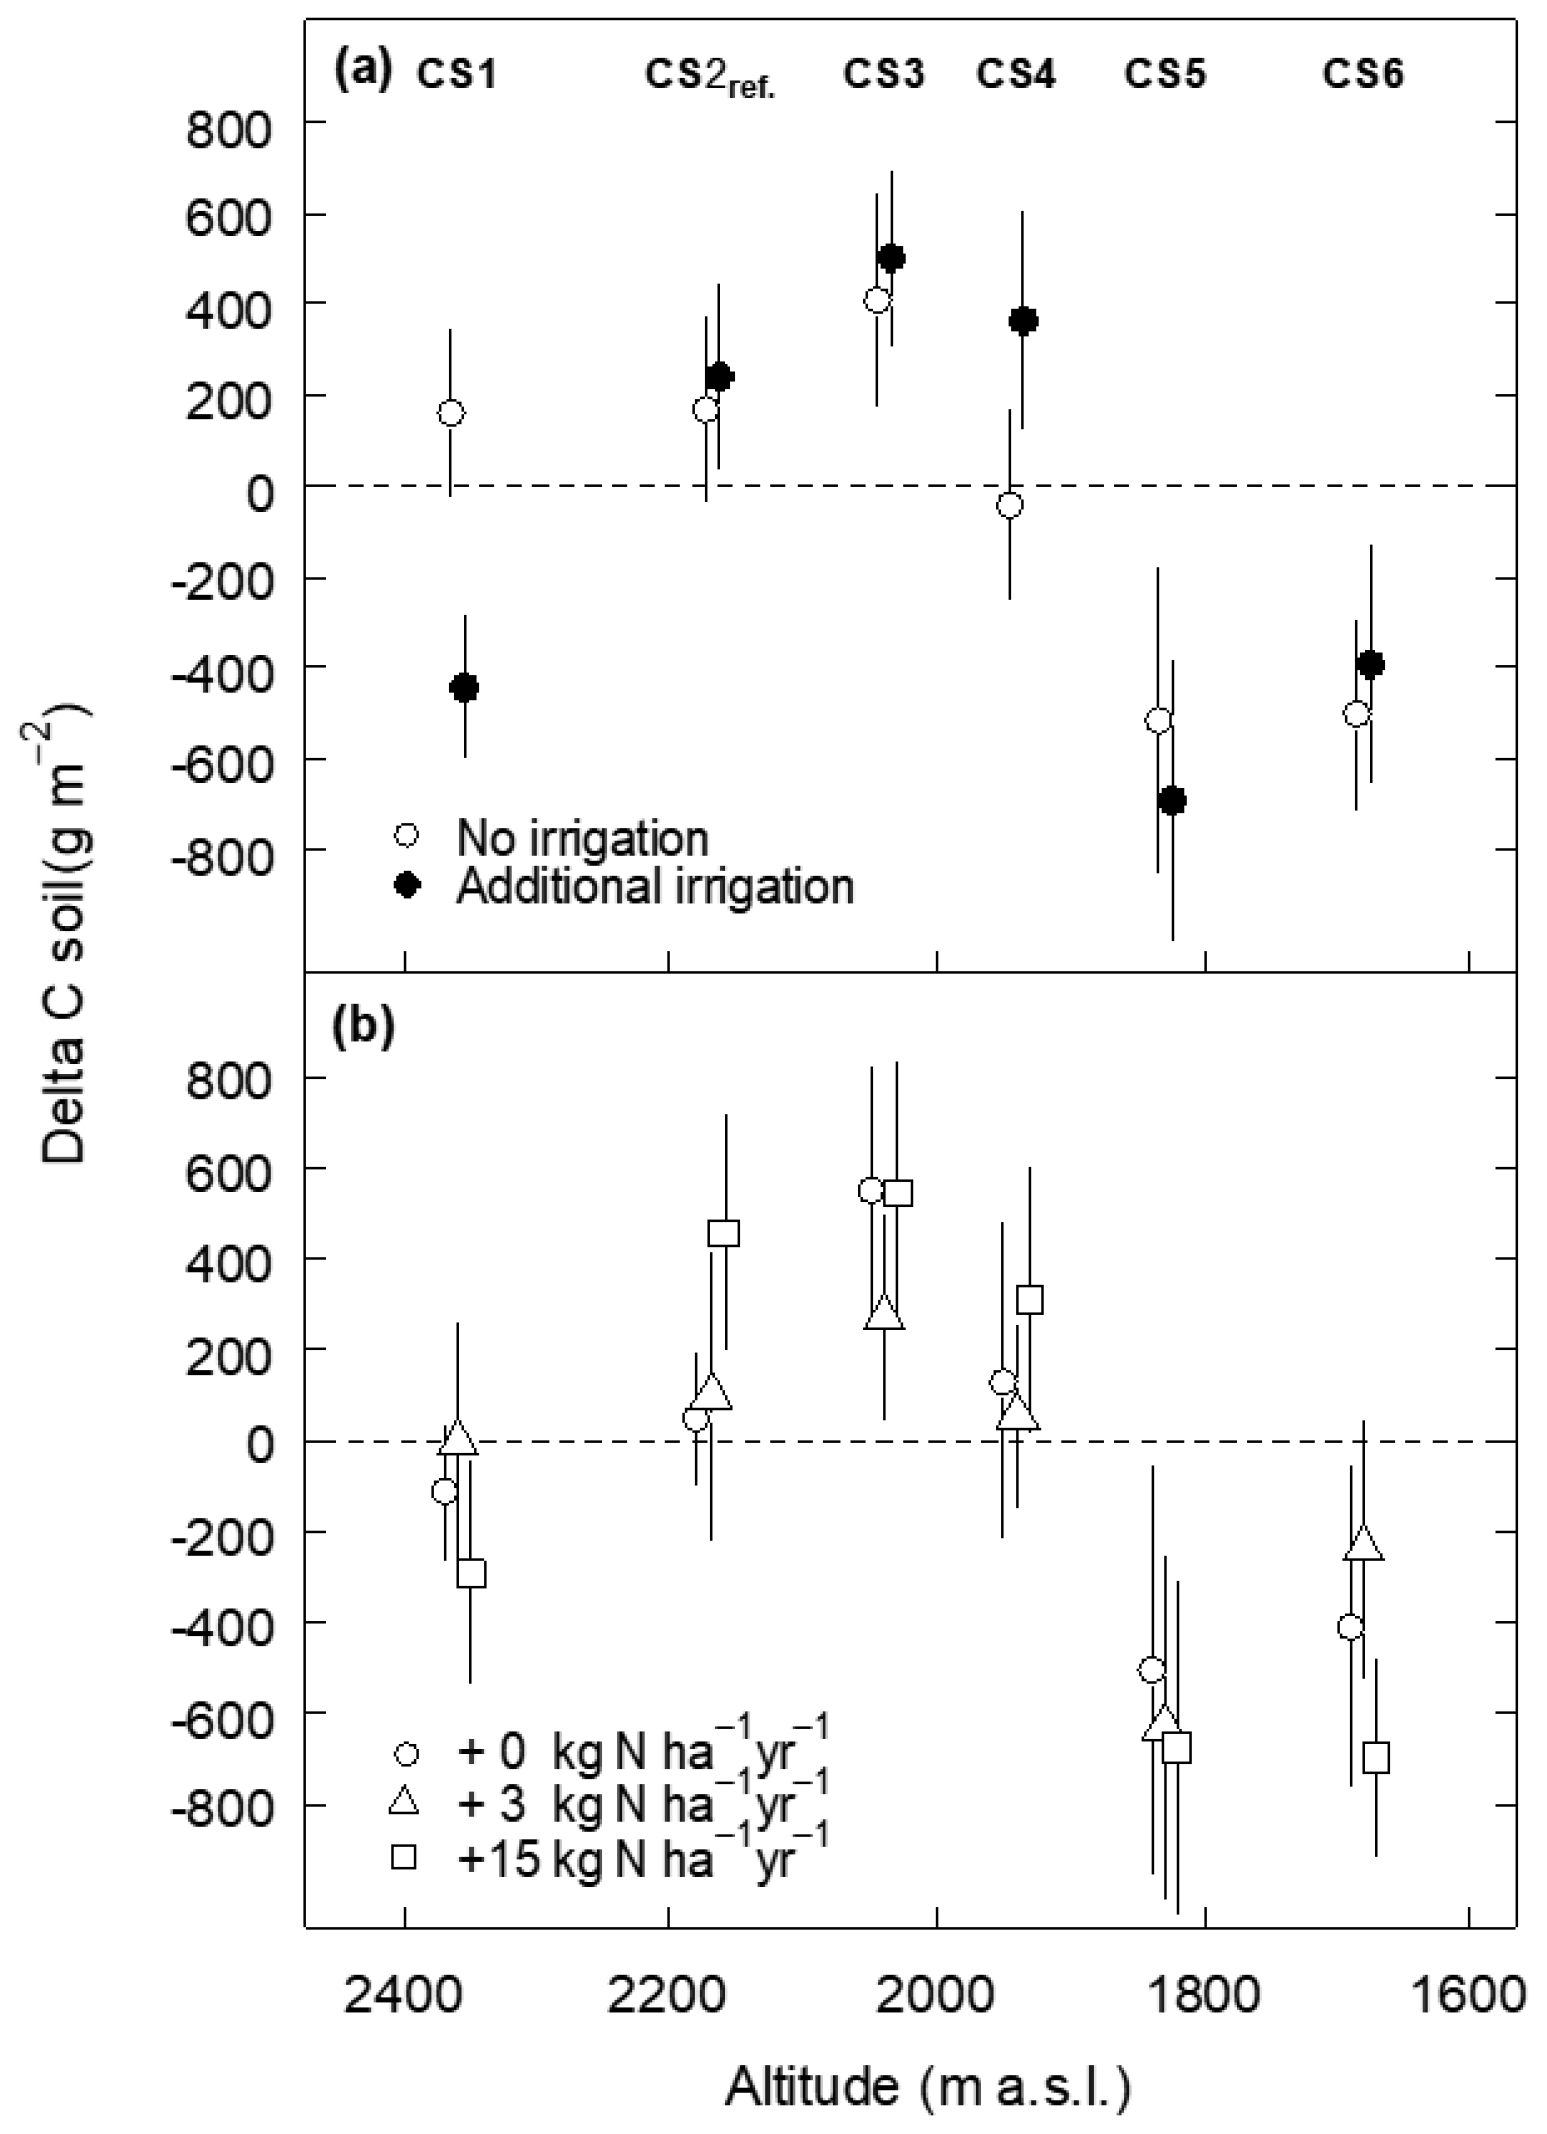
Figure A1Soil carbon stock change (Delta C) of subalpine grassland between 2012 and 2017 as a function of the altitude of climate scenario sites (CSs) and (a) the irrigation treatment and (b) the N deposition treatment (0, 3, 15 kg N ha−1 yr−1, in addition to 4–5 kg N background deposition). Data denote means ±1 SE, shifted horizontally to improve their visibility.
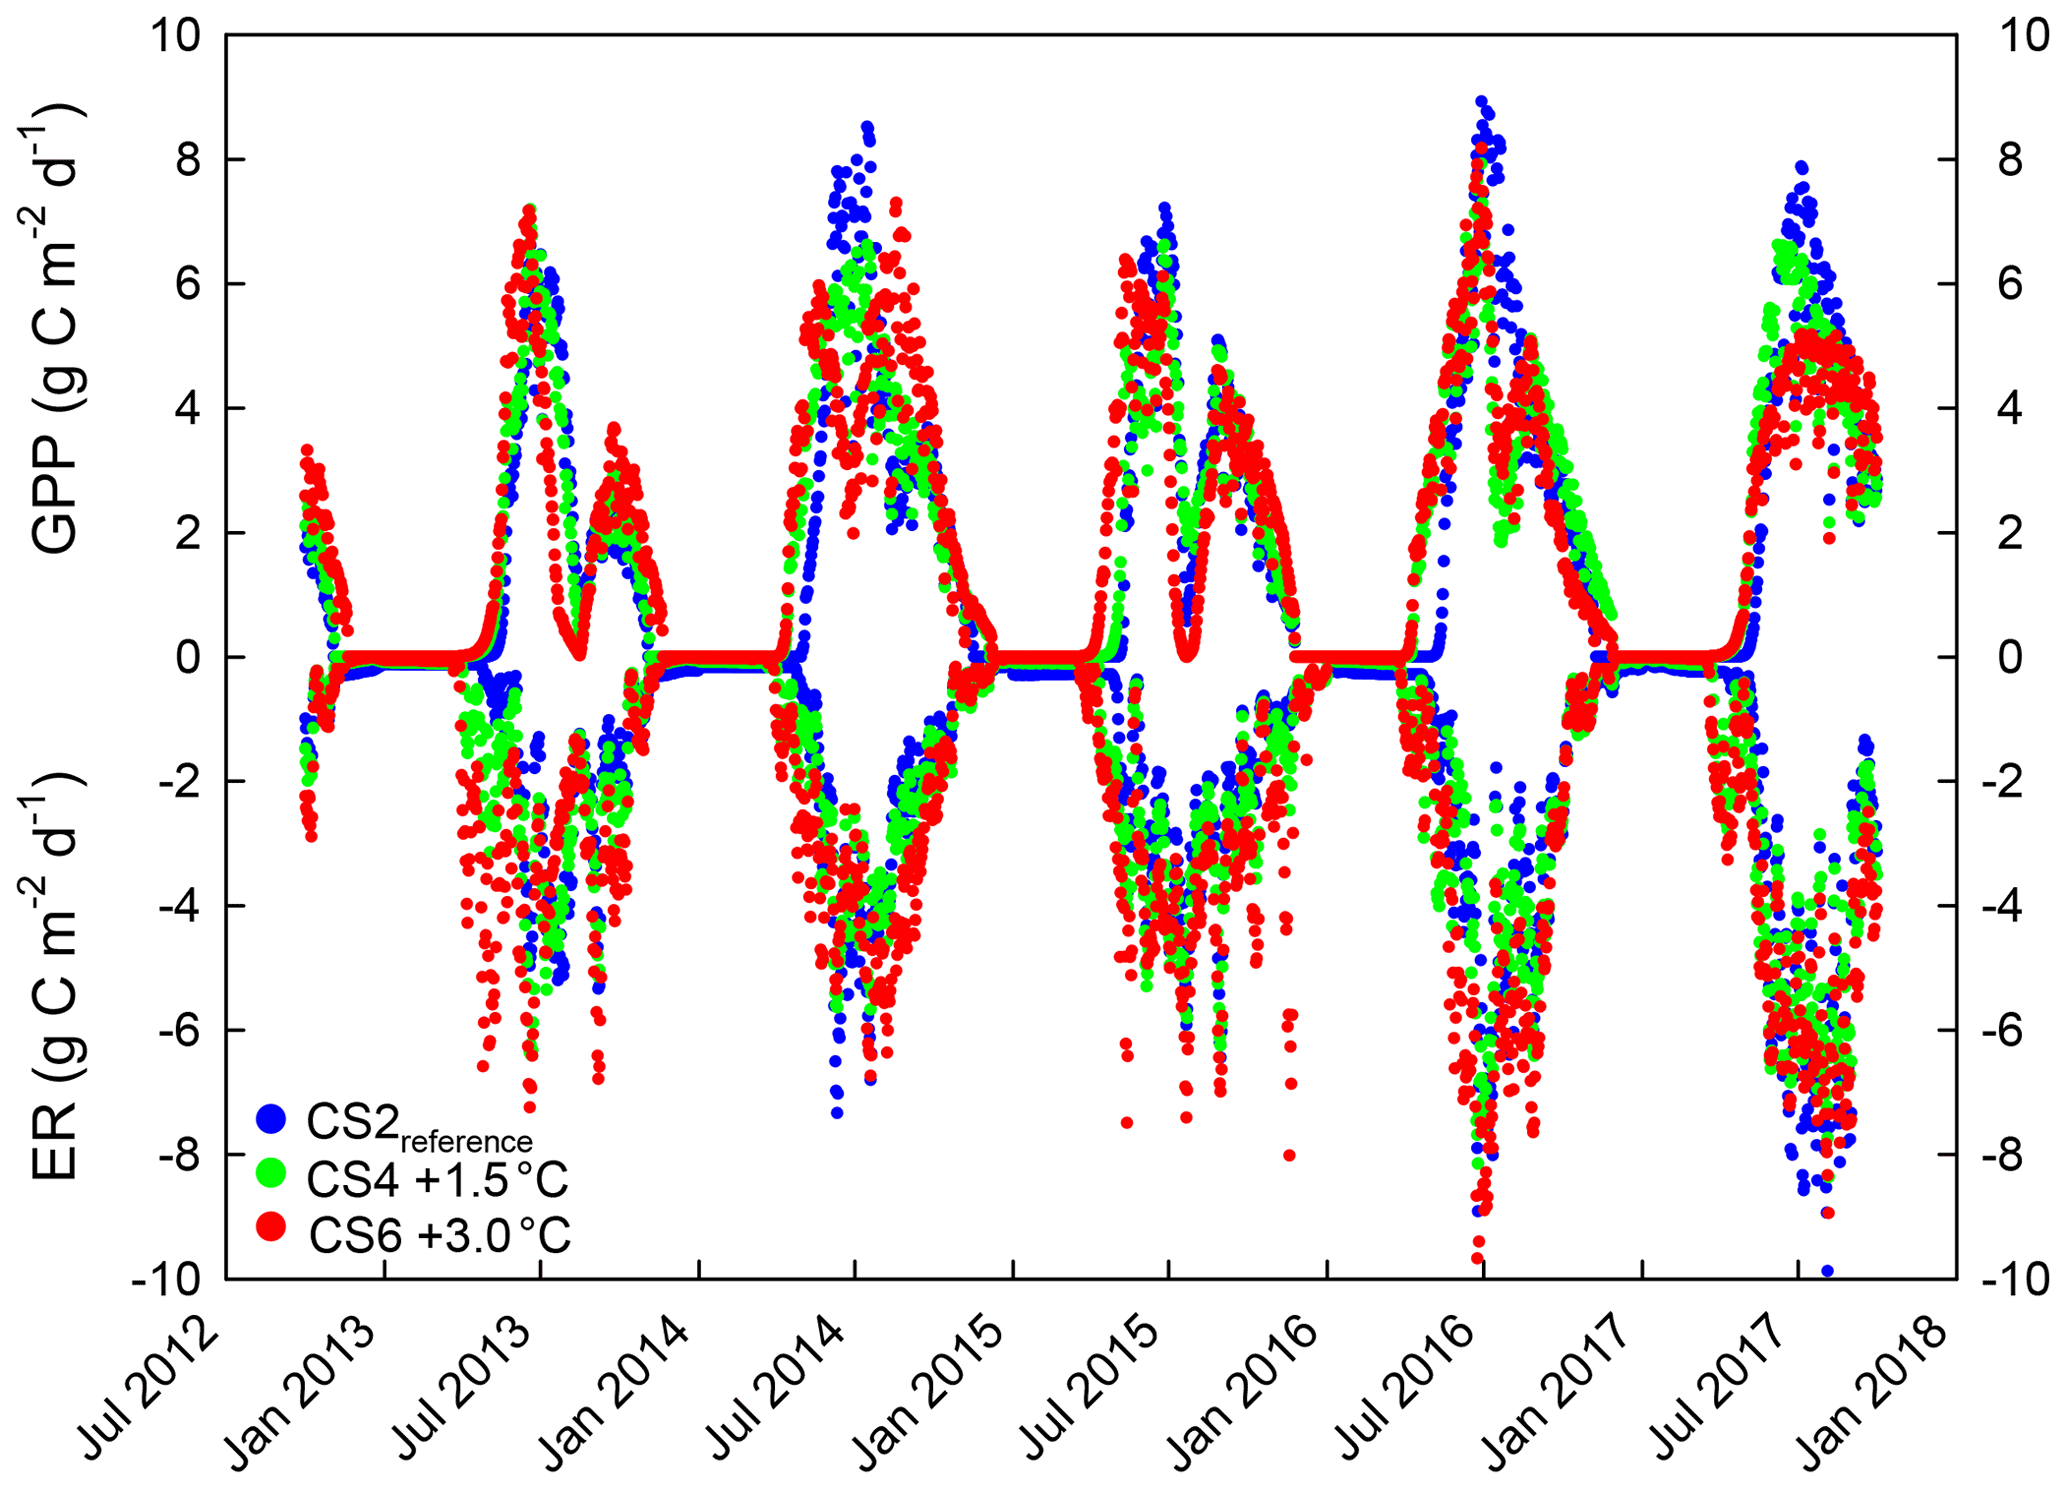
Figure A2Daily flux sums (mean) of CO2 gross primary productivity (GPP) and ecosystem respiration (ER). Colored dots indicate means from six control treatment monoliths (neither irrigation nor additional N) per CS2reference (blue), CS4 (green) and CS6 (red), respectively. The ecosystem perspective, rather than the atmosphere perspective, was assumed, resulting in negative ER values (C loss) and positive GPP values (C gain).
A3 Ecosystem respiration (ER)
Measured NEEnight was considered to represent ER for the entire day:
For the days between measurements (fortnightly to monthly during the snow-free period), ER was parameterized. First, ER for each monolith was normalized for temperature (10 ∘C at 8 cm soil depth) using the exponential function for NEEnight/soil temperature established earlier. Second, on the basis of the ER gained during measurement nights, a normalized daily ER between measurement nights was linearly interpolated. These normalized values integrate the effects of seasonal changes of substrate availability, heterotrophic and autotrophic biomass, and soil moisture availability. Ultimately, ER on an hourly basis was calculated using normalized ER values for the respective day and hourly soil temperature values.
A4 GPP
NEEday data were used to estimate GPP according to
GPP estimates from midday, clear-sky NEEday measurements reflect a situation without radiation limitation for assimilation. Therefore, GPP estimates reflect potential GPP at maximum radiation (GPPpot) at seasonal solar altitude. At the beginning of the season GPPpot was interpolated to rise exponentially between snowmelt and the first measurement of the season. Between the measurement days, GPPpot was linearly interpolated for every day. This way, effects of canopy development and soil moisture availability are reflected in the model.
A5 GPP light response
From clear-sky NEEday measurements at fully developed canopy stages, we parameterized light response curves of GPP. Between photosynthetic compensation points in the morning and evening, NEE data were collected at a frequency of 50 min or higher. Maximum GPP was observed at GR of ≥900 W m−2. No significant differences between treatments were found, and light use efficiency α was subsequently derived from data pooled across treatments. Light response was described by a nonlinear least-squares fit of flux data to a rectangular hyperbolic light response model (Michaelis–Menten model):
where GPP is in µmol CO2 m−2 s−1, α is the initial slope of the light response curve (the light use efficiency factor in µmol mol CO2 J−1), β is the asymptote of GPPpot and GR is in W m−2. We calculated actual GPP for each hour based on interpolated GPPpot for every day of the growing season, together with hourly means of GR and previously established light use efficiency α:
A6 NEP
NEP was used in the sense of describing the balance between GPP and ER, equivalent to an hourly, daily or annual CO2 balance for the ecosystem, neglecting other potential C imports or exports. Hourly ER flux rates were used to calculate hourly sums of C loss. Hourly GPP flux rates were used to calculate hourly sums of C gain for each monolith. NEP was then derived by subtracting hourly losses of respired carbon (ER) from hourly C gains (GPP) for a given period for each individual monolith:
Table B1Summary of analyses for the effects of climate scenario (CS), irrigation and N deposition on SOC stock change of subalpine grassland between 2012 and 2017. F tests refer to the fixed effects of a linear mixed-effects model; the marginal and conditional R2 values were 0.19 and 0.33, respectively. The random block variance was estimated to be zero and was therefore removed from the model.
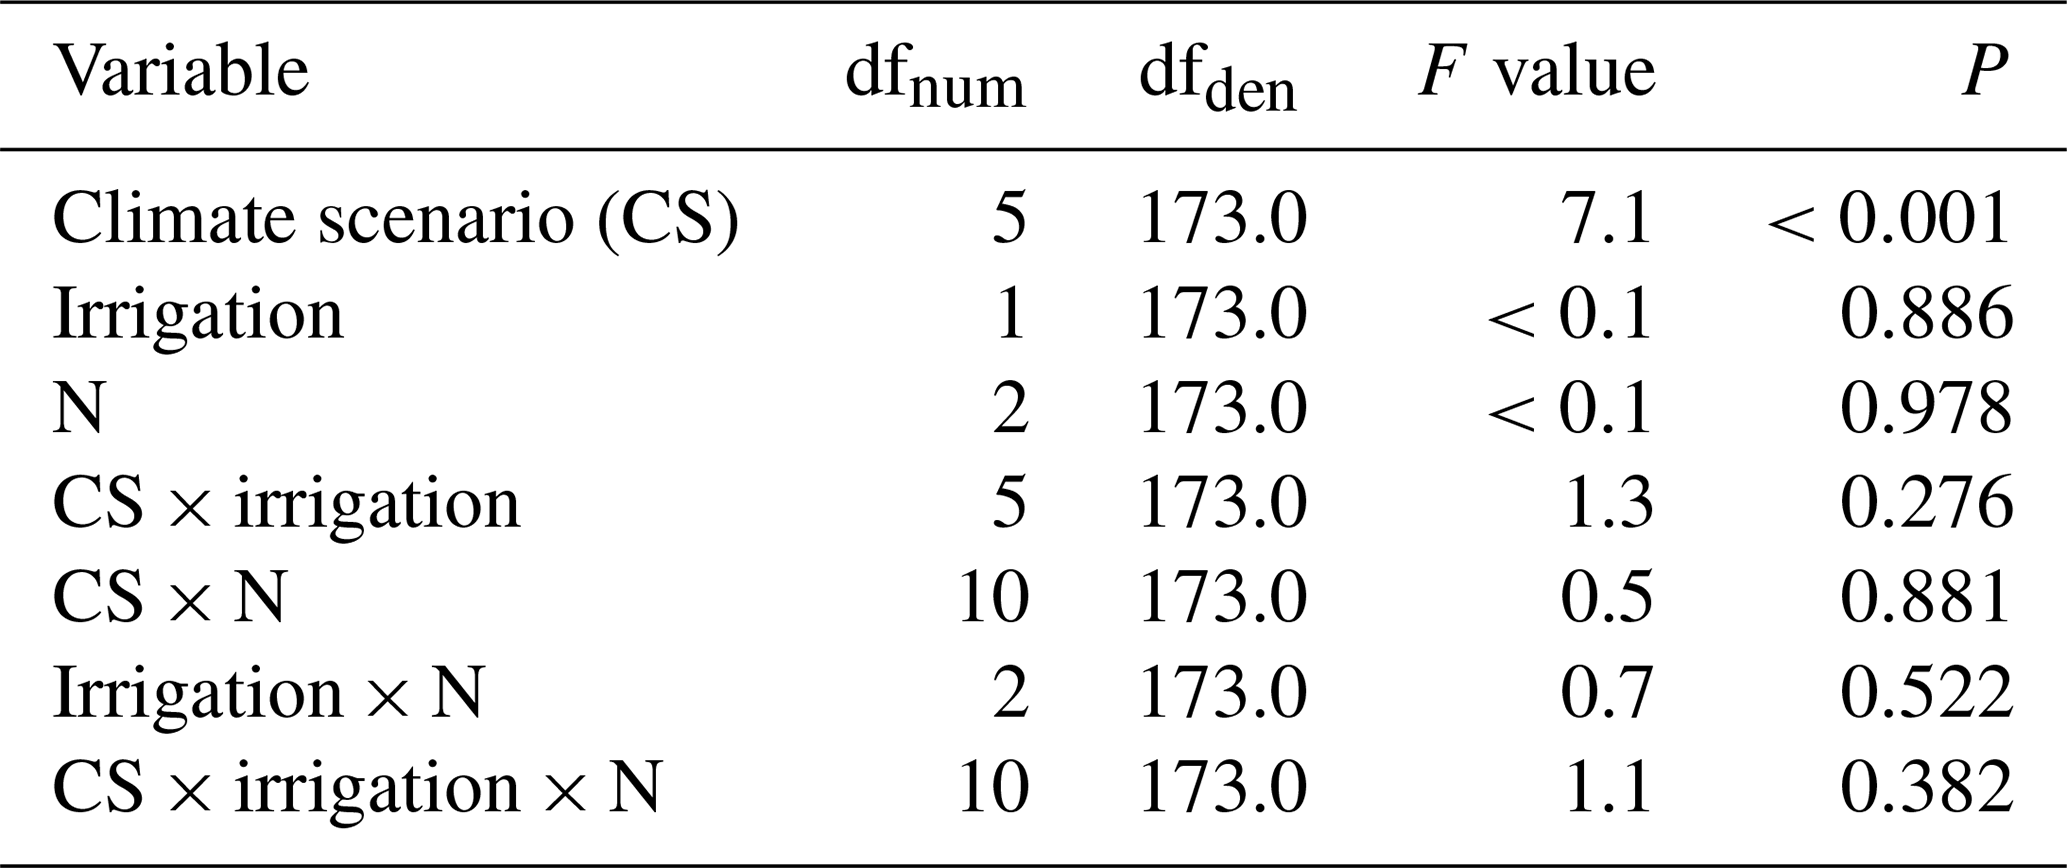
dfnum: degrees of freedom of term. dfden: degrees of freedom of error.
Table B2Summary of analyses for the effects of climate scenario (CS), irrigation and N deposition on root carbon stock of subalpine grassland in 2017, after 5 years of experimental treatment. F tests refer to the fixed effects of a linear mixed-effects model; the marginal and conditional R2 values were 0.47 and 0.63, respectively. No data were available for CS1 and the intermediate N-deposition treatment N3.
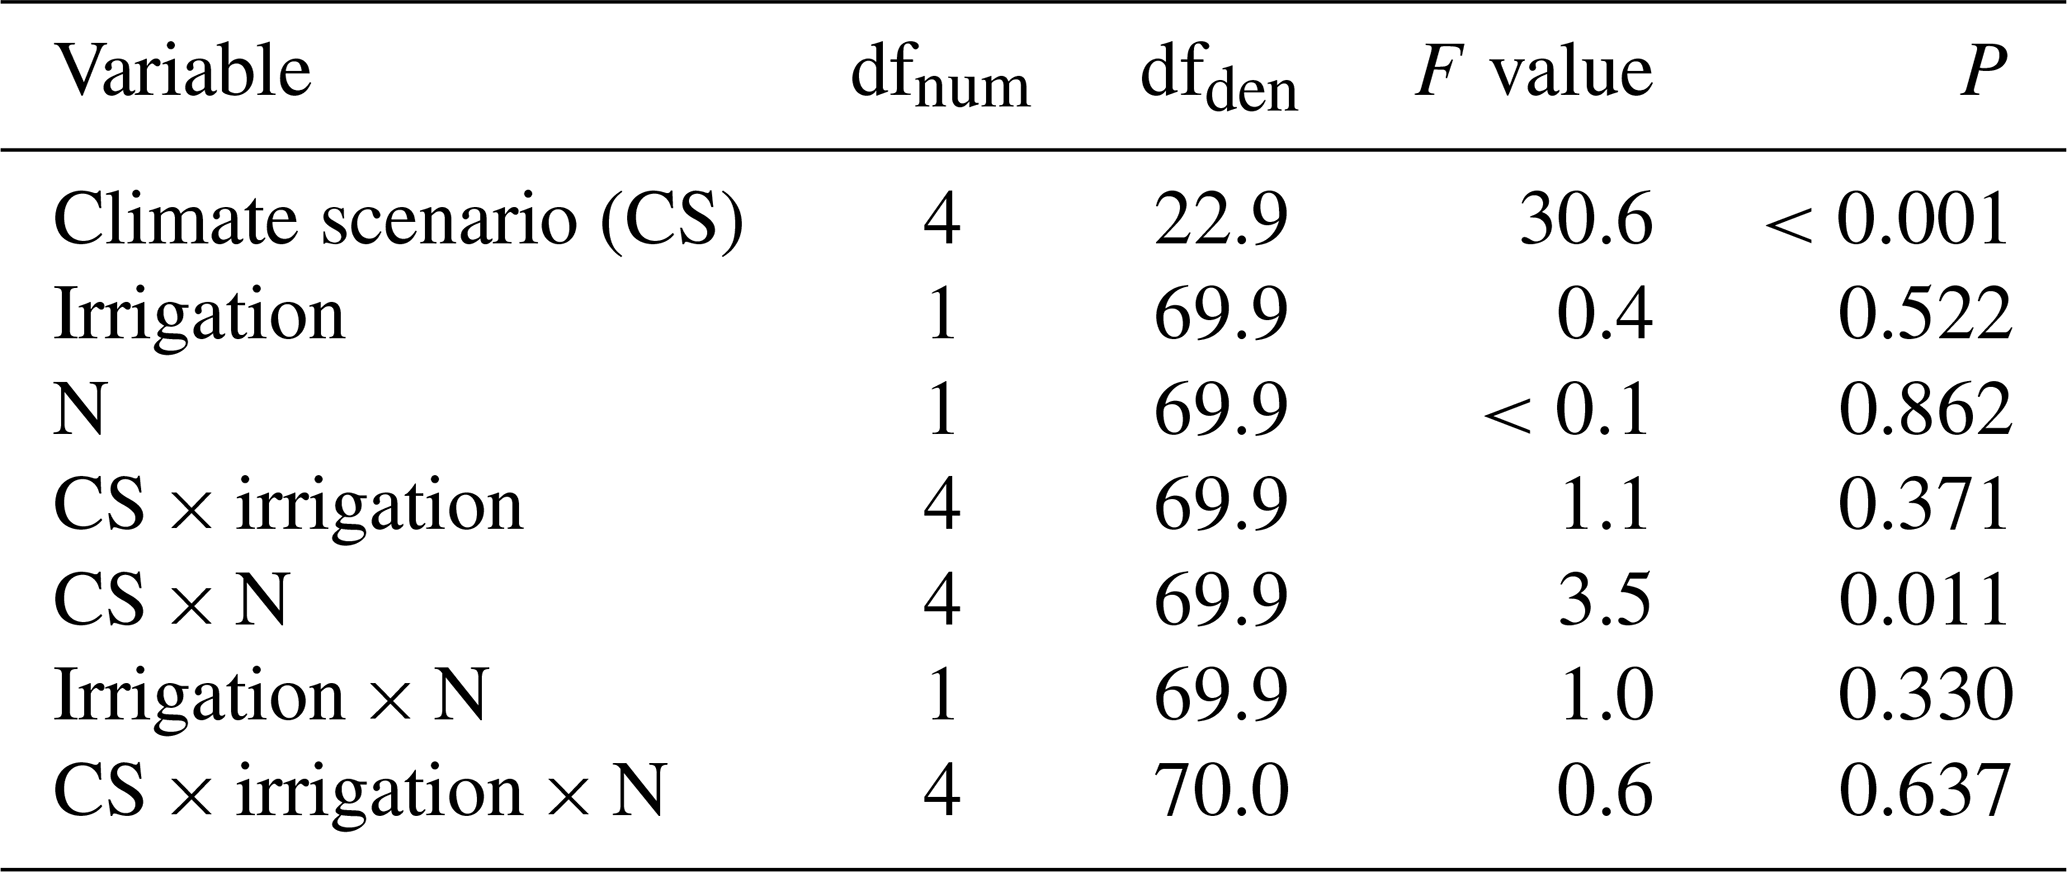
dfnum: degrees of freedom of term. dfden: degrees of freedom of error.
Table B3Summary of analyses for the effects of climate scenario (CS), irrigation and N deposition on shoot carbon stock of subalpine grassland in 2017, after 5 years of experimental treatment. F tests refer to the fixed effects of a linear mixed-effects model; the marginal and conditional R2 values were 0.16 and 0.32, respectively. No data were available for CS1 and the intermediate N-deposition treatment N3.
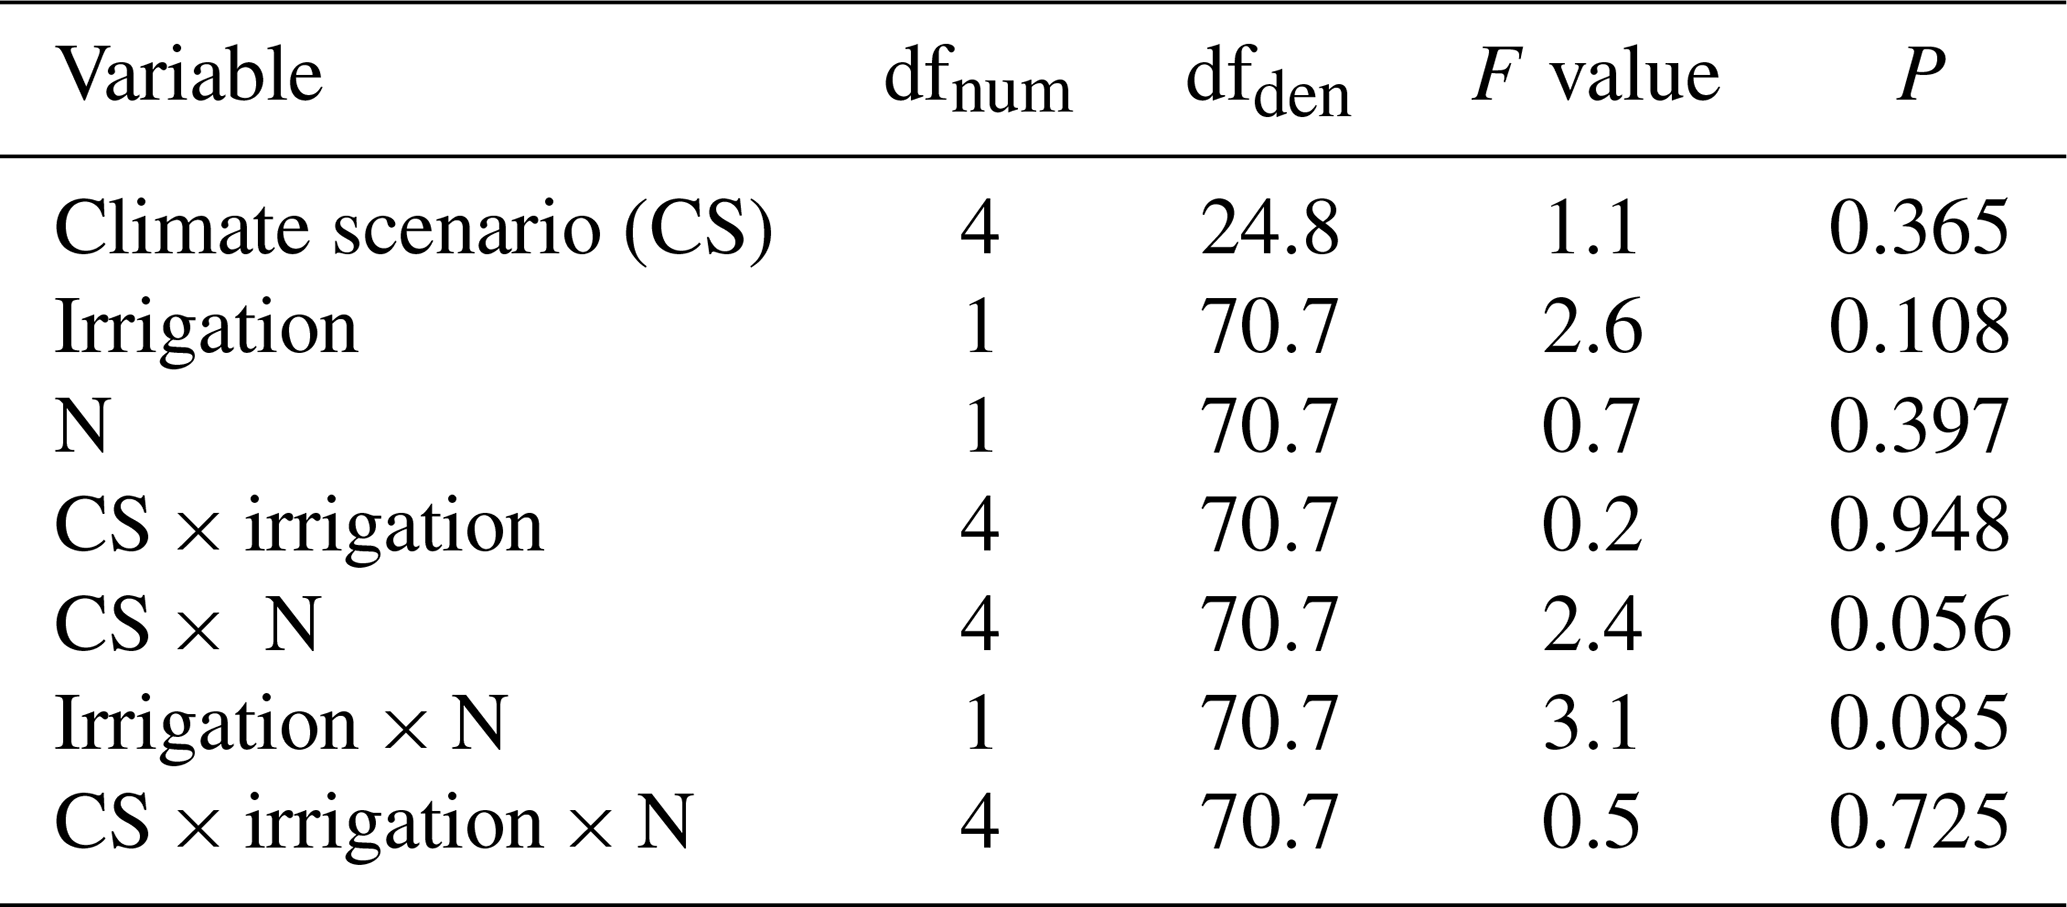
dfnum: degrees of freedom of term, dfden: degrees of freedom of error.
A general note to the generalized additive models: in all models, the default from the mgcv package has been used with the exception that the “gamma” statement of the gam() function was sometimes changed to adapt the degree of smoothing of the fitted line. This, however, did not or only marginally influence the inference drawn from the model, i.e., the P values for smooth terms reported in Tables A4–A6.
Table B4Summary of analyses for the effects of temperature change (delta temperature) induced by the climate change treatments on soil carbon stock change (Delta C soil) of subalpine grassland between 2012 and 2017. F and t values and approximate P values refer to a generalized additive model that used a smooth term to delta temperature.
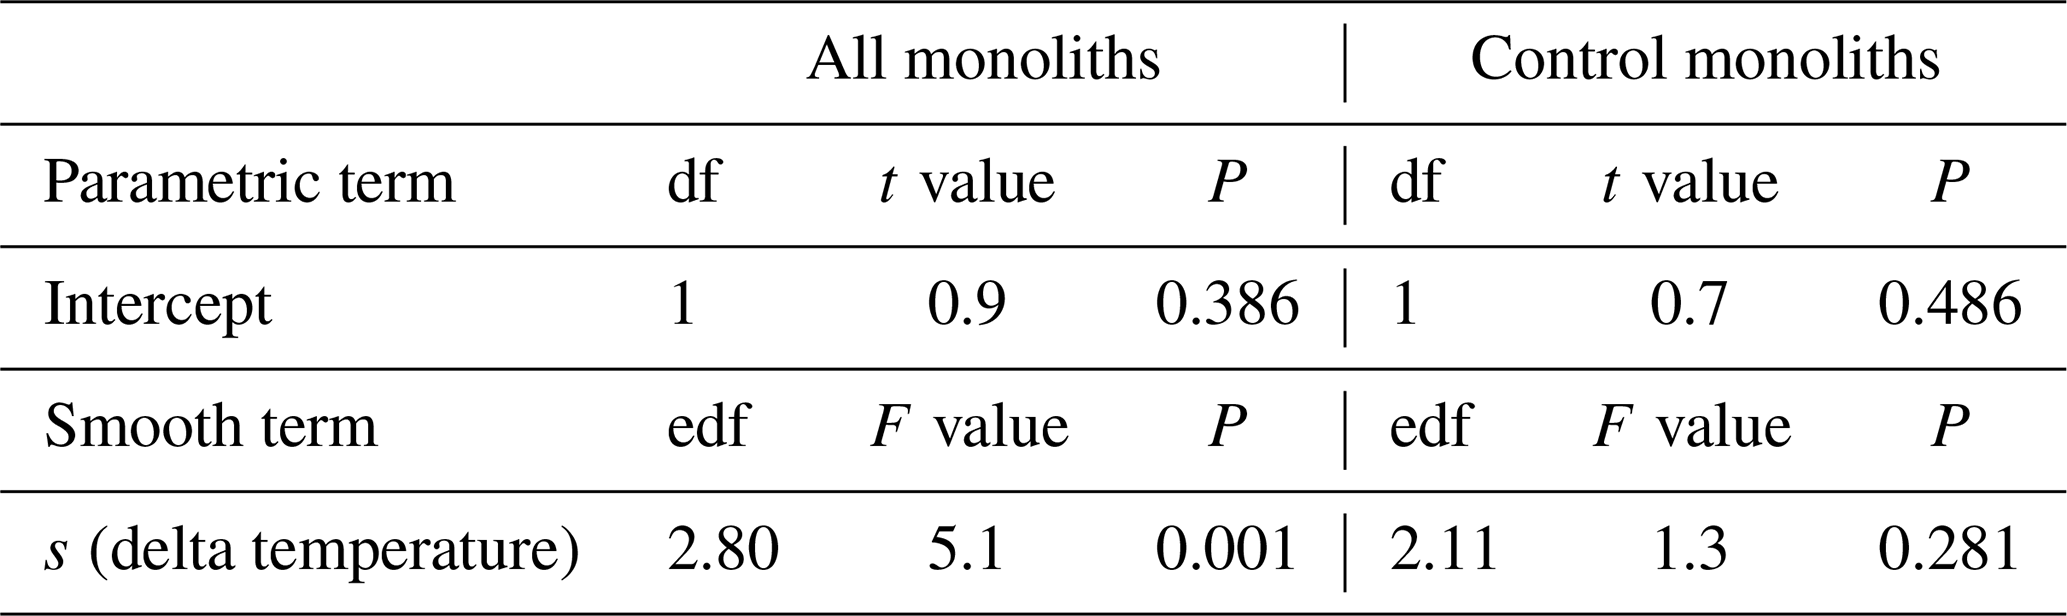
df: degrees of freedom. edf: effective degrees of freedom (which can be fractional in smooth terms of generalized additive models). s: smoothing function applied to term.
Table B5Summary of analyses for the effects of temperature change (delta temperature) induced by the climate change treatments root carbon stock (Root C) at 2017 after 5 years of experimental treatment. F and t values and approximate P values refer to a generalized additive model that used a smooth term to delta temperature.

s: smoothing function applied to term.
Table B6Summary of analyses for the effects of temperature change (delta temperature) induced by the climate change treatments shoot carbon stock (Shoot C) at 2017 after 5 years of experimental treatment. F and t values and approximate P values refer to a generalized additive model that used a smooth term to delta temperature.
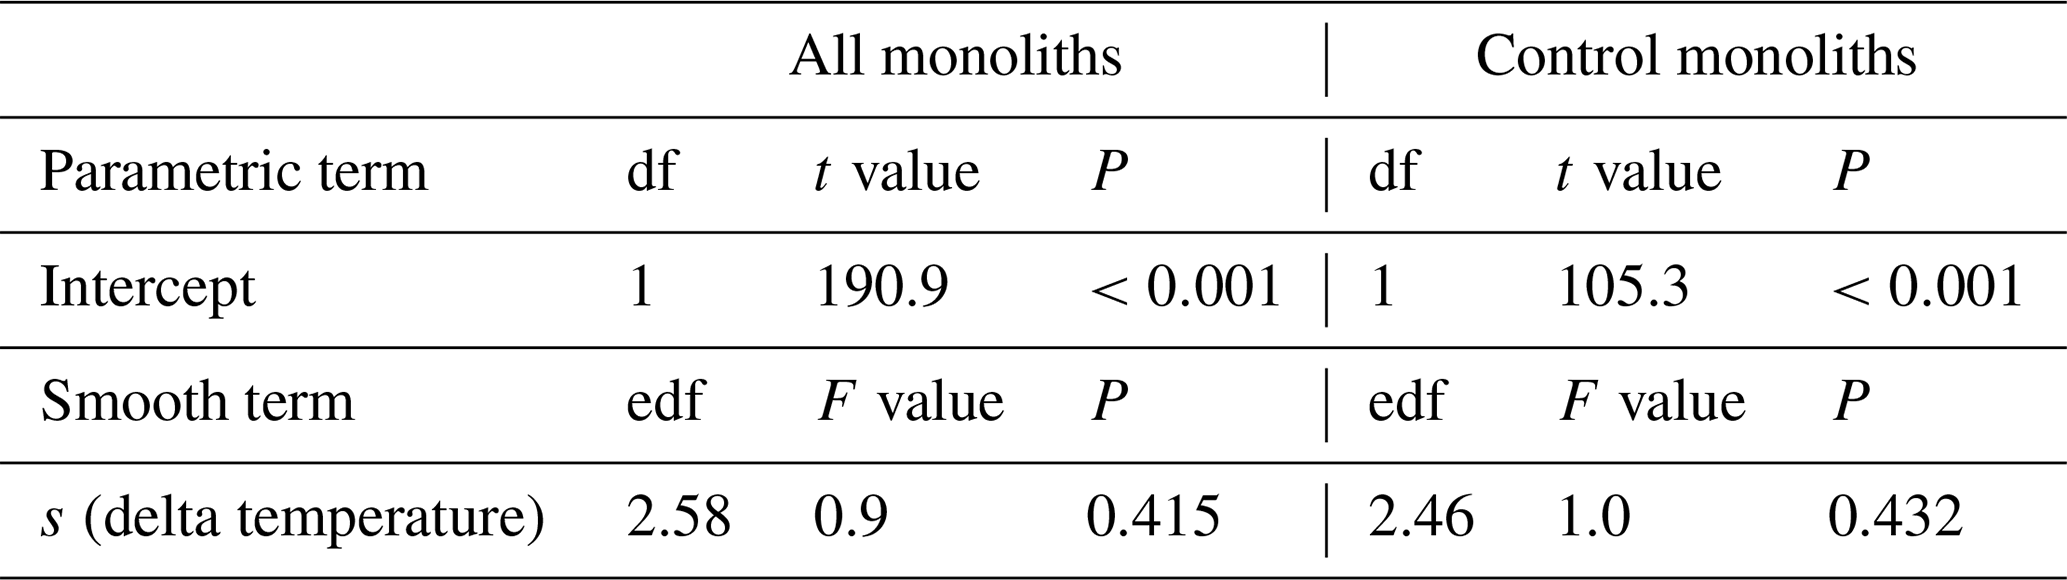
s: smoothing function applied to term.
The data are available at the CERN Zenodo data repository (https://doi.org/10.5281/zenodo.6558331; Volk et al., 2022).
MV and SB designed the experiment. MV, ALW and SB conducted fieldwork. MV and MS analyzed the data. MV led the writing of the manuscript, with significant contribution from MS. All authors contributed critically to the drafts and gave final approval for publication.
The contact author has declared that neither they nor their co-authors have any competing interests.
Publisher’s note: Copernicus Publications remains neutral with regard to jurisdictional claims in published maps and institutional affiliations.
We received essential financial support through the Federal Office for the Environment (contract no. 00.5100.PZ/R442-1499). The Gemeinde Ardez and Alpmeister Claudio Franziscus generously allowed us to work on the Allmend. We are grateful to Robin Giger for his untiring support in the field and the lab and to the scientific site manager Andreas Gauer, who was in charge of the field sites.
This research has been supported by the Bundesamt für Umwelt (grant no. 00.5100.PZ/R442-1499).
This paper was edited by Ben Bond-Lamberty and reviewed by two anonymous referees.
Ammann, C., Flechard, C. R., Leifeld, J., Neftel, A. and Fuhrer, J.: The carbon budget of newly established temperate grassland depends on management intensity, Agr. Ecosyst. Environ., 121, 5–20, 2007.
Ammann, C., Spirig, C., Leifeld, J., and Neftel, A.: Assessment of the nitrogen and carbon budget of two managed temperate grassland fields, Agr. Ecosyst. Environ., 133, 150–162, 2009.
Ammann, C., Neftel, A., Jocher, M., Fuhrer, J., and Leifeld, J.: Effect of management and weather variations on the greenhouse gas budget of two grasslands during a 10-year experiment, Agr. Ecosyst. Environ., 292, 106814, https://doi.org/10.1016/j.agee.2019.106814, 2020.
Bahn, M., Rodeghiero, M., Anderson-Dunn, M., Dore, S., Gimeno, C., Drösler, M., Williams, M., Ammann, C., Berninger, C., Flechard, C., Jones, S., Balzarolo, M., Kumar, S., Newesely, C., Priwitzer, T., Raschi, A., Siegwolf, R., Susiluoto, S., Tenhunen, J., Wohlfahrt, G., and Cernusca, A.: Soil respiration in European grasslands in relation to climate and assimilate supply, Ecosystems, 11, 1352–1367, 2008.
Bassin, S., Werner, R. A., Sörgel, K., Volk, M., Buchmann, N., and Fuhrer, J.: Effects of combined ozone and nitrogen deposition on the in situ properties of eleven key plant species of a subalpine pasture, Oecologia, 158, 747–756, 2009.
Bassin, S., Käch, D., Valsangiacomo, A., Mayer, J., Oberholzer, H. R., Volk, M., and Fuhrer, J.: Elevated ozone and nitrogen deposition affect nitrogen pools of subalpine grassland, Environ. Pollut., 201, 67–74, 2015.
Bates, D., Mächler, M., Bolker, B., and Walker S.: Fitting linear mixed-effects models using lme4, J. Stat. Softw., 67, 1–48, 2015.
Berninger, F., Susiluoto, S., Gianelle, D., and Balzarolo, M.: Management and site effects on carbon balances of European mountain meadows and rangelands, Boreal Environ. Res., 20, 748–760, 2015.
Bobbink, R., Hicks, K., Galloway, J., Spranger, T., Alkemade, R., Ashmore, M., Bustamante, M., Cinderby, S., Davidson, E., Dentener, F., Emmett, B., Erisman, J. W., Fenn, M., Gilliam, F., Nordin, A., Pardo, L., and De Vries, W.: Global assessment of nitrogen deposition effects on terrestrial plant diversity: a synthesis, Ecol. Appl., 20, 30–59, 2010.
Conant, R. T., Ryan, M. G., Ågren, G. I., Birge, H. E., Davidson, E. A., Eliasson, P. E., Evans, S. E., Frey, S. D., Giardina, C. P., Hopkins, F. M., Hyvönen, R., Kirschbaum, M. U. F., Lavallee, J. M., Leifeld, J., Parton, W. J., Steinweg, J. M., Wallenstein, M. D., Wetterstedt, J. Å. M., and Bradford, M. A.: Temperature and soil organic matter decomposition rates–synthesis of current knowledge and a way forward, Glob. Change Biol., 17, 3392–3404, 2011.
Conen, F., Leifeld, J., Seth, B., and Alewell, C.: Warming mineralises young and old soil carbon equally, Biogeosciences, 3, 515–519, https://doi.org/10.5194/bg-3-515-2006, 2006.
Core Writing Team: IPCC, 2014: Climate change 2014: Synthesis Report, Contribution of Working Groups I, II and III to the Fifth Assessment Report of the Intergovernmental Panel on Climate Change, edited by: Pachauri, R. K. and Meyer, L. A., IPCC, Geneva, Switzerland, 151 pp., 2014.
Crowther, T. W., Todd-Brown, K. E., Rowe, C. W., Wieder, W. R., Carey, J. C., Machmuller, M. B., Snoek, B. L., Fang, S., Zhou, G., Allison, S. D., Blair, J. M., Bridgham, S. D., Burton, A. J., Carrillo, Y., Reich, P. B., Clark, J. S., Classen, A. T., Dijkstra, F. A., Elberling, B., Emmett, B. A., Estiarte, M., Frey, S. D., Guo, J., Harte, J., Jiang, L., Johnson, B. R., Kröel-Dulay, G., Larsen, K. S., Laudon, H., Lavallee, J. M., Luo, Y., Lupascu, M., Ma, L. N., Marhan, S., Michelsen, A., Mohan, J., Niu, S., Pendall, E., Peñuelas, J., Pfeifer-Meister, L., Poll, C., Reinsch, S., Reynolds, L. L., Schmidt, I. K., Sistla, S., Sokol, N. W., Templer, P. H., Treseder, K. K., Welker, J. M., and Bradford, M. A.: Quantifying global soil carbon losses in response to warming, Nature, 540, 104–108, 2016.
Giardina, C. P., Binkley, D., Ryan, M. G., Fownes, J. H., and Senock, R. S.: Belowground carbon cycling in a humid tropical forest decreases with fertilization, Oecologia, 139, 545–550, 2004.
Heimann, M. and Reichstein, M.: Terrestrial ecosystem carbon dynamics and climate feedbacks, Nature, 451, 289–292, 2008.
Hoeppner, S. S. and Dukes, J. S.: Interactive responses of old-field plant growth and composition to warming and precipitation, Glob. Change Biol., 18, 1754–1768, 2012.
Hörtnagl, L., Barthel, M., Buchmann, N., Eugster, W., Butterbach-Bahl, K., Díaz-Pinés, E., Zeeman, M., Klumpp, K., Kiese, R., Bahn, M., Hammerle, A., Lu, H., Ladreiter-Knauss, T., Burril S., and Merbold, L.: Greenhouse gas fluxes over managed grasslands in Central Europe, Glob. Change Biol., 24, 1843–1872, 2018.
Jia, J., Cao, Z., Liu, C., Zhang, Z., Lin, L. I., Wang, Y., Haghipour, N., Wacker, L., Bao, H., Dittmar, T., Simpson, M. J., Yang, H., Crowther, T. W., Eglinton, T. I., He J.-S., and Feng, X.: Climate warming alters subsoil but not topsoil carbon dynamics in alpine grassland, Glob. Change Biol., 25, 4383–4393, 2019.
Jobbágy, E. G. and Jackson, R. B.: The vertical distribution of soil organic carbon and its relation to climate and vegetation, Ecol. Appl., 10, 423–436, 2000.
Jones, C., McConnell, C., Coleman, K., Cox, P., Falloon, P., Jenkinson, D., and Powlson, D.: Global climate change and soil carbon stocks; predictions from two contrasting models for the turnover of organic carbon in soil, Glob. Change Biol., 11, 154–166, 2005.
Jung, C. G., Xu, X., Niu, S., Liang, J., Chen, X., Shi, Z., Jiang, L., and Luo, Y.: Experimental warming amplified opposite impacts of drought vs. wet extremes on ecosystem carbon cycle in a tallgrass prairie, Agr. Forest Meteorol., 276, 107635, https://doi.org/10.1016/j.agrformet.2019.107635, 2019.
Kenward, M. G. and Roger, J. H.: Small sample inference for fixed effects from restricted maximum likelihood, Biometrics, 53, 983–997, 1997.
Kreyling, J., Grant, K., Hammerl, V., Arfin-Khan, M. A., Malyshev, A. V., Peñuelas, J., Pritsch, K., Sardans, J., Schloter, M., Schuerings, J., Jentsch, A., and Beierkuhnlein, C.: Winter warming is ecologically more relevant than summer warming in a cool-temperate grassland, Scientific Reports, 9, 1–9, 2019.
Leifeld, J., Bassin, S., and Fuhrer, J.: Carbon stocks in Swiss agricultural soils predicted by land-use, soil characteristics, and altitude, Agr. Ecosyst. Environ., 105, 255–266, 2005.
Leifeld, J., Zimmermann, M., Fuhrer, J., and Conen, F.: Storage and turnover of carbon in grassland soils along an elevation gradient in the Swiss Alps, Glob. Change Biol., 15, 668–679, 2009.
Leifeld, J., Bassin, S., Conen, F., Hajdas, I., Egli, M., and Fuhrer, J.: Control of soil pH on turnover of belowground organic matter in subalpine grassland, Biogeochemistry, 112, 59–69, 2013.
Liu, H., Mi, Z., Lin, L. I., Wang, Y., Zhang, Z., Zhang, F., Wang, H., Liu, L., Zhu, B., Cao, G., Zhao, Z., Sanders, N. J., Classen, A. T., Reich, P. B., and He, J. S.: Shifting plant species composition in response to climate change stabilizes grassland primary production, P. Natl. Acad. Sci. USA, 115, 4051–4056, 2018.
Lloyd, J. and Taylor, J. A.: On the temperature dependence of soil respiration, Funct. Ecol., 8, 315–323, 1994.
Lu, M., Zhou, X., Luo, Y., Yang, Y., Fang, C., Chen, J., and Li, B.: Minor stimulation of soil carbon storage by nitrogen addition: a meta-analysis, Agr. Ecosyst. Environ., 140, 234–244, 2011.
Magnani, F., Mencuccini, M., Borghetti, M., Berbigier, P., Berninger, F., Delzon, S., Grelle, A., Hari, P., Jarvis, P. J., Kolari, P., Kowalski, A. S., Lankreijer, H., Law, B. E., Lindroth, A., Loustau, D., Manca, G., Moncrieff, J. B., Rayment, M., Tedeschi, V., Valentini, R., and Grace, J.: The human footprint in the carbon cycle of temperate and boreal forests, Nature, 447, 849–851, 2007.
Nakagawa, S. and Schielzeth, H.: A general and simple method for obtaining R2 from generalized linear mixed-effects models, Methods Ecol. Evol., 4, 133–142, 2013.
Phoenix, G. K., Emmett, B. A., Britton, A. J., Caporn, S. J. M., Dise, N. B., Helliwell, R., Jones, L., Leake, J. R., Leith, I. D., Sheppard, L. J., Sowerby, A., Pilkington, M. G., Rowe, E. C., Ashmore, M. R., and Power, S. A.: Impacts of atmospheric nitrogen deposition: responses of multiple plant and soil parameters across contrasting ecosystems in long-term field experiments, Glob. Change Biol., 18, 1197–1215, 2012.
Poeplau, C., Kätterer, T., Leblans, N. I., and Sigurdsson, B. D.: Sensitivity of soil carbon fractions and their specific stabilization mechanisms to extreme soil warming in a subarctic grassland, Glob. Change Biol., 23, 1316–1327, 2017.
Poorter, H., Niklas, K. J., Reich, P. B., Oleksyn, J., Poot, P., and Mommer, L.: Biomass allocation to leaves, stems and roots: meta-analyses of interspecific variation and environmental control, New Phytol., 193, 30–50, 2012.
Post, W. M., Emanuel, W. R., Zinke, P. J., and Stangenberger, A. G.: Soil carbon pools and world life zones, Nature, 298, 156–159, 1982.
Pries, C. E. H., Castanha, C., Porras, R. C., and Torn, M. S.: The whole-soil carbon flux in response to warming, Science, 355, 1420–1423, 2017.
R Core Team: A language and environment for statistical computing, R Foundation for Statistical Computing, Vienna, Austria, https://www.r-project.org/, last access: 18 March 2021.
Reynolds, L. L., Johnson, B. R., Pfeifer-Meister, L., and Bridgham, S. D.: Soil respiration response to climate change in Pacific Northwest prairies is mediated by a regional Mediterranean climate gradient, Glob. Change Biol., 21, 487–500, 2015.
Rihm, B. and Achermann, B.: Critical Loads of Nitrogen and their Exceedances. Swiss contribution to the effects-oriented work under the Convention on Long-range Transboundary Air Pollution (UNECE), Federal Office for the Environment, Bern, Environmental studies no. 1642, 78 pp., 2016.
Rihm, B. and Kurz, D.: Deposition and critical loads of nitrogen in Switzerland, in: Acid rain 2000, Springer, Dordrecht, 1223–1228, https://doi.org/10.1007/978-94-007-0810-5_5, 2001.
Rogger, J., Hörtnagl, L., Buchmann, N., and Eugster, W.: Carbon dioxide fluxes of a mountain grassland: Drivers, anomalies and annual budgets, Agr. Forest Meteorol., 314, 108801, https://doi.org/10.1016/j.agrformet.2021.108801, 2022.
Rustad, L. E., Campbell, J., Marion, G., Norby, R., Mitchell, M., Hartley, A., Cornelissen, J. H. C., and Gurevitch, J.: A meta-analysis of the response of soil respiration, net nitrogen mineralization, and aboveground plant growth to experimental ecosystem warming, Oecologia, 126, 543–562, 2001.
Ryan, E. M., Ogle, K., Zelikova, T. J., LeCain, D. R., Williams, D. G., Morgan, J. A., and Pendall, E.: Antecedent moisture and temperature conditions modulate the response of ecosystem respiration to elevated CO2 and warming, Glob. Change Biol., 21, 2588–2602, 2015.
Schlesinger, W. H.: Carbon balance in terrestrial detritus, Annu. Rev. Ecol. Syst., 8, 51–81, 1977.
Smith, J. O., Smith, P., Wattenbach, M., Zaehle, S., Hiederer, R., Jones, R. J., Montanarella, L., Rounsewell, M. D. A., Reginster, I., and Ewert, F.: Projected changes in mineral soil carbon of European croplands and grasslands, 1990–2080, Glob. Change Biol., 11, 2141–2152, 2005.
Soussana, J. F., Allard, V., Pilegaard, K., Ambus, P., Amman, C., Campbell, C., Ceschia, E., Clifton-Brown, J., Czobel, S., Domingues, R., Flechard, C., Fuhrer, J., Hensen, A., Horvath, L., Jones, M., Kasper, G., Martin, C., Nagy, Z., Neftel, A., Raschi, A., Baronti, S., Rees, R. M., Skiba, U., Stefani, P., Manca, G., Sutton, M., Tuba, Z., and Valentini, R.: Full accounting of the greenhouse gas (CO2, N2O, CH4) budget of nine European grassland sites, Agr. Ecosyst. Environ., 121, 121–134, 2007.
Subke, J. A. and Bahn, M.: On the `temperature sensitivity' of soil respiration: can we use the immeasurable to predict the unknown?, Soil Biology and Biochemistry, 42, 1653–1656, 2010.
Thimonier, A., Kosonen, Z., Braun, S., Rihm, B., Schleppi, P., Schmitt, M., Seitler, E., Waldner, P., and Thöni, L.: Total deposition of nitrogen in Swiss forests: Comparison of assessment methods and evaluation of changes over two decades, Atmos. Environ., 198, 335–350, 2019.
Van Der Wal, R., and Stien, A.: High-arctic plants like it hot: A long-term investigation of between-year variability in plant biomass, Ecology, 95, 3414–3427, 2014.
Vitousek, P. M., Aber, J., Howarth, R. W., Likens, G. E., Matson, P. A., Schindler, D. W., Schlesinger, W. H., and Tilman, G. D.: Human alteration of the global nitrogen cycle: causes and consequences, Ecol. Appl., 7, 737–750, 1997.
Volk, M., Obrist, D., Novak, K., Giger, R., Bassin, S., and Fuhrer, J.: Subalpine grassland carbon dioxide fluxes indicate substantial carbon losses under increased nitrogen deposition, but not at elevated ozone concentration, Glob. Change Biol., 17, 366–376, 2011.
Volk, M., Wolff, V., Bassin, S., Ammann, C., and Fuhrer, J.: High tolerance of subalpine grassland to long-term ozone exposure is independent of N input and climatic drivers, Environ. Pollut., 189, 161–168, 2014.
Volk, M., Enderle, J., and Bassin, S.: Subalpine grassland carbon balance during 7 years of increased atmospheric N deposition, Biogeosciences, 13, 3807–3817, https://doi.org/10.5194/bg-13-3807-2016, 2016.
Volk, M., Bassin, S., Lehmann, M. F., Johnson, M. G., and Andersen, C. P.: 13C isotopic signature and C concentration of soil density fractions illustrate reduced C allocation to subalpine grassland soil under high atmospheric N deposition, Soil Biol. Biochem., 125, 178–184, 2018.
Volk, M., Suter, M., Wahl, A.-L., and Bassin, S.: Subalpine grassland productivity increased with warmer and drier conditions, but not with higher N deposition, in an altitudinal transplantation experiment, Biogeosciences, 18, 2075–2090, https://doi.org/10.5194/bg-18-2075-2021, 2021.
Volk, M., Suter, M., Wahl, A.-L., and Bassin, S.: Dataset for 'Massive warming-induced carbon loss from subalpine grassland soils in an altitudinal transplantation experiment' Volk et al. 2022, Zenodo [data set], https://doi.org/10.5281/zenodo.6558331, 2022.
Walker, T. W., Janssens, I. A., Weedon, J. T., Sigurdsson, B. D., Richter, A., Peñuelas, J., Leblans N. I. W., Bahn, M., Bartrons, M., De Jonge, C., Fuchslueger, L., Gargallo-Garriga, A., Gunnarsdóttir, G. E., Marañón-Jiménez, S., Oddsdóttir, E. S., Ostonen, I., Poeplau, C., Prommer, J., Radujković, D., Sardans, J., Sigurðsson, P., Soong, J. L., Vicca, S., Wallander, H., Ilieva-Makulec, K., and Verbruggen, E.: A systemic overreaction to years versus decades of warming in a subarctic grassland ecosystem, Nature Ecology and Evolution, 4, 101–108, 2020.
Wang, N., Quesada, B., Xia, L., Butterbach-Bahl, K., Goodale, C. L., and Kiese, R.: Effects of climate warming on carbon fluxes in grasslands–A global meta-analysis, Glob. Change Biol., 25, 1839–1851, 2019.
Wood, S. N.: Generalized Additive Models. An Introduction with R, 2nd edn., Chapman and Hall/CRC, London, https://doi.org/10.1201/9781315370279, 2017.
Wüst-Galley, C., Volk, M., and Bassin, S.: Interaction of climate change and nitrogen deposition on subalpine pastures, J. Veg. Sci., 32, e12946, https://doi.org/10.1111/jvs.12946, 2021.
Xu, X., Shi, Z., Chen, X., Lin, Y., Niu, S., Jiang, L., Luo, R., and Luo, Y.: Unchanged carbon balance driven by equivalent responses of production and respiration to climate change in a mixed-grass prairie, Glob. Change Biol., 22, 1857–1866, 2016.
Zhou, T., Shi, P., Hui, D., and Luo, Y.: Global pattern of temperature sensitivity of soil heterotrophic respiration (Q10) and its implications for carbon-climate feedback, J. Geophys. Res., 114, G02016, https://doi.org/10.1029/2008JG000850, 2009.
- Abstract
- Introduction
- Materials and methods
- Results
- Discussion
- Conclusion
- Appendix A: Supplementary information on the gas exchange measurement and parameterization
- Appendix B
- Data availability
- Author contributions
- Competing interests
- Disclaimer
- Acknowledgements
- Financial support
- Review statement
- References