the Creative Commons Attribution 4.0 License.
the Creative Commons Attribution 4.0 License.
 | 23 Mar 2021
Subalpine grassland productivity increased with warmer and drier conditions, but not with higher N deposition, in an altitudinal transplantation experiment
Matthias Volk
Matthias Suter
Anne-Lena Wahl
Seraina Bassin
Multiple global change drivers affect plant productivity of grasslands and thus ecosystem services like forage production and the soil carbon sink. Subalpine grasslands seem particularly affected and may serve as a proxy for the cold, continental grasslands of the Northern Hemisphere. Here, we conducted a 4-year field experiment (AlpGrass) with 216 turf monoliths, subjected to three global change drivers: warming, moisture, and N deposition. Monoliths from six different subalpine pastures were transplanted to a common location with six climate scenario sites (CSs). CSs were located along an altitudinal gradient from 2360 to 1680 m a.s.l., representing an April–October mean temperature change of −1.4 to +3.0 ∘C, compared to CSreference with no temperature change and with climate conditions comparable to the sites of origin. To uncouple temperature effects along the altitudinal gradient from soil moisture and soil fertility effects, an irrigation treatment (+12 %–21 % of ambient precipitation) and an N-deposition treatment (+3 kg and +15 kg N ha−1 a−1) were applied in a factorial design, the latter simulating a fertilizing air pollution effect.
Moderate warming led to increased productivity. Across the 4-year experimental period, the mean annual yield peaked at intermediate CSs (+43 % at +0.7 ∘C and +44 % at +1.8 ∘C), coinciding with ca. 50 % of days with less than 40 % soil moisture during the growing season. The yield increase was smaller at the lowest, warmest CS (+3.0 ∘C) but was still 12 % larger than at CSreference. These yield differences among CSs were well explained by differences in soil moisture and received thermal energy. Irrigation had a significant effect on yield (+16 %–19 %) in dry years, whereas atmospheric N deposition did not result in a significant yield response. We conclude that productivity of semi-natural, highly diverse subalpine grassland will increase in the near future. Despite increasingly limiting soil water content, plant growth will respond positively to up to +1.8 ∘C warming during the growing period, corresponding to +1.3 ∘C annual mean warming.
- Article
(12026 KB) - Full-text XML
- Companion paper
- BibTeX
- EndNote


The present period of global warming is most pronounced in the cold regions of high altitude and high latitude (Core writing team, IPCC, 2014). The productivity of these ecosystems is temperature-limited, and even though the temporal distribution of total annual radiation differs, they share many similarities. After the temperature decline following the Holocene climate optimum (ca. 9000–6000 a BP; Vinther et al., 2009), they are now experiencing a rapid rewarming.
In cold environments, the perspective on climate change is different compared to temperate and warm environments. First, mitigation of the thermal growth limitation is likely to have beneficial effects on plant growth. Second, the warming-associated drought risk is lower. The evaporative demand is much lower and at least the initial water supply for plant growth is granted because even a small winter snowpack supplies a large soil moisture resource in spring. Third, in many regions the warming comes along with rising atmospheric nitrogen (N) deposition, originating from agriculture and fossil fuel burning. Atmospheric N deposition can be as little as < 5 kg N ha−1 a−1 at remote mountain sites (Rihm and Kurz, 2001) but can reach rates > 40 kg N ha−1 a−1 elsewhere in Switzerland (Rihm and Achermann, 2016). This fertilizing air pollution agent promotes plant growth and has the potential to reduce plant species diversity by favoring fast-growing species (Vitousek et al., 1997; Bobbink et al., 2010; Phoenix et al., 2012). Alone and in interaction, all three factors increase the ecosystem plant productivity potential in cold regions. Given that essential ecosystem services strongly co-depend on plant productivity (e.g., forage supply for livestock and wildlife, soil erosion control, and support of the biological carbon sink), an improved knowledge on how climate warming affects productivity of colder grassland systems is required.
However, previous warming experiments on plant productivity have shown inconsistent results. For example, tundra vegetation showed an up to 2-fold productivity increase in response to increased summer temperature (Van der Wal and Stien, 2014). In contrast, Liu et al. (2018) combined long-term observations with a manipulative experiment to find that total net primary productivity (NPP) in Tibetan grassland remained unaffected, though the relative abundance of grasses was increased at the expense of forbs and sedges by drought and warmth. In yet another meta-analysis, only 13 out of 20 experimental grassland sites revealed small increases in plant productivity due to warming (Rustad et al., 2001): while grassland ecosystems in general showed both positive and negative responses, the colder tundra systems (high latitude or altitude) with lower precipitation had positive and larger productivity responses to warming.
To make matters more complicated, evapotranspiration will increase in warming experiments. The resulting temperature-confounded lower soil moisture makes it impossible to determine the proper temperature effect on plant growth. Only comparing the plant growth response at warming-confounded, reduced soil moisture and at experimentally mitigated soil moisture allows us to distinguish warming effects from moisture effects.
A common restriction for the usability of climate change experiments for ecosystem productivity projections lies in the low number of concurrently manipulated environmental factors (Rustad, 2008; but see Dukes et al., 2005 for an exception). This potentially leads to an overestimation of effects when data from several single-factor experiments are combined in meta-analyses or models (Leuzinger et al., 2011). Indeed, productivity responses to combined factors are usually less than additive in size, compared to single treatment responses (Dieleman et al., 2012; Xu et al., 2013). Not only a low number of treatment factors but also a low number of treatment levels can invite overly simplistic interpretation of experimental results, if only a short or linear segment out of a larger range of biologically possible responses is represented in the data. For example, a hump-shaped response curve (two-dimensional) under atmospheric N deposition best described the properties of a soil C sink in subalpine grassland (Volk et al., 2016). Similarly, a ridge-shaped response surface (three-dimensional), driven by temperature and precipitation during 17 experimental years, was needed to explain NPP data (Zhu et al., 2016). These findings demonstrate how, depending on the chosen treatment levels and their interaction with the ambient climate, the vegetation in a global change productivity experiment may respond with increasing as well as decreasing growth. Combining multiple treatments with many levels might thus improve interpretation of experimental outcomes and related climate change predictions.
Here, we present 4 years of results from a field experiment in the Swiss Alps. Turf monoliths from a variety of grassland communities at six different sites of origin were transplanted to one common experimental site to test for a plant productivity response that is not restricted to a specific species composition. At the common site, transplanted turf monoliths were distributed over six levels of altitude to generate a climate gradient. Doing so, we included not only the temperature change, but also the changing length of the growing period. The between-year weather variability created a large variety of climate situations within the range of potential growth conditions. Additionally, to uncouple temperature effects along the altitudinal gradient from soil moisture and soil fertility effects, a two-level irrigation treatment and a three-level atmospheric N-deposition treatment were set up in a factorial design. We hypothesized the following.
-
The effect of warming on plant growth would be beneficial at moderate warming levels but detrimental at high warming levels.
-
Increased soil water content would mitigate the detrimental effects of excessive warming levels.
-
N deposition would exhibit a generally favorable effect on plant growth. This effect would further increase with higher temperatures and irrigation due to their mitigating effect on thermal and water co-limitations.
This experiment (AlpGrass experiment) used grassland monoliths to investigate climate change effects on subalpine pasture ecosystems in the central Alps. At six different sites in the Canton Graubünden, Switzerland, areas of 1 ha on southerly exposed moderate slopes were selected at an altitude of ca. 2150 m a.s.l. to serve as “sites of origin”. All six sites were mountain grassland used for summer livestock grazing, within ≤ 55 km distance of each other, but their soil (typical depth 20–30 cm) developed either on basic or on acidic bedrock. Thus, the sites of origin shared very similar climatic conditions but represented a wide range of soil properties and plant communities. Plant communities at the sites of origin were generally dominated by grass and sedge species but also comprised a substantial share of forbs and a few legume species. Two of the summer pastures were characterized by Sesleretalia vegetation (with Sesleria caerulea, Anthyllis vulneraria, and Helianthemum nummularium present at both); the other four were dominated by Nardetalia vegetation (with typical species Nardus stricta, Leontodon helveticus, and Potentilla aurea). Nardus stricta, Polygonum viviparum, and Carex sempervirens were present in almost all monoliths, regardless of grassland type. Detailed information on soil properties and species composition of the different origins can be found in Wüst-Galley et al. (2021).
In June 2012 a total of 252 monoliths (6 sites of origin × 42 monoliths) of 0.1 m2 surface area (L × W × H = 37 × 27 × 22 cm) were excavated at the sites of origin. Randomly generated x–y coordinates were used to choose the location of excavation. If a distinct location had sufficiently deep soil and no rocks, if bare soil and woody species were < 10 %, and if there was no apparent dominance of single plant species, then monoliths were extracted. Otherwise, the next pair of coordinates was probed. Monoliths were placed into precisely fitting, well-drained plastic boxes to facilitate future transport and avoid potential side effects of experimental treatments applied later (Appendix Fig. A1). To minimize the disturbance of temperature and moisture conditions, monoliths were immediately reinserted into the ground at their respective site of origin.
Half a year later, in November 2012, 36 monoliths were transported from each site of origin to the common AlpGrass experimental site, while six monoliths each remained at their original site to allow for an assessment of the transplanting effect. Standardizing harvests were done in 2012 and 2013 to homogenize the canopy of the previously grazed monoliths that had more heterogeneous canopies than mown grassland.
2.1 Experimental site and treatment design
The AlpGrass experimental site is located on the south slope of Piz Cotschen (3029 m), above Ardez in the Lower Engadine valley (Graubünden, Switzerland). The site as a whole covers a 680 m altitudinal gradient, characterized by a vegetation change from montane forest (WGS 84 46.77818∘ N, 10.17143∘ E) to subalpine grassland (WGS 84 46.79858∘ N, 10.17843∘ E). Along the gradient, six separate climate scenario sites (CS) were located at different altitudes (CS1: 2360, CS2: 2170, CS3: 2040, CS4: 1940, CS5: 1830, CS6: 1680 m a.s.l.). Photographs of the environment can be found in the Appendix (Figs. A1–A4). Because CS2 had a similar altitude as the sites of origin, it was chosen as a reference site (hereafter CS2reference). CS2reference and sites of origin are all characterized by cold winters with permanent snow cover. The snow-free period lasts approximately from May to October, with a mean April–October air temperature of 6.5 ∘C during the experiment (Table 1). Annual mean temperature at CS2reference was 3.2 ∘C and mean precipitation sum was 748 mm (Table 2).
Table 1Climatic parameter means across years (± 1 SE) at the climate scenario sites (CSs) during the experiment: mean air temperature from April to October and for the whole year, April–October air temperature difference (ΔT) of respective CSs compared to CS2reference. Degree days above 0 ∘C for the snow-free period between annual harvests (DD0 ∘Ctotal). Pre-harvest period length is the number of days between snowmelt and harvest.
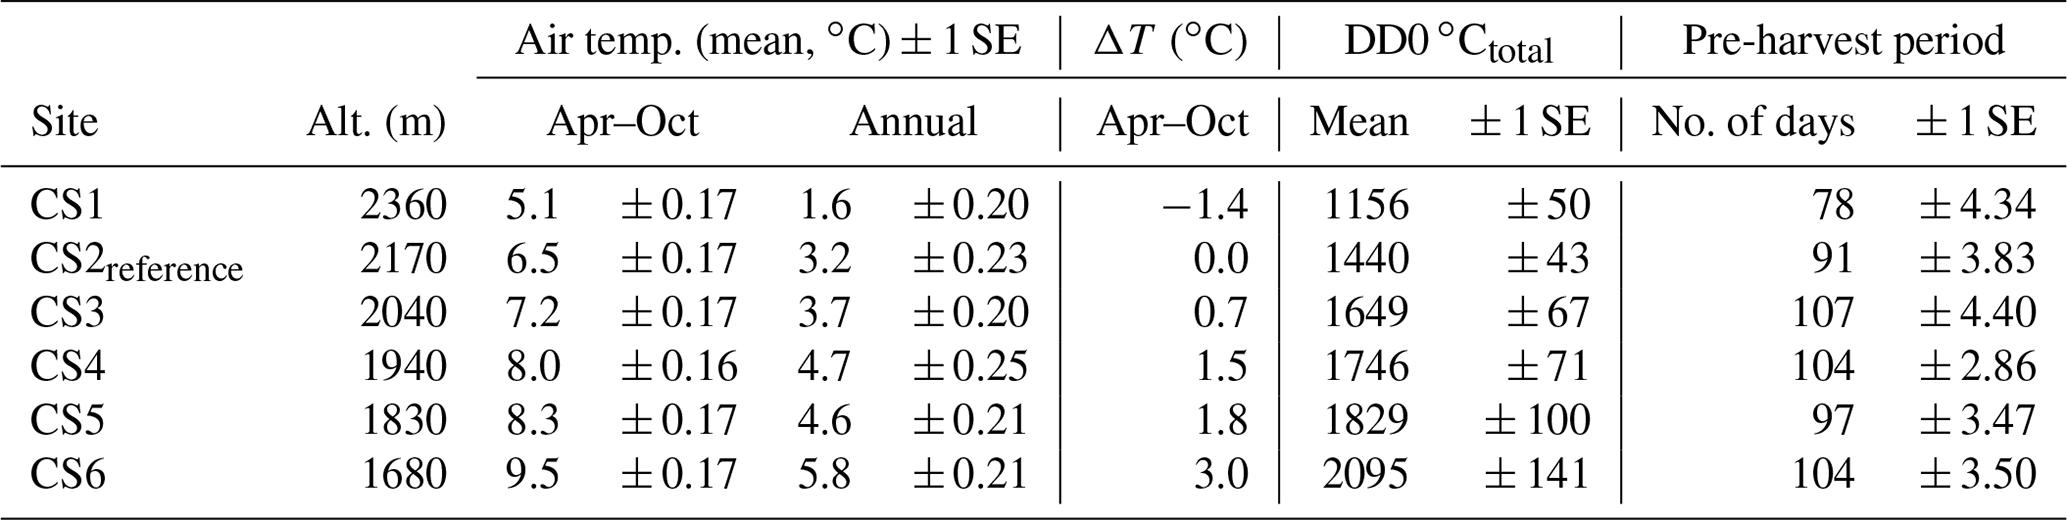
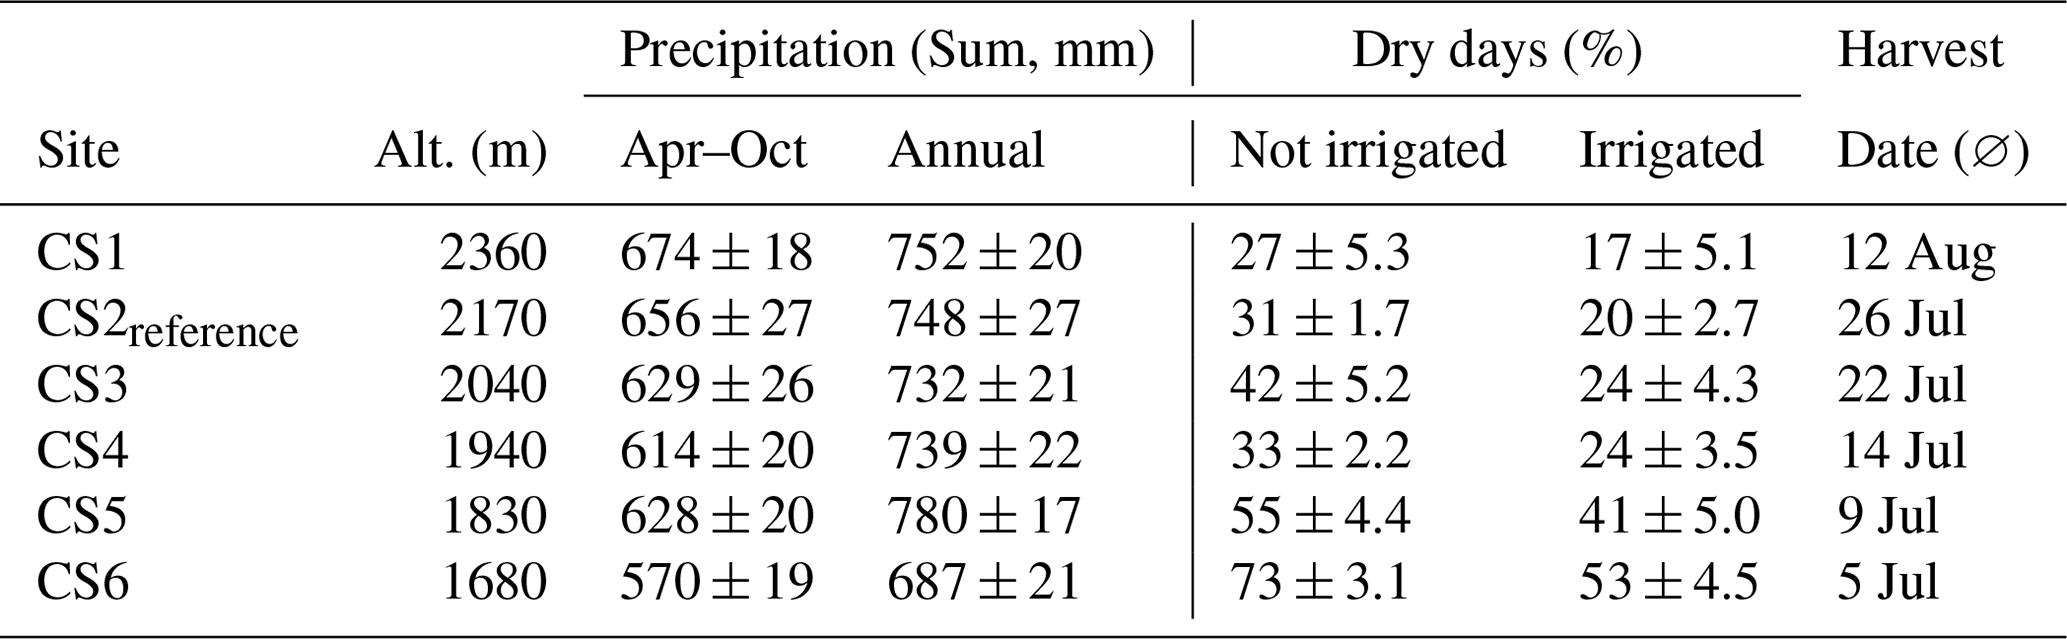
Table 2Precipitation sums for the climate scenario sites, aggregated from April to October and annually. For comparison, the closest Swiss Federal Office for Meteorology station (Scuol, 1303 m a.s.l., 9 km distance) reported 662 mm mean annual precipitation during the experiment. Dry days (%) indicate the percentage of days during the pre-harvest period with SWC < 40 %. The phenology-triggered harvest date reflects the delayed vegetation development at higher altitudes.
At each of the six CSs, six monoliths from each of the six sites of origin were installed in the ground within their drained plastic boxes, flush with the surrounding grassland surface, resulting in 36 monoliths per CS and a total of 216 transplanted monoliths (Appendix Figs. A2–A4). Monoliths in their containers were arranged side by side without a separating gap or buffer zone. The grassland surrounding the monoliths was frequently mown to prevent the introduction of new species/genotypes by seed dispersal.
At each CS, an irrigation and an N-deposition treatment were set up in a full-factorial design. One-half of the 36 monoliths (three monoliths per site of origin) received only ambient precipitation and no additional water; the other half received additional water during the growing season. Within each irrigation treatment, monoliths were subjected to an N treatment representing three levels of atmospheric N deposition (treatment details below, and see Appendix Table A1 for a schematic description). At each CS, irrigation and N treatments were arranged in a randomized complete block design (six blocks each containing all six irrigation–N treatment combinations). Moreover, monoliths of the six sites of origin were assigned to the six blocks by restricted randomization so that an equal distribution of sites of origin to all blocks was ensured.
2.2 Climate scenario site (CS) climate change treatment
The different altitudes of the CSs created a climate change scenario treatment, commencing in November 2012, when the monoliths were installed at the AlpGrass site, and ending in 2017 with the final harvest. The difference in altitude between the sites of origin and the respective CS at the AlpGrass experimental site determined the change of climatic conditions that the transplanted monoliths experienced. These conditions include the mean growing period temperature, from April to October. We assumed the evenly moderate temperature (ca. 0 ∘C) under the winter snow cover to be of little importance for differences in ecosystem productivity. The CS temperature treatment was specified as the deviation from CS2reference temperature. The available thermal energy was expressed as degree days (DDs) above a threshold of 0 ∘C (DD0 ∘C). To derive DD, the sum of hourly temperature means above 0∘C during 1 d was calculated and then divided by 24 h. To quantify the total thermal energy available for growth, DD during the snow-free period between the annual harvests (DD0 ∘Ctotal) was summed up, considering that the perennial vegetation continues to grow after mowing.
Differences in volumetric soil water content (SWC) were quantified as the proportion of days during the growing period with a SWC < 40 % (hereafter “dry days”). This < 40 % threshold does not necessarily imply plant growth limitation, but it was developed to reliably contrast the soil moisture status between the CSs and between years. Thus, more time below the threshold indicates a “drier period” in relative terms.
2.3 Irrigation treatment
An irrigation treatment with two levels was set up to distinguish the warming effect from the soil moisture effect, driven by warming. In several applications throughout the growing period, precipitation equivalents of 20 mm were applied to the monoliths under the irrigation treatment. The total amount of water added per monolith was 80, 120, 120, and 80 mm in 2014, 2015, 2016, and 2017, respectively. These amounts were equivalent to 12 %–21 % of the recorded precipitation sum during the growing periods.
2.4 N-deposition treatment
The N-deposition treatment consisted of three levels. Atmospheric N deposition from air pollution was simulated to amount to a deposition of 3 and 15 kg N ha−1 a−1, on top of the present background deposition. We used a 200 mL ammonium nitrate (NHNO) in water solution per monolith, which was applied in 12, ca. biweekly fractions, covering the growing period. Monoliths without additional N deposition received water without ammonium nitrate.
2.5 Meteorology
At all six CSs we measured air temperature, relative humidity (HygroClip 2 in an unaspirated radiation shield, Rotronic, Switzerland), and precipitation (ARG100 tipping-bucket rain gauge, Campbell Scientific, UK). Soil temperature and SWC were measured at 8 cm depth in six monoliths each at the topmost CS1 and intermediate CS3, CS4, and CS5, using a SWC reflectometer with 12 cm rods (CS655, Campbell Scientific, UK). At CS2reference and the lowest CS6 these values were measured in 18 monoliths and two points in the surrounding grassland. The measurement interval for all parameters was 10 min originally and was later integrated for longer periods as necessary.
At each site of origin, we installed Hobo U12-008 data loggers with TMC-HD sensors (Onset Computer Corporation, USA) in three monoliths and one spot in the undisturbed surrounding grassland for comparison with the reference climate scenario site CS2reference.
Ambient wet N deposition was measured at CS2reference and the lowest CS6 using bulk samplers (VDI 4320 Part 3, 2017; see Thimonier et al., 2019) between April 2013 and April 2015. Nitrate (NO) in rainwater and melted snow was analyzed by ion chromatography (ICS-1600, Dionex, USA), and NH was analyzed using a flow injection analyzer (FIAstar 5000, Foss, Denmark) with gas diffusion membrane, detection was completed with UV–vis photometry (SN EN ISO 11732).
2.6 Plant productivity
All plant material (including mosses and lichens) of the monoliths was cut 2 cm above the soil surface once per year at canopy maturity. This plant removal serves as a proxy for the short but intensive summer grazing period of traditional management. As a result of the phenology-triggered harvests (anthesis of Festuca rubra), the topmost CS1 was cut on average 38 d later than the lowest CS6. Plants were dried at 60 ∘C, allowed to cool in a desiccator, and weighed to determine dry matter yield (hereafter biomass yield).
2.7 Data analyses
Data were analyzed by linear mixed-effects models. First, we were interested in the overall response of biomass yield over years as affected by the treatment factors. To this aim, biomass yield was averaged across the four experimental years (2014–2017) and was modeled as a function of CS (factor of 6 levels), irrigation (factor of 2 levels), and N deposition (factor of 3 levels), including all interactions. Site of origin (six sites) and block (36 levels: 6 CS × 6 blocks) were modeled as random factors (random intercepts). Restricted maximum likelihood was used for parameter estimation. For the inference on fixed effects, the Kenward–Roger method was applied to determine the approximate denominator degrees of freedom (Kenward and Roger, 1997), and the marginal and conditional R2 values of the model were computed following Nakagawa and Schielzeth (2013). Differences in biomass yield between single CSs and the CSreference were tested based on the model contrasts (post hoc t tests, without using multiple comparisons). To receive additional insight into within-year treatment effects, this very same model was also applied to data of each of the 4 individual years.
Second, to consider the time effect and the repeated structure of the data, biomass yield of all 4 years was modeled as function of year (factor of 4 levels), CS, irrigation, and N deposition (factor levels as described), including all interactions. Here, random factors consisted of an identifier for monolith (216 levels) to consider the potential correlation of monoliths' biomass yield over years (modeled as random intercept). In addition, the model included the random factor site of origin and allowed for a separate block term at each of the 4 years (details as described). Residuals of all models were evaluated for normality and homoscedasticity and fulfilled assumptions of linear mixed-effects models. Finally, to gain insight into effects of thermal energy and drought on plant productivity, biomass yield was modeled as a function of each DD0 ∘Ctotal and percent days with less soil moisture (dry days) using generalized additive models (GAMs). Generalized additive models had to be used as simple linear models could not appropriately handle these relationships. The GAMs included the fixed factor irrigation and a smooth term for the continuous variables DD0 ∘Ctotal and percent dry days, respectively, for both levels of the irrigation treatment. Model validation revealed that the assumptions of GAMs were met; more information on the model specification is given in the Appendix. All data were analyzed with the statistics software R, version 4.0.2 (R Core Team, 2020) and packages lme4 for linear-mixed effect models (Bates et al., 2015) and mgcv for GAMs (Wood, 2017).
3.1 Climate scenario site (CS) environmental conditions
3.1.1 Low atmospheric background N deposition
Total N deposition was 3.3 kg N ha−1 a−1 at CS2reference and 4.3 kg N ha−1 a−1 at the lowest CS6. The seasonal distribution showed peak deposition rates in June and July.
3.1.2 Consistent temperature, precipitation, and drought changes with altitude
The mean April–October temperature gradient of up to +3 ∘C compared to CS2reference, distributed over four altitudinal levels (CS3–CS6), constituted the warming treatment. Conversely, temperature at the topmost CS1 constituted a cooling treatment (ΔT. −1.4 ∘C), extending the range of temperature responses tested (ΔT, Table 1). As intended, the DD0 ∘Ctotal steadily increased from CS2reference to the lowest CS6. The pre-harvest period (PHP) length was fairly similar among CSs, because the early snowmelt at the lower CS was compensated for by an early harvest (Table 1).
We observed a small, non-linear increase in precipitation with altitude during April–October. The recorded annual precipitation sum was somewhat larger than the sum for the growing period (Table 2).
The length of the period with less soil moisture (% dry days) doubled along the altitudinal gradient: at the two top CSs only one-third of the pre-harvest period was dry, compared to two-thirds of the time at the lowest site CS6 (compare Tables 1 and 2). The irrigation treatment reduced the incidence of days with < 40 % soil moisture to 60 %–80 % of the non-irrigated situation (Table 2).
3.1.3 Small transplantation effects on soil temperature and moisture
At the sites of origin, the mean April–October soil temperatures in the undisturbed grassland were 8.8 ∘C (± 0.3) compared to 8.9 ∘C (± 0.3) in the monoliths. At CS2reference this difference was 9.2 ∘C vs. 9.5 ∘C. Thus, the surrounding grassland at the CS2reference site was on average 0.4 ∘C warmer than at the sites of origin, and monoliths at CS2reference were 0.3 ∘C warmer than the undisturbed grassland surrounding the experiment. Volumetric SWC in the undisturbed grassland was 1 % lower on average compared to SWC in the monoliths at CS2reference and the lowest CS6.
3.2 Yield
3.2.1 Insignificant transplantation effect
The mean annual yield was 20 % larger at CS2reference (control treatment monoliths), compared to the origins (162 g m−2; ± 12.7), but not significantly different (P=0.19; paired, two-sided t test). Equally important, the difference showed no trend, as in some years the yield at CS2reference was higher and in some years it was lower compared to the sites of origin.
3.2.2 Strongest climate scenario site effect at intermediate CS
Across the 4 years, we found a highly significant effect of the CS on aboveground biomass yield (Table 3). At intermediate sites, yields increased by +43 %, +18 %, and +44 % (CS3, CS4, and CS5, respectively; Table 4, P≤0.05 at least), related to +0.7, +1.5, and +1.8 ∘C of the warming component of the respective CS (compare Table 1). Even at the warmest site CS6 the yield was still +12 % larger compared to the CS2reference site ( ∘C, ΔDD0 ∘Ctotal=655). The coldest site CS1 was not less productive than CS2reference. In the year of the overall maximum productivity (2016), the coldest site CS1 and the warmest site CS6 also produced their respective record yield (Table 4). Overall, the yields of the 24 combinations of year × CS varied by a factor of 2.1 (yields averaged across irrigation and N-deposition treatments). The yield response to CSs differed between years (Appendix Table A2, year × CS interaction: P< 0.001) in that the CS effect became weaker towards the end of the experiment (Appendix Table A3).
Table 3Summary of analyses for the effects of climate scenario site (CS), irrigation, and N deposition on aboveground biomass yield of subalpine grassland. Data were averaged across the four experimental years (total n=216). F tests refer to the fixed effects of the linear mixed-effects model. The marginal and conditional R2 values were 0.41 and 0.50, respectively.
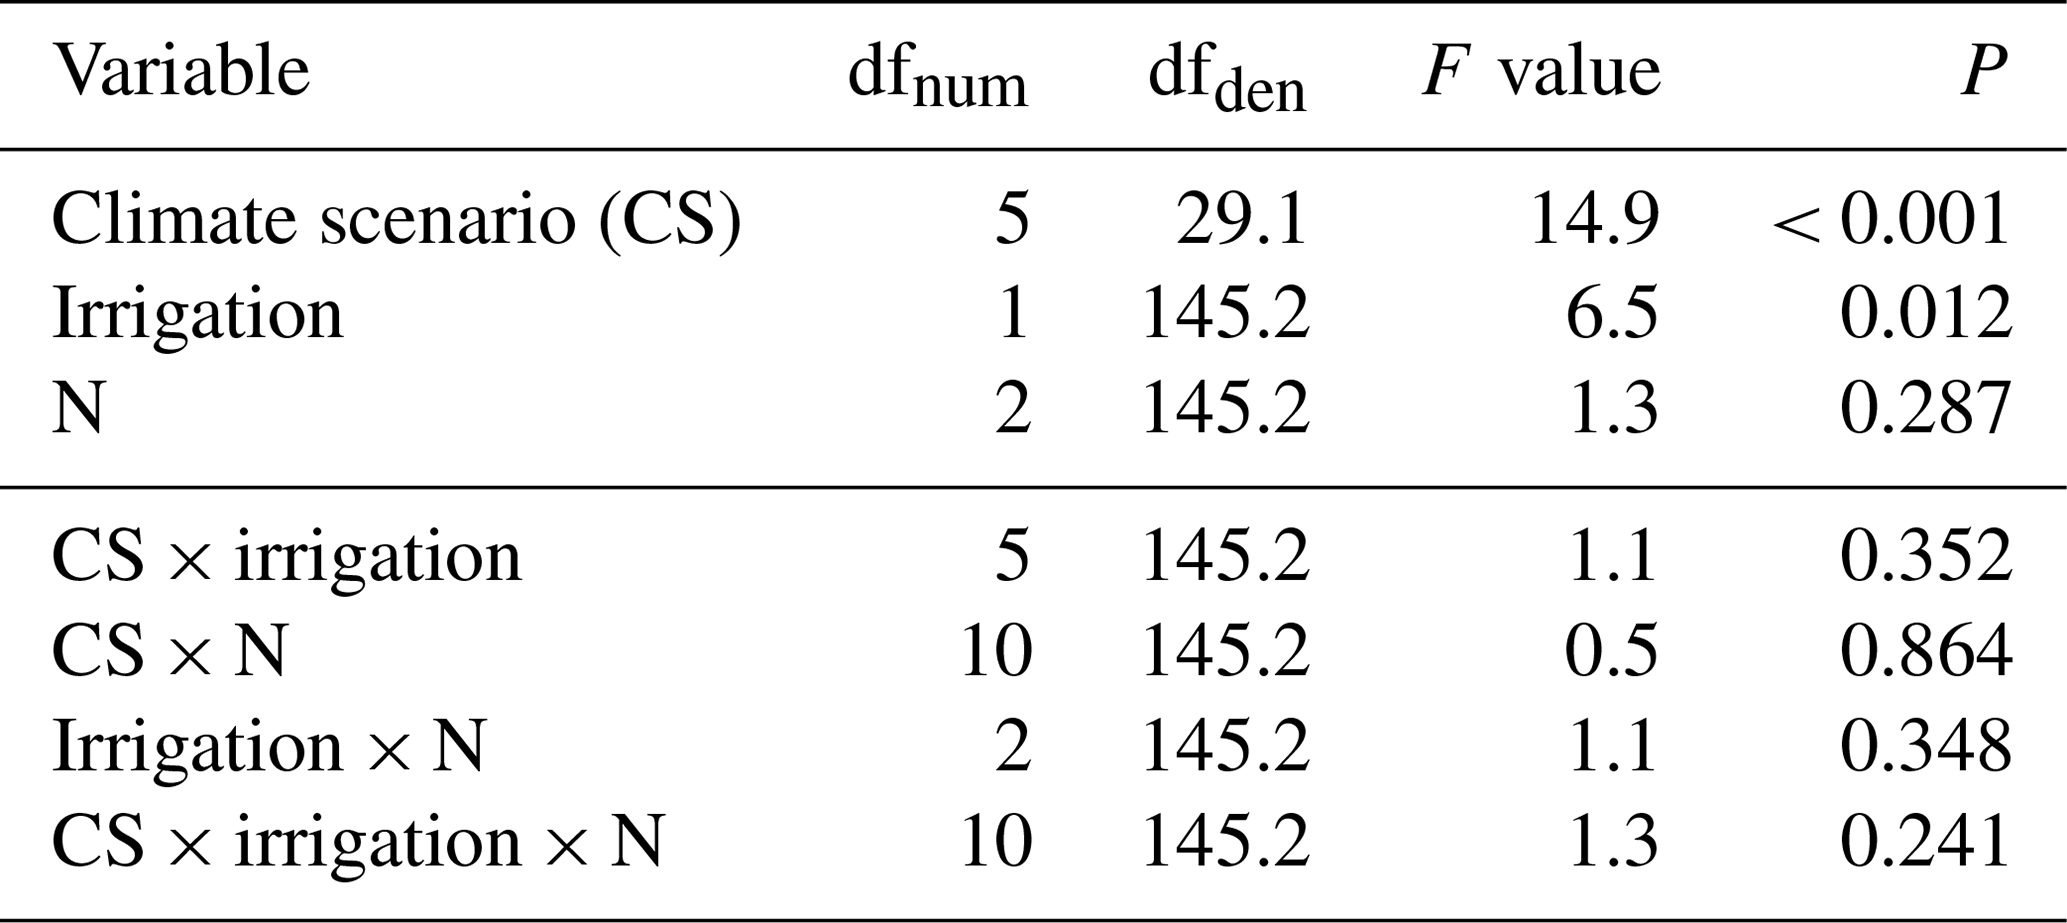
dfnum: degrees of freedom of term; dfden: degrees of freedom of error (which can be fractional in restricted maximum likelihood analysis).
3.2.3 Irrigation effect in dry years
Despite a mere +7.7 % average yield increase (Fig. 1b), irrigation turned out to be a significant factor across years (Table 3). Yet, the effect of irrigation differed between years (Appendix Table A2, year × irrigation interaction: P< 0.001), and single-year analysis detected positive effects of irrigation only in 2015 (+15.8 %) and 2017 (+18.8 %) (Appendix Table A3). In these years, the percentage of days with < 40 % soil moisture was highest.
3.2.4 No nitrogen deposition effect
A total of 5 years of experimentally increased atmospheric nitrogen deposition (+3 and +15 kg N ha−1 a−1) did not cause a significant response of biomass yield. Moreover, there was no significant interaction detected between the N treatment and the factors CS or irrigation (Fig. 1a; Table 3). Single-year analysis, to test for a late response to accumulating amounts of N, revealed a marginally significant effect only in 2016 (Appendix Table A3).
3.2.5 Yield at climate scenario sites strongly relates to changes in thermal energy and soil moisture
Biomass yield at the different CSs was significantly related to thermal energy, expressed as growing DD0 ∘Ctotal. Here, intermediate CSs (CS3, CS5) had the greatest yields at intermediate values of DD0 ∘Ctotal, indicated by the curvature of the predicted line in particular under irrigated conditions (Fig. 2a, Appendix Table A4, smooth term for DD0 ∘Ctotal: P< 0.001).
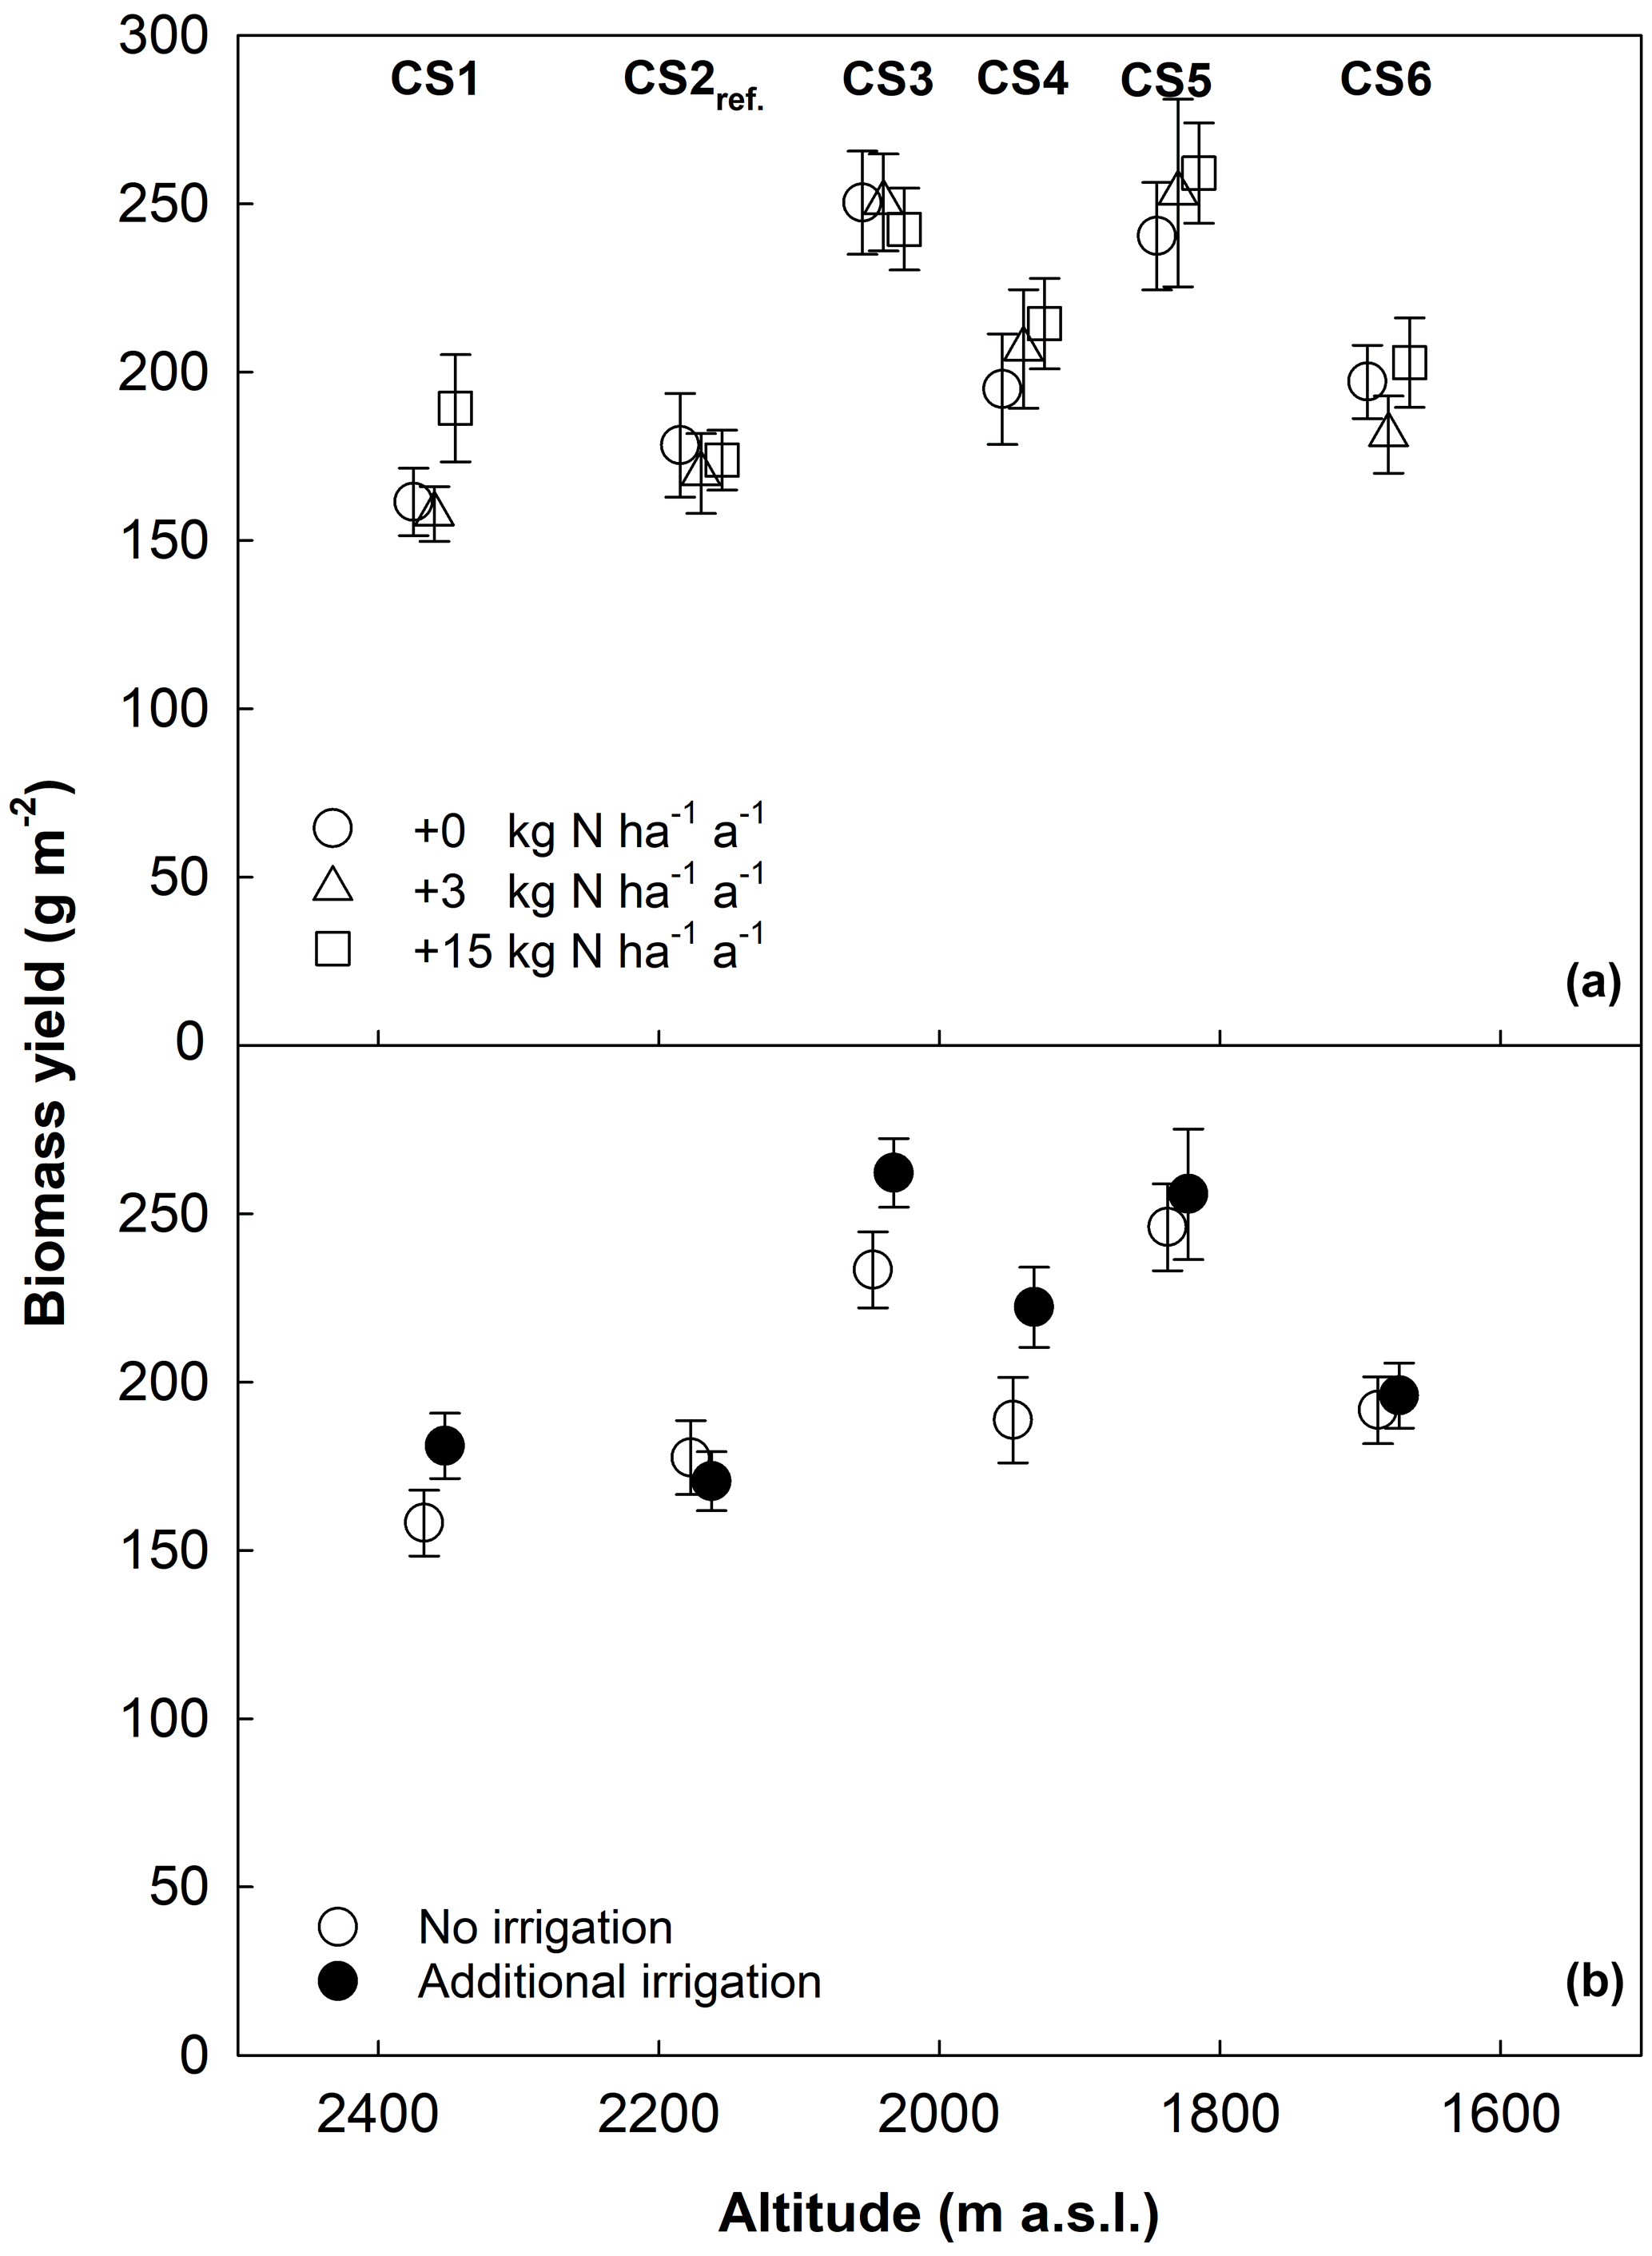
Figure 1Aboveground biomass yield as a function of the altitude of CSs. Data were averaged across years; circles denote means ± 1 SE. Warming and dry days (%) increase with decreasing altitude from left to right. (a) Yield values grouped by N-deposition treatment (0, 3, and 15 kg N ha−1 a−1, in addition to 4–5 kg N background deposition). (b) Yield values grouped by irrigation treatment. Overlapping means and SEs are shifted horizontally to improve their visibility.
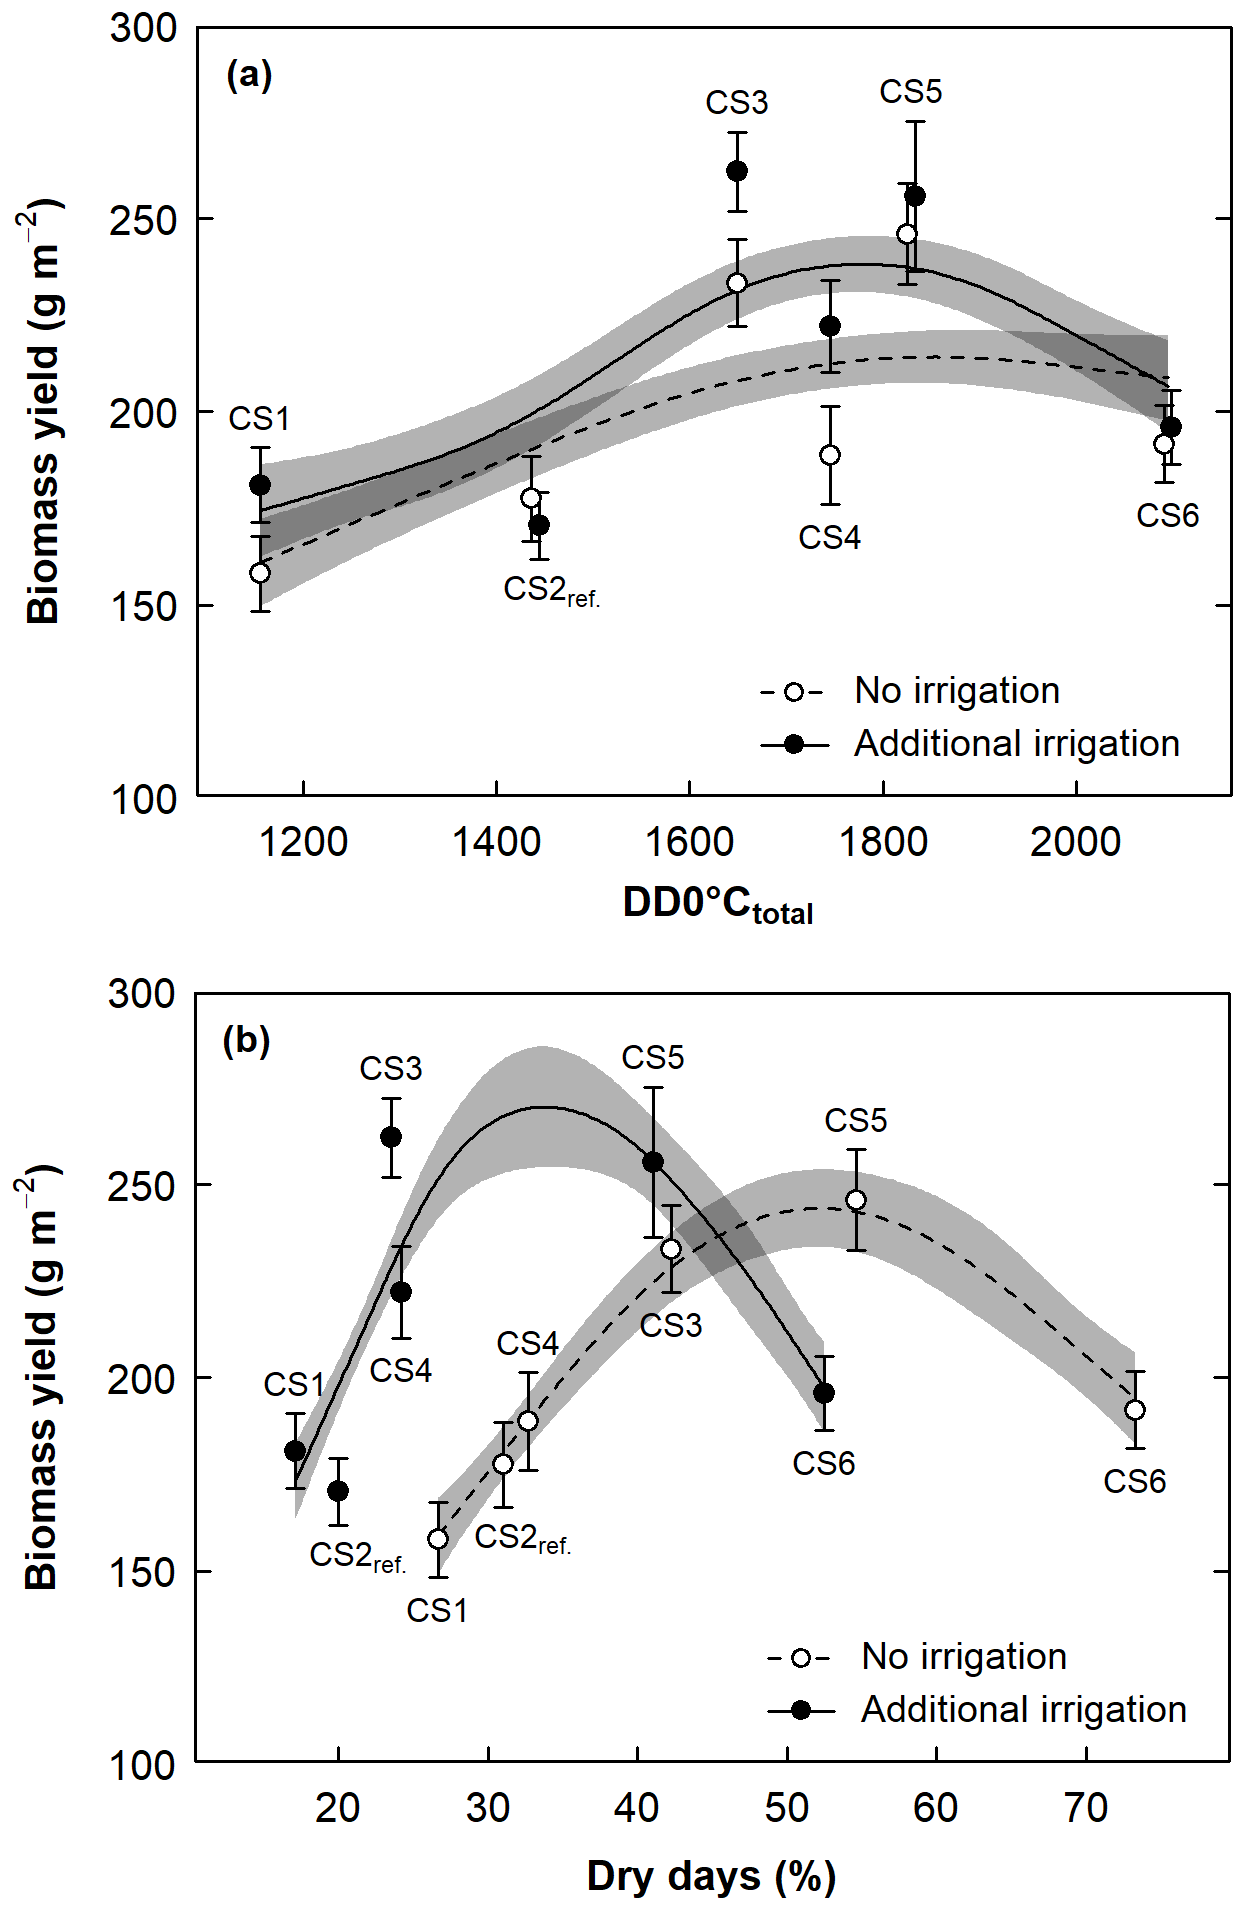
Figure 2Aboveground biomass yield at the six CSs as (a) a function of total received thermal energy (DD0 ∘Ctotal) and (b) percent of days with dry soil (SWC < 40 %) during the growing season (dry days %). Data were averaged across years; circles denote means ± 1 SE per CS and irrigation treatment. The predicted line is based on a generalized additive model using all data (± 1 SE light grey shaded). Dark grey indicates the cross section of the two SE bands. Overlapping means and SEs in (a) are shifted horizontally to improve their visibility.
Similarly, biomass yield was significantly related to days with soil moisture < 40 % (dry days) during the growing season, with intermediate CS3 and CS5 having the highest yields at around 50 % of dry days under no irrigation and at around 30 % dry days under additional irrigation (Fig. 2b, Appendix Table A5, smooth term for dry days: P< 0.001). Under unirrigated conditions, in parallel with a doubling of dry days (from 27 % at topmost CS1 to 55 % at intermediate CS5), yield consistently rose and only fell at the driest and warmest site CS6, with 73 % dry days.
We found a substantial and significant positive effect of climate scenarios, equivalent to warming of up to +1.8 ∘C (April–October mean), on aboveground biomass of subalpine grasslands (up to +44 % yield). Contrary to expectation, additional resource supply through irrigation and N deposition had only marginal (water) or no effect (N) on yield, respectively. Our transplanting experiment proved to be efficient in assessing several linked climate change drivers in their effect on plant growth.
4.1 Climate scenario temperature effects
The phenology-triggered harvest opened the possibility to extend the growing period in cool years and shorten the exposure to drought stress in warm years. Thus, beneficial thermal effects were maximized, while detrimental drought effects were minimized. As a consequence, we displayed the yield over a continuous x axis of degree days between harvests (DD0 ∘Ctotal, Fig. 2a). This represents the available thermal resource, associated with a particular yield, much better than mean temperatures of CS or categorical values for CS1–CS6.
In cold environments, the warming is so important because the metabolic growth processes, which utilize the assimilated energy, are strongly temperature dependent, much more so than the assimilation process per se (Körner, 2003). In a meta-analysis of grassland responses to warming that included 32 sites, distinctly positive warming effects on growth were found in the colder portion of those ecosystems (Rustad et al., 2001), very similar to responses in the subalpine grassland of the current study. Interestingly, the response size of our effects is also in the same range as that reported by Rustad et al. (2001).
Plant growth at the intermediate climate scenarios that represented a warming of 0.7, 1.5, and 1.8 ∘C (April–October) clearly benefitted from greater warmth. However, the increase in responses was somewhat inconsistent (CS4 ca. +18 %, CS3 and CS5 both >+40 %), only partly matching our first hypothesis. The erratic response of intermediate CS4 is likely the result of an interaction of micro-topography effects on climate that were not detected by our meteorological measurements, cockchafer infestation (Melolontha melolontha: beetle whose larvae feed on roots), or the occurrence of mast years in some species at that CS. In the extreme treatment at the lowest CS6 (+3 ∘C April–October, +2.4 ∘C annual mean) the positive response to warming finally ceased to increase, but yield was still somewhat larger than at CS2reference. This comparatively low growth response suggests that the water supply at CS6 had already reached critically low levels; yet, the larger thermal energy resource must have partly compensated for the radically smaller soil water resource, also leading to some growth benefit at CS6 (compare Fig. 2a and b).
Despite substantial cooling at the topmost CS1, coinciding with a temperature decline of −1.4 ∘C, the mean yields for CS1 and CS2reference were very similar (Table 4, Fig. 1). This is indicative of a plant community that is well cold-adapted. Indeed, local historical records from the Swiss Federal Office for Meteorology (MeteoSwiss) show that only 100 years ago the local April–October mean air temperature was 1.4–1.5 ∘C lower than today (30-year running mean, courtesy Pierluigi Calanca using MeteoSwiss data from Segl-Maria site at 1804 m a.s.l.). In effect, the cooling upward transplantation represented a climatic time travel of 100 years into the past, and the similar yield responses between CS1 and CS2reference indicate that subalpine grassland productivity may not have changed much during the past century. Moreover, the dramatic temperature dynamics during the past 12 000 years of the Holocene interglacial suggest that temperature adaptations in modern plant genotypes may actually match not only today's weather, but also warmer and cooler climate conditions. From this perspective, and with respect to the genetic memory of plants, the undiminished productivity at the topmost CS1 illustrates that assumed “control” temperatures in warming experiments only represent the most recent point of an extremely dynamic climatic history.
Table 4Aboveground biomass yield (means ± 1 SE) per CS and year, averaged across irrigation, N-deposition treatments, and site of origin. Within each year, significance tests are against CS2reference, based on contrasts derived from linear mixed-effects models (see Tables 3 and A1, for the respective model summaries). Shaded values indicate the CS with the greatest aboveground biomass yield per year and across years.
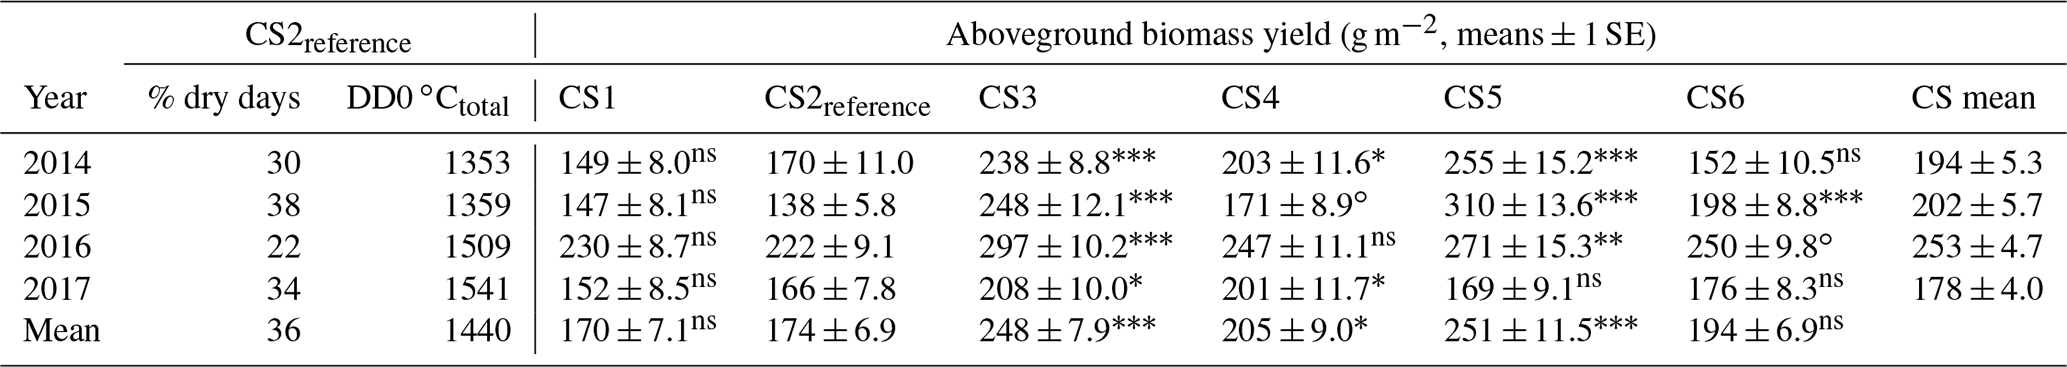
P≤0.001. P≤0.01. * P≤0.05. ∘ P≤0.1. ns P>0.1.
4.2 Climate scenario soil moisture effects
The differences in soil moisture content that resulted naturally from 24 different climatic situations (6 CS and altitude levels × 4 years) created a hump-shaped response curve of yield over drought (Fig. 2b). This does imply that, with decreasing altitude and increasing warmth, productivity rose despite more days with soil moisture < 40 %.
The importance of soil moisture for plant growth has been shown predominantly in much drier grasslands, e.g., in warmer prairie (Xu et al., 2013) or cold alpine grassland (Wang et al., 2013), where release from drought stress benefitted growth. For example, along a temperature and altitude gradient in semiarid Tibetan alpine grassland, productivity increased with altitude due to reduced drought stress but despite decreasing temperatures. Only after an 800 m rise in altitude, did productivity eventually become smaller, and further reduced drought stress did not constitute a further advantage on plant growth (Wang et al., 2016).
In our experiment, soil moisture values and its proxies integrate information on moisture and temperature. Thus, the two-dimensional growth response curve along the altitudinal gradient, peaking at the least detrimental situation between moisture limitation and thermal limitation (Fig. 2b), is analogous to the three-dimensional response surface found in the Jasper Ridge experiment (Zhu et al., 2016). Unfortunately, our experiment did not produce a sufficient number of data points for a 3-D presentation. Based on these results, we infer that a joint evaluation of soil moisture and temperature is mandatory to reliably assess warming effects of climate change on plant growth in the subalpine environment.
4.3 Irrigation treatment
We had assumed that increased SWC would mitigate detrimental effects of excessive warming. Surprisingly however, the overall irrigation effect on yield was not very substantial, despite large differences in the percentages of days with soil moisture < 40 % during the growing season (Table 2, Fig. 2b). Moreover, the positive responses did not increase consistently with warmth but were strongest at the intermediate CS3 and CS4 (Fig. 1b). Analyses of individual years showed that the two significant responses of annual yield to irrigation coincided with the 2 driest years. This evidence suggests that maximum mitigation of (low) temperature limitation requires simultaneous release of water limitation, while at the same time the amount of water applied in our study was insufficient to compensate for increased evapotranspiration at CS5 and the warmest site CS6.
4.4 N-deposition treatment
We hypothesized a generally positive effect of N deposition on plant growth, but we found no significant overall effect of N deposition on yield after 4 years and only a marginal effect in 1 year. Historically, the responsiveness of (sub)alpine vegetation to improved nutrient supply was considered to be restricted due to an overriding effect of thermal energy limitation. Yet, studies with very high rates of N application (40–100 kg N ha−1 a−1; Körner et al., 1997; Heer and Körner, 2002) showed substantial yield responses, also at alpine sites. Low-N-dose responses of total plant yield may require N accumulation over years or a compound interest effect in plant biomass. For example, only in the seventh treatment year was a strong +31 % total yield growth response to 5 kg N ha−1 a−1 reported by Volk et al. (2014) from subalpine grassland.
Low-dose experiments (5–30 kg N ha−1 a−1), however, can induce a species composition change (Bowman et al., 2006, 2012), indicating a growth benefit for some species at the expense of others. Yet, such single-species responses may be only transient: a strong Carex species response to as little as 5 kg N ha−1 a−1 in similar subalpine vegetation was recently found to cease after 5 years (Bassin et al., 2007, 2009, 2013). Taken together, we conclude that either the cold-adapted, mature and low-productivity grassland responds with a >4-year time lag or that the N-deposition treatment was below the critical load for aboveground biomass responses.
4.5 Transplantation
The turf monoliths at CS2reference were only slightly warmer and moister compared to the sites of origin, suggesting a low transplantation impact (we have found no transplantation effect data from other experiments to compare with). However, within the experimental site similar temperature increases between CS2reference and CS3 caused a much larger productivity increase (+43 %). We reason that this incongruence can be explained by the difference in melt-out time, which was on average only 3 d earlier at CS2reference (Julian day 118) than at the sites of origin but 21 d earlier at CS3 than at CS2reference. We thus assume that the substantially earlier start of the growing season caused the stronger growth response, despite a similar temperature change. This effect, induced by the transplantation of the grassland monoliths along the altitudinal gradient, demonstrates the importance of integrating multiple drivers in climate change experiments to allow for a multi-factor-driven plant response.
In our study, the effect of altitude on photosynthesis substrate limitation was considered negligible, compared to the climate effects. The assimilation conditions of alpine plants have been the subject of investigation for decades. Since the theoretical considerations of Gale (1972) and the field studies by Körner and Diemer (1987) and Körner et al. (1988), a predominant “altitude-tolerance” of photosynthesis has been widely accepted. Relevant environmental parameters that change with altitude (temperature, CO2 and O2 partial pressure, vapor-pressure deficit, and photosynthetic photon flux density) have antagonistic effects on assimilation efficiency (see Wang et al., 2016, for a recent discussion on the topic).
Despite dwindling soil water content, the subalpine grassland growth increased to up to +1.8 ∘C warming during the growing period (corresponding to +1.3 ∘C annual mean), compared to present temperatures. Even at the maximum warming (corresponding to +2.4 ∘C annual mean) the yield was larger than at the reference site. At the same time −1.4 ∘C cooling during the growing period (corresponding to −1.7 ∘C annual mean) did not reduce plant growth. These results suggest that the productivity of the subalpine grasslands in our study has likely not yet increased during the past century warming. But the positive response to warming treatments suggests that despite growing soil moisture deficits, productivity will increase with continued warming in the near future.
Table A1Schematic layout of monolith arrangement at each CS of the AlpGrass experimental site. At each CS, six monoliths from each of six sites of origin were transplanted, resulting in 36 monoliths. Two irrigation and three N-deposition treatments were set up in a factorial design, resulting in six irrigation × N treatment combinations, which were assigned to each of the six monoliths per site of origin. The six irrigation × N treatment combinations were arranged in a randomized complete block design of six blocks. Regarding sites of origin, the monoliths were assigned to the six blocks in a restricted randomization, so that an equal distribution of sites of origin to all blocks was ensured. It follows that the six monoliths from each site of origin received all irrigation × N treatment combinations and were evenly distributed on the site. Displayed is a possible randomization of irrigation and N treatments per block; at each CS separate randomizations were performed.
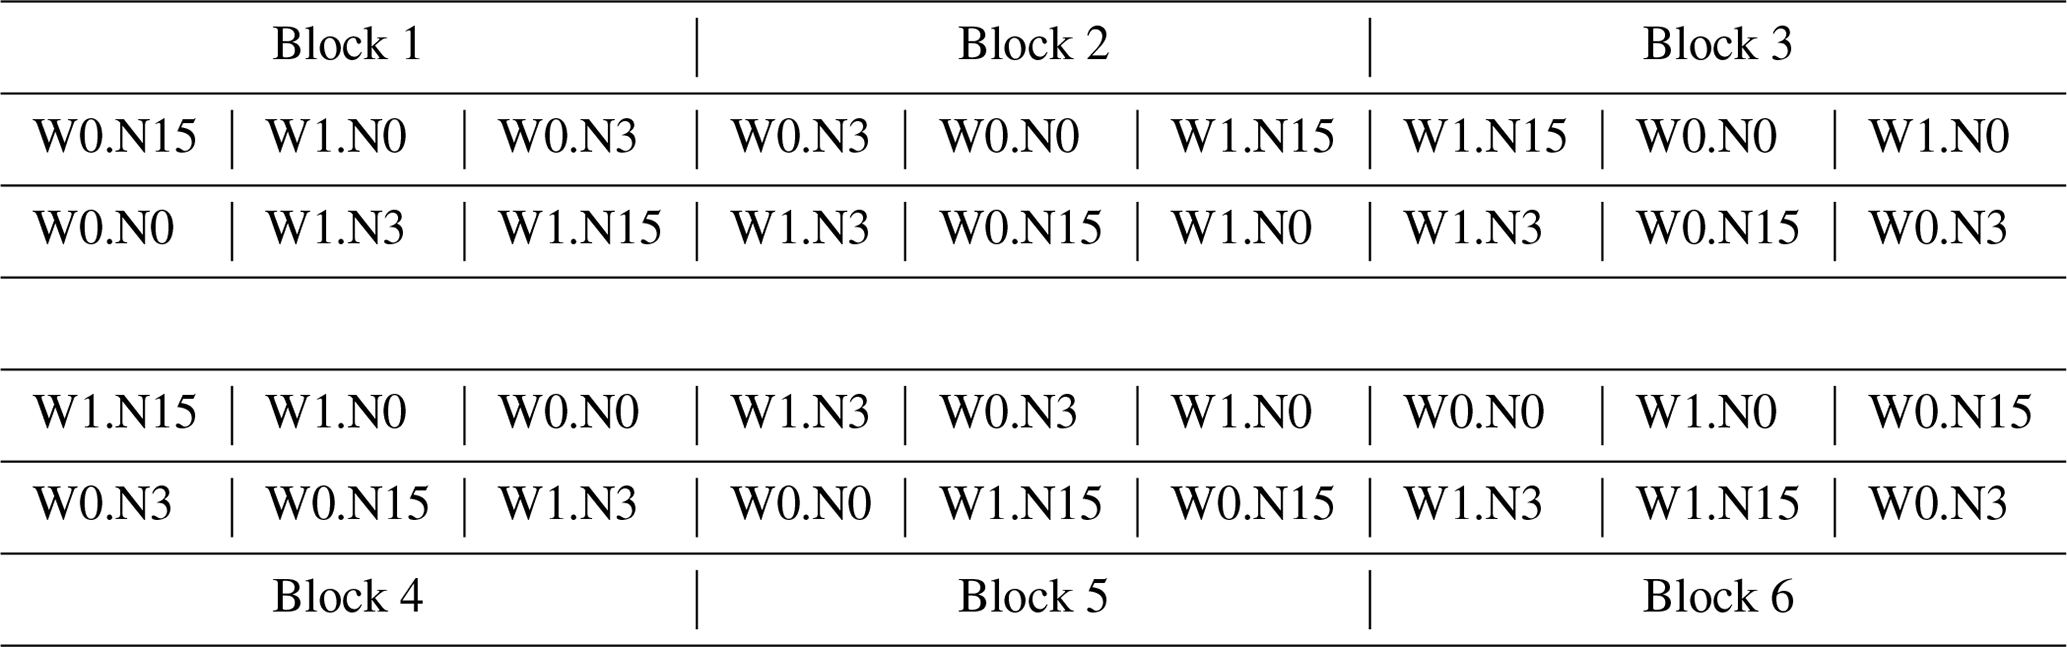
W0: no additional water (ambient precipitation only). W1: additional water during growing period. N0: no N fertilizer. N3: 3 kg N ha−1 a−1. N15: 15 kg N ha−1 a−1.
Table A2Summary of analyses for the effects of climate scenario (CS), irrigation, and N deposition on aboveground biomass yield of subalpine grassland over 4 experimental years. F tests refer to the fixed effects of a linear mixed-effects model that included all 4 years for a repeated measures analysis. The marginal and conditional R2 values were 0.68 and 0.80, respectively.
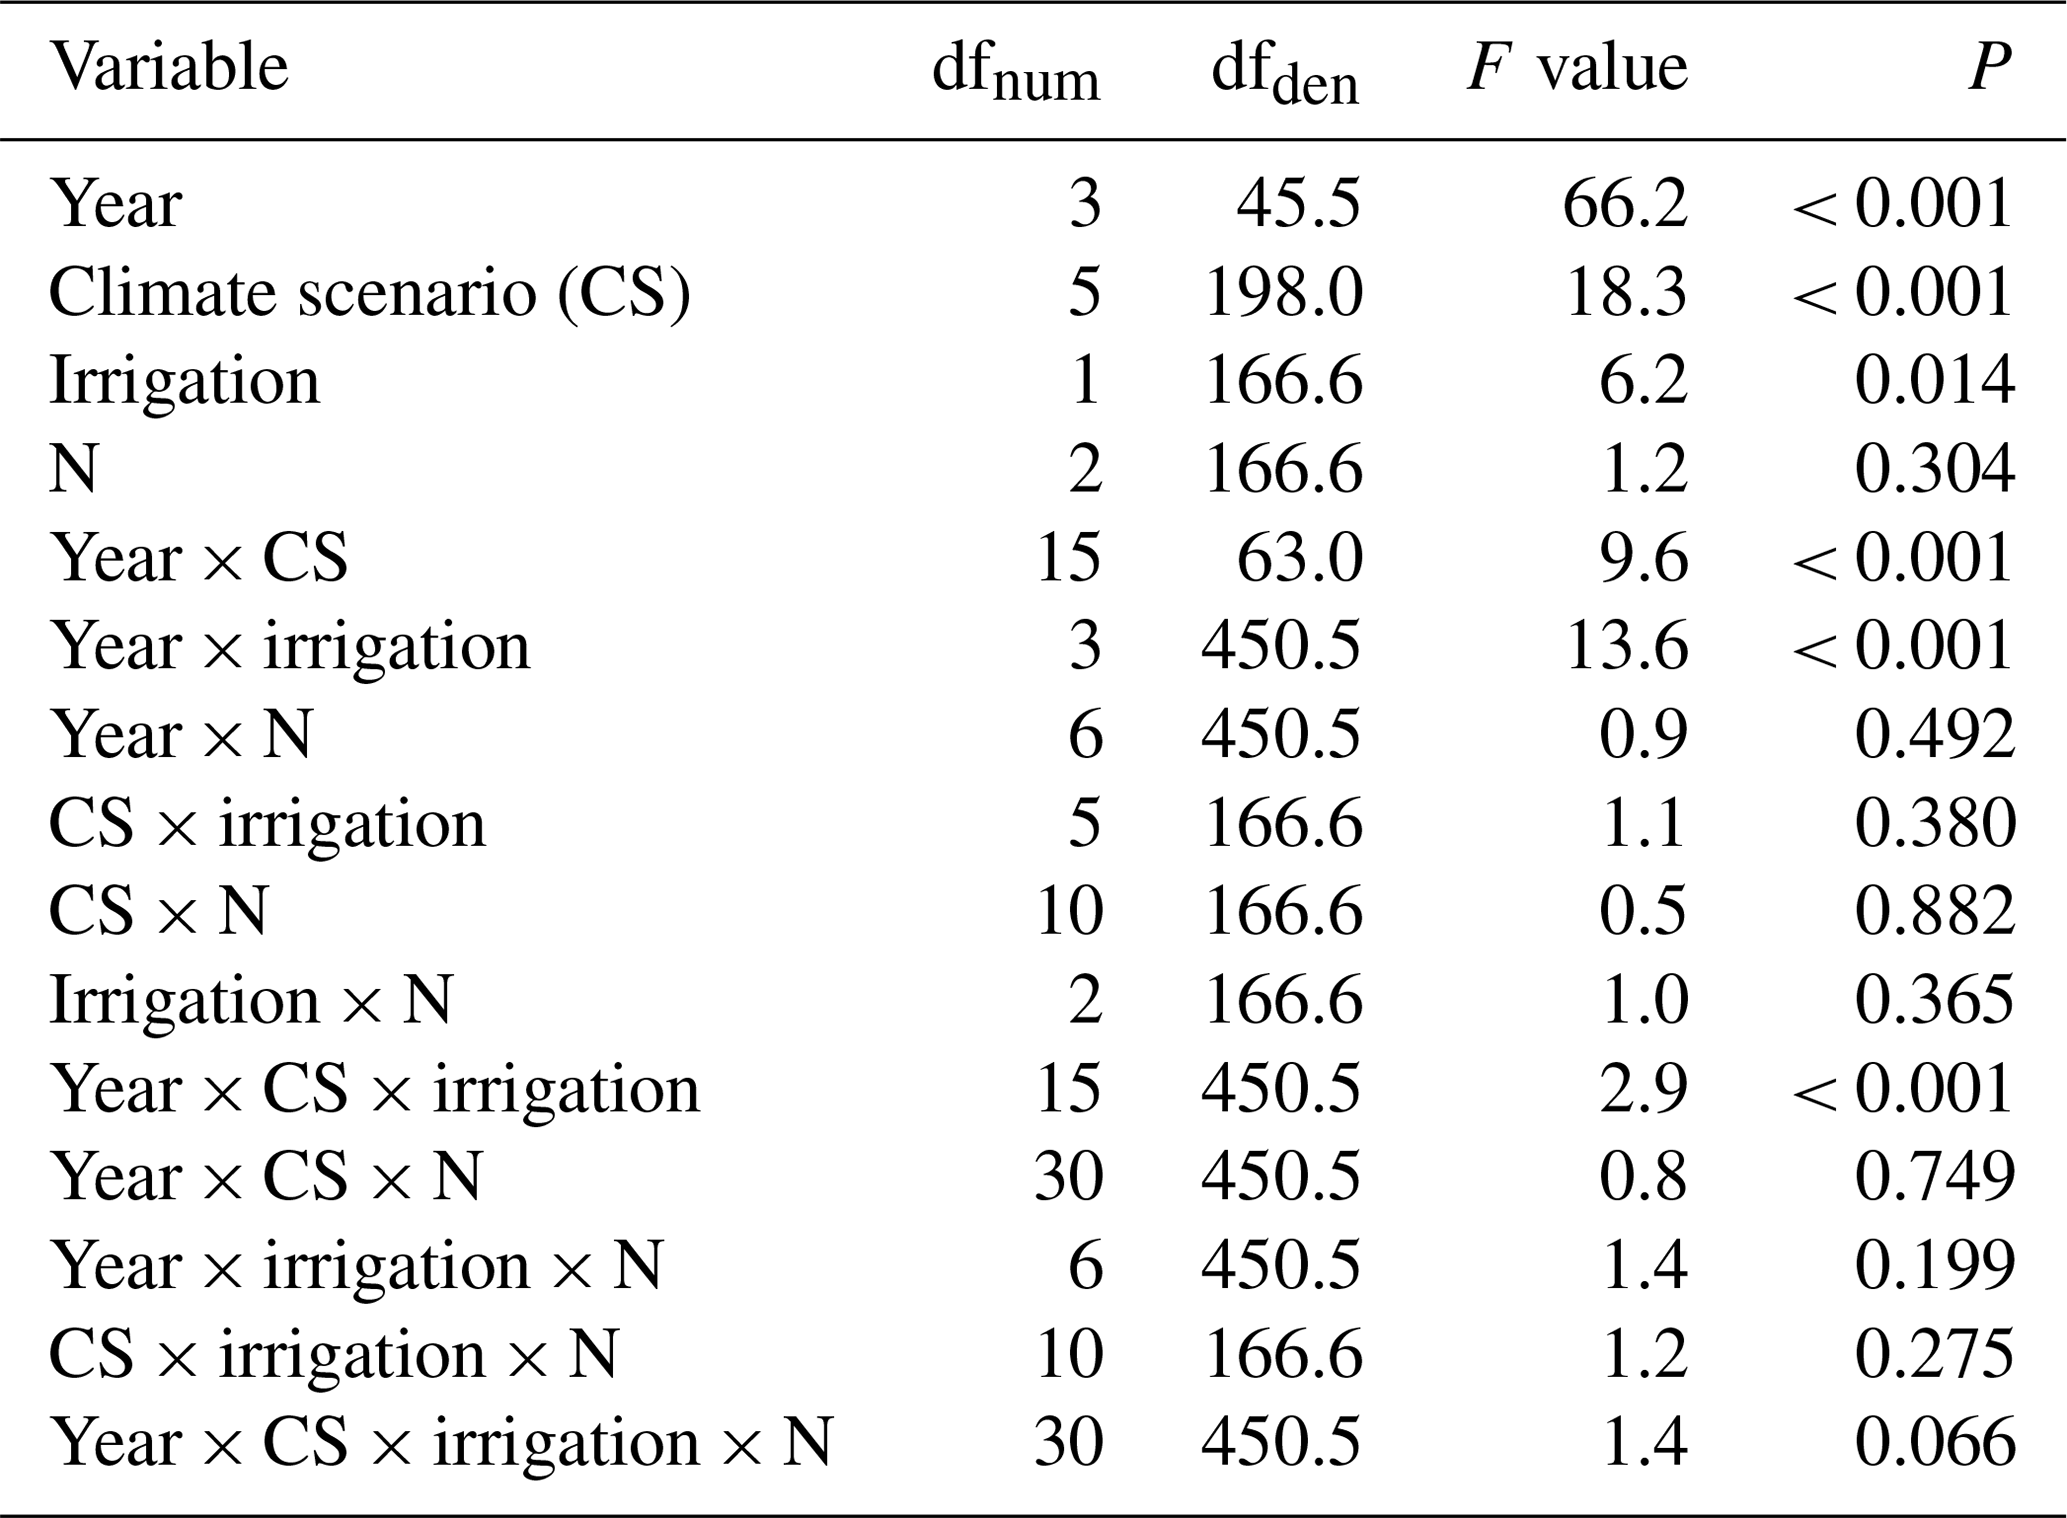
dfnum: degrees of freedom of term; dfden: degrees of freedom of error (which can be fractional in restricted maximum likelihood analysis).
Table A3Summary of analyses for the effects of climate scenario (CS), irrigation, and N deposition on aboveground biomass yield of subalpine grassland at each of 4 experimental years (2014–2017). F tests refer to the fixed effects of a linear mixed-effects model for each of the 4 years.
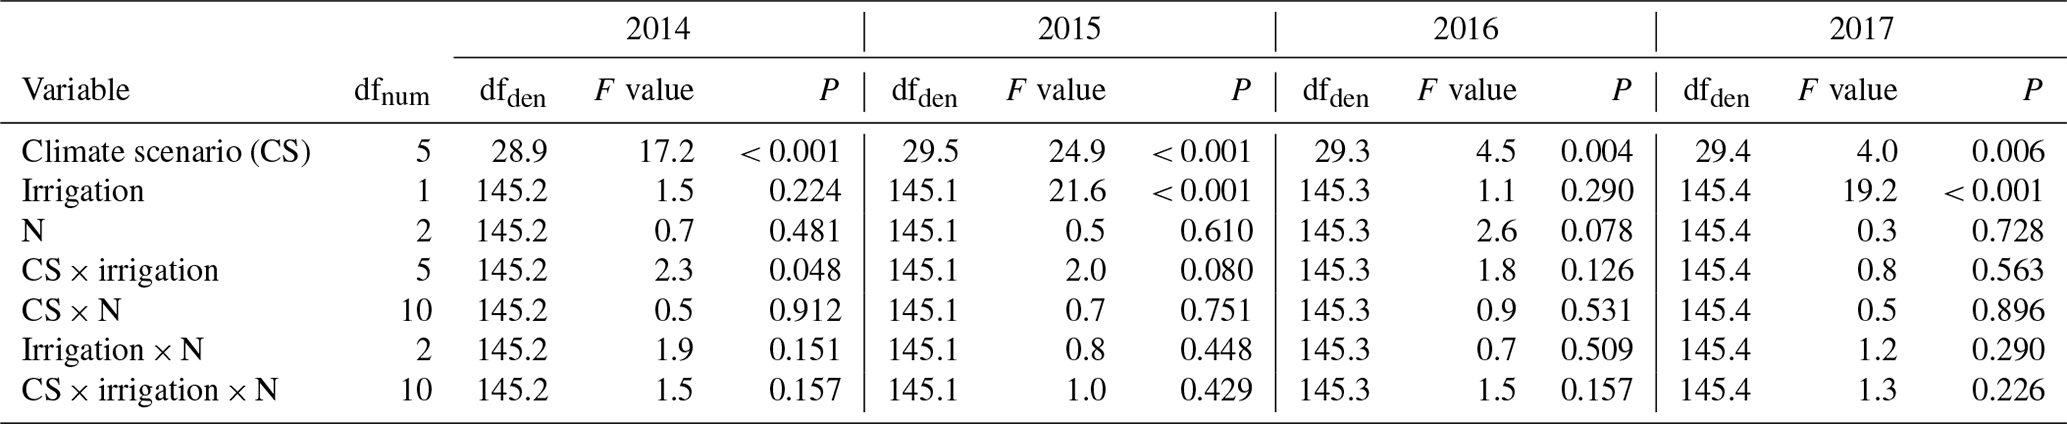
dfnum: degrees of freedom of term; dfden: degrees of freedom of error (which can be fractional in restricted maximum likelihood analysis).
Table A4Summary of analyses for the effects of total received thermal energy (DD0 ∘Ctotal) on aboveground biomass yield of subalpine grassland under two irrigation treatments. Data were averaged across the 4 experimental years (total n=216). F values and approximate P values refer to a generalized additive model that used a smooth term for each irrigation treatment.
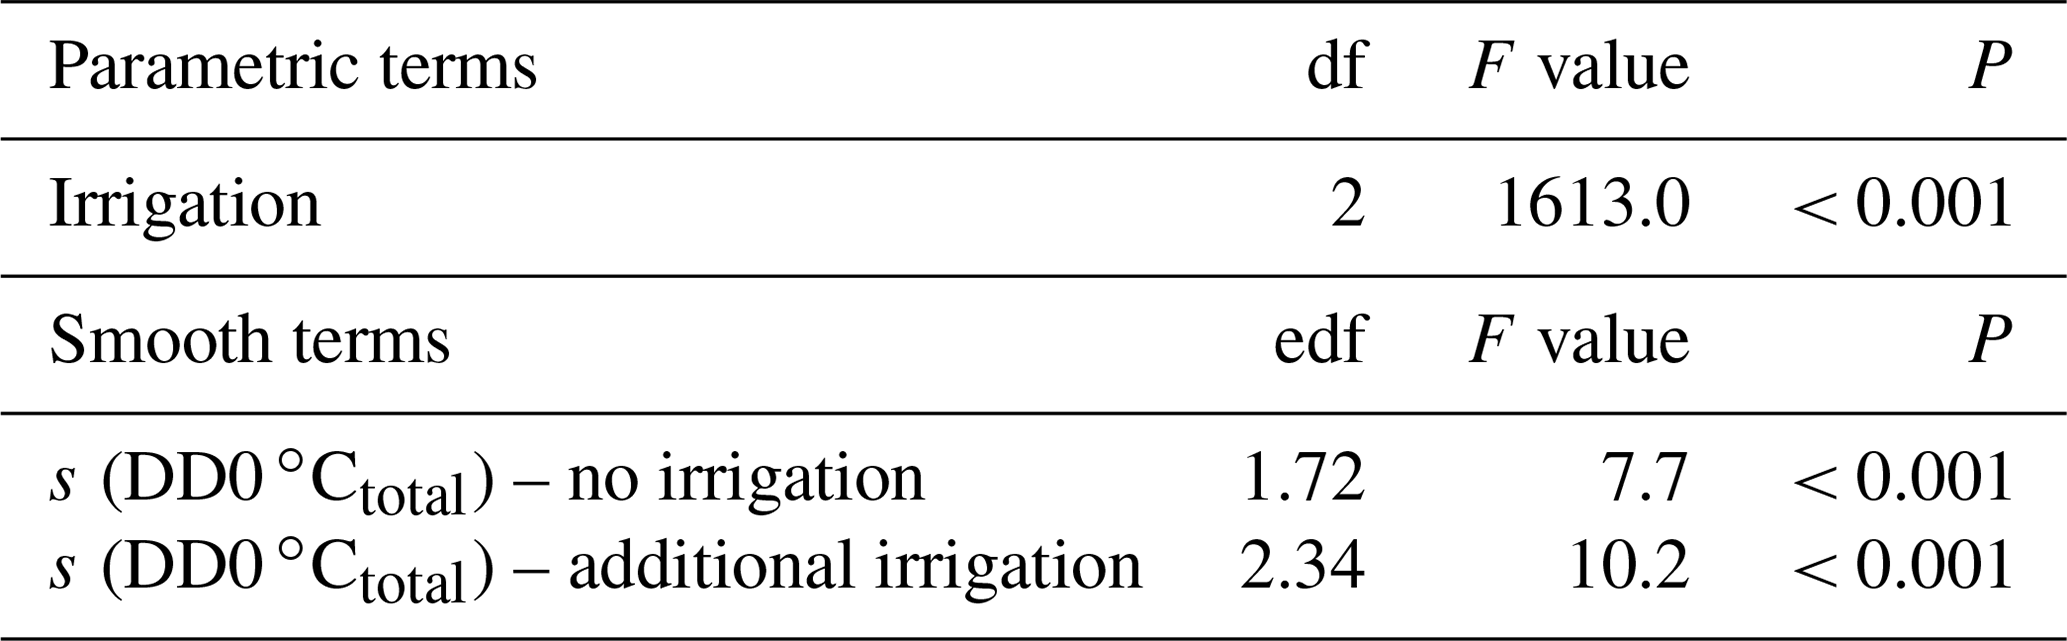
df: degrees of freedom; edf: effective degrees of freedom (which can be fractional in smooth terms of generalized additive models). s: smoothing function applied to term.
Table A5Summary of analyses for the effects of percent days with soil moisture < 40% during the growing season (dry days %) on aboveground biomass yield of subalpine grassland under two irrigation treatments. Data were averaged across the 4 experimental years (total n=216). F values and approximate P values refer to a generalized additive model that used a smooth term for each irrigation treatment.
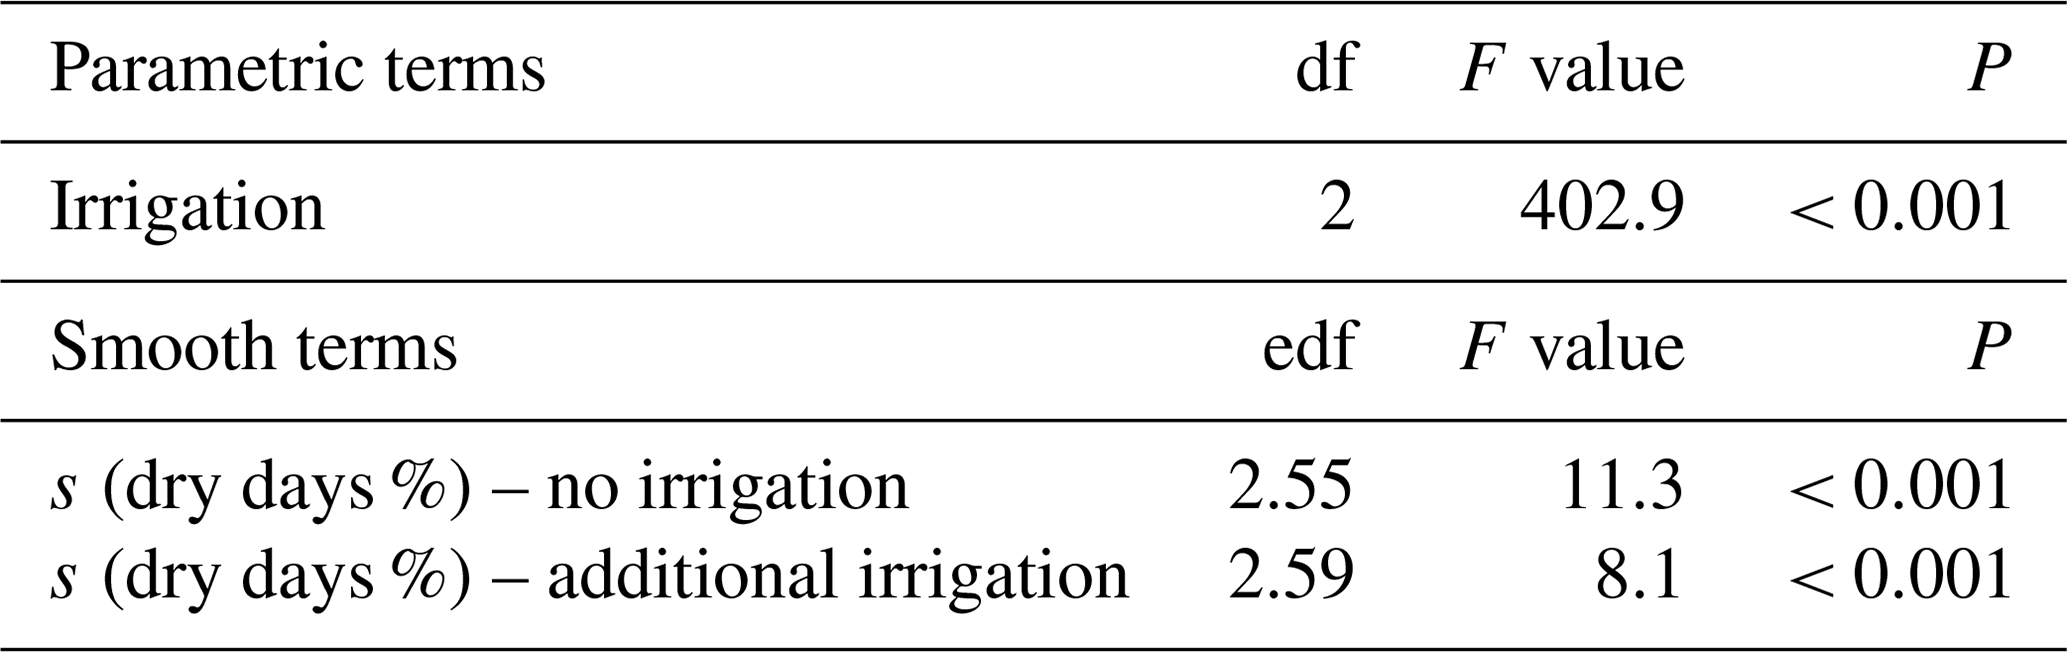
df: degrees of freedom; edf: effective degrees of freedom (which can be fractional in smooth terms of generalized additive models). s: smoothing function applied to term.
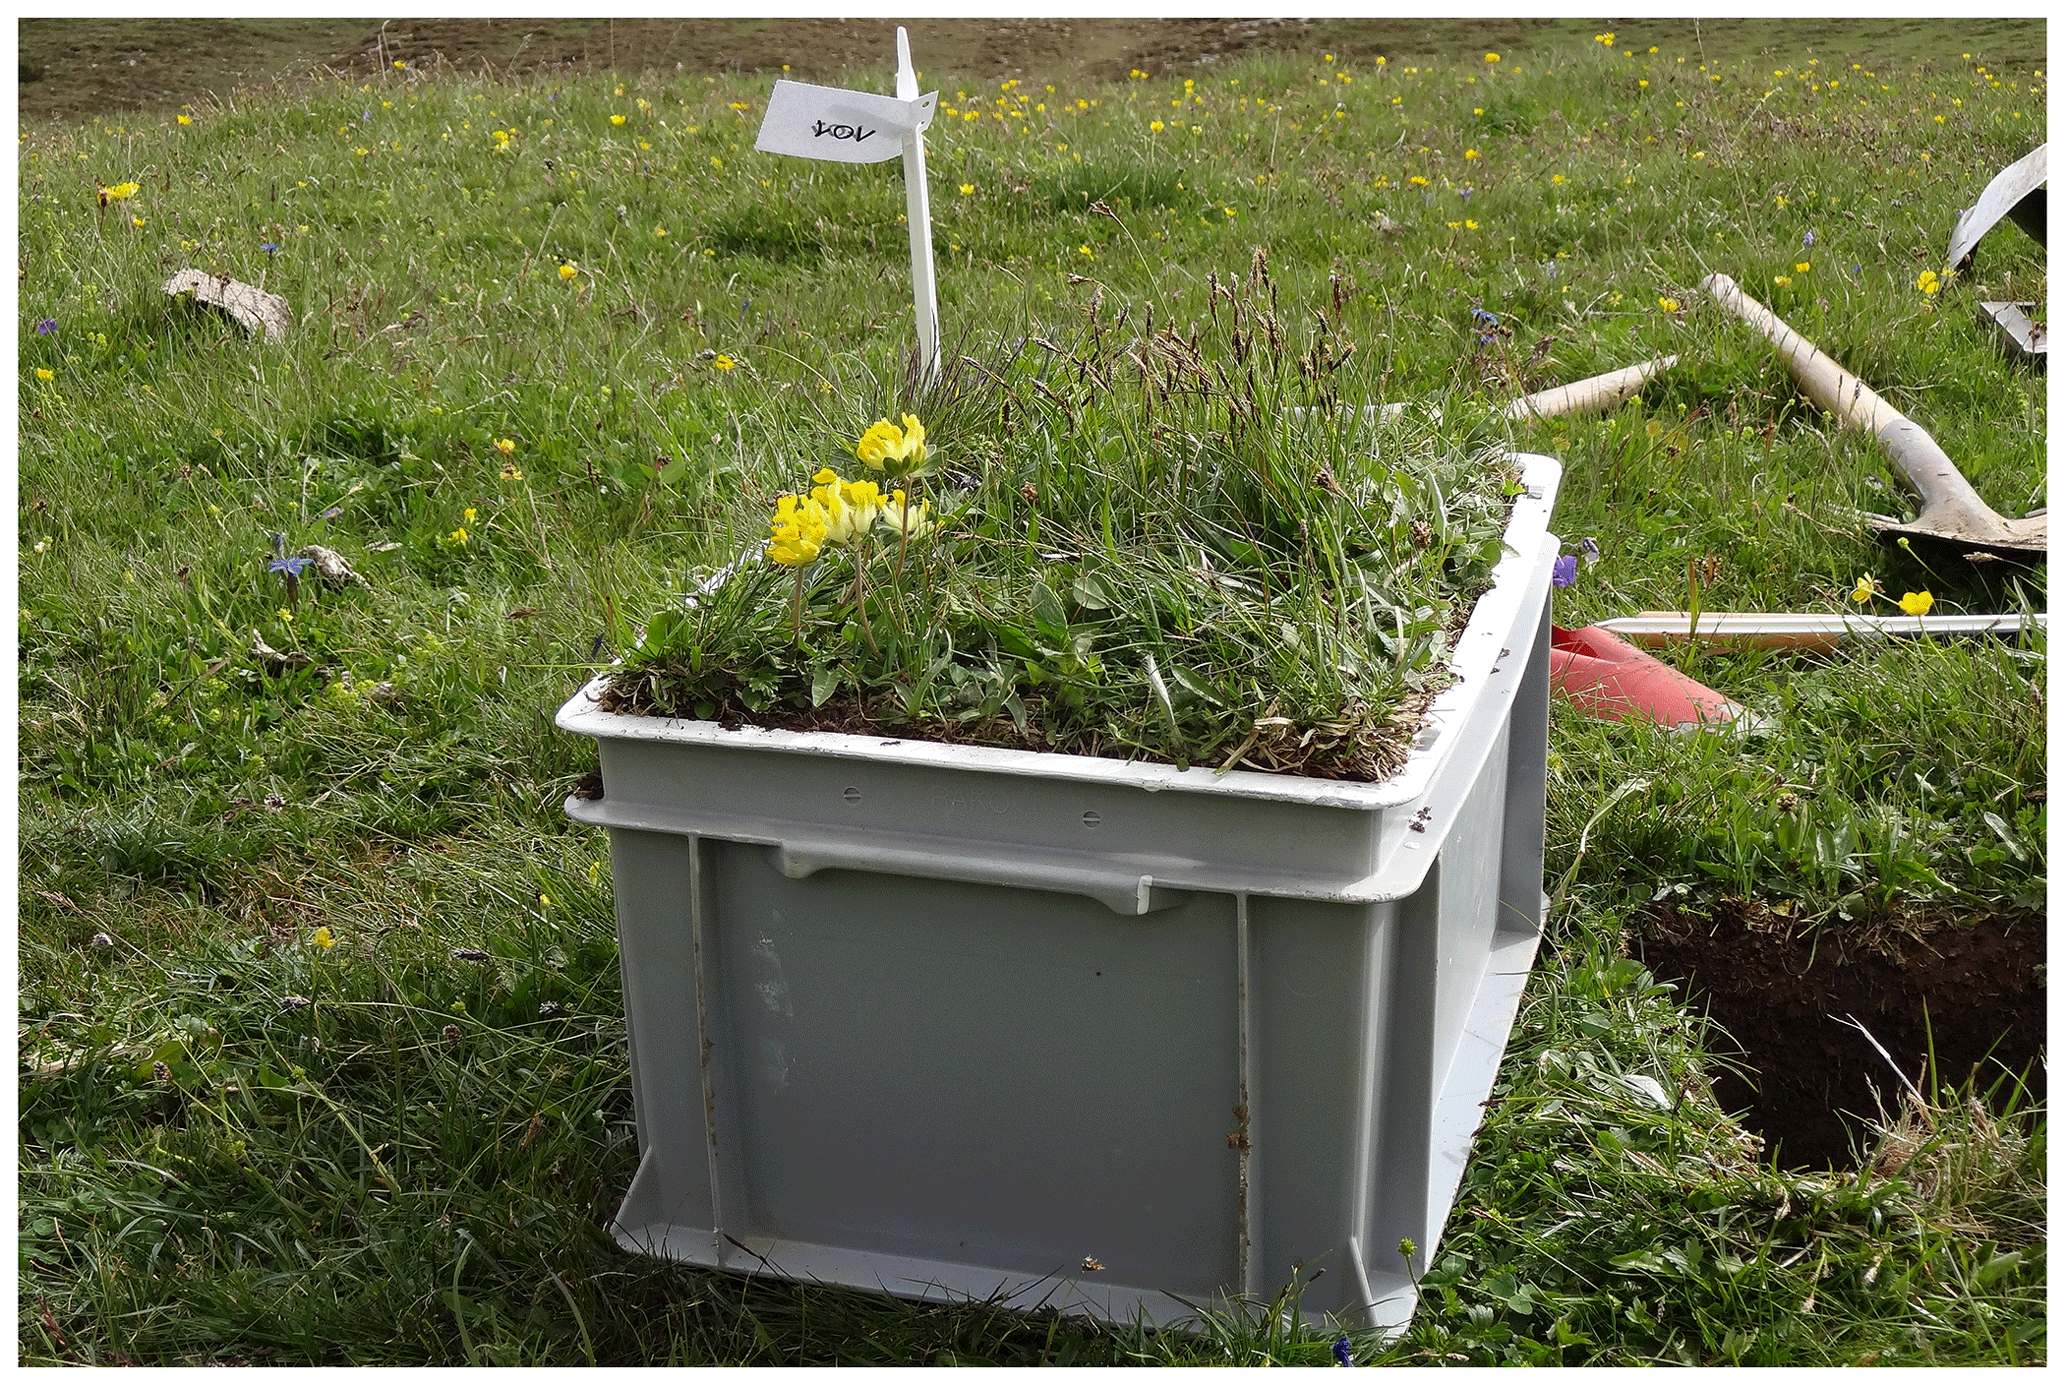
Figure A1Monolith produced at site of origin “Alp Nova” (46.72786∘ N, 9.72609∘ E) in June 2012. After monoliths were excavated in the close surroundings, they were fitted tightly into plastic containers. A total of 216 monoliths were produced at six such sites of origin, for later use at the altitudinal transplantation site of the AlpGrass experiment.
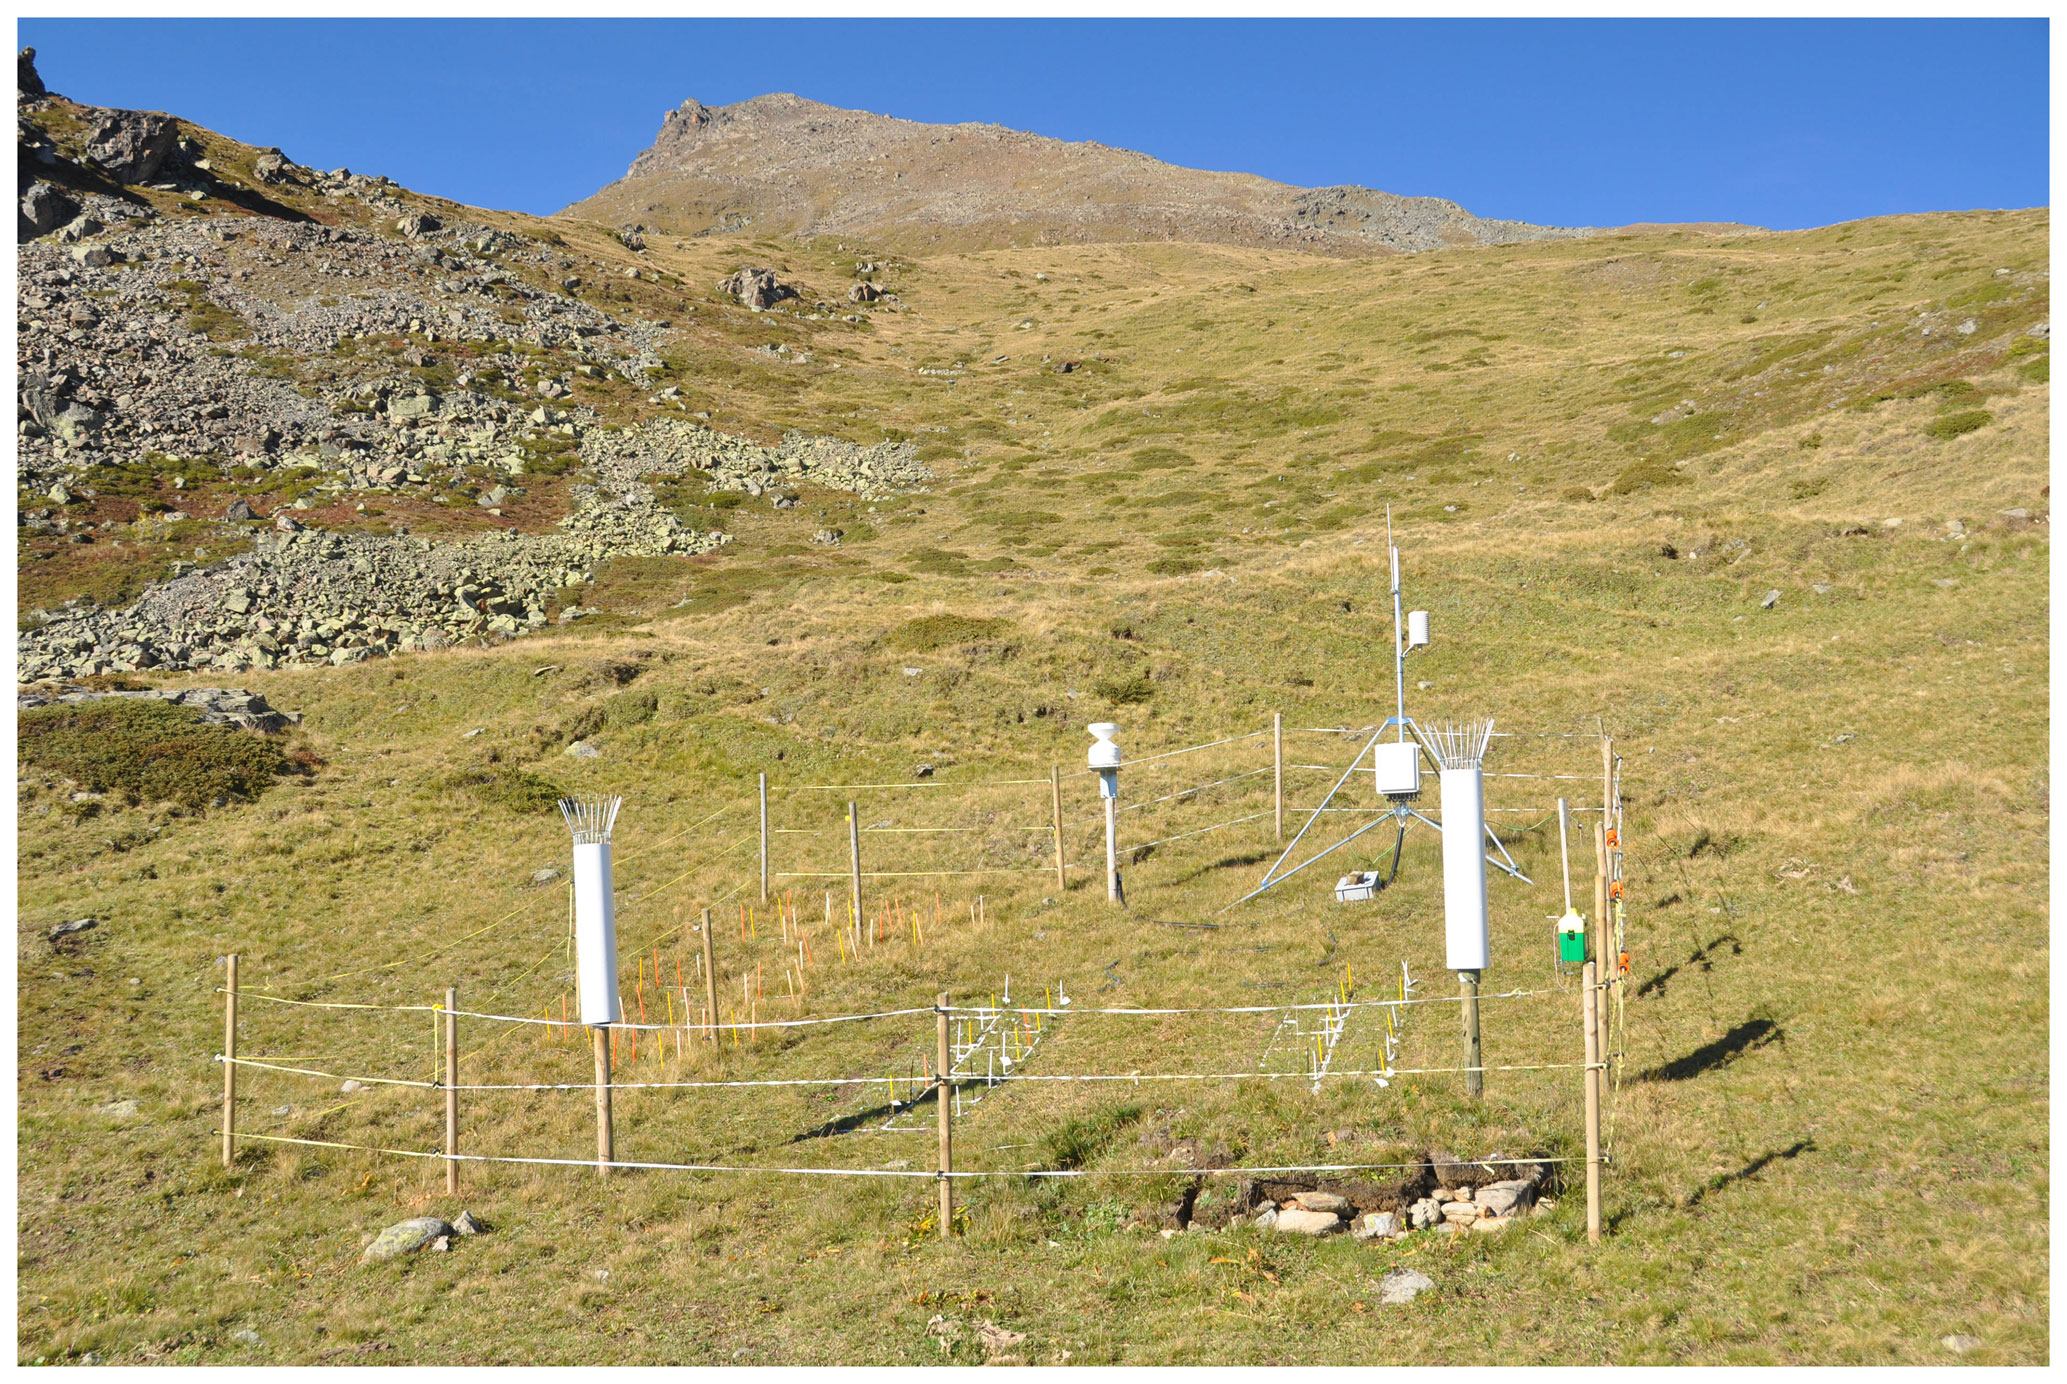
Figure A2Topmost climate scenario site CS1 (2360 m, 46.79859∘ N, 10.17840∘ E). Monoliths are in the right part of the fenced area. Monolith arrangement in two double rows of nine allows easy access and equal distribution of edge effects.
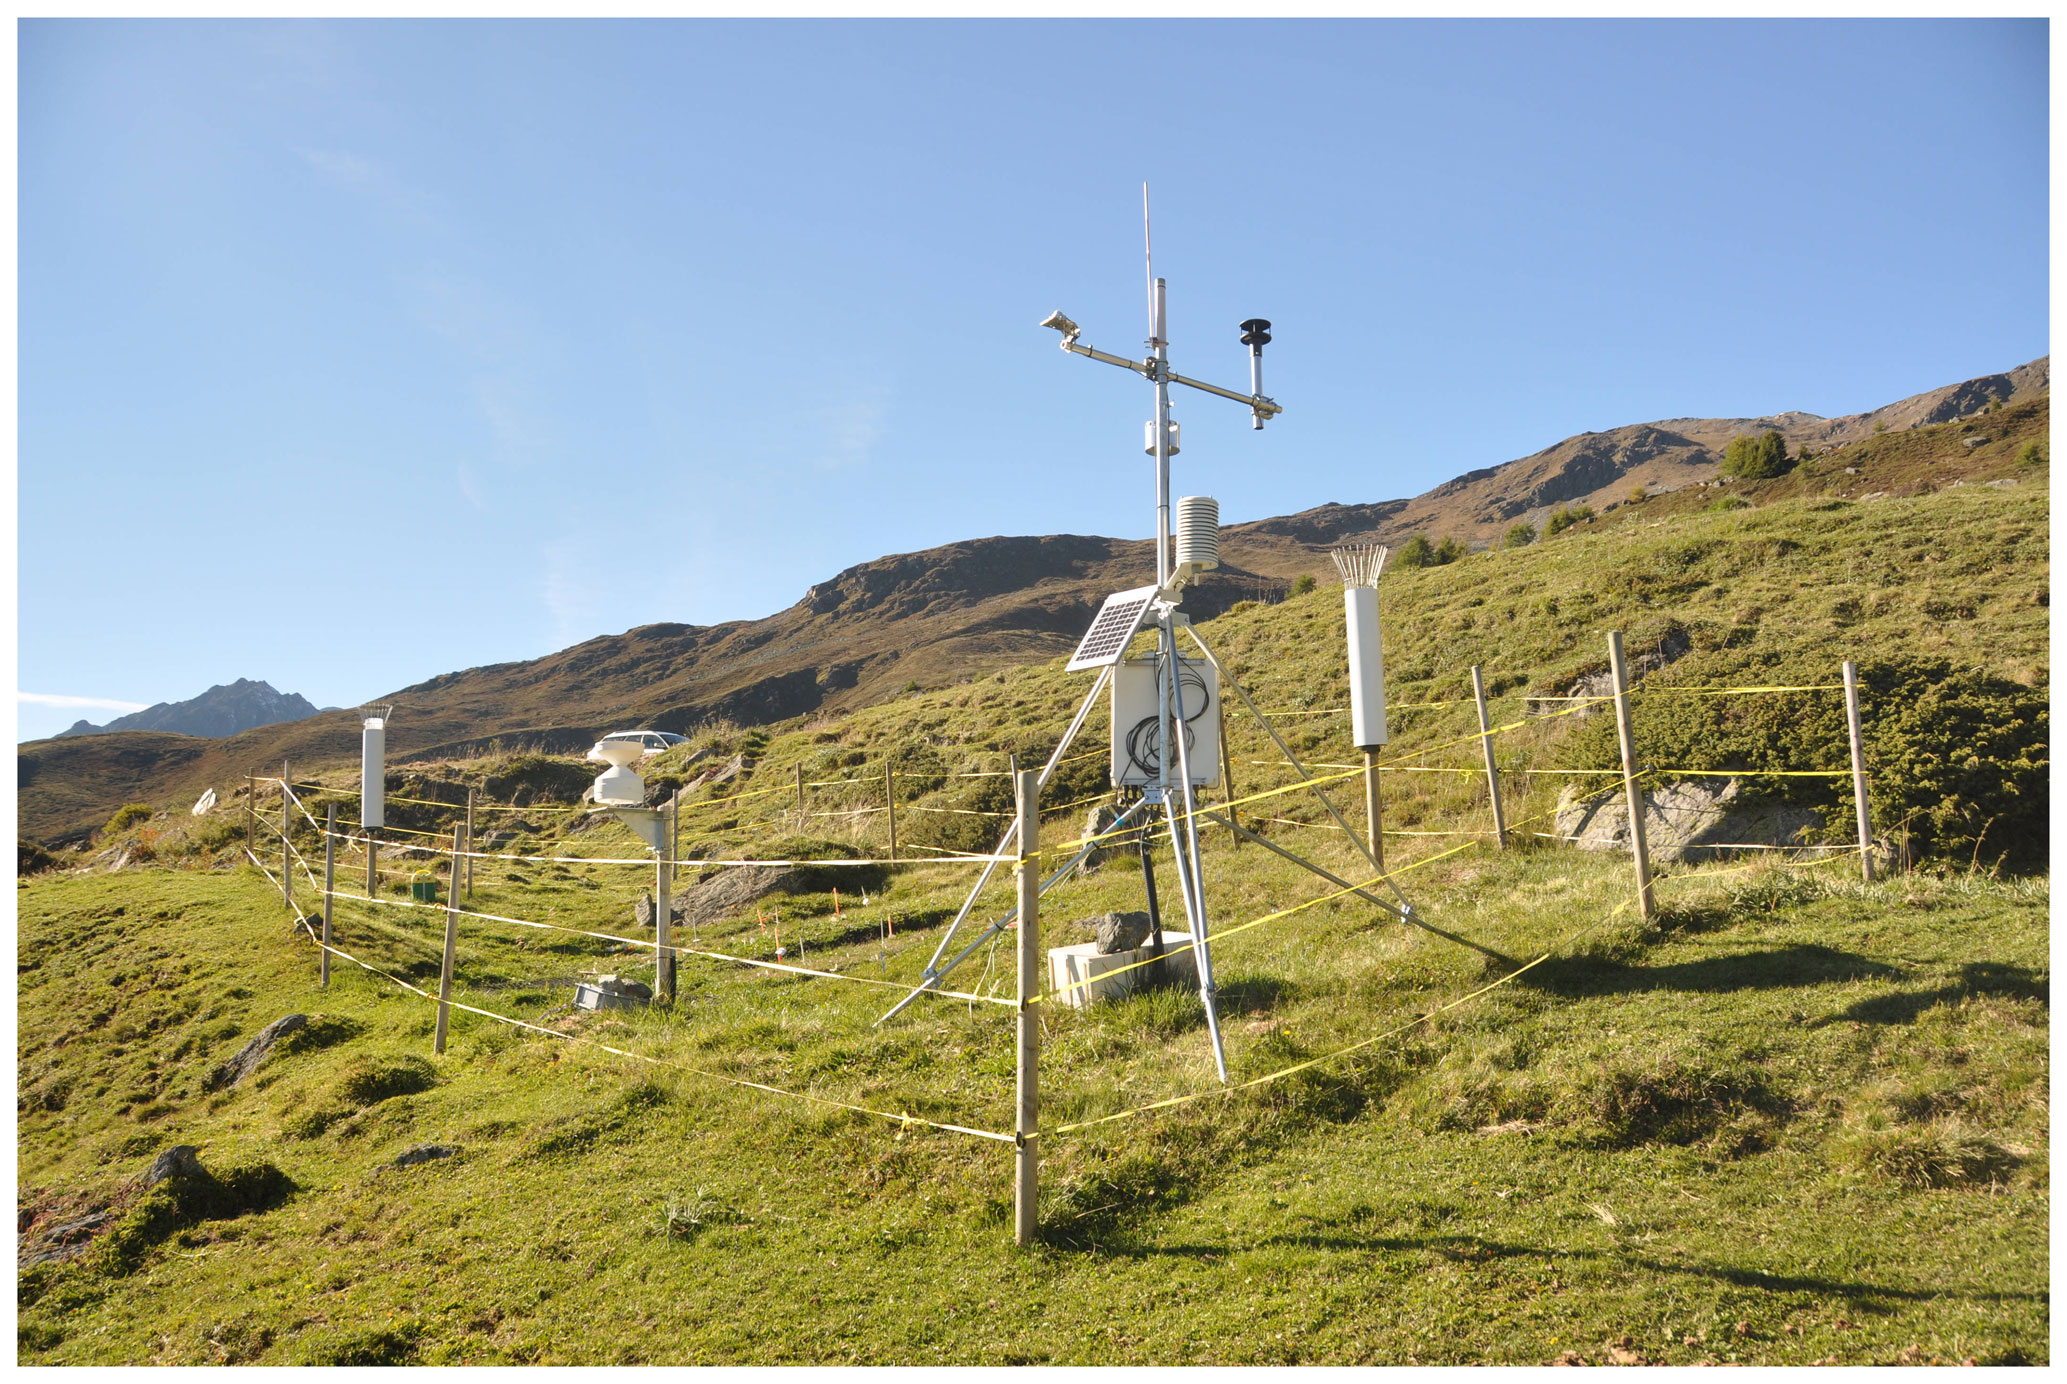
Figure A3Control climate scenario site CS2reference (2170 m, 46.79264∘ N, 10.17714∘ E). Along the altitudinal transplantation gradient this CS is representative of the sites of origin, because they share the same altitude.
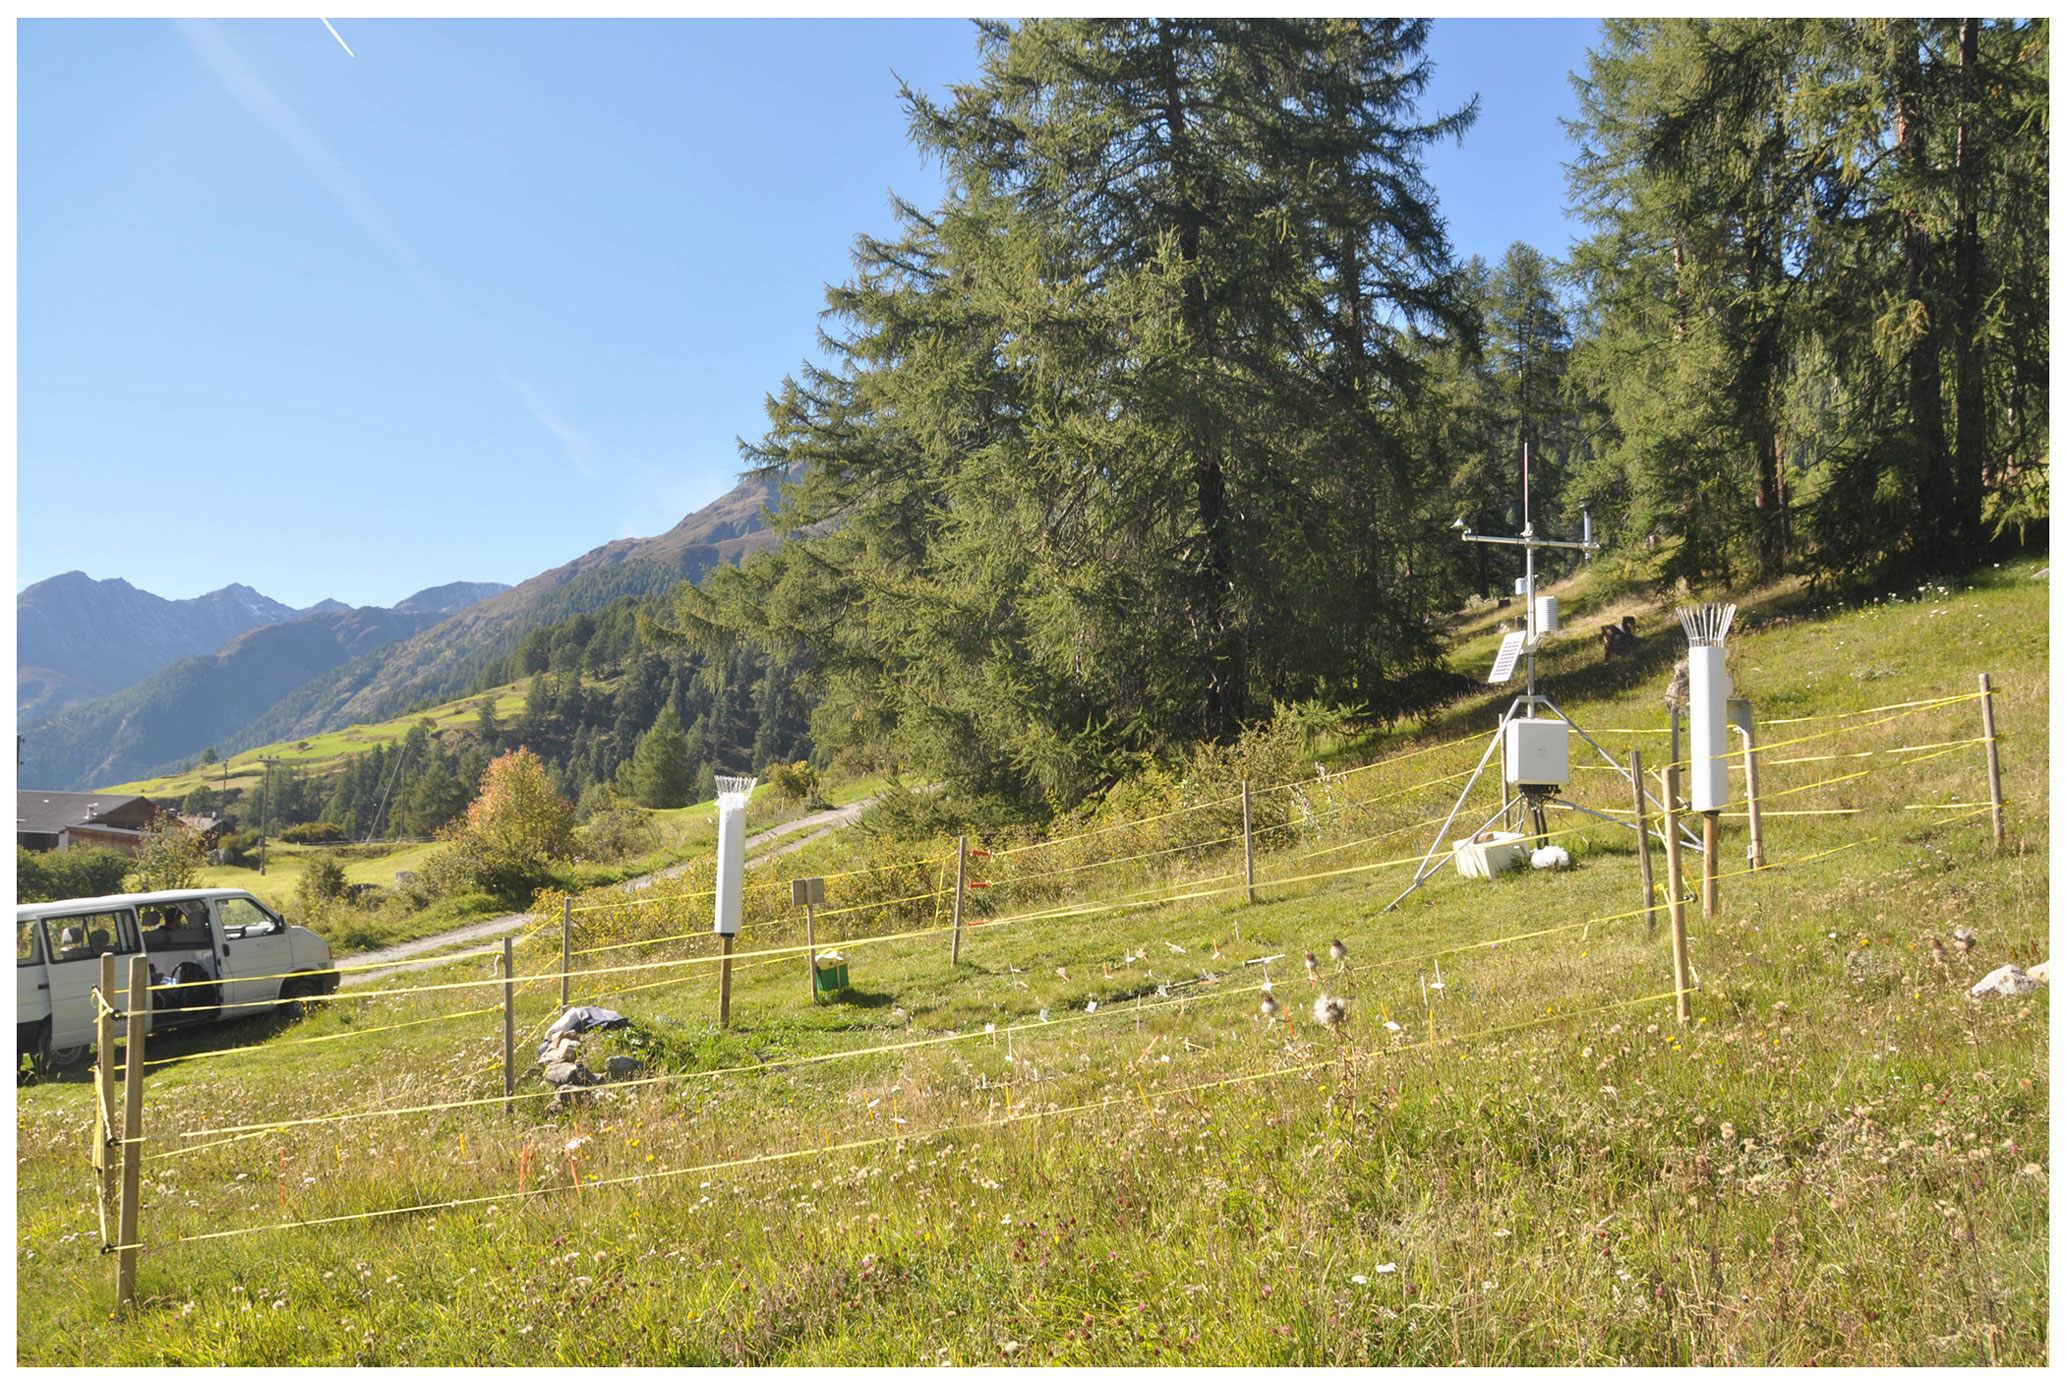
Figure A4Lowest climate scenario site CS6 (1680 m, 46.77818∘ N, 10.17143∘ E). Due to its low altitude this CS is the warmest and driest site along the altitudinal transplantation gradient.
##############################
#Linear mixed-effects model to analyze effects of the
#climate scenario treatment (CS), irrigation and
#N deposition (N_Treat) on aboveground biomass yield.

#Packages to load
library(lme4)
library(lmerTest)

##############################
#Reading in the data
d.data <- read.table("C:/Volk_etal_2021_AlpGrass.csv", header=TRUE, sep= ";")

##############################
#Define factors
d.data$CS <- as.factor(d.data$CS)
d.data$Irrigation <- as.factor(d.data$Irrigation)
d.data$N_Treat <- as.factor(d.data$N_Treat)
d.data$Origin <- as.factor(d.data$Origin)
d.data$Block <- as.factor(d.data$Block)

##############################
#Full model, including all interactions, as described
#in the first paragraph of the ‘Data analyses’ section

Model.A <- lmer(DM ~ CS + Irrigation + N_Treat + CS:Irrigation + CS:N_Treat
+ Irrigation:N_Treat + CS:Irrigation:N_Treat + (1 | Origin) + (1 | Block),
REML=TRUE, data=d.data)

##############################
#The model summary, given in Table 3, is received by

anova(Model.A, ddf="Kenward-Roger", type=1)

##############################
#Contrasts to test for differences in biomass yield
#between single CSs and the CSreference (across irrigation
#and the N treatments)

summary(update(Model.A, contrasts=list(CS=contr.treatment(levels(d.data$CS),base=2),
 Irrigation="contr.sum", N_Treat="contr.sum")), ddf="Kenward-Roger")

##############################
#This very same model and contrast code was applied
#to data of each individual year.
############################## #Generalized additive models to test for the effects of #thermal energy (DD0Ctot) and percent days with less #soil moisture (PercDryDays) on aboveground biomass yield. #Please note that the defaults from the mgcv package #were used, with one exception. The ‘gamma’ statement #of the gam() function has been increased slightly #to increase the degree of smoothing (to result in a #smoother fitted line). This, however, did not (or only #marginally) influence the inference drawn from the #model, i.e., P values for smooth terms reported in #the main text and Tables A4 and A5 were highly #significant in either case. #Package to load library(mgcv) ############################## #GAM for the effect of thermal energy on yield Model.B <- gam(DM ~ -1 + Irrigation + s(DD0Ctot, by=Irrigation), gamma=3.6, knots=list(DD0Ctot=rep(seq(from=min(d.data$DD0Ctot)+100, to=max(d.data$DD0Ctot)-100, length.out=12), each=18)), method="REML", data=d.data) ############################## #The model summary, given in Table A4, is received by anova(Model.B) ############################## #GAM for the effect of percent dry days on yield Model.C <- gam(DM ~ -1 + Irrigation + s(PercDryDays, by=Irrigation), gamma=1.7, knots=list(PercDryDays=rep(seq(from=min(d.data$PercDryDays)+5, to=max(d.data$PercDryDays)-5, length.out=12), each=18)), method="REML", data=d.data) ############################## #The model summary, given in Table A5, is received by anova(Model.C) ############################## #Note: The fitted lines in Figure 2a) & b) are based on the #predicted values from Model.B and Model.C, respectively.
The data analyzed for the current study are available at the CERN Zenodo data repository https://doi.org/10.5281/zenodo.4555374 (Volk et al., 2021).
MV and SB designed the experiment. MV, ALW, and SB conducted fieldwork. MV and MS analyzed the data. MV led the writing of the manuscript, with a significant contribution from MS. All authors contributed critically to the drafts and gave final approval for publication.
The authors declare that they have no conflict of interest.
The Federal Office for Meteorology (MeteoSwiss) is kindly acknowledged for providing access to meteorological data. We thank Pierluigi Calanca for handling these data. The Gemeinde Ardez and Alpmeister Claudio Franziscus generously allowed us to work on the Allmend. N-concentration analyses are courtesy of Forschungsstelle für Umweltbeobachtung (FUB-AG, Rapperswil, Switzerland). We are grateful to Robin Giger for his untiring support in the field and the lab and to the scientific site manager Andreas Gauer, who was in charge of the field sites.
This research has been supported by the Federal Office for the Environment (grant no. 00.5100.PZ/R442-1499).
This paper was edited by Sönke Zaehle and reviewed by two anonymous referees.
Bassin, S., Volk, M., Suter, M., Buchmann, N., and Fuhrer, J.: Nitrogen deposition but not ozone affects productivity and community composition of subalpine grassland after 3 yr of treatment, New Phytol., 175, 3, 523–534, 2007.
Bassin, S., Werner, R. A., Sörgel, K., Volk, M., Buchmann, N., and Fuhrer, J.: Effects of combined ozone and nitrogen deposition on the in situ properties of eleven key plant species of a subalpine pasture, Oecologia 158, 747–756, 2009.
Bassin, S., Volk, M., and Fuhrer, J.: Species composition of subalpine grassland is sensitive to nitrogen deposition, but not to ozone, after seven years of treatment, Ecosystems, 16, 1105–1117, 2013.
Bates, D., Maechler, M., Bolker, B., and Walker, S.: lme4: Linear mixed-effects models using Eigen and S4, Version 1.1-10, available at: https://CRAN.R-project.org/package=lme4, 2015.
Bobbink, R., Hicks, K., Galloway, J., Spranger, T., Alkemade, R., Ashmore, M., Bustamante, M., Cinderby, S., Davidson, E., Dentener, F., Emmett, B., Erisman, J. W., Fenn, M., Gilliam, F., Nordin, A., Pardo, L., and De Vries, W.: Global assessment of nitrogen deposition effects on terrestrial plant diversity: a synthesis, Ecol. Appl., 20, 30–59, 2010.
Bowman, W. D., Gartner, J. R., Holland, K., and Wiedermann, M.: Nitrogen Critical Loads For Alpine Vegetation And Terrestrial Ecosystem Response: Are We There Yet?, Ecol. Appl. 16, 1183–1193, 2006.
Bowman, W. D., Murgel, J., Blett, T., and Porter, E.: Nitrogen critical loads for alpine vegetation and soils in Rocky Mountain National Park, J. Environ. Manage. 103, 165–171, 2012.
Core Writing Team: IPCC, 2014: Climate change 2014: Synthesis Report, Contribution of Working Groups I, II and III to the Fifth Assessment Report of the Intergovernmental Panel on Climate Change, edited by: Pachauri, R. K. and Meyer, L. A., IPCC, Geneva, Switzerland. 151 pp., 2014.
Dieleman, W. I., Vicca, S., Dijkstra, F. A., Hagedorn, F., Hovenden, M. J., Larsen, K. S., Morgan, J. A., Volder, A., Beier, C., Dukes, J. S., King, J., Leuzinger, S., Linder, S., Luo, Y., Oren, R., De Angelis, P., Tingey, D., Hoosbeek, M. R., and Janssens, I. A.: Simple additive effects are rare: a quantitative review of plant biomass and soil process responses to combined manipulations of CO2 and temperature, Global Change Biol., 18, 2681–2693, 2012.
Dukes, J. S., Chiariello, N. R., Cleland, E. E., Moore, L. A., Shaw, M. R., Thayer, S., Tobeck, T., Mooney, H. A., and Field, C. B.: Responses of grassland production to single and multiple global environmental changes. Plos Biol. 3, 1829–1837, 2005.
Heer, C. and Körner, C.: High elevation pioneer plants are sensitive to mineral nutrient addition, Basic Appl. Ecol., 3, 39–47, 2002.
Gale, J.: Availability of carbon dioxide for photosynthesis at high altitudes: theoretical considerations, Ecology, 53, 494–497, 1972.
Kenward, M. G. and Roger, J. H.: Small sample inference for fixed effects from restricted maximum likelihood, Biometrics, 53, 983–997, 1997.
Körner, C.: Alpine plant life: functional plant ecology of high mountain ecosystems, Springer Science and Business Media, Berlin, Germany, 344 pp., 2003.
Körner, C. and Diemer, M.: In situ photosynthetic responses to light, temperature and carbon dioxide in herbaceous plants from low and high altitude, Funct. Ecol., 1, 179–194, 1987.
Körner, C., Diemer, M., Schäppi, B., Niklaus, P., and Arnone III J.: The responses of alpine grassland to four seasons of CO2 enrichment: a synthesis, Acta Oecol., 18, 165–175, 1997.
Körner, C., Farquhar, G. D., and Roksandic, Z.: A global survey of carbon isotope discrimination in plants from high altitude, Oecologia, 74, 623–632, 1988.
Leuzinger, S., Luo, Y., Beier, C., Dieleman, W., Vicca, S., Körner, C.: Do global change experiments overestimate impacts on terrestrial ecosystems? Trends in ecology and evolution 26, 236–241, 2011.
Liu, H., Mi, Z., Lin, L., Wang, Y., Zhang, Z., Zhang, F., Wang, H., Liu, L., Zhu, B., Cao, G., Zhao, X., Sanders, N. J., Classen, A. T., Reich, P. B., and He, J.-S.: Shifting plant species composition in response to climate change stabilizes grassland primary production, P. Natl. Acad. Sci., 115, 4051–4056, 2018.
Nakagawa, S. and Schielzeth, H.: A general and simple method for obtaining R2 from generalized linear mixed-effects models, Methods Ecol. Evol., 4, 133–142, 2013.
Phoenix, G. K., Emmett, B. A., Britton, A. J., Caporn, S. J.M., Dise, N. B., Helliwell, R., Jones, L., Leake, J. R., Leith, I. D., Sheppard, L. J., Sowerby, A., Pilkington, M. G., Rowe, E. C., Ashmore, M. R., and Power, S. A.: Impacts of atmospheric nitrogen deposition: responses of multiple plant and soil parameters across contrasting ecosystems in long-term field experiments, Global Change Biol., 18, 1197–1215, 2012.
R Core Team: A language and environment for statistical computing. R Foundation for Statistical Computing, available at: http://www.R-project.org (last access: 18 March 2020) Vienna, Austria, 2020.
Rihm, B. and Kurz, D.: Deposition and critical loads of nitrogen in Switzerland, in: Acid rain 2000, Springer, Dordrecht, 1223–1228, 2001.
Rihm, B. and Achermann, B.: Critical Loads of Nitrogen and their Exceedances, Swiss contribution to the effects-oriented work under the Convention on Long-range Transboundary Air Pollution (UNECE), Federal Office for the Environment, Bern, Environmental studies no. 1642, 78 pp., 2016.
Rustad, L. E., Campbell, J. L., Marion, G. M., Norby, R. J., Mitchell, M. J., Hartley, A. E., Cornelissen, J. H. C., Gurevitch, J., and GCTE-NEWS: A meta-analysis of the response of soil respiration, net nitrogen mineralization, and aboveground plant growth to experimental ecosystem warming, Oecologia, 126, 543–562, 2001.
Rustad, L. E.: The response of terrestrial ecosystems to global climate change: towards an integrated approach, Sci. Total Environ., 404, 222–235, 2008.
Thimonier, A., Kosonen, Z., Braun, S., Rihm, B., Schleppi, P., Schmitt, M., Seitler, E., Waldner, P., and Thöni, L.: Total deposition of nitrogen in Swiss forests: Comparison of assessment methods and evaluation of changes over two decades, Atmos. Environ. 198, 335–350, 2019.
Van Der Wal, R. and Stien, A.: High-arctic plants like it hot: A long-term investigation of between-year variability in plant biomass, Ecology 95, 3414–3427, 2014.
Vinther, B. M., Buchardt, S. L., Clausen, H. B., Dahl-Jensen, D., Johnsen, S. J., Fisher, D. A., Koerner, R. M., Raynaud, D., Lipenkov, V., Andersen, K. K., Blunier, T., Rasmussen, S. O., Steffensen, J. P., and Svensson, A. M.: Holocene thinning of the Greenland ice sheet, Nature, 461, 385–388, 2009.
Vitousek, P. M., Aber, J., Howarth, R. W., Likens, G. E., Matson, P. A., Schindler, D. W., Schlesinger, W. H., and Tilman, G. D.: Human alteration of the global nitrogen cycle: causes and consequences, Ecol. Appl., 7, 737–750, 1997.
Volk, M., Wolff, V., Bassin, S., Ammann, C., and Fuhrer, J.: High tolerance of subalpine grassland to long-term ozone exposure is independent of N input and climatic drivers, Environ. Poll. 189, 161–168, 2014.
Volk, M., Enderle, J., and Bassin, S.: Subalpine grassland carbon balance during 7 years of increased atmospheric N deposition, Biogeosciences, 13, 3807–3817, https://doi.org/10.5194/bg-13-3807-2016, 2016.
Volk, M., Suter, M., Wahl, A.-L., and Bassin, S.: Dataset for “Subalpine grassland productivity increased with warmer and drier conditions, but not with higher N deposition, in an altitudinal transplantation experiment”, Zenodo, https://doi.org/10.5281/zenodo.4555374, 2021.
Wang, Z., Luo, T., Li, R., Tang, Y., and Du, M.: Causes for the unimodal pattern of biomass and productivity in alpine grasslands along a large altitudinal gradient in semi-arid regions, J. Veg. Sci. 24, 189–201, 2013. Wang, H., Prentice, I. C., Davis, T. W., Keenan, T. F., Wright, I. J., and Peng, C.: Photosynthetic responses to altitude: an explanation based on optimality principles, New Phytol., 213, 976–982, 2016.
Wood, S. N.: Generalized Additive Models: An Introduction with R, 2nd edition, Chapman and Hall/CRC, London, 2017.
Wüst-Galley, C., Volk, M., and Bassin, S.: Interaction of climate change and nitrogen deposition on subalpine pastures, J. Veg. Sci., 32, e12946, https://doi.org/10.1111/jvs.12946, 2021.
Xu, X., Sherry, R. A., Niu, S., Li, D., and Luo, Y.: Net primary productivity and rain-use efficiency as affected by warming, altered precipitation, and clipping in a mixed-grass prairie, Global Change Biol., 19, 2753–2764, 2013.
Zhu, K., Chiariello, N. R., Tobeck, T., Fukami, T., and Field, C. B.: Nonlinear, interacting responses to climate limit grassland production under global change, P. Natl. Acad. Sci., 113, 10589–10594, 2016.