the Creative Commons Attribution 4.0 License.
the Creative Commons Attribution 4.0 License.
 | 11 Jul 2022
Tracing the source of nitrate in a forested stream showing elevated concentrations during storm events
Weitian Ding
Urumu Tsunogai
Fumiko Nakagawa
Takashi Sambuichi
Hiroyuki Sase
Masayuki Morohashi
Hiroki Yotsuyanagi
To clarify the source of nitrate increased during storm events in a temperate forested stream, we monitored temporal variation in the concentrations and stable isotopic compositions including Δ17O of stream nitrate in a forested catchment (KJ catchment, Japan) during three storm events: I, II, and III (summer). The stream showed a significant increase in nitrate concentration, from 24.7 to 122.6 µM, from 28.7 to 134.1 µM, and from 46.6 to 114.5 µM, during the storm events I, II, and III, respectively. On the other hand, the isotopic compositions (δ15N, δ18O, and Δ17O) of stream nitrate showed a decrease in accordance with the increase in the stream nitrate concentration, from +2.5 ‰ to −0.1 ‰, from +3.0 ‰ to −0.5 ‰, and from +3.5 ‰ to −0.1 ‰, for δ15N; from +3.1 ‰ to −3.4 ‰, from +2.9 ‰ to −2.5 ‰, and from +2.1 ‰ to −2.3 ‰ for δ18O; and from +1.6 ‰ to +0.3 ‰, from +1.4 ‰ to +0.3 ‰, and from +1.2 ‰ to +0.5 ‰, for Δ17O during the storm events I, II, and III, respectively. Besides, we found strong linear relationships between the isotopic compositions of stream nitrate and the reciprocal of stream nitrate concentrations during each storm event, implying that the temporal variation in the stream nitrate can be explained by simple mixing between two distinctive endmembers of nitrate having different isotopic compositions. Furthermore, we found that both concentrations and the isotopic compositions of soil nitrate obtained in the riparian zone of the stream were plotted on the nitrate-enriched extension of the linear relationship. We concluded that the soil nitrate in the riparian zone was primarily responsible for the increase in stream nitrate during the storm events. In addition, we found that the concentration of unprocessed atmospheric nitrate in the stream was stable at 1.6 ± 0.4, 1.8 ± 0.4, and 2.1 ± 0.4 µM during the storm events I, II, and III, respectively, irrespective of the significant variations in the total nitrate concentration. We concluded that the storm events have fews impacts on the concentration of unprocessed atmospheric nitrate in the stream, and thus the annual export flux of unprocessed atmospheric nitrate relative to the annual deposition flux can be a robust index to evaluate nitrogen saturation in forested catchments, irrespective to the variation in the number of storm events and/or the variation in the elapsed time from storm events to sampling.
- Article
(7030 KB) - Full-text XML
-
Supplement
(317 KB) - BibTeX
- EndNote


Nitrate is an important nitrogenous nutrient in the biosphere. Traditionally, forested ecosystems have been considered nitrogen limited (Vitousek and Howarth, 1991). Due to the elevated loading of nitrogen through atmospheric deposition, however, some forested ecosystems become nitrogen saturated (Aber et al., 1989), from which elevated levels of nitrate are exported (Mitchell et al., 1997; Peterjohn et al., 1996). In addition, a sudden increase in the concentration of nitrate in response to storm events has been reported in forested streams worldwide (Aguilera and Melack, 2018; Creed et al., 1996; Kamisako et al., 2008; McHale et al., 2002), which further enhanced nitrate export from forested ecosystems.
Such excessive leaching of nitrate from forested catchment degrades water quality and causes eutrophication in downstream areas (Galloway et al., 2003; Paerl and Huisman, 2009). Thus, tracing the source of nitrate increase during storm events in forested streams is important for sustainable forest management, especially for the nitrogen-saturated forested ecosystems.
As for the source of nitrate that was added to streams during storm events, either of the two possible sources have been assumed in past studies: (1) atmospheric nitrate (NOatm) in rain water originally and being supplied directly to stream water (Inamdar and Mitchell, 2006), and (2) soil nitrate originally and being supplied to stream water by the flushing effects on soils (Creed et al., 1996; Ocampo et al., 2006). Nevertheless, monitoring the variation in nitrate concentration, it is difficult to clarify the primary source of nitrate that increases during storm events.
The natural stable isotopic composition of nitrate has been widely applied to clarify the sources of nitrate in natural freshwater systems (Burns and Kendall, 2002; Durka et al., 1994; Kendall et al., 2008). In particular, triple oxygen isotopic compositions of nitrate (Δ17O) have been used in recent days as a conservative tracer of NOatm deposited onto a forested catchment (Inoue et al., 2021; Michalski et al., 2004; Nakagawa et al., 2018; Tsunogai et al., 2014), showing distinctively different Δ17O from that of remineralized nitrate (NOre), derived from organic nitrogen through general chemical reactions, including microbial N mineralization and microbial nitrification. While NOre, the oxygen atoms of which are derived from either terrestrial O2 or H2O through microbial processing (i.e., nitrification), always shows the relation close to the “mass-dependent” relative relation between ratios and ratios, NOatm displays an anomalous enrichment in 17O reflecting oxygen atom transfers from atmospheric ozone (O3) during the conversion of NOx to NOatm (Alexander et al., 2009; Michalski et al., 2003; Morin et al., 2011; Nelson et al., 2018). As a result, the Δ17O signature defined by the following equation (Kaiser et al., 2007) enables us to distinguish NOatm (Δ17O > 0) from NOre (Δ17O = 0):
where the constant β is 0.5279 (Kaiser et al., 2007), δ18O = and R is the ratio (or the ratio in the case of δ17O or the ratio in the case of δ15N) of the sample and each standard reference material. In addition, Δ17O is almost stable during “mass-dependent” isotope fractionation processes within terrestrial ecosystems. Therefore, while the δ15N or δ18O signature of NOatm can be overprinted by the biological processes subsequent to deposition, Δ17O can be used as a robust tracer of unprocessed NOatm to reflect its accurate mole fraction within total NO, regardless of the progress of the partial metabolism (partial removal of nitrate through denitrification and assimilation) subsequent to deposition (Michalski et al., 2004; Nakagawa et al., 2013, 2018; Tsunogai et al., 2011, 2014, 2018).
While the variations in the δ18O and/or Δ17O of nitrate in forested streams during storm events have been reported in past studies (Sebestyen et al., 2019; Sabo et al., 2016; Buda and DeWalle, 2009), the temporal resolutions of sampling were less than 10 times per day during storm events and the source of the stream nitrate increased during storm events has not been clarified yet. In this study, we determined the temporal variation in the concentrations and the isotopic compositions (δ15N, δ18O, and Δ17O) of stream nitrate once every hour during storm events in a forested catchment to clarify (1) the source of nitrate in a forested stream that was added during storm events, and (2) the temporal variation in the concentration of NOatm in response to storm events. In addition, the impacts of storm events on the index of nitrogen saturation recently proposed by Nakagawa et al. (2018) were discussed.
2.1 Study site
As for the studying field to trace the source of stream nitrate during storm events, we chose Kajikawa forested catchment (KJ catchment) in Japan, in which several past studies had been done to clarify the temporal variation in the concentration of stream nitrate and the status of nitrogen saturation (Kamisako et al., 2008; Nakagawa et al., 2018; Sase et al., 2021). This is a small, forested catchment (3.84 ha) located in the northern part of Shibata City, Niigata Prefecture, along the coast of the Sea of Japan (Fig. 1a). The KJ catchment predominantly slopes towards the west–northwest, with a mean slope of 36∘, and the elevation ranges from 60 to 170 m above sea level (Fig. 1b). The catchment is fully covered by Japanese cedars (Cryptomeria japonica D. Don) that were approximately 46 years old in 2018 (Sase et al., 2021). The parent material is granodiorite and brown forest soils (Cambisols) have developed in this area (Kamisako et al., 2008; Sase et al., 2008). The lowest, highest, and mean monthly temperatures recorded at the nearest meteorological station (Nakajo station) were 1.0 ∘C (in February), 27.9 ∘C (in August), and 14.5 ∘C, respectively, from May 2017 to March 2020. The annual mean precipitation was around 2500 mm, approximately 17 % of which occurred during spring (from March to May), approximately 20 % during summer (from June to August), approximately 28 % during fall (from September to November), and approximately 35 % during winter (from December to February). The catchment usually experiences snowfall from late December to March.
From 2003 to 2005, Kamisako et al. (2008) determined temporal variation in the concentration of Ca2+, Mg2+, Cl−, and NO eluted from the catchment via a stream at intervals of 1–3 h for 2–3 d on each and found a significant increase in the stream nitrate concentration during storm events, from less than 30 µM to more than 120 µM. On the basis of the observed nitrate enrichment in the stream water, they concluded that atmospheric nitrogen inputs exceeded the biological demand at the catchment and proposed that the KJ catchment was under nitrogen saturation. Nakagawa et al. (2018) determined temporal variation in the concentrations and stable isotopic compositions (δ15N, δ18O, and Δ17O) of both stream nitrate and soil nitrate for 2 years (from December 2012 to December 2014) and concluded that nitrate in the groundwater of the catchment was the major source of nitrate in the stream water during the base flow periods. Additionally, Nakagawa et al. (2018), who proposed that the export flux of NOatm (Matm) relative to the deposition flux of NOatm (Datm) can be an alternative, more robust index for nitrogen saturation in temperate forested catchments, clarified that the ratio in the KJ catchment was larger (9.4 %) than the other catchments they studied simultaneously (6.5 % and 2.6 %), which also implied that the KJ catchment was under the nitrogen saturation. Moreover, Sase et al. (2021) reported that the nitrate concentration of the stream has been increasing in recent years, which implies that nitrogen saturation is still ongoing in the forest.
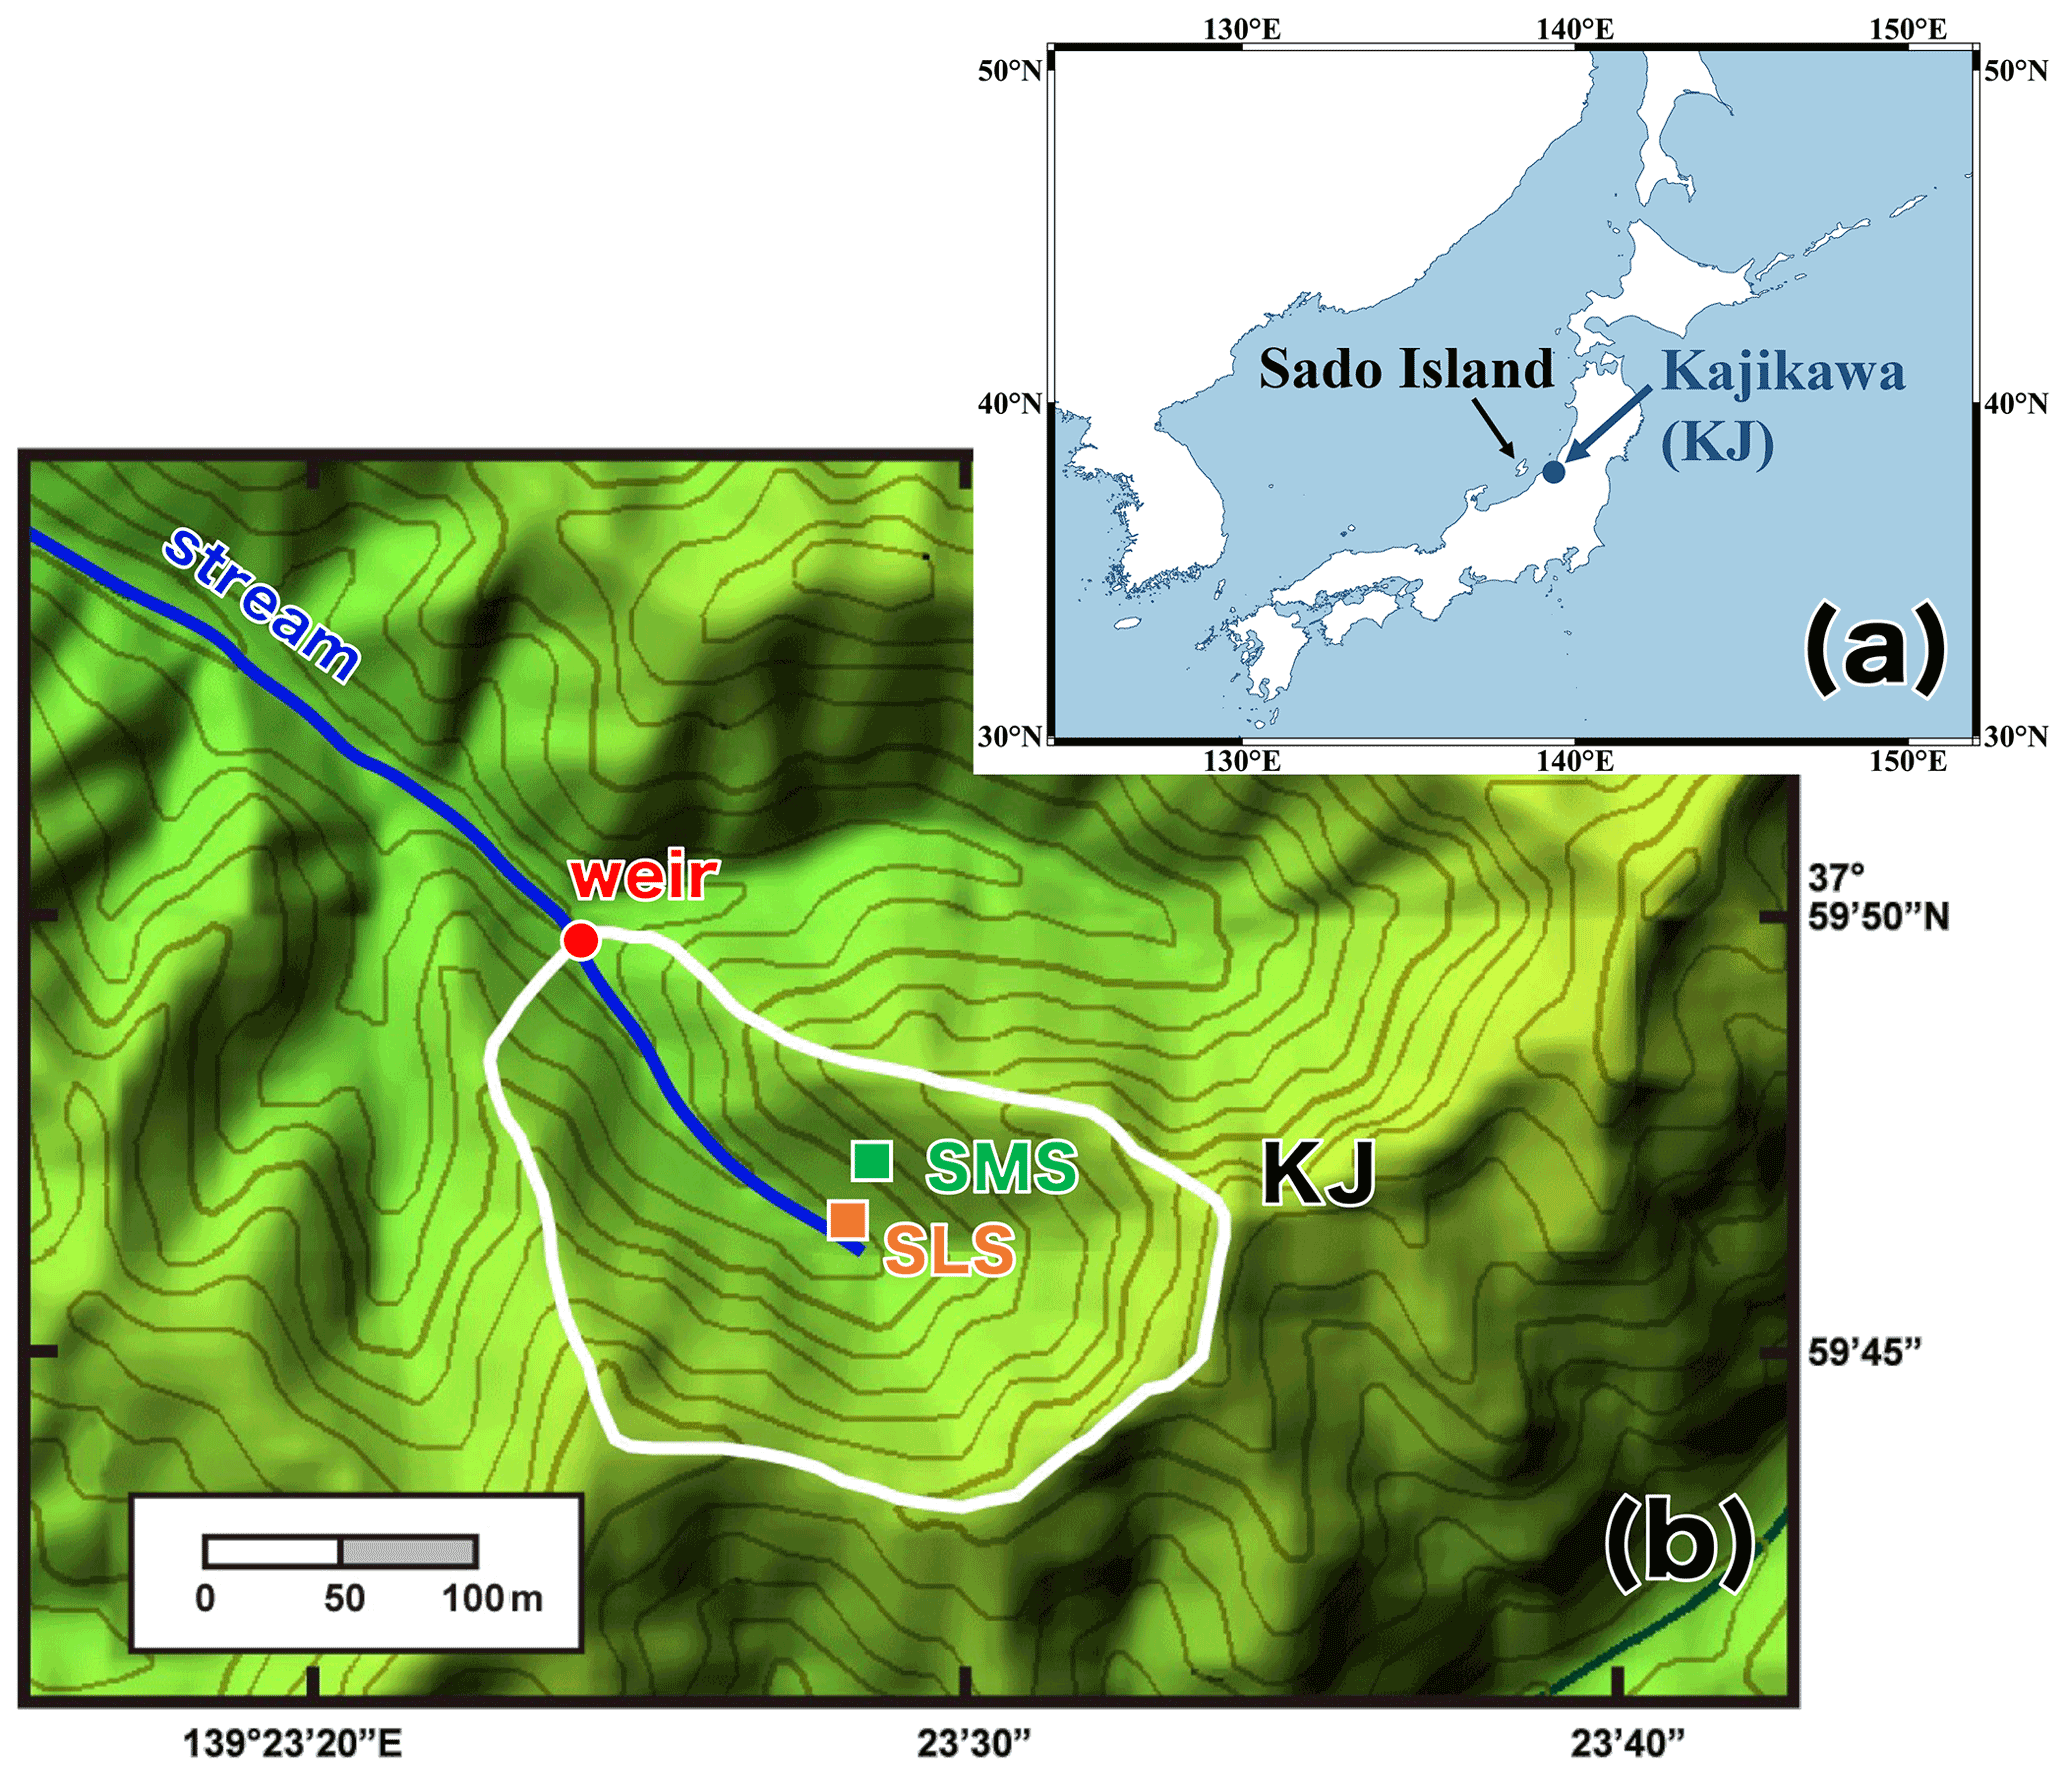
Figure 1A map showing the locations of the studied Kajikawa (KJ) catchment in Japan (a) and a colored altitude map of the KJ catchment (b) (modified after Nakagawa et al., 2018). The white line denotes the whole catchment area, and the red circle denotes the position of the weir where the stream water was sampled. The orange (SLS) and green (SMS) squares denote the sampling stations of soil water in the riparian and upland zone, respectively, in the past study (Nakagawa et al., 2018).
2.2 Discharge rates and weather information
A V-notch weir (half angle 30∘) and a partial flume were installed at the bottom of the catchment (Fig. 1b), where the discharge rates were determined. The weather information, including the precipitation monitored by Japan Meteorological Agency at the nearest station of KJ catchment (Nakajo station; 38∘04′60′′ N, 139∘23′30′′ E), was used for that in the KJ catchment. Because the accumulated snow was not monitored in Nakajo station, however, that monitored at the Niigata station (37∘53′60′′ N, 139∘01′10′′ E) was used instead.
2.3 Sampling
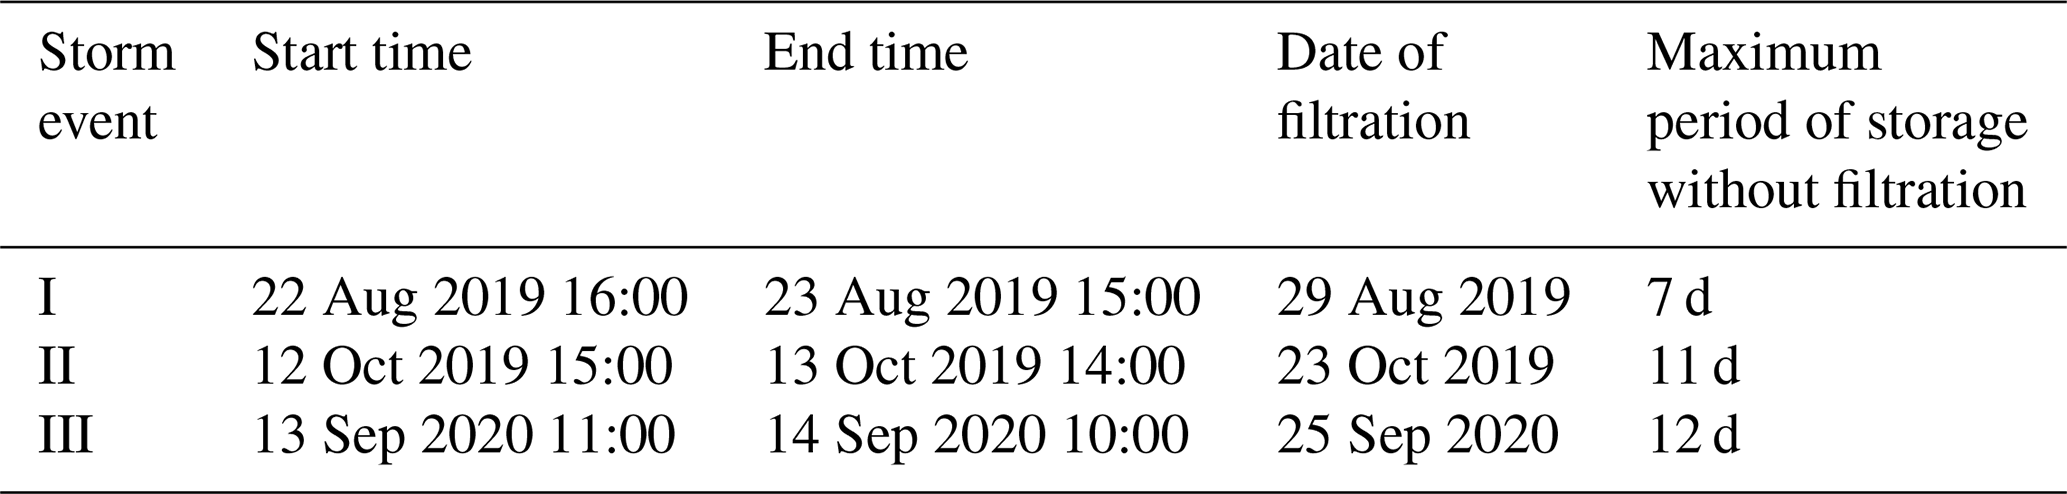
In this study, the concentrations and stable isotopic compositions (δ15N, δ18O, and Δ17O) of stream nitrate eluted from the KJ catchment were monitored every month for more than 2 years (routine observation). Additionally, during storm events, the same parameters were monitored every hour for 1 d (intensive observation). Stream water was sampled at the weir located on the outlet of the KJ catchment (Fig. 1b). Routine observation was performed manually using bottles at the weir approximately once a month from May 2017 to March 2020. Intensive observation was conducted during the three storm events I, II, and III (22 August 2019, 12 October 2019, and 13 September 2020, respectively), where the water samples were collected at intervals of 1 h over 24 h using an automatic water sampler (SIGMA 900, Hach, USA). In this study, 0.5 or 2 L polyethylene bottles washed using chemical detergents were rinsed at least three times using deionized water and dried in the laboratory before being used to store the water samples.
2.4 Analysis
Samples of stream water for the routine observation were transported to the laboratory within 1 h after being collected manually. Samples for the intensive observation were transported within 12 d after completion of the automatic sampling (Table 1). All samples were passed through a membrane filter (pore size 0.45 µm) and stored in a refrigerator (4 ∘C) until their chemical analysis.
The concentrations of nitrate were measured by ion chromatography (DX-500, Dionex Inc., USA). To determine the stable isotopic compositions of nitrate in the stream water samples, nitrate in each sample was chemically converted to N2O using a method originally developed to determine the and ratios of seawater and freshwater nitrate (McIlvin and Altabet, 2005) that was later modified (Konno et al., 2010; Tsunogai et al., 2011; Yamazaki et al., 2011). In brief, 11 mL of each sample solution was pipetted into a vial with a septum cap. Then, 0.5 g of spongy cadmium was added, followed by 150 µL of a 1 M NaHCO3 solution. The sample was then shaken for 18–24 h at a rate of 2 cycles s−1. Then, the sample solution (10 mL) was decanted into a different vial with a septum cap. After purging the solution using high-purity helium, 0.4 mL of an azide–acetic acid buffer, which had also been purged using high-purity helium, was added. After 45 min, the solution was alkalinized by adding 0.2 mL of 6 M NaOH.
Then, the stable isotopic compositions (δ15N, δ18O, and Δ17O) of the N2O in each vial were determined using the continuous-flow isotope ratio mass spectrometry (CF-IRMS) system at Nagoya University. The analytical procedures performed using the CF-IRMS system were the same as those detailed in previous studies (Hirota et al., 2010; Komatsu et al., 2008). The obtained values of δ15N, δ18O, and Δ17O for the N2O derived from the nitrate in each sample were compared with those derived from our local laboratory nitrate standards to calibrate the values of the sample nitrate to an international scale and to correct for both isotope fractionation during the chemical conversion to N2O and the progress of oxygen isotope exchange between the nitrate derived reaction intermediate and water (ca. 20 %). The local laboratory nitrate standards used for the calibration had been calibrated using the internationally distributed isotope reference materials (USGS-34 and USGS-35). In this study, we adopted the internal standard method (Nakagawa et al., 2013, 2018; Tsunogai et al., 2014) to calibrate the stable isotopic compositions of sample nitrate. In order to calibrate the differences in δ18O of H2O between the samples and the standard samples, the δ18O values of H2O in the samples were analyzed as well (Tsunogai et al., 2010, 2011, 2014).
To determine whether the conversion rate from nitrate to N2O was sufficient, the concentration of nitrate in the samples was determined each time we analyzed the isotopic composition using CF-IRMS based on the N2O+ or O outputs. We adopted the δ15N, δ18O, and Δ17O values only when the concentration measured via CF-IRMS correlated with the concentration measured via ion chromatography prior to isotope analysis within a difference of 10 %.
Three kinds of the local laboratory nitrate standards were used to determine the isotopic compositions of stream nitrate, which had been named to be GG01 (δ15N = −3.07 ‰, δ18O = +1.10 ‰, and Δ17O = 0 ‰), HDLW02 (δ15N = +16.11 ‰, δ18O = +22.20 ‰), and NF (δ18O = +54.14 ‰, Δ17O = +19.16 ‰). Both GG01 and HDLW02 were used to determine δ15N and δ18O of stream nitrate, and both GG01 and NF were used to determine Δ17O of stream nitrate. The standard errors of the mean in the isotopic compositions (δ15N, δ18O and Δ17O), determined through repeated measurements on GG01 (n=3), were ±0.17 ‰ for δ15N, ±0.25 ‰ for δ18O, and ±0.10 ‰ for Δ17O, during the measurements in this study. We repeated the analysis of δ15N, δ18O, and Δ17O values for each sample at least three times to attain high precision. All samples had a nitrate concentration of greater than 10 µM, which corresponded to a nitrate quantity greater than 100 nmol in a 10 mL sample. Thus, all isotope values presented in this study have an error (standard error of the mean) better than ±0.2 ‰ for δ15N, ±0.3 ‰ for δ18O, and ±0.1 ‰ for Δ17O.
Nitrite (NO) in the samples interferes with the final N2O produced from nitrate because the chemical method also converts NO to N2O (McIlvin and Altabet, 2005). Therefore, it is sometimes necessary to remove NO prior to converting nitrate to N2O. However, in this study, all the stream and soil water samples analyzed for stable isotopic composition had NO concentrations lower than the detection limit (0.05 µM). Because the minimum nitrate concentration in the samples was 24.7 µM in this study, the ratios of NO to nitrate in the samples must be less than 0.2 %. Thus, we skipped the processes for removing NO.
2.5 Calculating the concentration of unprocessed NOatm in stream water
The Δ17O data of nitrate in each sample can be used to estimate the concentration of NOatm ([NOatm]) in the stream water samples by applying Eq. (2):
where [NOatm] and [NO] denote the concentration of NOatm and nitrate (total) in each water sample, respectively, and Δ17Oatm and Δ17O denote the Δ17O values of NOatm and nitrate (total) in the stream water sample, respectively. In this study, we used the average Δ17O value of NOatm determined at the nearby Sado-seki monitoring station during the observation from April 2009 to March 2012 (Δ17O ‰; Tsunogai et al., 2016) for Δ17Oatm in Eq. (2) to estimate [NOatm] in the stream. We allow for an error range of 3 ‰ in Δ17Oatm, in which the factor changes in Δ17Oatm from +26.3 ‰ caused by both areal and seasonal variation in the Δ17O values of NOatm have been considered (Nakagawa et al., 2018; Tsunogai et al., 2016).
Table 1Information on the samples taken during the intensive observation.
3.1 Variation during the routine observation
During the routine observation, the concentrations of stream nitrate ranged from 35.7 to 129.3 µM with the flux-weighted average concentration of 55.6 µM (Fig. 2a), showing little temporal changes from that determined during the past observations from 2013 to 2014 at the same catchment (58.4 µM; Nakagawa et al., 2018). The variation range also agreed with the past observation done in the same catchment (Kamisako et al., 2008), except for the extraordinarily large concentration (129.3 µM) recorded on 31 August 2018, which exceeded the 2σ of the whole variation range of stream nitrate of our routine observation (Fig. 2a). We will discuss the reason in Sect. 4.2.
The stable isotopic compositions of stream nitrate during the routine observation ranged from +0.1 ‰ to +5.9 ‰ for δ15N (Fig. 2b), from −1.9 ‰ to +7.7 ‰ for δ18O (Fig. 2c), and from +0.4 ‰ to +2.7 ‰ for Δ17O (Fig. 2d), while showing little seasonal variation. The flux-weighted averages for the δ15N, δ18O, and Δ17O values of nitrate were +2.0 ‰, +1.1 ‰, and +1.1 ‰, respectively. Except for the extraordinarily large δ18O and Δ17O values we found on 31 January 2019 (δ18O = +7.7 ‰ and Δ17O = +2.7 ‰) (Fig. 2c and d), the values are typical for stream nitrate eluted from temperate forested catchments (Hattori et al., 2019; Huang et al., 2020; Nakagawa et al., 2013, 2018; Riha et al., 2014; Sabo et al., 2016; Tsunogai et al., 2014, 2016). On the other hand, the data recorded on 31 January 2019 exceeded the 2σ variation range of the whole δ18O and Δ17O data. We will discuss the reason in Sect. 4.3.
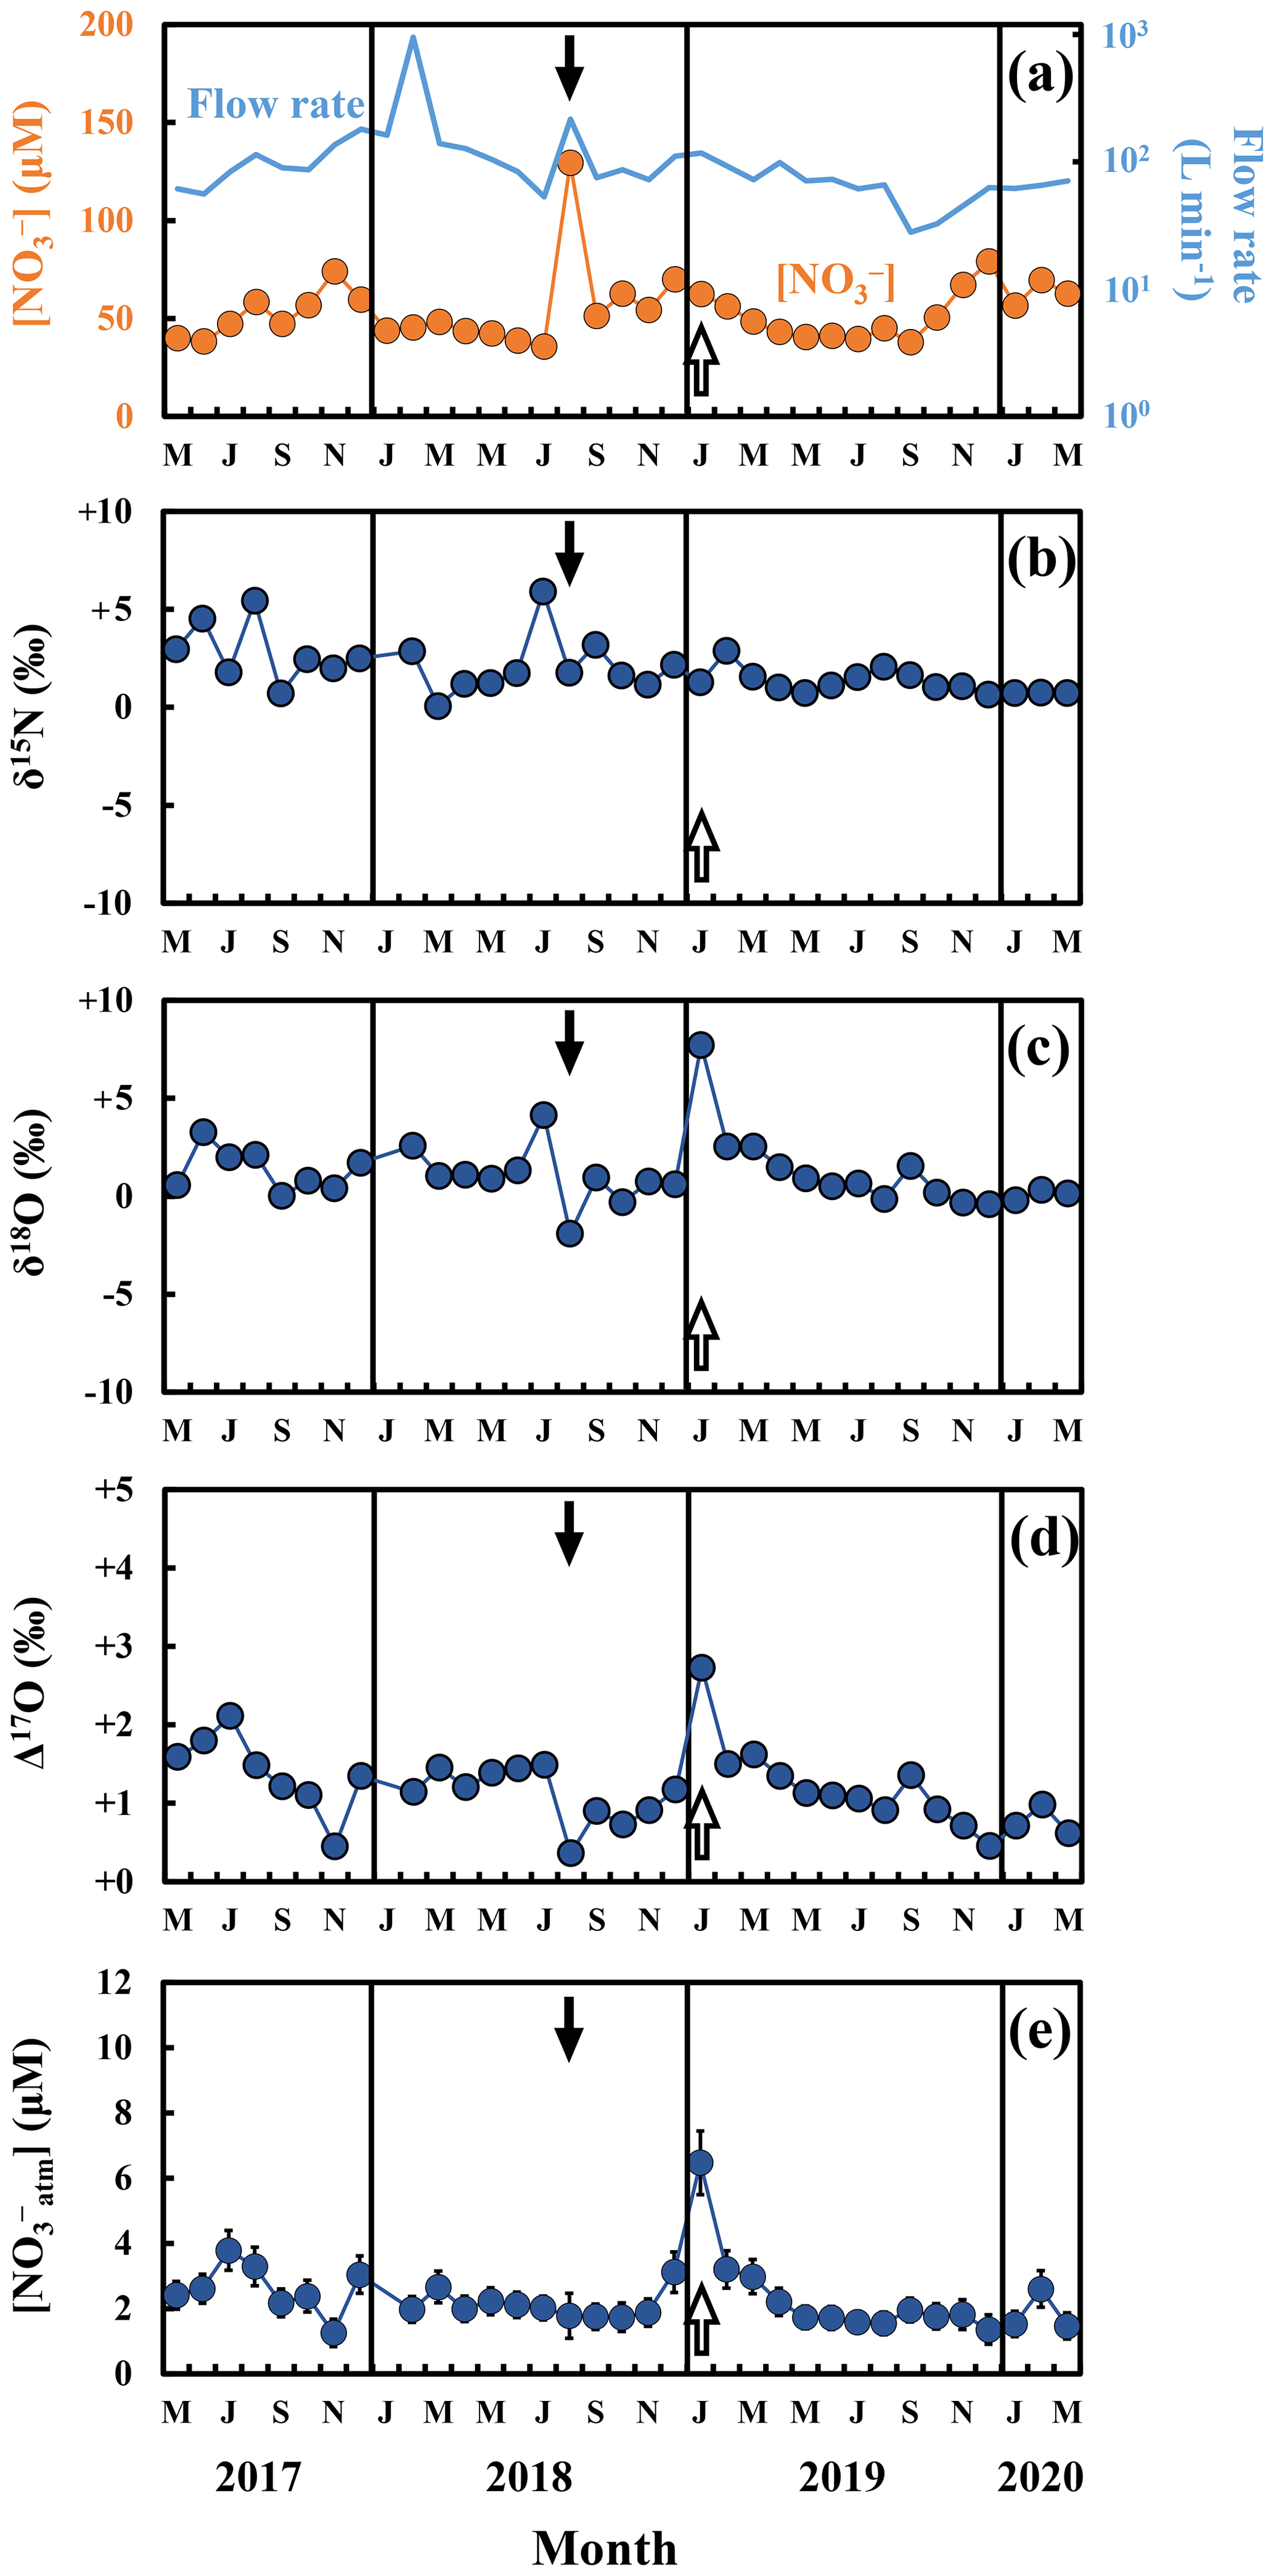
Figure 2Temporal variations in the concentrations of nitrate (orange circles) and the flow rates (blue line) in the stream water during the routine observation (a), together with those of the values of δ15N (b), δ18O (c), Δ17O (d) of nitrate, and the concentrations of unprocessed atmospheric nitrate ([NOatm]) (e) in the stream water (blue circles). The black and white arrows in the figures indicate the sampling that took place on 31 August 2018 and 31 January 2019, respectively. The error bars smaller than the sizes of the symbols are not presented.
3.2 Variation in response to the storm events
During the intensive observations made in response to the storm events, the concentration of stream nitrate showed significant short-term variation, from 24.7 to 122.6 µM, from 28.7 to 134.1 µM, and from 46.6 to 114.5 µM during the storm events I, II, and III, respectively, with the minimum recorded just before the beginning of each storm event and the maximum recorded when the flow rate was close to the maximum within each storm event (Fig. 3 and Fig. S1 in the Supplement). Similar increase in the concentrations of stream nitrate in accordance with the increase in the flow rate during storm events have been reported in many past studies (e.g., Burns et al., 2019; Chen et al., 2020; Kamisako et al., 2008; Christopher et al., 2008). Especially, Kamisako et al. (2008), who monitored temporal changes in the concentration of stream nitrate in the same KJ catchment from 2003 to 2005 and found 11 nitrate increase events in accordance with the increase in the flow rate, reported the largest concentration of stream nitrate during the events to be 120 µM. The pattern and range of the short-term variation of the stream nitrate concentration during the three storm events were also consistent with the past study (Kamisako et al., 2008).
The stable isotopic compositions of stream nitrate during the three storm events also showed significant temporal variation, from −0.1 ‰ to +2.5 ‰, from −0.5 ‰ to +3.0 ‰, and from −0.1 ‰ to +3.5 ‰ for δ15N (Figs. 3b, S1b, S1g), from −3.4 ‰ to +3.1 ‰, from −2.5 ‰ to +2.9 ‰, and from −2.3 ‰ to +2.1 ‰ for δ18O (Figs. 3c, S1c, S1h), and from +0.3 ‰ to +1.6 ‰, from +0.3 ‰ to +1.4 ‰, and from +0.5 ‰ to +1.2 ‰ for Δ17O (Figs. 3d, S1d, S1i), with minimum values observed when the concentration of stream nitrate was at maximum and maximum values observed when the concentration of stream nitrate was at a minimum.
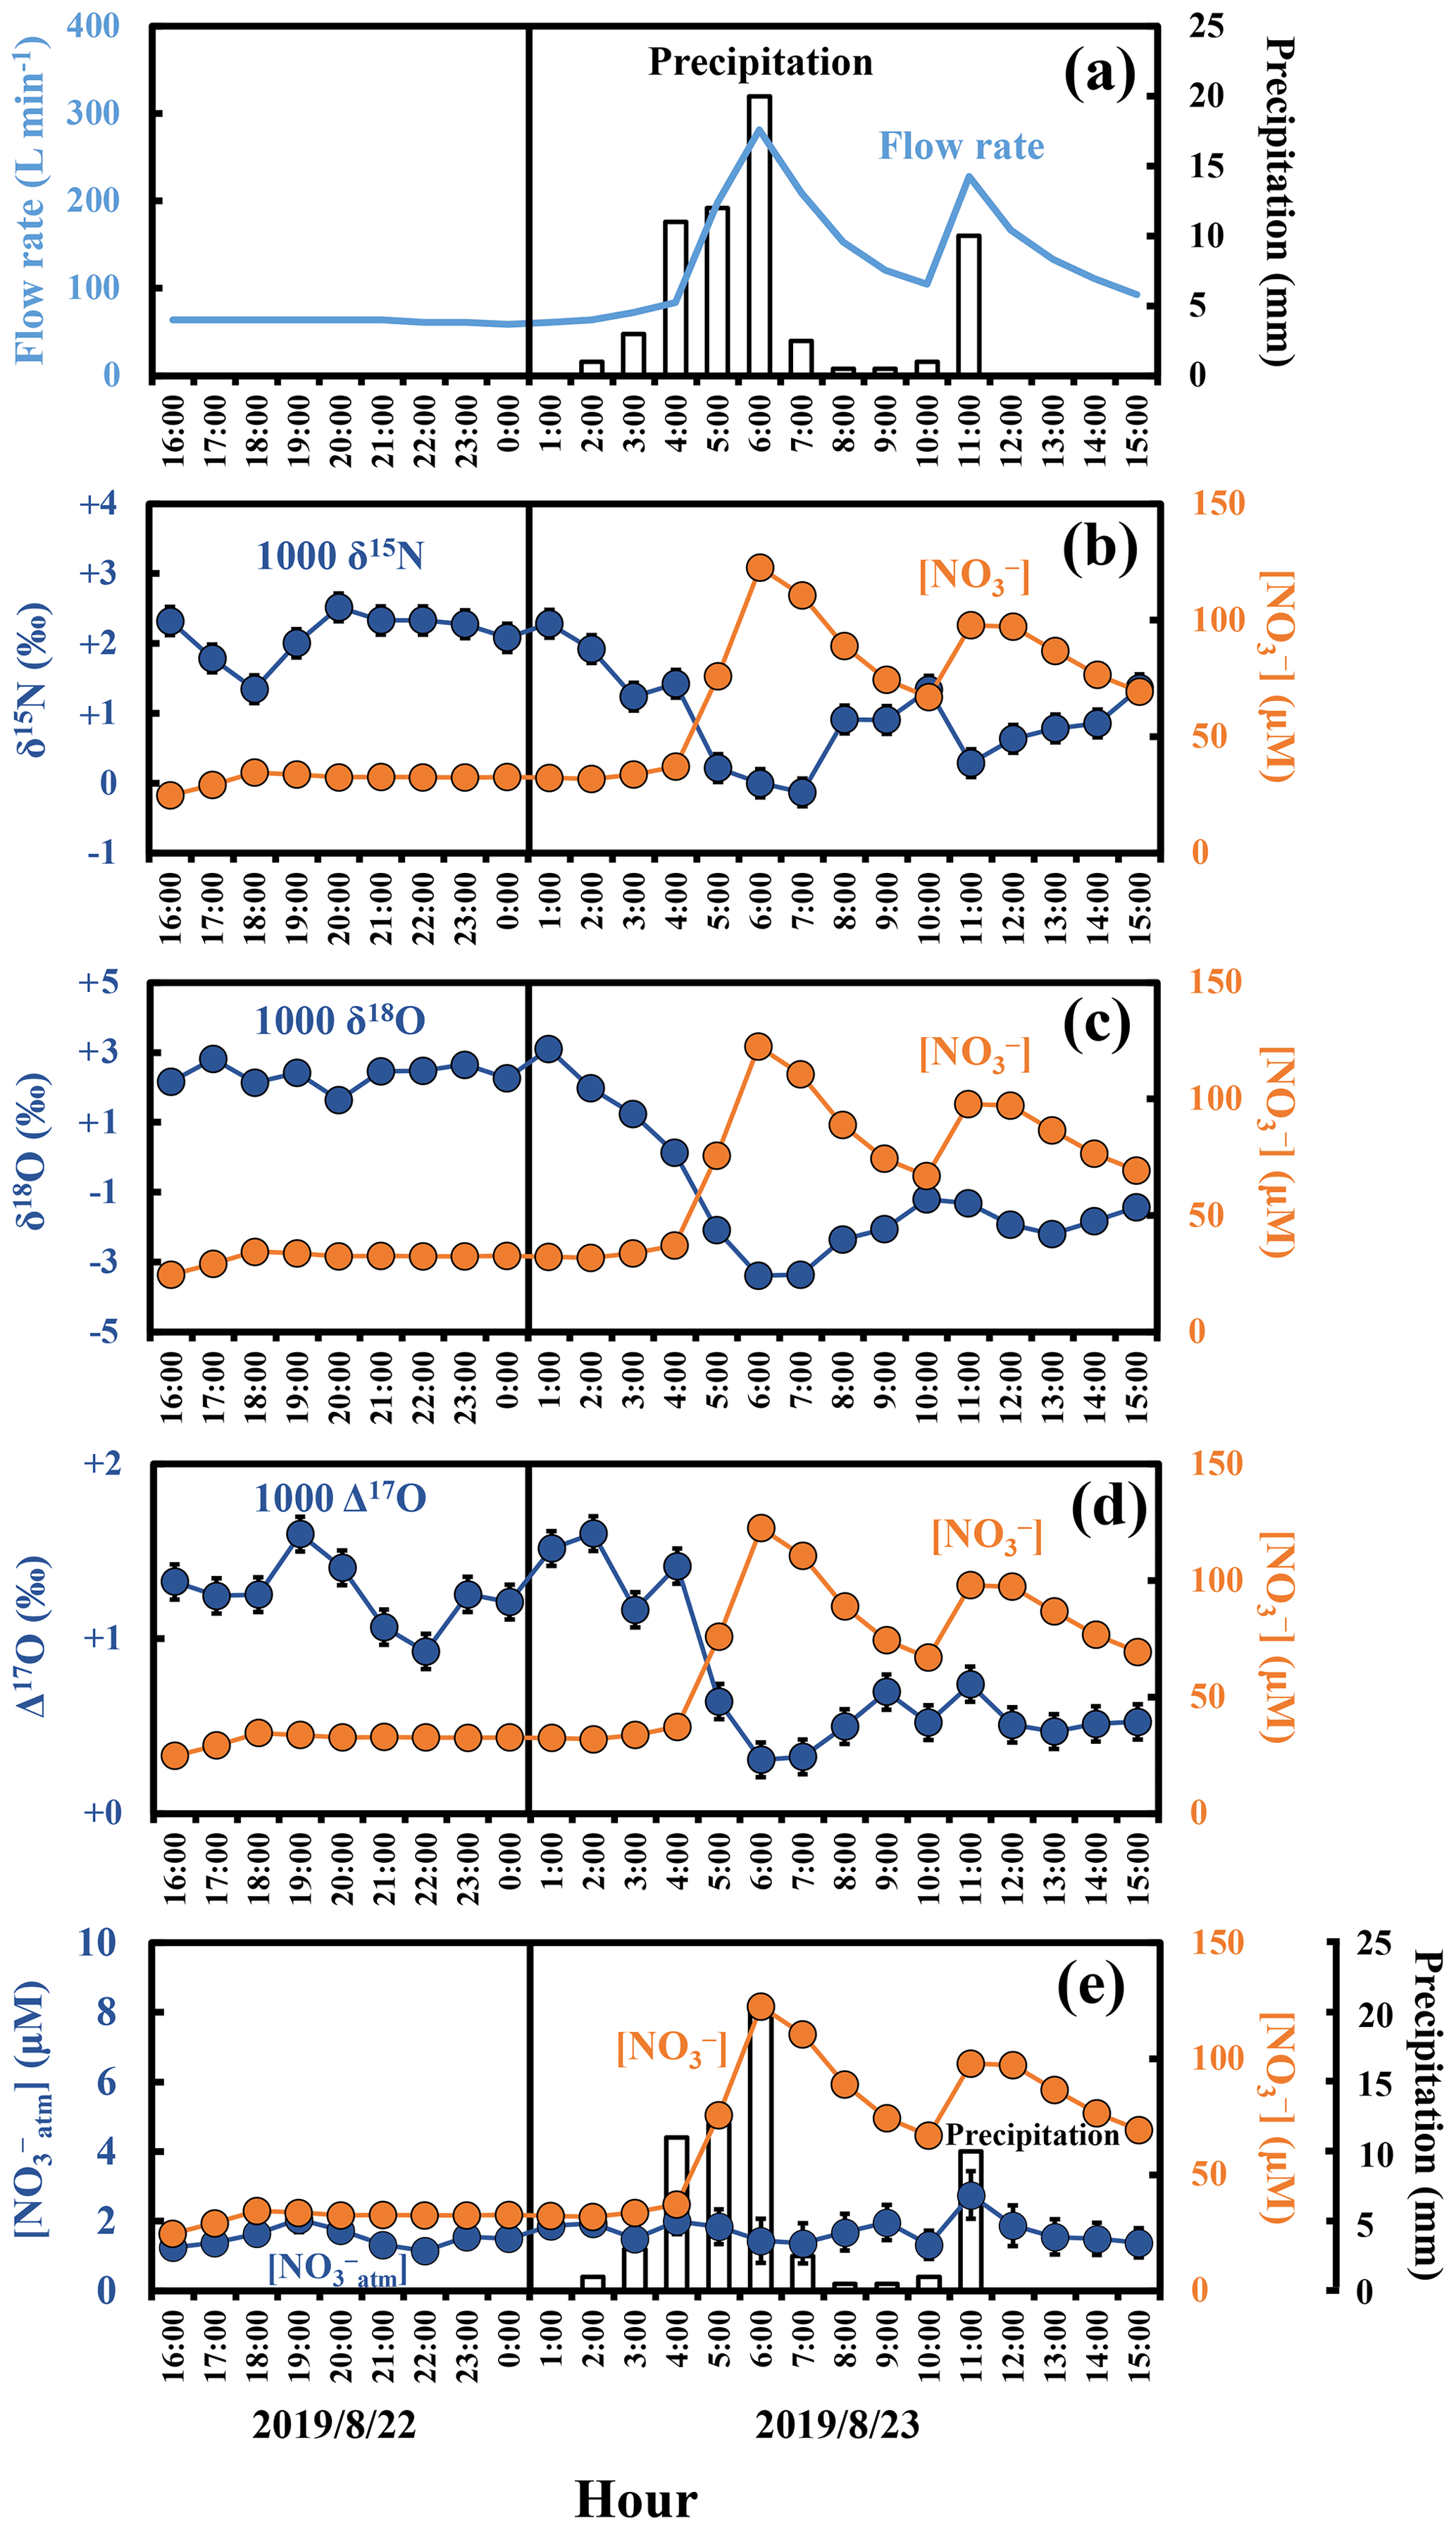
Figure 3Temporal variations in the amount of precipitation (bar chart) and flow rates of the stream water (blue line) during storm event I (a), together with those in the concentrations of nitrate (orange circles) (b–e), the values of δ15N (b), δ18O (c), Δ17O (d) of nitrate, and [NOatm] (e) in the stream water (blue circles). The error bars smaller than the sizes of the symbols are not presented.
4.1 Possible alterations to the concentration and isotopic compositions of stream nitrate during the storage period in the automatic sampler used for the intensive observations
During the intensive observations, the stream water samples were stored in bottles of the automatic sampler. The storage periods until filtration ranged from 7 (storm event I) to 12 d (storm event III) (Table 1). While the automatic sampler was surrounded by ferns and the other understory vegetations to minimize the possible alterations of the samples, progress of biogeochemical reactions such as nitrification, denitrification, and assimilation could alter the concentration and isotopic compositions (δ15N, δ18O, and Δ17O) of stream nitrate during the storage period. Above all, possible increase in soil water input into the stream water that is enriched with organic matter during a storm event could enhance nitrification during the storage period and could increase the concentration of nitrate in the stream water samples taken by using the automatic sampler.
As a result, we discussed the possible alteration of the concentration and isotopic compositions during the storage for the samples taken by using the automatic sampler and concluded that the alterations during the storage in the automatic sampler were minor in the samples. The details are described in Appendix A.
4.2 Primary source of nitrate increased during storm events
The striking feature of the observed short-term variation was that all the stable isotopic compositions (δ15N, δ18O, and Δ17O) varied in response to the variation in the nitrate concentration throughout the three storm events (Figs. 3, S1). The result implied that the source of increased nitrate during the storm events was different from that during the base flow period.
As a result, the stable isotopic compositions (δ15N, δ18O, and Δ17O) of stream nitrate were plotted as the functions of the reciprocal of the stream nitrate concentration () for each storm event (Fig. 4). All the stable isotopic compositions of stream nitrate showed strong linear relationships (R2>0.5; p<0.001) with the reciprocal of concentrations. The linear relationships strongly suggest mixing between two endmembers with distinctively different isotopic signatures (e.g., Keeling, 1958). The observed strong linear relationships not only in the Δ17O of stream nitrate (Fig. 4g–i), which is stable during the progress of partial removal reactions such as denitrification or assimilation, but also in the δ15N and δ18O of stream nitrate (Fig. 4a–f), which should be altered during the progress of the partial removal reactions, also implied that the progress of denitrification or assimilation in bottles of the automatic sampler during the storage period without filtration were minor in the samples.
The nitrate-depleted endmember must be the source of stream nitrate during the base flow period prior to each storm event. On the other hand, the nitrate-enriched endmember represents the source of nitrate that was added during the storm events.
Atmospheric nitrate (NOatm) dissolved in rain water was one of the possible sources of nitrate enriched during the storm events (Inamdar and Mitchell, 2006). While the NOatm showed the δ18O and Δ17O values enriched in both 18O and 17O, more than +55 ‰ and more than +18 ‰, respectively, during summer periods in Japan (Tsunogai et al., 2016), the nitrate-enriched endmember showed the δ18O and Δ17O values depleted in both 18O and 17O, less than +3.1 ‰ and +1.6 ‰, respectively, during the storm events. During storm events, increases in δ18O and/or Δ17O have been reported for stream nitrate eluted from forested catchments in past studies (Sebestyen et al., 2019; Sabo et al., 2016; Buda and DeWalle, 2009). In KJ catchment, however, we found significant decrease in both the δ18O and Δ17O of stream nitrate during storm events. In addition, the concentrations of NOatm ([NOatm]) showed little temporal variations showing the concentrations of 1.6 ± 0.4, 1.8 ± 0.4, and 2.1 ± 0.4 µM during the storm events I, II, and III, respectively (Figs. 3e, S1e, S1j). In general, the [NOatm] in rain water was much higher than that in stream water (Nakagawa et al., 2018; Rose et al., 2015; Tsunogai et al., 2014). During the storm events I, II, and III, however, the [NOatm] in stream water was almost constant irrespective of the increase in precipitation (Figs. 3e, S1e, S1j). Thus, we concluded that the direct input of [NOatm] via rain water into the stream through overland flow during storm events can be negligible, at least in the KJ catchment, and that the NOatm should be the minor source of nitrate that increased during the storm events.
Nakagawa et al. (2018) determined the temporal variations in the concentrations (Fig. 5a) and isotopic compositions (δ15N, δ18O, and Δ17O) (Fig. 5b–d) of soil nitrate dissolved in soil water taken within the same catchment during 2013–2014, at the depths of 20 and 60 cm of the station SLS (SLS 20 and SLS 60, respectively) and at the depth of 20 cm of the station SMS (SMS 20), where the station SLS was located in the riparian zone of the stream and the station SMS was about 20 m away from the stream and located in the upland zone (Fig. 1b). The concentrations of soil nitrate showed significant seasonal variation, with the higher concentration in summer and the lower concentration in winter (Fig. 5a). Both the δ18O and Δ17O values also showed significant seasonal variation, with the minimum in summer and the maximum in winter (Fig. 5c and d). To verify if the soil nitrate is the source of the stream nitrate that was added to the stream during the storm events, we also plotted soil nitrate at each site (SLS 20, SLS 60, and SMS 20) of the same season in Fig. 4. Because our intensive observations on the storm events were done in summer (from August to October), the average concentration and the average isotopic composition during summer (from August to October) were calculated (Table 2) and plotted in Fig. 4. The error bars of each soil nitrate denote the standard deviation (SD) of each isotopic composition (n=5 for each). We found that the isotopic compositions (δ15N, δ18O, and Δ17O) of soil nitrate in the riparian zone (SLS 20 and SLS 60; Table 2) were always plotted on the nitrate-enriched extension (lower extension) of the mixing line during the storm events I, II, and III (Fig. 4), while those of the soil nitrate in the upland zone (SMS 20; Table 2) were somewhat deviated from the nitrate-enriched extension of the mixing line, δ18O especially (Fig. 4d–f). We concluded that the primary source of nitrate added during the storm events was the soil nitrate in the riparian zone.
The “flushing hypothesis” has been proposed to explain the increase in stream nitrate concentration in accordance with the increase in flow rate during storm events (Creed et al., 1996; Hornberger et al., 1994). During the base flow periods, nitrate accumulate in shallow, oxic soil layers due to the progress of nitrification. When the water level became higher during storm periods, concentration of stream nitrate increased due to flushing of the soil nitrate accumulated in the shallow soil layers of riparian zones into stream (Chen et al., 2020; Creed et al., 1996; Ocampo et al., 2006). Our finding that the primary source of nitrate increased during the storm events was the soil nitrate in the riparian zone is consistent with the “flushing hypothesis”. We concluded that the flushing of soil nitrate in the riparian zone into the stream due to rising of both stream water and groundwater level was primarily responsible for the increase in stream nitrate during the storm events (Fig. 6).
Within the whole dataset on the variation of the concentration of nitrate in the stream determined by Kamisako et al. (2008), increases in the concentration of stream nitrate to more than 20 µM in response to storm events were limited to the storm events that occurred in the warm months, from June to November. As the concentrations of soil nitrate in the riparian zone (SLS 20 and SLS 60) were much higher in the warm months (734 ± 496 µM; from June to November) than in the cold months (156 ± 124 µM; from December to May), such seasonal variation in the concentration of riparian soil nitrate is consistent with the observed seasonality in the influence of storm events on the stream nitrate concentration, where significant increases were limited to warm months, whereas insignificant effects were observed during cold months.
The stream nitrate during storm events showed δ15N values more depleted in 15N than those during the base flow periods (Figs. 3b, S1b, S1g), probably due to the input of riparian soil nitrate more depleted in 15N. Compared with the δ15N values of stream nitrate taken during the base flow periods of routine observations when precipitation was less than 1 mm d−1 (Fig. 2b; Table S1 in the Supplement), the riparian soil nitrate (SLS 20 and SLS 60; Table 2) showed the δ15N values around 3.5 ‰ lower. The trend and the extent of the 15N depletion coincided well with those determined in the forested catchments in past studies (Fang et al., 2015; Hattori et al., 2019). Fang et al. (2015), for instance, reported significant differences between the δ15N values of soil nitrate and those of stream nitrate in six forested catchments in Japan and China, and proposed that the kinetic fractionation due to the progress of denitrification during the elution of soil nitrate into groundwater was responsible for the relative 15N enrichment in stream nitrate compared with soil nitrate. As a result, the observed temporal decrease in the δ15N value of stream nitrate during storm events also supported that the flushing of soil nitrate showing 15N-depleted δ15N values into the stream was responsible for the elevated nitrate concentrations during storm events.
As mentioned in Sect. 3.1, we found a significant increase in nitrate concentration up to 129.3 µM on 31 August 2018 during our routine observation on the stream, when the water was sampled in the middle of a heavy storm (48.0 mm d−1; Table S1) with significant increase in flow rate (from 53.4 L min−1 1 month before to 216.9 L min−1 during sampling), with which the amount of precipitation on 31 August 2018 was the highest within the whole routine observations (Table S1). The measured δ18O and Δ17O value of the stream nitrate on 31 August 2018 (−1.9 ‰ and +0.4 ‰, respectively), showing significantly smaller values than those during the other routine observation (Fig. 2c and d), agreed well with those of the nitrate increase during the storm events I, II, and III. Moreover, both the range of increase in stream nitrate concentration (129.3 µM) and the season of observation (August) also agreed well with those of the stream nitrate increase during the three storm events. As a result, we concluded that the input of soil nitrate accumulated in the riparian zone due to flushing was also responsible for the significant increase in stream nitrate concentration we found on 31 August 2018 during the routine observation.
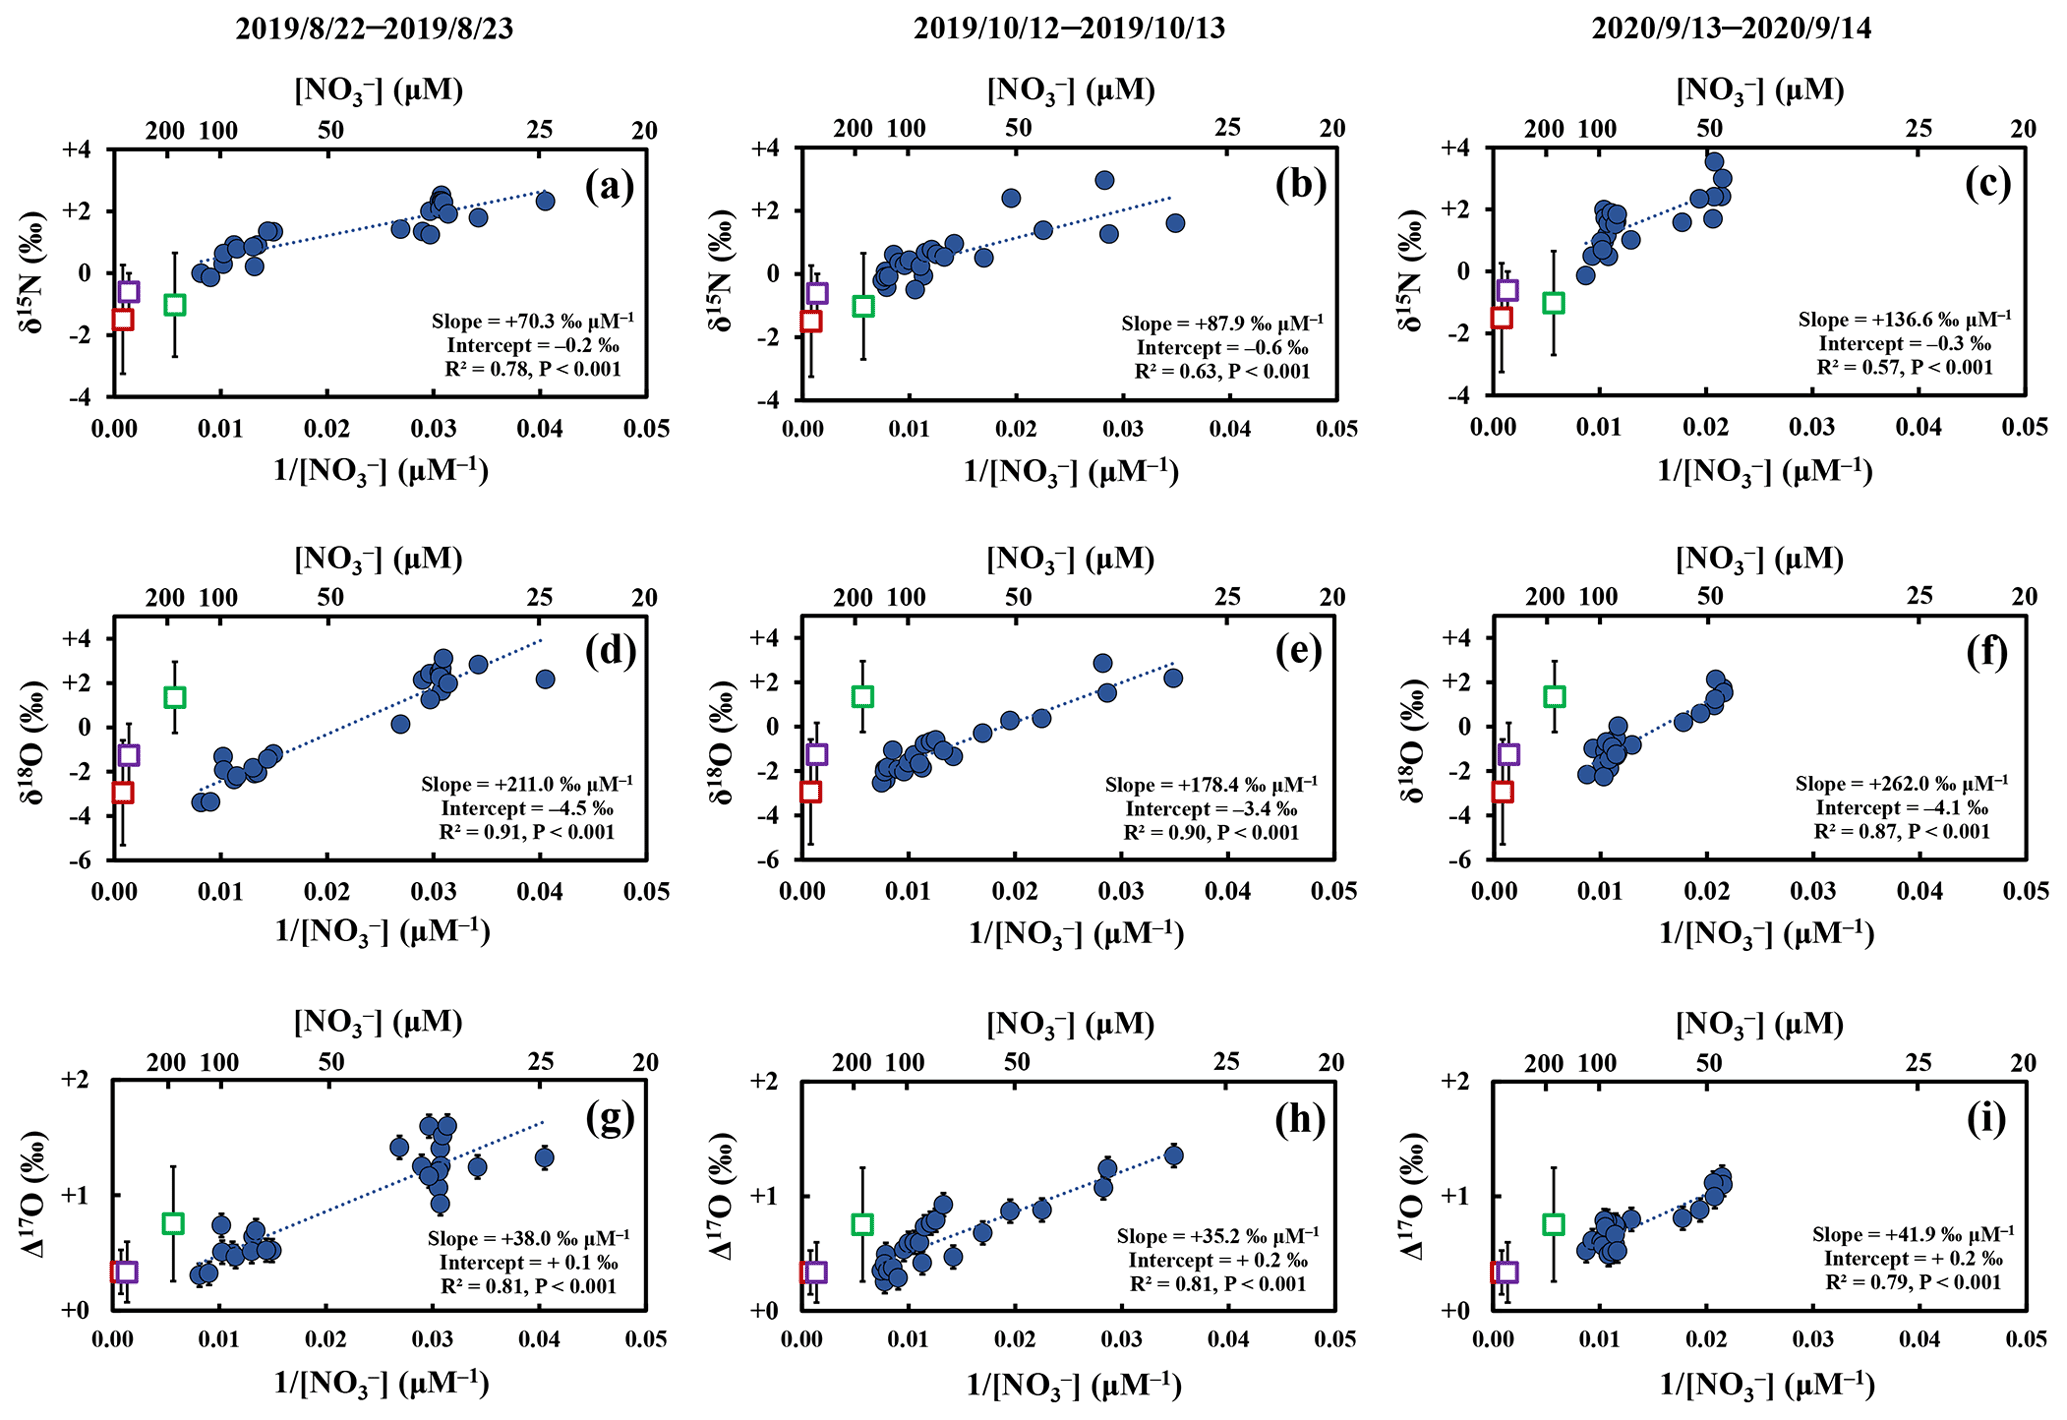
Figure 4The δ15N (a–c), δ18O (d–f), and Δ17O (g–i) values of stream nitrate (blue circles) during storm events I, II, and III plotted as a function of the reciprocal of nitrate concentration (), together with those of soil nitrate at SLS 20 (red squares; riparian zone), SLS 60 (purple squares; riparian zone), and SMS 20 (green squares; upland zone) during August to October in 2013 and 2014. The error bars of each soil nitrate denote the standard deviation (SD) of each isotopic composition (n=5 for each). The error bars smaller than the sizes of the symbols are not presented.
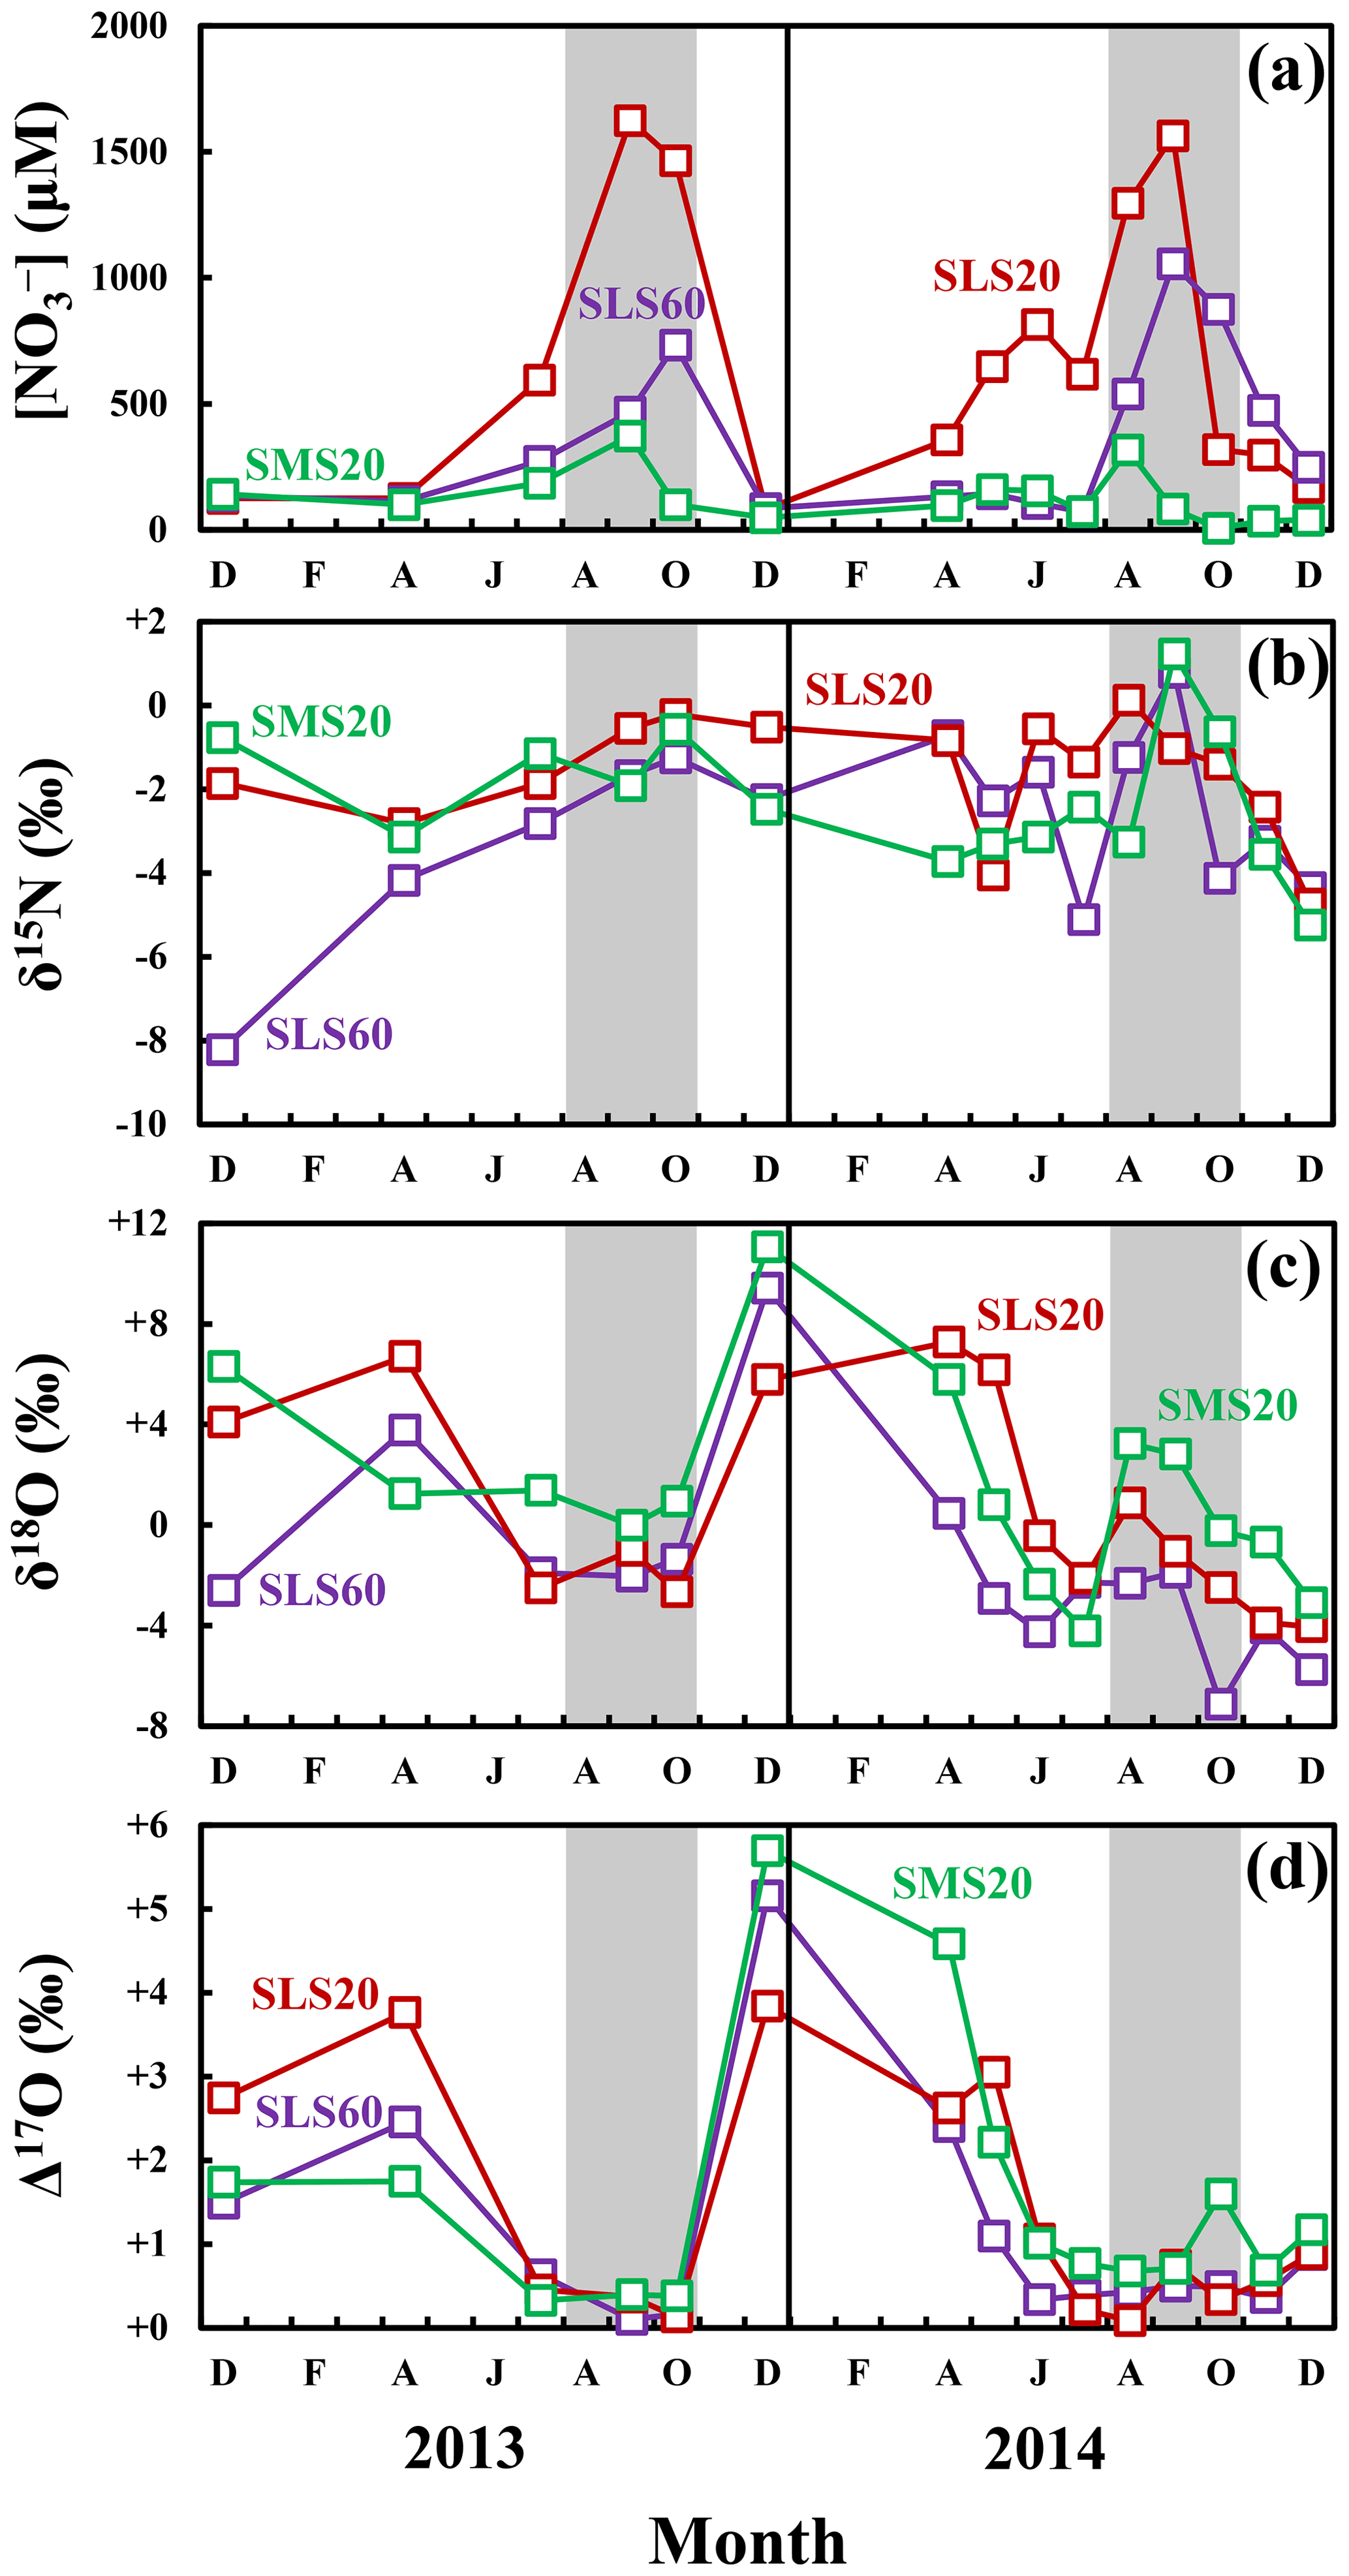
Figure 5Seasonal variations in the concentrations of soil nitrate (a) at SLS 20 (red squares), SLS 60 (purple squares), and SMS 20 (green squares), together with those in the values of δ15N (b), δ18O (c), and Δ17O (d) of each soil nitrate during 2013– 2014 (modified from Nakagawa et al., 2018). The periods used to estimate the isotopic compositions (from August to October) are presented in gray. The error bars are smaller than the sizes of the symbols.
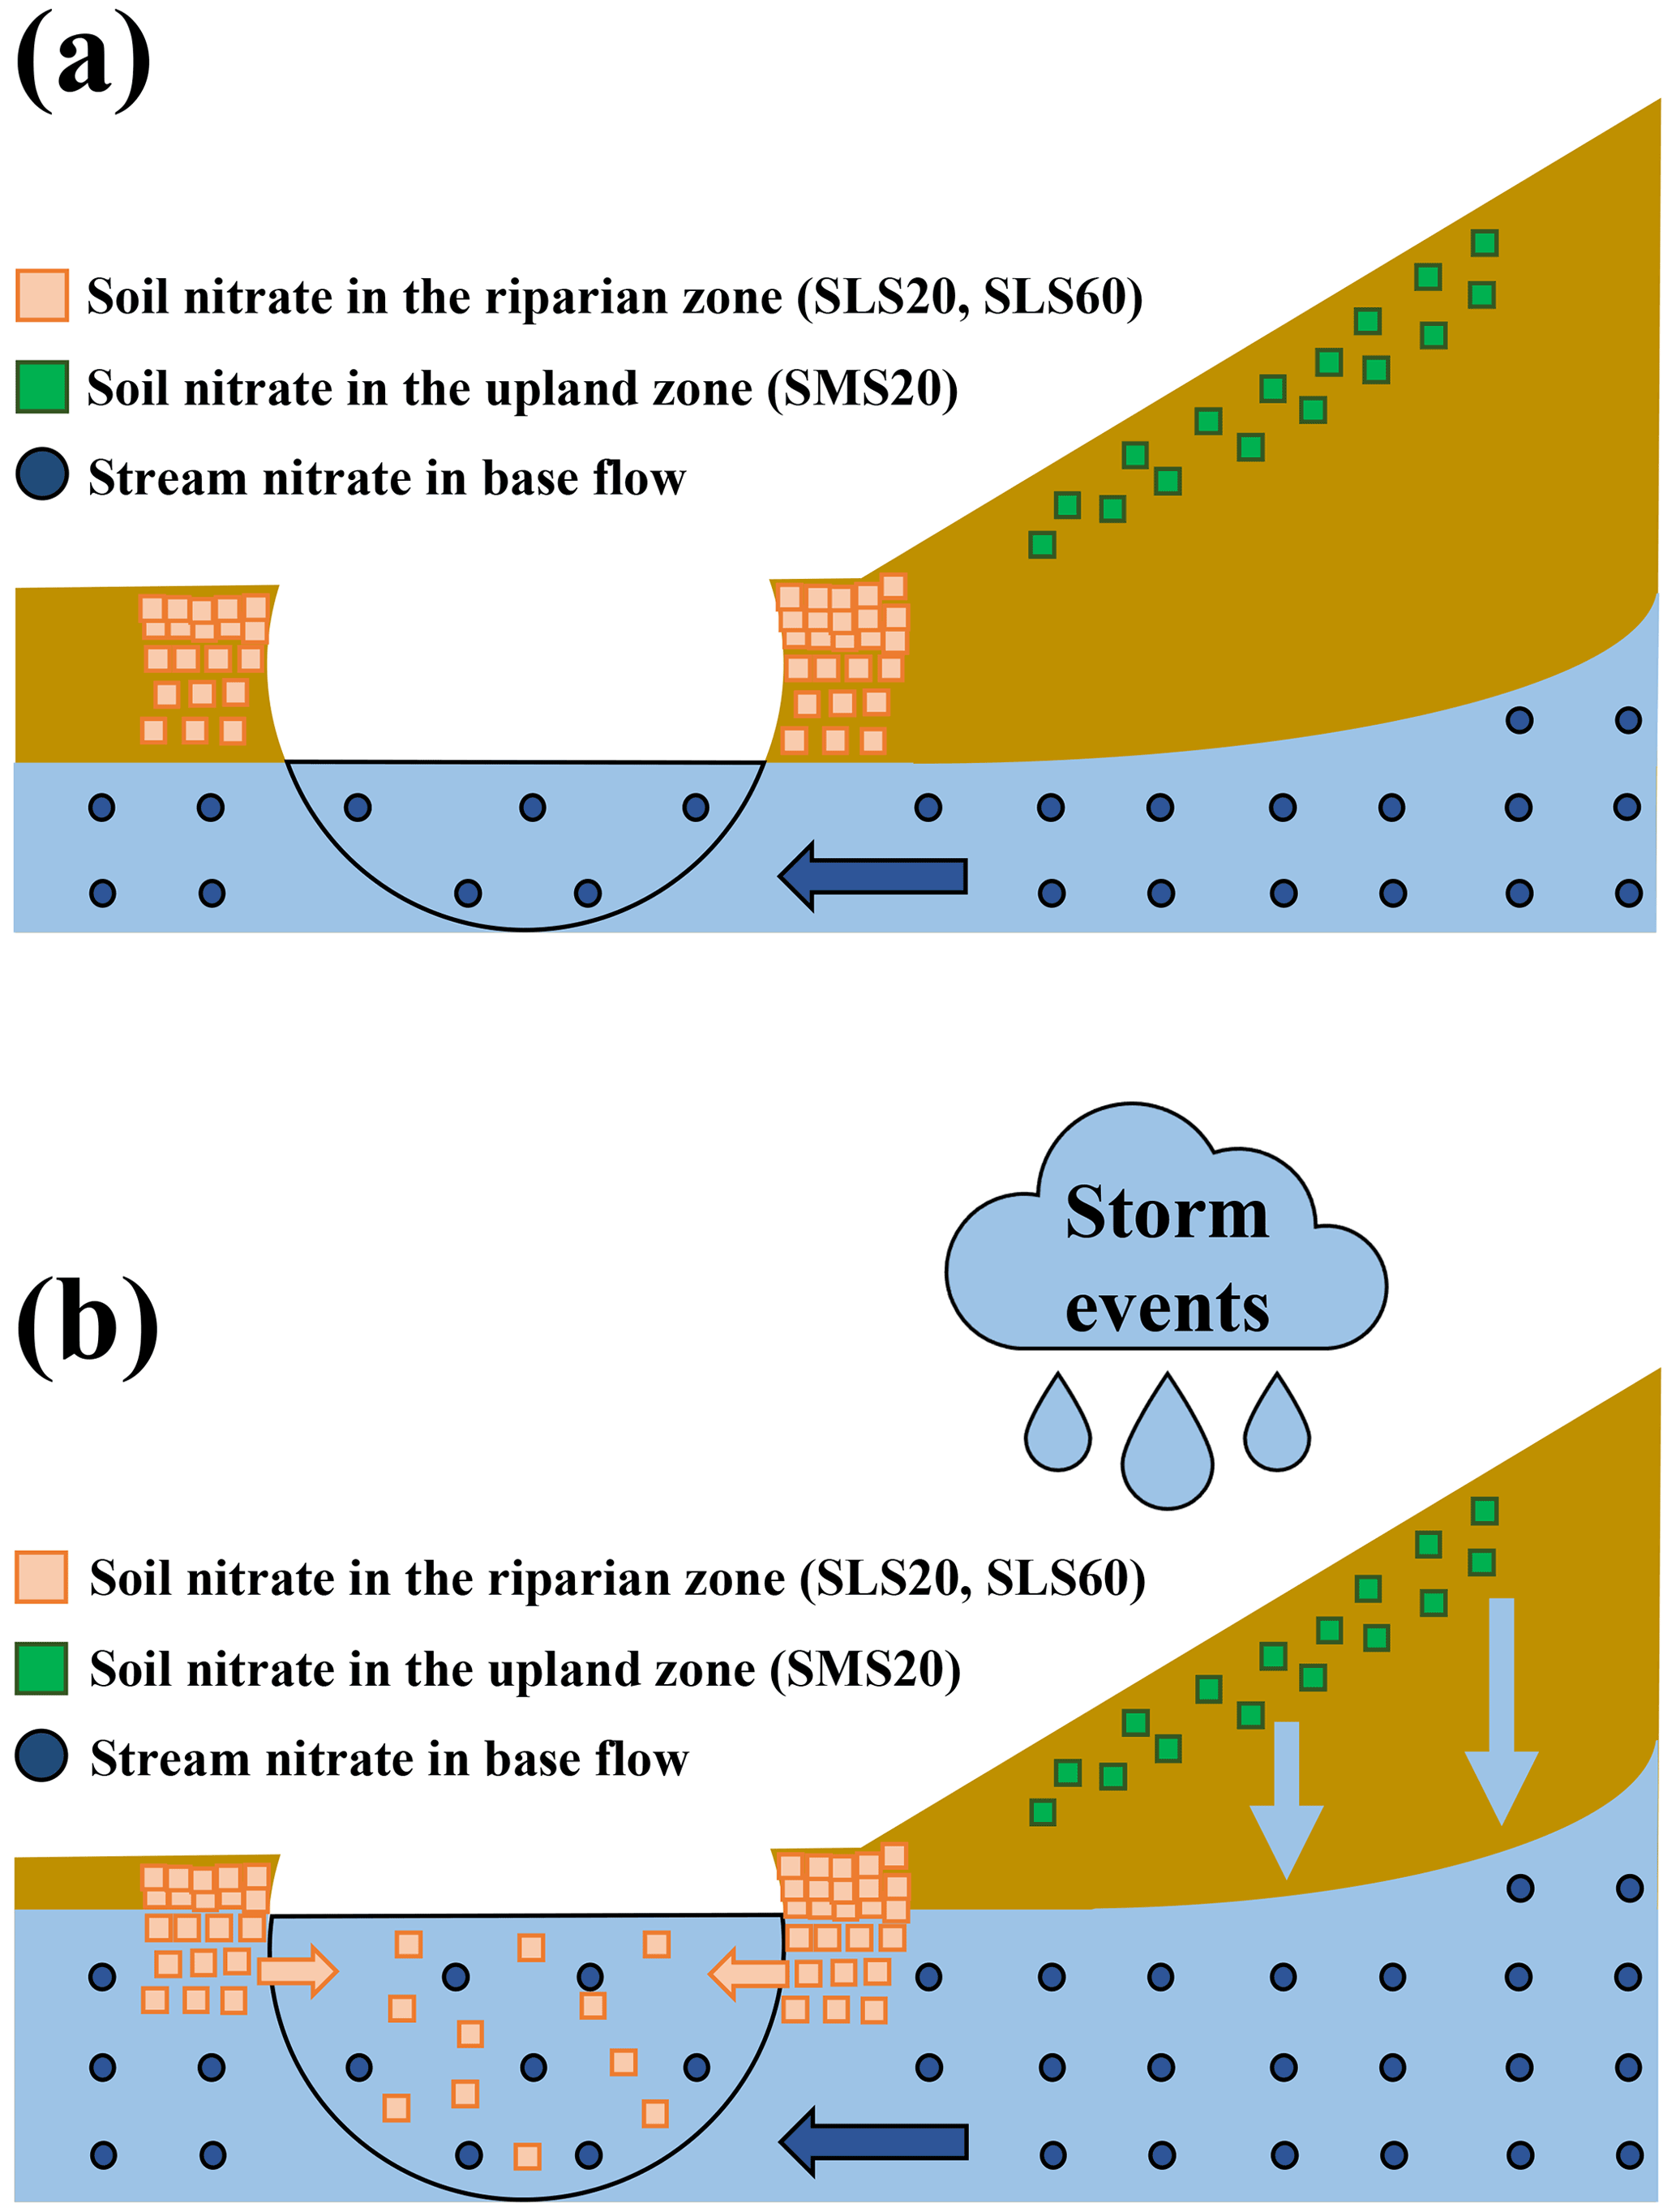
Figure 6The elution of soil nitrate to the stream before the storm events (a) and during the storm events (b). Soil nitrate in the riparian zone and that in the upland zone are represented by the orange squares and green squares, respectively, while stream nitrate during base flow is represented by the blue circles.
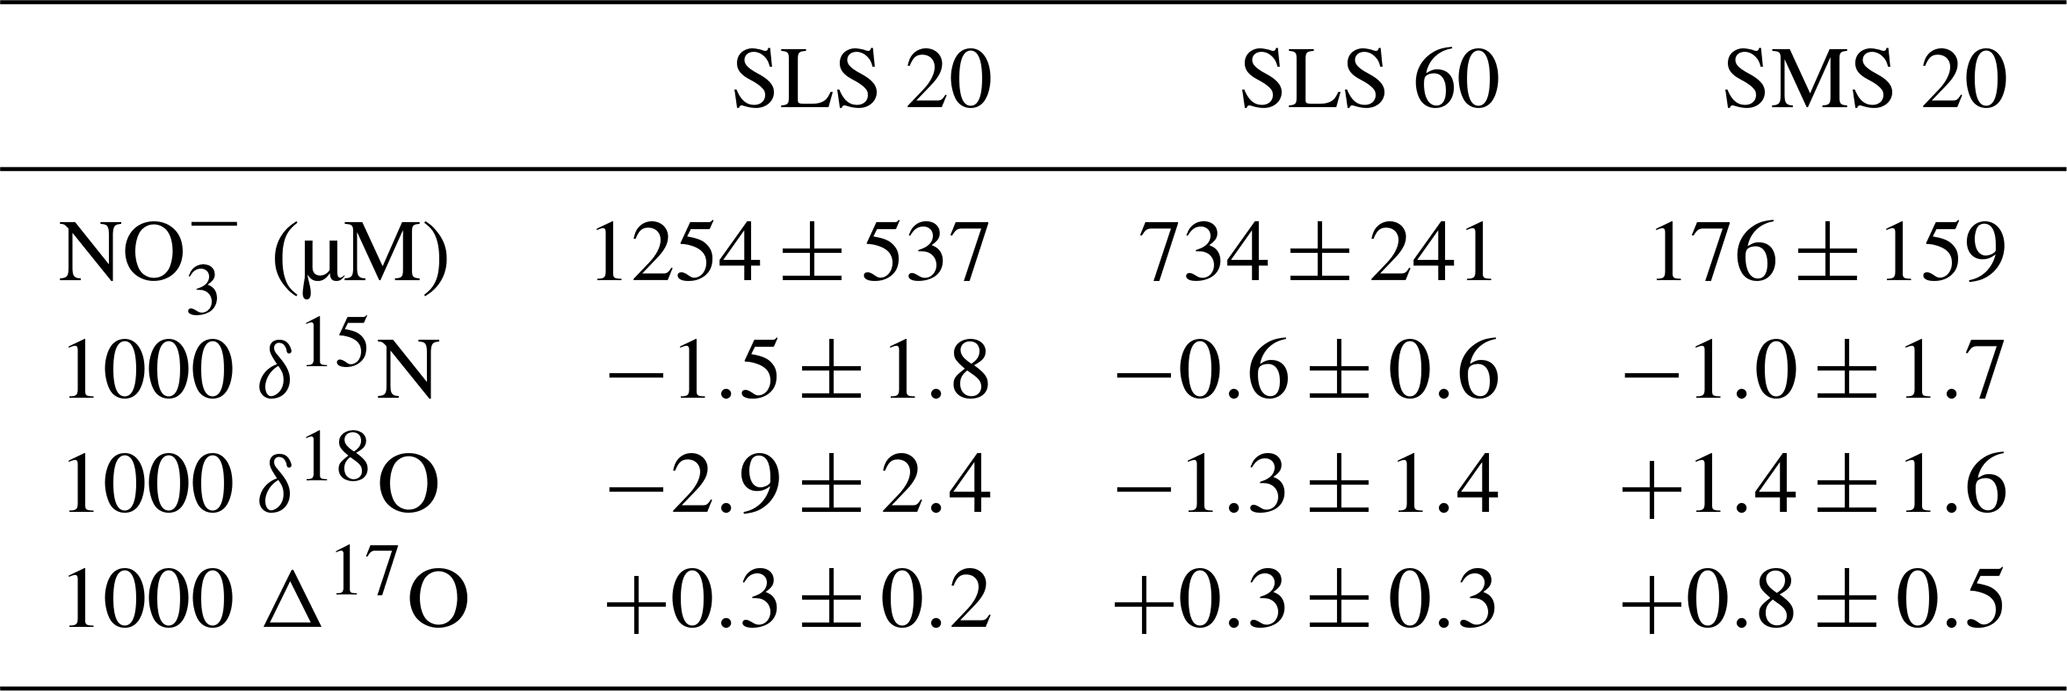
Table 2Concentrations and isotopic compositions (δ15N, δ18O, and Δ17O) of soil nitrate at SLS 20, SLS 60, and SMS 20 during August to October in 2013 and 2014 (recalculated from the data in Nakagawa et al., 2018).
4.3 Variation in the concentration of NOatm during routine observation
The concentration of NOatm ([NOatm]) showed little seasonal variation, from 1.3 to 3.8 µM during our routine observation in this study (Fig. 2e), except for the extraordinarily large [NOatm] we found on 31 January 2019 (6.5 µM). Except for the extraordinarily large [NOatm], the obtained [NOatm] corresponded well with data determined in the past study done at the same catchment (Nakagawa et al., 2018). In addition, it corresponded well with data of the temperate forested catchments saturated in nitrogen, such as Fernow experimental Forest 3 (4.2 µM; Rose et al., 2015).
In this study, accumulation of snow up to 18 cm was observed at the KJ catchment on 27 January 2019, while most of the accumulated snow had melted to a depth of 1 cm by 30 January 2019, just before the sampling on 31 January 2019. Furthermore, during the routine observation period from May 2017 to March 2020, no other snow-melting events occurred within 4 d prior to the day of sampling, except for the sampling on 31 January 2019. Similar enhancement in the concentration of NOatm, as well as the δ18O and Δ17O of stream nitrate, in response to snow melting has been frequently observed in streams worldwide (Ohte et al., 2004, 2010; Pellerin et al., 2012; Piatek et al., 2005; Rose et al., 2015; Sabo et al., 2016; Tsunogai et al., 2014, 2016).
The flow rate, concentration of stream nitrate, and Δ17O was 110.0 L min−1, 70.0 µM, and +1.17 ‰ on 28 December 2018, respectively, while 117.3 L min−1, 62.4 µM, and +2.73 ‰ on 31 January 2019, respectively (Table S1). The [NOatm] in stream water was estimated to be 3.1 µM on 28 December 2018 and 6.5 µM on 31 January 2019. Assuming that the [NOatm] in snowmelt was the same with the volume-weighted mean concentration of nitrate in rain water (41.0 µM) determined at Sado island in January (EANET, 2011, 2012; Tsunogai et al., 2016), the increase in the flow rate (ΔFsnowmelt) due to the mixing of snowmelt into the stream can be estimated to be 10.3 L min−1, by using the mass balance equation shown below:
where , , and denote the [] in stream water on 28 December 2018, 31 January 2019, and that in snowmelt water, respectively, and F28 Dec 2018, F31 Jan 2019, and ΔFsnowmelt denote the flow rate of stream water on 28 December 2018, 31 January 2019, and the increase in the flow rate due to snowmelt, respectively. Because the estimated volume of melting snow water into the stream water (10.3 L min−1) was comparable to the observed increase in the flow rate from 28 December 2018 to 31 January 2019 (7.3 L min−1), we concluded that the snow melting was responsible for the increase in Δ17O on 31 January 2019 and that the input of NOatm accumulated in the melted snow water, showing δ18O and Δ17O values significantly higher than those in the stream, caused the extraordinary increase in [NOatm] on 31 January 2019. Except for the extraordinary increase in [NOatm] (n=1), [NOatm] was stable at 2.2 ± 0.6 µM throughout the routine observation (n=33). We concluded that [NOatm] was generally stable in the stream.
4.4 The impact of storm events on the index of the nitrogen saturation
The concentration of stream nitrate eluted from a forested catchment has been used as an index to evaluate the stage of nitrogen saturation (Huang et al., 2020; Rose et al., 2015; Stoddard, 1994). However, McHale et al. (2002) pointed out the problem in the reliability of this index, because the number of storm events influenced the concentration of nitrate eluted from forested streams significantly. That is, if we use the concentration of stream nitrate sampled during the storm events to evaluate the stage of nitrogen saturation in a forested catchment, the stage of nitrogen saturation might be overestimated.
Nakagawa et al. (2018) have proposed that the export flux of NOatm (Matm) relative to the deposition flux of NOatm (Datm) can be an alternative, more robust index for nitrogen saturation in temperate forested catchments, because the ratio directly reflects the demand on atmospheric nitrate deposited onto each forested catchment as a whole, and thus reflects the nitrogen saturation in each forested catchment. To estimate reliable Matm in each forested catchment, we must obtain reliable [NOatm] in the forested stream, including their temporal variation.
As already presented in Sect. 4.2, we found that [NOatm] remained almost constant irrespective of the significant variation in [NO] during storm events (Figs. 3e, S1e, S1j). The concentrations of atmospheric nitrate ([NOatm]) in rain water were much higher than those in stream water. While the volume-weighted mean [NOatm] in rain water determined in Sado island from August to October, for example, was 15.2±8.4 µM (EANET, 2011, 2012; Tsunogai et al., 2016), that in stream water was 2.2 ± 0.6 µM in this study. As a result, the [NOatm] in stream water would increase if a significant portion of rain water were added directly into the stream water during the storm events. The [NOatm] in stream water, however, was stable showing no correlation with the amount of precipitation or the concentration of stream nitrate during the storm events (Figs. 3e, S1e, S1j). The [NOatm] remained almost constant as well during the stream event on 31 August 2018 we found through the routine observation, while [NO] increased from 35.7 µM (1 month before) to 129.3 µM (Fig. 2e). As a result, we concluded that the direct input of NOatm into the stream water was negligible even during the storm events.
The observed [NOatm] showing almost constant values implies that the primary source of NOatm in stream water during storm events was the NOatm stored in groundwater, which is the same source as that during the base flow periods, rather than the direct input of NOatm from rain water. Because direct input of NOatm into stream water was negligible during the storm events, the ratio in each forested catchment should be controlled by the metabolized processes (uptake or denitrification) in each forested catchment subsequent to deposition, so that the can correctly reflect the total demand on NOatm in each forested catchment and thus the status of nitrogen saturation. We concluded that the ration can be a more robust index to evaluate nitrogen saturation in forested catchments.
Temporal variations in the concentrations and stable isotopic compositions (δ15N, δ18O, and Δ17O) of stream nitrate were determined during storm events to clarify the source of stream nitrate increased during storm events. Because the stable isotopic compositions of soil nitrate in the riparian zone during summer agreed well with those of the nitrate-enriched endmember of the stream nitrate increased during storm events, we concluded that the soil nitrate in the riparian zone was primarily responsible for the stream nitrate increase during storm events. Additionally, the concentration of NOatm in the stream was almost constant during the storm events, implying that the source of NOatm in stream water during storm events was the NOatm stored in groundwater. We concluded that the number of storm events have little impact on the ratio, the index of nitrogen saturation. In addition, the Δ17O of nitrate can be applicable as the tracer to clarify the source of nitrate.
During the intensive observations, the stream water samples were stored in bottles of the automatic sampler. The storage periods until filtration ranged from 7 (storm event I) to 12 d (storm event III) (Table 1). While the automatic sampler was surrounded by ferns and the other understory vegetations to minimize the possible alterations of the samples, progress of biogeochemical reactions, such as nitrification, denitrification, and assimilation, could alter the concentration and isotopic compositions (δ15N, δ18O, and Δ17O) of stream nitrate during the storage period. Above all, a possible increase in soil water input into the stream water that is enriched with organic matter during a storm event could enhance nitrification during the storage period and could increase the concentration of nitrate in the stream water samples taken by using the automatic sampler. Here, we discussed the possible alteration of the concentration and isotopic compositions during the storage for the samples taken by using the automatic sampler.
Table A1Comparison of both concentration and isotopic compositions (δ15N, δ18O, and Δ17O) of stream nitrate between those taken at the beginning of intensive observations using the automatic sampler and those taken manually on the days nearby during routine observations.
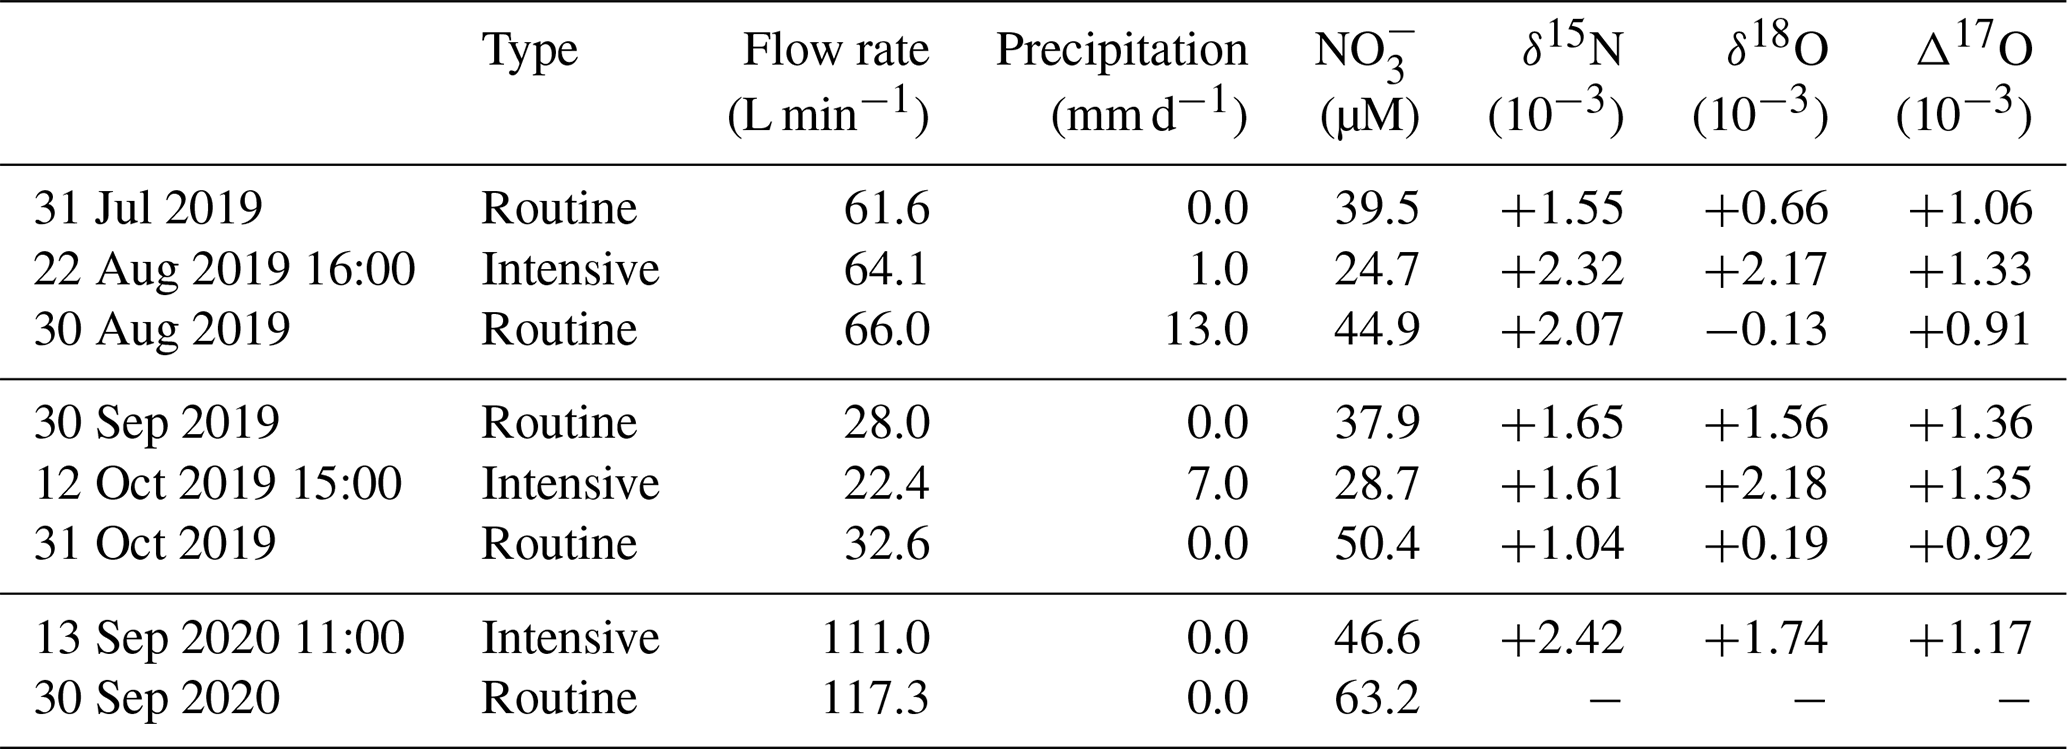
The dash indicates that no samples were taken for isotopic analysis.
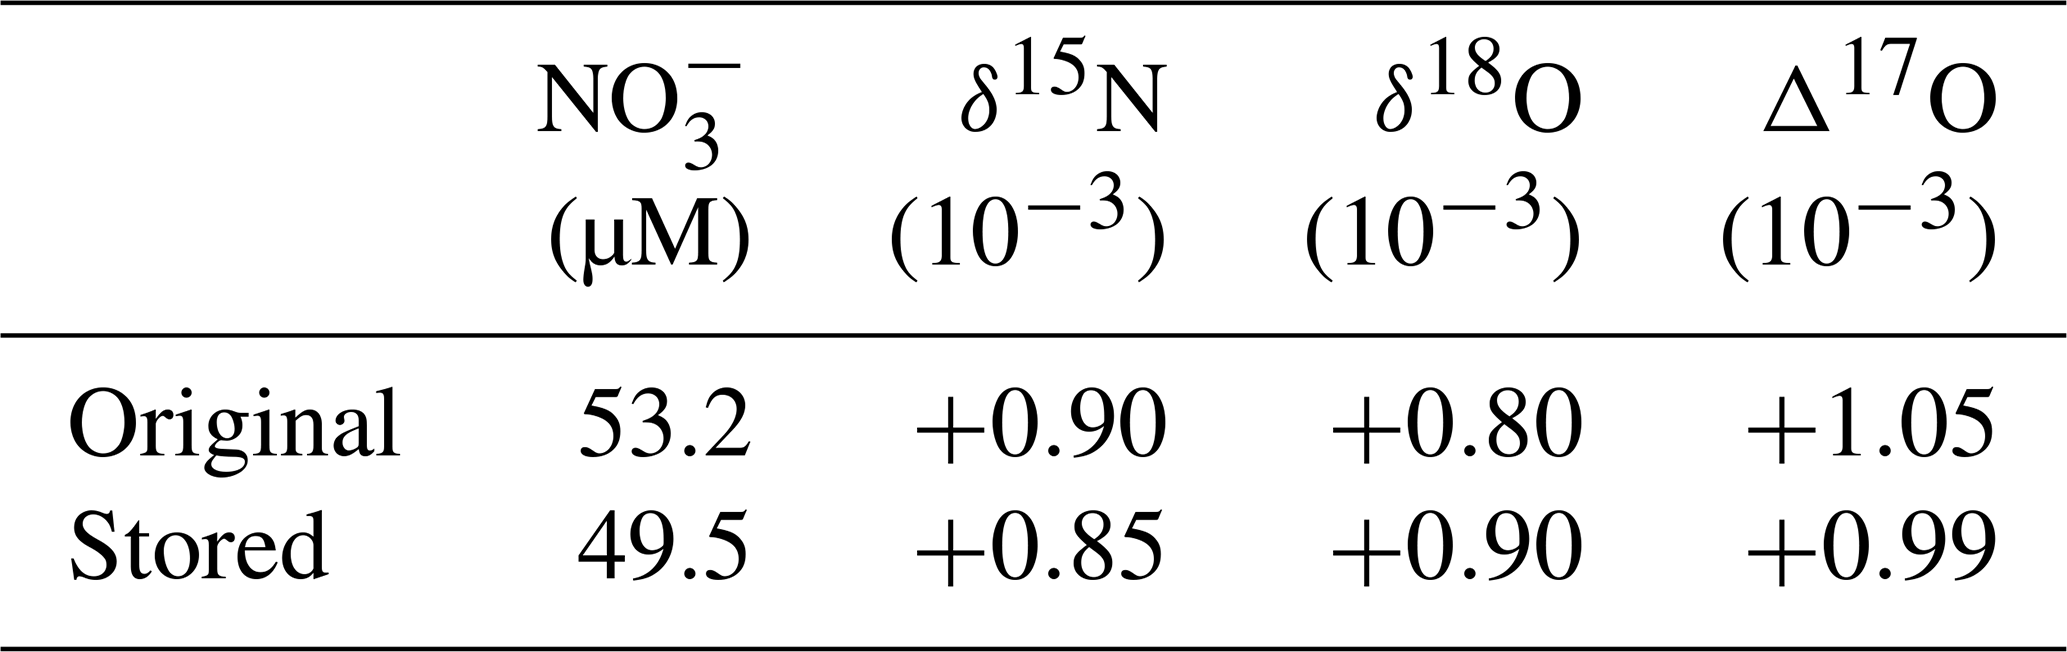
Table A2Comparison of both concentration and isotopic compositions (δ15N, δ18O, and Δ17O) between the original stream water sample and that being stored under the room temperature for 2 weeks without treatments.
First, we compared the samples taken during the intensive observations using the automatic sampler with those taken during the routine observations. During the routine observations, the stream water samples were taken manually, transported to the laboratory within 1 h of each collection, passed through a membrane filter (pore size 0.45 µm), and stored in a refrigerator (4 ∘C) until chemical analysis. As a result, alterations should be minor in the samples taken through the routine observations.
When we compared the concentrations and isotopic compositions of stream nitrate in the samples taken at the beginning of the intensive observation using the automatic sampler with those in the routine observation nearby, they coincided well with each other (Table A1), implying that at least the progress of nitrification within the bottles of the automatic sampler should be minor during the storage period because the concentration of nitrate should increase, while the Δ17O should decrease significantly during the storage period if the progress of nitrification was active in the bottles of the intensive observation.
In addition, a clear storm event was also observed during the routine observation on 31 August 2018 (Fig. 2; Table S1), so that we can compare the concentrations and isotopic compositions of stream nitrate with those of intensive observations. During the routine observation on 31 August 2018 done under a precipitation and flow rate of 48 mm d−1 and 216.9 L min−1, respectively, we observed a significant increase in the concentration of stream nitrate from 35.7 µM 1 month before to 129.3 µM (Fig. 2; Table S1). In accordance with the increase in the concentration, we found significant changes in the isotopic compositions: from +5.9 ‰ to +1.8 ‰ for δ15N, from +4.1 ‰ to −1.9 ‰ for δ18O, and from +1.5 ‰ to +0.4 ‰ for Δ17O (Fig. 2; Table S1). The trend and the degree of the variations in the concentration and the isotopic compositions on 31 August 2018 from those 1 month before were consistent with those of the intensive observation (Figs. 3, S1). As a result, we concluded that the increase in the flow rate was responsible for the observed increase in concentrations of stream nitrate during the storm events and thus the microbial production of nitrate through nitrification during the storage had little influence on the observed temporal changes in the concentrations and isotopic compositions of nitrate in the stream water samples taken by using the automatic sampler.
Kotlash and Chessman (1998) conducted storage experiments under various conditions, such as freezing, acidification, refrigeration, and room temperature, to clarify the changes in the concentrations of nitrogen compounds in stream water samples and found little change in the concentration of oxidized nitrogen (NO + NO) irrespective of the treatments. To further verify the insignificant changes in the concentrations and isotopic compositions of stream nitrate stored without treatments in the samples taken by the automatic sampler, we also conducted the storage experiments by using a 100 mL of stream water taken at the KJ forested catchment on 28 April 2022 and stored in a 100 mL polypropylene (PP) bottle without treatments. Approximately 85 mL of the stream water within the bottle was filtered using a GF/F filter paper (25 mm diameter) and stored in a refrigerator (4 ∘C) to determine the original (initial) concentration and isotopic compositions of nitrate. To simulate the stream water containing increased suspended organic matter during the storm events, the GF/F filter paper was returned to the 100 mL PP bottle which contained 15 mL of the stream water sample and left the 15 mL stream water under room temperature (18.3 ∘C) for 2 weeks together with the suspended organic matter on the filter. The concentration and isotopic compositions of the original stream nitrate (85 mL) and those being stored without filtration under room temperature for 2 weeks (15 mL) were analyzed by using the same method presented in Sect. 2.4. The concentration of nitrate in the stream water sample being stored for 2 weeks without treatments coincided well with those in the original, showing the difference in concentrations to be less than 10 % (Table A2). Besides, the differences in the isotopic compositions from the original were also negligibly small (Table A2).
As a result, we concluded that the possible alteration in the concentration and isotopic compositions of nitrate due to the progress of biogeochemical reactions, such as nitrification, denitrification, and assimilation during storage in the automatic sampler used in the intensive observations, was negligibly small.
All the primary data are presented in the Supplement. The other data are available upon request to the corresponding author (Weitian Ding).
The supplement related to this article is available online at: https://doi.org/10.5194/bg-19-3247-2022-supplement.
WD, UT, FN, and HS designed the study. HY, MM, and HS performed the field observations. HY, MM, and HS determined the concentrations of the samples. WD determined the isotopic compositions of the samples. WD, TS, FN, and UT performed data analysis, and WD and UT wrote the paper with input from MM, HY, and HS.
The contact author has declared that none of the authors has any competing interests.
Publisher’s note: Copernicus Publications remains neutral with regard to jurisdictional claims in published maps and institutional affiliations.
We thank the anonymous referees for valuable remarks on an earlier version of this paper. The samples analyzed in this study were collected through the Long-term Monitoring of Transboundary Air Pollution and Acid Deposition by the Ministry of the Environment in Japan. The authors are grateful to Ryo Shingubara, Masanori Ito, Hao Xu, Hui Lan, Peng Lai, Tianzheng Huang, Yuhei Morishita, Tae Ito, Yuka Tadachi, and other present and past members of the Biogeochemistry Group, Nagoya University, for their valuable support throughout this study. Weitian Ding thanks the “Nagoya University Interdisciplinary Frontier Fellowship” supported by JST and Nagoya University.
This work was supported by a Grant-in-Aid for Scientific Research from the Ministry of Education, Culture, Sports, Science, Technology of Japan under grant numbers JP17H00780, JP19H04254, and JP19H00955, the Yanmar Environmental Sustainability Support Association, and the River Fund of The River Foundation, Japan.
This paper was edited by Perran Cook and reviewed by two anonymous referees.
Aber, J. D., Nadelhoffer, K. J., Steudler, P., and Melillo, J. M.: Nitrogen Saturation in Northern Forest Ecosystems, Bioscience, 39, 378–386, https://doi.org/10.2307/1311067, 1989.
Aguilera, R. and Melack, J. M.: Concentration-Discharge Responses to Storm Events in Coastal California Watersheds, Water Resour. Res., 54, 407–424, https://doi.org/10.1002/2017WR021578, 2018.
Alexander, B., Hastings, M. G., Allman, D. J., Dachs, J., Thornton, J. A., and Kunasek, S. A.: Quantifying atmospheric nitrate formation pathways based on a global model of the oxygen isotopic composition (Δ17O) of atmospheric nitrate, Atmos. Chem. Phys., 9, 5043–5056, https://doi.org/10.5194/acp-9-5043-2009, 2009.
Buda, A. R. and DeWalle, D. R.: Dynamics of stream nitrate sources and flow pathways during stormflows on urban, forest and agricultural watersheds in central Pennsylvania, USA, Hydrol. Process., 23, 3292–3305, https://doi.org/10.1002/hyp.7423, 2009.
Burns, D. A. and Kendall, C.: Analysis of δ15N and δ18O to differentiate NO sources in runoff at two watersheds in the Catskill Mountains of New York, Water Resour. Res., 38, 91–912, https://doi.org/10.1029/2001wr000292, 2002.
Burns, D. A., Pellerin, B. A., Miller, M. P., Capel, P. D., Tesoriero, A. J., and Duncan, J. M.: Monitoring the riverine pulse: Applying high-frequency nitrate data to advance integrative understanding of biogeochemical and hydrological processes, WIREs Water, 6, e1348, https://doi.org/10.1002/wat2.1348, 2019.
Chen, X., Tague, C. L., Melack, J. M., and Keller, A. A.: Sensitivity of nitrate concentration-discharge patterns to soil nitrate distribution and drainage properties in the vertical dimension, Hydrol. Process., 34, 2477–2493, https://doi.org/10.1002/hyp.13742, 2020.
Christopher, S. F., Mitchell, M. J., McHale, M. R., Boyer, E. W., Burns, D. A., and Kendall, C.: Factors controlling nitrogen release from two forested catchments with contrasting hydrochemical responses, Hydrol. Process., 22, 46–62, https://doi.org/10.1002/hyp.6632, 2008.
Creed, I. F., Band, L. E., Foster, N. W., Morrison, I. K., Nicolson, J. A., Semkin, R. S., and Jeffries, D. S.: Regulation of nitrate-N release from temperate forests: A test of the N flushing hypothesis, Water Resour. Res., 32, 3337–3354, https://doi.org/10.1029/96WR02399, 1996.
Durka, W., Schulze, E., Gebauer, G., and Voerkeliust, S.: Effects of forest decline on uptake and leaching of deposited nitrate determined from 15N and 18O measurements, Nature, 372, 765–767, https://doi.org/10.1038/372765a0, 1994.
EANET: Data Report 2010, Network center for EANET (Acid Deposition Monitoring Network in East Asia), Nigata, Japan, 2011.
EANET: Data Report 2011, Network center for EANET (Acid Deposition Monitoring Network in East Asia), Nigata, Japan, 2012.
Fang, Y., Koba, K., Makabe, A., Takahashi, C., Zhu, W., Hayashi, T., Hokari, A. A., Urakawa, R., Bai, E., Houlton, B. Z., Xi, D., Zhang, S., Matsushita, K., Tu, Y., Liu, D., Zhu, F., Wang, Z., Zhou, G., Chen, D., Makita, T., Toda, H., Liu, X., Chen, Q., Zhang, D., Li, Y., and Yoh, M.: Microbial denitrification dominates nitrate losses from forest ecosystems, P. Natl. Acad. Sci. USA, 112, 1470–1474, https://doi.org/10.1073/pnas.1416776112, 2015.
Galloway, J. N., Aber, J. D., Erisman, J. W., Seitzinger, S. P., Howarth, R. W., Cowling, E. B., and Cosby, B. J.: The nitrogen cascade, Bioscience, 53, 341–356, https://doi.org/10.1641/0006-3568(2003)053[0341:TNC]2.0.CO;2, 2003.
Hattori, S., Nuñez Palma, Y., Itoh, Y., Kawasaki, M., Fujihara, Y., Takase, K., and Yoshida, N.: Isotopic evidence for seasonality of microbial internal nitrogen cycles in a temperate forested catchment with heavy snowfall, Sci. Total Environ., 690, 290–299, https://doi.org/10.1016/j.scitotenv.2019.06.507, 2019.
Hirota, A., Tsunogai, U., Komatsu, D. D., and Nakagawa, F.: Simultaneous determination of δ15N and δ18O of N2O and δ13C of CH4 in nanomolar quantities from a single water sample, Rapid Commun. Mass Sp., 24, 1085–1092, https://doi.org/10.1002/rcm.4483, 2010.
Hornberger, G. M., Bencala, K. E., and McKnight, D. M.: Hydrological controls on dissolved organic carbon during snowmelt in the Snake River near Montezuma, Colorado, Biogeochemistry, 25, 147–165, https://doi.org/10.1007/BF00024390, 1994.
Huang, S., Wang, F., Elliott, E. M., Zhu, F., Zhu, W., Koba, K., Yu, Z., Hobbie, E. A., Michalski, G., Kang, R., Wang, A., Zhu, J., Fu, S., and Fang, Y.: Multiyear Measurements on Δ17O of Stream Nitrate Indicate High Nitrate Production in a Temperate Forest, Environ. Sci. Technol., 54, 4231–4239, https://doi.org/10.1021/acs.est.9b07839, 2020.
Inamdar, S. P. and Mitchell, M. J.: Hydrologic and topographic controls on storm-event exports of dissolved organic carbon (BOC) and nitrate across catchment scales, Water Resour. Res., 42, 1–16, https://doi.org/10.1029/2005WR004212, 2006.
Inoue, T., Nakagawa, F., Shibata, H., and Tsunogai, U.: Vertical Changes in the Flux of Atmospheric Nitrate From a Forest Canopy to the Surface Soil Based on Δ17O Values, J. Geophys. Res.-Biogeo., 126, 1–18, https://doi.org/10.1029/2020JG005876, 2021.
Kaiser, J., Hastings, M. G., Houlton, B. Z., Röckmann, T., and Sigman, D. M.: Triple oxygen isotope analysis of nitrate using the denitrifier method and thermal decomposition of N2O, Anal. Chem., 79, 599–607, https://doi.org/10.1021/ac061022s, 2007.
Kamisako, M., Sase, H., Matsui, T., Suzuki, H., Takahashi, A., Oida, T., Nakata, M., Totsuka, T., and Ueda, H.: Seasonal and annual fluxes of inorganic constituents in a small catchment of a Japanese cedar forest near the sea of Japan, Water. Air. Soil Pollut., 195, 51–61, https://doi.org/10.1007/s11270-008-9726-8, 2008.
Keeling, D.: The concentration and isotopic abundances of atmospheric carbon dioxide in rural areas, Geochim. Cosmochim. Ac., 13, 322–334, https://doi.org/10.1016/0016-7037(58)90033-4, 1958.
Kendall, C., Elliott, E. M., and Wankel, S. D.: Tracing Anthropogenic Inputs of Nitrogen to Ecosystems, Stable Isot. Ecol. Environ. Sci. Second Ed., 375–449, https://doi.org/10.1002/9780470691854.ch12, 2008.
Kotlash, A. R. and Chessman, B. C.: Effects of water sample preservation and storage on nitrogen and phosphorus determinations: Implications for the use of automated sampling equipment, Water Res., 32, 3731–3737, https://doi.org/10.1016/S0043-1354(98)00145-6, 1998.
Komatsu, D. D., Ishimura, T., Nakagawa, F., and Tsunogai, U.: Determination of the , , and ratios of nitrous oxide by using continuous-flow isotope-ratio mass spectrometry Daisuke, Rapid Commun. Mass Sp., 22, 1587–1596, https://doi.org/10.1002/rcm.3493, 2008.
Konno, U., Tsunogai, U., Komatsu, D. D., Daita, S., Nakagawa, F., Tsuda, A., Matsui, T., Eum, Y.-J., and Suzuki, K.: Determination of total N2 fixation rates in the ocean taking into account both the particulate and filtrate fractions, Biogeosciences, 7, 2369–2377, https://doi.org/10.5194/bg-7-2369-2010, 2010.
McHale, M. R., McDonnell, J. J., Mitchell, M. J., and Cirmo, C. P.: A field-based study of soil water and groundwater nitrate release in an Adirondack forested watershed, Water Resour. Res., 38, 2-1–2-16, https://doi.org/10.1029/2000wr000102, 2002.
McIlvin, M. R. and Altabet, M. A.: Chemical conversion of nitrate and nitrite to nitrous oxide for nitrogen and oxygen isotopic analysis in freshwater and seawater, Anal. Chem., 77, 5589–5595, https://doi.org/10.1021/ac050528s, 2005.
Michalski, G., Scott, Z., Kabiling, M., and Thiemens, M. H.: First measurements and modeling of Δ17O in atmospheric nitrate, Geophys. Res. Lett., 30, 3–6, https://doi.org/10.1029/2003GL017015, 2003.
Michalski, G., Meixner, T., Fenn, M., Hernandez, L., Sirulnik, A., Allen, E., and Thiemens, M.: Tracing Atmospheric Nitrate Deposition in a Complex Semiarid Ecosystem Using Δ17O, Environ. Sci. Technol., 38, 2175–2181, https://doi.org/10.1021/es034980+, 2004.
Mitchell, M. J., Iwatsubo, G., Ohrui, K., and Nakagawa, Y.: Nitrogen saturation in Japanese forests: An evaluation, Forest Ecol. Manag., 97, 39–51, https://doi.org/10.1016/S0378-1127(97)00047-9, 1997.
Morin, S., Sander, R., and Savarino, J.: Simulation of the diurnal variations of the oxygen isotope anomaly (Δ17O) of reactive atmospheric species, Atmos. Chem. Phys., 11, 3653–3671, https://doi.org/10.5194/acp-11-3653-2011, 2011.
Nakagawa, F., Suzuki, A., Daita, S., Ohyama, T., Komatsu, D. D., and Tsunogai, U.: Tracing atmospheric nitrate in groundwater using triple oxygen isotopes: evaluation based on bottled drinking water, Biogeosciences, 10, 3547–3558, https://doi.org/10.5194/bg-10-3547-2013, 2013.
Nakagawa, F., Tsunogai, U., Obata, Y., Ando, K., Yamashita, N., Saito, T., Uchiyama, S., Morohashi, M., and Sase, H.: Export flux of unprocessed atmospheric nitrate from temperate forested catchments: a possible new index for nitrogen saturation, Biogeosciences, 15, 7025–7042, https://doi.org/10.5194/bg-15-7025-2018, 2018.
Nelson, D. M., Tsunogai, U., Ding, D., Ohyama, T., Komatsu, D. D., Nakagawa, F., Noguchi, I., and Yamaguchi, T.: Triple oxygen isotopes indicate urbanization affects sources of nitrate in wet and dry atmospheric deposition, Atmos. Chem. Phys., 18, 6381–6392, https://doi.org/10.5194/acp-18-6381-2018, 2018.
Ocampo, C. J., Sivapalan, M., and Oldham, C.: Hydrological connectivity of upland-riparian zones in agricultural catchments: Implications for runoff generation and nitrate transport, J. Hydrol., 331, 643–658, https://doi.org/10.1016/j.jhydrol.2006.06.010, 2006.
Ohte, N., Sebestyen, S. D., Shanley, J. B., Doctor, D. H., Kendall, C., Wankel, S. D., and Boyer, E. W.: Tracing sources of nitrate in snowmelt runoff using a high-resolution isotopic technique, Geophys. Res. Lett., 31, 2–5, https://doi.org/10.1029/2004GL020908, 2004.
Ohte, N., Tayasu, I., Kohzu, A., Yoshimizu, C., Osaka, K., Makabe, A., Koba, K., Yoshida, N., and Nagata, T.: Spatial distribution of nitrate sources of rivers in the lake Biwa Watershed, Japan: Controlling factors revealed by nitrogen and oxygen isotope values, Water Resour. Res., 46, 1–16, https://doi.org/10.1029/2009WR007871, 2010.
Paerl, H. W. and Huisman, J.: Climate change: A catalyst for global expansion of harmful cyanobacterial blooms, Env. Microbiol. Rep., 1, 27–37, https://doi.org/10.1111/j.1758-2229.2008.00004.x, 2009.
Pellerin, B. A., Saraceno, J. F., Shanley, J. B., Sebestyen, S. D., Aiken, G. R., Wollheim, W. M., and Bergamaschi, B. A.: Taking the pulse of snowmelt: In situ sensors reveal seasonal, event and diurnal patterns of nitrate and dissolved organic matter variability in an upland forest stream, Biogeochemistry, 108, 183–198, https://doi.org/10.1007/s10533-011-9589-8, 2012.
Peterjohn, W. T., Adams, M. B., and Gilliam, F. S.: Symptoms of nitrogen saturation in two central Appalachian hardwood forest ecosystems, Biogeochemistry, 35, 507–522, https://doi.org/10.1007/BF02183038, 1996.
Piatek, K. B., Mitchell, M. J., Silva, S. R., and Kendall, C.: Sources of nitrate in snowmelt discharge: Evidence from water chemistry and stable isotopes of nitrate, Water. Air. Soil Pollut., 165, 13–35, https://doi.org/10.1007/s11270-005-4641-8, 2005.
Riha, K. M., Michalski, G., Gallo, E. L., Lohse, K. A., Brooks, P. D., and Meixner, T.: High Atmospheric Nitrate Inputs and Nitrogen Turnover in Semi-arid Urban Catchments, Ecosystems, 17, 1309–1325, https://doi.org/10.1007/s10021-014-9797-x, 2014.
Rose, L. A., Elliott, E. M., and Adams, M. B.: Triple Nitrate Isotopes Indicate Differing Nitrate Source Contributions to Streams Across a Nitrogen Saturation Gradient, Ecosystems, 18, 1209–1223, https://doi.org/10.1007/s10021-015-9891-8, 2015.
Sabo, R. D., Nelson, D. M., and Eshleman, K. N.: Episodic, seasonal, and annual export of atmospheric and microbial nitrate from a temperate forest, Geophys. Res. Lett., 43, 683–691, https://doi.org/10.1002/2015GL066758, 2016.
Sase, H., Takahashi, A., Sato, M., Kobayashi, H., Nakata, M., and Totsuka, T.: Seasonal variation in the atmospheric deposition of inorganic constituents and canopy interactions in a Japanese cedar forest, Environ. Pollut., 152, 1–10, https://doi.org/10.1016/j.envpol.2007.06.023, 2008.
Sase, H., Saito, T., Takahashi, M., Morohashi, M., Yamashita, N., Inomata, Y., Ohizumi, T., and Nakata, M.: Transboundary air pollution reduction rapidly reflected in stream water chemistry in forested catchment on the Sea of Japan coast in central Japan, Atmos. Environ., 248, 118223, https://doi.org/10.1016/j.atmosenv.2021.118223, 2021.
Sebestyen, S. D., Ross, D. S., Shanley, J. B., Elliott, E. M., Kendall, C., Campbell, J. L., Dail, D. B., Fernandez, I. J., Goodale, C. L., Lawrence, G. B., Lovett, G. M., McHale, P. J., Mitchell, M. J., Nelson, S. J., Shattuck, M. D., Wickman, T. R., Barnes, R. T., Bostic, J. T., Buda, A. R., Burns, D. A., Eshleman, K. N., Finlay, J. C., Nelson, D. M., Ohte, N., Pardo, L. H., Rose, L. A., Sabo, R. D., Schiff, S. L., Spoelstra, J., and Williard, K. W. J.: Unprocessed Atmospheric Nitrate in Waters of the Northern Forest Region in the U.S. and Canada, Environ. Sci. Technol., 53, 3620–3633, https://doi.org/10.1021/acs.est.9b01276, 2019.
Stoddard, J. L.: Long-Term Changes in Watershed Retention of Nitrogen, Environmental Chemistry of Lakes and Reservoirs, 8, 223–284, https://doi.org/10.1021/ba-1994-0237.ch008, 1994.
Tsunogai, U., Komatsu, D. D., Daita, S., Kazemi, G. A., Nakagawa, F., Noguchi, I., and Zhang, J.: Tracing the fate of atmospheric nitrate deposited onto a forest ecosystem in Eastern Asia using Δ17O, Atmos. Chem. Phys., 10, 1809–1820, https://doi.org/10.5194/acp-10-1809-2010, 2010.
Tsunogai, U., Daita, S., Komatsu, D. D., Nakagawa, F., and Tanaka, A.: Quantifying nitrate dynamics in an oligotrophic lake using Δ17O, Biogeosciences, 8, 687–702, https://doi.org/10.5194/bg-8-687-2011, 2011.
Tsunogai, U., Komatsu, D. D., Ohyama, T., Suzuki, A., Nakagawa, F., Noguchi, I., Takagi, K., Nomura, M., Fukuzawa, K., and Shibata, H.: Quantifying the effects of clear-cutting and strip-cutting on nitrate dynamics in a forested watershed using triple oxygen isotopes as tracers, Biogeosciences, 11, 5411–5424, https://doi.org/10.5194/bg-11-5411-2014, 2014.
Tsunogai, U., Miyauchi, T., Ohyama, T., Komatsu, D. D., Nakagawa, F., Obata, Y., Sato, K., and Ohizumi, T.: Accurate and precise quantification of atmospheric nitrate in streams draining land of various uses by using triple oxygen isotopes as tracers, Biogeosciences, 13, 3441–3459, https://doi.org/10.5194/bg-13-3441-2016, 2016.
Tsunogai, U., Miyauchi, T., Ohyama, T., Komatsu, D. D., Ito, M., and Nakagawa, F.: Quantifying nitrate dynamics in a mesotrophic lake using triple oxygen isotopes as tracers, Limnol. Oceanogr., 63, S458–S476, https://doi.org/10.1002/lno.10775, 2018.
Vitousek, P. M. and Howarth, R. W.: Nitrogen limitation on land and in the sea: How can it occur?, Biogeochemistry, 13, 87–115, https://doi.org/10.1007/BF00002772, 1991.
Yamazaki, A., Watanabe, T., and Tsunogai, U.: Nitrogen isotopes of organic nitrogen in reef coral skeletons as a proxy of tropical nutrient dynamics, Geophys. Res. Lett., 38, 1–5, https://doi.org/10.1029/2011GL049053, 2011.
- Abstract
- Introduction
- Methods
- Results
- Discussion
- Conclusions
- Appendix A: Possible alterations to the concentration and isotopic compositions of stream nitrate during the storage period in the automatic sampler used for the intensive observations
- Data availability
- Author contributions
- Competing interests
- Disclaimer
- Acknowledgements
- Financial support
- Review statement
- References
- Supplement