the Creative Commons Attribution 4.0 License.
the Creative Commons Attribution 4.0 License.
 | 20 Jul 2022
Controls on nitrite oxidation in the upper Southern Ocean: insights from winter kinetics experiments in the Indian sector
Mhlangabezi Mdutyana
Tanya Marshall
Jessica M. Burger
Sandy J. Thomalla
Bess B. Ward
Sarah E. Fawcett
Across the Southern Ocean in winter, nitrification is the dominant mixed-layer nitrogen cycle process, with some of the nitrate produced therefrom persisting to fuel productivity during the subsequent growing season. Because this nitrate constitutes a regenerated rather than a new nutrient source to phytoplankton, it will not support the net removal of atmospheric CO2. To better understand the controls on Southern Ocean nitrification, we conducted nitrite oxidation kinetics experiments in surface waters across the western Indian sector in winter. While all experiments (seven in total) yielded a Michaelis–Menten relationship with substrate concentration, the nitrite oxidation rates only increased substantially once the nitrite concentration exceeded 115±2.3 to 245±18 nM, suggesting that nitrite-oxidizing bacteria (NOB) require a minimum (i.e., “threshold”) nitrite concentration to produce nitrate. The half-saturation constant for nitrite oxidation ranged from 134±8 to 403±24 nM, indicating a relatively high affinity of Southern Ocean NOB for nitrite, in contrast to results from culture experiments. Despite the high affinity of NOB for nitrite, its concentration rarely declines below 150 nM in the Southern Ocean's mixed layer, regardless of season. In the upper mixed layer, we measured ammonium oxidation rates that were two- to seven-fold higher than the coincident rates of nitrite oxidation, indicating that nitrite oxidation is the rate-limiting step for nitrification in the winter Southern Ocean. The decoupling of ammonium and nitrite oxidation, combined with a possible nitrite concentration threshold for NOB, may explain the non-zero nitrite that persists throughout the Southern Ocean's mixed layer year-round. Additionally, nitrite oxidation may be limited by dissolved iron, the availability of which is low across the upper Southern Ocean. Our findings have implications for understanding the controls on nitrification and ammonium and nitrite distributions, both in the Southern Ocean and elsewhere.
- Article
(2939 KB) - Full-text XML
-
Supplement
(875 KB) - BibTeX
- EndNote


The cycling of nitrogen (N) in the upper ocean is central to the role that phytoplankton and bacteria play in atmospheric carbon dioxide (CO2) consumption and production. Annually, the Southern Ocean accounts for ∼35 % of total oceanic CO2 removal (DeVries et al., 2017; Gruber et al., 2019; Watson et al., 2020) and absorbs ∼40 % of anthropogenic CO2 (Gruber et al., 2019; Hauck et al., 2015; Khatiwala et al., 2009; Watson et al., 2020). The contribution of biology to CO2 drawdown can be evaluated using the new production paradigm, among other approaches. This framework defines phytoplankton growth on nitrate (NO supplied from below the euphotic zone as “new production” and phytoplankton growth on ammonium (NH recycled within the euphotic zone as “regenerated production” (Dugdale and Goering, 1967). Over appropriate timescales, new production is equivalent to “export production”, the latter referring to the organic matter produced by phytoplankton that escapes recycling in surface waters and sinks into the ocean interior, thereby sequestering atmospheric CO2 at depth (Dugdale and Goering, 1967; Eppley and Peterson, 1979; Raven and Falkowski, 1999; Volk and Hoffert, 1985). The occurrence of nitrification in the euphotic zone, which produces regenerated NO, complicates applications of the new production paradigm since phytoplankton growth fueled by this NO will drive no net removal of CO2 (Yool et al., 2007).
In the Southern Ocean, nitrification appears to be largely confined to the dark waters below the euphotic zone during the summertime period of maximum NO consumption by phytoplankton (DiFiore et al., 2009; Mdutyana et al., 2020). By contrast, the Southern Ocean winter is characterized by elevated mixed-layer nitrification rates, coincident with low rates of NO uptake (Mdutyana et al., 2020; Smart et al., 2015). Some of the NO regenerated in the winter mixed layer will be supplied to phytoplankton during the proceeding spring and summer growing season, with negative implications for CO2 removal on an annual basis. That said, there is evidence that ammonia-oxidizing archaea, the organisms that are dominantly responsible for NH oxidation (the first step in the nitrification pathway) (Beman et al., 2008; Newell et al., 2011; Peng et al., 2016), have a high iron requirement (Shafiee et al., 2019) such that NH oxidation may at times experience iron limitation (Mdutyana et al., 2022a). If this limitation is verified and proves widespread in the environment, one implication is that the iron-depleted conditions of Southern Ocean surface waters may restrict mixed-layer nitrification and by extension decrease the extent to which phytoplankton growth is fueled by regenerated NO.
Nitrification is a chemoautotrophic process involving two pathways usually facilitated by different groups of microorganisms. The first step is NH oxidation, which involves the oxidation of NH via hydroxylamine and nitric oxide to NO (Caranto and Lancaster, 2017; Kozlowski et al., 2016; Vajrala et al., 2013; Walker et al., 2010) by ammonia-oxidizing archaea and bacteria (AOA and AOB, respectively; collectively, ammonia-oxidizing organisms, AOOs). The second step is the oxidation of NO to NO by nitrite-oxidizing bacteria (NOB), a polyphyletic group of microbes that is not well-understood in the ocean (Beman et al., 2013; Daims et al., 2016; Pachiadaki et al., 2017; Sun et al., 2021; Watson et al., 1986). In general, NO oxidation rate data are limited, with few measurements available for the Southern Ocean (Bianchi et al., 1997; Mdutyana et al., 2020; Olson, 1981a). Such measurements are critical, however, if we are to better understand the controls on nitrification in the Southern Ocean mixed layer and the connection between NO production by NOB and its subsequent removal by phytoplankton.
One approach for investigating the controls on NO oxidation is through experiments designed to yield a hyperbolic Michaelis–Menten relationship between NO oxidation rate and NO concentration. Useful kinetic parameters can be derived from this relationship, such as the maximum oxidation rate (Vmax) and the half-saturation constant (Km), with the latter indicating the NO concentration at which the oxidation rate, V, equals . Estimates of Km provide information regarding the efficiency of NOB in acquiring NO substrate, with a lower Km indicating a higher affinity for NO, while Vmax denotes the maximum rate of NO oxidation that can be achieved under a given set of conditions by a particular NOB community. In the ocean, direct measurements of NO oxidation kinetic parameters are extremely limited (Olson, 1981a; Sun et al., 2017, 2021; Zhang et al., 2020), with no estimates available for the Southern Ocean. Km values derived from culture studies of NOB range from 9 to 544 µM (Nowka et al., 2015; Ushiki et al., 2017), orders of magnitude higher than the existing estimates for natural assemblages of NOB in coastal waters and oxygen deficient zones (ranging from 0.07 to 0.51 µM; Olson, 1981a; Sun et al., 2017; Zhang et al., 2020). This discrepancy emphasizes the gaps in our understanding of NO oxidation and the organisms that catalyze it.
Generally, NO concentrations in the low-latitude oxygenated ocean reach a maximum near the base of the euphotic zone (i.e., the primary nitrite maximum, PNM), with much lower concentrations above and below this depth (Lomas and Lipschultz, 2006). By contrast, at higher latitudes including in the Southern Ocean, the NO concentrations are elevated (100–400 nM) and fairly invariant throughout the mixed layer in all seasons (Fripiat et al., 2019; Mdutyana et al., 2020; Zakem et al., 2018). A possible explanation for this NO accumulation is a decoupling of the NH and NO oxidation rates, with NO oxidation being the rate-limiting step in the nitrification pathway, contrary to expectations for oxygenated marine waters (Kendall, 1998; Vajrala et al., 2013; Walker et al., 2010). However, this idea has yet to be examined using observations.
To better understand the controls on NO oxidation (and thus nitrification) in the Southern Ocean, we conducted a series of NO oxidation kinetics experiments in wintertime surface waters across the western Indian sector. At every station (seven in total) along a transect between the subtropical and marginal ice zones, NO oxidation rates increased with increasing NO concentrations, as per the expected Michaelis–Menten relationship. The derived Km values were low and increased with increasing ambient NO. Additionally, there appeared to be a minimum NO concentration that was required before the NO oxidation rates increased significantly, implying a “threshold” NO requirement for NO oxidation in the Southern Ocean. Finally, coincident measurements of euphotic zone NH and NO oxidation rates suggest that NO oxidation is rate-limiting for nitrification across the Southern Ocean in winter.

Figure 1(a) Map of the cruise track showing the kinetics stations (large circle symbols) and locations of the underway stations sampled during Leg 1 (small symbols), overlaid on the measured surface (∼7 m) nitrite concentrations ([NO]). Additionally, the locations of the hydrocast stations occupied during Leg 2 are shown, with the stations at which depth-profile experiments were conducted indicated by the large square symbols. The colored horizontal lines denote the frontal positions at the time of sampling, and the major zones of the Southern Ocean are indicated by the vertical lines and dots: STZ, subtropical zone; STF, subtropical front; SAZ, subantarctic zone; SAF, subantarctic front; PFZ, polar frontal zone; PF, polar front; AZ, Antarctic zone; SACCF, southern Antarctic circumpolar front; MIZ, marginal ice zone. Also shown are water column (0–500 m) profiles of the concentrations of (b) nitrite (NO and (c) nitrate (NO sampled during Leg 2. The grey dots indicate the discrete sampling depths at all the hydrocast stations (eight in total), with the four stations at which depth-profile experiments were conducted (St 08 to St 11) labeled above the panel. The black dots show the derived mixed-layer depths.
2.1 Sampling site and experimental design
A winter cruise was undertaken on board the R/V SA Agulhas II in July 2017 between Cape Town, South Africa, and the marginal ice zone (MIZ; encountered at 61.7∘ S; de Jong et al., 2018), returning to South Africa along the meridional World Ocean Circulation Experiment (WOCE) I06 transect (30∘ E) (Fig. 1). Sampling was conducted on two legs – between 37 and 62∘ S on the southward leg (Leg 1) and between 59 and 41∘ S on the northward return leg along the WOCE I06 line (Leg 2). During Leg 1, only surface samples were collected, while on Leg 2, the deployment of conductivity–temperature–depth (CTD) hydrocasts allowed for depth-profile sampling.
2.1.1 Hydrography and nutrient collections
The positions of the major hydrographic fronts (the subtropical front, STF; subantarctic front, SAF; polar front, PF; and southern Antarctic circumpolar current front, SACCF; Fig. 1) were determined from temperature and salinity measured by the ship's hull-mounted thermosalinograph (∼7 m), augmented by temperature, salinity, and oxygen concentrations measured during Leg 2 by the CTD sensors (Belkin and Gordon, 1996; Orsi et al., 1995; Pollard et al., 2002; Read et al., 2002). For the hydrocast stations, the mixed-layer depth was determined for each CTD (up)cast as the depth between 10 and 400 m of maximum Brunt Väisälä frequency squared (i.e., N2) (Carvalho et al., 2017; Schofield et al., 2015). Surface photosynthetically active radiation (PAR) was not measured continuously during the cruise; we instead use latitude as a qualitative proxy for light availability during Leg 1.
2.1.2 Nutrient samples
Seawater samples were collected every 4 h from the ship's underway system (∼7 m intake) on Leg 1 for the determination of NO concentrations (Fig. 1a). During Leg 2, samples were collected from Niskin bottles fired remotely between the surface and 500 m at eight hydrocast stations for the analysis of NO, NO, and NH concentrations (see Fig. 1b and c for station locations and sampling depths). For NO and NO, unfiltered seawater was collected in duplicate 50 mL polypropylene centrifuge tubes that were analyzed on board within 24 h of collection (NO or stored frozen at −20 ∘C until analysis (NO. Seawater samples for NH were collected unfiltered in duplicate high-density polyethylene (HDPE) bottles that had been “aged” with orthophthaldialdehyde (OPA) working reagent and analyzed on board within 24 h of collection.
2.1.3 NO oxidation kinetics experiments
During Leg 1, seawater samples were collected from the surface via the ship's underway system at seven stations spanning the different zones of the Southern Ocean (the subtropical zone, STZ, to the north of the STF; at the STF, the subantarctic zone, SAZ, between the STF and SAF; the polar frontal zone, PFZ, between the SAF and PF; the open Antarctic zone, OAZ, between the PF and SACCF; and the marginal ice zone, MIZ, south of the SACCF; station (St) 01 to St 07 in Fig. 1a). At each station, 25 L of seawater were collected in a single carboy that was gently shaken to homogenize the contents before the seawater was filtered through a 200 µM nylon mesh to remove zooplankton grazers and then dispensed into 250 mL acid-washed opaque HDPE bottles. All the bottles were rinsed three times with sample water prior to filling. Eight sets of duplicate 250 mL bottles were amended with Na15NO2 to yield 15NO concentrations ranging from 10 to 1500 nM.
2.1.4 Depth distribution of NO oxidation
On Leg 2, seawater was collected at four stations (one each in the polar Antarctic zone (PAZ; just north of the edge of the MIZ), OAZ, PFZ, and SAZ; St 08 to St 11 in Fig. 1a–c) using a CTD rosette equipped with 24 12 L Niskin bottles. Seawater from six depths (10, 25, 50, 75, 200, and 500 m) was pre-filtered (200 µM nylon mesh) and transferred into rinsed 250 mL acid-washed opaque HDPE bottles. Duplicate bottles from each depth were amended with Na15NO2 to yield a final 15NO concentration of 200 nM. From all incubation bottles (for kinetics and depth-profile experiments), initial (T0) subsamples were collected in 50 mL centrifuge tubes immediately after the addition of 15NO. The opaque HDPE bottles from the upper 75 m were then incubated in custom-built on-deck incubators supplied with running surface seawater, while those from 200 and 500 m were incubated in a ∼2 ∘C cold room. The incubations lasted 23–30 h and were terminated via the collection of final (Tf) subsamples (50 mL). Subsamples were filtered (0.2 µM) and stored frozen at −20 ∘C until analysis.
2.1.5 Depth distribution of NO uptake
To assess the extent to which mixed-layer NO oxidation supports wintertime NO uptake by phytoplankton, we also conducted NO uptake experiments over the upper 75 m (the approximate depth of the euphotic zone) at St 08 to St 11 during Leg 2. Seawater was collected from four depths – 10, 25, 50, and 75 m – in duplicate 2 L clear polycarbonate bottles following filtration (200 µM nylon mesh) to remove large zooplankton grazers. Na15NO3 was added to each bottle to yield a final 15NO concentration of 3 µM, and the bottles were then transferred to custom-built deck-board incubators equipped with neutral density screens that allowed for the penetration of 55 %, 30 %, 10 %, and 1 % of surface PAR. The bottles were kept at near in situ temperature via a supply of continuously running seawater from the underway system. Samples were incubated for 3–6 h, and incubations were terminated by filtering the bottle contents through pre-combusted (450∘ C for 8 h) 0.3 µM glass fiber filters (GF-75; Sterlitech) that were subsequently enclosed in foil envelops (pre-combusted at 500∘ C for 5 h) and stored at −80∘ C until analysis.
2.2 Laboratory analyses
2.2.1 Nutrient concentrations
Samples were analyzed on board for NO concentrations using the colorimetric method of Grasshoff et al. (1983) and a Thermo Scientific Genesys 30 Visible spectrophotometer (detection limit of 20 nM, precision of ±20 nM). NO + NO concentrations were measured ashore using a Lachat Quikchem flow injection autoanalyzer (Egan, 2008) in a configuration with a detection limit of 0.2 µM and precision of ±0.3 µM. The concentration of NO was determined by subtracting NO from NO + NO. Aliquots of a certified reference material (JAMSTEC) were included in each NO and NO + NO run to ensure measurement accuracy. The NH concentrations were also determined on board using the fluorometric method of Holmes et al. (1999); the methodological details and NH data are discussed at length in Mdutyana et al. (2022a) and Smith et al. (2022).
2.2.2 NO oxidation rates
Using the denitrifier-isotope ratio mass spectrometer (IRMS) method (Sigman et al., 2001; Weigand et al., 2016), we measured the δ15N of NO (δ15N-NO produced from 15NO oxidation for both the kinetics and depth-profile experiments (δ15N, in ‰ versus air, = () ×1000). Samples were measured using a Delta V Plus IRMS with a custom-built purge-and-trap front end (Weigand et al., 2016) in a configuration with a detection limit of 0.2 nmol of N and a δ15N precision of 0.2 ‰. Prior to isotope analysis, samples were treated with sulfamic acid (15 mM) to remove 15NO remaining at the end of the experiments, after which sample pH was adjusted to ∼7–8 via the addition of 2 M NaOH. To account for inefficiencies in 15NO removal, both the Tf and T0 samples were treated with sulfamic acid prior to analysis of δ15N-NO, with the difference between them taken as the 15NO enrichment due to 15NO oxidation (Peng et al., 2015). International reference materials (IAEA-N3, USGS 34, USGS 32) were used to calibrate the measured δ15N-NO.
The rate of NO oxidation (NO; nM d−1) was calculated following Peng et al. (2015) as
where Δ[15NO] is the change in the concentration of 15NO between the start and end of the incubation due to NO oxidation, calculated from the difference in the measured δ15N-NO between the Tf and T0 samples, is the fraction of the NO substrate pool labeled with 15N at the start of the incubation, calculated following the direct measurement of ambient NO concentration, and T is the incubation length (days). Detection limits for NO rates ranged from 0.11 to 0.36 nM d−1, calculated according to Santoro et al. (2013) and Mdutyana et al. (2020).
2.2.3 Kinetic model
Kinetic parameters are typically calculated using the Michaelis–Menten (MM) equation for enzyme kinetics (Monod, 1942):
where V is the measured reaction rate, Vmax is the maximum reaction rate achievable under in situ conditions at saturating substrate (S) concentrations, and Km is the half-saturation constant, defined as the substrate concentration at which .
The MM equation (Eq. 2) is a rectangular hyperbola, meaning that the asymptotes along the x and y axes are perpendicular. By definition, when S (the x-axis variable) is equal to zero, V (the y-axis variable) is also zero, forcing the model through the origin (0,0). In the case of NO oxidation, the assumption that once S>0, V>0 is appropriate in waters where the ambient NO concentration is near-zero or where NO is non-zero but considerably lower than the Km. In the Southern Ocean, mixed-layer NO concentrations are typically ≥150 nM (Cavagna et al., 2015; Zakem et al., 2018; Fripiat et al., 2019; Mdutyana et al., 2020), and forcing the MM model through the origin results in a poor fit to the measurements (red line in Fig. S1 in the Supplement). This poor fit, in turn, leads to clearly inaccurate estimates of the kinetic parameters, particularly Km (Table S1 in the Supplement).
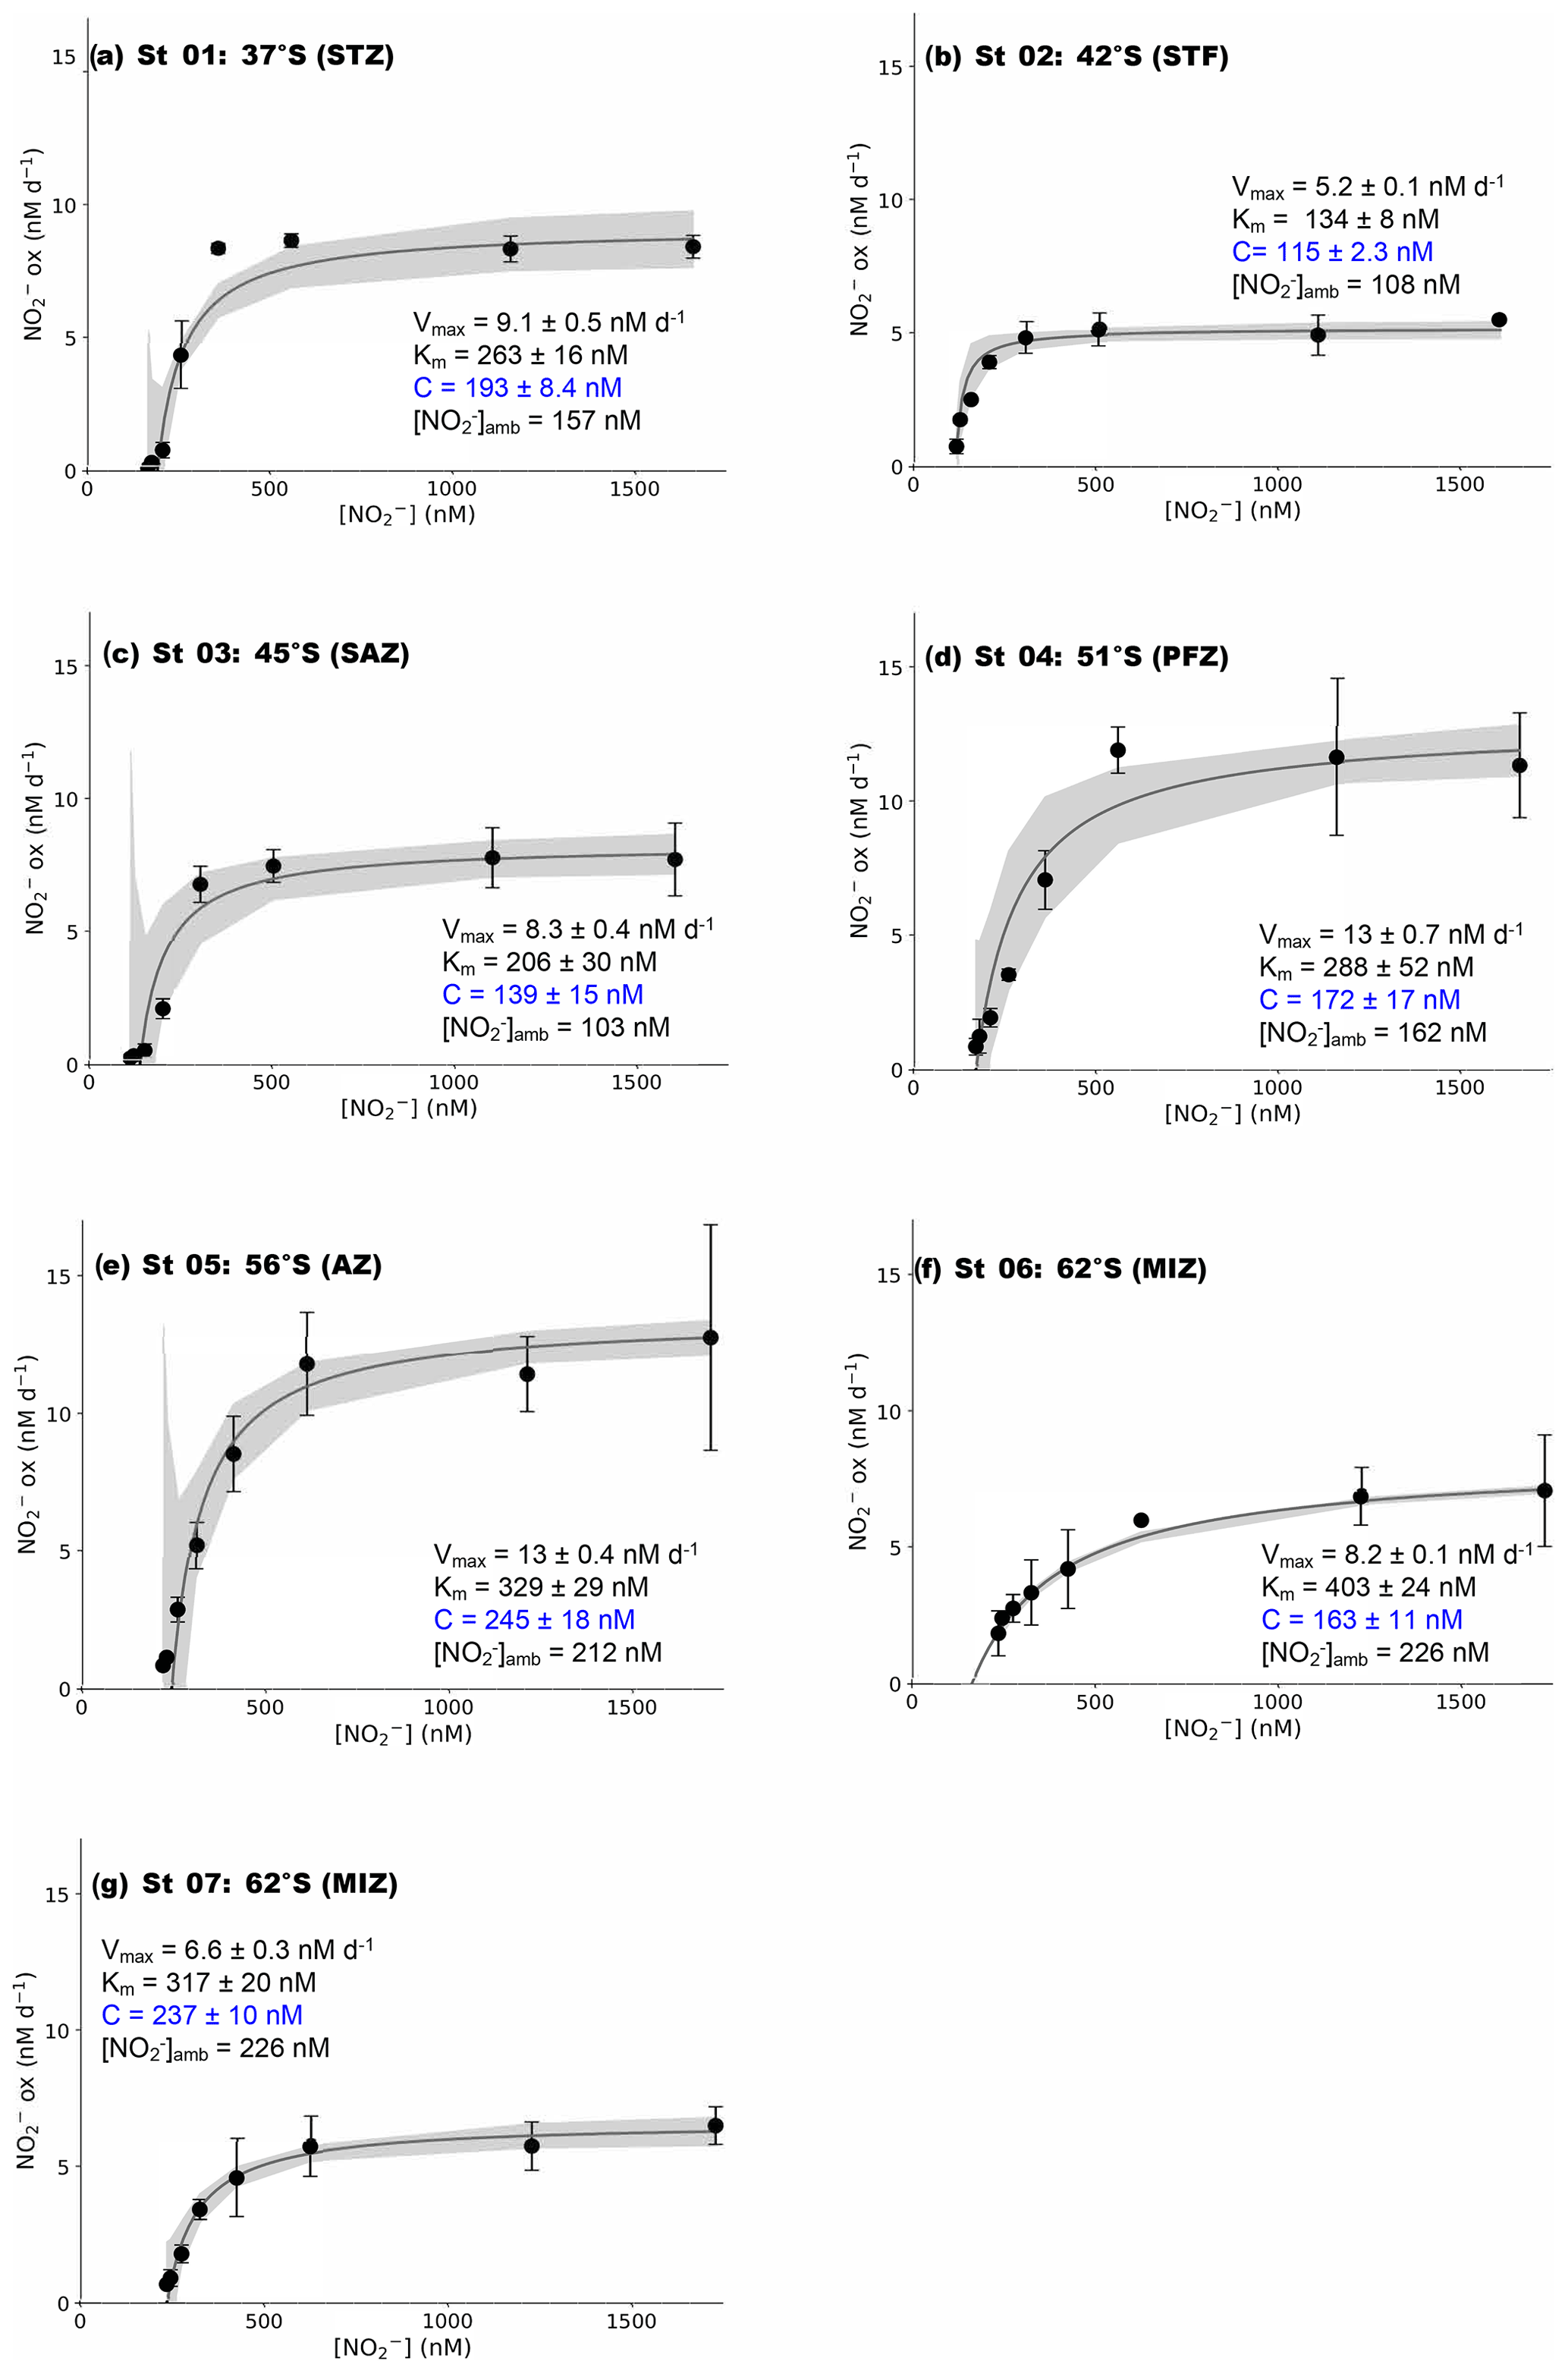
Figure 2Kinetics experiments: the dependence of the NO oxidation rates on NO concentration ([NO]) at the surface (∼7 m) in winter at (a) St 01, 37∘ S (STZ), (b) St 02, 42∘ S (STF), (c) St 03, 45∘ S (SAZ), (d) St 04, 51∘ S (PFZ), (e) St 05, 55∘ S (OAZ), (f) St 06, 62∘ S (MIZ), and (g) St 07, 62∘ S (MIZ). The solid lines show the Michaelis–Menten best fit, with the derived values of Vmax, Km, and C, as well as the ambient concentration of nitrite ([NO]amb), indicated in each panel. Error bars represent the range of measured values. Where errors bars are not visible, they are smaller than the data markers. The grey shaded area shows the 95 % confidence interval associated with the model fit. Note that the x axis represents total [NO] (i.e., [15NO]tracer + [NO]amb).
While not typical for studies of NO oxidation kinetics in the ocean, the standard form of nonlinear regression models, including the MM equation, can be modified to better fit the observations (e.g., Archontoulis and Miguez, 2014; Birch, 1999; Tsoularis and Wallace, 2002). For application to our dataset, we modified Eq. (2) to allow V=0 at S>0 by subtracting a location parameter, C, from S (Fig. 2) (Archontoulis and Miguez, 2014). In other words, we set the y intercept (i.e., where V=0) equal to C rather than to zero, which yields Eq. (3):
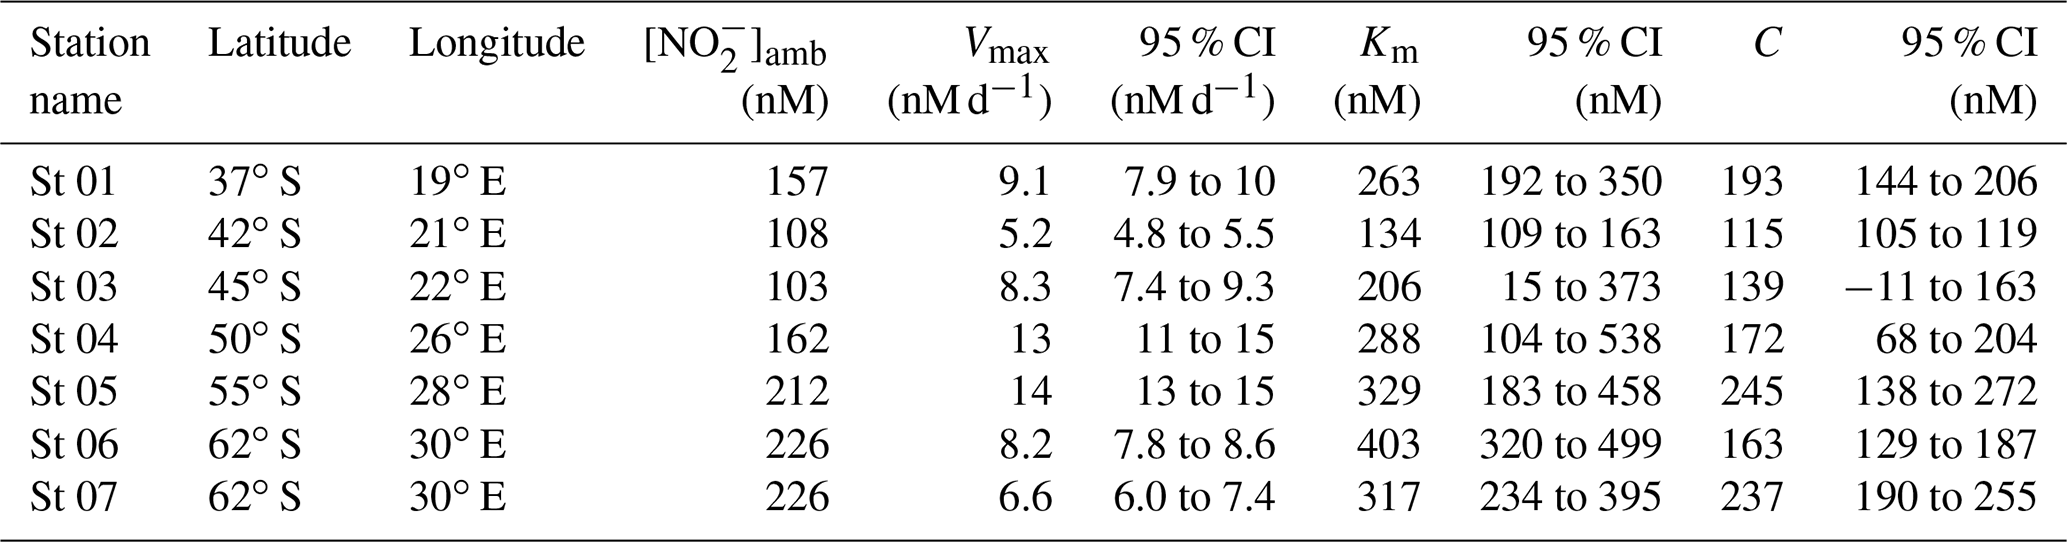
Using a nonlinear, least-squares optimization method (SciPy lmfit package, Python 3.7.6), we solved Eq. (3) for Vmax, , and C. The value of derived in this way is relative to C such that the substrate concentration at which (i.e., Km) is actually equal to (Supplement). Mechanistically, C represents a “threshold” substrate concentration; when S≤C, V=0. Hereafter, all derived kinetic parameters are reported as the best fit plus 95 % confidence interval (i.e., mean ±2σ; Table 1).
Table 1Kinetic parameters (Vmax, Km, and C) associated with NO oxidation experiments conducted across the western Indian sector of the Southern Ocean in winter 2017. Included here are the best fit and 95 % confidence interval (CI) for each kinetic parameter, derived using a nonlinear, least-squares optimization method (SciPy lmfit package, Python 3.7.6).
2.2.4 Revising the depth distribution of NO oxidation using Km
For the NO oxidation experiments conducted at the Leg 2 hydrocast stations (i.e., depth-profile experiments; St 08 to St 11), the Na15NO2 was added to yield a final 15NO concentration of 200 nM at all the sampled depths. However, at low ambient NO concentrations (<1–2 µM), an amendment of this magnitude may stimulate NO oxidation, leading to an overestimation of the in situ rates. We thus revised the measured NO rates using our derived Km values as per Rees et al. (1999), Diaz and Raimbault (2000), and Horak et al. (2013):
Here, corrNO is the revised rate of NO, NO is the measured NO oxidation rate (Eq. 1), [NO]amb is the ambient NO concentration measured at each depth, [NO]total refers to the concentration of 15NO tracer plus NO, and Km is the derived half-saturation constant. We estimated a Km for each sample depth from the equation resulting from the linear regression of all derived Km values on [NO]amb (see Sect. 4.2 below). We also computed corrNO using the Km derived from the Leg 1 kinetics experiment located nearest each hydrocast station, which yielded very similar results. The values of corrNO presented here were computed using the Km values derived from the linear regression equation. Rates of NH oxidation measured coincident with NO on Leg 2 (see Mdutyana et al., 2022a) were similarly revised (to yield corrNH) using the Km values derived from kinetics experiments conducted during Leg 1 of the cruise: for St 08 and St 09, Km=137 nM; for St 10, Km=67 nM; and for St 11, Km=28 nM.
2.2.5 Isotopic dilution of 15NO by co-occurring NH oxidation
The focus of this study is the second step in the nitrification pathway. However, not only will NO have been consumed in our incubation bottles (i.e., oxidized to NO, but it will also have been produced by NH oxidation, the first step in the nitrification pathway. For all of our NO oxidation rate experiments (kinetics and depth profile), we measured the coincident rates of NH oxidation (Mdutyana et al., 2022a), and these data can be used to account for any dilution of the 15NO pool by 14NO produced from 14NH oxidation (following the approach of Glibert et al., 1982, 1985, and Mulholland and Bernhardt, 2005). We found that isotopic dilution in the mixed layer was minor because the ambient NO concentrations were reasonably high (mean of 157±54 nM, range of 64 to 226 nM for all the depths at which experiments were conducted; Fig. 1a–b), and the NH oxidation rates were fairly low (mean of 13.4±4.0 nM d−1, range of 7.8 to 22.0 nM d−1; see Fig. 3f–j for the depth-profile rates and Mdutyana et al., 2022a, for the kinetic station rates). Below the mixed layer where the ambient NO concentrations were near-zero, so too were the NH oxidation rates, which again resulted in minimal dilution of the 15NO pool. Accounting for isotope dilution increased the NO oxidation rates by 0 % to 12 % (mean of 3.9±0.3 % and median of 3.7±0.3 %), which is within the experimental error associated with the rate measurements; we thus consider the effect of isotope dilution to be negligible
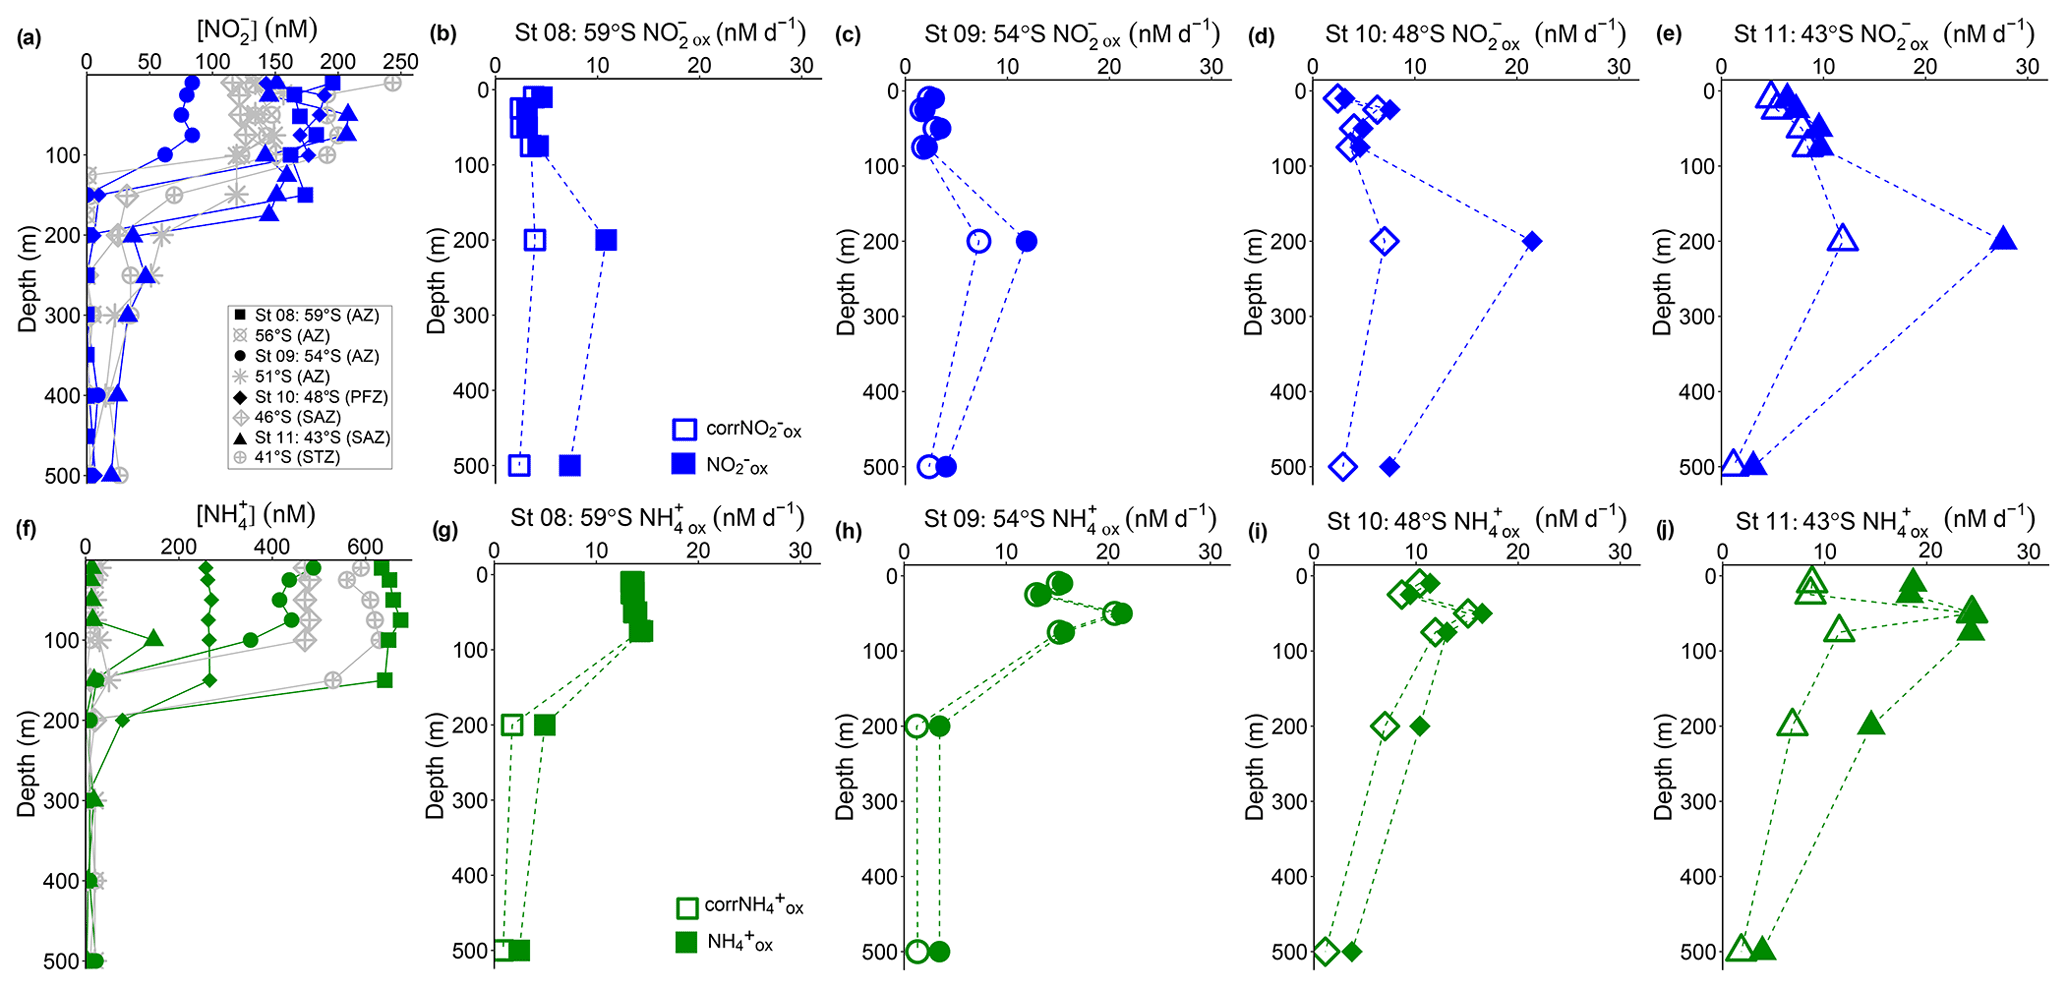
Figure 3Depth-profile experiments: water column (0–500 m) profiles of the concentration of (a) nitrite ([NO]) and (f) ammonium ([NH]), and rates of NO and NH oxidation at (b, g) St 08, 59∘ S (AZ), (c, h) St 09, 54∘ S (AZ), (d, i) St 10, 48∘ S (PFZ), and (e, j) St 11, 43∘ S (SAZ). In (a, f), the blue and green symbols indicate the stations at which oxidation rates were measured, while the grey symbols show data from the stations where no experiments were conducted. In (b–e) and (g–j), open symbols show the oxidation rates revised for possible stimulation due to 15N-tracer additions (corrNO and corrNH; Eq. 4), and closed symbols show the uncorrected rates (Eq. 1). Error bars indicate the range of measured values. Where error bars are not visible, they are smaller than the data markers. The dashed lines connecting the data points are included only to guide the eye and should not be taken to imply interpolation with depth.
2.2.6 Nitrate uptake rates
On shore, the GF-75 filters were oven-dried at 45∘ C for 24 h, then pelletized into tin cups following the removal of unused peripheral filter. The concentration and isotopic composition of the particulate organic N (PON) captured on the filters was analyzed using a Delta V Plus IRMS coupled to a Flash 2000 elemental analyzer, with a detection limit of 1 µg N and precision of ±0.005 At %. Blanks (combusted unused filters + tin capsules) and laboratory running standards calibrated to international reference materials were run after every 5 to 10 samples. The absolute rates of NO uptake (ρNO; nM d−1) were calculated after blank correction according to the equations of Dugdale and Wilkerson (1986) assuming a day-length of between 7 and 10 h, depending on the station latitude. To compute the fraction of the mixed-layer NO pool consumed by phytoplankton that derived from in situ nitrification, we trapezoidally integrated ρNO and corrNO over the mixed layer following Mdutyana et al. (2020), and then divided the integrated values of corrNO by ρNO.
3.1 Hydrography and nutrient concentrations
The positions of the major hydrographic fronts during both legs of the cruise are shown in Fig. 1a. At the hydrocast stations (Leg 2), the mixed-layer depth (MLD) averaged 143 m in the OAZ, 146 m in the PFZ, 205 m in the SAZ, and 113 m in the STZ, which is within the reported climatological range for the western Indian sector of the Southern Ocean in winter (Sallée et al., 2010). Underway ambient NO concentrations (Leg 1) ranged from 74 to 232 nM (transect average of 168±48 nM, median of 177 nM) and generally increased with latitude, albeit with a high degree of variability (Figs. 1a, S2). The ambient NO concentrations at the hydrocast stations were fairly constant throughout the mixed layer (ranging from 55±35 to 159±73 nM), decreasing rapidly to values below detection by 150–200 m (Fig. 1b). Mixed-layer NO showed no clear latitudinal trend mainly because of the anomalously low concentrations measured at St 09 (54∘ S; mixed-layer average of 64±30 nM, compared to 144±56 nM for the seven other hydrocast stations). The NO concentrations were also near-homogenous throughout the mixed layer, decreasing from an average of 28.4±0.2 µM at the southernmost station (St 08; 59∘ S) to 3.7±1.1 µM at the northernmost station (41∘ S) and increasing below the mixed layer as expected (Fig. 1c).
3.2 NO oxidation rates
3.2.1 Kinetics experiments
At all the kinetic stations (St 01 to St 07; Leg 1), an MM curve could be fit to the NO oxidation rate versus substrate concentration measurements using Eq. (3) (Fig. 2). The derived kinetic parameters varied across the transect (Table 1). The maximum NO oxidation rate (Vmax) increased southwards from 5.2±0.1 nM d−1 at the STF (St 02; Fig. 2b) to 13±0.4 nM d−1 in the AZ (St 05; Fig. 2e), before decreasing in the MIZ to 8.2±0.1 nM d−1 at St 06 (Fig. 2f) and 6.6±0.3 nM at St 07 (Fig. 2g). The average Vmax for the transect was 9.0±1.1 nM d−1. The half-saturation constant (Km) increased from 134±8.0 nM at the STF (St 02) to 403±24 nM in the MIZ (St 06), with a transect average of 277±31 nM. The value of C showed a positive relationship with [NO]amb (R2=0.59, p=0.045) and no strong relationship with latitude, and it ranged from 115±2.3 nM at the STF (St 02) to 245±18 nM in the AZ (St 05), with a transect average of 181±45 nM.
3.2.2 Depth-profile experiments
NO oxidation rates at St 08 to St 11, calculated using Eq. (1), were low and largely invariant over the upper 75 m, ranging from 1.9 to 9.7 nM d−1 (average of 4.9±2.4 nM d−1; filled symbols in Fig. 3b–e). All stations showed a maximum NO oxidation rate at 200 m (roughly coincident with or just below the MLD), ranging between 11 and 28 nM d−1 (average of 18±7.0 nM d−1). The NO oxidation rates showed a latitudinal gradient, with lower rates in the AZ (St 08 and St 09) than in the PFZ (St 10) and SAZ (St 11).
Revising the NO oxidation rates using Eq. (4) decreased their 0–75 m values by 13 % to 26 % (i.e., corrNO ranged from 1.6 to 8.5 nM d−1 and averaged 4.0±2.0 nM d−1 over the upper 75 m; open symbols in Fig. 3b–e). The largest decrease (of 39 % to 68 %) occurred at 200 and 500 m, coinciding with the very low ambient NO concentrations (Fig. 3a). Nonetheless, at all but St 08, the maximum NO oxidation rate was still observed at 200 m, although its magnitude was lower. The coincidentally measured and revised NH oxidation rates (corrNH) showed a similar pattern, with the largest decrease occurring at the depths with the lowest ambient NH concentrations (Fig. 3f–j) – over the upper 75 m, the rates decreased by 1 % to 9 % at St 08 to St 10 where the mixed-layer NH concentrations averaged 263±4.3 to 655±15 nM, while at St 11 where the mixed-layer NH concentration averaged 13±1.6 nM, the rates decreased by 40±23 %. Similar to the NO oxidation rates, the NH oxidation rates decreased most at 200 and 500 m, by between 33 % and 70 %. Hereafter, we use the revised NO and NH oxidation rates (corrNO and corrNH, respectively) when referring to the depth distributions of these processes, including in Figs. 5 and 6. We note, however, that the revised rates may still not be accurate since Km was not derived separately for each depth at each station (Horak et al., 2013). Nonetheless, because of the high concentration of the 15N-tracer amendments relative to all derived Km values, we are confident that the revised rates are more representative of in situ conditions than the rates computed using Eq. (1).
3.3 NO uptake rates
The rates of NO uptake (ρNO were low and relatively homogenous over the upper 75 m at each station (Fig. S3a). Average euphotic zone ρNO increased northwards, from 2.9±1.1 nM d−1 at St 08 in the AZ to 12±2.0 nM d−1 at St 11 in the SAZ, with a transect average of 6.2±3.4 nM d−1. The euphotic zone PON concentrations also increased northwards, from 0.24±0.02 µM at St 08 to 0.47±0.08 µM at St 11 (Fig. S3b). Integrated over the mixed layer, corrNO accounted for an average of 122 % of ρNO (range of 63 % at St 09 to 237 % at St 08; Table S2), consistent with previous observations from the wintertime Southern Ocean (Mdutyana et al., 2020).
Across all the major zones of the wintertime Southern Ocean, the addition of NO to samples of surface seawater stimulated NO oxidation following a Michaelis–Menten relationship, suggesting that substrate availability plays a dominant role in determining the rate of NO production in the Southern Ocean's winter mixed layer. Curiously, however, we also observed an apparent minimum substrate requirement of NO oxidation (i.e., a “threshold” NO concentration, ranging from 115 to 245 nM), which contradicts expectations for a “classical” Michaelis–Menten relationship (i.e., V is expected to increase as soon as S>0, assuming S is limiting to V; Monod, 1942). Below, we examine our findings in the context of existing estimates of NO oxidation kinetic parameters and then evaluate the potential drivers of the trends that we observe. We also discuss possible reasons for the apparent requirement of Southern Ocean NOB for a threshold ambient NO concentration and consider the implications thereof for the regional N cycle.
4.1 Southern Ocean NO oxidation kinetic parameters in the context of existing estimates
Measurements of NO oxidation rates are limited in the Southern Ocean, with only two studies that have directly measured this pathway in open ocean waters (Bianchi et al., 1997; Mdutyana et al., 2020). For NO oxidation kinetics, there are no data at all for the Southern Ocean. This scarcity of measurements is unsurprising given that in situ NO oxidation kinetics studies are generally limited; indeed, to our knowledge, there are only two studies from the coastal ocean (Olson, 1981a; Zhang et al., 2020) and two from the eastern tropical North Pacific oxygen deficient zone (ETNP ODZ; with these experiments conducted across a range of ambient oxygen concentrations; Sun et al., 2017, 2021). By contrast, there exist numerous estimates of NO oxidation kinetic parameters determined using cultured marine NOB (e.g., Jacob et al., 2017; Kits et al., 2017; Nowka et al., 2015; Sorokin et al., 2012; Zhang et al., 2020). In general, culture experiments suggest far higher kinetic constants compared to the limited in situ observations from the ocean, particularly for Km (i.e., culture-based Km estimates of 9–544 µM; Blackburne et al., 2007; Nowka et al., 2015; Ushiki et al., 2017).
Table 2A selection of previously derived Km and Vmax values from the open ocean, along with the concurrently measured ambient concentrations of nitrite ([NO]amb). The numbers in parenthesis are standard errors.
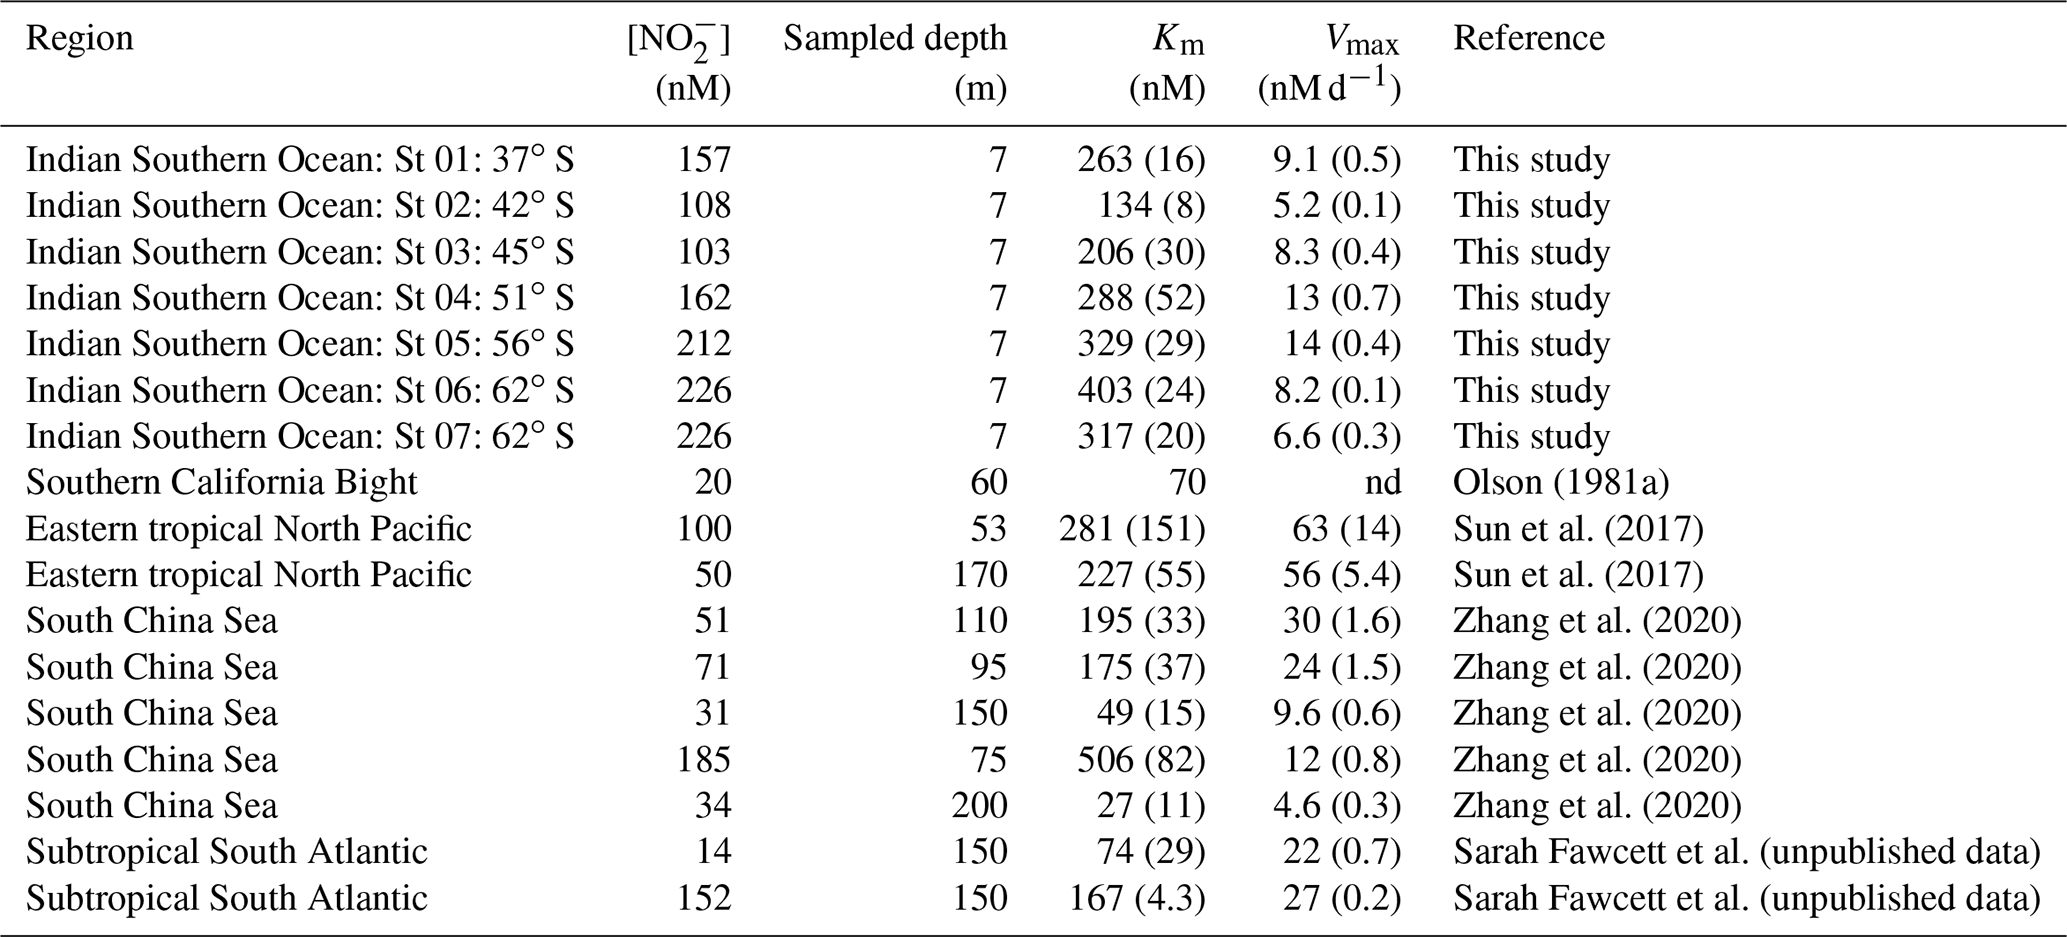
nd: not determined.
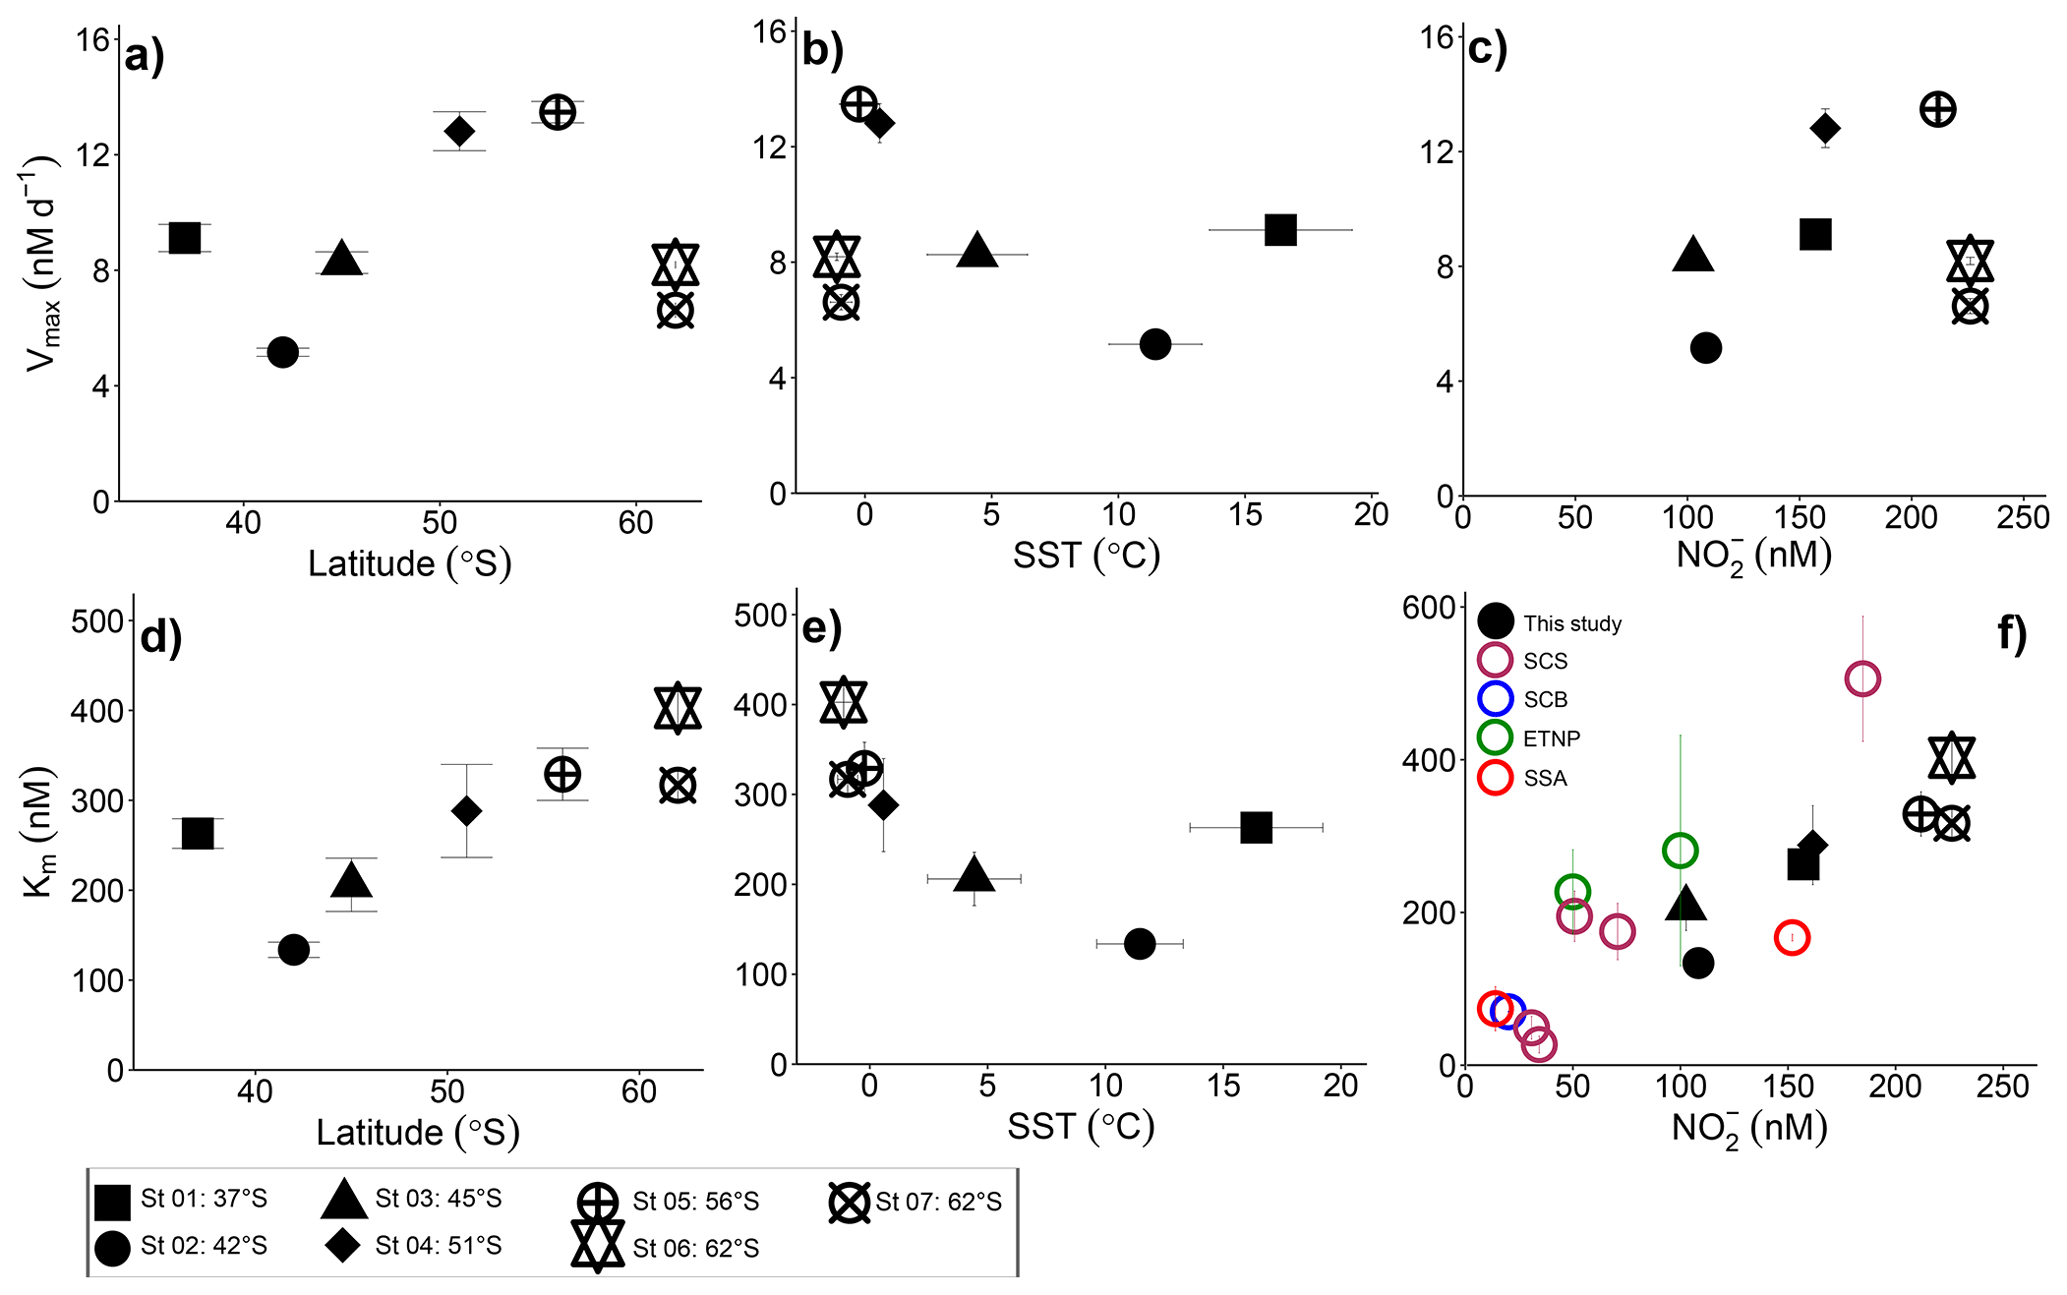
Figure 4Potential controls on the kinetic parameters associated with NO oxidation. Vmax and Km are shown as a function of (a, d) latitude, (b, e) sea surface temperature (SST), and (c, f) the ambient nitrite concentration ([NO]amb). Vertical error bars show the propagated error associated with Vmax and Km computed using a nonlinear, least-squares optimization method (SciPy lmfit package, Python 3.7.6), while the symbols and horizontal error bars in (b, e) indicate the average (±1 standard deviation) SST experienced by the sampled communities during the incubations. In (f) black symbols show our Southern Ocean data, maroon symbols show Km values from the South China Sea (SCS; Zhang et al., 2020), the blue symbol shows the Km value derived for the Southern California Bight (SCB; Olson 1981a), the green symbol shows Km values from the eastern tropical North Pacific oxygen deficient zone (ETNP; Sun et al. 2017), and the red symbols show Km values derived for the subtropical southeast Atlantic (SSA; Sarah Fawcett et al., unpublished data).
The high Km values derived for cultured NOB suggest that the affinity of these organisms for NO is low. However, this is not what is observed in the environment, which indicates that the most abundant marine NOB are not represented in the culture collection. For the Southern Ocean, we report high substrate affinities of NOB, with Km values ranging from 134 to 403 nM, which is within the range documented for oxygenated coastal and open ocean waters (27–506 nM; Olson, 1981a; Zhang et al., 2020) (Table 2). In the low- to zero-oxygen waters of the ETNP ODZ, similarly low Km values have been reported (254±161 nM; Sun et al., 2017), although values >5 µM have also been observed (Sun et al., 2021), with these latter estimates associated with ambient NO concentrations >1 µM. We explore the relationship between ambient NO concentration and Km in detail in Sect. 4.2 below. Here, our focus is on the Km values derived under conditions of low ambient NO (i.e., < 250 nM) given that (some of) the environmental factors affecting NO oxidation at high ambient NO concentrations appear to be unique. For example, oxygen has been shown to decrease the rate of NO oxidation in the ODZs (Sun et al., 2017, 2021) where novel clades of NOB have been detected (Sun et al., 2021). Additionally, NO concentrations in the oxygenated open ocean seldom exceed 250 nM (Zakem et al., 2018), in contrast to the ODZs (Bristow et al., 2016; Füssel et al., 2012).
Across our Southern Ocean transect, Vmax ranged from 5 to 14 nM d−1, which is relatively low compared to estimates from other regions (Table 2), although such a comparison may not be particularly informative as our rates (and typically those of others) are not normalized for NOB abundance. Our Vmax estimates are also low compared to a previous study of mixed-layer nitrification in the winter Southern Ocean (Mdutyana et al., 2020). This difference may be partly due to the fact that the kinetics experiments were conducted using surface (∼7 m) seawater (and thus, the surface NOB community that had been exposed to surface conditions, including elevated light), yet the highest rates of NO oxidation typically occur near the base of the mixed layer, including in the Southern Ocean (Fig. 3b–e; Mdutyana et al., 2020; Peng et al., 2018; Sun et al., 2017). The opposite pattern has also been observed, however (although not in the Southern Ocean), with deeper samples yielding a lower Vmax than samples collected in shallow waters (Sun et al., 2017; Zhang et al., 2020).
4.2 Environmental drivers of the NO oxidation kinetic parameters
We report maximum NO oxidation rates that generally increase towards the south and with decreasing sea surface temperature (SST; recognizing that these parameters co-vary), although St 01 in the STZ and St 06 and St 07 in the MIZ deviate from this trend (Fig. 4a and b; R2=0.019, p=0.77 and R2=0.12, p=0.45, respectively, when all the stations are considered and R2=0.92, p=0.041 and R2=0.94, p=0.029, respectively, when Sts 01, 06, and 07 are excluded). It is possible that changes in the NOB community (composition and/or abundance) across the transect explain some of the observed variability. Nonetheless, taking latitude as a qualitative proxy for light, it is perhaps unsurprising that the maximum NO oxidation rates increase southwards given that NOB are known to be at least partially light inhibited (Olson, 1981b; Peng et al., 2018; Ward, 2005). This explanation does not hold for the stations in the MIZ, however, at which Vmax decreases sharply despite these waters receiving the least light (less than 5 h of weak sunlight versus ∼7 h at 55∘ S to ∼9 h at 37∘ S). The temperature at the MIZ stations was C, which raises the possibility of a temperature effect on Vmax. Indeed, we previously observed a strong decline in the Vmax associated with NH oxidation at SSTs C in the Southern Ocean, while at SSTs ranging from 0.6 to 16∘ C, Vmax was near invariant (Mdutyana et al., 2022a).
Marine nitrification has been reported to be largely unaffected by temperature variations (Baer et al., 2014; Bianchi et al., 1997; Horak et al., 2013), although NH and NO oxidation may respond differently to similar changes in temperature. For example, marine NOB incubated at temperatures ranging from 10 to 35∘ C responded far more slowly to an increase in temperature than co-incubated AOA, resulting in an accumulation of NO in the incubation bottles (Schaefer and Hollibaugh, 2017). By contrast, we previously observed no robust relationship between temperature and the maximum NH oxidation rate in the Southern Ocean (Mdutyana et al., 2022a), a finding that is consistent with studies of NH oxidation in the Arctic and temperate coastal ocean (Baer et al., 2014; Horak et al., 2013). Far less work has been done to assess the response of NOB to temperature changes. In the absence of experiments specifically designed to test the response of Southern Ocean NOB to temperature, it is difficult to disentangle the effect(s) on NO oxidation of temperature versus light (and possibly other parameters that co-vary with latitude, such as NO and/or micronutrient availability).
Plotting Vmax as a function of the ambient substrate concentration ([NO]amb) reveals a strong positive relationship for all but the MIZ stations (Fig. 4c; R2=0.73, p=0.065 if the MIZ stations are excluded). In particular, the STZ station (St 01), which appeared anomalous in the plots of Vmax versus latitude and SST, is consistent with the other non-MIZ stations when evaluated in Vmax versus [NO]amb space. The positive relationship of Vmax to [NO]amb could be taken as evidence that NO availability strongly controls the maximum achievable rate of NO oxidation. However, Vmax varies four-fold across the transect, while [NO]amb only changes by a factor of 2, and [NO]amb is also correlated with latitude (R2=0.51, p<0.001 for all surface [NO]amb data; Fig. S2). Additionally, previous wintertime Southern Ocean NO oxidation rates (albeit not Vmax) showed no relationship with ambient NO concentration (Bianchi et al., 1997; Mdutyana et al., 2020). The extent to which Vmax is directly controlled by [NO]amb is thus unclear, and it is likely that NOB community composition, light availability, and temperature also play a role, with SST perhaps becoming more important at very low temperatures (i.e., in the MIZ).
Our estimates of Km reveal that NOB in the wintertime Southern Ocean have a high affinity for NO that appears to decrease (i.e., the Km rises) at higher latitudes (i.e., lower light) and lower temperatures, with St 01 in the STZ again emerging as an exception (Fig. 4d and e; R2=0.86, p=0.008 and R2=0.86, p=0.008, respectively). Plotting our Km values as a function of [NO]amb reveals a strong positive relationship (Fig. 4f; R2=0.83, p=0.004; black data points), implying that NO availability rather than temperature or light exerts the dominant control on Km. This trend further suggests that NOB are well-adapted to the environment (or Southern Ocean region) in which they are found. Southern Ocean mixed-layer NO concentrations are almost never <150 nM, regardless of the season (Fripiat et al., 2019; Mdutyana et al., 2020; Zakem et al., 2018), yet the relationship of Km to [NO]amb also holds at far lower NO concentrations. The colored data points in Fig. 4f show Km versus [NO]amb for four additional regions where a Michaelis–Menten relationship of NO oxidation rate to NO concentration was observed and where [NO]amb was <250 nM (two coastal ocean sites, the South China Sea (SCS; Zhang et al., 2020) and Southern California Bight (SCB; Olson, 1981a); one oligotrophic ocean site, the subtropical southeast Atlantic (SSA; Sarah Fawcett et al., unpublished data); and two stations from the ETNP ODZ, where oxygen concentrations ranged from 0 to 16.8 µM (Sun et al., 2017)). The robust positive relationship of Km to [NO]amb that emerges when these previous results are combined with our Southern Ocean data (R2=0.68, p<0.001) strongly implicates [NO]amb as the dominant control on the Km of NO oxidation in the ocean, particularly at low [NO]amb (i.e., <250 nM).
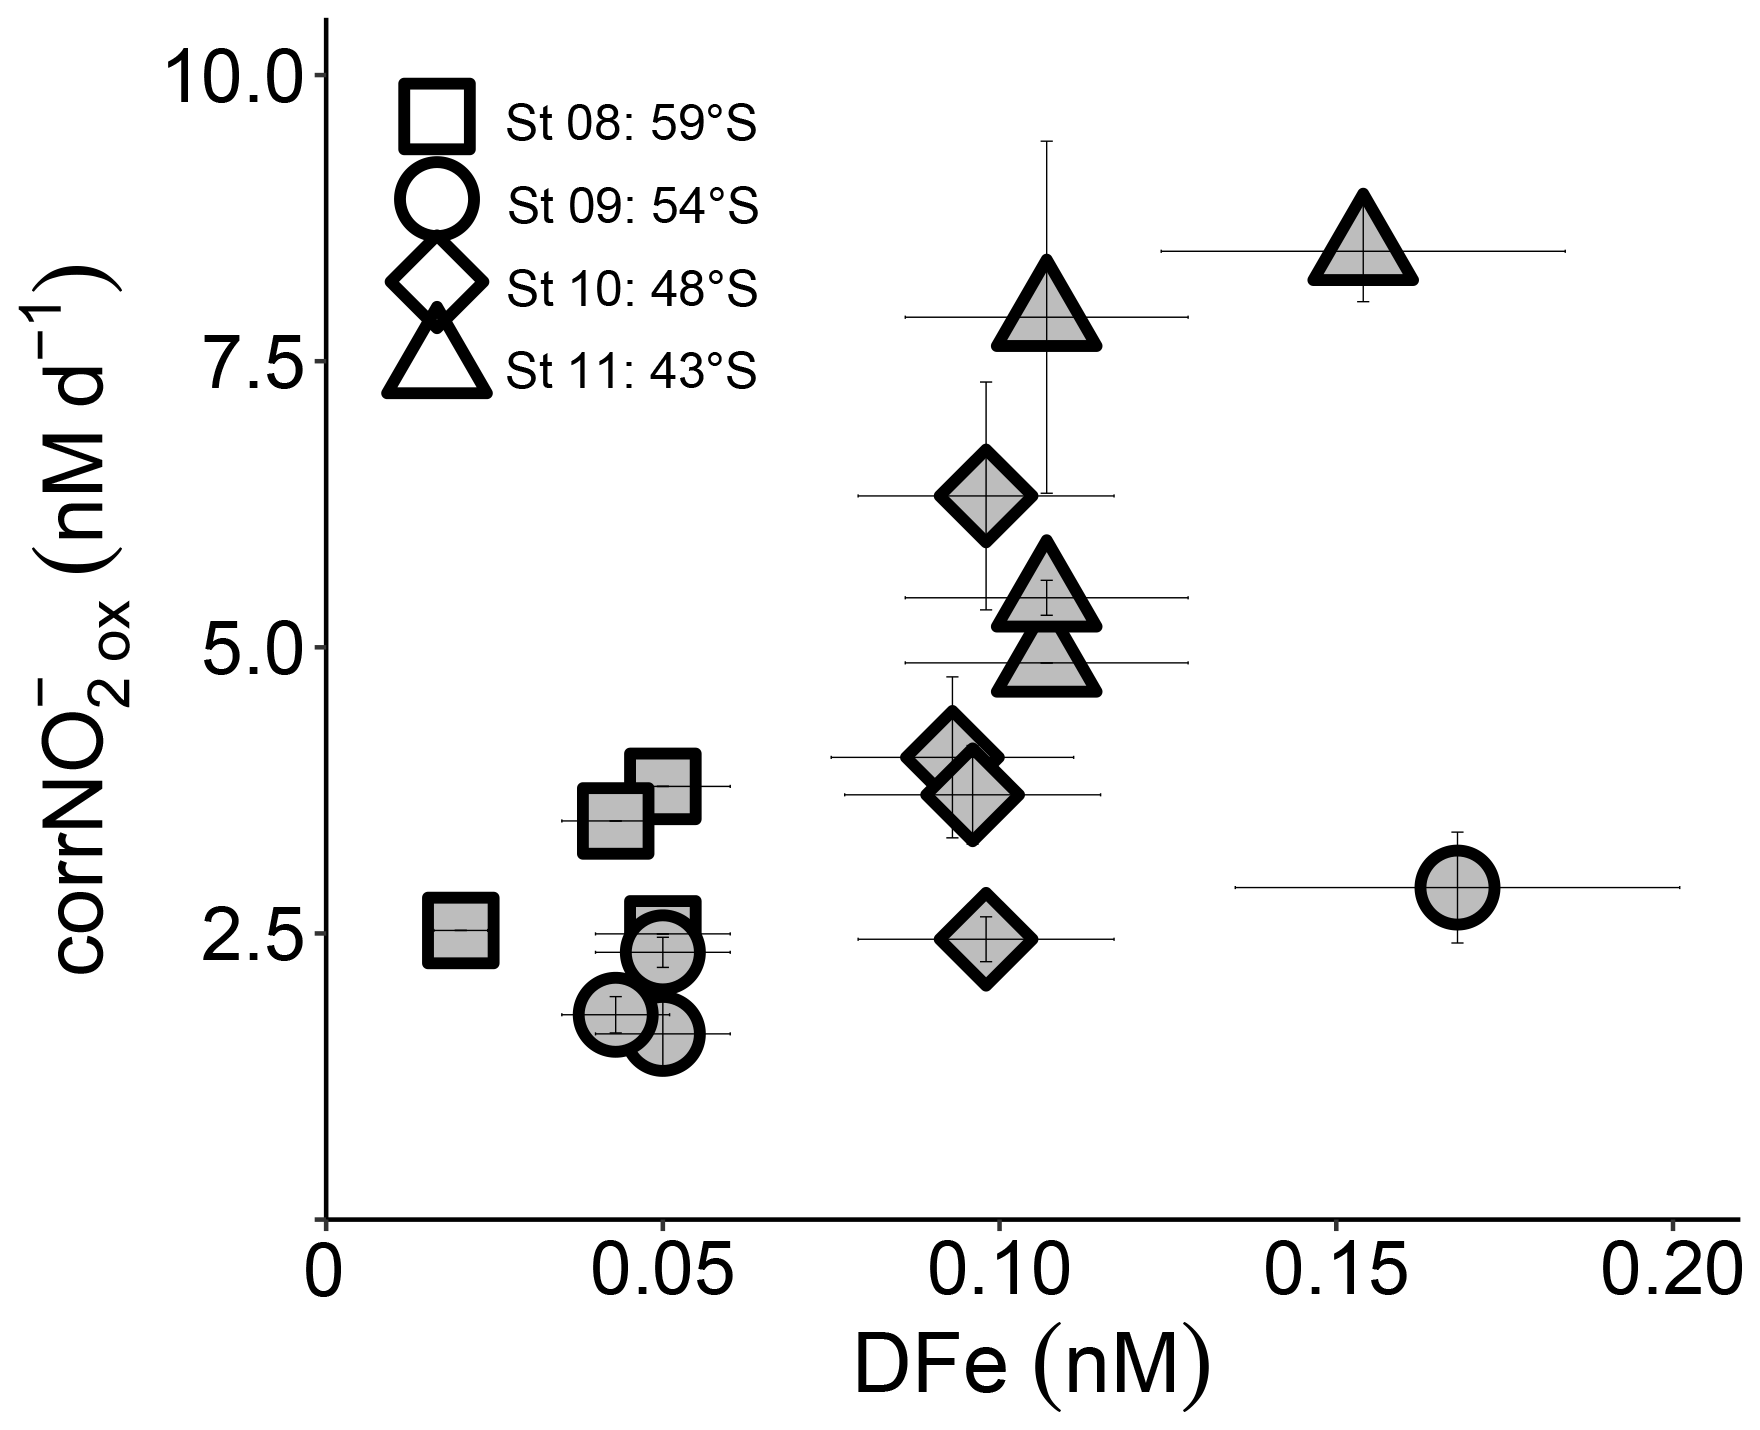
Figure 5Euphotic zone (0–75 m) revised rates of NO oxidation (corrNO) measured at the depth-profile stations (St 08 to St 11) plotted against coincident dissolved iron concentrations ([DFe]). Error bars indicate the range of measured values. Where errors bars are not visible, they are smaller than the data markers.
The production of NO from NH oxidation has recently been hypothesized to be vulnerable to iron limitation (Mdutyana et al., 2022a) since AOB rely on iron-rich cytochrome c proteins (Arp et al., 2002; Walker et al., 2010), and some AOA appear to have a low affinity for inorganic iron (Shafiee et al., 2019). NOB also contain iron-rich enzymes, such as nitrite oxidoreductase, which is responsible for converting NO to NO (Meincke et al., 1992; Spieck et al., 1998). While we have no iron data with which to compare our kinetic parameters, dissolved iron concentrations ([DFe]) were measured throughout the euphotic zone at the depth-profile stations (St 08 to St 11; Mdutyana et al., 2022a). The revised NO oxidation rates at these stations are weakly positively correlated with [DFe] (R2=0.35, p=0.016; Fig. 5), indicating a potential role for iron in controlling NO oxidation. Combined with the evidence that iron may also constrain marine NH oxidation (Shafiee et al., 2019), this observation implies that mixed-layer nitrification in the Southern Ocean may be iron limited. Since phytoplankton consumption of regenerated NO yields no net removal of atmospheric CO2 in a mass balance sense (Dugdale and Goering 1967; Yool et al., 2007), an iron-related control on mixed-layer nitrification would help to limit the extent to which this process can weaken the Southern Ocean's biological pump and would lead to enhanced competition between phytoplankton and nitrifiers for iron.
4.3 The persistence of elevated NO concentrations throughout the Southern Ocean's mixed layer
While still limited, there is growing evidence that marine AOA have a very high affinity for NH (more correctly, ammonia (NH3), the substrate for NH oxidation; Horak et al., 2013; Martens-Habbena et al., 2009; Mdutyana et al., 2022a; Newell et al., 2013; Peng et al., 2016). Marine NOB also appear able to access low concentrations of substrate, based on the few in situ studies conducted to date, including this one (Fig. 4f; Olson, 1981a; Sun et al., 2017; Zhang et al., 2020). This high substrate affinity is perhaps unsurprising given that NO concentrations are generally near-zero throughout the oxygenated ocean, rising modestly to values typically <500 nM at the PNM in (sub-)tropical waters (Lomas and Lipschultz, 2006; Zakem et al., 2018) and <400 nM over the mixed layer in (sub-)polar regions (Zakem et al., 2018). The average surface NO concentration measured during Leg 1 of our cruise was 168±48 nM (Fig. 1a), and the average mixed-layer concentration for Leg 2 was 137±57 nM (Figs. 1b and 3a). Similar concentrations have been observed previously across the Southern Ocean, including in other seasons (Cavagna et al., 2015; Fripiat et al., 2019; Mdutyana et al., 2020). Thus, while NO oxidation in Southern Ocean surface waters is characterized by a low Km, the affinity of NOB for NO is apparently not high enough to completely remove the available NO.
The persistence of elevated NO concentrations in the mixed layer at high latitudes has previously been attributed to the inability of iron- and/or light-limited phytoplankton to fully consume NO transported to the surface with NO during deep mixing events (Zakem et al., 2018). However, subsurface NO concentrations in the Southern Ocean are typically below detection (Figs. 1b and 3a; Olsen et al., 2016), so it is unclear how deep mixing could supply measurable NO to the euphotic zone. We thus discount subsurface mixing as a primary explanation for the elevated Southern Ocean mixed-layer NO concentrations observed during our study and in other seasons (e.g., Fripiat et al., 2019).
A second possible source of elevated mixed-layer NO is efflux following partial NO reduction to NO by phytoplankton (Lomas and Lipschultz, 2006), which has been extensively documented in laboratory and field studies (see Collos, 1998, for a review). The release of NO by phytoplankton is hypothesized to result from light limitation of intracellular NO reduction (Kiefer et al., 1976; Vaccaro and Ryther, 1960), short-term increases in irradiance to which phytoplankton cannot adapt (Lomas and Lipschultz, 2006), iron limitation of NO assimilation (Milligan and Harrison, 2000), and/or release of phytoplankton from NO limitation following a period of starvation (Sciandra and Amara, 1994). While some of these mechanisms may be ongoing in the Southern Ocean, they all require the initial uptake of NO by phytoplankton. This process occurs in the winter mixed layer at rates that are too low to support NO efflux to the extent that it would allow NO to accumulate to concentrations of 100–400 nM (Fig. S3; Mdutyana et al., 2020; Philibert et al., 2015) while simultaneously being removed by NO oxidation. Additionally, we observe a reasonable correlation between the NH oxidation rates and the ambient NO concentration (R2=0.46, p<0.001; Fig. S4), which implies that NO derives mainly from NH oxidation rather than phytoplankton efflux.
A third potential explanation for elevated mixed-layer NO is a decoupling of NH and NO oxidation, which appears to be widespread in the environment (e.g., Beman et al., 2013; Ward and Zafiriou, 1988). In the oxygenated ocean, NH oxidation has been considered the rate-limiting step in the nitrification pathway because NO seldom accumulates in the mixed layer (Kendall, 1998; Kowalchuk and Stephen, 2001; Vajrala et al., 2013; Walker et al., 2010). However, rate measurements from numerous ocean regions show contrasting results, with NO oxidation sometimes outpacing NH oxidation (Bristow et al., 2015; Dore and Karl, 1996; Horrigan et al., 1990; Peng et al., 2018), while in other cases, NH oxidation is dominant (Clark et al., 2008; Kalvelage et al., 2013; Ward and Kilpatrick, 1991). The limited data available from previous Southern Ocean investigations show no clear trend (Bianchi et al., 1997; Mdutyana et al., 2020). In the present study, mixed-layer corrNO rates are two- to seven-times lower than the coincidentally measured corrNH (Figs. 3 and 6). Additionally, the maximum rates of NO oxidation (Vmax) that we measure in this study for the surface NOB community (∼5 to 13 nM d−1; Fig. 2) are on average half those determined at the same stations for NH oxidation (14 to 23 nM d−1; Mdutyana et al., 2022a). At the time of our sampling, therefore, NO oxidation was rate-limiting for nitrification, which likely accounts for at least some of the NO accumulated in the Southern Ocean's winter mixed layer.
If a decoupling of NH and NO oxidation is predominantly responsible for NO accumulation, an obvious question is why these rates are not balanced. Environmental factors like temperature and light may play a role (Ward, 2008), as may iron limitation and the different ecophysiologies of NH and NO oxidizers. AOA have been shown to adapt more rapidly than NOB to a change in temperature (Schaefer and Hollibaugh, 2017); however, seasonal SST changes within the various zones of the Southern Ocean are fairly small and the aforementioned study showing the differential thermal response of AOA and NOB was conducted at higher temperatures than those experienced in much of the Southern Ocean. With regards to light, there is evidence from culture and field studies that NOB are more photosensitive than AOA and AOB (Bock, 1965; Olson, 1981b; Qin et al., 2014). Our data are consistent with this notion insofar as the Vmax associated with NO oxidation in surface waters rises with increasing latitude (and thus decreasing light; Fig. 4a), while the Vmax derived for NH oxidation remains largely unchanged across >30∘ of latitude (Mdutyana et al., 2022a). However, the ambient NO concentration in Southern Ocean surface waters rises near linearly with latitude (Fig. S2a), while the NH concentration resembles a step function, increasing from ∼100 nM north of the SAF to ∼700 nM south of the SAF, over a distance of roughly 1∘ of latitude (Fig. S2b). The differing trends in Vmax may thus have more to do with substrate availability than photoinhibition.
Mixing, particularly deep winter overturning, might also contribute to a decoupling of NH and NO oxidation. In coastal waters, deep mixing has been shown to dilute the nitrifier community, with AOO subsequently observed to recover more rapidly than NOB. This differential rate of recovery has been hypothesized to result in a period of low rates of NO oxidation during which the co-occurring NH oxidation rates remain elevated, ultimately causing NO to accumulate in the surface layer (Haas et al., 2021). While a similar effect may play a role in NO accumulation in the open Southern Ocean, it is unlikely that the entire NO reservoir can be attributed to this process. The rates of NH oxidation are only slightly higher than the NO oxidation rates in the winter mixed layer (Fig. 3), and the mixed-layer NH concentrations are elevated (Fig. 3f). These observations imply that NH oxidizers are limited by something other than the NH substrate. This limitation prevents AOO from catalyzing higher rates of NO production (and thus NO accumulation).
Nitrite oxidoreductase (NXR), the enzyme possessed by NOB that is responsible for aerobic NO oxidation to NO, is an iron–sulfur molybdoprotein (Lücker et al., 2010; Meincke et al., 1992; Sundermeyer-Klinger et al., 1984). As such, NO oxidation has a significant iron requirement (Bayer et al., 2021; Saito et al., 2020), intimated by the relationship we observe between corrNO and DFe (Fig. 5). Additionally, NO accumulation at the PNM in the California Current has been hypothesized to be caused by the iron limitation of NOB (Santoro et al., 2013). AOB also require iron, in particular for the oxidation of hydroxylamine, which is catalyzed by the heme-rich hydroxylamine oxidoreductase complex (Arp et al., 2002; Walker et al., 2010). By contrast, AOA, the dominant marine NH oxidizers, rely mainly on copper-containing proteins to mediate NH oxidation (Amin et al., 2013; Santoro et al., 2015; Walker et al., 2010). In the iron-limited Southern Ocean, it is thus possible that iron scarcity more strongly limits NO than NH oxidation. However, recent culture and proteomic work suggests that some AOA may actually have a high iron requirement (Carini et al., 2018; Qin et al., 2018; Santoro et al., 2015; Shafiee et al., 2019), and we have previously hypothesized an iron-related control on NH oxidation in the Southern Ocean (Mdutyana et al., 2022a). Deeper investigation is thus required to characterize the role of iron in controlling the relative rates of NH and NO oxidation, as well as the implications for the complete nitrification pathway.
A further consideration is differences in the ecology of AOA and NOB. Marine NOB are an order of magnitude less abundant than AOA (e.g., Beman et al., 2013; Damashek et al., 2019; Füssel et al., 2012; Kitzinger et al., 2020; Pachiadaki et al., 2017) and roughly 3-times larger (Könneke et al., 2005; Martens-Habbena et al., 2009; Pachiadaki et al., 2017; Watson and Waterbury, 1971). While marine NOB appear to have a high affinity for ambient NO, the in situ Km values derived to date are not as low as those reported for NH oxidation (Horak et al., 2013; Mdutyana et al., 2022a; Peng et al., 2016; Xu et al., 2019; Zhang et al., 20202), which is perhaps to be expected given the larger size of NOB versus AOA. Resource limitation theory posits that nitrifiers (NOB and AOA) require a subsistence concentration of substrate (R∗) to maintain their population and that those with the lowest R* will outcompete all other organisms limited by the same resource, provided that their Vmax is higher than their loss rate due to grazing and/or viral lysis (Zakem et al., 2018). Because NOB are larger than AOA, they will have a higher R∗ even before grazing pressure is factored in. Their larger size also means that NOB are more likely to be grazed than AOA, which will further increase their R∗, as will the fact that their maximum growth rates are low and thus vulnerable to being outpaced by their loss rate. Taken together, these factors will increase R∗, potentially resulting in the accumulation of NO in the water column, and may help to explain why the Km for NO oxidation, in the Southern Ocean and elsewhere, is considerably higher than the Km derived for NH oxidation. Additionally, the fact that NOB will be preferentially grazed over AOA may contribute to NO oxidation being rate-limiting for nitrification.
That NO oxidation was rate-limiting at the time of our sampling does not necessarily explain the accumulation of NO in the Southern Ocean mixed layer year-round. Neither NH nor NO oxidation occurs at elevated rates in summer or autumn (Bianchi et al., 1997; Mdutyana et al., 2020), yet the elevated NO concentrations persist during these seasons (Cavagna et al., 2015; Fripiat et al., 2019; Mdutyana et al., 2020). To fit a Michaelis–Menten function to our experimental data required amending the classical equation (Eq. 2) to allow for a positive x intercept (i.e., a non-zero S value at which V was still zero, the C parameter in Eq. 3) (Archontoulis and Miguez, 2014). Additionally, at most stations, the NO oxidation rates did not increase substantially following the initial two or three substrate amendments (i.e., in Fig. 2, the slope of the relationship between V and S is less steep for the initial two to three values of S than at higher S values). Practically, our findings suggest that Southern Ocean NOB require a minimum (i.e., “threshold”) NO concentration below which NO becomes severely limiting. Coupled with weak NO drawdown by iron- and/or light-limited phytoplankton during their incomplete consumption of the NO + NO pool, a threshold substrate requirement of NOB can explain the year-round persistence of non-zero mixed-layer NO since it implies that there is no mechanism by which NO can be completely exhausted.

Figure 6The relationship between the revised rates of NO and NH oxidation (corrNO and corrNH) for (a) each experiment depth in the upper water column (0–500 m) and (b) integrated over the mixed layer (grey symbols) and upper 200 m (black symbols). Error bars in (a) indicate the range of values, each measured at least twice, while in (b), error bars show the propagated error. Where errors bars are not visible, they are smaller than the data markers. The black diagonal line in both panels has a slope of 1, which is expected if the rates of NH and NO oxidation are tightly coupled.
The existence of a NO concentration threshold may indicate limitation of the membrane-bound NXR enzyme, either by NO or by another essential nutrient. Recently, using NXR concentrations, estimates of NXR-specific activity, and direct measurements of in situ NO oxidation rates, Saito et al. (2020) deduced that Nitrospina NXR is undersaturated with NO in the tropical Pacific possibly due to iron limitation. The authors suggest that under iron-scarce conditions, it becomes increasingly difficult for NOB to synthesize NXR and thus to oxidize NO. A similar dynamic may be at play in the Southern Ocean, with limited synthesis of NXR at low iron concentrations resulting in a decrease in the efficiency of the NO oxidation pathway that manifests most strongly when the ambient NO concentration is also low. This inefficiency could be alleviated at higher NO concentrations since NOB (even with a paucity of NXR) are less likely to experience diffusion limitation with respect to NO when there is more of this substrate available (Pasciak and Gavis, 1974). Regardless of its mechanistic basis, limitation of NOB NXR would help to explain the perennially high concentrations of NO in the Southern Ocean mixed layer. Moreover, environmental factors unique to the Southern Ocean, such as limited iron availability, may be instrumental in setting the NO threshold and associated elevated mixed-layer NO concentrations.
Our observations raise the question of why a similar NO concentration threshold has not been reported for other ocean regions, particularly those characterized by similar conditions to the Southern Ocean. This may partly be due to the very limited number of NO oxidation kinetics experiments that have been conducted in the open ocean and/or to the fact that a classic Michaelis–Menten function is usually imposed upon kinetics data, with V assumed to increase as soon as S>0. Additionally, depending on the maximum substrate concentration added during kinetics experiments (i.e., the maximum concentration on the x axis of the V versus S plot), it can be difficult to discern a possible threshold NO concentration by simply examining the plots. Inspection of published Michaelis–Menten curves does reveal the possibility of a non-zero C value in some cases, including in the ETNP ODZ (Sun et al., 2021) and associated with the PNM in the South China Sea (Zhang et al., 2020). However, there are also published curves that clearly intercept the origin in V versus S space (Olson, 1981a; Sun et al., 2017), underscoring the need for further investigation of the conditions that lead to a threshold NO concentration requirement of NOB.
In this study, we present the first NO oxidation kinetic constants for the Southern Ocean, derived from surface experiments conducted during winter 2017. All the experiments were well-described by the Michaelis–Menten equation, provided that a location parameter, C, was included in the model. Vmax ranged from 5.2±0.1 to 13±0.4 nM d−1, and Km ranged from 134±8 to 403±24 nM, with the latter parameter showing a strong positive relationship with the ambient NO concentration. We interpret the positive values of C (range of 115±2.3 to 245±18 nM) to indicate an ambient NO concentration threshold below which NOB, and thus NO oxidation, are impeded. We hypothesize that this threshold indicates substrate limitation of NXR, possibly exacerbated by the low ambient iron concentrations characteristic of the upper Southern Ocean. Our kinetics experiments were conducted in surface waters only, which raises the question of the relevance of our findings for deeper euphotic zone waters. For instance, it is possible that surface nitrifier communities may be more iron limited than those living nearer the base of the euphotic zone. However, in the winter Southern Ocean, the euphotic zone is always considerably shallower than the mixed layer (50–75 m versus 100–250 m) such that euphotic zone waters are typically very well mixed, as is apparent from the near-invariant mixed-layer (and thus euphotic-zone) distributions of nutrients (Fig. 1b–c), including trace metals (Cloete et al., 2019). One might therefore expect the nitrifiers to also be evenly distributed over the euphotic zone and mixed layer. The light flux will not be homogenous over these layers, however. Indeed, light availability is frequently invoked to explain the vertical distribution of nitrification rates because nitrifier activity is impeded at high light (Horrigan et al., 1981; Olson, 1981b; Peng et al., 2018; Qin et al., 2014). Our nitrification depth profiles do not show a vertical trend, instead remaining similar throughout the euphotic zone and only rising near the base of the mixed layer (Fig. 3b–e). We thus consider the results of our surface kinetics experiments to be broadly applicable to the euphotic zone in winter. From the depth-profile measurements, we deduce that the rate-limiting step for mixed-layer nitrification in the winter Southern Ocean is NO oxidation. Despite this, NO production from NO oxidation accounted for 63 %–237 % of the NO consumed by phytoplankton, consistent with previous wintertime observations from the Atlantic sector (Mdutyana et al., 2020). The implication of this finding is that most of the mixed-layer NO consumed by phytoplankton in winter, and likely also a significant fraction assimilated in spring, supports regenerated rather than new production (Yool et al., 2007; Mdutyana et al., 2020).
NO oxidation, as the ultimate pathway connecting reduced N to its most oxidized form (NO, is important throughout the water column but particularly in the upper layer where the supply of reduced N is greatest. The production of NO within the mixed layer from in situ nitrification can complicate the application of the new production paradigm as a framework for estimating carbon export potential, which advocates for additional measurements of this pathway over the upper ∼200 m. Additionally, it is becoming increasingly clear that we lack a mechanistic understanding of the controls on nitrification (both NH and NO oxidation), which renders it challenging to model both their magnitude and distribution, as well as to assess how these may change in future. In particular, further study of the role of iron in controlling nitrification is required, especially in the Southern Ocean where the mixed layer's biological N cycle is dominated by nitrification in winter (Mdutyana et al., 2020; Smart et al., 2015), and surface-layer iron remains scarce throughout the year (Tagliabue et al., 2012).
All data used in this paper can be found at https://doi.org/10.5281/zenodo.6791408 (Mdutyana et al., 2022b).
The supplement related to this article is available online at: https://doi.org/10.5194/bg-19-3425-2022-supplement.
MM and SEF planned the campaign; MM and JMB collected the samples and conducted the experiments; MM and XS made the measurements, with support from BBW; MM, TM, and SEF analyzed the data; MM and SEF wrote the manuscript draft, with substantial input from BBW, TM, and SJT. All authors reviewed, edited, and approved the manuscript.
The contact author has declared that none of the authors has any competing interests.
Publisher's note: Copernicus Publications remains neutral with regard to jurisdictional claims in published maps and institutional affiliations.
We thank Captain Knowledge Bengu, the crew of the R/V S.A. Agulhas II, and Chief Scientist Marcello Vichi for professional support during the cruise, as well as the Marine Biogeochemistry Lab team at the University of Cape Town (UCT), Cashifa Karriem for extensive administrative support, and Ian Newton and Julie Luyt at the UCT Stable Light Isotope Laboratory for filter analyses. The nitrification measurements were made possible through the Princeton University Visiting Student Research Collaborator program – we are especially grateful to Sergey Oleynik in the Department of Geosciences for his expert assistance during the first author's visit. Julie Granger, Sian Henley, and Alyson Santoro provided comments that greatly improved the manuscript. We also acknowledge the South African Department of Science and Innovation's Biogeochemistry Research Infrastructure Platform.
This research has been supported by the South African National Research Foundation through Antarctic Programme grants to Sarah E. Fawcett (grant nos. 110735 and 129232) and Sandy J. Thomalla (grant no. 93076) and a National Equipment Programme grant to Sarah E. Fawcett (grant no. 116142), as well as postgraduate scholarships to Mhlangabezi Mdutyana (grant no. 112380), Tanya Marshall (grant nos. 114673 and 130826), and Jessica M. Burger (grant no. 110732); by the University of Cape Town (UCT) through a Harry Crossley Foundation research fellowship to Mhlangabezi Mdutyana, postgraduate scholarship to Tanya Marshall, Vice-Chancellor (VC) research scholarships to Jessica M. Burger, a VC Future Leaders 2030 award to Sarah E. Fawcett, and a research committee equipment grant to Sarah E. Fawcett; by the African Academy of Sciences and Royal Society through a FLAIR Fellowship to Sarah E. Fawcett; and by US National Science Foundation grants to Bess B. Ward.
This paper was edited by Jack Middelburg and reviewed by two anonymous referees.
Amin, S. A., Moffett, J. W., Martens-Habbena, W., Jacquot, J. E., Han, Y., Devol, A., Ingalls, A. E., Stahl, D. A., and Armbrust, E. V.: Copper requirements of the ammonia-oxidizing archaeon Nitrosopumilus maritimus SCM1 and implications for nitrification in the marine environment, Limnol. Oceanogr., 58, 2037–2045, https://doi.org/10.4319/lo.2013.58.6.2037, 2013.
Archontoulis, S. V. and Miguez, F. E.: Nonlinear regression models and applications in agricultural research, Agron. J., 107, 786–798, https://doi.org/10.2134/agronj2012.0506, 2014.
Arp, D. J., Sayavedra-Soto, L. A., and Hommes, N. G.: Molecular biology and biochemistry of ammonia oxidation by Nitrosomonas europaea, Arch. Microbiol., 178, 250–255, https://doi.org/10.1007/s00203-002-0452-0, 2002.
Baer, S. E., Connelly, T. L., Sipler, R. E., Yager, P. L., and Bronk, D. A.: Effect of temperature on rates of ammonium uptake and nitrification in the western coastal Arctic during winter, spring, and summer, Global Biogeochem. Cy., 28, 1455–1466, https://doi.org/10.1111/1462-2920.13280, 2014.
Bayer, B., Saito, M. A., McIlvin, M. R., Lücker, S., Moran, D. M., Lankiewicz, T. S., Dupont, C. L., and Santoro, A. E.: Metabolic versatility of the nitrite-oxidizing bacterium Nitrospira marina and its proteomic response to oxygen-limited conditions, ISME J., 15, 1025–1039, https://doi.org/10.1038/s41396-020-00828-3, 2021.
Belkin, I. M. and Gordon, A. L.: Southern Ocean fronts from the Greenwich meridian to Tasmania, J. Geophys. Res.-Oceans, 101, 3675–3696, https://doi.org/10.1029/95JC02750, 1996.
Beman, J. M., Popp, B. N., and Francis, C. A.: Molecular and biogeochemical evidence for ammonia oxidation by marine Crenarchaeota in the Gulf of California, ISME J., 2, 429–441, https://doi.org/10.1038/ismej.2007.118, 2008.
Beman, J. M., Leilei Shih, J., and Popp, B. N.: Nitrite oxidation in the upper water column and oxygen minimum zone of the eastern tropical North Pacific Ocean, ISME J., 7, 2192–2205, https://doi.org/10.1038/ismej.2013.96, 2013.
Bianchi, M., Feliatra, F., Tréguer, P., Vincendeau, M. A., and Morvan, J.: Nitrification rates, ammonium and nitrate distribution in upper layers of the water column and in sediments of the Indian sector of the Southern Ocean, Deep. Res. Pt. II, 44, 1017–1032, https://doi.org/10.1016/S0967-0645(96)00109-9, 1997.
Birch, C. P. D.: A new generalized logistic sigmoid growth equation compared with the Richards growth equation, Ann. Bot., 83, 713–723, https://doi.org/10.1006/anbo.1999.0877, 1999.
Blackburne, R., Vadivelu, V. M., and Yuan, Z.: Kinetic characterisation of an enriched Nitrospira culture with comparison to Nitrobacter, Water Res., 41, 3033–3042, https://doi.org/10.1016/j.watres.2007.01.043, 2007.
Bock, E.: Vergleichende Untersuchungen über die Wirkung sichtbaren Lichtes auf Nitrosomonas europaea und Nitrobacter winogradskyi, Arch. Mikrobiol., 51, 18–41, https://doi.org/10.1007/BF00406848, 1965.
Bristow, L. A., Sarode, N., Cartee, J., Caro-Quintero, A., Thamdrup, B., and Stewart, F. J.: Biogeochemical and metagenomic analysis of nitrite accumulation in the Gulf of Mexico hypoxic zone, Limnol. Oceanogr., 60, 1733–1750, https://doi.org/10.1002/lno.10130, 2015.
Bristow, L. A., Dalsgaard, T., Tiano, L., Mills, D. B., Bertagnolli, A. D., Wright, J. J., Hallam, S. J., Ulloa, O., Canfield, D. E., Revsbech, N. P., and Thamdrup, B.: Ammonium and nitrite oxidation at nanomolar oxygen concentrations in oxygen minimum zone waters, P. Natl. Acad. Sci. USA, 113, 10601–10606, https://doi.org/10.1073/pnas.1600359113, 2016.
Caranto, J. D. and Lancaster, K. M.: Nitric oxide is an obligate bacterial nitrification intermediate produced by hydroxylamine oxidoreductase, P. Natl. Acad. Sci. USA, 114, 8217–8222, https://doi.org/10.1073/pnas.1704504114, 2017.
Carini, P., Dupont, C. L., and Santoro, A. E.: Patterns of thaumarchaeal gene expression in culture and diverse marine environments, Environ. Microbiol., 20, 2112–2124, https://doi.org/10.1111/1462-2920.14107, 2018.
Carvalho, F., Kohut, J., Oliver, M. J., and Schofield, O.: Defining the ecologically relevant mixed-layer depth for Antarctica's coastal seas, Geophys. Res. Lett., 44, 338–345, https://doi.org/10.1002/2016GL071205, 2017.
Cavagna, A. J., Fripiat, F., Elskens, M., Mangion, P., Chirurgien, L., Closset, I., Lasbleiz, M., Florez-Leiva, L., Cardinal, D., Leblanc, K., Fernandez, C., Lefèvre, D., Oriol, L., Blain, S., Quéguiner, B., and Dehairs, F.: Production regime and associated N cycling in the vicinity of Kerguelen Island, Southern Ocean, Biogeosciences, 12, 6515–6528, https://doi.org/10.5194/bg-12-6515-2015, 2015.
Clark, D. R., Rees, A. P., Joint, I., Limnology, S., Jan, N., Clark, D. R., Rees, A. P., and Joint, I.: Ammonium regeneration and nitrification rates in the oligo trophic Atlantic Ocean: Implications for new production estimates, Limnol. Oceanogr., 53, 52–62, https://doi.org/10.4319/lo.2008.53.1.0052, 2008.
Cloete, R., Loock, J. C., Mtshali, T., Fietz, S., and Roychoudhury, A. N.: Winter and summer distributions of Copper, Zinc and Nickel along the International GEOTRACES Section GIPY05: Insights into deep winter mixing, Chem. Geol., 511, 342–357, https://doi.org/10.1016/j.chemgeo.2018.10.023, 2019.
Collos, Y.: Nitrate uptake, nitrite release and uptake, and new production estimates, Mar. Ecol. Prog. Ser., 171, 293–301, https://doi.org/10.3354/meps171293, 1998.
Damashek, J., Tolar, B. B., Liu, Q., Okotie-Oyekan, A. O., Wallsgrove, N. J., Popp, B. N., and Hollibaugh, J. T.: Microbial oxidation of nitrogen supplied as selected organic nitrogen compounds in the South Atlantic Bight, Limnol. Oceanogr., 64, 982–995, https://doi.org/10.1002/lno.11089, 2019.
de Jong, E., Vichi, M., Mehlmann, C. B., Eayrs, C., De Kock, W., Moldenhauer, M., and Audh, R. R.: Sea Ice conditions within the Antarctic Marginal Ice Zone in winter 2017, onboard the SA Agulhas II, Pangaea, 2018, https://doi.org/10.1594/PANGAEA.885211, 2018.
DeVries, T., Holzer, M., and Primeau, F.: Recent increase in oceanic carbon uptake driven by weaker upper-ocean overturning, Nature, 542, 215–218, https://doi.org/10.1038/nature21068, 2017.
Diaz, F. and Raimbault, P.: Nitrogen regeneration and dissolved organic nitrogen release during spring in a NW Mediterranean coastal zone (Gulf of Lions): Implications for the estimation of new production, Mar. Ecol. Prog. Ser., 197, 51–65, https://doi.org/10.3354/meps197051, 2000.
DiFiore, P. J., Sigman, D. M., and Dunbar, R. B.: Upper ocean nitrogen fluxes in the Polar Antarctic Zone: Constraints from the nitrogen and oxygen isotopes of nitrate, Geochem. Geophys. Geosys., 10, Q11016, https://doi.org/10.1029/2009GC002468, 2009.
Dore, J. E. and Karl, D. A. I.: Nitrification in the euphotic zone as a source for nitrite, nitrate, and nitrous oxide at Station ALOHA, Limnol. Oceanogr., 41, 1619–1628, https://doi.org/10.4319/lo.1996.41.8.1619, 1996.
Dugdale, R. C. and Goering, J. J.: Uptake of new and regenerated forms of nitrogen in primary productivity, Limnol. Oceanogr., 12, 196–206, https://doi.org/10.4319/lo.1967.12.2.0196, 1967.
Dugdale, R. C. and Wilkerson, F. P.: the Use of N-15 To Measure Nitrogen Uptake in Eutrophic Oceans – Experimental Considerations, Limnol. Oceanogr., 31, 673–689, https://doi.org/10.4319/lo.1986.31.4.0673, 1986.
Eppley, R. W. and Peterson, B. J.: Particulate organic matter flux and planktonic new production in the deep ocean, Nature, 282, 677–680, https://doi.org/10.1038/282677a0, 1979.
Fripiat, F., Studer, A. S., Haug, G. H., Oleynik, S., Martínez-García, A., Smart, S. M., Rubach, F., Sigman, D. M., Fawcett, S. E., and Kemeny, P. C.: The isotope effect of nitrate assimilation in the Antarctic Zone: Improved estimates and paleoceanographic implications, Geochim. Cosmochim. Ac., 247, 261–279, https://doi.org/10.1016/j.gca.2018.12.003, 2019.
Füssel, J., Lam, P., Lavik, G., Jensen, M. M., Holtappels, M., Günter, M., and Kuypers, M. M. M.: Nitrite oxidation in the Namibian oxygen minimum zone, ISME J., 6, 1200–1209, https://doi.org/10.1038/ismej.2011.178, 2012.
Glibert, P. M., Lipschultz, F., Mccarthy, J. J., and Altabet, M. A.: Isotope Dilution Models of Uptake and Remineralization of Ammonium By Marine Plankton, Limnol. Oceanogr., 27, 639–650, https://doi.org/10.4319/lo.1982.27.4.0639, 1982.
Glibert, P. M., Dennett, M. R., and Goldman, J. C.: Inorganic carbon uptake by phytoplankton in Vineyard Sound, Massachusetts. II. Comparative primary productivity and nutritional status of winter and summer assemblages, J. Exp. Mar. Bio. Ecol., 86, https://doi.org/10.1016/0022-0981(85)90025-5, 1985.
Grasshoff, K., Ehrhardt, M., and, Kremling, K.: Methods of seawater analysis, Verlag Chemie, New York, ISBN 3–527-2599-8, 1983.
Gruber, N., Clement, D., Carter, B. R., Feely, R. A., van Heuven, S., Hoppema, M., Ishii, M., Key, R. M., Kozyr, A., Lauvset, S. K., Monaco, C. Lo, Mathis, J. T., Murata, A., Olsen, A., Perez, F. F., Sabine, C. L., Tanhua, T., and Wanninkhof, R.: The oceanic sink for anthropogenic CO2 from 1994 to 2007, Science, 363, 1193–1199, https://doi.org/10.1126/science.aau5153, 2019.
Haas, S., Robicheau, B. M., Rakshit, S., Tolman, J., Algar, C. K., LaRoche, J., and Wallace, D. W. R.: Physical mixing in coastal waters controls and decouples nitrification via biomass dilution, P. Natl. Acad. Sci. USA, 118, e2004877118, https://doi.org/10.1073/pnas.2004877118, 2021.
Hauck, J., Völker, C., Wolf-Gladrow, D. A., Laufkötter, C., Vogt, M., Aumont, O., Bopp, L., Buitenhuis, E. T., Doney, S. C., Dunne, J., Gruber, N., Hashioka, T., John, J., Quéré, C. Le, Lima, I. D., Nakano, H., Séférian, R., and Totterdell, I.: On the Southern Ocean CO2 uptake and the role of the biological carbon pump in the 21st century, Global Biogeochem. Cy., 29, 1451–1470, https://doi.org/10.1002/2015GB005140, 2015.
Heiss, E. M. and Fulweiler, R. W.: Erratum to “Coastal water column ammonium and nitrite oxidation are decoupled in summer” Estuar. Coast. Shelf Sci., 193, 37–45, https://doi.org/10.1016/j.ecss.2016.12.026, 2017.
Holmes, R. M., Aminot, A., Kerouel, R., Hooker, B. A., and Peterson, B. J.: A simple and precise method for measuring ammonium in marine and freshwater ecosystems, Can. J. Fish. Aquat. Sci., 56, 1801–1808, https://doi.org/10.1139/cjfas-56-10-1801, 1999.
Horak, R. E. A., Qin, W., Schauer, A. J., Armbrust, E. V., Ingalls, A. E., Moffett, J. W., Stahl, D. A., and Devol, A. H.: Ammonia oxidation kinetics and temperature sensitivity of a natural marine community dominated by Archaea, ISME J., 7, 2023–2033, https://doi.org/10.1038/ismej.2013.75, 2013.
Horrigan, S., Carlucci, F., and Williams, P.: Light inhibition of nitrification in sea surface films, J. Mar. Res., 39, 557–565, 1981.
Horrigan, S. G., Montoya, J. P., Nevins, J. L., McCarthy, J. J., Ducklow, H., Goericke, R., and Malone, T.: Nitrogenous nutrient transformations in the spring and fall in the Chesapeake Bay, Estuar. Coast. Shelf Sci., 30, 369–391, https://doi.org/10.1016/0272-7714(90)90004-B, 1990.
Jacob, J., Nowka, B., Merten, V., Sanders, T., Spieck, E., and Dähnke, K.: Oxidation kinetics and inverse isotope effect of marine nitrite-oxidizing isolates, Aquat. Microb. Ecol., 80, 289–300, https://doi.org/10.3354/ame01859, 2017.
Kalvelage, T., Lavik, G., Lam, P., Contreras, S., Arteaga, L., Löscher, C. R., Oschlies, A., Paulmier, A., Stramma, L., and Kuypers, M. M. M.: Nitrogen cycling driven by organic matter export in the South Pacific oxygen minimum zone, Nat. Geosci., 6, 228–234, https://doi.org/10.1038/ngeo1739, 2013.
Kendall, C.: USGS – Isotope Tracers – Resources: Isotope Tracers in Catchment Hydrology – Chapter 16, Isot. Tracers Catchment Hydrol. Elsevier Sci. B.V, ISBN 9780444501554, 1998.
Khatiwala, S., Primeau, F., and Hall, T.: Reconstruction of the history of anthropogenic CO2 concentrations in the ocean, Nature, 462, 346–349, https://doi.org/10.1038/nature08526, 2009.
Kiefer, D. A., Olson, R. J., and Holm-Hansen, O.: Another look at the nitrite and chlorophyll maxima in the central North Pacific, Deep. Res. Oceanogr. Abstr., 23, https://doi.org/10.1016/0011-7471(76)90895-0, 1976.
Kits, K. D., Sedlacek, C. J., Lebedeva, E. V., Han, P., Bulaev, A., Pjevac, P., Daebeler, A., Romano, S., Albertsen, M., Stein, L. Y., Daims, H., and Wagner, M.: Kinetic analysis of a complete nitrifier reveals an oligotrophic lifestyle, Nature, 549, 269–272, https://doi.org/10.1038/nature23679, 2017.
Kitzinger, K., Marchant, H. K., Bristow, L. A., Herbold, C. W., Padilla, C. C., Kidane, A. T., Littmann, S., Daims, H., Pjevac, P., Stewart, F. J., Wagner, M., and Kuypers, M. M. M.: Single cell analyses reveal contrasting life strategies of the two main nitrifiers in the ocean, Nat. Commun., 11, https://doi.org/10.1038/s41467-020-14542-3, 2020.
Kowalchuk, G. A. and Stephen, J. R.: Ammonia-oxidizing bacteria: A model for molecular microbial ecology, Annu. Rev. Microbiol., 55, 485–529, https://doi.org/10.1146/annurev.micro.55.1.485, 2001.
Kozlowski, J. A., Stieglmeier, M., Schleper, C., Klotz, M. G., and Stein, L. Y.: Pathways and key intermediates required for obligate aerobic ammonia-dependent chemolithotrophy in bacteria and Thaumarchaeota, ISME J., 10, 1836–1845, https://doi.org/10.1038/ismej.2016.2, 2016.
Lomas, M. W. and Lipschultz, F.: Forming the primary nitrite maximum: Nitrifiers or phytoplankton?, Limnol. Oceanogr., 51, 2453–2467, https://doi.org/10.4319/lo.2006.51.5.2453, 2006.
Lücker, S., Wagner, M., Maixner, F., Pelletier, E., Koch, H., Vacherie, B., Rattei, T., Damsté, J. S. S., Spieck, E., Le Paslier, D., and Daims, H.: A Nitrospira metagenome illuminates the physiology and evolution of globally important nitrite-oxidizing bacteria, P. Natl. Acad. Sci. USA, 107, 13479–13484, https://doi.org/10.1073/pnas.1003860107, 2010.
Martens-Habbena, W., Berube, P. M., Urakawa, H., De La Torre, J. R., and Stahl, D. A.: Ammonia oxidation kinetics determine niche separation of nitrifying Archaea and Bacteria, Nature, 461, 976–979, https://doi.org/10.1038/nature08465, 2009.
McIlvin, M. R. and Casciotti, K. L.: Technical updates to the bacterial method for nitrate isotopic analyses, Anal. Chem., 83, 1850–1856, https://doi.org/10.1021/ac1028984, 2011.
Mdutyana, M., Thomalla, S. J., Philibert, R., Ward, B. B., and Fawcett, S. E.: The Seasonal Cycle of Nitrogen Uptake and Nitrification in the Atlantic Sector of the Southern Ocean, Global Biogeochem. Cy., 34, e2019GB006363, https://doi.org/10.1029/2019GB006363, 2020.
Mdutyana, M., Sun, X., Burger, J., Flynn, R., Smith, S., van Horsten, N. R., Bucciarelli, E., Planquette, H., Roychoudhury, A. N., Thomalla, S. J., Ward, B. B., and Fawcett, S. E.: The kinetics of ammonium uptake and oxidation during winter across the Indian sector of the Southern Ocean, Limnol. Oceanogr., 67, 973–991, https://doi.org/10.1002/lno.12050, 2022a.
Mdutyana, M., Marshall, T., Sun, X., Burger, J. M., Thomalla, S. J., Ward, B. B., and Fawcett, S. E.: Controls on nitrite oxidation in the upper Southern Ocean: insights from winter kinetics experiments in the Indian sector, Zenodo [data set], https://doi.org/10.5281/zenodo.6791408, 2022b.
Meincke, M., Bock, E., Kastrau, D., and Kroneck, P. M. H.: Nitrite oxidoreductase from Nitrobacter hamburgensis: redox centers and their catalytic role, Arch. Microbiol., 158, 127–131, https://doi.org/10.1007/BF00245215, 1992.
Milligan, A. J. and Harrison, P. J.: Effects of non-steady-state iron limitation on nitrogen assimilatory enzymes in the marine diatom Thalassiosira weissflogii (Bacillariophyceae), J. Phycol., 36, 78–86, https://doi.org/10.1046/j.1529-8817.2000.99013.x, 2000.
Monod, J.: Recherches sur la croissance des cultures bacteriennes, Hermann Cie, Paris, OCLC no. 6126763, 1942.
Mulholland, M. R. and Bernhardt, P. W.: The effect of growth rate, phosphorus concentration, and temperature on N2 fixation, carbon fixation, and nitrogen release in continuous cultures of Trichodesmium IMS101, Limnol. Oceanogr., 50, 839–849, https://doi.org/10.4319/lo.2005.50.3.0839, 2005.
Newell, S. E., Babbin, A. R., Jayakumar, A., and Ward, B. B.: Ammonia oxidation rates and nitrification in the Arabian Sea, Global Biogeochem. Cycles, 25, 1–10, https://doi.org/10.1029/2010GB003940, 2011.
Newell, S. E., Fawcett, S. E., and Ward, B. B.: Depth distribution of ammonia oxidation rates and ammonia-oxidizer community composition in the Sargasso Sea, Limnol. Oceanogr., 58, 1491–1500, https://doi.org/10.4319/lo.2013.58.4.1491, 2013.
Nowka, B., Daims, H., and Spieck, E.: Comparison of Oxidation Kinetics of Nitrite-Oxidizing Bacteria: Nitrite Availability as a Key Factor in Niche Differentiation, Appl. Environ. Microb., 81, 745–753, https://doi.org/10.1128/AEM.02734-14, 2015.
Olsen, A., Key, R. M., van Heuven, S., Lauvset, S. K., Velo, A., Lin, X., Schirnick, C., Kozyr, A., Tanhua, T., Hoppema, M., Jutterström, S., Steinfeldt, R., Jeansson, E., Ishii, M., Pérez, F. F., and Suzuki, T.: The Global Ocean Data Analysis Project version 2 (GLODAPv2) – an internally consistent data product for the world ocean, Earth Syst. Sci. Data, 8, 297–323, https://doi.org/10.5194/essd-8-297-2016, 2016.
Olson, R.: 15N tracer studies of the primary nitrite maximum, J. Mar. Res., 39, 203–226, 1981a.
Olson, R.: Differential Photoinhibition of Marine Nitrifying Bacteria - a Possible Mechanism for the Formation of the Primary Nitrite Maximum, J. Mar. Res., 39, 227–238, 1981b.
Orsi, H., Whitworth, T., and Nowlin, W. D.: On the meridional extent and fronts of the Antarctic Circumpolar Current Pronounced meridional gradients in surface properties separate waters of the Southern Ocean from the warmer and saltier waters of the subtropical circulations, Deep Sea Res., 42, 641–673, https://doi.org/10.1016/0967-0637(95)00021-W, 1995.
Pachiadaki, M. G., Sintes, E., Bergauer, K., Brown, J. M., Record, N. R., Swan, B. K., and Mathyer, M. E.: Major role of nitrite-oxidizing bacteria in dark ocean carbon fixation, Science, 1051, 1046–1051, 2017.
Pasciak, W. J. and Gavis, J.: Transport Limitation of Nutrient Uptake in Phytoplankton, Limnol. Oceanogr., 19, 881–888, https://doi.org/10.4319/lo.1974.19.6.0881, 1974.
Peng, X., Fuchsman, C. A., Jayakumar, A., Oleynik, S., Martens-Habbena, W., Devol, A. H., and Ward, B. B.: Ammonia and nitrite oxidation in the Eastern Tropical North Pacific, Global Biogeochem. Cy., 29, 2034–2049, https://doi.org/10.1002/2015GB005278, 2015.
Peng, X., Fuchsman, C. A., Jayakumar, A., Warner, M. J., Devol, A. H., and Ward, B. B.: Revisiting nitrification in the Eastern Tropical South Pacific: A focus on controls, J. Geophys. Res.-Oceans, 121, 1667–1684, https://doi.org/10.1002/2015JC011455, 2016.
Peng, X., Fawcett, S. E., van Oostende, N., Wolf, M. J., Marconi, D., Sigman, D. M., and Ward, B. B.: Nitrogen uptake and nitrification in the subarctic North Atlantic Ocean, Limnol. Oceanogr., 63, 1462–1487, https://doi.org/10.1002/lno.10784, 2018.
Philibert, R., Waldron, H., and Clark, D.: A geographical and seasonal comparison of nitrogen uptake by phytoplankton in the Southern Ocean, Ocean Sci., 11, 251–267, https://doi.org/10.5194/os-11-251-2015, 2015.
Pollard, R. T., Lucas, M. I., and Read, J. F.: Physical controls on biogeochemical zonation in the Southern Ocean, Deep. Res. Pt. II, 49, 3289–3305, https://doi.org/10.1016/S0967-0645(02)00084-X, 2002.
Qin, W., Amin, S. A., Martens-Habbena, W., Walker, C. B., Urakawa, H., Devol, A. H., Ingalls, A. E., Moffett, J. W., Armbrust, E. V., and Stahl, D. A.: Marine ammonia-oxidizing archaeal isolates display obligate mixotrophy and wide ecotypic variation, P. Natl. Acad. Sci. USA, 111, 12504–12509, https://doi.org/10.1073/pnas.1324115111, 2014.
Qin, W., Amin, S. A., Lundeen, R. A., Heal, K. R., Martens-Habbena, W., Turkarslan, S., Urakawa, H., Costa, K. C., Hendrickson, E. L., Wang, T., Beck, D. A., Tiquia-Arashiro, S. M., Taub, F., Holmes, A. D., Vajrala, N., Berube, P. M., Lowe, T. M., Moffett, J. W., Devol, A. H., Baliga, N. S., Arp, D. J., Sayavedra-Soto, L. A., Hackett, M., Armbrust, E. V., Ingalls, A. E., and Stahl, D. A.: Stress response of a marine ammonia-oxidizing archaeon informs physiological status of environmental populations, ISME J., 12, 508–519, https://doi.org/10.1038/ismej.2017.186, 2018.
Raven, J. A. and Falkowski, P. G.: Oceanic sinks for atmospheric CO2, Plant, Cell Environ., 22, 741–755, https://doi.org/10.1046/j.1365-3040.1999.00419.x, 1999.
Read, J. F., Pollard, R. T., and Bathmann, U.: Physical and biological patchiness of an upper ocean transect from South Africa to the ice edge near the Greenwich Meridian, Deep. Res. Pt. II, 49, 3713–3733, https://doi.org/10.1016/S0967-0645(02)00108-X, 2002.
Rees, A. P., Joint, I., and Donald, K. M.: Early spring bloom phytoplankton-nutrient dynamics at the Celtic Sea shelf edge, Deep. Res. Pt. I, 46, 483–510, https://doi.org/10.1016/S0967-0637(98)00073-9, 1999.
Saito, M. A., McIlvin, M. R., Moran, D. M., Santoro, A. E., Dupont, C. L., Rafter, P. A., Saunders, J. K., Kaul, D., Lamborg, C. H., Westley, M., Valois, F., and Waterbury, J. B.: Abundant nitrite-oxidizing metalloenzymes in the mesopelagic zone of the tropical Pacific Ocean, Nat. Geosci., 13, 355–362, https://doi.org/10.1038/s41561-020-0565-6, 2020.
Santoro, A. E., Sakamoto, C. M., Smith, J. M., Plant, J. N., Gehman, A. L., Worden, A. Z., Johnson, K. S., Francis, C. A., and Casciotti, K. L.: Measurements of nitrite production in and around the primary nitrite maximum in the central California Current, Biogeosciences, 10, 7395–7410, https://doi.org/10.5194/bg-10-7395-2013, 2013.
Santoro, A. E., Dupont, C. L., Richter, R. A., Craig, M. T., Carini, P., McIlvin, M. R., Yang, Y., Orsi, W. D., Moran, D. M., and Saito, M. A.: Genomic and proteomic characterization of “Candidatus Nitrosopelagicus brevis”: An ammonia-oxidizing archaeon from the open ocean, P. Natl. Acad. Sci. USA, 112, 1173–1178, https://doi.org/10.1073/pnas.1416223112, 2015.
Schaefer, S. C. and Hollibaugh, J. T.: Temperature Decouples Ammonium and Nitrite Oxidation in Coastal Waters, Environ. Sci. Technol., 51, 3157–3164, https://doi.org/10.1021/acs.est.6b03483, 2017.
Schofield, O., Miles, T., Alderkamp, A. C., Lee, S. H., Haskins, C., Rogalsky, E., Sipler, R., Sherrell, R. M., and Yager, P. L.: In situ phytoplankton distributions in the Amundsen Sea Polynya measured by autonomous gliders, Elementa, 3, 000073, https://doi.org/10.12952/journal.elementa.000073, 2015.
Sciandra, A. and Amara, R.: Effects of nitrogen limitation on growth and nitrite excretion rates of the dinoflagellate Prorocentrum minimum, Mar. Ecol. Prog. Ser., 105, 301, https://doi.org/10.3354/meps105301, 1994.
Shafiee, R. T., Snow, J. T., Zhang, Q., and Rickaby, R. E. M.: Iron requirements and uptake strategies of the globally abundant marine ammonia-oxidising archaeon, Nitrosopumilus maritimus SCM1, ISME J., 13, 2295–2305, https://doi.org/10.1038/s41396-019-0434-8, 2019.
Sigman, D. M., Casciotti, K. L., Andreani, M., Barford, C., Galanter, M., and Böhlke, J. K.: A bacterial method for the nitrogen isotopic analysis of nitrate in seawater and freshwater, Anal. Chem., 73, 4145–4153, https://doi.org/10.1021/ac010088e, 2001.
Smart, S. M., Fawcett, S. E., Thomalla, S. J., Weigand, M. a, Reason, C. J. C., and Sigman, D. M.: Isotopic evidence for nitrification in the Antarctic winter mixed layer, Global Biogeochem. Cy., 29, 427–445, https://doi.org/10.1002/2014GB005013, 2015.
Smith, S., Altieri, K. E., Mdutyana, M., Walker, D. R., Parrott, R. G., Gallie, S., Spence, K. A. M., Burger, J. M., and Fawcett, S. E.: Biogeochemical controls on ammonium accumulation in the surface layer of the Southern Ocean, Biogeosciences, 19, 715–741, https://doi.org/10.5194/bg-19-715-2022, 2022.
Sorokin, D. Y., Lücker, S., Vejmelkova, D., Kostrikina, N. A., Kleerebezem, R., Rijpstra, W. I. C., Sinninghe Damsté, J. S., Le Paslier, D., Muyzer, G., Wagner, M., Van Loosdrecht, M. C. M., and Daims, H.: Nitrification expanded: Discovery, physiology and genomics of a nitrite-oxidizing bacterium from the phylum Chloroflexi, ISME J., 6, 2245–2256, https://doi.org/10.1038/ismej.2012.70, 2012.
Spieck, E., Ehrich, S., and Aamand, J.: Isolation and immunocytochemical location of the nitrite-oxidizing system in Nitrospira moscoviensis, Arch. Microbiol., 169, 225–230, https://doi.org/10.1007/s002030050565, 1998.
Sun, X., Ji, Q., Jayakumar, A., and Ward, B. B.: Dependence of nitrite oxidation on nitrite and oxygen in low-oxygen seawater, Geophys. Res. Lett., 44, 7883–7891, https://doi.org/10.1002/2017GL074355, 2017.
Sun, X., Frey, C., Garcia-Robledo, E., Jayakumar, A., and Ward, B. B.: Microbial niche differentiation explains nitrite oxidation in marine oxygen minimum zones, ISME J., 1–13, https://doi.org/10.1038/s41396-020-00852-3, 2021.
Sundermeyer-Klinger, H., Meyer, W., Warninghoff, B., and Bock, E.: Membrane-bound nitrite oxidoreductase of Nitrobacter: evidence for a nitrate reductase system, Arch. Microbiol., 140, 153–158, https://doi.org/10.1007/BF00454918, 1984.
Tagliabue, A., Mtshali, T., Aumont, O., Bowie, A. R., Klunder, M. B., Roychoudhury, A. N., and Swart, S.: A global compilation of dissolved iron measurements: focus on distributions and processes in the Southern Ocean, Biogeosciences, 9, 2333–2349, https://doi.org/10.5194/bg-9-2333-2012, 2012.
Tsoularis, A. and Wallace, J.: Analysis of logistic growth models, Math. Biosci., 179, 21–55, https://doi.org/10.1016/S0025-5564(02)00096-2, 2002.
Ushiki, N., Jinno, M., Fujitani, H., Suenaga, T., Terada, A., and Tsuneda, S.: Nitrite oxidation kinetics of two Nitrospira strains: The quest for competition and ecological niche differentiation, J. Biosci. Bioeng., 123, 581–589, https://doi.org/10.1016/j.jbiosc.2016.12.016, 2017.
Vaccaro, R. F. and Ryther, J. H.: Marine Phytoplankton and the Distribution of Nitrite in the Sea, ICES J. Mar. Sci., 25, 260–271, https://doi.org/10.1093/icesjms/25.3.260, 1960.
Vajrala, N., Martens-Habbena, W., Sayavedra-Soto, L. A., Schauer, A., Bottomley, P. J., Stahl, D. A., and Arp, D. J.: Hydroxylamine as an intermediate in ammonia oxidation by globally abundant marine archaea, P. Natl. Acad. Sci. USA, 110, 1006–1011, https://doi.org/10.1073/pnas.1214272110, 2013.
Volk, T. and Hoffert, M. I.: Ocean carbon pumps: analysis of relative strengths and efficiencies in ocean-driven atmospheric CO2 changes, edited by: Sundquist, E. T. and Broecker, W. S., Geophysical Monograph Series, https://doi.org/10.1029/GM032p0099, 1985.
Walker, C. B., De La Torre, J. R., Klotz, M. G., Urakawa, H., Pinel, N., Arp, D. J., Brochier-Armanet, C., Chain, P. S. G., Chan, P. P., Gollabgir, A., Hemp, J., Hügler, M., Karr, E. A., Könneke, M., Shin, M., Lawton, T. J., Lowe, T., Martens-Habbena, W., Sayavedra-Soto, L. A., Lang, D., Sievert, S. M., Rosenzweig, A. C., Manning, G., and Stahl, D. A.: Nitrosopumilus maritimus genome reveals unique mechanisms for nitrification and autotrophy in globally distributed marine crenarchaea, P. Natl. Acad. Sci. USA, 107, 8818–8823, https://doi.org/10.1073/pnas.0913533107, 2010.
Ward, B. B.: Temporal variability in nitrification rates and related biogeochemical factors in Monterey Bay, California, USA, Mar. Ecol. Prog. Ser., 292, 97–109, https://doi.org/10.3354/meps292097, 2005.
Ward, B. B.: Chapter 5 – Nitrification in Marine Systems, in: Nitrogen in the Marine Environment (2 Edn.), 199–261, https://doi.org/https://doi.org/10.1016/B978-0-12-372522-6.00005-0, 2008.
Ward, B. B. and Kilpatrick, K. A.: Nitrogen Transformations in the Oxic Layer of Permanent Anoxic Basins: The Black Sea and the Cariaco Trench, in: Black Sea Oceanography, https://doi.org/10.1007/978-94-011-2608-3_7, 1991.
Ward, B. B. and Zafiriou, O. C.: Nitrification and nitric oxide in the oxygen minimum of the eastern tropical North Pacific, Deep Sea Res., 35, 1127–1142, https://doi.org/10.1016/0198-0149(88)90005-2, 1988.
Watson, A. J., Schuster, U., Shutler, J. D., Holding, T., Ashton, I. G. C., Landschützer, P., Woolf, D. K., and Goddijn-Murphy, L.: Revised estimates of ocean-atmosphere CO2 flux are consistent with ocean carbon inventory, Nat. Commun., 11, 1–6, https://doi.org/10.1038/s41467-020-18203-3, 2020.
Watson, S. W. and Waterbury, J. B.: Characteristics of Two Marine Nitrite Oxidizing Bacteria, Microscopy, 77, 203–230, https://doi.org/10.1007/BF00408114, 1971.
Watson, S. W., Bock, E., Valois, F. W., Waterbury, J. B., and Schlosser, U.: Nitrospira marina gen. nov. sp. nov.: a chemolithotrophic nitrite-oxidizing bacterium, Arch. Microbiol., 144, 1–7, https://doi.org/10.1007/BF00454947, 1986.
Weigand, M. A., Foriel, J., Barnett, B., Oleynik, S., and Sigman, D. M.: Updates to instrumentation and protocols for isotopic analysis of nitrate by the denitrifier method, Rapid Commun. Mass Spectrom., 30, 1365–1383, https://doi.org/10.1002/rcm.7570, 2016.
Xu, M. N., Li, X., Shi, D., Zhang, Y., Dai, M., Huang, T., Glibert, P. M., and Kao, S. J.: Coupled effect of substrate and light on assimilation and oxidation of regenerated nitrogen in the euphotic ocean, Limnol. Oceanogr., 64, 1270–1283, https://doi.org/10.1002/lno.11114, 2019.
Yool, A., Martin, A. P., Fernández, C., and Clark, D. R.: The significance of nitrification for oceanic new production, Nature, 447, 999–1002, https://doi.org/10.1038/nature05885, 2007.
Zakem, E. J., Al-Haj, A., Church, M. J., Van Dijken, G. L., Dutkiewicz, S., Foster, S. Q., Fulweiler, R. W., Mills, M. M., and Follows, M. J.: Ecological control of nitrite in the upper ocean, Nat. Commun., 9, https://doi.org/10.1038/s41467-018-03553-w, 2018.
Zhang, Y., Qin, W., Hou, L., Zakem, E. J., Wan, X., Zhao, Z., Liu, L., Hunt, K. A., Jiao, N., Kao, S. J., Tang, K., Xie, X., Shen, J., Li, Y., Chen, M., Dai, X., Liu, C., Deng, W., Dai, M., Ingalls, A. E., Stahl, D. A., and Herndl, G. J.: Nitrifier adaptation to low energy flux controls inventory of reduced nitrogen in the dark ocean, P. Natl. Acad. Sci. USA, 117, 4823–4830, https://doi.org/10.1073/pnas.1912367117, 2020.