the Creative Commons Attribution 4.0 License.
the Creative Commons Attribution 4.0 License.
 | 27 Jul 2022
Assessment of the impacts of biological nitrogen fixation structural uncertainty in CMIP6 earth system models
Taraka Davies-Barnard
Sönke Zaehle
Pierre Friedlingstein
Biological nitrogen fixation is the main source of new nitrogen into natural terrestrial ecosystems and consequently in the nitrogen cycle in many earth system models. Representation of biological nitrogen fixation varies, and because of the tight coupling between the carbon and nitrogen cycles, previous studies have shown that this affects projected changes in net primary productivity. Here we present the first assessment of the performance of biological nitrogen fixation in models contributing to CMIP6 compared to observed and observation-constrained estimates of biological nitrogen fixation. We find that 9 out of 10 models represent global total biological nitrogen fixation within the uncertainty in recent global estimates. However, 6 out of 10 models overestimate the amount of fixation in the tropics and therefore the extent of the latitudinal gradient in the global distribution. For the SSP3-7.0 scenario of future climate change, models project increases in fixation over the 21st century of up to 80 %. However, while the historical range of biological nitrogen fixation amongst models is large (up to 140 kg N ha−1 yr−1 at the grid cell level and 43–208 Tg N yr−1 globally) this does not have explanatory power for variations within the model ensemble of net primary productivity or the coupled nitrogen–carbon cycle. Models with shared structures can have significant variations in both biological nitrogen fixation and other parts of the nitrogen cycle without differing in their net primary productivity. This points to systematic challenges in the representation of carbon–nitrogen model structures and the severe limitations of models using net primary productivity or evapotranspiration to project the biological nitrogen fixation response to elevated atmospheric carbon dioxide or other environmental changes.
- Article
(1011 KB) - Full-text XML
-
Supplement
(328 KB) - BibTeX
- EndNote


In a key innovation to CMIP5, the majority of earth system models (ESMs) of the latest generation that contribute to CMIP6 (Eyring et al., 2016) include a nitrogen cycle to better represent the terrestrial carbon cycle (Arora et al., 2020; Davies-Barnard et al., 2020). Nitrogen is a key nutrient requirement for plants to take up carbon and, in its bioavailable inorganic form, is highly liable to losses via gaseous and water processes (Thomas et al., 2013; Vitousek and Howarth, 1991). Over the last few decades, terrestrial carbon uptake has sequestered around a quarter of anthropogenic carbon emissions (Friedlingstein et al., 2020). However, previous assessments of ESMs have suggested that future projections of terrestrial carbon storage are decreased by 37 %–58 % if nitrogen availability is accounted for (Wieder et al., 2015; Zaehle et al., 2014). Therefore, the accuracy of ESMs, which help guide policy on preventing further climate change, is partly determined by the functioning of the nitrogen cycles within them.
The uptake of new carbon by plants is reliant on new sources of nitrogen as existing nitrogen may not be bioavailable. The sources of this new input of nitrogen vary by biome, including anthropogenic inputs via addition of 70–108 Tg of fertilizer per year (Lu and Tian, 2017; Potter et al., 2010) and increased deposition and natural sources such as lightning 3.5–7 Tg N yr−1 (Tie et al., 2002), atmospheric N deposition 63 Tg N yr−1 (Lamarque et al., 2013), weathering (Holloway and Dahlgren, 2002), and biological nitrogen fixation (BNF) 40–141 Tg N yr−1 (Davies-Barnard and Friedlingstein, 2020; Vitousek et al., 2013). In many natural ecosystems BNF is likely the largest natural or anthropogenic source of new nitrogen to the terrestrial biosphere. But because of the intricate processes that control fixation and the lack of global estimates from observations, it is also the most uncertain (Meyerholt et al., 2016; Reed et al., 2011). Therefore, continued carbon sequestration in critical natural ecosystems that are present-day and future carbon sinks is reliant on BNF. We need to know how well models are representing the current quantity and distribution of BNF to assess the reliability of the functions and therefore the robustness of future projections of terrestrial carbon uptake. Studies of individual models suggest differences in representation of BNF can lead to widely differing future terrestrial carbon sequestration (Meyerholt et al., 2016; Peng et al., 2020; Wieder et al., 2015). Therefore inaccuracies in BNF representation could lead to errors in allowable emissions (Jones et al., 2013) for targets such as constraining warming to 1.5 or 2 ∘C (Millar et al., 2017).
BNF is performed by a large range of bacteria in virtually all parts of the terrestrial environment, including soil, litter, leaf canopy, and decaying wood and in association with bryophytes, lichens, and angiosperms (Davies-Barnard and Friedlingstein, 2020; Reed et al., 2011; Son, 2001; Tedersoo et al., 2018). BNF is frequently classified into symbiotic (higher plant association) and free-living pathways (Cleveland et al., 1999; Reed et al., 2011). Symbiotic BNF makes up around two-thirds of BNF and free-living BNF around one-third (Davies-Barnard and Friedlingstein, 2020) or as much as 49 Tg N yr−1 (Elbert et al., 2012).
Despite the complexity of BNF, most models have a simple BNF representation based on either (i) a linear relationship with net primary productivity (NPP) or (ii) a linear relationship with evapotranspiration (ET), both derived from Cleveland et al. (1999) (see Table 1). However, recent analyses show that in non-agricultural biomes ET and NPP are poor predictors of both symbiotic and free-living BNF (Davies-Barnard and Friedlingstein, 2020; Dynarski and Houlton, 2018). Models with more complex representations are mainly based on plant nitrogen demand, physiological limits, or optimality approaches (Fisher et al., 2010; Meyerholt et al., 2016; Wang et al., 2007) (see Table 1). While single model assessments have shown the importance of BNF to carbon sequestration, affecting the terrestrial carbon sink by up to a third (Meyerholt et al., 2016, 2020; Wieder et al., 2015), the performance of multiple models has hitherto not been assessed against observed BNF values.
Table 1Summary of the model's BNF representations. The theoretical maximum BNF value refers to any limit imposed by the equations in the model, e.g. a saturation point.

2.1 ESM simulations
We use results from 10 ESMs: CMCC-CM2, TaiESM1, CESM2, NorESM2, UKESM1, AWI-ESM, MPI-ESM, ACCESS, EC-Earth, and MIROC. The simulations used were the historical runs from CMIP6 deck simulations (Eyring et al., 2016) of the World Climate Research Programme for the period 1950–2014. A list of the reference IDs of the simulations used can be found in the Supplement.
2.2 Land surface model simulations
As an additional check on the performance of the ESMs, we also looked at the BNF of a number of land surface models (LSMs) in offline simulations included in the Supplement. The LSMs used were CLM5, CLM4.5, JSBACH, JULES, and LPJ-GUESS and are all used within ESMs considered here. These simulations and their methodology are fully described in Davies-Barnard et al. (2020).
2.3 BNF in the models
A summary of the models can be found in Table 1. Although there appears to be a range of approaches to BNF, every model considered here is partially or entirely based on Cleveland et al. (1999).
2.3.1 CABLE and CASACNP – used in ACCESS
The nitrogen cycle in the CABLE model (Law et al., 2017) of the ACCESS ESM relies on the CASACNP model, as described by Wang and Houlton (2009) and Wang et al. (2007). Symbiotic BNF is calculated as a function of soil moisture, soil temperature, soil N availability, and NPP. Free-living BNF is calculated using biome-level observational averages adapted from Cleveland et al. (1999) with a range of 0.7–9.2 kg N ha−1 yr−1 (tropical forest is the highest; needleleaf forest is the lowest) (Wang and Houlton, 2009).
2.3.2 CLM4.5 – used in CMCC-CM2 and TaiESM1
The Community Land Model version 4.5 (CLM4.5; Koven et al., 2013; Oleson et al., 2010) is used in the Euro-Mediterranean Centre on Climate Change coupled climate model (CMCC-CM2; Cherchi et al., 2019) and TaiESM1 (Wang et al., 2021). The N component is described in Koven et al. (2013).
BNF is calculated as an exponential saturating function of NPP based on Thornton et al. (2007), which is based on Cleveland et al. (1999) with a 7 d lag to match seasonal BNF to NPP. There is no differentiation between symbiotic and free-living BNF.
2.3.3 CLM5 – used in CESM2 and NorESM2
The Community Land Model version 5 (CLM5; Lawrence et al., 2019) is used in the Community Earth System Model version 2 (CESM2; Danabasoglu et al., 2020) and the Norwegian Earth System Model version 2 (NorESM2; Seland et al., 2020). CLM5 is the latest version of CLM and represents a suite of developments on top of CLM4.5. The N component is described in Fisher et al. (2010) and Shi et al. (2016).
Symbiotic BNF is calculated on a carbon cost basis for acquiring N, derived from the fixation and uptake of nitrogen (FUN) approach (Fisher et al., 2010). Free-living BNF in CLM5 is calculated separately as a function of evapotranspiration based on Cleveland et al. (1999) and Lawrence et al. (2019).
2.3.4 JSBACH – used in MPI-ESM and AWI-ESM1
The JSBACH version 3.20 model (Goll et al., 2017) is used in the Max Planck Earth System Model version 1.2 (MPI-ESM; Mauritsen et al., 2019) and Alfred Wegener Institute Earth System Model (AWI-ESM) (Contzen et al., 2022). The N component is described in Goll et al. (2017).
BNF is calculated as an exponential saturating function of NPP based on Thornton et al. (2007), which is based on Cleveland et al. (1999). The BNF function is calibrated to produce 100 Tg N yr−1 with NPP of 65 Pg yr−1 (Goll et al., 2017). There is no differentiation between symbiotic and free-living BNF.
2.3.5 JULES – used in UKESM1
The Joint UK Land Environment Simulator version 5.4 (JULES-ES; Best et al., 2011; Clark et al., 2011) is used in the UK Earth System Model (UKESM1; Sellar et al., 2019). The N component is described in Wiltshire et al. (2021) and Sellar et al. (2019).
BNF is calculated as a linear function of NPP, 0.00016 kg N per kg C NPP (Wiltshire et al., 2021), based on Cleveland et al. (1999). There is no differentiation between symbiotic and free-living BNF.
2.3.6 LPJ-GUESS – used in EC-Earth
The Lund–Potsdam–Jena General Ecosystem Simulator version 4.0 (LPJ-GUESS; Olin et al., 2015; Smith et al., 2014) is used in the European Community Earth-System Model (EC-Earth; Hazeleger et al., 2012). The N component is described in Smith et al. (2014).
BNF is a linear function of ET, 0.0102 ET (mm yr−1) +0.524 (Smith et al., 2014), based on Cleveland et al. (1999). There is no differentiation between symbiotic and free-living BNF. The amount of BNF is capped at 20 kg N ha−1 yr−1.
2.3.7 VISIT-e – used in MIROC
VISIT-e is used in the Model for Interdisciplinary Research on Climate, Earth System version 2 for Long-term simulations (MIROC-ES2L) (Hajima et al., 2020). The nitrogen component is described in Hajima et al. (2020).
BNF is a linear function of ET, based on Cleveland et al. (1999). Symbiotic and free-living BNF is calculated using the same function and distinguished by symbiotic BNF being directly available to plants, whereas free-living BNF is assumed to be part of the litter. Symbiotic BNF represents 50 % of BNF. In cropland a higher level of BNF occurs for nitrogen-fixing crops, but non-fixing crops have the same BNF as natural vegetation (Hajima et al., 2020).
2.4 Observations
Following the methods of Davies-Barnard and Friedlingstein (2020) we reviewed the BNF literature to find observational data that covered all, or close to all, BNF at a field site (i.e. including symbiotic and free-living fixation of as many BNF types as are present). The locations of the site observations used can be found in Fig. S1 in the Supplement. Further details of the observations are in Table S1 in the Supplement. Few measurements are available, with studies usually focusing on either symbiotic or free-living BNF. Since recent meta-analysis suggests that free-living BNF is approximately a third of total BNF, and higher in some regions, we only consider data that include explicitly both symbiotic and free-living BNF or state that all sources of BNF are measured.
3.1 Present-day BNF
The majority of the models have total global BNF between 80 and 130 Tg N yr−1 (Fig. 1a), within the uncertainties in two recent observation-based BNF estimates (Davies-Barnard and Friedlingstein, 2020; Vitousek et al., 2013). The range between CMCC, TaiESM1, UKESM1, MPI-ESM, and AWI-ESM, which all calculate BNF from NPP, is just 36 Tg N yr−1. There is, in some instances, as much variation in global total BNF within models that share components as between different models (see Sect. 2). For instance, CESM2 and NorESM2 share the same land surface model, and the modelled BNF is still different by 43 Tg N yr−1. However, there is little relationship between BNF function and total global BNF, with the two models using BNF based on ET encompassing the lowest and second-highest values. This is suggestive of a substantial role for climate in modelling of BNF and a deliberate clustering to the most common BNF estimate (Davies-Barnard and Friedlingstein, 2020).
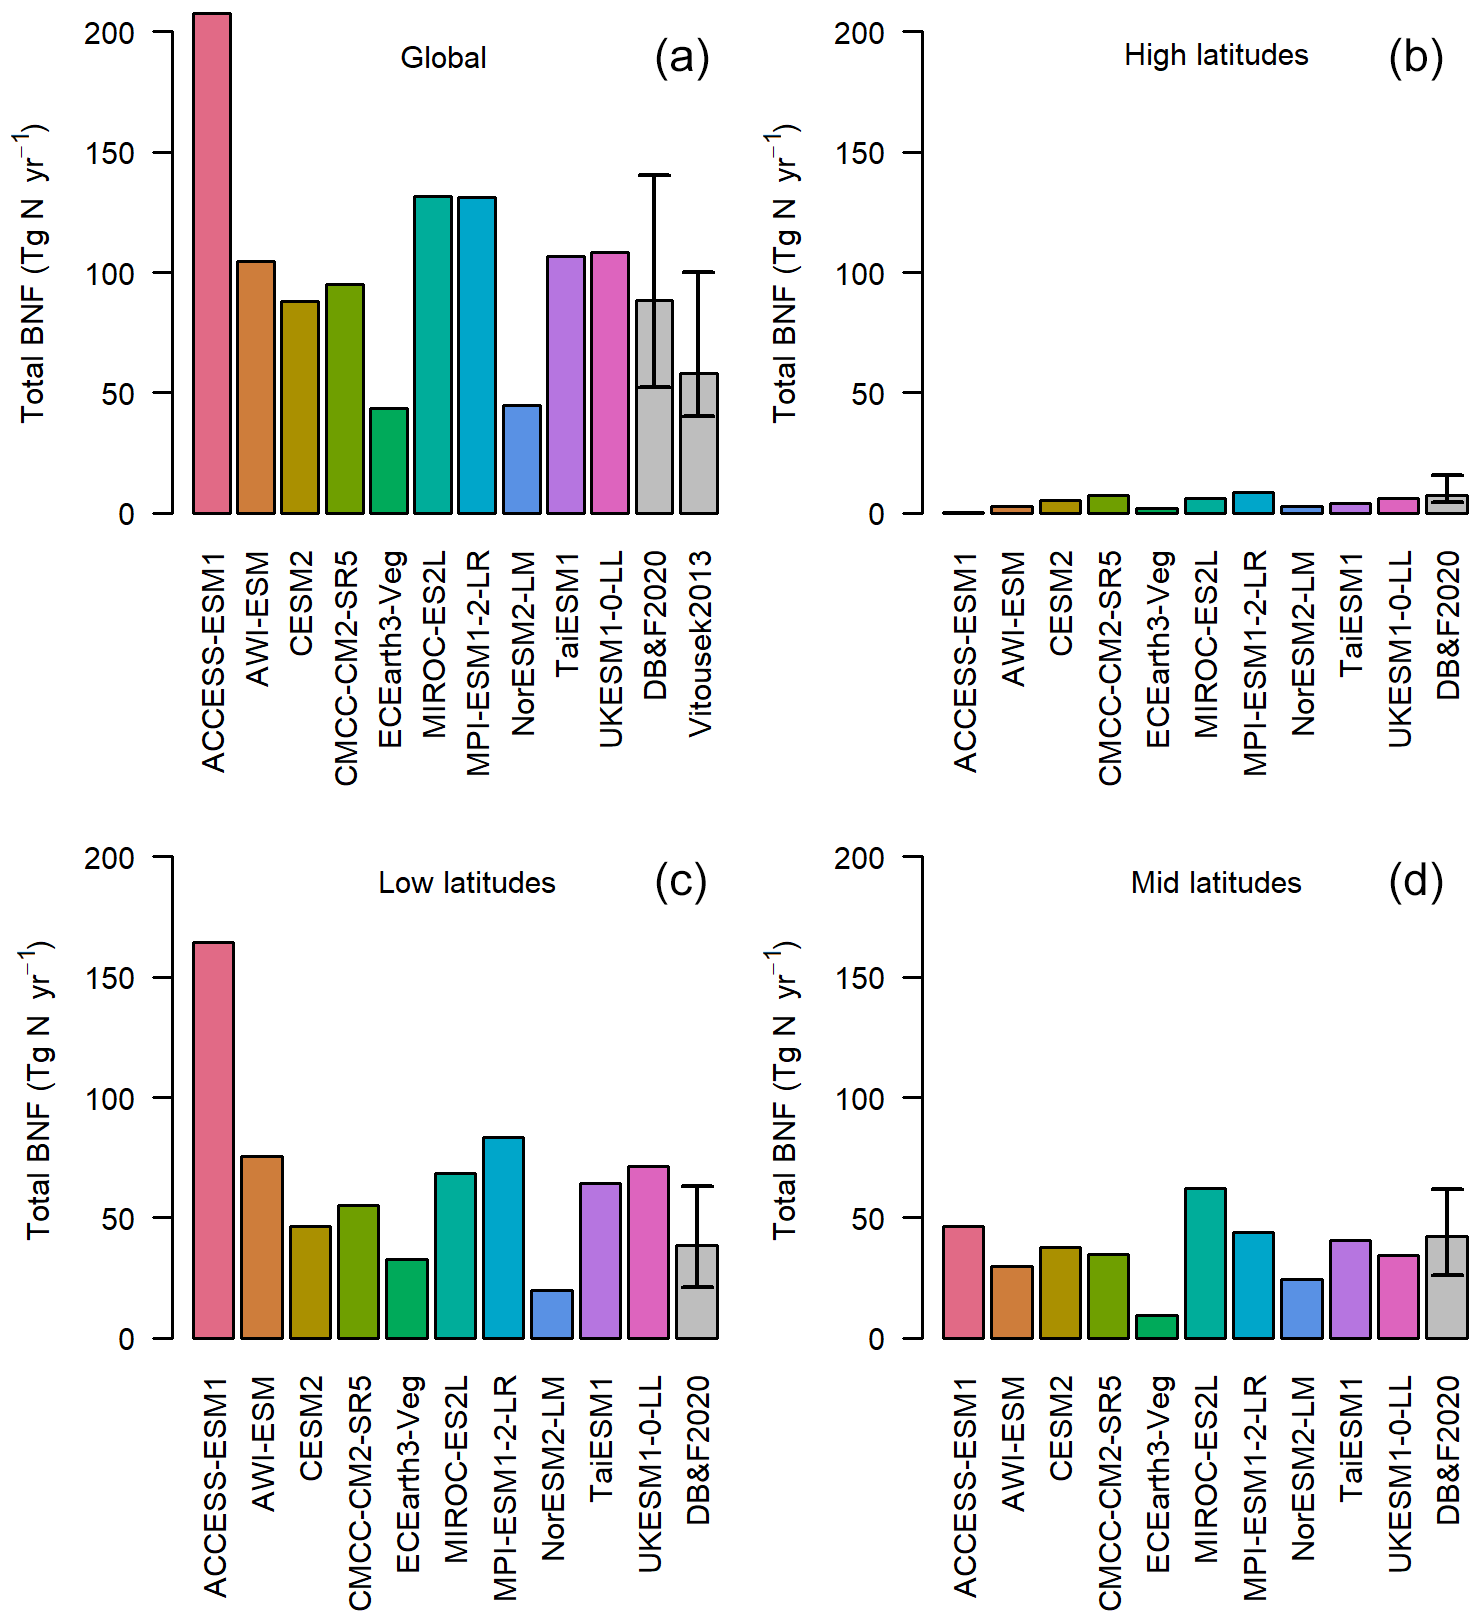
Figure 1The global total annual BNF (Tg N yr−1) for the average of the period 1980–2014. The grey bars represent the observationally constrained ranges by Davies-Barnard and Friedlingstein (2020) and Vitousek et al. (2013). The four panels represent latitude bands and global. High latitudes: more than 60∘ N or 60∘ S. Mid-latitudes: less than 60∘ N and more than 30∘ N, less than 60∘ S and more than 30∘ S. Low latitudes: less than 30∘ N and less than 30∘ S.
However, while for most ESMs the global BNF estimates show good agreement with Davies-Barnard and Friedlingstein (2020) and Vitousek et al. (2013), the majority of models predict too much BNF in the tropics. In the low latitudes (30∘ N to 30∘ S) 6 of the 10 models are above the observation-based estimate (Fig. 1c), but in the mid-latitudes only 1 model is above (Fig. 1d) and in the high latitudes none (Fig. 1b). The multi-model mean of BNF from CMIP6 ESMs compared to an observation-based estimate (Fig. 2) shows a broad agreement in spatial patterns, although there are clear weaknesses of the ESMs' BNF estimates in tropical forests, where BNF is overestimated. This is to be expected as most of the models are based on the data and linear modelling presented in Cleveland et al. (1999). However, that linear modelling has been superseded, and recent studies have shown much lower BNF in tropical forests (Davies-Barnard and Friedlingstein, 2020; Sullivan et al., 2014; Vitousek et al., 2013). Although there are sources of error in the models, notably differing climate in the models' historical simulation compared to observations, these errors persist in the land surface model components of the ESMs when driven with observed data (see Fig. S2).

Figure 2Map of observation-biome-based estimates of BNF in kg N ha−1 yr−1 (a) and a map of multi-model mean BNF for the period 1980–2015 (b).
The pattern of high BNF in the tropics is partly due to a small number of models with very high BNF (Fig. S3). ACCESS has areas of anomalously high BNF in the tropics of up to 139 kg N ha−1 yr−1. MIROC also has grid cells of up to 193 kg N ha−1 yr−1, whereas in other models the tropical peak is below 41 kg N ha−1 yr−1. While measurements of BNF from individual nitrogen-fixating plants can be over 100 kg N ha−1 yr−1, these rarely occur at a density of more than 30 % cover (Davies-Barnard and Friedlingstein, 2020). At the field scale BNF rarely exceeds around 15 kg N ha−1 yr−1 for free-living BNF and 20 kg N ha−1 yr−1 for symbiotic BNF (Davies-Barnard and Friedlingstein, 2020). Therefore, values much above 35 kg N ha−1 yr−1 at an ESM grid cell level seem improbable.
Comparison of models to individual BNF field-scale observations of all BNF (free-living and symbiotic) (Fig. 3) shows similar differences in latitudinal variation as the global and averaged data comparisons (Figs. 1 and 2). The models underestimate mid-latitude wetland and peatland BNF (Massachusetts and S Germany; Fig. 3b) (Schwintzer, 1983; Waughman and Bellamy, 1980) and desert BNF (Negev desert, Israel; Fig. 3b) (Russow et al., 2008). These locations show the systemic problem with BNF predicated on NPP and focused on symbiotic BNF. Although the NPP is relatively low, the BNF is high due to the presence of free-living BNF (Russow et al., 2008; Schwintzer, 1983; Waughman and Bellamy, 1980). Free-living BNF is less likely to adhere to the assumption of being related to plant productivity as by definition it is not directly associated with plants. Symbiotic BNF represents only 0.11 kg N ha−1 yr−1 in the Negev desert measurements, but the biological crusts fix 9–13 kg N ha−1 yr−1 (Russow et al., 2008). Considering only symbiotic BNF the models are on the correct order of magnitude. Unlike other observation sites, where some discrepancies between models and observations can be partially attributed to differences in land cover, the models are capturing desert as a low-productivity environment, with the NPP- and ET-based models all having very low BNF. The error therefore is in the assumption that low productivity equates to low BNF. However, it is unclear at what timescale free-living BNF becomes available to plants, and it remains uncertain to what extent it contributes to future carbon sequestration. Given that free-living BNF makes up 34 %–49% of total BNF, this suggests that in terms of BNF that is bioavailable to plants contributing significantly to NPP, the modelled values ought to be lower than the global estimates shown above.
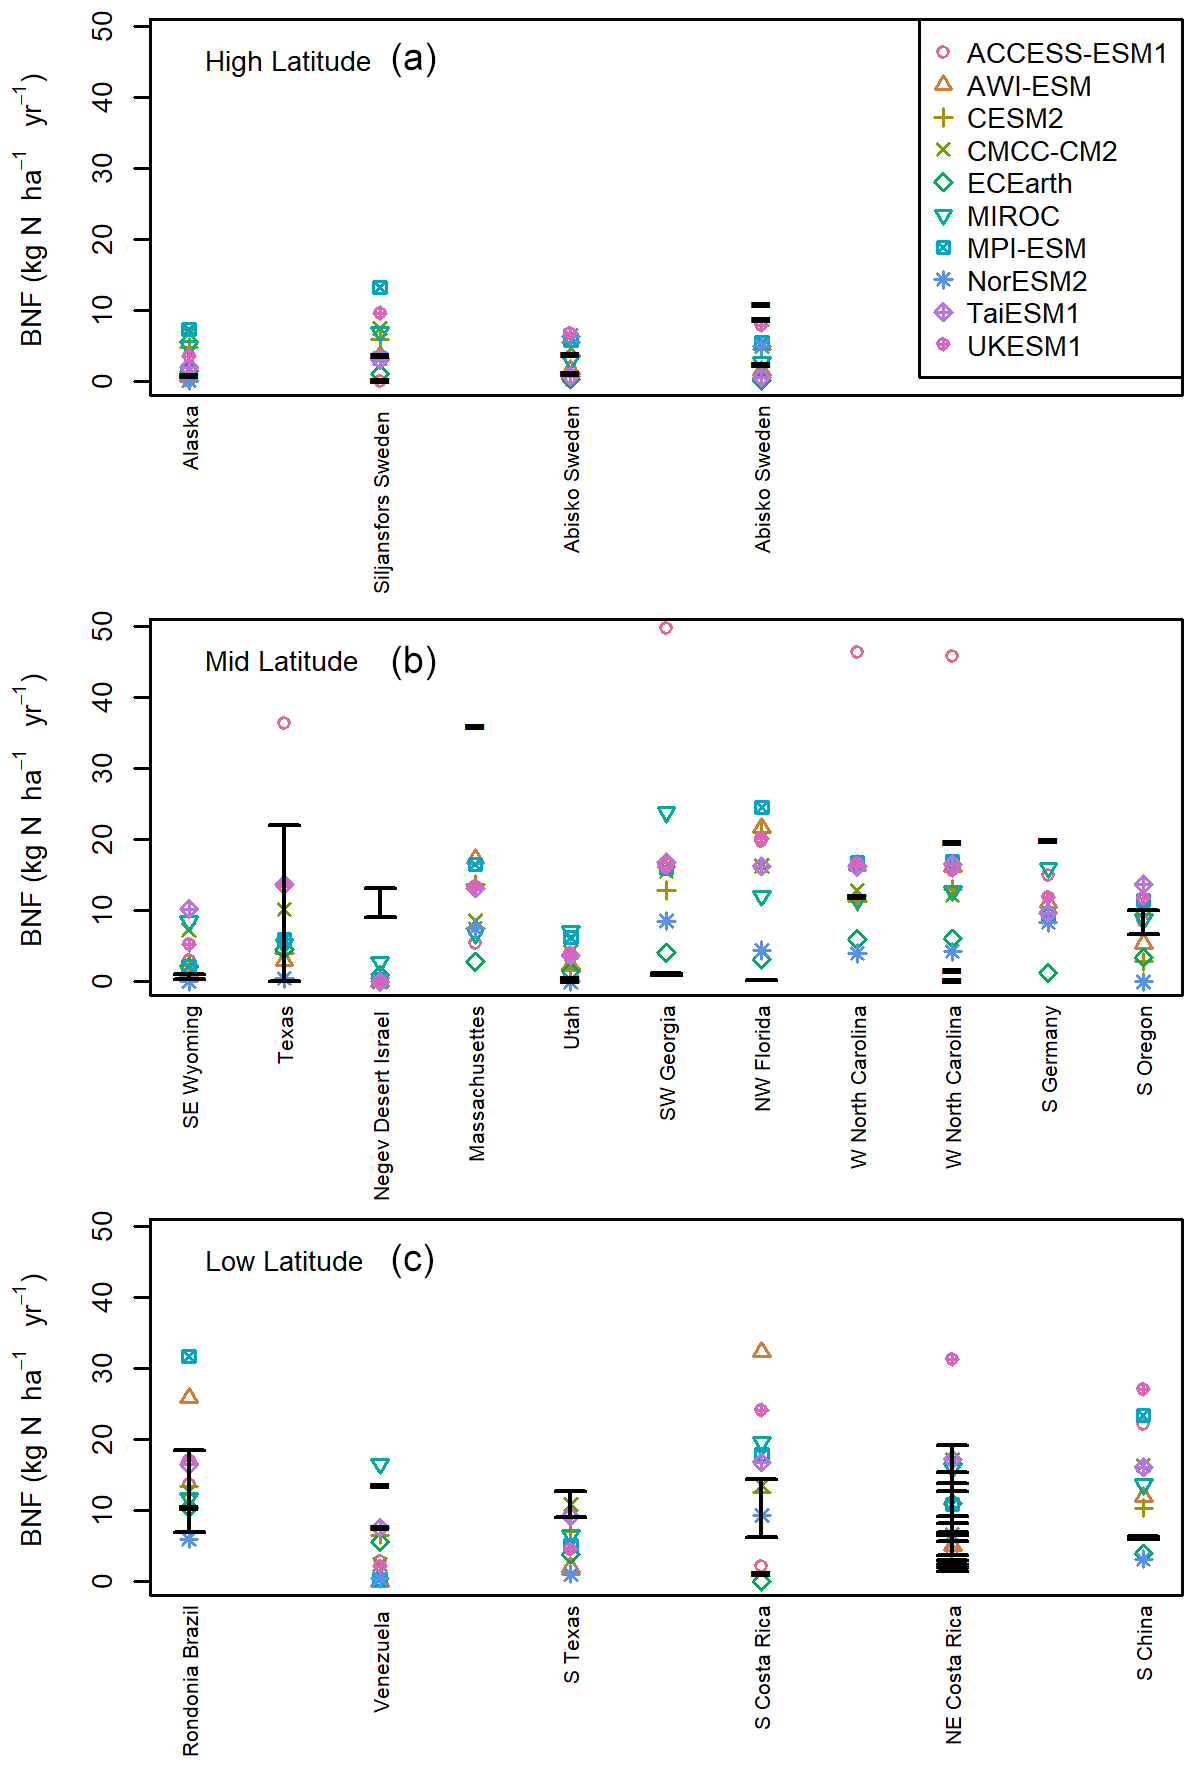
Figure 3BNF field-scale observations in kg N ha−1 yr−1 plotted over the model BNF value for the nearest grid cell, matched to the latitude and longitude. (a) More than 60∘ N or 60∘ S. (b) Less than 60∘ N and more than 30∘ N, less than 60∘ S and more than 30∘ S. (c) Observations less than 30∘ N and less than 30∘ S. The black lines represent single values or the confidence range as reported by the paper the observational data come from (see Table S1).
The low latitudes have a similar observed distribution of BNF to the mid-latitudes, but the models generally have higher BNF, with three stark examples (Fig. 3). These are all forest locations (Tierney et al., 2019; Zheng et al., 2016) with either tropical broadleaf or pine species and relatively high-productivity environments. We can see from these locations as well as the tropical forests of S Costa Rica (Sullivan et al., 2014) that the NPP-based models are particularly liable to overestimations of BNF in the tropics.
3.2 BNF in future under SSP3-7.0
All the models simulate an increase in NPP over the 21st century in SSP3-7.0 due to the combined effects of rising atmospheric carbon dioxide and climate change. Given the constrained stoichiometric ratios within plants and soils, such an increase in productivity requires additional nitrogen to sustain growth. Work on the structural uncertainty in the carbon cycle caused by BNF in individual models (Meyerholt et al., 2016, 2020; Wieder et al., 2015) indicates that changes in the representation of BNF and its assumed dependency on NPP, ET, or plant N demand lead to significant variation in carbon storage under elevated atmospheric carbon dioxide within the same model structure. In the context of these results and the large range of present-day BNF simulated between CMIP6 models, it would be a logical corollary if the magnitude of simulated changes in NPP were associated with the magnitude of simulated change in BNF in the SSP3-7.0 scenario. However, in this ensemble, the increases in BNF are not proportional to those in NPP, suggesting that other model structural differences affecting the carbon cycle response to atmospheric carbon dioxide and climate change superseded the direct impact of the BNF parameterization (Fig. 4a and b).
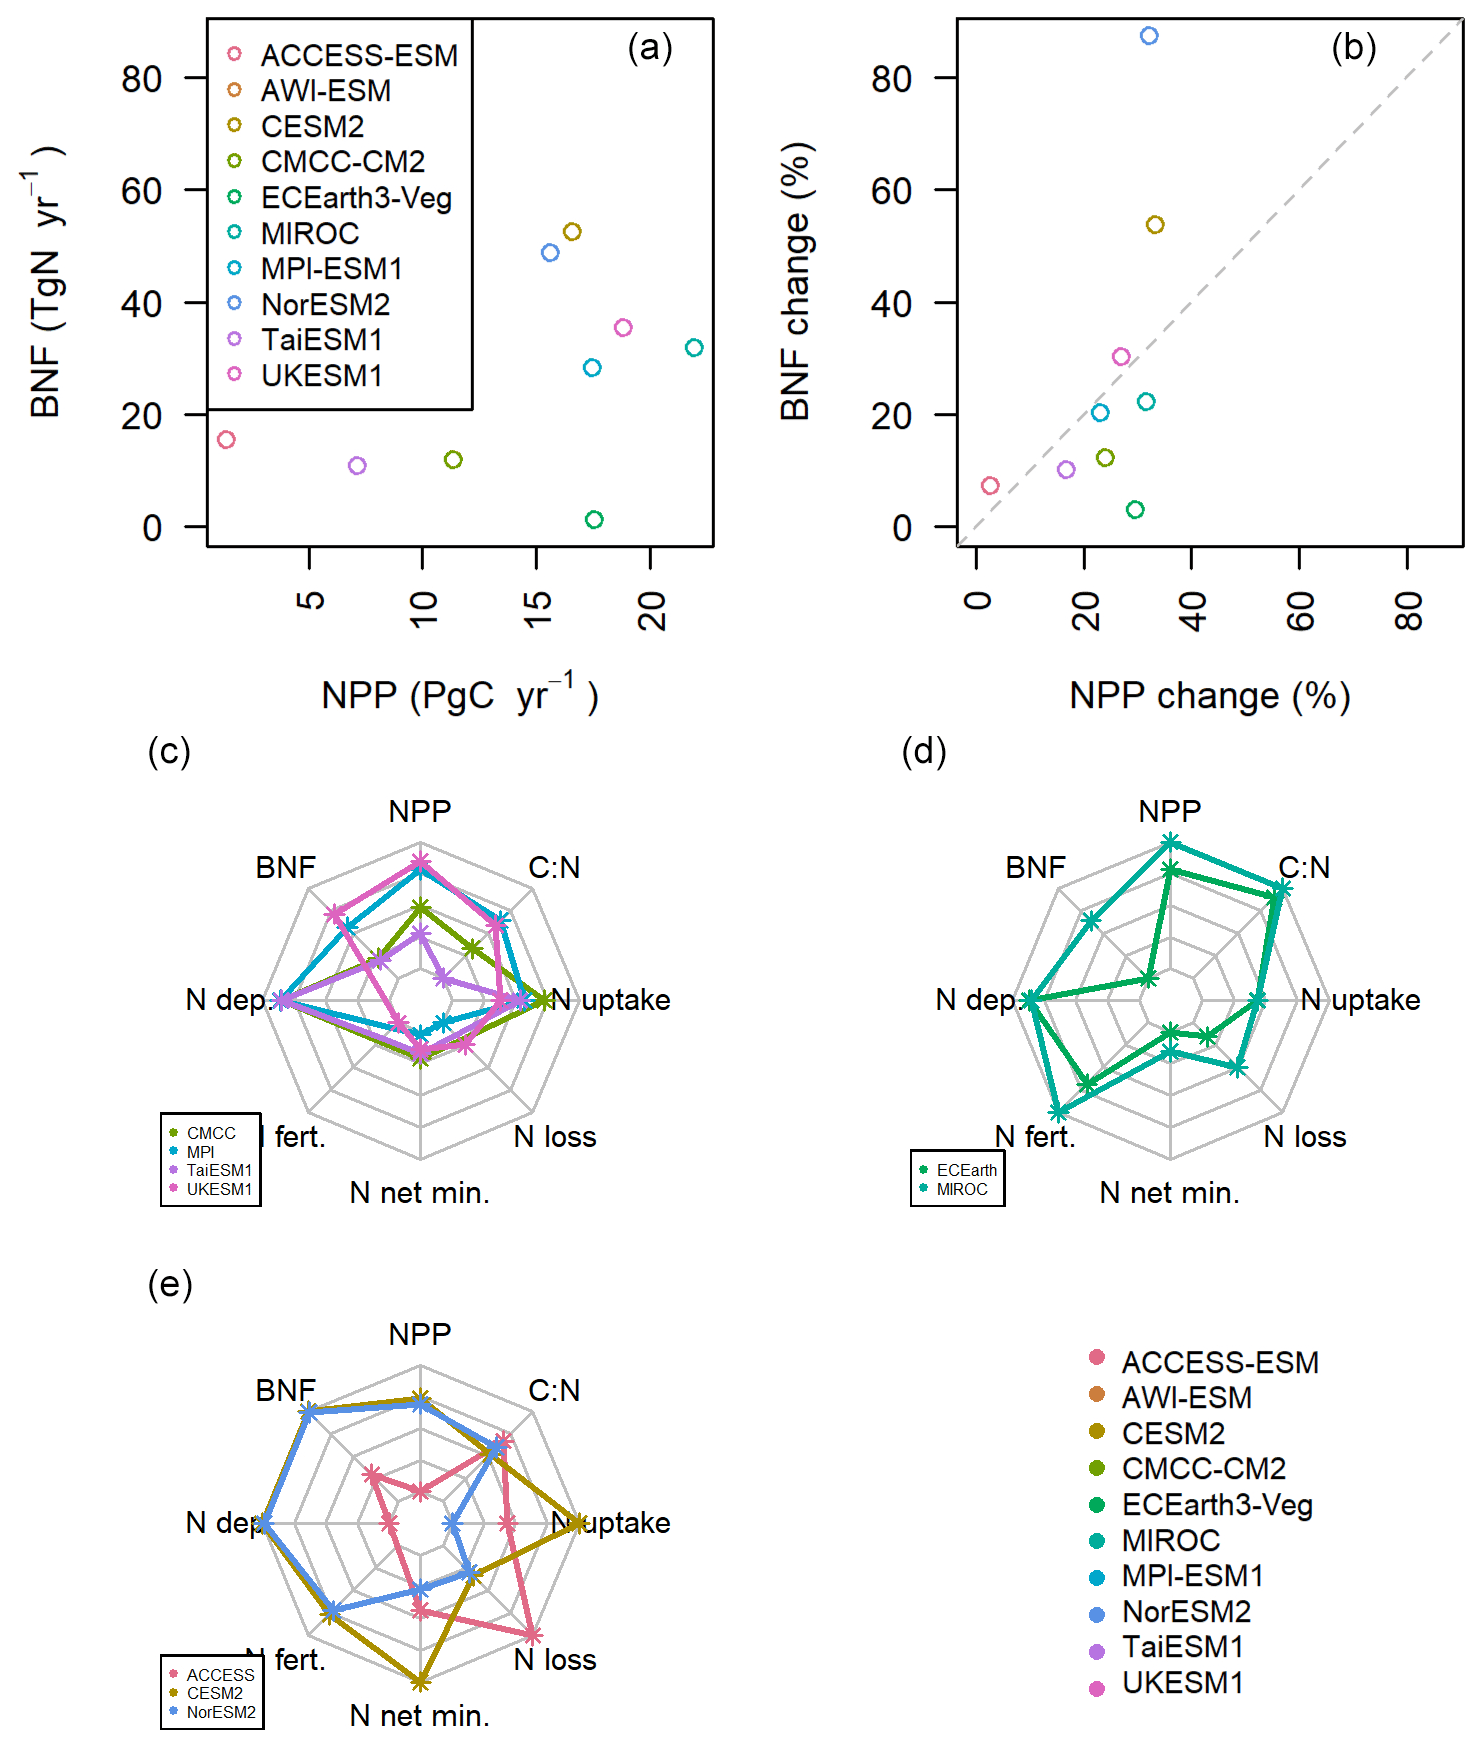
Figure 4(a, b) The change in BNF and NPP between the first and last decade of SSP3-7.0. (c, d, e) The normalized changes in nitrogen components in the models. Each dot represents the normalized change in the variable during the 21st century in SSP3-7.0. Each line represents a model, and each plot is a group of models that deal with BNF similarly (from the top left: carbon cost or mechanistic, ET, and NPP).
The models with BNF as a function of NPP should have BNF increases approximately commensurate with their increase in NPP (Fig. 4b). This is true for JSBACH (in MPI-ESM and AWI-ESM) and UKESM1, where relative changes in NPP and BNF fall nearly onto the 1:1 line. CMCC, which employs a similar representation, deviates from parity because in parts of the tropics the simulated BNF is at the saturation level of NPP and has reached the model-prescribed maximum (see Table 1). TaiESM1, which uses the same underlying land model as CMCC, shows a closer relationship between NPP and BNF. This is due to the lower tropical NPP in this model leading to the BNF being further from saturation point compared to CMCC. All these models suggest little change (relative to the whole model ensemble) in net N mineralization or N loss (Fig. 4c), implying that the change in the terrestrial N budget is primarily driven by the NPP-related increase in BNF. The N deposition (where the model output is available) is very similar across these models as they should all have used the same prescribed boundary conditions, as specified by Jones et al. (2016).
EC-Earth has the lowest BNF increase (1.3 Tg N yr−1) over 2090–2100 compared to 2015–2025 under the SSP3-7.0 scenario but a relatively high NPP increase (17.5 Pg C yr−1) (Fig. 4d), whereas the other ET-driven model, MIROC, has the highest increase in NPP (22.0 Pg C yr−1) and a BNF increase of 32.0 Tg N yr−1 (Fig. 4d). In the context of the whole ensemble, these two models have relatively high NPP given their change in BNF (in Fig. 4b they are below the 1:1 proportionality line). Both models also have the two largest increases in vegetation-carbon-to-nitrogen ratios (Fig. 4d; EC-Earth +12.9 and MIROC +17.5, in a model ensemble range of −29.3 to +17.5), probably because of a large fraction of vegetation carbon increase in woody biomass. This C:N ratio change effectively decreases the relative increase in demand for nitrogen associated with the increase in NPP and illustrates that stoichiometry and BNF together affect the magnitude of the nitrogen constraint on terrestrial carbon storage (Meyerholt et al., 2020).
The two models (CESM2 and NorESM2) using the FUN (Fisher et al., 2010) carbon cost function for BNF have almost identical absolute changes in NPP, BNF, N deposition, N fertilization, and N loss (Figs. 4e and S4), despite their divergent results for present day (Sect. 3.1). They have the largest increase in BNF but proportionally less NPP change than BNF (they are above the 1:1 line in Fig. 4 b), which is probably at least partially related to the fact that these models account for the carbon costs of increasing BNF in the calculation of NPP. In effect, the extra supply of nitrogen via BNF in these models is not converting to an increase in NPP as efficiently as in the rest of the model ensemble. Despite their similar land model, CESM2 has the largest N uptake increase in all the models in the ensemble, whereas NorESM2 is the only model projecting a decrease in plant N uptake (346 and −51 Tg N yr−1, respectively). This difference is likely related to diverging projections in net N mineralization, which is 788 Tg N yr−1 for CESM2 and 267 Tg N for NorESM2 (ensemble range 75.8–385.4 Tg N yr−1). In contrast, we see only a 0.9 Pg C yr−1 difference in the increase in NPP between these two models, in a model ensemble range of 1.3–22.6 Pg C yr−1 (Fig. 4a). From this we can see that in the underlying model, CLM5, nitrogen limitation plays only a small role in determining NPP and future terrestrial carbon sequestration. The large increase in N uptake in CESM2 compared to NorESM2 is not leading to proportional differences in NPP.
ACCESS-ESM shows a different pattern of changes in nitrogen model components to the rest of the model ensemble (Fig. 4e). Like CESM2 and NorESM2, ACCESS has proportionally less NPP increase for the amount of BNF increase, though the absolute levels are much lower for both (Fig. 4b). It is possible that this is due to ACCESS including the phosphorus cycle in addition to the nitrogen cycle, and therefore, increases in NPP are constrained by not only the magnitude and increase in BNF, but also phosphorus availability. ACCESS is the only model where the C:N ratio change is not approximately proportional compared to the rest of the ensemble to the change in NPP (Fig. 4e). Similarly, it has the largest increase in N loss.
The historical simulations compared to data for BNF reveal a mixed message, with ensemble members generally performing well in high latitudes and at the global total scale, but poorly in the mid-latitudes and tropics. For the simulations under the future scenario SSP3-7.0, the impact of the projected change in BNF over time under elevated atmospheric carbon dioxide and other environmental changes is more difficult to assess because of covarying drivers and multiple interactions of biospheric processes (including the water cycle and vegetation dynamics) that confound the imprint of changing BNF on the terrestrial carbon cycle response.
Limitations in methodology of both observations and model simulations partly account for the lack of agreement between them. For models, the simulations are not specific to the site but rather taken from the closest grid cell of a global simulation. Were site-level simulations with observed driving climate data available and the correct land cover (particularly vegetation) prescribed, it is possible models would perform better. For the data, the comparison is made with simple upscaled measurements grouped by biome, which is vulnerable to skew in the underlying data (Davies-Barnard and Friedlingstein, 2020). The underlying BNF data for the historical comparison also have substantial limitations. For instance, the most commonly used method of measuring BNF, acetylene reduction assay, requires calibration to avoid variation of up to 2 orders of magnitude, which ∼70 % of studies fail to do (Soper et al., 2021). The literature is also biased away from null results, making an accurate understanding of the processes underlying BNF more difficult. Thus, the problems with model representation of BNF are symptomatic of wider uncertainties in BNF observations and upscaling from single soil cores or plants to the ecosystem level.
The challenge for progressing BNF modelling is what a suitable replacement for the functions currently used would be. Symbiotic fixation is around two-thirds of total BNF (Davies-Barnard and Friedlingstein, 2020) and is the focus of the more process-based models of BNF (as used in ACCESS, CESM2, and NorESM2). However, work with herbaceous legumes suggests that fixers may have little variation in whole plant biomass whether the nitrogen is fixed or provided as fertilizer, such that the carbon cost of acquiring nitrogen symbiotically may be lower than previously thought (Wolf et al., 2017). Therefore the process-based attempts to establish an empirical relationship between BNF and climate or soil properties at the macroscale have not indicated any robust relationship, which is probably primarily the consequence of lack of data availability, and biome-based upscaled values have low data support and high uncertainties (Davies-Barnard and Friedlingstein, 2020). Abundance of fixers is an important parameter in the CESM2 and NorESM2 models and has a large impact on total fixation and response to fertilization (Fisher et al., 2018), but in observations it is poorly constrained (Davies-Barnard and Friedlingstein, 2020) and not well correlated with total fixation rates, to the point of being anti-correlated (Taylor et al., 2019).
Free-living BNF makes up around a third of all BNF and is comprised of a heterogeneous set of organisms (Reed et al., 2011), making a single process-based model challenging. Thus, the three CMIP6 models that account separately for free-living BNF use static biome-level upscaling (ACCESS) or an empirical relationship with evapotranspiration (NorESM2 and CESM2) (see Table 1). The presence of separately defined processes for symbiotic and free-living BNF is not in itself a sufficient condition for a model with better representation of BNF, as shown by the contrasting performances of CESM2, NorESM2, and ACCESS.
In the future scenarios, the multiple sources of uncertainty as to how and to what extent BNF will change make any definitive statements about the capacity of models to capture BNF changes difficult. While increased atmospheric carbon dioxide tends to increase BNF (Liang et al., 2016), nitrogen addition in the form of deposition or fertilization tends to suppress BNF (Zheng et al., 2019) and effects from land use change (Zheng et al., 2020), increased temperature, reduced precipitation, and other climate change as well as the potential effects of climate-induced land cover change that may alter the composition and location of biomes. It is challenging to predict which of these factors will predominate over the coming century.
Regardless of the change in BNF in future, it is revealing that, while single parameter perturbation experiments suggest BNF significantly affects terrestrial carbon storage (Meyerholt et al., 2016; Wieder et al., 2015), when in a dynamic system the effects of BNF are subsumed by structural differences in the nitrogen and carbon models as well as the larger effects of increasing carbon dioxide. In terms of confidence in model results, the process-based models have clear advantages. However, that increased complexity does not necessarily translate into increased fidelity in the representation of model BNF. This could be due to issues with the process-based representation of BNF, systematic problems with the model representation of the wider nitrogen cycle which BNF previously compensated for, or inaccuracies in the observational upscaled data.
BNF is an important part of the nitrogen cycle, and previous work has shown how nitrogen availability (Zaehle et al., 2014) and BNF in particular impact terrestrial carbon storage (Meyerholt et al., 2016; Wieder et al., 2015). Here we show that although there are considerable shortcomings in the representation of BNF in CMIP6 models, BNF is not a dominant source of uncertainty in future carbon uptake when considered in light of the diversity of process representations currently encoded in earth system models. While some models have a strong relationship between NPP and BNF, others utilize changes in equally uncertain parts of the nitrogen cycle to enable the increases in NPP. Even models with structural similarity can have almost identical NPP with different levels of BNF and other nitrogen variables. Therefore, the weaknesses of BNF representation in most models need to be seen in the context of the entire nitrogen cycle and the need for simultaneous improvement in process understanding and representation.
The two models performing best are CESM2 and CMCC-CM2, as judged by being within the global estimates by Vitousek et al. (2013) and Davies-Barnard and Friedlingstein (2020) as well as within the uncertainty for all three latitudinal bands (low latitudes, mid-latitudes, and high latitudes) for the Davies-Barnard and Friedlingstein (2020) observation-based estimates. These models have little in common in terms of BNF model processes, encompassing the simplest and most complex modelling processes discussed above. That models using a weak physical basis for BNF can simulate BNF with similar skill to more sophisticated models reveals the need for greater process understanding of BNF to enable more reliability in models.
The data can be accessed at https://doi.org/10.24378/exe.4085 (Davies-Barnard et al., 2022). All model data used are freely available from the CMIP6 archive at https://esgf-node.llnl.gov/search/cmip6/ (last access: 21 July 2022; Earth System Grid Federation, 2022).
The supplement related to this article is available online at: https://doi.org/10.5194/bg-19-3491-2022-supplement.
TDB contributed to the conception and design of the analysis, performed the analysis, and wrote the paper. PF and SZ contributed to the conception and design of the analysis and to the editing of the paper.
At least one of the (co-)authors is a member of the editorial board of Biogeosciences. The peer-review process was guided by an independent editor, and the authors also have no other competing interests to declare.
Publisher’s note: Copernicus Publications remains neutral with regard to jurisdictional claims in published maps and institutional affiliations.
Authors acknowledge funding from the European Union's Horizon 2020 research and innovation programme Coordinated Research in Earth Systems and Climate: Experiments kNowledge, Dissemination and Outreach (CRESCENDO).
Sönke Zaehle acknowledges support by the European Union's Horizon 2020 research and innovation programme QUINCY. Pierre Friedlingstein and Sönke Zaehle acknowledge funding from the European Union's Horizon 2020 research and innovation programme 4C project.
This research has been supported by the EU's research and innovation funding programme Horizon 2020 (QUINCY (grant no. 647204), CRESCENDO (grant no. 641816), and 4C (grant no. 821003)).
The article processing charges for this open-access publication were covered by the Max Planck Society.
This paper was edited by Alexey V. Eliseev and reviewed by three anonymous referees.
Arora, V. K., Katavouta, A., Williams, R. G., Jones, C. D., Brovkin, V., Friedlingstein, P., Schwinger, J., Bopp, L., Boucher, O., Cadule, P., Chamberlain, M. A., Christian, J. R., Delire, C., Fisher, R. A., Hajima, T., Ilyina, T., Joetzjer, E., Kawamiya, M., Koven, C. D., Krasting, J. P., Law, R. M., Lawrence, D. M., Lenton, A., Lindsay, K., Pongratz, J., Raddatz, T., Séférian, R., Tachiiri, K., Tjiputra, J. F., Wiltshire, A., Wu, T., and Ziehn, T.: Carbon–concentration and carbon–climate feedbacks in CMIP6 models and their comparison to CMIP5 models, Biogeosciences, 17, 4173–4222, https://doi.org/10.5194/bg-17-4173-2020, 2020.
Best, M. J., Pryor, M., Clark, D. B., Rooney, G. G., Essery, R. L. H., Ménard, C. B., Edwards, J. M., Hendry, M. A., Porson, A., and Gedney, N.: The Joint UK Land Environment Simulator (JULES), model description–Part 1: energy and water fluxes, Geosci. Model Dev., 4, 677–699, 2011.
Cherchi, A., Fogli, P. G., Lovato, T., Peano, D., Iovino, D., Gualdi, S., Masina, S., Scoccimarro, E., Materia, S., Bellucci, A., and Navarra, A.: Global Mean Climate and Main Patterns of Variability in the CMCC-CM2 Coupled Model, J. Adv. Model. Earth Sy., 11, 185–209, https://doi.org/10.1029/2018MS001369, 2019.
Clark, D. B., Mercado, L. M., Sitch, S., Jones, C. D., Gedney, N., Best, M. J., Pryor, M., Rooney, G. G., Essery, R. L. H., Blyth, E., Boucher, O., Harding, R. J., Huntingford, C., and Cox, P. M.: The Joint UK Land Environment Simulator (JULES), model description – Part 2: Carbon fluxes and vegetation dynamics, Geosci. Model Dev., 4, 701–722, https://doi.org/10.5194/gmd-4-701-2011, 2011.
Cleveland, C. C., Townsend, A. R., Schimel, D. S., Fisher, H., Howarth, R. W., Hedin, L. O., Perakis, S. S., Latty, E. F., Fischer, J. C. V., Elseroad, A., and Wasson, M. F.: Global patterns of terrestrial biological nitrogen (N2) fixation in natural ecosystems, Global Biogeochem. Cy., 13, 623–645, https://doi.org/10.1029/1999GB900014, 1999.
Contzen, J., Dickhaus, T., and Lohmann, G.: Variability and extremes: statistical validation of the Alfred Wegener Institute Earth System Model (AWI-ESM), Geosci. Model Dev., 15, 1803–1820, https://doi.org/10.5194/gmd-15-1803-2022, 2022.
Danabasoglu, G., Lamarque, J.-F., Bacmeister, J., Bailey, D. A., DuVivier, A. K., Edwards, J., Emmons, L. K., Fasullo, J., Garcia, R., Gettelman, A., Hannay, C., Holland, M. M., Large, W. G., Lauritzen, P. H., Lawrence, D. M., Lenaerts, J. T. M., Lindsay, K., Lipscomb, W. H., Mills, M. J., Neale, R., Oleson, K. W., Otto-Bliesner, B., Phillips, A. S., Sacks, W., Tilmes, S., Kampenhout, L. van, Vertenstein, M., Bertini, A., Dennis, J., Deser, C., Fischer, C., Fox-Kemper, B., Kay, J. E., Kinnison, D., Kushner, P. J., Larson, V. E., Long, M. C., Mickelson, S., Moore, J. K., Nienhouse, E., Polvani, L., Rasch, P. J., and Strand, W. G.: The Community Earth System Model Version 2 (CESM2), J. Adv. Model. Earth Sy., 12, e2019MS001916, https://doi.org/10.1029/2019MS001916, 2020.
Davies-Barnard, T. and Friedlingstein, P.: The Global Distribution of Biological Nitrogen Fixation in Terrestrial Natural Ecosystems, Global Biogeochem. Cy., 34, e2019GB006387, https://doi.org/10.1029/2019GB006387, 2020.
Davies-Barnard, T., Meyerholt, J., Zaehle, S., Friedlingstein, P., Brovkin, V., Fan, Y., Fisher, R. A., Jones, C. D., Lee, H., Peano, D., Smith, B., Wårlind, D., and Wiltshire, A. J.: Nitrogen cycling in CMIP6 land surface models: progress and limitations, Biogeosciences, 17, 5129–5148, https://doi.org/10.5194/bg-17-5129-2020, 2020.
Davies-Barnard, T.; Zaehle, S., and Friedlingstein, P.: Assessment of the impacts of biological nitrogen fixation structural uncertainty in CMIP6 earth system models, University of Exeter [dataset], https://doi.org/10.24378/exe.4085, 2022.
Dynarski, K. A. and Houlton, B. Z.: Nutrient limitation of terrestrial free-living nitrogen fixation, New Phytol., 217, 1050–1061, https://doi.org/10.1111/nph.14905, 2018.
Earth System Grid Federation (ESGF): CMIP6 Data Search, ESGF-CoG, https://esgf-node.llnl.gov/search/cmip6/, last access: 21 July 2022.
Elbert, W., Weber, B., Burrows, S., Steinkamp, J., Büdel, B., Andreae, M. O., and Pöschl, U.: Contribution of cryptogamic covers to the global cycles of carbon and nitrogen, Nat. Geosci., 5, 459–462, https://doi.org/10.1038/ngeo1486, 2012.
Eyring, V., Bony, S., Meehl, G. A., Senior, C. A., Stevens, B., Stouffer, R. J., and Taylor, K. E.: Overview of the Coupled Model Intercomparison Project Phase 6 (CMIP6) experimental design and organization, Geosci. Model Dev., 9, 1937–1958, https://doi.org/10.5194/gmd-9-1937-2016, 2016.
Fisher, J. B., Sitch, S., Malhi, Y., Fisher, R. A., Huntingford, C., and Tan, S.-Y.: Carbon cost of plant nitrogen acquisition: A mechanistic, globally applicable model of plant nitrogen uptake, retranslocation, and fixation, Global Biogeochem. Cy., 24, GB1014, https://doi.org/10.1029/2009GB003621, 2010.
Fisher, R. A., Wieder, W. R., Sanderson, B. M., Koven, C. D., Oleson, K. W., Xu, C., Fisher, J. B., Shi, M., Walker, A. P., and Lawrence, D. M.: Parametric Controls on Vegetation Responses to Biogeochemical Forcing in the CLM5, J. Adv. Model. Earth Sy., 11, 2879–2895, https://doi.org/10.1029/2019MS001609, 2018.
Friedlingstein, P., O'Sullivan, M., Jones, M. W., Andrew, R. M., Hauck, J., Olsen, A., Peters, G. P., Peters, W., Pongratz, J., Sitch, S., Le Quéré, C., Canadell, J. G., Ciais, P., Jackson, R. B., Alin, S., Aragão, L. E. O. C., Arneth, A., Arora, V., Bates, N. R., Becker, M., Benoit-Cattin, A., Bittig, H. C., Bopp, L., Bultan, S., Chandra, N., Chevallier, F., Chini, L. P., Evans, W., Florentie, L., Forster, P. M., Gasser, T., Gehlen, M., Gilfillan, D., Gkritzalis, T., Gregor, L., Gruber, N., Harris, I., Hartung, K., Haverd, V., Houghton, R. A., Ilyina, T., Jain, A. K., Joetzjer, E., Kadono, K., Kato, E., Kitidis, V., Korsbakken, J. I., Landschützer, P., Lefèvre, N., Lenton, A., Lienert, S., Liu, Z., Lombardozzi, D., Marland, G., Metzl, N., Munro, D. R., Nabel, J. E. M. S., Nakaoka, S.-I., Niwa, Y., O'Brien, K., Ono, T., Palmer, P. I., Pierrot, D., Poulter, B., Resplandy, L., Robertson, E., Rödenbeck, C., Schwinger, J., Séférian, R., Skjelvan, I., Smith, A. J. P., Sutton, A. J., Tanhua, T., Tans, P. P., Tian, H., Tilbrook, B., van der Werf, G., Vuichard, N., Walker, A. P., Wanninkhof, R., Watson, A. J., Willis, D., Wiltshire, A. J., Yuan, W., Yue, X., and Zaehle, S.: Global Carbon Budget 2020, Earth Syst. Sci. Data, 12, 3269–3340, https://doi.org/10.5194/essd-12-3269-2020, 2020.
Goll, D. S., Winkler, A. J., Raddatz, T., Dong, N., Prentice, I. C., Ciais, P., and Brovkin, V.: Carbon–nitrogen interactions in idealized simulations with JSBACH (version 3.10), Geosci. Model Dev., 10, 2009–2030, https://doi.org/10.5194/gmd-10-2009-2017, 2017.
Hajima, T., Watanabe, M., Yamamoto, A., Tatebe, H., Noguchi, M. A., Abe, M., Ohgaito, R., Ito, A., Yamazaki, D., Okajima, H., Ito, A., Takata, K., Ogochi, K., Watanabe, S., and Kawamiya, M.: Development of the MIROC-ES2L Earth system model and the evaluation of biogeochemical processes and feedbacks, Geosci. Model Dev., 13, 2197–2244, https://doi.org/10.5194/gmd-13-2197-2020, 2020.
Hazeleger, W., Wang, X., Severijns, C., Ştefănescu, S., Bintanja, R., Sterl, A., Wyser, K., Semmler, T., Yang, S., van den Hurk, B., van Noije, T., van der Linden, E., and van der Wiel, K.: EC-Earth V2.2: description and validation of a new seamless earth system prediction model, Clim. Dynam., 39, 2611–2629, https://doi.org/10.1007/s00382-011-1228-5, 2012.
Holloway, J. M. and Dahlgren, R. A.: Nitrogen in rock: Occurrences and biogeochemical implications, Global Biogeochem. Cy., 16, 65-1–65-17, https://doi.org/10.1029/2002GB001862, 2002.
Jones, C., Robertson, E., Arora, V., Friedlingstein, P., Shevliakova, E., Bopp, L., Brovkin, V., Hajima, T., Kato, E., Kawamiya, M., Liddicoat, S., Lindsay, K., Reick, C. H., Roelandt, C., Segschneider, J., and Tjiputra, J.: Twenty-First-Century Compatible CO2 Emissions and Airborne Fraction Simulated by CMIP5 Earth System Models under Four Representative Concentration Pathways, J. Climate., 26, 4398–4413, https://doi.org/10.1175/JCLI-D-12-00554.1, 2013.
Jones, C. D., Arora, V., Friedlingstein, P., Bopp, L., Brovkin, V., Dunne, J., Graven, H., Hoffman, F., Ilyina, T., John, J. G., Jung, M., Kawamiya, M., Koven, C., Pongratz, J., Raddatz, T., Randerson, J. T., and Zaehle, S.: C4MIP – The Coupled Climate–Carbon Cycle Model Intercomparison Project: experimental protocol for CMIP6, Geosci. Model Dev., 9, 2853–2880, https://doi.org/10.5194/gmd-9-2853-2016, 2016.
Koven, C. D., Riley, W. J., Subin, Z. M., Tang, J. Y., Torn, M. S., Collins, W. D., Bonan, G. B., Lawrence, D. M., and Swenson, S. C.: The effect of vertically resolved soil biogeochemistry and alternate soil C and N models on C dynamics of CLM4, Biogeosciences, 10, 7109–7131, https://doi.org/10.5194/bg-10-7109-2013, 2013.
Lamarque, J.-F., Shindell, D. T., Josse, B., Young, P. J., Cionni, I., Eyring, V., Bergmann, D., Cameron-Smith, P., Collins, W. J., Doherty, R., Dalsoren, S., Faluvegi, G., Folberth, G., Ghan, S. J., Horowitz, L. W., Lee, Y. H., MacKenzie, I. A., Nagashima, T., Naik, V., Plummer, D., Righi, M., Rumbold, S. T., Schulz, M., Skeie, R. B., Stevenson, D. S., Strode, S., Sudo, K., Szopa, S., Voulgarakis, A., and Zeng, G.: The Atmospheric Chemistry and Climate Model Intercomparison Project (ACCMIP): overview and description of models, simulations and climate diagnostics, Geosci. Model Dev., 6, 179–206, https://doi.org/10.5194/gmd-6-179-2013, 2013.
Law, R. M., Ziehn, T., Matear, R. J., Lenton, A., Chamberlain, M. A., Stevens, L. E., Wang, Y.-P., Srbinovsky, J., Bi, D., Yan, H., and Vohralik, P. F.: The carbon cycle in the Australian Community Climate and Earth System Simulator (ACCESS-ESM1) – Part 1: Model description and pre-industrial simulation, Geosci. Model Dev., 10, 2567–2590, https://doi.org/10.5194/gmd-10-2567-2017, 2017.
Lawrence, D. M., Fisher, R. A., Koven, C. D., Oleson, K. W., Swenson, S. C., Bonan, G., Collier, N., Ghimire, B., Kampenhout, L. van, Kennedy, D., Kluzek, E., Lawrence, P. J., Li, F., Li, H., Lombardozzi, D., Riley, W. J., Sacks, W. J., Shi, M., Vertenstein, M., Wieder, W. R., Xu, C., Ali, A. A., Badger, A. M., Bisht, G., Broeke, M. van den, Brunke, M. A., Burns, S. P., Buzan, J., Clark, M., Craig, A., Dahlin, K., Drewniak, B., Fisher, J. B., Flanner, M., Fox, A. M., Gentine, P., Hoffman, F., Keppel-Aleks, G., Knox, R., Kumar, S., Lenaerts, J., Leung, L. R., Lipscomb, W. H., Lu, Y., Pandey, A., Pelletier, J. D., Perket, J., Randerson, J. T., Ricciuto, D. M., Sanderson, B. M., Slater, A., Subin, Z. M., Tang, J., Thomas, R. Q., Martin, M. V., and Zeng, X.: The Community Land Model Version 5: Description of New Features, Benchmarking, and Impact of Forcing Uncertainty, J. Adv. Model. Earth Sy., 11, 4245–4287, https://doi.org/10.1029/2018MS001583, 2019.
Liang, J., Qi, X., Souza, L., and Luo, Y.: Processes regulating progressive nitrogen limitation under elevated carbon dioxide: a meta-analysis, Biogeosciences, 13, 2689–2699, https://doi.org/10.5194/bg-13-2689-2016, 2016.
Lu, C. and Tian, H.: Global nitrogen and phosphorus fertilizer use for agriculture production in the past half century: shifted hot spots and nutrient imbalance, Earth Syst. Sci. Data, 9, 181–192, https://doi.org/10.5194/essd-9-181-2017, 2017.
Mauritsen, T., Bader, J., Becker, T., Behrens, J., Bittner, M., Brokopf, R., Brovkin, V., Claussen, M., Crueger, T., Esch, M., Fast, I., Fiedler, S., Fläschner, D., Gayler, V., Giorgetta, M., Goll, D. S., Haak, H., Hagemann, S., Hedemann, C., Hohenegger, C., Ilyina, T., Jahns, T., Jimenéz-de-la-Cuesta, D., Jungclaus, J., Kleinen, T., Kloster, S., Kracher, D., Kinne, S., Kleberg, D., Lasslop, G., Kornblueh, L., Marotzke, J., Matei, D., Meraner, K., Mikolajewicz, U., Modali, K., Möbis, B., Müller, W. A., Nabel, J. E. M. S., Nam, C. C. W., Notz, D., Nyawira, S.-S., Paulsen, H., Peters, K., Pincus, R., Pohlmann, H., Pongratz, J., Popp, M., Raddatz, T. J., Rast, S., Redler, R., Reick, C. H., Rohrschneider, T., Schemann, V., Schmidt, H., Schnur, R., Schulzweida, U., Six, K. D., Stein, L., Stemmler, I., Stevens, B., Storch, J.-S. von, Tian, F., Voigt, A., Vrese, P., Wieners, K.-H., Wilkenskjeld, S., Winkler, A., and Roeckner, E.: Developments in the MPI-M Earth System Model version 1.2 (MPI-ESM1.2) and Its Response to Increasing CO2, J. Adv. Model. Earth Sy., 11, 998–1038, https://doi.org/10.1029/2018MS001400, 2019.
Meyerholt, J., Zaehle, S., and Smith, M. J.: Variability of projected terrestrial biosphere responses to elevated levels of atmospheric CO2 due to uncertainty in biological nitrogen fixation, Biogeosciences, 13, 1491–1518, https://doi.org/10.5194/bg-13-1491-2016, 2016.
Meyerholt, J., Sickel, K., and Zaehle, S.: Ensemble projections elucidate effects of uncertainty in terrestrial nitrogen limitation on future carbon uptake, Glob. Change Biol., 26, 3978–3996, https://doi.org/10.1111/gcb.15114, 2020.
Millar, R. J., Fuglestvedt, J. S., Friedlingstein, P., Rogelj, J., Grubb, M. J., Matthews, H. D., Skeie, R. B., Forster, P. M., Frame, D. J., and Allen, M. R.: Emission budgets and pathways consistent with limiting warming to 1.5 ∘C, Nat. Geosci., 10, 741–747, https://doi.org/10.1038/ngeo3031, 2017.
Oleson, K. W., Lawrence, D. M., B, G., Flanner, M. G., Kluzek, E., J, P., Levis, S., Swenson, S. C., Thornton, E., Feddema, J., Heald, C. L., Lamarque, J., Niu, G., Qian, T., Running, S., Sakaguchi, K., Yang, L., Zeng, X., and Zeng, X.: Technical Description of version 4.0 of the Community Land Model (CLM), No. NCAR/TN-478+STR, University Corporation for Atmospheric Research, https://doi.org/10.5065/D6FB50WZ, 2010.
Oleson, K., Lawrence, D., Bonan, G., Drewniak, B., Huang, M., Koven, C., Levis, S., Li, F., Riley, W., Subin, Z., Swenson, S., Thornton, P., Bozbiyik, A., Fisher, R., Heald, C., Kluzek, E., Lamarque, J.-F., Lawrence, P., Leung, L., Lipscomb, W., Muszala, S., Ricciuto, D., Sacks, W., Sun, Y., Tang, J., and Yang, Z.-L.: Technical description of version 4.5 of the Community Land Model (CLM), UCAR/NCAR, https://doi.org/10.5065/D6RR1W7M, 2013.
Olin, S., Lindeskog, M., Pugh, T. A. M., Schurgers, G., Wårlind, D., Mishurov, M., Zaehle, S., Stocker, B. D., Smith, B., and Arneth, A.: Soil carbon management in large-scale Earth system modelling: implications for crop yields and nitrogen leaching, Earth Syst. Dynam., 6, 745–768, https://doi.org/10.5194/esd-6-745-2015, 2015.
Peng, J., Wang, Y.-P., Houlton, B. Z., Dan, L., Pak, B., and Tang, X.: Global Carbon Sequestration Is Highly Sensitive to Model-Based Formulations of Nitrogen Fixation, Global Biogeochem. Cy., 34, e2019GB006296, https://doi.org/10.1029/2019GB006296, 2020.
Potter, P., Ramankutty, N., Bennett, E. M., and Donner, S. D.: Characterizing the Spatial Patterns of Global Fertilizer Application and Manure Production, Earth Interact., 14, 1–22, https://doi.org/10.1175/2009EI288.1, 2010.
Reed, S. C., Cleveland, C. C., and Townsend, A. R.: Functional Ecology of Free-Living Nitrogen Fixation: A Contemporary Perspective, Annu. Rev. Ecol. Evol. Syst., 42, 489–512, https://doi.org/10.1146/annurev-ecolsys-102710-145034, 2011.
Russow, R., Veste, M., Breckle, S.-W., Littmann, T., and Böhme, F.: Nitrogen Input Pathways into Sand Dunes: Biological Fixation and Atmospheric Nitrogen Deposition, in: Arid Dune Ecosystems, Springer, Berlin, Heidelberg, 319–336, https://doi.org/10.1007/978-3-540-75498-5_22, 2008.
Schwintzer, C. R.: Nonsymbiotic and Symbiotic Nitrogen Fixation in a Weakly Minerotrophic Peatland, Am. J. Bot., 70, 1071–1078, https://doi.org/10.1002/j.1537-2197.1983.tb07908.x, 1983.
Seland, Ø., Bentsen, M., Olivié, D., Toniazzo, T., Gjermundsen, A., Graff, L. S., Debernard, J. B., Gupta, A. K., He, Y.-C., Kirkevåg, A., Schwinger, J., Tjiputra, J., Aas, K. S., Bethke, I., Fan, Y., Griesfeller, J., Grini, A., Guo, C., Ilicak, M., Karset, I. H. H., Landgren, O., Liakka, J., Moseid, K. O., Nummelin, A., Spensberger, C., Tang, H., Zhang, Z., Heinze, C., Iversen, T., and Schulz, M.: Overview of the Norwegian Earth System Model (NorESM2) and key climate response of CMIP6 DECK, historical, and scenario simulations, Geosci. Model Dev., 13, 6165–6200, https://doi.org/10.5194/gmd-13-6165-2020, 2020.
Sellar, A. A., Jones, C. G., Mulcahy, J. P., Tang, Y., Yool, A., Wiltshire, A., O'Connor, F. M., Stringer, M., Hill, R., Palmieri, J., Woodward, S., Mora, L. de, Kuhlbrodt, T., Rumbold, S. T., Kelley, D. I., Ellis, R., Johnson, C. E., Walton, J., Abraham, N. L., Andrews, M. B., Andrews, T., Archibald, A. T., Berthou, S., Burke, E., Blockley, E., Carslaw, K., Dalvi, M., Edwards, J., Folberth, G. A., Gedney, N., Griffiths, P. T., Harper, A. B., Hendry, M. A., Hewitt, A. J., Johnson, B., Jones, A., Jones, C. D., Keeble, J., Liddicoat, S., Morgenstern, O., Parker, R. J., Predoi, V., Robertson, E., Siahaan, A., Smith, R. S., Swaminathan, R., Woodhouse, M. T., Zeng, G., and Zerroukat, M.: UKESM1: Description and Evaluation of the U.K. Earth System Model, J. Adv. Model. Earth Sy., 11, 4513–4558, https://doi.org/10.1029/2019MS001739, 2019.
Shi, M., Fisher, J. B., Brzostek, E. R., and Phillips, R. P.: Carbon cost of plant nitrogen acquisition: global carbon cycle impact from an improved plant nitrogen cycle in the Community Land Model, Glob. Change Biol., 22, 1299–1314, https://doi.org/10.1111/gcb.13131, 2016.
Smith, B., Wårlind, D., Arneth, A., Hickler, T., Leadley, P., Siltberg, J., and Zaehle, S.: Implications of incorporating N cycling and N limitations on primary production in an individual-based dynamic vegetation model, Biogeosciences, 11, 2027–2054, https://doi.org/10.5194/bg-11-2027-2014, 2014.
Son, Y.: Non-symbiotic nitrogen fixation in forest ecosystems, Ecol. Res., 16, 183–196, https://doi.org/10.1046/j.1440-1703.2001.00385.x, 2001.
Soper, F. M., Simon, C., and Jauss, V.: Measuring nitrogen fixation by the acetylene reduction assay (ARA): is 3 the magic ratio?, Biogeochemistry, 152, 345–351, https://doi.org/10.1007/s10533-021-00761-3, 2021.
Sullivan, B. W., Smith, W. K., Townsend, A. R., Nasto, M. K., Reed, S. C., Chazdon, R. L., and Cleveland, C. C.: Spatially robust estimates of biological nitrogen (N) fixation imply substantial human alteration of the tropical N cycle, P. Natl. Acad. Sci. USA, 111, 8101–8106, https://doi.org/10.1073/pnas.1320646111, 2014.
Taylor, B. N., Chazdon, R. L., and Menge, D. N. L.: Successional dynamics of nitrogen fixation and forest growth in regenerating Costa Rican rainforests, Ecology, 100, e02637, https://doi.org/10.1002/ecy.2637, 2019.
Tedersoo, L., Laanisto, L., Rahimlou, S., Toussaint, A., Hallikma, T., and Pärtel, M.: Global database of plants with root-symbiotic nitrogen fixation: NodDB, J. Veg. Sci., 29, 560–568, https://doi.org/10.1111/jvs.12627, 2018.
Thomas, R. Q., Zaehle, S., Templer, P. H., and Goodale, C. L.: Global patterns of nitrogen limitation: confronting two global biogeochemical models with observations, Glob. Change Biol., 19, 2986–2998, https://doi.org/10.1111/gcb.12281, 2013.
Thornton, P. E., Lamarque, J.-F., Rosenbloom, N. A., and Mahowald, N. M.: Influence of carbon-nitrogen cycle coupling on land model response to CO2 fertilization and climate variability, Global Biogeochem. Cy., 21, GB4018, https://doi.org/10.1029/2006GB002868, 2007.
Tie, X., Zhang, R., Brasseur, G., and Lei, W.: Global NOx Production by Lightning, J. Atmos. Chem., 43, 61–74, https://doi.org/10.1023/A:1016145719608, 2002.
Tierney, J. A., Hedin, L. O., and Wurzburger, N.: Nitrogen fixation does not balance fire-induced nitrogen losses in longleaf pine savannas, Ecology, 100, e02735, https://doi.org/10.1002/ecy.2735, 2019.
Vitousek, P. M. and Howarth, R. W.: Nitrogen limitation on land and in the sea: How can it occur?, Biogeochemistry, 13, 87–115, https://doi.org/10.1007/BF00002772, 1991.
Vitousek, P. M., Menge, D. N. L., Reed, S. C., and Cleveland, C. C.: Biological nitrogen fixation: rates, patterns and ecological controls in terrestrial ecosystems, Philos. T. Roy. Soc. B, 368, 20130119, https://doi.org/10.1098/rstb.2013.0119, 2013.
Wang, Y.-C., Hsu, H.-H., Chen, C.-A., Tseng, W.-L., Hsu, P.-C., Lin, C.-W., Chen, Y.-L., Jiang, L.-C., Lee, Y.-C., Liang, H.-C., Chang, W.-M., Lee, W.-L., and Shiu, C.-J.: Performance of the Taiwan Earth System Model in Simulating Climate Variability Compared With Observations and CMIP6 Model Simulations, J. Adv. Model. Earth Sy., 13, e2020MS002353, https://doi.org/10.1029/2020MS002353, 2021.
Wang, Y.-P. and Houlton, B. Z.: Nitrogen constraints on terrestrial carbon uptake: Implications for the global carbon-climate feedback, Geophys. Res. Lett., 36, L24403, https://doi.org/10.1029/2009GL041009, 2009.
Wang, Y.-P., Houlton, B. Z., and Field, C. B.: A model of biogeochemical cycles of carbon, nitrogen, and phosphorus including symbiotic nitrogen fixation and phosphatase production, Global Biogeochem. Cy., 21, GB1018, https://doi.org/10.1029/2006GB002797, 2007.
Waughman, G. J. and Bellamy, D. J.: Nitrogen Fixation and the Nitrogen Balance in Peatland Ecosystems, Ecology, 61, 1185–1198, https://doi.org/10.2307/1936837, 1980.
Wieder, W. R., Cleveland, C. C., Lawrence, D. M., and Bonan, G. B.: Effects of model structural uncertainty on carbon cycle projections: biological nitrogen fixation as a case study, Environ. Res. Lett., 10, 044016, https://doi.org/10.1088/1748-9326/10/4/044016, 2015.
Wiltshire, A. J., Burke, E. J., Chadburn, S. E., Jones, C. D., Cox, P. M., Davies-Barnard, T., Friedlingstein, P., Harper, A. B., Liddicoat, S., Sitch, S., and Zaehle, S.: JULES-CN: a coupled terrestrial carbon–nitrogen scheme (JULES vn5.1), Geosci. Model Dev., 14, 2161–2186, https://doi.org/10.5194/gmd-14-2161-2021, 2021.
Wolf, A. A., Funk, J. L., and Menge, D. N. L.: The symbionts made me do it: legumes are not hardwired for high nitrogen concentrations but incorporate more nitrogen when inoculated, New Phytol., 213, 690–699, https://doi.org/10.1111/nph.14303, 2017.
Zaehle, S., Jones, C. D., Houlton, B., Lamarque, J.-F., and Robertson, E.: Nitrogen Availability Reduces CMIP5 Projections of Twenty-First-Century Land Carbon Uptake, J. Climate., 28, 2494–2511, https://doi.org/10.1175/JCLI-D-13-00776.1, 2014.
Zheng, M., Li, D., Lu, X., Zhu, X., Zhang, W., Huang, J., Fu, S., Lu, X., and Mo, J.: Effects of phosphorus addition with and without nitrogen addition on biological nitrogen fixation in tropical legume and non-legume tree plantations, Biogeochemistry, 131, 65–76, 2016.
Zheng, M., Zhang, W., Luo, Y., Wan, S., Fu, S., Wang, S., Liu, N., Ye, Q., Yan, J., Zou, B., Fang, C., Ju, Y., Ha, D., Zhu, L., and Mo, J.: The Inhibitory Effects of Nitrogen Deposition on Asymbiotic Nitrogen Fixation are Divergent Between a Tropical and a Temperate Forest, Ecosystems, 22, 955–967, https://doi.org/10.1007/s10021-018-0313-6, 2019.
Zheng, M., Zhou, Z., Zhao, P., Luo, Y., Ye, Q., Zhang, K., Song, L., and Mo, J.: Effects of human disturbance activities and environmental change factors on terrestrial nitrogen fixation, Glob. Change Biol., 26, 6203–6217, https://doi.org/10.1111/gcb.15328, 2020.