the Creative Commons Attribution 4.0 License.
the Creative Commons Attribution 4.0 License.
 | 05 Aug 2022
Effects of brackish water inflow on methane-cycling microbial communities in a freshwater rewetted coastal fen
Cordula Nina Gutekunst
Susanne Liebner
Anna-Kathrina Jenner
Klaus-Holger Knorr
Viktoria Unger
Franziska Koebsch
Erwin Don Racasa
Sizhong Yang
Michael Ernst Böttcher
Manon Janssen
Jens Kallmeyer
Denise Otto
Iris Schmiedinger
Lucas Winski
Gerald Jurasinski
Rewetted peatlands can be a significant source of methane (CH4), but in coastal ecosystems, input of sulfate-rich seawater could potentially mitigate these emissions. The presence of sulfate as an electron acceptor during organic matter decomposition is known to suppress methanogenesis by favoring the growth of sulfate reducers, which outcompete methanogens for substrate. We investigated the effects of a brackish water inflow on the microbial communities relative to CH4 production–consumption dynamics in a freshwater rewetted fen at the southern Baltic Sea coast after a storm surge in January 2019 and analyzed our data in context with the previous freshwater rewetted state (2014 serves as our baseline) and the conditions after a severe drought in 2018 (Fig. 1).
We took peat cores at four previously sampled locations along a brackishness gradient to compare soil and pore water geochemistry as well as the microbial methane- and sulfate-cycling communities with the previous conditions. We used high-throughput sequencing and quantitative polymerase chain reaction (qPCR) to characterize pools of DNA and RNA targeting total and putatively active bacteria and archaea. Furthermore, we measured CH4 fluxes along the gradient and determined the concentrations and isotopic signatures of trace gases in the peat.
We found that both the inflow effect of brackish water and the preceding drought increased the sulfate availability in the surface and pore water. Nevertheless, peat soil CH4 concentrations and the 13C compositions of CH4 and total dissolved inorganic carbon (DIC) indicated ongoing methanogenesis and little methane oxidation. Accordingly, we did not observe a decrease in absolute methanogenic archaea abundance or a substantial change in methanogenic community composition following the inflow but found that the methanogenic community had mainly changed during the preceding drought. In contrast, absolute abundances of aerobic methanotrophic bacteria decreased back to their pre-drought level after the inflow, while they had increased during the drought year. In line with the higher sulfate concentrations, the absolute abundances of sulfate-reducing bacteria (SRB) increased – as expected – by almost 3 orders of magnitude compared to the freshwater state and also exceeded abundances recorded during the drought by over 2 orders of magnitude. Against our expectations, methanotrophic archaea (ANME), capable of sulfate-mediated anaerobic methane oxidation, did not increase in abundance after the brackish water inflow. Altogether, we could find no microbial evidence for hampered methane production or increased methane consumption in the peat soil after the brackish water inflow. Because Koebsch et al. (2020) reported a new minimum in CH4 fluxes at this site since rewetting of the site in 2009, methane oxidation may, however, take place in the water column above the peat soil or in the loose organic litter on the ground. This highlights the importance of considering all compartments across the peat–water–atmosphere continuum to develop an in-depth understanding of inflow events in rewetted peatlands. We propose that the changes in microbial communities and greenhouse gas (GHG) fluxes relative to the previous freshwater rewetting state cannot be explained with the brackish water inflow alone but were potentially reinforced by a biogeochemical legacy effect of the preceding drought.
- Article
(6240 KB) - Full-text XML
-
Supplement
(877 KB) - BibTeX
- EndNote


Peatlands are important global carbon stores (Gorham, 1991; Batjes, 1996; Limpens et al., 2008; Yu et al., 2010; Page et al., 2011; Dargie et al., 2017), but drainage for agriculture or peat extraction leads to aerobic mineralization of the organic material and thus to increased emissions of carbon dioxide (CO2) (Frolking et al., 2011; Leifeld, 2013). Rewetting effectively stops the high CO2 emissions (Kirkby et al., 2013; Paustian et al., 2016; Wilson et al., 2016) and can restore the carbon sink function (Leifeld and Menichetti, 2018). However, rewetting of drained peatlands may induce high emissions of methane (CH4) (Joosten and Couwenberg, 2009; Wichtmann et al., 2010; Hahn et al., 2015; Abdalla et al., 2016), especially in nutrient-rich fens. Although this does not negate the overall beneficial effect of peatland rewetting for mitigating climate warming (Günther et al., 2020), CH4 still acts as short-lived but strong greenhouse gas (GHG) (Lelieveld et al., 1998; Myhre et al., 2013), and thus high emission rates should be avoided when possible (Nisbet et al., 2020). It is therefore desirable to better understand the conditions under which CH4 emissions from rewetted peatlands can be kept small to implement the best mitigation strategy.
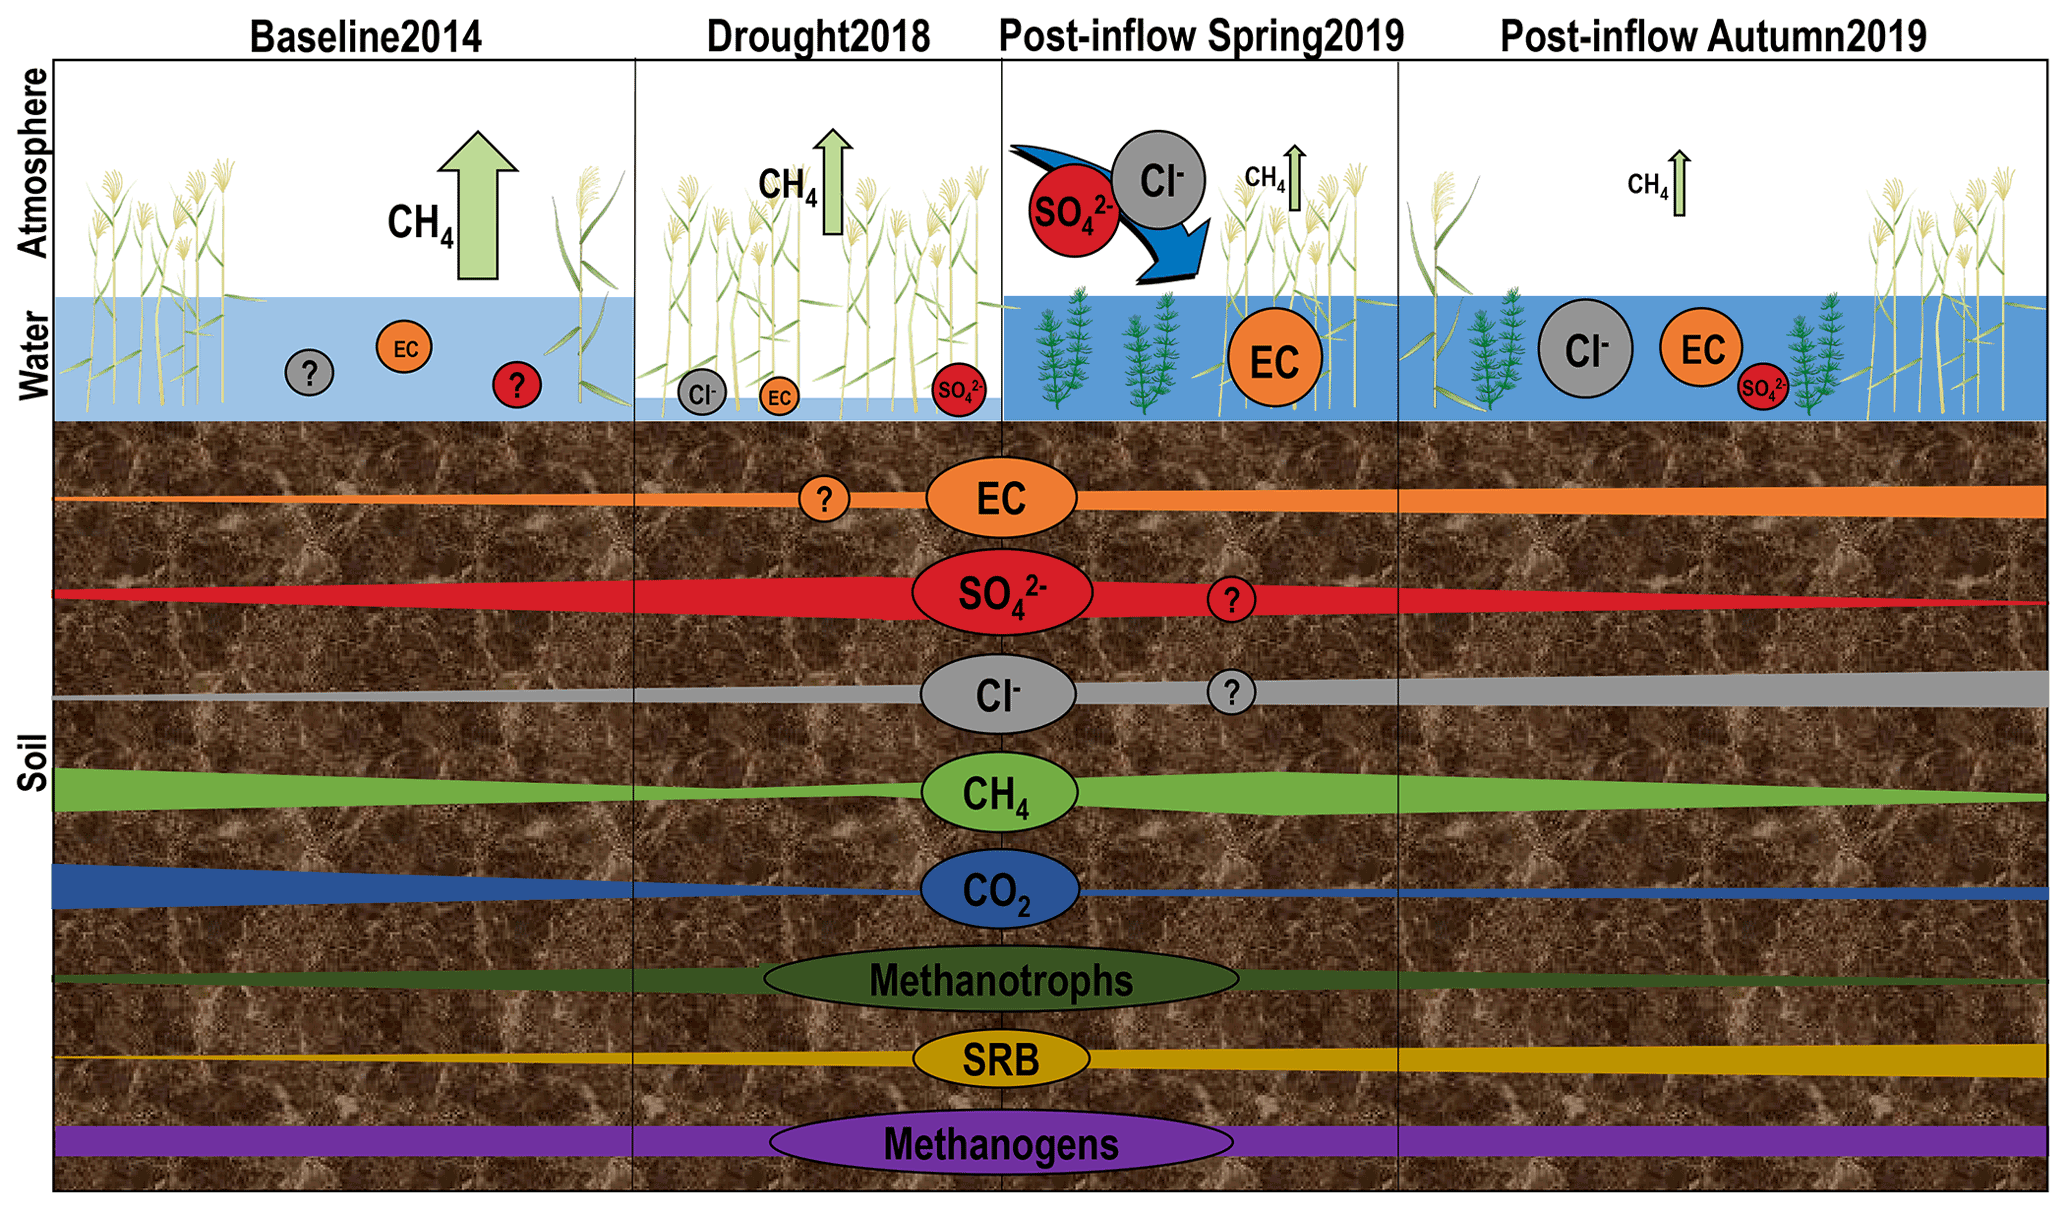
Figure 1Schematic development of geochemistry, greenhouse gases and microorganisms under different environmental conditions throughout time at three different compartments discussed in this study: atmosphere, surface water and peat soil. Patterns were derived from annual budgets of CH4 fluxes (green arrows, Koebsch et al., 2020) and from concentrations of surface and pore water components, averaged over all locations and depth sections. Note that CH4 and CO2 patterns show tendency derived from peat soil concentrations and not from isotopic signatures of δ 13C. Schematic microbial changes are based on absolute counts of qPCR results. The design of plants and other symbolic depictions was inspired and partly extracted from the media library of the Center for Environmental Science, University of Maryland (https://ian.umces.edu/media-library/symbols/#download, last access: 16 November 2021).
Sea level rise, driven by global warming (Fabian, 2002; Church et al., 2013; Nerem et al., 2018), may cause a sustainable shift in the biogeochemistry of coastal wetland systems (van Dijk et al., 2019), including low-lying coastal peatlands (Jurasinski et al., 2018). Above all, marine water inflow may increase the sulfate availability in these ecosystems and thereby provide an alternative electron acceptor (EA) for organic matter (OM) decomposition (Jørgensen, 1982). Available studies typically report a reduction of methane production (methanogenesis) in anaerobic soil zones in the presence of a thermodynamically more favorable EA such as sulfate. This has been found in marine environments (Oremland, 1988), rice paddies, (van der Gon and Neue, 1994), salt marshes (Bartlett et al., 1987) and even in freshwater peatlands (Lovley and Klug, 1983; Gauci et al., 2004; Pester et al., 2012). Sulfate-reducing bacteria (SRB) outcompete methanogens because of a higher energy gain through their metabolic pathway (Schönheit et al., 1982; Lovley and Klug, 1983) and their high substrate affinity (Kristjansson and Schönheit, 1983).
The majority of methanogens are obligate anaerobic methane-producing (methanogenic) archaea (Moore and Knowles, 1989; Strack et al., 2008; Thauer et al., 2008; Nazaries et al., 2013), although they may also withstand the presence of oxygen within anaerobic niches in oxic soil layers (Angle et al., 2017; Wagner, 2017) or tolerate short-term droughts (Kim et al., 2008; Wen et al., 2018). Nevertheless, most studies focus on methane production by anaerobic methanogenic archaea. Archaeal methanogens belong to the phylum Euryarchaeota and are distributed over seven orders (Dean et al., 2018). However, additionally the phyla Halobacterota, Thermoplasmatota and Bathyarchaeota have been recently discussed as potential methanogens, especially in peat soil (Bräuer et al., 2020). Methane consumption mitigates the release of methane and was historically thought to be limited to aerobic bacteria (Söhngen, 1906; Whittenbury et al., 1970), belonging mainly to Alpha- and Gammaproteobacteria and Verrucomicrobia (Hanson and Hanson, 1996; Op den Camp et al., 2009). However, the so-called methanotrophs can also be archaea that inhabit anaerobic zones (Boetius et al., 2000; Conrad, 2009; Nazaries et al., 2013; Dean et al., 2018). In the presence of sulfate and at low H2 concentrations, certain anaerobic methanotrophic archaea (ANME) can reverse methanogenesis in close interaction with SRB, with whom they form symbiotic consortia (Hoehler et al., 1994; Hansen et al., 1998; Boetius et al., 2000). Both partners benefit from the transfer of intermediates, such as CH4 as electron donor and carbon source for sulfate reduction, as well as sulfate as EA for methane oxidation (Hansen et al., 1998). Besides sulfate, other EAs such as nitrate or metal oxides can play a role in anaerobic oxidation of methane (AOM), especially in coastal freshwater and brackish wetlands (Segarra et al., 2013), which, unlike ombrotrophic bogs, are not generally poor in alternative EA (Damman, 1978; Dettling et al., 2006). Sulfate-independent AOM was, for example, reported from freshwater wetlands (Segarra et al., 2015). Besides archaea, also bacteria like the recently cultured Candidatus Methylomirabilis oxyfera from the NC10 phylum are able to oxidize methane anaerobically using nitrite as an alternative EA (Ettwig et al., 2010), and other genera within the order Methylomirabilales may also be able to perform this process (He et al., 2016).
Whilst sulfate-mediated CH4 suppression effects are well known in natural coastal wetlands, these mechanisms can be suspended by the land-use history of degraded coastal peatlands: Koebsch et al. (2019) found that sulfate was depleted in the coastal fen (Hütelmoor) we are investigating here, except for some local relicts at peat layers below 30 cm depth. These locally high pore water sulfate concentrations could, however, not prevent high CH4 emissions from the same fen (Glatzel et al., 2011; Hahn et al., 2015; Koebsch et al., 2015). Jurasinski et al. (2018) concluded that unlike in marine systems, spatial separation of methanogenesis and sulfate reduction can sustain methane production and prevent anaerobic methane oxidation in rewetted coastal fens. This is because methane is formed above the sulfate-reducing zone due to a freshening of the surface water. Like drought-induced salinization (Kinney et al., 2014; Chamberlain et al., 2020), the inflow of sulfate-containing brackish water could increase the availability of sulfate and, thus, lead to lower CH4 emissions. The brackish water inflow into the Hütelmoor in 2019 was followed by a 87 % reduction in CH4 emissions compared to the reference period 2014–2017, while a preceding drought in 2018 led to a drop in CH4 emissions of 22 % (Koebsch et al., 2020).
While CH4 emissions in rewetted freshwater peatlands have been widely studied, the effect of brackish water inflow events on the methane-cycling community and the related biogeochemical patterns in the soil are largely unknown. Field studies of coastal peatlands that cover the transition from freshwater to brackish state are still sparse, and to our knowledge, no study has examined the integrated effect of brackish water inflow on biogeochemistry, microbiology and methane emissions, so far.
We thus investigated how microbial communities and coupled peat biogeochemistry change in a freshwater rewetted coastal fen after a brackish water inflow and how this relates to local methane fluxes. Since our study site was exposed to a severe drought in 2018, we put our results in context with potential legacy effects of the preceding drought. We hypothesized that the brackish water inflow will have replenished the sulfate reservoir in peat soil regions relevant for methane production and oxidation. Further, we expected the abundances of SRB to increase at the expense of methanogens after the inflow of brackish water. The increase in SRB in conjunction with an anticipated increasing abundance of sulfate-dependent anaerobic methanotrophic archaea (ANMEs) should decrease methane production and, therefore, can explain the reported decrease in methane emissions.
2.1 Site description
The study site and nature reserve Heiligensee und Hütelmoor is located near the city of Rostock at the German Baltic Sea coast. Mean annual temperature at the study area (hereafter “Hütelmoor”) was 9.6 ∘C, and mean annual rainfall was 635 mm (1991–2020, derived from the freely available grid product of the German Weather Service (DWD), for which 1 km gridded data are extrapolated from weather station data according to Müller-Westermeier, 1995). The Hütelmoor is a minerotrophic coastal paludification fen that was drained and used for agriculture between the 1970s and 1990s (Koch et al., 2014; Hahn et al., 2015; Unger et al., 2021a). Drainage led to water tables up to 1.60 m below surface (Glatzel et al., 2011) and to rapid peat decomposition (Koch et al., 2017). Therefore, the peat soil in the Hütelmoor is highly degraded (Voigtländer et al., 1996; Hahn et al., 2015), and peat thickness varies between 0.2 and 3 m (Wen et al., 2018; Koebsch et al., 2020). Active drainage of the area by pumping ended in 1990 and resulted in a rise of the water table to 0.3 m below ground (Glatzel et al., 2011), mostly due to freshwater from rising groundwater levels (Miegel et al., 2016). However, effective rewetting with permanent water levels above the ground surface was only achieved after installing a groundsill at the outflow of the catchment in 2009 (Miegel et al., 2016). Emergent macrophytes like Phragmites australis, Carex acutiformis, Bolboschoenus maritimus and Schoenoplectus tabernaemontani soon dominated the vegetation, while some large areas of open water remained (Koch et al., 2017). In 2018, a severe drought caused the water table to decrease, and new species like Tephroseris palustris and Ranunculus sceleratus that before had only minor cover in the area colonized the bare peat patches (Koebsch et al., 2020).
In addition to active drainage, a coastal protection dune built in 1963 (Voigtländer et al., 1996; Koebsch et al., 2013) reduced the input of brackish water. The last major brackish water inflow before 2019 occurred in 1995 (Bohne and Bohne, 2008). In 2000, maintenance of the coastal protection dune was discontinued to reinstate the natural flooding regime, leading to a slow decline in dune height and extent over the years. A storm surge destroyed parts of the rests of the former coastal protection dune close to the lake Heiligensee in January 2019, resulting in brackish water inflow into the peatland that potentially changed the formerly only weak pore water salinity gradient (Koebsch et al., 2019) along a previously sampled transect from HC1 towards HC4 (Fig. 2).
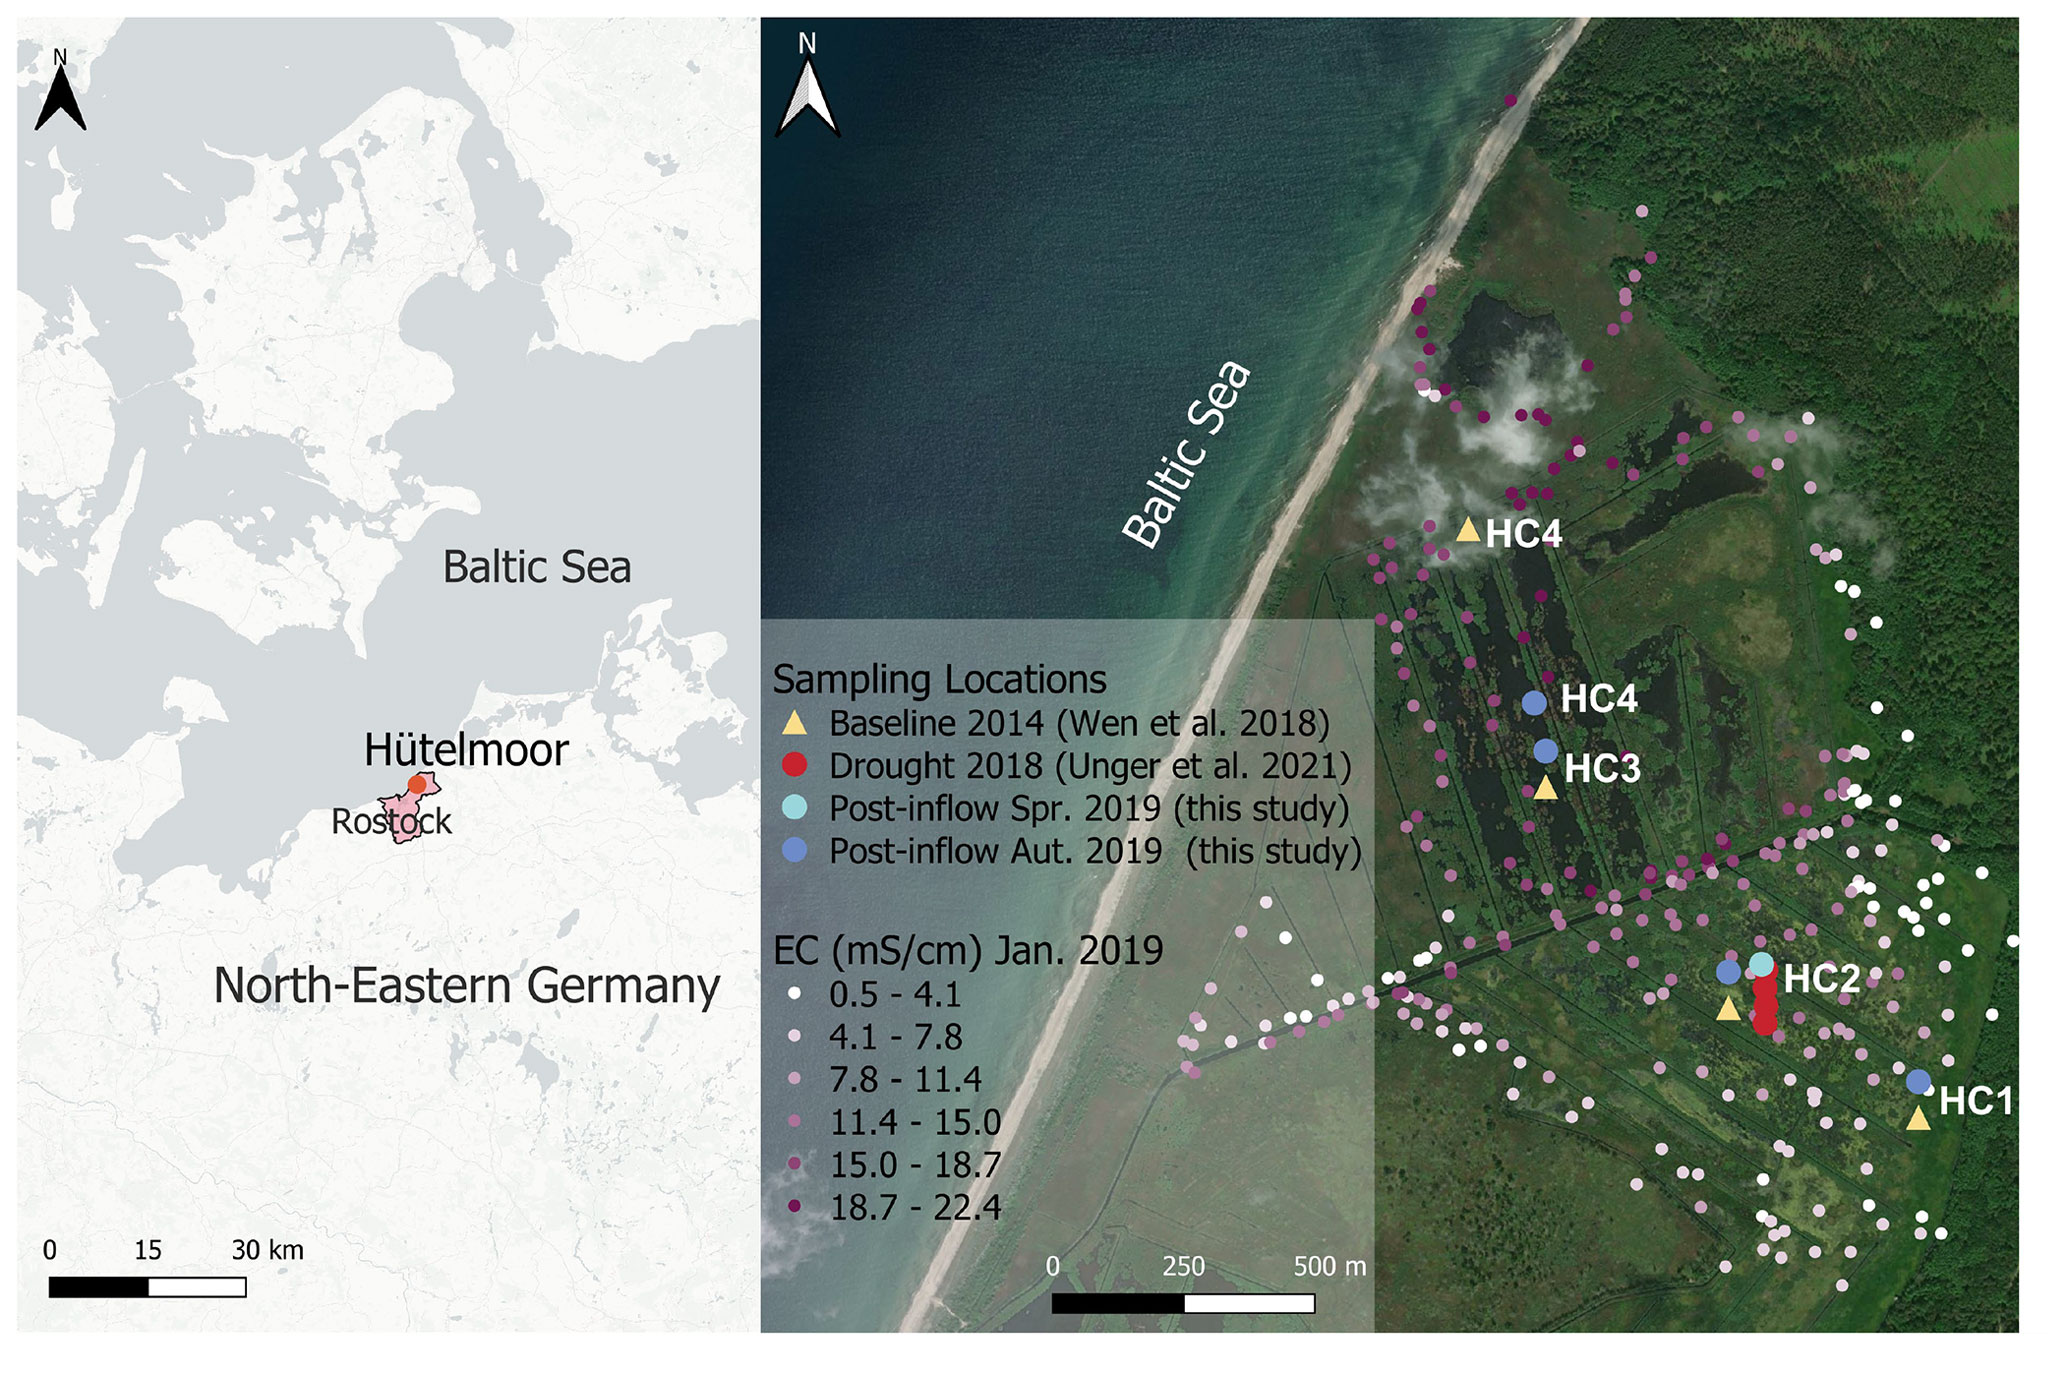
Figure 2Location of the study site in northeastern Germany (left) and sampling locations HC1–4 within the study site Hütelmoor (right). Exact locations of baseline sampling in 2014 are shown in yellow, drought sampling in 2018 in red, post-inflow in spring 2019 in light blue and post-inflow sampling in autumn 2019 in dark blue. Due to technical reasons, location HC4 had to be shifted post-inflow towards the south from its original (Baseline2014) position. Electrical conductivity (EC) values from January 2019, shortly after the inflow of brackish water, are shown in different shades of purple and ranged from 0.5 to 22.4 mS cm−1. The location map was drawn in QGIS, version 3.22.4, and the base map was created by CartoDB, under CC BY 3.0, using data from OpenStreetMap, under ODbL; see https://cartodb.com/basemaps/ (last access: 27 July 2022). Further maps were extracted from https://www.geoportal-mv.de/gaia/gaia.php (last access: 14 October 2022) and https://server.arcgisonline.com/arcgis/rest/services/World_Imagery/MapServer (last access: 14 October 2022).
2.2 Field data collection
We combined data from previous studies (results from microbial sequencing can be found here: Wen et al., 2016, and Unger et al., 2021b) with our own data recordings at the site to evaluate the effect of the inflow of Baltic Sea water during the storm surge in January 2019 (Fig. 2). We conducted fieldwork at the same four locations (HC1, HC2, HC3 and HC4) discussed in Koebsch et al. (2019) and Wen et al. (2018), which cover different salinity regimes, especially in deeper layers of the peat. Details regarding field sampling protocols (peat biogeochemistry and microorganisms) and data analysis can be found in Wen et al. (2018) and Unger et al. (2021a). The microbial analysis was conducted in the same laboratory and strictly followed the same protocols regarding DNA and RNA extraction and regarding primer combinations during sequencing and qPCR. Minor adaptations due to improved technologies are marked accordingly in the relevant subchapter of the method section.
In our study, previous data from 2014 served as a baseline and represent the conditions in the freshwater rewetted fen. Therefore, we refer to the geochemical, trace gas and microbial data from Wen et al. (2018) as “Baseline2014” (and “base14” in the figures). Data from Unger et al. (2021a) provided insights into the dynamics during the drought in 2018 at location HC2 and are referred to as “Drought2018” (and “drought18” in the figures).
In order to track the surface flow and exchange processes in the aboveground water column after the inflow, we complemented the pore water sampling with surface water measurements. Surface water electrical conductivity (EC) measurements took place on several days directly after the inflow in January 2019 to cover the immediate effect of the inflow. On 16 April 2019, surface water in situ variables and samples and local GHG flux measurements had been taken at the four locations. Sampling for microbial as well as for pore and surface water analysis combined with GHG measurements took place on 28 November and 2 December 2019, hereafter referred to as “Post-inflow Autumn2019”. Soil cores and pore water samples were also taken on 16 May 2019 (“Post-inflow Spring2019”) at one of our sampling locations (HC2; see Fig. 2) for better comparison with the previous drought study (Unger et al., 2021a) in order to increase the temporal resolution at this common location. We derived groundwater level data from a data logger and pressure transducer (Dipper PTEC, SEBA, Kaufbeuren, Germany) installed permanently near location HC2 at 0.49 m depth. Measurements were recorded every 15 min since January 2018.
At each of the four locations, we collected surface and pore water samples for sulfate and chloride concentration analysis. Surface water samples were filtered directly in the field and stored at −25 ∘C in the lab until further analysis. We used filters with a pore size of 0.45 µm (Sarstedt, Nümbrecht, Germany) in order to include only dissolved organic carbon (Thurman, 1985; Fiedler et al., 2008). For reference ion chromatography (IC) measurements, used to compare with data measured during drought in 2018 (Ibenthal, 2020), we filtered 10 mL samples in situ through a 0.20 µm cellulose acetate membrane. Surface water electrical conductivity (EC) and pH values were measured in situ (ProDSS, YSI, Ohio, USA). For pore water sampling in May 2019, pre-filled diffusion pore water samplers were used (Höpner, 1981). We installed pore water samplers well in advance, on 28 March 2019, to allow time for equilibration with the surrounding soil. For the pre-fill to match the salinity of the pore water, we mixed filtered (CA 0.45 µm, GE Healthcare Life Sciences Whatman®, Vancouver, Canada) tap water (which is river filtrate from river Warnow in Rostock) with filtered Baltic Sea water until salinity of Hütelmoor surface water was obtained. The diffusion samplers were pre-filled under argon atmosphere and wrapped until installation in the field. Pore water sampling in November and December of 2019 was carried out with peat soil cores, taken in plastic liners (length: 60 cm; inner diameter: 10 cm). Afterwards pore water extraction was conducted using Rhizon® pore water suction samplers (Rhizosphere Research Products, Wageningen, the Netherlands, 0.12 µm pore size; Seeberg-Elverfeldt et al., 2005). In pre-drilled holes of the plastic liner, rhizons were inserted and attached to 10 mL syringes. Pore water pH and salinity values were measured immediately after recovery using a handheld pH meter (Handylab pH11, Schott Instruments GmbH, Mainz, Germany, calibrated with Mettler Toledo buffer solutions) and a refractometer (Master-S, Atago, Tokyo, Japan).
Local CH4 flux measurements were conducted manually using an opaque floating chamber and a portable laser-based analyzer (Picarro G4301, GasScouter, Santa Clara, USA). The floating chamber was 22 cm high and had a total volume of 9953.3 cm3. Flux measurements lasted between 180 and 300 s and were repeated three times at randomly chosen spots on the open water body, close to each sampling location. In parallel, we measured chamber and soil temperatures, surface water level, and relative air humidity.
At each location, two peat cores were taken with a Russian D-corer (De Vleeschouwer et al., 2010) and divided into the following depth sections: 5–20, 20–40 and 40–50 cm. Each peat core was used to extract samples for microbial and pore water analysis in situ. From each core section we took sediment plugs for peat soil GHG concentration measurements using a tip-cut syringe (Omnifix, Braun, Bad Arolsen, Germany) to get a distinct sediment volume of 3 mL. We immediately inserted the sediment plugs into 20 mL glass vials (Agilent Technologies, 5182-0837, Santa Clara, USA) completely filled with saturated NaCl for conservation (no head space). We closed the vials airtight with rubber stoppers and aluminum crimpers and stored the samples upside down to avoid gas escape. Per location and core section, we extracted an additional 1 mL soil sample with a 5 mL tip-cut syringe (Omnifix, Braun, Bad Arolsen, Germany) to be analyzed for bulk density to obtain estimates for peat porosity. To prevent drying, the syringe opening was covered with Parafilm® (Bemis, Neenah, WI, USA), and samples were cooled at approximately 4 ∘C until further analysis. For microbial analysis, we collected subsamples from all core sections mentioned above and additionally from the surface layer between 0–5 cm. We placed them into centrifugation tubes (15 mL, Falcon®, Corning Inc, Tewksbury, MA, USA) using sterile equipment. We assured immediate cooling on ice and further storage at −80 ∘C to preserve total nucleic acids until further analyses.
2.3 Lab analyses: water and peat
2.3.1 Peat soil greenhouse gas concentrations
We measured peat soil CH4 and CO2 H2CO3 (in the following for simplicity referred to as CO2) concentrations using a gas chromatograph (GC; Agilent Technologies 7890A, Santa Clara, USA). A headspace of 3 mL filled with helium was created in the glass vials containing the sediment plugs and put onto a shaker for at least 24 h. With a needled syringe we extracted 300 µL of the headspace volume and inserted 250 µL into the GC using a flame ionization detector (FID) for CH4 and a thermal conductivity detector (TCD) for CO2 concentration measurement. Gas partial pressures as obtained from the headspace analyses were converted to micromolar concentrations of dissolved CH4 and CO2 using the following Eq. (1):
where G is the headspace gas mole fraction (ppm), H is the headspace volume (3 mL), T is the absolute temperature (295.15 K), R is the universal gas constant (0.0821 L atm K−1 mol−1), V is the peat volume (3 mL) and P is the peat porosity (mL cm3).
2.3.2 Isotopic composition of dissolved methane and inorganic carbon
The isotopic composition in the C gases can help to uncover the sources and/or production pathways. We determined δ13C in CH4 and total CO2 (DIC) after acidification with appropriate volumes of 2 M HCl to pH < 4.5 in diluted headspace samples from the glass vials described above (final volume of ∼ 20 mL), using cavity ring-down spectroscopy (CRDS; analyzer model Picarro G 2201-i) and the Small Sample Isotope Module (SSIM; both Picarro Instruments, Sunnyvale, USA). To exclude spectral interference with hydrogen sulfide potentially present in the samples, we added 1 mL of a saturated zinc acetate solution (zinc acetate dihydrate, > 98 %; Sigma Aldrich, Taufkirchen, Germany) to fix hydrogen sulfide as solid ZnS. We used the data on the concentrations of gases in the headspace (see Sect. 2.3.1) to determine a suitable dilution in synthetic air for isotope measurements to fall into the measurement range of the instrument of 300–2000 ppm for CO2 and 2.5–2000 ppm for CH4. While a maximum of 5 mL of headspace sample could be retrieved and an injected volume of 15–20 mL was necessary, the isotopic composition could not be determined for samples containing less than 10 ppm CH4 in the headspace. Isotope values are expressed in the common δ-notation vs. V-PDB. The values given in per mill (‰) are equivalent to “mUr” (milli-urey; Brand and Coplen, 2012). Calibration for 13C in CH4 was done using a working standard of 1000 ppm CH4 (−42.48 ‰) and four certified standards of 2500 ppm CH4 (−38.30 ‰, −54.45 ‰, −66.50 ‰ and −69.00 ‰). For CO2, a working standard of 1000 ppm (−31.07 ‰) and dilutions of pure CO2 (−27.10 ‰ and −4.55 ‰) were used. All gas standards without a certificate were calibrated against reference materials from IAEA (RM8562) using elemental analysis coupled to isotope ratio mass spectrometry (EA 3000, Eurovector, Redavalle, Italy; Horizon, NU Instruments, Wrexham, UK). Certified standards were obtained from air gas (Air Liquide, Plumsteadville, PA, USA) or from isometric instruments (GASCO, Victoria, BC, Canada).
2.3.3 Ion composition in pore and surface waters
Sulfate concentrations in pore water were analyzed by inductively coupled plasma optical emission spectrometry (ICP-OES, iCap 7400 Duo MFC ICP spectrometer, Thermo Fisher Scientific, Dreieich, Germany) with a matrix matched external calibration (diluted Atlantic seawater (salinity 35.0 (± 0.2 %), OSIL, Hampshire, UK)) and Sc as an internal standard. Precision and accuracy were checked with spiked SLEW-3 (National Research Council Canada Measurement Science and Standards, Ottawa, Canada) and were better than 4.7 and 7.6 % (von Ahn et al., 2021), respectively. Dissolved sulfide was measured in the solutions preserved with zinc acetate on-site following the methylene blue method of Cline (1969) using a spectrophotometer (SPECORD 40, Analytik Jena GmbH, Jena, Germany). For sulfate and chloride in surface water samples the same method was applied as for the pore water analysis. Reference surface water sulfate and chloride concentrations, used for comparison with surface water data from the drought 2018 (Ibenthal, 2020), were determined with anion chromatography (DX320, Dionex) with inline dilution and dialysis setup (Metrohm 930 Compact IC Flex with a Metrosep A Supp 5-150/4.0 (6.1006.520) column, Herisau, Switzerland).
2.3.4 Peat physical properties
The sampled 1 mL soil cores were pushed out of the syringes and weighed after drying for 24 h at 70 ∘C to determine bulk density ρb. Loss on ignition (LOI, in %) was determined for each sampling site and depth section on additional cores at 550 ∘C using a CEM Phoenix Black microwave muffle furnace (North Carolina, USA). Porosity ϕ was then calculated with Eq. (2), following DIN 19683-14 (2007):
with the particle density of the organic material ρs-org= 1.40 g cm−3 and that of the ignition residue ρs-min= 2.65 g cm−3.
2.4 Lab analyses: microbial data
2.4.1 DNA and RNA extraction
We extracted DNA from 150–200 mg soil from biological duplicates per sampling location and depth section according to the manufacturer's protocol (GeneMATRIX Soil DNA Purification Kit, Roboklon, Berlin, Germany). DNA concentrations were quantified using a Qubit 2.0 Fluorometer (Thermo Fisher Scientific, Darmstadt, Germany), following the protocol of the DNA High Sensitivity and Broad Range Assay Kit (dsDNA HS and BR assay, Thermo Fisher, Berlin, Germany).
For RNA extraction, we required 2 g of soil and used the RNeasy PowerSoil Total RNA Kit (Qiagen, Venlo, Netherlands). RNA concentrations were also quantified with the Qubit 2.0 Fluorometer and the RNA High Sensitivity Assay Kit (RNA HS, Thermo Fisher, Berlin, Germany). To remove unwanted excess DNA from RNA samples we used the TURBO DNA-free Kit (Invitrogen, Thermo Fisher, Berlin, Germany) according to an in-house protocol. Here, we applied 0.1 % volume (e.g., 5 µL) of 10× Turbo DNase Buffer and 1 µL Turbo DNase to the extracted RNA dissolved in 50 µL RNase- and DNase-free water. After mixing, the solution was incubated at 37 ∘C for 30 min. DNase Inactivation Reagent (5 µL) was added and mixed well using a vortex. After incubation at room temperature for 5 min, the resulting suspension was centrifuged at full speed (17 000 g) at 4 ∘C for 1.5 min. RNA was dissolved in supernatant and separated from the pelleted DNA. RNA concentrations were quantified using the Agilent 4150 TapeStation system and RNA ScreenTape assay (Agilent, Santa Clara, USA) according to the manufacturer's protocol.
2.4.2 cDNA synthesis
cDNA synthesis was done using SuperScript III Reverse Transcriptase (Invitrogen, Thermo Fisher, Berlin, Germany). We followed the in-house protocol and applied 1 µL Random Hexamer and 1 µL 10 mM dNTP Mix (nucleotides) onto 50 ng RNA template and filled the tube to a final volume of 13 µL with sterile water. We heated the mixture at 65 ∘C for 5 min and immediately chilled on ice afterwards. Then, we added 4 µL 5× First Strand Buffer, 1 µL 0.1 M DTT, 1 µL sterile water, and 1 µL SuperScript III RT and mixed well. The resultant mixture was incubated at 25 ∘C for 5 min following incubation at 50 ∘C for 60 min. The reaction was inactivated by heating to 70 ∘C for 15 min.
2.4.3 PCR amplification and sequencing
Amplification via polymerase chain reaction (PCR) of 16S rRNA genes of DNA and cDNA samples was performed using the universal primer combination Uni515-F/Uni806-R (Caporaso et al., 2011), for both bacteria and archaea, and primer combination S-D-Arch-0349-a-S-17/S-D-Arch-0786-a-A-20 (Takai and Horikoshi, 2000) for more precise archaea detection. Please note that Wen et al. (2018) and Unger et al. (2021a) used a specific bacterial primer combination (S-D-Bact-0341-b-S-17/S-DBact-0785-a-A-21) instead of the universal primer we used here. We decided on the universal primer because it has equal resolution for bacteria but covers both bacteria and archaea, providing some support for the qPCR data. For the PCR (Thermal Cycler, T100, Bio-Rad, Feldkirchen, Germany) we added 10× Pol Buffer C (OptiTaq DNA Polymerase, Roboklon, Berlin, Germany), 1.25 U OptiTaq DNA Polymerase, 0.2 mM dNTP, 0.5 mM MgCl2 and 0.5 µM of each primer to 5 µL of the purified sample. Using sterile water, we filled the mixture to a final volume of 50 µL. The PCR program for universal primers included initial denaturation at 95 ∘C for 5 min and then 30 cycles of denaturation at 95 ∘C for 30 s, annealing at 56 ∘C for 30 s and elongation at 72 ∘C for 1 min, followed by a final elongation at 72 ∘C for 7 min. The PCR program for archaeal primer included 35 cycles of denaturation at 95 ∘C for 30 s, annealing at 55 ∘C for 30 s and elongation at 72 ∘C for 1 min. Initial denaturation and final elongation were the same as mentioned above. When we could not detect a clean product, we increased the number of PCR cycles to up to 10 additional cycles for archaeal primer samples. The same PCR program was run on purified RNA extracts to exclude remnants of DNA.
The PCR products were cleaned using Agencourt AMPure XP magnetic bead solution (Beckman Coulter, Massachusetts, USA) according to the manufacturer's protocol. Identification of single samples was possible due to unique barcodes, which were attached to the primers. Illumina MiSeq sequencing was done by Eurofins Genomics (Ebersberg, Germany) with 300 bp paired-end mode.
2.4.4 qPCR gene abundance measurements
To quantify the abundances of the 16S rRNA target genes, mcrA, pmoA and dsrB, we used quantitative PCR (qPCR, CFX Connect Real-Time PCR Detection System, Bio-Rad, Munich, Germany) with the double-strand binding dye SYBR Green (KAPA universal). Whereas primers for 16S rRNA genes (Eub341-F/Eub534-R) target general prokaryotic microorganisms, primers used to amplify mcrA, pmoA and drsB are specific to genes encoding enzymes used by methanogenic archaea (mcrA, mlas-F/mcrA-R), aerobic methanotrophic bacteria (pmoA, pmoA189-F/pmoA661-R) and SRB (dsrB, DsrB2060-F/DsrB4-R). According to the in-house protocol, we used 10 µL of SYBR Green, 0.08 µL of each primer (with a concentration of 100 µM each), 4 µL template per reaction and 5.84 µL sterile water, resulting in a total final volume of 20 µL. The qPCR program included initial denaturation at 95 ∘C for 3 min, denaturation at 95 ∘C for 3 s, annealing for 20 s, elongation at 72 ∘C for 30 s and a plate read at 80 ∘C for 3 s to create the melting curve. Annealing temperatures were 60 ∘C for 16S rRNA genes, mcrA and pmoA and 62 ∘C for dsrB, respectively. The standard curve was typically based on a series of dilutions of known gene copy numbers in the range of, e.g., 103–108 copies as specified in Winkel et al. (2018), with starting concentrations being 2.5×10⁸ for 16S rRNA, 2.9×10⁷ for mcrA, 3.2×10⁷ for pmoA and 6.69×10⁷ for dsrB genes. We performed 35 qPCR cycles for 16S rRNA genes and 40 cycles for mcrA, pmoA and dsrB. Since Wen et al. (2018) and Unger et al. (2021a) did not investigate SRB, we performed qPCR with dsrB target primers additionally with material from Baseline2014 and Drought2018. All absolute gene copy numbers are given per gram of dry soil and were calculated by normalizing them over their initial fresh weight, taking into account a dry weight factor, the elution volume and the dilution factor. For better visualization, we log10 transformed the data.
2.5 Data analysis
2.5.1 GHG flux estimation
Flux data analyses were done in R (R Core Team 2021). CH4 fluxes were estimated with the fluxx function of the R package flux (Jurasinski et al., 2014) as described in Huth et al. (2012), Günther et al. (2015) and Huth et al. (2021). We used the atmospheric sign convention, meaning that positive fluxes indicate a release from the ecosystem to the atmosphere and negative fluxes indicate an uptake by the ecosystem.
2.5.2 Processing of microbial sequence data
The Illumina paired-end (PE) sequences were preprocessed by the method described in Krauze et al. (2021) and Yang et al. (2021). Briefly, demultiplexing was implemented by combining mothur (version 1.39.0) (Schloss et al., 2009), BBTools (Bushnell, 2014) and a custom Python script. The PE reads were processed with the make.contigs function of mothur, and the resultant report and groups files were parsed with a custom Python script to get sequence identifiers of the good quality contigs (minimum overlap length > 25, mismatch bases < 5 and without ambiguous base) for each sample. Next, PE sequences were extracted for each sample with the filterbyname.sh function of BBTools. After these steps, orientation of PE sequences was corrected by the extract_barcodes.py function of QIIME (version 1.8) (Caporaso et al., 2010). After removing primers with the awk command, the PE sequences were fed to DADA2 (Callahan et al., 2016) for filtering, dereplication, chimera check, sequence merge, and amplicon sequence variant (ASV) calling. All sequencing reads, including those from Wen et al. (2018) and Unger et al. (2021a), were merged into a common ASV file which provided the basis for all following analyses. Taxonomic assignment was referred to SILVA138 (Quast et al., 2013) in platform QIIME2 (Bolyen et al., 2019).
2.5.3 Visualization and statistical analyses
Several R packages (simba, Jurasinski and Retzer, 2012), dplyr (Wickham et al., 2021), reshape2 (Wickham, 2007), forcats (Wickham, 2021), and scales (Wickham and Seidel, 2020) were used to visualize and explore microbial community data in R. We followed Unger et al. (2021a) and used bubble plots and nonmetric multidimensional scaling (NMDS) ordinations to investigate changes in the microbial community structure and in the structure of the communities of specific groups (methanogens, methanotrophs, SRB and ANME) of different sites and depths with the DNA and RNA data. We provide the R workflow as Supplement. In brief, we constructed bubble plots to visualize dissimilarity in microbial community composition at the order (methanogens, methanotrophs), class (SRB), and genus (ANMEs) level among subsites and across sampling periods. We extracted the relevant groups from the data by searching for text strings using regular expressions across the whole taxonomy for the DNA and, where available, for the RNA data. Then we transformed the data from wide format to molten format and plotted the bubble plots using ggplot2 (Wickham, 2016) and arranged them using ggpubr (Kassambara, 2020). To account for the different sizes of the bacterial and the archaeal datasets and strongly varying count numbers across taxonomical units, we used Wisconsin double standardization at each group level (vegan package, Oksanen et al., 2020).
Further, we built NMDS plots by using the metaMDS() function of R package vegan (Oksanen et al., 2020) at the domain level to examine differences in relative abundances of bacteria and archaea over sampling locations and time (sampling campaigns). Here, we applied Wisconsin double standardization on the entire bacterial and archaeal dataset each before running the NMDS. We used the envfit() function of package vegan (Oksanen et al., 2020) in order to add environmental variables to the NMDS ordination configurations. Colors were used according to a colorblind-friendly palette from ggthemes (Arnold, 2021).
To visualize quantitative differences in functional gene abundances, we created depth profiles using the R packages ggplot2 (Wickham, 2016), ggpubr (Kassambara, 2020) and patchwork (Pedersen, 2020). In addition, we created depth profiles of pore water variables such as pH, electrical conductivity, dissolved gas, sulfate and chloride concentrations, and gas isotopic signatures. To test for differences in average values, we used ANOVA and a post hoc Tukey test for normally distributed data. For not normally distributed variables, we used the Kruskal–Wallis test and Wilcoxon test (including Bonferroni correction) as a post hoc test for more than three subgroups and a Mann–Whitney U test for exactly two variables. To display average values for different subgroups (usually mean values with standard error if not indicated otherwise), we used the psych package (Revelle, 2020).
3.1 Brackish water effect on surface and pore water geochemistry
The year 2019 after the brackish water inflow in January had a mean annual air temperature of 10.7 ∘C and an average annual precipitation of 605 mm. Thus, 2019 was warmer (+1.1 ∘C) and slightly drier (−30 mm) than the averages of the latest 30-year reference period (1991–2020, DWD Germany; see Sect. 2.1). Since rewetting in 2009, water levels resided largely above the ground surface year-round. During the drought in 2018, however, mean water levels near station HC2 ranged between −0.61 (below ground) and 0.59 m (above ground) and stayed below the ground surface for 153 d. In 2019, water levels showed much less variation and ranged between −0.07 and 0.36 m, dropping to below the ground surface on only 2 d.
The inflow event in January 2019 created a pronounced lateral brackish zonation in the surface water, which was essentially shaped by the separating effect of the main ditch, which crosses the area in NE–SW direction: HC3 and HC4, located north of the ditch and closest to the Baltic Sea, had the highest electrical conductivities (ECs > 22 mS cm−1), whilst HC1, located south of the ditch and furthest inland, had lowest EC values (≤ 11 mS cm−1, Fig. 2). The data measured during our Post-inflow Spring2019 campaign in April/May at the distinct transect stations were in line with these initial inflow patterns, although the EC had decreased significantly overall since January. Surface water EC decreased down to 12 mS cm−1 in the vicinity of the Baltic Sea at HC3 and HC4 and down to 7 mS cm−1 at the inland spots HC1 and HC2. By autumn (Post-inflow Autumn2019), EC values at HC3 and HC4 dropped down to 8.7 mS cm−1, while the EC values at the inland locations HC1 and HC2 were 5.3 and 6.3 mS cm−1, respectively. As a result, the lateral brackish water gradient that had been established due to the inflow event (Fig. 2) had largely leveled out within 11 months. In parallel to EC, surface water sulfate concentrations also decreased from 3.9 mM (HC4) and 2.7 mM (HC1) down to 1.2 and 0.2 mM, respectively, between Post-inflow Spring2019 and Autumn2019. Unlike sulfate concentrations, which decreased throughout all locations from Post-inflow Spring2019 to Autumn2019, chloride concentrations only decreased at the inland locations HC1 and HC2 and increased at HC3 and HC4, the locations closer to the Baltic Sea (Table S1). This created a lateral span from HC4 (47.3 mM) towards HC1 (12.4 mM) in Post-inflow Autumn2019, which did not occur in Post-inflow Spring2019. The divergent temporal dynamics of surface water chloride concentrations at different areas of the peatland were also reflected by the sulfate chloride (SO Cl−) ratios: SO Cl− ratios at all locations in Post-inflow Spring2019 were within a narrow range of 0.09–0.12 and decreased towards Post-inflow Autumn2019 (0.01–0.03) by around 1 order of magnitude and were then highest at HC4 and lowest at HC1 (Table S1).
In the pore water, there was a general and significant increase in EC (from 5.1 ± 2.8 to 9.1 ± 3.3 mS cm−1, p < 0.001, Wilcoxon test), sulfate (from 1.1 ± 3.7 to 5.3 ± 6.9 mM, p < 0.001, Wilcoxon test) and chloride concentrations (from 37.8 ± 22.8 to 55.1 ± 22.4 p < 0.05, Wilcoxon test) after the inflow from Baseline2014 conditions to Post-inflow Autumn2019, averaged over all four locations and across all sampling depths (Fig. 3b, c and d; for average values see Table S1). The individual depth profiles are, however, shaped by their specific location along the lateral brackish gradient and the pre-existing Baseline2014 sulfate concentrations. Pore water sulfate levels at HC3 and HC4 close to the Baltic Sea increased only moderately from average 0.02 and 0.16 mM at Baseline2014 to 0.8 and 0.7 mM in Post-inflow Autumn2019, respectively. In contrast, sulfate concentrations at HC1, furthest inland, increased strongly from a low level of only 0.01 mM (Baseline2014) to 9.9 mM (Post-inflow Autumn2019) and thereby approached the record levels of HC2. HC2 had highest pre-existing Baseline2014 sulfate concentrations at deep pore water layers (Fig. 3g). Averaged across the profile, sulfate concentrations at HC2 increased from 3.5 to 8.9 mM after the inflow (Table S1). In Post-inflow Autumn2019, pore water chloride concentrations increased mostly in upper peat layers at all four locations after the inflow (Fig. 3d) but to a higher extent at locations in proximity to the Baltic Sea (HC3 and HC4, with averages across the peat profile: 68.1 and 74.8 mM, respectively) and to a lesser extent at locations HC1 (23.5 mM) and HC2 (57.1 mM). Baseline2014 pore water chloride concentrations showed similar differences in magnitude like sulfate concentrations, but here concentrations were lower at HC1 (12.4 mM) compared to the other three locations (40.5–47.4 mM; see Table S1).
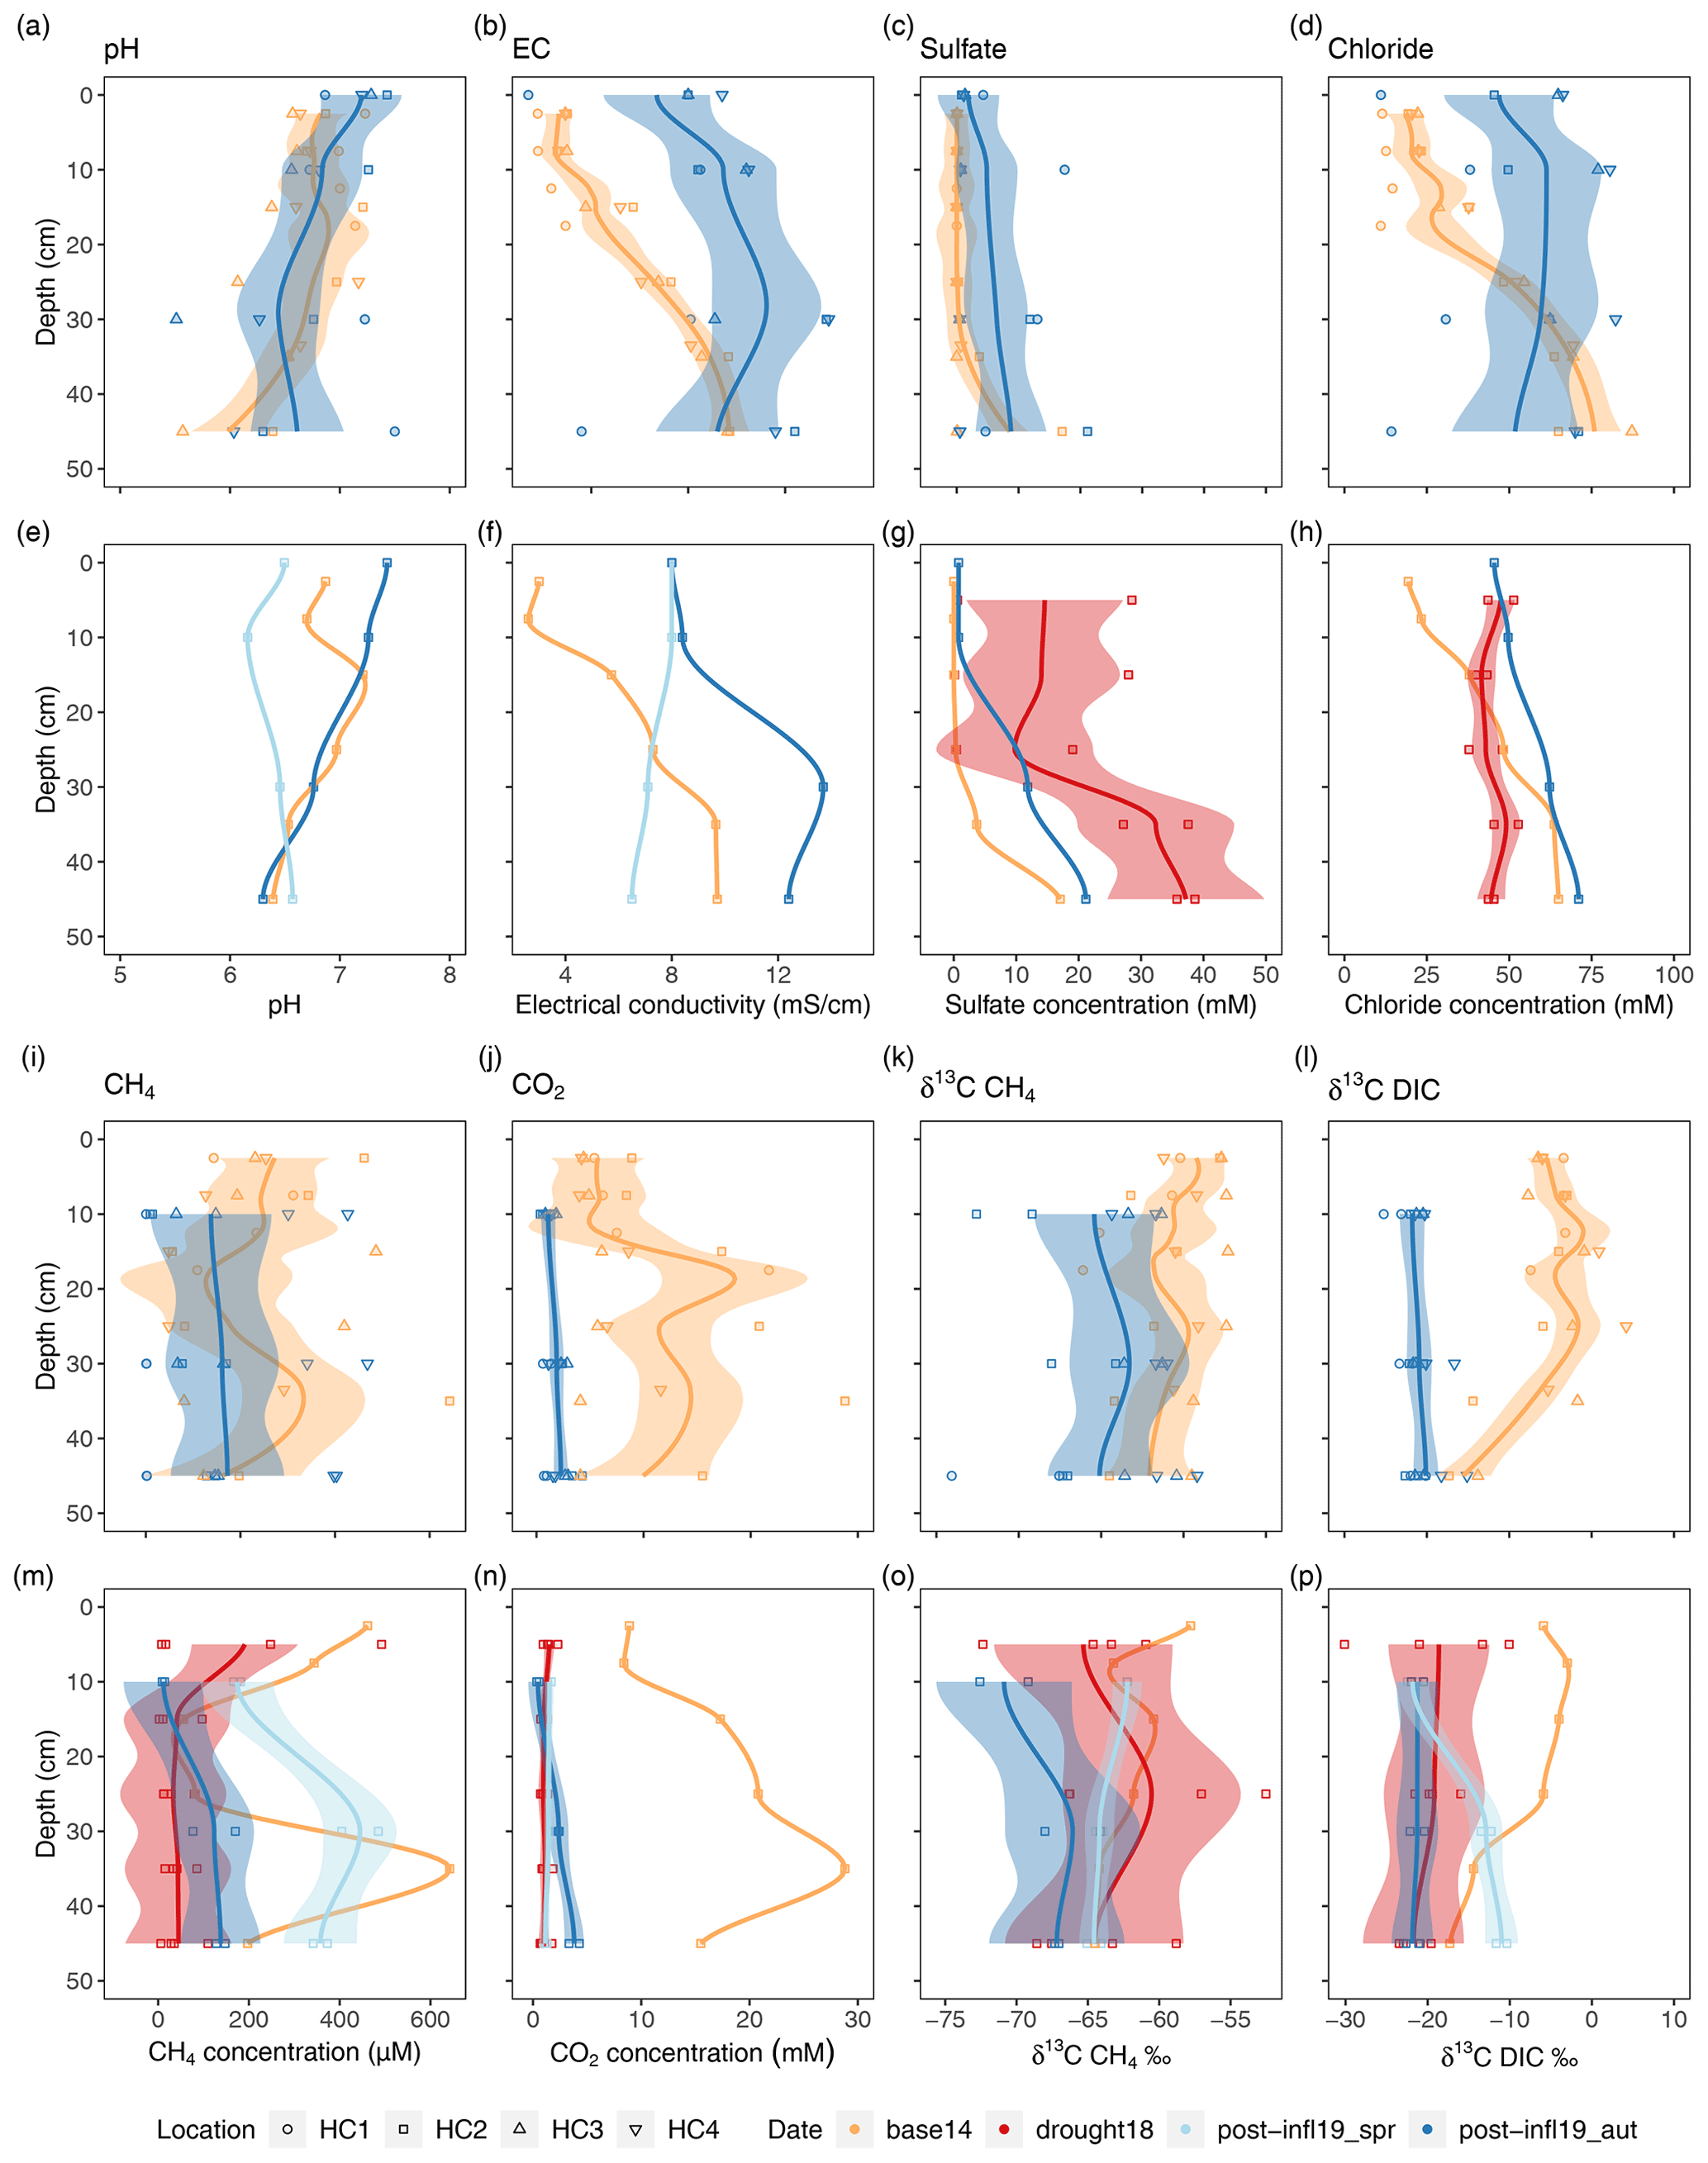
Figure 3Compilation of depth profiles for pore water variables; panels (a)–(d) and (i)–(l) show comparison between Baseline2014 (n= 42) and Post-inflow Autumn2019 (n= 26–32) at locations HC1–4; panels (e)–(h) and (m)–(p) show comparison between Baseline2014 (n= 12), Drought2018 (n= 24), Post-inflow Spring2019 (n= 8) and Post-inflow Autumn2019 (n= 8). Colors represent the different sampling campaigns, and symbols show different sampling locations. The lines depict a span = 0.5 LOESS smooth along the data points and are meant to guide the eye. The shaded areas represent the respective confidence interval of 95 % according to standard errors of the models. A colorblind-friendly color palette “4-class RdYlBu” was used from https://colorbrewer2.org/?type=diverging&scheme=BrBG&n=4#type=diverging&scheme=RdYlBu&n=4 (last access: 28 January 2022).
When zooming in to HC2 (Fig. 3e–h), where we have additional sampling data (Drought2018 and Post-inflow Spring2019), a new sulfate concentration maximum of almost 40 mM becomes apparent in depths below 35 cm during the Drought2018 (Fig. 3g). At the same time, chloride concentrations hardly increased during the drought but rather in Post-inflow Autumn2019 (Fig. 3h). The additional data at location HC2 also show a gradual increase in EC starting in Post-inflow Spring2019 in the surface layers and increasing throughout the peat profile towards Post-inflow Autumn2019 (Fig. 3f).
3.2 Greenhouse gas fluxes, concentrations and isotopic signatures in the pore water
All CH4 fluxes measured in 2019 differed slightly but not significantly among locations despite the differences in surface water EC and sulfate concentrations. Overall, CH4 fluxes averaged (median) 0.06 and 0.4 mg m−2 h−1 in Post-inflow Spring2019 and Post-inflow Autumn2019, respectively (Table S1), and differed significantly between the post-inflow seasons (p < 0.01, Mann–Whitney U test).
Dissolved CH4 concentrations in pore water samples decreased from an average of 232.6 ± 161.8 µM in the Baseline2014 sampling to an average of 158.0 ± 155.4 µM in our Post-inflow Autumn2019 sampling. Whereas CH4 concentrations varied strongly with location and depth in 2014, the depth variation was much lower in Post-inflow Autumn2019, while the variability across locations did not change much (Fig. 3i). Like CH4, also CO2 concentrations decreased from Baseline2014 (9.8 ± 6.9 mM) to Post-inflow Autumn2019 (1.8 ± 1.0 mM) and were significantly different between the two years (Wilcoxon test, p < 0.0001). This strong decrease was associated with a strong decrease in depth-dependent variation (Fig. 3j). At location HC2 (Fig. 3m–n), where additional measurements were taken during the Drought2018 and Post-inflow Spring2019, CH4 concentrations remained relatively high at the surface in Drought2018, but were lower in deeper layers and showed much less depth variation than Baseline2014 (Fig. 3m). Here at HC2, CH4 concentrations decreased from average 297.1 ± 218.6 µM (Baseline2014) to 70.9 ± 114.3 µM (Drought2018) and increased strongly to an average of 325.4 ± 126.7 µM in Post-inflow Spring2019, showing the highest values in almost all sampled depth sections. In Post-inflow Autumn2019, the pore water CH4 concentrations at HC2 decreased again but remained, on average (91.0 ± 68.7 µM), slightly higher than during the Drought2018. Similarly, CO2 concentrations (Fig. 3n) decreased strongly from Baseline2014 (16.6 ± 7.3 mM) to during the Drought2018 (1.1 ± 0.4 mM) in the same pore water samples (HC2) but increased only marginally in Post-inflow Spring2019 (1.4 ± 0.2 mM) and Post-inflow Autumn2019 (2.2 ± 1.5 mM). While strong decreases in depth variation of CO2 concentrations were found during the Drought2018 and in Post-inflow Spring2019 shortly after the inflow, depth variation slightly increased in Post-inflow Autumn2019, with the highest values with increasing depths (Fig. 3n).
At all locations (Fig. 3k), δ13C-CH4 values were significantly lower (−64.7 ± 4.1 ‰, p < 0.001, Tukey test) in Post-inflow Autumn2019 compared to Baseline2014 (−60.6 ± 2.6 ‰). δ13C-CO2 values (Fig. 3l) also became more negative after the inflow and differed significantly between Baseline2014 and Post-inflow Autumn2019, averaging −5.2 ± 5 ‰ and −20.94 ± 2.1 ‰, respectively (p < 0.001, Tukey Test). At HC2 (Fig. 3o), δ13C-CH4 decreased steadily from Baseline2014 (max: −57.8 ‰), Drought2018 and Post-inflow Spring2019 to Post-inflow Autumn2019 (min: −72.6 ‰). It is also apparent that the decrease in δ13C-CO2 already took place during Drought2018 (Fig. 3p), leading to significant differences between the Baseline2014 and the Drought2018 (p < 0.001, Tukey Test) at location HC2. Here, average δ13C-CO2 decreased from −8.4 ± 5.7 ‰ (Baseline2014) to −19.9 ± 5.1 ‰ (Drought2018), increased in Post-inflow Spring2019 (−15.2 ± 5.2 ‰) and decreased again in Post-inflow Autumn2019 (−21.5 ± 0.9 ‰).
3.3 Microbial community composition
Throughout all sampling locations, the most abundant groups of methanogenic archaea belonged to the orders Methanosarcinales, Methanomicrobiales, Methanobacteriales, Methanofastidiosales, Methanocellales and Methanomassiliicoccales (orange, Fig. 4a). Increases and decreases in DNA-based relative abundances in individual depth sections caused methanogenic archaea to appear more homogenous along the peat profile in Post-inflow Autumn2019 compared to the Baseline2014. While acetoclastic groups, especially Methanosaeta (or Methanothrix, Bräuer et al., 2020), within the Methanosarcinales order remained rather constant, CO2-reducing and some potentially methylotrophic methanogens like Methanomicrobiales and taxa within Methanobacteriales gained in relative abundance after the inflow. Among the methanotrophic bacteria, the genera Methylocystis and Methylosinus within the order Rhizobiales were most abundant at the Baseline2014 sampling and decreased in Post-inflow Autumn2019, while representatives of the order Methylococcales increased and were subsequently present throughout the whole depth profile from 0–50 cm. Candidatus Methylomirabiles oxyfera within Methylomirabilales were found in low abundances at the Baseline2014 sampling and appeared in higher abundances in Post-inflow Autumn2019 at HC1 and HC4 (blue, Fig. 4a).
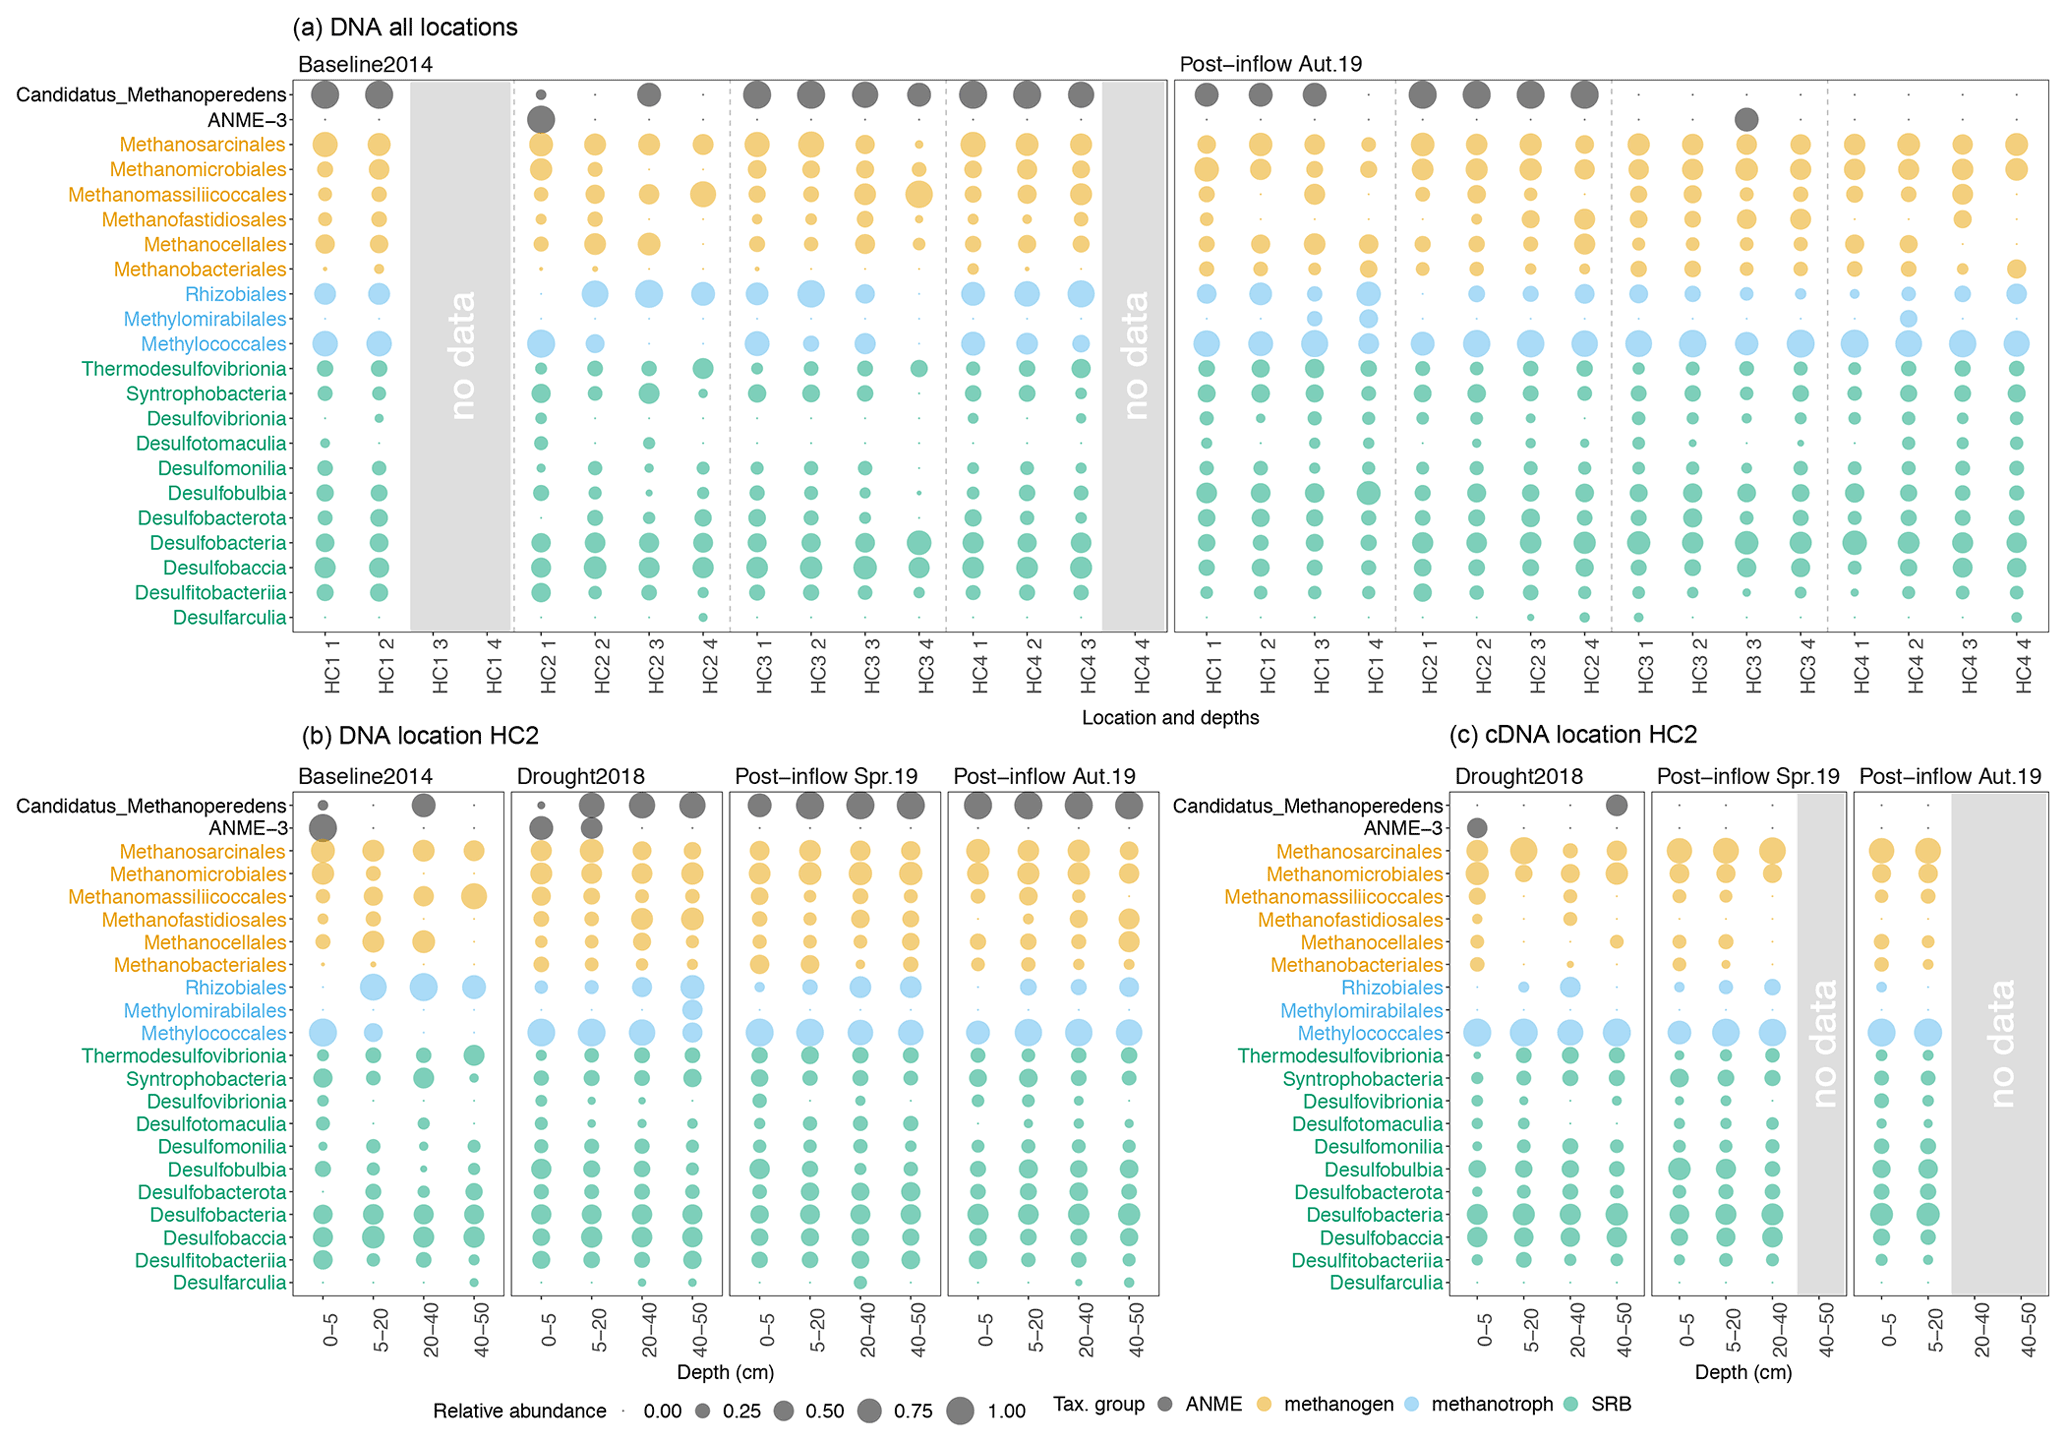
Figure 4Bubble plots showing the microbial community composition and relative abundances from all sampling locations along the surface water salinity gradient (a) and the sampling location HC2 (b, c). On the y axes the taxonomical groups on order (methanogens, methanotrophs), class (sulfate-reducing bacteria, SRB) and genus level (anaerobic methanotrophic archaea, ANME) are displayed. The x axes show (a) the locations HC1–4 and sampling depths, where codes correspond to the depths, 1 = 0–5, 2 = 5–20, 3 = 20–40, 4 = 40–50 cm, and (b, c) the depth in centimeters (cm). Coloring reflects the different microorganism groups. Circle sizes represent relative abundances (square root transformed) of different taxonomic groups from (a, b) DNA- and (c) RNA-based sequencing (cDNA data derived from RNA extraction). Note that groups are not adding up globally but sum up to 100 % within each group (methanogens, methanotrophs, SRB, ANME). Please also note that preservation methods differed slightly between the studies.
Sulfate-reducing bacteria (SRB) were already present in relatively moderate abundances during the Baseline2014 sampling. The most dominant classes in Baseline2014 were Desulfobacteria and Desulfobaccia (green, Fig. 4a). Other SRB classes such as Desulfovibrionia, Desulfotomaculia and Desulfobulbia were distributed more equally and higher in relative abundance in surface peat soil in Post-inflow Autumn2019 (green, Fig. 4a). The anaerobic methanotrophic Candidatus Methanoperedens was found in most locations in high relative abundance (black, Fig. 4a). In Post-inflow Autumn2019, relative abundances of Candidatus Methanoperedens decreased strongly at location HC3 and HC4. ANME-3 was only present in high relative abundances in the surface peat layer at HC2 in Baseline2014 (black, Fig. 4a). In Post-inflow Autumn2019, ANME-3 was only detected between 20–40 cm at HC3.
At location HC2 (Fig. 4b), a more detailed picture of the microbial communities was possible due to two additional sampling campaigns during the Drought2018 and in Post-inflow Spring2019. Despite differences in biogeochemical conditions, it appears that the microbial community compositions and DNA-based relative abundances at HC2 show similar patterns comparable to the other locations during the Baseline2014 and Post-inflow Autumn2019 samplings (Fig. 4a). According to the data from HC2, most methanogenic orders increased during the drought and remained high in abundance after the brackish water inflow such as taxa within Methanomicrobiales and Methanobacteriales (orange, Fig. 4b). In contrast, Methanofastidiosales decreased shortly after the inflow (Post-inflow Spring2019) and increased in deeper peat layers towards Post-inflow Autumn2019 (orange, Fig. 4b). Other methanogens, such as Methanomassiliicoccales and Methanocellales, decreased during the Drought2018 (orange, Fig. 4b). Both orders remained low in abundance after the inflow of brackish water. Putatively active methanogen taxa (RNA-based communities) changed only slightly from the Drought2018 towards the post-brackish water inflow year (Fig. 4c). These changes were mostly in line with the changes observed in the DNA-based data (Fig. 4b).
Within bacterial methanotrophs at location HC2, Methylococcales became more abundant during the Drought2018 and remained high in DNA-based relative abundance as the most dominant methanotrophs after the brackish water inflow (blue, Fig. 4b). In general, the abundances of Rhizobiales decreased during the Drought2018 and even more so in Post-inflow Spring2019 and Autumn2019. Methylomirabilales increased during the Drought2018 in peat layers below 40 cm and disappeared almost completely after establishment of higher water tables post-inflow. The RNA-based abundances of aerobic methanotrophic bacteria like Methylococcales were similarly high during Drought2018 and post-inflow conditions, while RNA-based abundances of Rhizobiales were lower (blue, Fig. 4c), which reflects the results of DNA analysis (blue, Fig. 4b).
In the DNA-based community profile, most SRBs (Desulfovibrionia, Desulfotomaculia, Desulfobulbia, Desulfobacterota) increased in relative abundance at HC2 during the Drought2018 and remained highly abundant in most peat layers in Post-inflow Spring2019 and Autumn2019 (green, Fig. 4b).
DNA-based abundances of Candidatus Methanoperedens increased already during the Drought2018 and remained high afterwards through the whole peat profile (black, Fig. 4b). DNA-based ANME-3, which were detected in surface layers in Baseline2014 at location HC2, were still present during the Drought2018 but with low abundances in Post-inflow Spring2019 and Autumn2019 (black, Fig. 4b).
3.4 Absolute abundances of microbial groups (qPCR)
Mean total prokaryote gene sequence abundances (16S rRNA gene) were very similar among the four sampling campaigns, whereas abundance variation along depth sections decreased after the brackish water inflow (Fig. 5a). Absolute methanogenic (mcrA) and aerobic methanotrophic (pmoA) gene copies (per gram of dried soil) were lower at the surface layer and higher at deeper peat layers in Post-inflow Autumn2019 at all locations compared to Baseline2014 conditions (Fig. 5b and c). Average mcrA gene copies did not differ largely across sampling campaigns, but pmoA gene copies decreased slightly but not significantly towards Post-inflow Autumn2019, despite considerable spatial variability. Functional genes encoding for sulfate-reducing bacteria (dsrB) increased significantly (Wilcoxon test, p < 0.001) in absolute abundance after the brackish water inflow at all locations (Fig. 5d). Mean dsrB gene copy numbers from Post-inflow Autumn2019 were close to 3 orders of magnitude higher compared to the Baseline2014.

Figure 5Depth profiles (a) of locations HC1–4 and (b) location HC2 showing log10 abundances (copies/g dry soil) of functional genes (16S rRNA, mcrA, pmoA and dsrB), derived from qPCR analysis. Sample sizes differ between top and bottom plot and are as follows. HC1–4 in Baseline2014: n= 34–42; Post-inflow Autumn2019: n= 32. HC2 in Baseline2014: n= 7–12; Drought18: n= 16; Post-inflow Spring2019: n= 8; Post-inflow Autumn2019: n= 8. Different colors visualize different sampling dates. Trend lines were estimated using LOESS with a span of 0.5 and are meant to guide the eye. Shaded areas show the confidence interval according to standard errors. The confidence interval for all locations (a–d) is 95 %; the confidence interval of location HC2 (e–h) was set to 50 %.
Zooming in on the higher temporal resolution at HC2 shows that absolute methanogenic abundances (mcrA) increased during the Drought2018 and Post-inflow Spring2019 and increased further in Post-inflow Autumn2019 (Fig. 5f). Methanotrophs (pmoA) also increased already during the Drought2018 but decreased Post-inflow Spring2019 to the level from before the Drought2018 (pmoA, Fig. 5g). SRB abundances (dsrB) increased slightly during the Drought2018 but increased much more strongly in Post-inflow Spring2019 and especially after additional 6 months, in Post-inflow Autumn2019 (Fig. 5h).
3.5 Microbial community composition similarities through time
The NMDS ordinations (Fig. 6) revealed clustering according to different sampling times and locations. The overall composition of the bacterial communities at different sampling locations and depths showed strong similarities across all sampling campaigns (Baseline2014, Drought2018, Post-inflow Spring2019, Post-inflow Autumn2019) as reflected in the substantial overlap of the polygons in Fig. 6a. Also, the overall archaeal community compositions overlapped quite strongly between sampling dates, but a distinct clustering was more clearly visible (Fig. 6b). In the bacterial ordination, the Baseline2014 samples were associated with slightly higher EC and CO2 concentrations and with more enriched 13C in CH4 (see post hoc fit arrow in Fig. 6a) compared to the other sampling campaigns. Those surface samples of HC2 during the Drought2018 with low sulfate concentrations had higher pH values. Although Drought2018 sampling was only conducted at location HC2, the Drought2018 cluster spanned a wide range of the complete bacterial variation, and post-inflow bacterial community composition was almost entirely a subset of it. Post-inflow Spring2019 samples (also only HC2) appeared as a subset of the Post-inflow Autumn2019 samples, when cores were taken at all locations.
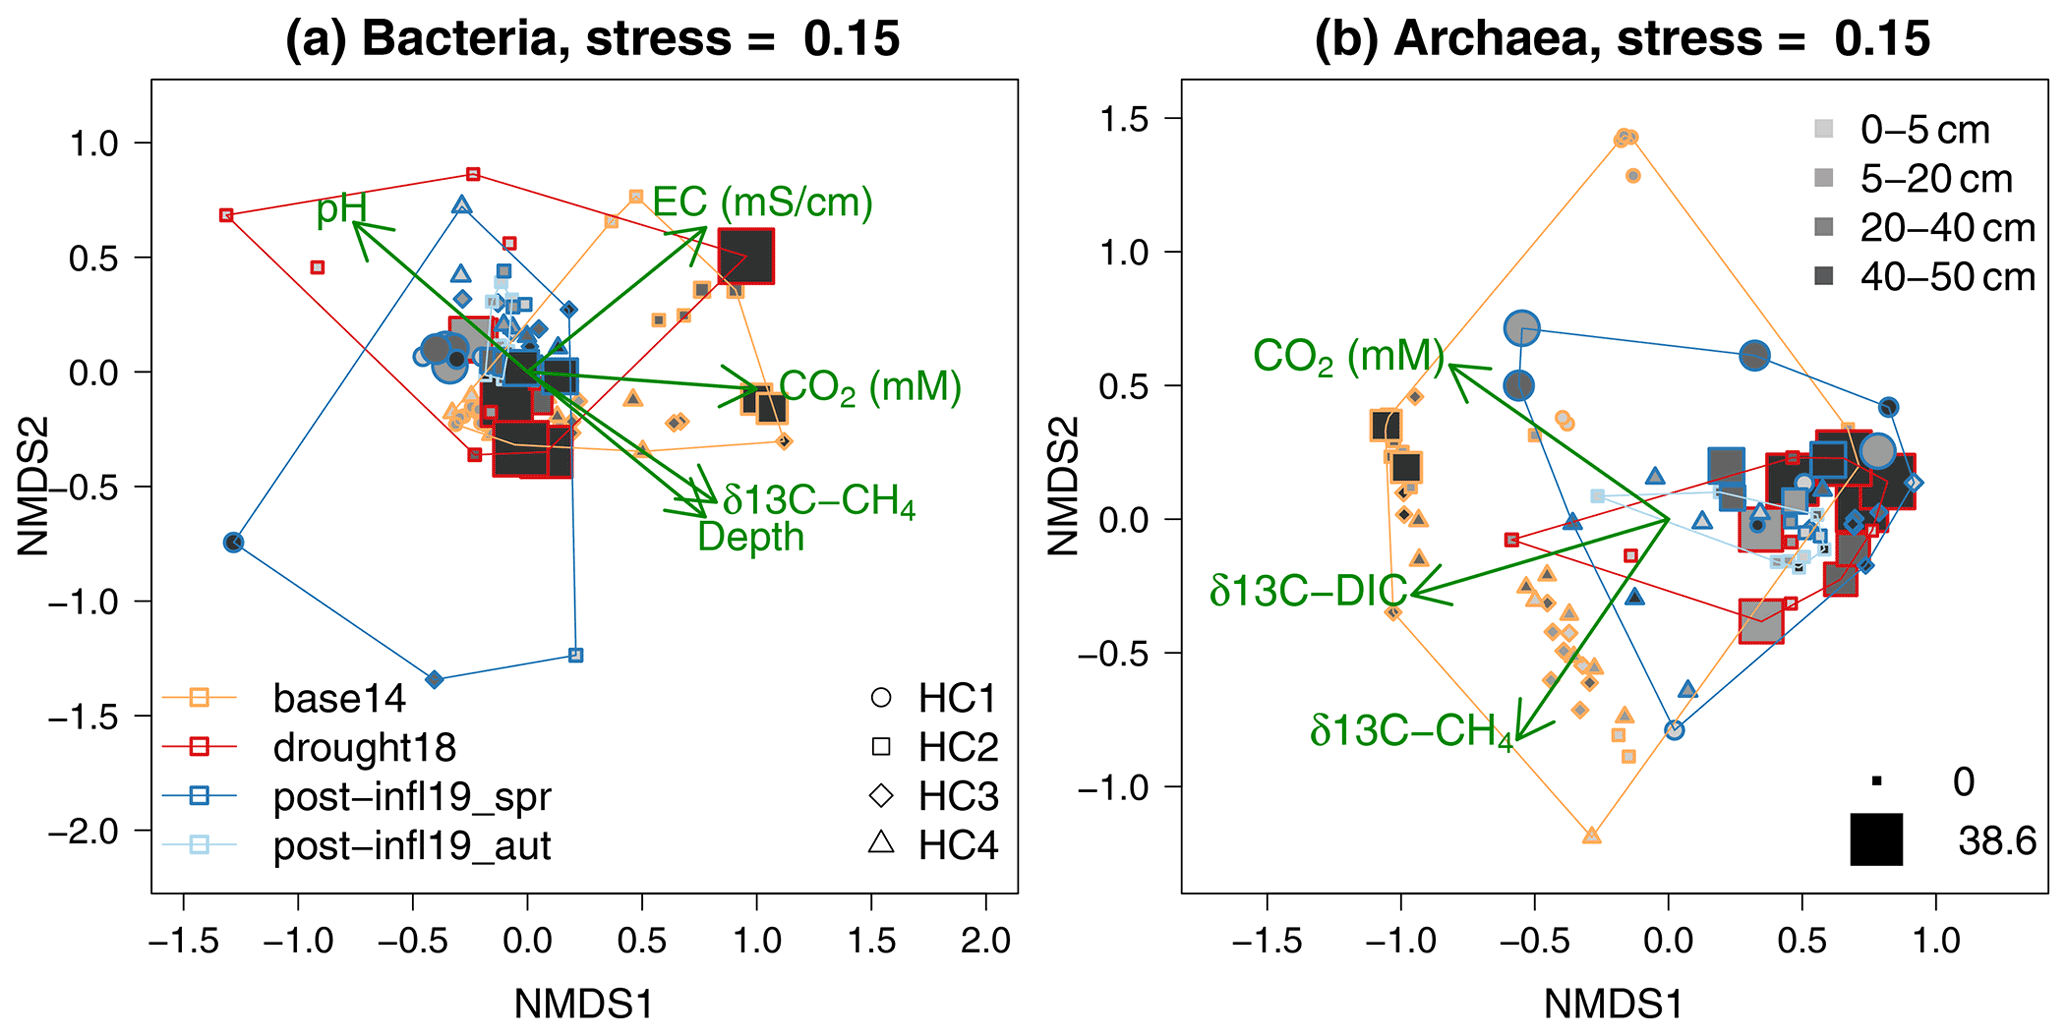
Figure 6NMDS ordination on bacterial and archaeal community composition according to sampling campaign (polygons; for color-coding, see bottom-left legend in panel a), sampling locations (for symbols of HC1–4, see bottom-right legend in panel a), depths (for grey shades, see top-right legend in panel b) and sulfate concentrations (minimum and maximum values in mM represented by symbol sizes; see bottom-right legend in panel b). Proximity of colored symbols can be interpreted as similarities in bacterial and archaeal community composition. Arrows indicate the direction of change in environmental variables (only those variables that showed significant correlation to the domination configuration are shown).
Baseline2014 archaeal communities (Fig. 6b) differed from the Drought2018 and post-inflow (Spring2019 and Autumn2019) clusters and were more variable. At the same time, the 13C in CH4 and DIC in the pore water samples was positively correlated with Baseline2014 samples. Similar to the bacterial Drought2018 communities, also archaeal Drought2018 communities showed large similarities with the post-inflow communities but did not cover the variations at locations HC1 and HC4 in Post-inflow Autumn2019, where the archaeal communities seemed to have been very different from the HC2 communities during the Drought2018. Post-inflow Spring2019 archaeal communities overlapped largely with the Post-inflow Autumn2019 communities and were a subset like the Post-inflow Spring2019 bacterial communities. The communities of the Baseline2014 data and those from the Drought2018 and Post-inflow 2019 seemed to be associated with changes in pore water trace gases, since their isotopic signatures and DIC concentrations were the only physicochemical variables that were significantly correlated with the ordination configuration with a positive change vector in the direction of the Baseline2014 positions. Sulfate-dominated plots were distinctly clustered within Baseline2014 and Drought2018, but not across sampling campaigns, and seemingly correlated with peat soil depth. Sulfate was, however, not a significant variable among the bacterial or the archaeal communities.
4.1 Effect of brackish water inflow on surface and pore water geochemistry
The January 2019 storm surge brought brackish water into the freshwater rewetted peatland, but the emerging biogeochemical shift was not equally distributed across the sampled transect. Instead, two zones of different brackish impact formed, separated by the main ditch, with higher electrical conductivity (EC) values close to the Baltic Sea (HC3 and HC4) and lower EC values further inland (HC1 and HC2; see also Fig. 2). Nevertheless, large increases in EC (0.6 to 7.6 mS cm−1) as well as in sulfate (0.1 to 5.6 mM) and chloride (2.9 to 55.6 mM) concentrations between April 2018 (Ibenthal, 2020) and April 2019 (this study) were observed in the surface water near location HC2. Given that EC, sulfate and chloride concentrations increased at every single location in the pore water from the Baseline2014 sampling to the Post-inflow Autumn2019 sampling (Fig. 3b, c and d), we can assume that the surface water geochemistry also changed at locations HC1, HC3, and HC4 and that all locations were affected by the brackish water inflow in spring 2019 post-inflow despite the different distances to the Baltic Sea. The brackish water inflow is also reflected by sulfate chloride (SO Cl−) ratios in the surface water that exceeded (0.09–0.12) the ratio of the southern Baltic Sea coast (0.07, Rheinheimer, 2013) at all locations shortly after the inflow. The fen's surface water SO Cl− ratio decreased from spring towards autumn post-inflow. The reduction was higher at locations HC3 and HC4 than at HC1 and HC2. At location HC1 and HC2, surface sulfate concentrations decreased in parallel with chloride concentrations, which might be a result of dilution with freshwater. At HC3 and HC4 close to the Baltic Sea, surface water EC and sulfate concentrations had decreased between spring and autumn post-inflow while chloride concentrations had not (Table S1). Although we lack direct evidence for increased sulfate reduction rates, we can assume that sulfate was microbially processed in the underlying peat soil indicated by the reduction of surface water sulfate concentrations. Similar to the surface water patterns, pore water chloride concentrations increased at a much higher rate after the inflow in autumn 2019 at HC3 and HC4 compared to HC1 and HC2. However, unlike in the surface water, pore water sulfate concentrations also increased post-inflow but were much lower at HC3 and HC4 compared to HC1 and HC2, suggesting depletion of the sulfate reservoir through microbial sulfate reduction at locations close to the Baltic Sea. This was also seen by the increased absolute abundances of sulfate-reducing bacteria (SRB; see Fig. 5d and h).
Despite the fact that the locations differed in pore water biogeochemistry, the shift from freshwater to brackish conditions was clearly visible. This is especially true, because sulfate, chloride and EC levels showed an approximation of the freshwater-influenced upper part and the partly brackish-influenced deeper pore water (HC2) after the inflow (Fig. 3b, c and d). Most probably, new sulfate from the inflow sits on top of the old relicts and will thus help to suppress methane emissions, since sulfate reservoir is no longer depleted (Jurasinski et al., 2018).
The legacy effect of the preceding drought should nevertheless be accounted for regarding its influence on the changes in sulfate concentrations. At location HC2, pore water sulfate concentrations were already higher than at the other three locations, where sulfate was almost completely exhausted during our baseline study in 2014 (Koebsch et al., 2019). During the drought year 2018, sulfate concentrations at HC2 increased further up to 40 mM, which was most likely due to the oxidation of existing sulfides yielding higher sulfate concentrations than originally present in the pore water (Boman et al., 2008, 2010). When the drought-induced drop of the water levels recovered parallel to the brackish water inflow, sulfate levels at HC2 decreased (Fig. 3g). Most likely, the water table reservoir got filled up with freshwater before the inflow, reducing the effect that the inflow of sulfate-containing brackish water may have had on the sulfate concentrations in the pore water. Nevertheless, sulfate concentrations remained higher than the baseline 2014 levels observed at all locations (Fig. 3c), including the remote location HC1 most distant from the Baltic Sea. Further, chloride as a conservative tracer also increased after the inflow at all four locations (Fig. 3d), which is most unlikely due to drought-induced salinization. Therefore, the drought cannot be the only source for the observed increase in pore water ion concentrations, and, hence, we can assume that brackish water inflow and not only the legacy effect of the drought in 2018 changed sulfate concentrations in the surface and pore water, which was critical for the methane dynamics and the microbial community composition (Fig. 1). So, what does this mean in a broader context? The whole peatland was affected by a single storm surge and the resulting brackish water inflow. Such events are likely to happen more frequently and possibly more intensely in the future in the investigated site and in many low-lying peatlands as a consequence of global-warming-induced sea level rise (Jurasinski et al., 2018). In parallel, as temperatures increase and weather patterns are getting more extreme, drought periods in peatlands may occur more often in the future. Thus, we were able to study possible future events, rendering the results exemplary for other coastal peatlands. The change from drought conditions to brackish water inflow might even trigger similar process chains in non-rewetted, still-drained fens, since their normal is the dry situation.
Brackish water inflow is sometimes, also by some of the authors, discussed as a possible way to reduce methane emissions after rewetting of peatlands, even if they are not intentionally rewetted as a natural-based solution for climate change mitigation. However, although the sulfate input and/or activation we have seen seems to have been beneficial because it leads to lower methane emissions, salinization is also seen as a dangerous threat to many coastal ecosystems. In addition, sulfate might lead to higher peat mineralization rates (Zak et al., 2019), and the produced CO2 could outweigh the positive effects of lower methane emissions in the long term. Therefore, further research in a variety of shallow coast peatland ecosystems is necessary to draw final conclusions. Since these complex ecosystem effects are hard to investigate in experimental studies, this calls for a network of long-term monitoring sites.
4.2 Effect of brackish water inflow on greenhouse gas pools in the peat soil
The δ13C-CH4 values decreased after brackish water inflow (in autumn 2019, Fig. 3k), indicating isotopically lighter, newly produced CH4 and suggesting that the formation of 13C-depleted methane increased slightly, potentially as a result of shifts in methanogenic pathways. Microorganisms preferentially take up isotopically lighter substrates (12C) and leave heavier substrates (13C) in the soil, so values that are more negative indicate more microbially produced 12C-CH4, e.g., during methanogenesis (Oremland, 1988). At the same time, the overall decrease in CH4 concentrations post-inflow (Fig. 3i) suggests less methanogenesis after the inflow, assuming no major changes in effluxes. This is, however, only the case in autumn 2019. Five months after the inflow at location HC2, we observe an increase in CH4 concentrations (Fig. 3m). It seems like CH4 concentrations in the peat soil of locations HC2 decreased during the drought (Unger et al., 2021a), increased shortly after the brackish water inflow and decreased again after another 7 months (Fig. 3m). During the drought, aerobic conditions and re-oxidation of terminal electron acceptors likely hampered methanogenesis (Achtnich et al., 1995; Dettling et al., 2006). However, methane production must have been triggered again at the beginning of 2019 due to the water table increase, availability of substrates (Koebsch et al., 2020) and the re-establishment of anaerobic conditions (Whiting and Chanton, 1993; Popp et al., 1999). In autumn 2019, methanogens likely became substrate- and temperature-limited, and, thus, CH4 concentrations might have decreased for these reasons.
We do not observe indicators for sulfate-driven anaerobic CH4 oxidation based on the isotopic signatures and microbial community data (see below) after the inflow as anticipated. Specifically, we expected a clear drop in peat methane concentrations and a shift towards more positive values, because microbes also take up lighter 12C-CH4 for methane oxidation rather than the heavier 13C-CH4 (e.g., Whiticar et al., 1986; Oremland, 1988; Meister et al., 2019). Instead, we see a shift towards more negative δ13C-CH4 values (Fig. 3k). While this seemed contradictory at first sight, this may be explained by the observation that methane produced under thermodynamically more unfavorable conditions, e.g., in microenvironments (Knorr et al., 2008), tends to be more depleted in 13C (Penning et al., 2005).
The decrease in δ13C-DIC between the baseline sampling in 2014 and autumn 2019 sampling post-inflow indicates an increase in non-methanogenic CO2 production (Fig. 3l). The isotopic signatures from HC2 suggests that a depletion of 13C in the DIC pool already took place during the drought year 2018 (Fig. 3p). Since aerobic conditions fuel decomposition and enhance the diffusivity of the peat soil, CO2 production might have therefore increased (Alm et al., 1999). In spring 2019, shortly after the brackish water inflow, DIC became less depleted in 13C (potential onset of methanogenesis, Fig. 3p) compared to drought conditions, especially in the peat layer below 20 cm. However, in autumn post-inflow, values of δ13C-DIC decreased down to the level of the drought (Fig. 3p), indicating increased CO2 production. This can be attributed to the increase in the water table and potentially non-methanogenic CO2 production (Knorr et al., 2008). Other than via aerobic peat decomposition during the drought or via methane oxidation, CO2 may be produced more intensively via sulfate reduction after the inflow of the sulfate-rich brackish water. In addition, δ13C-DIC values from autumn 2019 approached −27 ‰ (Fig. 3l and p), which is close to the average values of the most dominant plant species (C3 plants, Meyers, 1994), indicating non-methanogenic pathways of CO2 production (Boehme et al., 1996; Corbett et al., 2013).
In contrast, concentration measurements in the pore water (Fig. 3n) show that CO2 levels decreased with the drought compared to the baseline sampling and remained low after the inflow. Unlike the isotopic signatures, this indicates that CO2 production was rather low during the drought and after the inflow. However, trends in trace gas concentrations and isotopic signatures can also appear contradicting, because gas concentrations are temporally highly variable and might not reflect biogeochemical processes, since downstream processes likely use up intermediate products or gases get emitted to the atmosphere. This means that CO2 production might be higher during drought and further on, but the produced CO2 might not accumulate and is therefore not measurable. Increases in CO2 emissions from ecosystem respiration during the drought support this hypothesis (Koebsch et al., 2020).
Overall, the strong depletion of 13C in CH4 and the slight decrease in concentrations indicates that methanogenesis did not decrease to an extent that this could explain the measured decrease in CH4 fluxes (Koebsch et al., 2020). Due to persistently high CH4 concentrations, strongly negative isotopic signatures and the patterns in microbial community composition, we can conclude that methane oxidation was of minor importance in the peat soil. Sulfate-mediated anaerobic methane oxidation can also not explain the decrease in pore water isotopic signatures of δ13C-DIC in autumn 2019 post-inflow, indicating higher anaerobic but non-methanogenic CO2 production, e.g., via sulfate reduction. If anaerobic CO2 production had been a result of methane oxidation, it had to happen in an area outside the scope of our analysis, namely the water column or the fresh litter layer above the peat soil (Fig. 1). It is well established that the fresh organic litter in rewetted peatlands can be a hotspot of biochemical cycling (Hahn-Schöfl et al., 2011), providing nutrients (Wang et al., 2015) and shelter for microorganisms (Bani et al., 2018). Therefore, in the future, it seems advisable to include the above layers, namely, the open water and the fresh litter in similar studies. Carbon cycling might have changed after the complex impact of the drought and the subsequent brackish water inflow from well-known patterns, turning the usual role of the water column from an area of potential methane production into an area of methane oxidation in the investigated ecosystem.
4.3 Effect of brackish water inflow on methane-cycling microorganisms
The inflow of sulfate-containing brackish water caused two main changes within the microbial communities: (1) sulfate-reducing bacteria (SRB) increased both in relative and absolute abundance (Figs. 4, 5d and h) and (2) methanogenic archaea changed regarding the community composition but not in absolute abundances (Fig. 4). Changes within the methanotrophic community after the inflow, both aerobic and anaerobic, were marginal. SRB communities were clearly affected by the inflow of brackish water, because they only increased strongly in absolute abundances after the inflow but not during the drought (Fig. 5h). This even holds for HC2, where sulfate concentrations were higher during the drought than after the inflow (Fig. 3g).
To determine the direct effect of the inflow on the methanogenic and methanotrophic communities, excluding the legacy effect of the drought is more difficult. After the inflow, we observed the highest reduction of methanogenic archaea (mcrA) and aerobic methanotrophic bacteria (pmoA) in the upper layers of the peat soil (Fig. 5b and c). In deeper layers, methanogens and bacterial methanotrophs increased in abundance relative to baseline conditions. Zooming in to location HC2, where we measured total and putatively active microbes also during the drought in 2018 and in spring 2019 after the inflow, we must conclude that methanogenic and methanotrophic absolute abundances had changed already during the drought and did not change much further after the brackish water inflow (Fig. 5f and g). Aerobic methanotrophs like Methylococcales were likely activated under oxic drought conditions (Henckel et al., 2001; Ma et al., 2013; Unger et al., 2021a) and remained present when the water came back after the inflow (Fig. 4b).
The data from HC2 also show that methanogens increased in absolute abundances mostly at peat layers below 5 cm during the drought and remained high afterwards, whereas they decreased in the surface peat (Fig. 5f). At the surface, the reduction of methanogenic abundances due to the previous drought, also shown in other studies (Peltoniemi et al., 2016), might have persisted after the brackish water inflow because re-establishment was likely hindered by competition for substrate with sulfate-reducing bacteria (Schönheit et al, 1982; Scholten et al., 2002; van Dijk et al., 2019). In deeper layers, however, the increase in absolute methanogenic abundances (Fig. 5b and f) might result from a lack of competition between SRB and methanogens for substrate. This could have two reasons: (1) there was enough labile litter available after the drought due to plant dieback (Hahn-Schöfl et al., 2011) and different microbial processes are taking place simultaneously or (2) methanogens did not use organic compounds such as acetate but rather methylated compounds (Söllinger and Urich, 2019) or hydrogen and CO2. In this context, the microbial community data and carbon isotopic signatures of CH4 and DIC suggest a relative increase in methanogenic CO2 reduction, which potentially benefits from an increase in non-methanogenic CO2 production.
Similar to the isotopic values and CH4 concentrations, the molecular microbial data provide no evidence for substantial methane oxidation in the peat after the brackish water inflow. Although we detected some taxa associated with anaerobic methane oxidation, specifically Candidatus Methanoperedens (ANME 2d) and ANME-3, their abundance was very low, especially on the level of transcripts. This holds in particular for groups known to be involved in sulfate-driven anaerobic methane oxidation (AOM). However, anaerobic methanotrophic archaea are known to be slow growing (Nauhaus et al., 2007; Holler et al., 2011; Knittel et al., 2018) and seem to require stable environmental conditions (Ruff et al., 2016). Peatlands, rewetted ones especially, are generally highly dynamic systems with regard to hydrology and redox conditions, and the supply of electron acceptors, mostly sulfate, after the inflow may not have been sufficed for AOM communities to establish. Aerobic methanotrophs, on the other hand, may be hampered in their activity by the standing water above surface and lack of oxygen. Consequently, their population could have become inactive without any major changes in population size and community structure.
Finally, the brackish water inflow could have been associated with an introduction of marine-derived aerobic and anaerobic methanotrophic taxa. A measurable change in community composition through this, however, was not observed, which further supports that methane oxidation was not a relevant process after the storm surge in the peat unlike it was in the period after the drought in 2018 (Unger et al., 2021a). As discussed earlier, though, methane oxidation most likely occurred in the standing water above the peat (Fig. 1) given the substantial drop in methane emissions despite the fact that methanogenesis seemingly occurred besides alternative anaerobic pathways of carbon respiration, mostly sulfate reduction. Methane oxidation in the water column was, however, beyond the scope of our study.
Brackish water inflow led to an increase in electrical conductivity and sulfate concentrations in the surface and pore water of a coastal fen that had originally been rewetted with freshwater. This resulted in a recharge of sulfate concentrations in the upper pore water layers and a homogenization of the microbial community composition and abundance along the depth profiles. Trace gas concentrations showed an overall decrease in methane and CO2 concentrations after the brackish water inflow. Isotopic signatures unexpectedly suggest increased formation of more 13C-depleted CH4 and DIC, indicating ongoing methanogenesis, though shifted towards more methanogenic CO2 reduction and non-methanogenic CO2 production. At the same time, no evidence for substantial aerobic and anaerobic methane oxidation was detected in the peat. Furthermore, sulfate-reducing bacteria (SRB) increased in overall abundance and diversity throughout the whole peat profile. Presumably, the presence of sulfate helped SRB to establish a large community in the peat soil, although many members of this large group had been already present in locally confined high-sulfate environments during the drought. It remains unresolved, however, why methane emissions decreased to a new minimum since rewetting more than a decade ago, while methanogenic absolute abundances and methane concentrations overall did not change or even decreased (Fig. 1). Possibly, methane oxidation took place within the water column or the fresh litter on the ground surface above the peat, which was, however, outside of the scope of this study.
In conclusion, the inflow of brackish water into a freshwater rewetted, highly degraded coastal fen likely contributed to further reducing methane emissions following a drought in the preceding year. The sequence of drought and storm surge profoundly altered CH4 emissions and underlain microbial communities, although at the same time the preceding drought seemingly interfered with the effect of the inflow. Rising sea levels (and stronger storm surges) due to climate change are likely to cause an increase in the frequency of brackish water inflow events into coastal peatlands. This will affect the sulfate–methane dynamics in these systems and thereby change their biogeochemical-cycling processes and most likely decrease methane emissions.
Baseline2014 data from microbial sequencing can be found at EBI under the BioProject PRJNA356778 (Wen et al., 2016, accession numbers are SRR5118134-SRR5118155 and SRR5119428-SRR5119449), and Drought2018 data have been deposited at ENA under BioProject accession number PRJEB38162 (Unger et al., 2021b, sample accession number ERS4542720-ERS4542735, ERS4542752-ERS4542767, ERS4542784-ERS4542800 and ERS4542822-ERS4542837).
The data which derived from microbial sequencing (relative abundances) of all 97 post-inflow samples have been deposited in the European Nucleotide Archive (ENA) at EMBL-EBI under accession number PRJEB52161 (with sample accession numbers ERS11559347-ERS11559443). Absolute microbial abundance and peat pore water data can be provided by the corresponding author upon request and will be uploaded to the Pangaea database in the near future.
The supplement related to this article is available online at: https://doi.org/10.5194/bg-19-3625-2022-supplement.
GJ, SL and FK developed the idea and concept of the research project; CNG, GJ, SL, VU and FK planned data collection, manuscript structure and the research focus; CNG, AKJ and EDR performed the field campaigns and subsequent data analysis and corrections; CNG, AKJ, DO, IS and LW performed the lab analysis; SY did the bioinformatics analysis; CNG and GJ did the statistical analysis and created the figures; CNG, KHK, SL, GJ, VU, FK and MJ did the data interpretation; CNG summarized all data and wrote the manuscript with the help of GJ, AKJ, EDR, MJ, SY and KHK, who wrote parts of the method section; and GJ, SL, FK, VU, KHK, MEB, JK, MJ and EDR reviewed and edited the manuscript.
The contact author has declared that none of the authors has any competing interests.
Publisher’s note: Copernicus Publications remains neutral with regard to jurisdictional claims in published maps and institutional affiliations.
First of all, we would like to thank our editor Denise Akob for the kind cooperation and our two reviewers for the fair and fruitful review process. Further, we thank Anke Saborowski from the Geomicrobiology Section (GFZ Potsdam), who helped to a large extent in the laboratory during molecular extraction, quantification and preparation for sequencing of microbial data. Moreover, we thank Jan Axel Kitte and Oliver Burckhardt (both GFZ Potsdam) for their kind assistance in the laboratory during GC measurements. Special thanks also go to Daniel Brüggemann, who performed isotopic analysis at the University of Münster, and Evelyn Bolzmann, who carried out the loss on ignition measurements at the Soil Physics department of the University of Rostock. In addition, we thank Joachim Hofmann and Birgit Schröder for their technical support and kind cooperation; Anke Günther for her help with the CH4 flux calculations and the provision of the respective R script; Vytas Huth for his advice regarding field equipment, sampling design and approaches; and Sate Ahmad for interdisciplinary discussions and his QGIS expertise.
This study was conducted within the framework of the Research Training Group “Baltic TRANSCOAST” funded by the DFG (Deutsche Forschungsgemeinschaft) under grant number GRK 2000 (https://www.baltic-transcoast.uni-rostock.de/, last access: 16 August 2022). This is Baltic TRANSCOAST publication no. GRK2000/0058. The study site maintenance is supported by the Helmholtz Terrestrial Environmental Observatories (TERENO) network.
This paper was edited by Denise Akob and reviewed by two anonymous referees.
Abdalla, M., Hastings, A., Truu, J., Espenberg, M., Mander, Ü., and Smith, P.: Emissions of methane from northern peatlands: a review of management impacts and implications for future management options, Ecol. Evol., 6, 7080–7102, https://doi.org/10.1002/ece3.2469, 2016.
Achtnich, C., Bak, F., and Conrad, R.: Competition for electron donors among nitrate reducers, ferric iron reducers, sulfate reducers, and methanogens in anoxic paddy soil, Biol. Fert. Soils, 19, 65–72, https://doi.org/10.1007/BF00336349, 1995.
Alm, J., Schulman, L., Walden, J., Nykänen, H., Martikainen, P. J., and Silvola, J.: Carbon balance of a boreal bog during a year with an exceptionally dry summer, Ecology, 80, 161–174, https://doi.org/10.1890/0012-9658(1999)080[0161:CBOABB]2.0.CO;2, 1999.
Angle, J. C., Morin, T. H., Solden, L. M., Narrowe, A. B., Smith, G. J., Borton, M. A., Rey-Sanchez, C., Daly, R. A., Mirfenderesgi, G., Hoyt, D. W., Riley, W. J., Miller, C. S., Bohrer, G., and Wrighton, K. C.: Methanogenesis in oxygenated soils is a substantial fraction of wetland methane emissions, Nat. Commun., 8, 1–9, https://doi.org/10.1038/s41467-017-01753-4, 2017.
Arnold, J. B.: ggthemes: Extra Themes, Scales and Geoms for “ggplot2”, R package version 4.2.4, https://CRAN.R-project.org/package=ggthemes (last access: 15 June 2022), 2021.
Bani, A., Pioli, S., Ventura, M., Panzacchi, P., Borruso, L., Tognetti, R., Tonon, G., and Brusetti, L: The role of microbial community in the decomposition of leaf litter and deadwood, Appl. Soil Ecol., 126, 75–84, https://doi.org/10.1016/j.apsoil.2018.02.017, 2018.
Bartlett, K. B., Bartlett, D. S., Harriss, R. C., and Sebacher, D. I.: Methane emissions along a salt marsh salinity gradient, Biogeochemistry, 4, 183–202, https://doi.org/10.1007/BF02187365, 1987.
Batjes, N. H.: Total carbon and nitrogen in the soils of the world, Eur. J. Soil Sci., 47, 151–163, 1996.
Boehme, S. E., Blair, N. E., Chanton, J. P., and Martens, C. S.: A mass balance of 13C and 12C in an organic-rich methane-producing marine sediment, Geochim. Cosmochim. Ac., 60, 3835–3848, https://doi.org/10.1016/0016-7037(96)00204-9, 1996.
Boetius, A., Ravenschlag, K., Schubert, C. J., Rickert, D., Widdel, F., and Gleseke, A.: A marine microbial consortium apparently mediating anaerobic oxidation methane, Nature, 407, 623–626, https://doi.org/10.1038/35036572, 2000.
Bohne, B. and Bohne, K.: Monitoring zum Wasserhaushalt einer auf litoralem Versumpfungsmoor gewachsenen Regenmoorkalotte – Beispiel Naturschutzgebiet “Hütelmoor” bei Rostock, in: Aspekte der Geoökologie, edited by: Stüdemann, O., Weißensee Verlag, Berlin, 313–338, ISBN: 978-3-89998-127-8, 2008.
Bolyen, E., Rideout, J. R., Dillon, M. R., Bokulich, N. A., Abnet, C. C., Al-Ghalith, G. A., Alexander, H., Alm, E. J., Arumugam, M., Asnicar, F., Bai, Y., Bisanz, J. E., Bittinger, K., Brejnrod, A., Brislawn, C. J., Brown, C. T., Callahan, B. J., Caraballo-Rodríguez, A. M., Chase, J., Cope, E. K., Da Silva, R., Diener, C., Dorrestein, P. C., Douglas, G. M., Durall, D. M., Duvallet, C., Edwardson, C. F., Ernst, M., Estaki, M., Fouquier, J., Gauglitz, J. M., Gibbons, S. M., Gibson, D. L., Gonzalez, A., Gorlick, K., Guo, J., Hillmann, B., Holmes, S., Holste, H., Huttenhower, C., Huttley, G. A., Janssen, S., Jarmusch, A. K., Jiang, L., Kaehler, B. D., Kang, K. B., Keefe, C. R., Keim, P., Kelley, S. T., Knights, D., Koester, I., Kosciolek, T., Kreps, J., Langille, M. G. I., Lee, J., Ley, R., Liu, Y.-X., Loftfield, E., Lozupone, C., Maher, M., Marotz, C., Martin, B. D., McDonald, D., McIver, L. J., Melnik, A. V., Metcalf, J. L., Morgan, S. C., Morton, J. T., Naimey, A. T., Navas-Molina, J. A., Nothias, L. F., Orchanian, S. B., Pearson, T., Peoples, S. L., Petras, D., Preuss, M. L., Pruesse, E., Rasmussen, L. B., Rivers, A., Robeson, M. S., Rosenthal, P., Segata, N., Shaffer, M., Shiffer, A., Sinha, R., Song, S. J., Spear, J. R., Swafford, A. D., Thompson, L. R., Torres, P. J., Trinh, P., Tripathi, A., Turnbaugh, P. J., Ul-Hasan, S., van der Hooft, J. J. J., Vargas, F., Vázquez-Baeza, Y., Vogtmann, E., von Hippel, M., Walters, W., Wan, Y., Wang, M., Warren, J., Weber, K. C., Williamson, C. H. D., Willis, A. D., Xu, Z. Z., Zaneveld, J. R., Zhang, Y., Zhu, Q., Knight, R., and Caporaso, J. G.: Reproducible, interactive, scalable and extensible microbiome data science using QIIME 2, Nat. Biotechnol., 37, 852–857, https://doi.org/10.1038/s41587-019-0209-9, 2019.
Boman, A., Åström, M., and Fröjdö, S.: Sulfur dynamics in boreal acid sulfate soils rich in metastable iron sulfide. The role of artificial drainage, Chem. Geol., 255, 68–77, https://doi.org/10.1016/j.chemgeo.2008.06.006, 2008.
Boman, A., Fröjdö, S., Backlund, K., and Åström, M.: Impact of isostatic land uplift and artificial drainage on oxidation of brackish-water sediments rich in metastable iron sulfide, Geochim. Cosmochim. Ac., 74, 1268–1281, https://doi.org/10.1016/j.gca.2009.11.026, 2010.
Brand, W. and Coplen, T.: Stable isotope deltas: Tiny, yet robust signatures in nature, Isot. Environ. Health S., 48, 393–409, https://doi.org/10.1080/10256016.2012.666977, 2012.
Bräuer, S. L., Basiliko, N., Siljanen, H. M. P., and Zinder, S. H.: Methanogenic archaea in peatlands, FEMS Microbiol. Lett., 367, 1–17, https://doi.org/10.1093/femsle/fnaa172, 2020.
Bushnell, B.: BBTools software package, https://www.sourceforge.net/projects/bbmap (last access: 18 January 2021), 2014.
Callahan, B. J., Mcmurdie, P. J, Rosen, M. J., Han, A. W., Johnson, A. J. A., and Holmes, S. P.: DADA2: High-resolution sample inference from Illumina amplicon data, Nat. Methods, 13, 581–583, https://doi.org/10.1038/nmeth.3869, 2016.
Caporaso, J. G., Kuczynski, J., Stombaugh, J., Bittinger, K., Bushman, F. D., Costello, E. K., Fierer, N., Peña, A. G., Goodrich, J., Gordon, J. I., Huttley, G. A., Kelley, S. T., Knights, D., Koenig, J. E., Ley, R. E., Lozupone, C., Mcdonald, D., Muegge, B. D., Pirrung, M., Reeder, J., Sevinsky, J. R., Turnbaugh, P. J., Walters, W. A., Widmann, J., Yatsunenko, T., Zaneveld, J., and Knight, R.: QIIME allows analysis of high-throughput community sequencing data, Nat. Methods, 7, 335–336, https://doi.org/10.1038/nmeth.f.303, 2010.
Caporaso, J. G., Lauber, C. L., Walters, W. A., Berg-Lyons, D., Lozupone, C. A., Turnbaugh, P. J., Fierer, N., and Knight, R.: Global patterns of 16S rRNA diversity at a depth of millions of sequences per sample, P. Natl. Acad. Sci. USA, 108, 4516–4522, https://doi.org/10.1073/pnas.1000080107, 2011.
Chamberlain, S. D., Hemes, K. S., Eichelmann, E., Szutu, D. J., Verfaillie, J. G., and Baldocchi, D. D.: Effect of drought-induced salinization on wetland methane emissions, gross ecosystem productivity, and their interactions, Ecosystems, 23, 675–688, https://doi.org/10.1007/s10021-019-00430-5, 2020.
Church, J. A. White, N. J., Domingues, C. M., Monselesan, D. P., and Miles, E. R.: Sea-level and ocean heat-content change, International Geophysics, 103, 697–725, https://doi.org/10.1016/B978-0-12-391851-2.00027-1, 2013.
Cline, J.: Spectrophotometric Determination of Hydrogen Sulfide in Natural Waters, Limnol. Oceanogr., 14, 454–458, https://doi.org/10.4319/lo.1969.14.3.0454, 1969.
Conrad, R.: The global methane cycle: Recent advances in understanding the microbial processes involved, Env. Microbiol. Rep., 1, 285–292, https://doi.org/10.1111/j.1758-2229.2009.00038.x, 2009.
Corbett, J. E., Tfaily, M. M., Burdige, D. J., Cooper, W. T., Glaser, P. H., and Chanton, J. P.: Partitioning pathways of CO2 production in peatlands with stable carbon isotopes, Biogeochemistry, 114, 327–340, https://doi.org/10.1007/s10533-012-9813-1, 2013.
Damman, A. W. H.: Distribution and movement of elements in ombrotrophic peat bogs, Oikos, 30, 480–495, 1978.
Dargie, G. C., Lewis, S. L., Lawson, I. T., Mitchard, E. T. A., Page, S. E., Bocko, Y. E., and Ifo, S. A.: Age, extent and carbon storage of the central Congo Basin peatland complex, Nature Letter, 542, 86–90, https://doi.org/10.1038/nature21048, 2017.
Dean, J. F., Middelburg, J. J., Röckmann, T., Aerts, R., Blauw, L. G., Egger, M., Jetten, M. S. M., de Jong, A. E. E., Meisel, O. H., Rasigraf, O., Slomp, C. P., in't Zandt, M. H., and Dolman, A. J.: Methane feedbacks to the global climate system in a warmer world, Rev. Geophys., 56, 207–250, https://doi.org/10.1002/2017RG000559, 2018.
Dettling, M. D., Yavitt, J. B., and Zinder, S. H.: Control of organic carbon mineralization by alternative electron acceptors in four peatlands, central New York state, USA, Wetlands, 26, 917–927, https://doi.org/10.1672/0277-5212(2006)26[917:COOCMB]2.0.CO;2, 2006.
De Vleeschouwer, F., Chambers, F. M., and Swindles, G. T.: Coring and sub-sampling of peatlands for palaeoenvironmental research, Mires Peat, 7, 1–10, 2010.
DIN 19683-14 (Deutsches Institut für Normung e.V.), Bodenbeschaffenheit – Physikalische Laboruntersuchungen – Teil 14: Bestimmung des Substanzanteils von Moorböden, Beuth-Verlag, Berlin, https://doi.org/10.31030/9848020, 2007.
Ettwig, K. F., Butler, M. K., Le Paslier, D., Pelletier, E., Mangenot, S., Kuypers, M. M. M., Schreiber, F., Dutilh, B. E., Zedelius, J., De Beer, D., Gloerich, J., Wessels, H. J. C. T., Van Alen, T., Luesken, F., Wu, M. L., Van De Pas-Schoonen, K. T., Op Den Camp, H. J. M., Janssen-Megens, E. M., Francoijs, K. J., Stunnenberg, H., Weissenbach, J., Jetten, M. S. M., and Strous, M.: Nitrite-driven anaerobic methane oxidation by oxygenic bacteria, Nature, 464, 543–548, https://doi.org/10.1038/nature08883, 2010.
Fabian, P.: Leben im Treibhaus. Unser Klimasystem – und was wir daraus machen, Springer-Verlag, Berlin, Germany, https://doi.org/10.1007/978-3-642-56154-2, 2002.
Fiedler, S., Höll, B. S., Freibauer, A., Stahr, K., Drösler, M., Schloter, M., and Jungkunst, H. F.: Particulate organic carbon (POC) in relation to other pore water carbon fractions in drained and rewetted fens in Southern Germany, Biogeosciences, 5, 1615–1623, https://doi.org/10.5194/bg-5-1615-2008, 2008.
Frolking, S., Talbot, J., Jones, M. C., Treat, C. C., Kauffman, J. B., Tuittila, E.-S., and Roulet, N.: Peatlands in the Earth's 21st century climate system, Environ. Rev., 19, 371–396, https://doi.org/10.1139/a11-014, 2011.
Gauci, V., Matthews, E., Dise, N., Walter, B., Koch, D., Granberg, G., and Vile, M.: Sulfur pollution suppression of the wetland methane source in the 20th and 21st centuries, P. Natl. Acad. Sci. USA, 101, 12583–12587, https://doi.org/10.1073/pnas.0404412101, 2004.
Glatzel, S., Koebsch, F., Beetz, S., Hahn, J., Richter, P., and Jurasinski, G.: Maßnahmen zur Minderung der Treibhausgasfreisetzung aus Mooren im Mittleren Mecklenburg, TELMA, 4, 85–106, https://doi.org/10.23689/fidgeo-2976, 2011.
Gorham, E.: Northern peatlands – Role in the carbon-cycle and probable responses to climatic warming, Ecol. Appl., 1, 182–195, https://doi.org/10.2307/1941811, 1991.
Günther, A., Huth, V., Jurasinski, G., and Glatzel, S.: The effect of biomass harvesting on greenhouse gas emissions from a rewetted temperate fen, GCB Bioenergy, 7, 1092–1106, https://doi.org/10.1111/gcbb.12214, 2015.
Günther, A., Barthelmes, A., Huth, V., Joosten, H., Jurasinski, G., Koebsch, F., and Couwenberg, J.: Prompt rewetting of drained peatlands reduces climate warming despite methane emissions, Nat. Commun., 11, 1–5, https://doi.org/10.1038/s41467-020-15499-z, 2020.
Hahn-Schöfl, M., Zak, D., Minke, M., Gelbrecht, J., Augustin, J., and Freibauer, A.: Organic sediment formed during inundation of a degraded fen grassland emits large fluxes of CH4 and CO2, Biogeosciences, 8, 1539–1550, https://doi.org/10.5194/bg-8-1539-2011, 2011.
Hahn, J., Köhler, S., Glatzel, S., and Jurasinski, G.: Methane exchange in a coastal fen in the first year after flooding – A systems shift, PLoS ONE, 10, 1–25, https://doi.org/10.1371/journal.pone.0140657, 2015.
Hansen, L. B., Finster, K., Fossing, H., and Iversen, N.: Anaerobic methane oxidation in sulfate depleted sediments: Effects of sulfate and molybdate additions, Aquat. Microb. Ecol., 14, 195–204, https://doi.org/10.3354/ame014195, 1998.
Hanson, R. S. and Hanson, T. E.: Methanotrophic bacteria, Microbiol. Rev., 60, 439–471, https://doi.org/10.1002/0471263397.env316, 1996.
He, Z. Cai, C., Wang, J., Xu, X., Zheng, P., Jetten, M. S. M., and Hu, B.: A novel denitrifying methanotroph of the NC10 phylum and its microcolony, Sci. Rep.-UK, 6, 32241, https://doi.org/10.1038/srep32241, 2016.
Henckel, T., Jäckel, U., and Conrad, R.: Vertical distribution of the methanotrophic community after drainage of rice field soil, FEMS Microbiol. Ecol., 34, 279–291, https://doi.org/10.1016/S0168-6496(00)00105-7, 2001.
Hoehler, T. M., Alperin, M. J., Albert, D. B., and Martens, C. S.: Field and laboratory studies of methane oxidation in an anoxic marine sediment: evidence for a methanogen-sulfate reducer consortium, Global Biogeochem. Cy., 8, 451–463, https://doi.org/10.1029/94GB01800, 1994.
Höpner, T.: Design and use of a diffusion sampler for interstitial water from fine grained sediments, Environ. Technol. Lett., 2, 187–196, https://doi.org/10.1080/09593338109384040, 1981.
Holler, T., Widdel, F., Knittel, K., Amann, R., Kellermann, M. Y., Hinrichs, K. U., Teske, A., Boetius, A., and Wegener, G.: Thermophilic anaerobic oxidation of methane by marine microbial consortia, ISME J., 5, 1946–1956, https://doi.org/10.1038/ismej.2011.77, 2011.
Huth, V., Jurasinski, G., and Glatzel, S.: Winter emissions of carbon dioxide, methane and nitrous oxide from a minerotrophic fen under nature conservation management in north-east Germany, Mires Peat, 10, 1–13, http://www.mires-and-peat.net/pages/volumes/map10/map1004.php (last access: 10 January 2019), 2012.
Huth, V., Günther, A., Bartel, A., Gutekunst, C., Heinze, S., Hofer, B., Jacobs, O., Koebsch, F., Rosinski, E., Tonn, C., Ullrich, K., and Jurasinski, G.: The climate benefits of topsoil removal and Sphagnum introduction in raised bog restoration, Restor. Ecol., 30, 1–9, https://doi.org/10.1111/rec.13490, 2021.
Ibenthal, M.: Marine and terrestrial influence on submarine groundwater discharge in coastal waters connected to a peatland, Ph.D. thesis, Georg-August-Universität Göttingen, Germany, 169 pp., 2020.
Joosten, H. and Couwenberg, J.: Are emission reductions from peatlands MRV-able? IMCG, 1–14, http://www.imcg.net/docum/09/joosten_couwenberg_2009.pdf (last access: 14 March 2022), 2009.
Jørgensen, B. B.: Mineralization of organic matter in the sea bed-the role of sulphate reduction, Nature, 296, 643–645, https://doi.org/10.1038/296643a0, 1982.
Jurasinski, G. and Retzer, V.: simba: A Collection of functions for similarity analysis of vegetation data, R package version 0.3-5, https://CRAN.R-project.org/package=simba (last access: 15 June 2022), 2012.
Jurasinski, G., Koebsch, F., Guenther, A., and Beetz, S.: flux: Flux rate calculation from dynamic closed chamber measurements, R package version 0.3-0, https://CRAN.R-project.org/package=flux (last access: 29 April 2021), 2014.
Jurasinski, G., Janssen, M., Voss, M., Böttcher, M. E., Brede, M., Burchard, H., Forster, S., Gosch, L., Gräwe, U., Gründling-Pfaff, S., Haider, F., Ibenthal, M., Karow, N., Karsten, U., Kreuzburg, M., Lange, X., Leinweber, P., Massmann, G., Ptak, T., Rezanezhad, F., Rehder, G., Romoth, K., Schade, H., Schubert, H., Schulz-Vogt, H., Sokolova, I. M., Strehse, R., Unger, V., Westphal, J., and Lennartz, B.: Understanding the coastal ecocline: Assessing sea-land interactions at non-tidal, low-lying coasts through interdisciplinary research, Front. Mar. Sci., 5, 1–22, https://doi.org/10.3389/fmars.2018.00342, 2018.
Kassambara, A.: ggpubr: “ggplot2” Based Publication Ready Plots, R package version 0.4.0, https://CRAN.R-project.org/package=ggpubr (last access: 15 June 2022), 2020.
Kim, S. Y., Lee, S. H., Freeman, C., Fenner, N., and Kang, H.: Comparative analysis of soil microbial communities and their responses to the short-term drought in bog, fen, and riparian wetlands, Soil Biol. Biochem., 40, 2874–2880, https://doi.org/10.1016/j.soilbio.2008.08.004, 2008.
Kinney, E. L., Quigg, A., and Armitage, A. R.: Acute effects of drought on emergent and aquatic communities in a brackish marsh, Estuar. Coast., 37, 636–645, https://doi.org/10.1007/s12237-013-9721-1, 2014.
Kirkby, C. A., Richardson, A. E., Wade, L. J., Batten, G. D., Blanchard, C., and Kirkegaard, J. A.: Carbon-nutrient stoichiometry to increase soil carbon sequestration, Soil Biology and Biochemistry, 60, 77–86, https://doi.org/10.1016/j.soilbio.2013.01.011, 2013.
Knittel, K., Wegener, G., and Boetius, A.: Anaerobic methane oxidizers, Handbook of Hydrocarbon and Lipid Microbiology, 2023–2032. https://doi.org/10.1007/978-3-540-77587-4_147, 2018.
Knorr, K.-H., Glaser, B., and Blodau, C.: Fluxes and 13C isotopic composition of dissolved carbon and pathways of methanogenesis in a fen soil exposed to experimental drought, Biogeosciences, 5, 1457–1473, https://doi.org/10.5194/bg-5-1457-2008, 2008.
Koch, M., Koebsch, F., Hahn, J., and Jurasinski, G.: From meadow to shallow lake: Monitoring secondary succession in a coastal fen after rewetting by flooding based on aerial imagery and plot data, Mires Peat, 19, 1–17, https://doi.org/10.19189/MaP.2015.OMB.188, 2017.
Koch, S., Jurasinski, G., Koebsch, F., Koch, M., and Glatzel, S.: Spatial variability of annual estimates of methane emissions in a phragmites australis (cav.) trin. ex steud. dominated restored coastal brackish fen, Wetlands, 34, 593–602, https://doi.org/10.1007/s13157-014-0528-z, 2014.
Koebsch, F., Glatzel, S., Hofmann, J., Forbrich, I., and Jurasinski, G.: CO2 exchange of a temperate fen during the conversion from moderately rewetting to flooding, J. Geophys. Res.-Biogeo., 118, 940–950, https://doi.org/10.1002/jgrg.20069, 2013.
Koebsch, F., Jurasinski, G., Koch, M., Hofmann, J., and Glatzel, S.: Controls for multi-scale temporal variation in ecosystem methane exchange during the growing season of a permanently inundated fen, Agr. Forest Meteorol., 204, 94–105, https://doi.org/10.1016/j.agrformet.2015.02.002, 2015.
Koebsch, F., Winkel, M., Liebner, S., Liu, B., Westphal, J., Schmiedinger, I., Spitzy, A., Gehre, M., Jurasinski, G., Köhler, S., Unger, V., Koch, M., Sachs, T., and Böttcher, M. E.: Sulfate deprivation triggers high methane production in a disturbed and rewetted coastal peatland, Biogeosciences, 16, 1937–1953, https://doi.org/10.5194/bg-16-1937-2019, 2019.
Koebsch, F., Gottschalk, P., Beyer, F., Wille, C., Jurasinski, G., and Sachs, T.: The impact of occasional drought periods on vegetation spread and greenhouse gas exchange in rewetted fens: Drought effects on vegetation and C loss, Philos. T. R. B, 375, 2–7, https://doi.org/10.1098/rstb.2019.0685, 2020.
Krauze, P., Wagner, D., Yang, S., Spinola, D., and Kühn, P.: Influence of prokaryotic microorganisms on initial soil formation along a glacier forefield on King George Island, maritime Antarctica, Sci. Rep.-UK, 11, 13135, https://doi.org/10.1038/s41598-021-92205-z, 2021.
Kristjansson, J. K. and Schönheit, P.: Why do sulfate-reducing bacteria outcompete methanogenic bacteria for substrates?, Oecologia, 60, 264–266, https://doi.org/10.1007/BF00379530, 1983.
Leifeld, J.: Prologue paper: soil carbon losses from land-use change and the global agricultural greenhouse gas budget, Sci. Total Environ., 465, 3–6, https://doi.org/10.1016/j.scitotenv.2013.03.050, 2013.
Leifeld, J. and Menichetti, L.: The underappreciated potential of peatlands in global climate change mitigation strategies, Nat. Commun., 9, 1071, https://doi.org/10.1038/s41467-018-03406-6, 2018.
Lelieveld, J., Crutzen, P. J., and Dentener, F. J.: Changing concentration, lifetime and climate forcing of atmospheric methane, Tellus B, 50, 128–150, https://doi.org/10.3402/tellusb.v50i2.16030, 1998.
Limpens, J., Berendse, F., Blodau, C., Canadell, J. G., Freeman, C., Holden, J., Roulet, N., Rydin, H., and Schaepman-Strub, G.: Corrigendum to ”Peatlands and the carbon cycle: from local processes to global implications a synthesis” published in Biogeosciences, 5, 1475–1491, 2008, Biogeosciences, 5, 1739–1739, https://doi.org/10.5194/bg-5-1739-2008, 2008.
Lovley, D. R. and Klug, M. J.: Sulfate reducers can outcompete methanogens at freshwater sulfate concentrations, Appl. Environ. Microb., 45, 187–192, https://doi.org/10.1128/aem.45.1.187-192.1983, 1983.
Ma, K., Conrad, R., and Lu, Y.: Dry/wet cycles change the activity and population dynamics of methanotrophs in rice field soil, Appl. Environ. Microb., 79, 4932–4939, https://doi.org/10.1128/AEM.00850-13, 2013.
Meister, P., Liu, B., Khalili, A., Böttcher, M. E., and Jørgensen, B. B.: Factors controlling the carbon isotope composition of dissolved inorganic carbon and methane in marine porewater: An evaluation by reaction-transport modelling, J. Marine Syst., 200, 103227, https://doi.org/10.1016/j.jmarsys.2019.103227, 2019.
Meyers, P. A.: Preservation of elemental and isotopic source identification of sedimentary organic matter, Chem. Geol., 114, 289–302, https://doi.org/10.1016/0009-2541(94)90059-0, 1994.
Miegel, K., Graeff, T., Selle, B., Salzmann, T., Franck, C., and Bronstert, A.: Untersuchung eines renaturierten Niedermoores an der mecklenburgischen Ostseeküste – Teil I: Systembeschreibung und hydrologische Grundcharakterisierung, Hydrologie und Wasserbewirtschaftung, https://doi.org/10.5675/HyWa_2016,4_1, 2016.
Moore, T. R. and Knowles, R.: The influence of water table levels on methane and carbon dioxide emissions from peatland soils, Can. J. Soil Sci., 69, 33–38, https://doi.org/10.4141/cjss89-004, 1989.
Myhre, G., Shindell, D., Bréon, F.-M., Collins, W., Fuglestvedt, J., Huang, J., Koch, D., Lamarque, J.-F., Lee, D., Mendoza, B., Nakajima, T., Robock, A., Stephens, G., Takemura, T., and Zhang, H.: Anthropogenic and Natural Radiative Forcing, in: Climate change 2013: The physical science basis. Contribution of working group I to the fifth assessment report of the Intergovernmental Panel on Climate Change, edited by: Stocker, T. F., Qin, D., Plattner, G. K., Tignor, M., Allen, S. K., Boschung, J., Nauels, A., Xia, Y., Bex, V., and Midgley, P. M., Cambridge University Press, Cambridge, United Kingdom and New York, United States, 56, https://doi.org/10.1017/CBO9781107415324.018, 2013.
Müller-Westermeier, G.: Numerisches Verfahren zur Erstellung klimatologischer Karten (A numeric method creating climatologic maps), Berichte des Deutschen Wetterdienstes (Reports of the German Weather Service), 193, 1–17, 1995.
Nauhaus, K., Albrecht, M., Elvert, M., Boetius, A., and Widdel F.: In vitro cell growth of marine archaealbacterial consortia during anaerobic oxidation of methane with sulfate, Environ. Microbiol., 9, 187–196, https://doi.org/10.1111/j.1462-2920.2006.01127.x, 2007.
Nazaries, L., Murrell, J. C., Millard, P., Baggs, L., and Singh, B. K.: Methane, microbes and models: Fundamental understanding of the soil methane cycle for future predictions, Environ. Microbiol., 15, 2395–2417, https://doi.org/10.1111/1462-2920.12149, 2013.
Nerem, R. S., Beckley, B. D., Fasullo, J. T., Hamlington, B. D., Masters, D., and Mitchum, G. T.: Climate-change–driven accelerated sea-level rise detected in the altimeter era, P. Natl. Acad. Sci. USA, 115, 2022–2025, https://doi.org/10.1073/pnas.1717312115, 2018.
Nisbet, E. G., Fisher, R. E., Lowry, D., France, J. L., Allen, G., Bakkaloglu, S., Broderick, T. J., Cain, M., Coleman, M., Fernandez, J., Forster, G., Griffiths, P. T., Iverach, C. P., Kelly, B. F.J., Manning, M. R., Nisbet-Jones, P. B. R., Pyle, J. A., Townsend-Small, A., Al-Shalaan, A., Warwick, N., and Zazzeri, G.: Methane mitigation: Methods to reduce emissions, on the path to the Paris agreement, Rev. Geophys., 58, e2019RG000675, https://doi.org/10.1029/2019RG000675, 2020.
Oksanen, J., Blanchet, F. G., Friendly, M., Kindt, R., Legendre, P., McGlinn, D., Minchin, P. R., O'Hara, R. B., Simpson, G. L., Solymos, P., M. H. H., Stevens, H., Szoecs, E., and Wagner, H.: vegan: Community Ecology Package, R package version 2.5-7, https://CRAN.R-project.org/package=vegan (last access: 15 June 2022), 2020.
Op den Camp, H. J., Islam, T., Stott, M. B., Harhangi, H. R., Hynes, A., Schouten, S., Dunfield, P. F.: Environmental, genomic and taxonomic perspectives on methanotrophic Verrucomicrobia, Env. Microbiol. Rep., 1, 293–306, https://doi.org/10.1111/j.1758-2229.2009.00022.x, 2009.
Oremland, R. S.: Biogeochemistry of methanogenic bacteria, in: Biology of anaerobic microorganisms, edited by: Zehnder, A. J. B., John Wiley & Sons, Inc., 641–690, https://pubs.er.usgs.gov/publication/70198767 (last access 27 July 2022), 1988.
Page, S. E., Rieley, J. O., and Banks, C. J.: Global and regional importance of the tropical peatland carbon pool, Glob. Change Biol., 17, 798–818, https://doi.org/10.1111/j.1365-2486.2010.02279.x, 2011.
Paustian, K., Lehmann, J., Ogle, S., Reay, D., Robertson, G. P., and Smith, P.: Climate-smart soils, Nature, 532, 49–57, https://doi.org/10.1038/nature17174, 2016.
Pedersen, T. L.: patchwork: The Composer of Plots, R package version 1.1.1, https://CRAN.R-project.org/package=patchwork (last access: 13 April 2022), 2020.
Peltoniemi, K., Laiho, R., Juottonen, H., Bodrossy, L., Kell, D. K., Minkkinen, K., Mäkiranta, P., Mehtätalo, L., Penttilä, T., Siljanen, H. M. P., Tuittila, E. S., Tuomivirta, T., and Fritze, H.: Responses of methanogenic and methanotrophic communities to warming in varying moisture regimes of two boreal fens, Soil Biol. Biochem., 97, 144–156, https://doi.org/10.1016/j.soilbio.2016.03.007, 2016.
Penning, H., Plugge, C. M., Galand, P. E., and Conrad, R.: Variation of carbon isotope fractionation in hydrogenotrophic methanogenic microbial cultures and environmental samples at different energy status, Glob. Change Biol., 11, 2103–2113, https://doi.org/10.1111/j.1365-2486.2005.01076.x, 2005.
Pester, M., Knorr, K.-H., Friedrich, M. W., Wagner, M., and Loy, A.: Sulfate-reducing microorganisms in wetlands – fameless actors in carbon cycling and climate change, Front. Microbiol., 3, 1–19, https://doi.org/10.3389/fmicb.2012.00072, 2012.
Popp, T. J., Chanton, J. P., Whiting, G. J., and Grant, N.: Methane stable isotope distribution at a Carex dominated fenin north Central Alberta, Global Biogeochem. Cy., 13, 1063–1077, https://doi.org/10.1029/1999GB900060, 1999.
QGIS.org: QGIS Geographic Information System. QGIS Association, https://www.qgis.org, last access: 11 February 2022.
Quast, C., Pruesse, E., Yilmaz, P., Gerken, J., Schweer, T., Yarza, P., Peplies, J., and Glöckner, F. O.: The SILVA ribosomal RNA gene database project: improved data processing and web-based tools, Nucleic Acids Res., 41, 590–596, https://doi.org/10.1093/nar/gks1219, 2013.
R Core Team: A language and environment for statistical computing, R Foundation for Statistical Computing, Vienna, Austria, https://www.R-project.org/, last access: 15 October 2021.
Revelle, W.: psych: Procedures for Personality and Psychological Research, Northwestern University, Evanston, Illinois, USA, Version = 2.1.3, https://CRAN.R-project.org/package=psych (last access: 17 March 2022), 2020.
Rheinheimer, G. (Ed.): Meereskunde der Ostsee, Springer, Berlin, Heidelberg, Germany, https://doi.org/10.1007/978-3-642-85211-4, 2013.
Ruff, S. E., Kuhfuss, H., Wegener, G., Lott, C., Ramette, A., Wiedling, J., Knittel, K., and Weber, M.: Methane seep in shallow-water permeable sediment harbors high diversity of anaerobic methanotrophic communities, Elba, Italy, Front. Microbiol., 7, 1–20, https://doi.org/10.3389/fmicb.2016.00374, 2016.
Schloss, P. D., Westcott, S. L., Ryabin, T., Hall, J. R., Hartmann, M., Hollister, E. B., Lesniewski, R. A., Oakley, B. B., Parks, D. H., Robinson, C. J., Sahl, J. W., Stres, B., Thallinger, G. G., Van Horn, D. J., and Weber, C. F.: Introducing mothur: Open-source, platform-independent, community-supported software for describing and comparing microbial communities, Appl. Environ. Microb., 75, 7537–7541, https://doi.org/10.1128/AEM.01541-09, 2009.
Scholten, J. C. M., Van Bodegom, P. M., Vogelaar, J., Van Ittersum, A., Hordijk, K., Roelofsen, W., and Stams, A. J. M.: Effect of sulfate and nitrate on acetate conversion by anaerobic microorganisms in a freshwater sediment, FEMS Microbiol. Ecol., 42, 375–385, https://doi.org/10.1016/S0168-6496(02)00359-8, 2002.
Schönheit, P., Kristjansson, J. K., and Thauer, R. K.: Microbiology, Arch. Microbiol., 132, 285–288, 1982.
Seeberg-Elverfeldt, J., Schlüter, M., Feseker, T., and Kölling, M.: Rhizon sampling of porewaters near the sediment-water interface of aquatic systems, Limnol. Oceanogr.-Meth., 3, 361-371, https://doi.org/10.4319/lom.2005.3.361, 2005.
Segarra, K. E. A., Comerford, C., Slaughter, J., and Joye, S. B.: Impact of electron acceptor availability on the anaerobic oxidation of methane in coastal freshwater and brackish wetland sediments, Geochim. Cosmochim. Ac., 115, 15–30, https://doi.org/10.1016/j.gca.2013.03.029, 2013.
Segarra, K. E. A., Schubotz, F., Samarkin, V., Yoshinaga, M. Y., Hinrichs, K. U., and Joye, S. B.: High rates of anaerobic methane oxidation in freshwater wetlands reduce potential atmospheric methane emissions, Nat. Commun., 6, 1–8, https://doi.org/10.1038/ncomms8477, 2015.
Söhngen, N.: Über Bakterien, welche Methan als Kohlenstoffnahrung und Energiequelle gebrauchen, Zentrabl. Bakt. P. Inf., 15, 513–517, 1906.
Söllinger, A. and Urich, T.: Methylotrophic methanogens everywhere – physiology and ecology of novel players in global methane cycling, Biochem. Soc. T., 47, 1895–1907, https://doi.org/10.1042/BST20180565, 2019.
Strack, M., Waddington, J. M., Turetsky, M., Roulet, N. T., and Byrne, K. A.: Northern peatlands, greenhouse gas exchange and climate change, in Peatland and climate change, edited by: Strack, M., International Peat Society, Jyväskylä, Finland, 44–69, ISBN 978-952-99401-1-0, 2008.
Takai, K. and Horikoshi, K.: Rapid detection and quantification of members of the archaeal community by quantitative PCR using fluorogenic probes, Appl. Environ. Microb., 66, 5066–5072, https://doi.org/10.1128/AEM.66.11.5066-5072.2000, 2000.
Thauer, R. K., Kaster, A. K., Seedorf, H., Buckel, W., and Hedderich, R.: Methanogenic archaea: Ecologically relevant differences in energy conservation, Nat. Rev. Microbiol., 6, 579–591, https://doi.org/10.1038/nrmicro1931, 2008.
Thurman, E. M.: Organic geochemistry of natural waters, Martinus Nijhoff, Dr. W. Junk Publishers, Dordrecht, Boston, Lancaster, 497 pp., https://doi.org/10.1007/978-94-009-5095-5, 1985.
Unger, V., Liebner, S., Koebsch, F., Yang, S., Horn, F., Sachs, T., Kallmeyer, J., Knorr, K.-H., Rehder, G., Gottschalk, P., and Jurasinski, G.: Congruent changes in microbial community dynamics and ecosystem methane fluxes following natural drought in two restored fens, Soil Biol. Biochem., 160, 108348, https://doi.org/10.1016/j.soilbio.2021.108348, 2021a.
Unger, V., Liebner, S., Koebsch, F., Yang, S., Horn, F., Sachs, T., Kallmeyer, J., Knorr, K.-H., Rehder, G., Gottschalk, P., and Jurasinski, G.: Analysis of microbial communities in fens affected by natural drought in the context of methane cycling, ENA, [ERP121549], https://www.ebi.ac.uk/ena/browser/view/PRJEB38162?show=reads (last access: 28 July 2022), 2021b.
van der Gon, H. A. C. D. and Neue, H. U.: Impact of gypsum application on the methane emission from a wetland rice field, Global Biogeochem. Cy., 8, 127–134, https://doi.org/10.1029/94GB00386, 1994.
van Dijk, G. Lamers, L. P. M., Loeb, R., Westendorp, P. J., Kuiperij, R., van Kleef, H. H., Klinge, M., and Smolders, A. J. P.: Salinization lowers nutrient availability in formerly brackish freshwater wetlands; unexpected results from a long-term field experiment, Biogeochemistry, 143, 67–83, https://doi.org/10.1007/s10533-019-00549-6, 2019.
Voigtländer, U., Schmidt, J., and Scheller, W.: Pflege- und Entwicklungsplan NSG Heiligensee und Hütelmoor, SALIX, Büro für Landschaftsplanung Waren, Teterow, Germany, 1996.
von Ahn C. M. E., Scholten, J. C., Malik, C., Feldens, P., Liu B., Dellwig, O., Jenner, A.-K., Papenmeier, S., Schmiedinger, I., Zeller, M. A., and Böttcher, M. E.: A Multi-Tracer Study of Fresh Water Sources for a Temperate Urbanized Coastal Bay (Southern Baltic Sea), Front. Environ. Sci., 9, 642346, https://doi.org/10.3389/fenvs.2021.642346, 2021.
Wagner, D.: Effect of varying soil water potentials on methanogenesis in aerated marshland soils, Sci. Rep.-UK, 7, 1–9, https://doi.org/10.1038/s41598-017-14980-y, 2017.
Wang, M., Moore, T. R., Talbot, J., and Riley, J. L.: The stoichiometry of carbon and nutrients in peat formation, Global Biogeochem. Cy., 29, 113–121, https://doi.org/10.1002/2014GB005000, 2015.
Wen, X., Unger, V., Jurasinski, G., Koebsch, F., Horn, F., Rehder, G., Sachs, T., Zak, D., Lischeid, G., Knorr, K.-H., Böttcher, M. E., Winkel, M., Bodelier, P. L. E., and Liebner, S.: Peat metagenome, NCBI [PRJNA356778], https://www.ncbi.nlm.nih.gov/bioproject/?term=PRJNA356778 (last access: 28 July 2022), 2016.
Wen, X., Unger, V., Jurasinski, G., Koebsch, F., Horn, F., Rehder, G., Sachs, T., Zak, D., Lischeid, G., Knorr, K.-H., Böttcher, M. E., Winkel, M., Bodelier, P. L. E., and Liebner, S.: Predominance of methanogens over methanotrophs in rewetted fens characterized by high methane emissions, Biogeosciences, 15, 6519–6536, https://doi.org/10.5194/bg-15-6519-2018, 2018.
Wickham, H.: reshape: Reshaping data with the reshape package, J. Stat. Softw., 21, 1–20, https://doi.org/10.18637/jss.v021.i12, 2007.
Wickham, H. (Ed.): ggplot2: Elegant graphics for data analysis, Springer-Verlag New York, ISBN 978-3-319-24277-4, 2016.
Wickham, H.: forcats: Tools for Working with Categorical Variables (Factors), R package version 0.5.1, https://CRAN.R-project.org/package=forcats (last access: 15 June 2022), 2021.
Wickham, H. and Seidel, D.: scales: Scale Functions for Visualization, R package version 1.1.1., https://CRAN.R-project.org/package=scales (last access: 15 June 2022), 2020.
Wickham, H., François, F., Henry, L., and Müller, K.: dplyr: A grammar of data manipulation, R package version 1.0.7, https://CRAN.R-project.org/package=dplyr (last access: 15 June 2022), 2021.
Wilson, D., Blain, D., Couwenberg, J., Evans, C. D., Murdiyarso, D., Page, S. E., Renou-Wilson, F., Rieley, J.O., Sirin, A., Strack, M., and Tuittila, E.-S.: Greenhouse gas emission factors associated with rewetting of organic soils, Mires Peat, 17, 1–28, https://doi.org/10.19189/MaP.2016.OMB.222, 2016.
Winkel, M., Mitzscherling, J., Overduin, P. P., Horn, F., Winterfeld, M., Rijkers, R., Grigoriev, M. N., Knoblauch, C., Mangelsdorf, K., Wagner, D., and Liebner, S.: Anaerobic methanotrophic communities thrive in deep submarine permafrost, Sci. Rep.-UK, 8, 1–13, https://doi.org/10.1038/s41598-018-19505-9, 2018.
Whiticar, M. J., Faber, E., and Schoell, M.: Biogenic methane formation in marine and freshwater environments: CO2 reduction vs. acetate fermentation-Isotope evidence, Geochim. Cosmoch. Ac., 50, 693–709, https://doi.org/10.1016/0016-7037(86)90346-7, 1986.
Whiting, G. J. and Chanton, J. P.: Primary production control of methane emission from wetlands, Letter to Nature, 364, 794–795, 1993.
Whittenbury, R., Phillips, K. C., and Wilkinson, J. F.: Enrichment, isolation and some properties of methane-utilizing bacteria, J. Gen. Microbiol., 61, 205–218, 1970.
Wichtmann, W., Tanneberger, F., Wichmann, S., Joosen, H., and Herold, B.: Paludiculture is paludifuture. Climate, biodiversity and economic benefits from agriculture and forestry on rewetted peatland, Peatlands International, 1, 48–51, 2010.
Yang, S., Liebner, S., Svenning, M. M., and Tveit, A. T.: Decoupling of microbial community dynamics and functions in Arctic peat soil exposed to short term warming, Mol. Ecol., 30, 5094–5104, https://doi.org/10.1111/mec.16118, 2021.
Yu, Z. C., Loisel, J., Brosseau, D. P., Beilman, D. W., and Hunt, S. J.: Global peatland dynamics since the last glacial maximum, Geophys. Res. Lett., 37, L13402, https://doi.org/10.1029/2010GL043584, 2010.
Zak, D., Roth, C., Unger, V., Goldhammer, T., Fenner, N., Freeman, C., and Jurasinski, G.: Unraveling the importance of polyphenols for microbial carbon mineralization in rewetted riparian peatlands, Front. Environ. Sci., 7, 1–14, https://doi.org/10.3389/fenvs.2019.00147, 2019.