the Creative Commons Attribution 4.0 License.
the Creative Commons Attribution 4.0 License.
 | 24 Aug 2022
Recent extreme drought events in the Amazon rainforest: assessment of different precipitation and evapotranspiration datasets and drought indicators
Christian S. Zang
Zlatan Angelov
Aline Anderson de Castro
Juan Carlos Jimenez
Luiz Felipe Campos De Rezende
Romina C. Ruscica
Boris Sakschewski
Anna A. Sörensson
Kirsten Thonicke
Carolina Vera
Nicolas Viovy
Celso Von Randow
Anja Rammig
Over the last decades, the Amazon rainforest has been hit by multiple severe drought events. Here, we assess the severity and spatial extent of the extreme drought years 2005, 2010 and 2015/16 in the Amazon region and their impacts on the regional carbon cycle. As an indicator of drought stress in the Amazon rainforest, we use the widely applied maximum cumulative water deficit (MCWD). Evaluating nine state-of-the-art precipitation datasets for the Amazon region, we find that the spatial extent of the drought in 2005 ranges from 2.2 to 3.0 (mean =2.7) ×106 km2 (37 %–51 % of the Amazon basin, mean =45 %), where MCWD indicates at least moderate drought conditions (relative MCWD anomaly ). In 2010, the affected area was about 16 % larger, ranging from 3.0 up to 4.4 (mean =3.6) ×106 km2 (51 %–74 %, mean =61 %). In 2016, the mean area affected by drought stress was between 2005 and 2010 (mean km2; 55 % of the Amazon basin), but the general disagreement between datasets was larger, ranging from 2.4 up to 4.1×10⁶ km2 (40 %–69 %). In addition, we compare differences and similarities among datasets using the self-calibrating Palmer Drought Severity Index (scPDSI) and a dry-season rainfall anomaly index (RAI). We find that scPDSI shows a stronger and RAI a much weaker drought impact in terms of extent and severity for the year 2016 compared to MCWD. We further investigate the impact of varying evapotranspiration on the drought indicators using two state-of-the-art evapotranspiration datasets. Generally, the variability in drought stress is most dependent on the drought indicator (60 %), followed by the choice of the precipitation dataset (20 %) and the evapotranspiration dataset (20 %). Using a fixed, constant evapotranspiration rate instead of variable evapotranspiration can lead to an overestimation of drought stress in the parts of Amazon basin that have a more pronounced dry season (for example in 2010). We highlight that even for well-known drought events the spatial extent and intensity can strongly depend upon the drought indicator and the data sources it is calculated with. Using only one data source and drought indicator has the potential danger of under- or overestimating drought stress in regions with high measurement uncertainty, such as the Amazon basin.
- Article
(4137 KB) - Full-text XML
-
Supplement
(3225 KB) - BibTeX
- EndNote


The severe drought events occurring in 2005, 2010 and 2015/16 in the Amazon basin are reasons for concern regarding their frequency, severity and their impacts on the Amazon rainforest. Different large-scale atmospheric processes related to increased sea surface temperature (SST) in the Pacific Ocean and the Atlantic Ocean seem to be responsible for such repeated mega-drought events (Coelho et al., 2012): while the 2015/16 drought was driven by a record-level El Niño event enhanced by the strong underlying global warming trend (Jimenez et al., 2018), the 2010 drought was a combination of a moderate El Niño event and anomalously warm SSTs in the tropical North Atlantic (Marengo et al., 2011; Marengo and Espinoza, 2016). Similarly, the 2005 drought was attributed to anomalies of warm SSTs in the North Atlantic (Marengo et al., 2008b; Zeng et al., 2008). As a consequence, such events differ in their strength, their timing, and their spatial patterns, and thus, impacted regions differ. While drought events related to El Niño events show a southwest–northeast gradient with dry conditions over the northeastern Amazon region (Malhi et al., 2008), drought events caused by anomalously warm North Atlantic SSTs show a north–south gradient with dry conditions in the southern Amazon region (Lewis et al., 2011; Marengo et al., 2008a). Even in the case of El Niño events, SST anomalies over the eastern Pacific (EP) or the central Pacific (CP) can lead to different impacts and spatial patterns of drought (Jimenez et al., 2019). In addition to their influence on temperature, recent El Niño events also showed amplified anomalies of atmospheric vapour pressure deficit (Barkhordarian et al., 2019; Rifai et al., 2019). The impacts of such drought events on humid tropical forests, which are often not adapted to longer-lasting dryness, are severe. Increased forest mortality connected to drought events was observed in central and southern Amazonia (Feldpausch et al., 2016; Lewis et al., 2011; Phillips et al., 2009), as well as shifts in tree species composition (Esquivel-Muelbert et al., 2019). Droughts are assumed to be one of the main drivers of the observed decline in the Amazon carbon sink, indicating that more carbon is lost to the atmosphere than taken up by the forest (Hubau et al., 2020). Thus, such extreme drought events are altering the carbon cycle of the Amazon forest (Feldpausch et al., 2016; Gloor et al., 2015; Hubau et al., 2020; Phillips et al., 2009).
Losing tropical forests in the Amazon region through increased mortality under drought also has implications for regional- and continental-scale water cycling (Ruiz-Vásquez et al., 2020). The rainforest transpires an enormous amount of water which is transported by winds to remote regions far beyond the borders of the rainforest (e.g. Dirmeyer et al., 2009; van der Ent et al., 2010; Zemp et al., 2014, 2017). In addition, the ongoing deforestation in the Amazon rainforest further decreases forest cover and thus, transpiration rates, leading to a rainfall decline and enhanced drought conditions in a positive feedback loop (Miralles et al., 2019; Zemp et al., 2017). It can be expected that ongoing climate change most likely will cause stronger and more frequent drought events in the Amazon (Cai et al., 2015; Jiang et al., 2020; Marengo and Espinoza, 2016).
For assessing the severity; the spatial extent; and, in particular, the impacts of such drought events on existing ecosystems, different gridded precipitation datasets are available, which in some cases differ strongly in magnitude and spatiotemporal distribution of precipitation amounts (Golian et al., 2019). Typical problems of precipitation data for South America encompass the underestimation of extreme rainfall events in both dry or wet seasons (Blacutt et al., 2015; Giles et al., 2020). Therefore, while for the Amazon region, the recent drought events have been assessed in terms of severity (Jimenez et al., 2018; Jiménez-Muñoz et al., 2016) and impacts (Feldpausch et al., 2016; Lewis et al., 2011; Phillips et al., 2009) based on single precipitation datasets, a systematic analysis of how the most frequently used precipitation datasets differ regarding the spatial extent, location and severity of recent extreme drought events is currently missing.
For our study, we selected precipitation from nine different datasets. (1, 2) Data from the Tropical Rainfall Measurement Mission (TRMM) versions 6 and 7 (Huffman et al., 2007) have been frequently used e.g. to estimate drought impacts on the carbon balance (Lewis et al., 2011; Malhi et al., 2009) and are assumed to represent precipitation patterns in the Amazon region best, since they are derived from radar measurements (Huffman et al., 2007). (3) CHIRPS (Climate Hazards group Infrared Precipitation with Stations; Espinoza et al., 2019) has been used to study regional hydro-climatic and environmental changes in the Amazon basin. These three datasets only provide precipitation and no information about other climatic variables such as temperature or radiation. In addition, we selected five datasets that are often used as drivers for ecosystem models (e.g. in Forkel et al., 2019; Yang et al., 2015) and – in contrast to the other datasets – provide information about more climate variables. (4) Data from the Climatic Research Unit (CRU) have been used in a joint project reanalysis (NCEP, National Centers for Environmental Prediction), known as CRUNCEP (version 8; Viovy, 2018). (5) The WATCH (Water and Global Change) WFDEI (WATCH Forcing Data methodology applied to ERA-Interim reanalysis data; Weedon et al., 2011, 2014) dataset was originally derived from global sub-daily observations merged with integrations from a general circulation model. (6) The GSWP3 (Global Soil Wetness Project Phase 3; Kim et al., 2022) dataset is closely related to WATCH WFDEI, relying on a similar forcing but with a different bias-correction method applied. (7) The newer GLDAS (Global Land Data Assimilation System) 2.1 is derived from various geostationary infrared satellite measurements and microwave observations (Rodell et al., 2004). (8) The latest ECMWF atmospheric reanalysis dataset, ERA5, is the successor to ERA-Interim and provides higher spatial and temporal resolutions and a more recent model and data assimilation system than the previous ERA-Interim reanalysis (Albergel et al., 2018). Finally, (9) the GPCC (named after the Global Precipitation Climatology Centre) dataset (Schneider et al., 2018) is based on globally available land stations (rain gauges) combined with an empirical interpolation method (Willmott et al., 1985). The datasets were chosen because they are often used to force dynamic global vegetation and hydrological simulation models in climate impact studies. A more detailed description of the datasets is given in the “Methods” section.
We evaluate the precipitation datasets based on the maximum cumulative water deficit (MCWD; Aragão et al., 2007), a well-established drought index that is particularly suitable for estimating drought stress in the Amazon region (e.g. Esquivel-Muelbert et al., 2019; Lewis et al., 2011; Malhi et al., 2009; Phillips et al., 2009; Zang et al., 2020). In addition, we included two other measures to complement our analysis: a rainfall anomaly index (RAI), which does account for the mean deviation (in units of standard deviation) of precipitation during the driest months of the year, and the scPDSI (self-calibrating Palmer Drought Severity Index; Wells et al., 2004). The scPDSI index has a more complex formulation compared to RAI and MCWD and takes available soil water content into account. Both RAI and scPDSI have been used in studies describing the recent Amazonian drought events (e.g. Jiménez-Muñoz et al., 2016; Lewis et al., 2011). Many studies (e.g. Flack-Prain et al., 2019; Hubau et al., 2020) currently still use a fixed evapotranspiration rate for the calculation of MCWD instead of using evapotranspiration datasets as input. To assess the robustness of a fixed evapotranspiration rate, we include two evapotranspiration datasets GLEAM (Global Land Evaporation Amsterdam Model; Martens et al., 2017) and DOLCE (Derived Optimal Linear Combination Evapotranspiration; Hobeichi et al., 2018) for the calculation of MCWD and scPDSI. The goals of our study are (1) to analyse and quantify the uncertainty in strength, extent and location of three recent Amazon droughts in the years 2005, 2010 and 2015/16 in precipitation from nine state-of-the-art precipitation or climate datasets based on MCWD and (2) to examine differences among these drought events by taking two additional drought indicators (RAI and scPDSI) and two evapotranspiration datasets into account.
2.1 Study area
Our study covers the Amazon River basin as delineated by Döll and Lehner (2002; see black contour in Fig. 1). Using 0.5∘ spatial resolution in longitude and latitude results in 1946 grid cells of interest for this study area. Note that differences in the comparison of our results with Lewis et al. (2011) arise because of differences in the delineation of the Amazon region; i.e. the area used in our study is 0.6×10⁶ km2 larger.
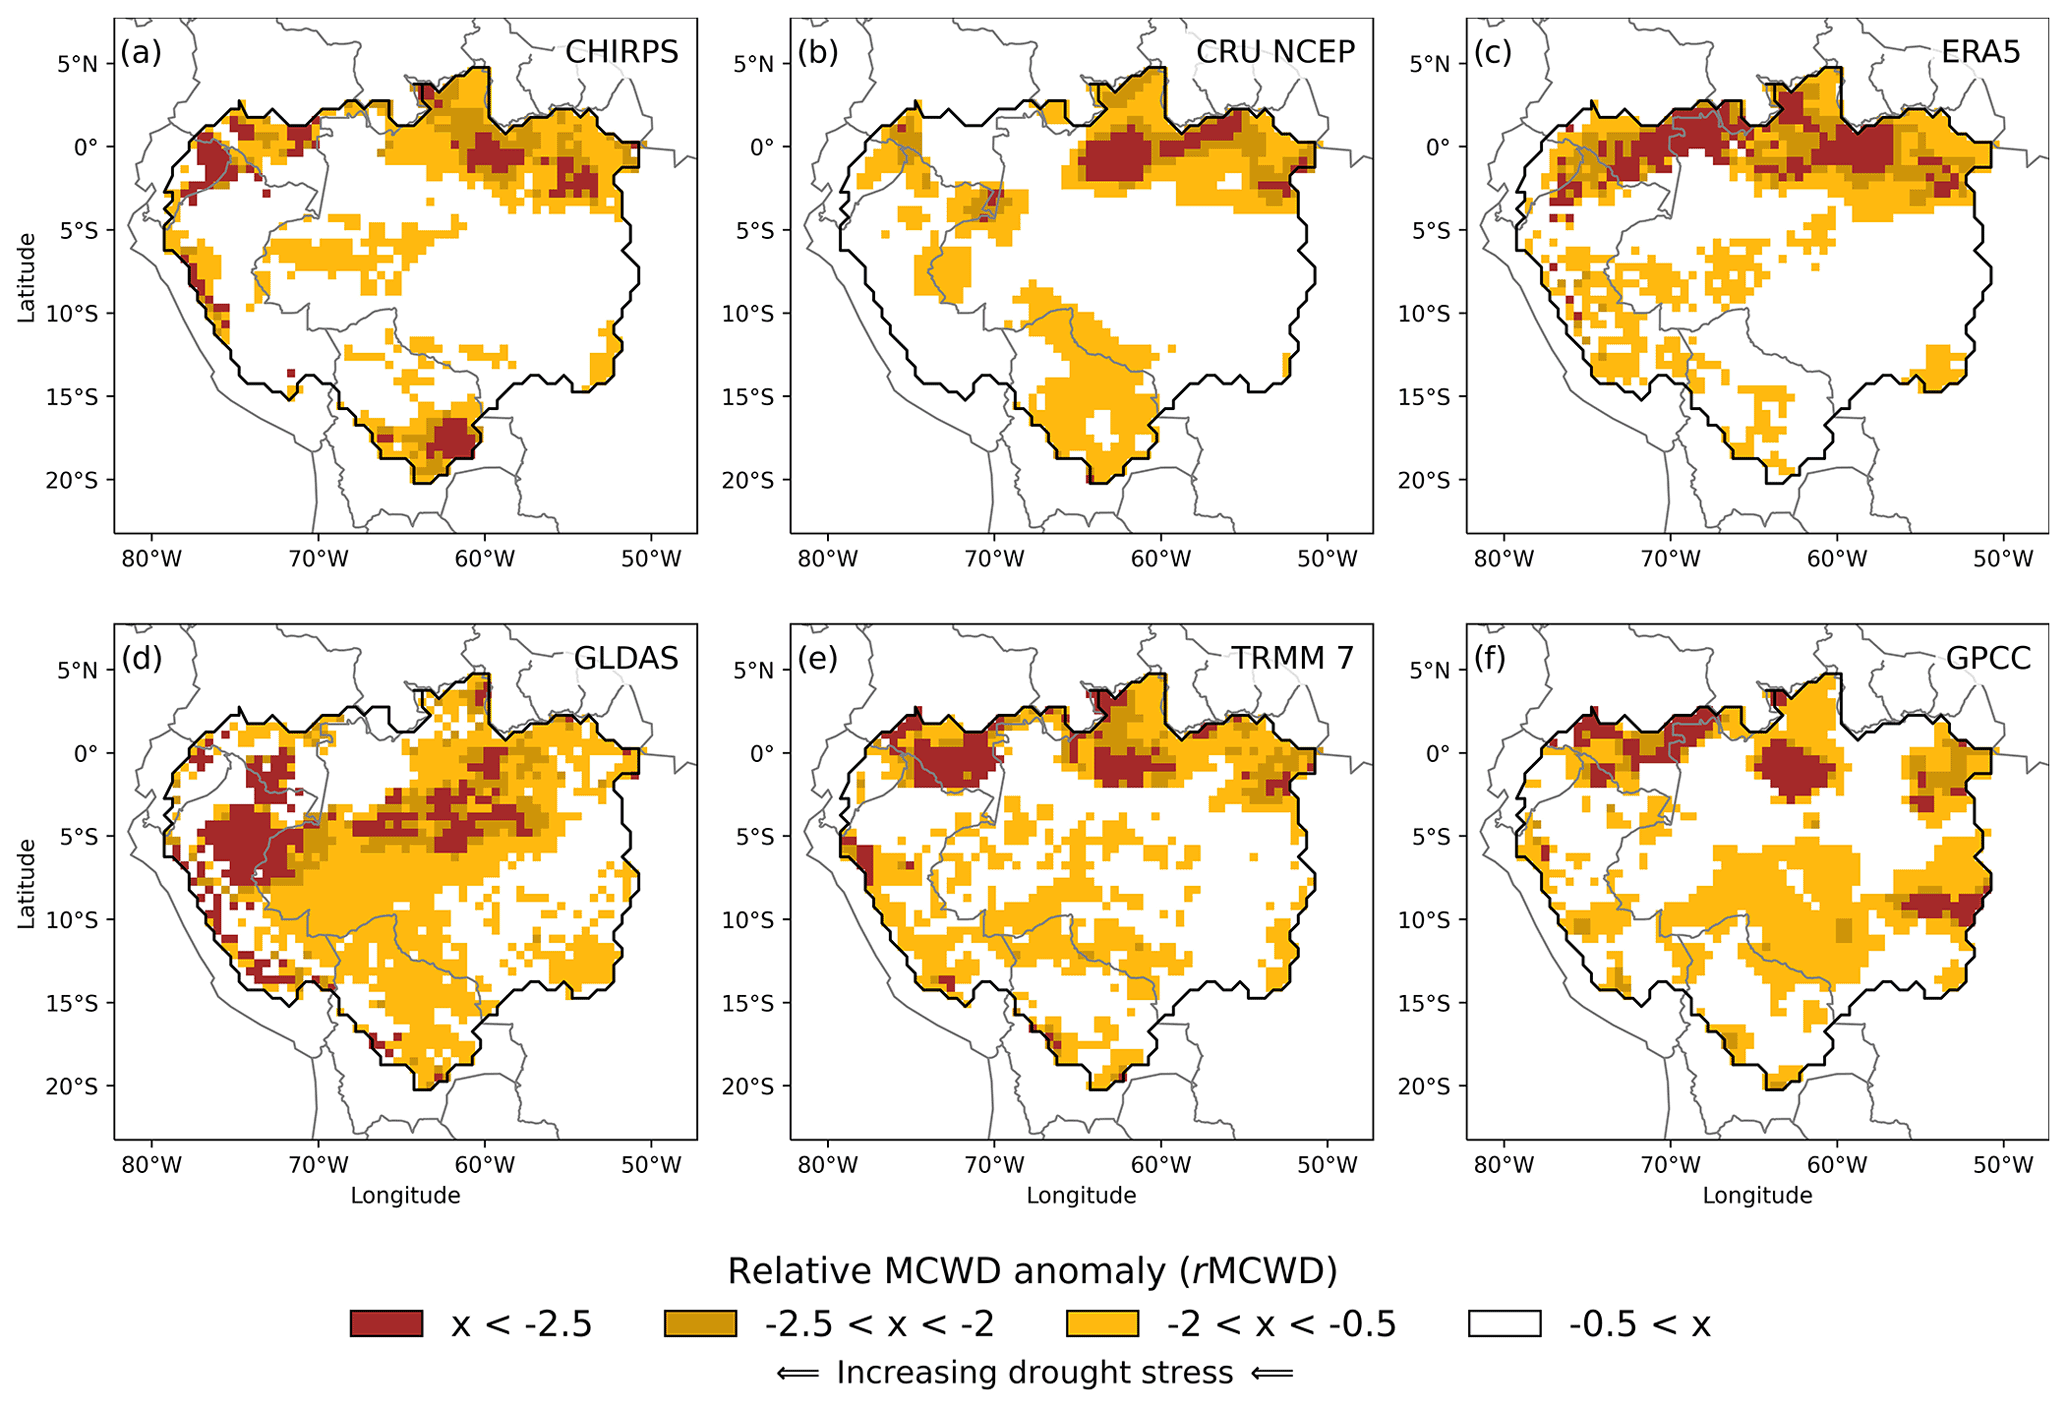
Figure 1Relative MCWD anomalies (from October to September) as an indicator of drought stress in the Amazon basin during the record-breaking drought event in 2016. Displayed are only the datasets that include the year 2016 in their temporal range. The baseline period of the MCWD calculation is 2001 to 2016.
2.2 Data sources
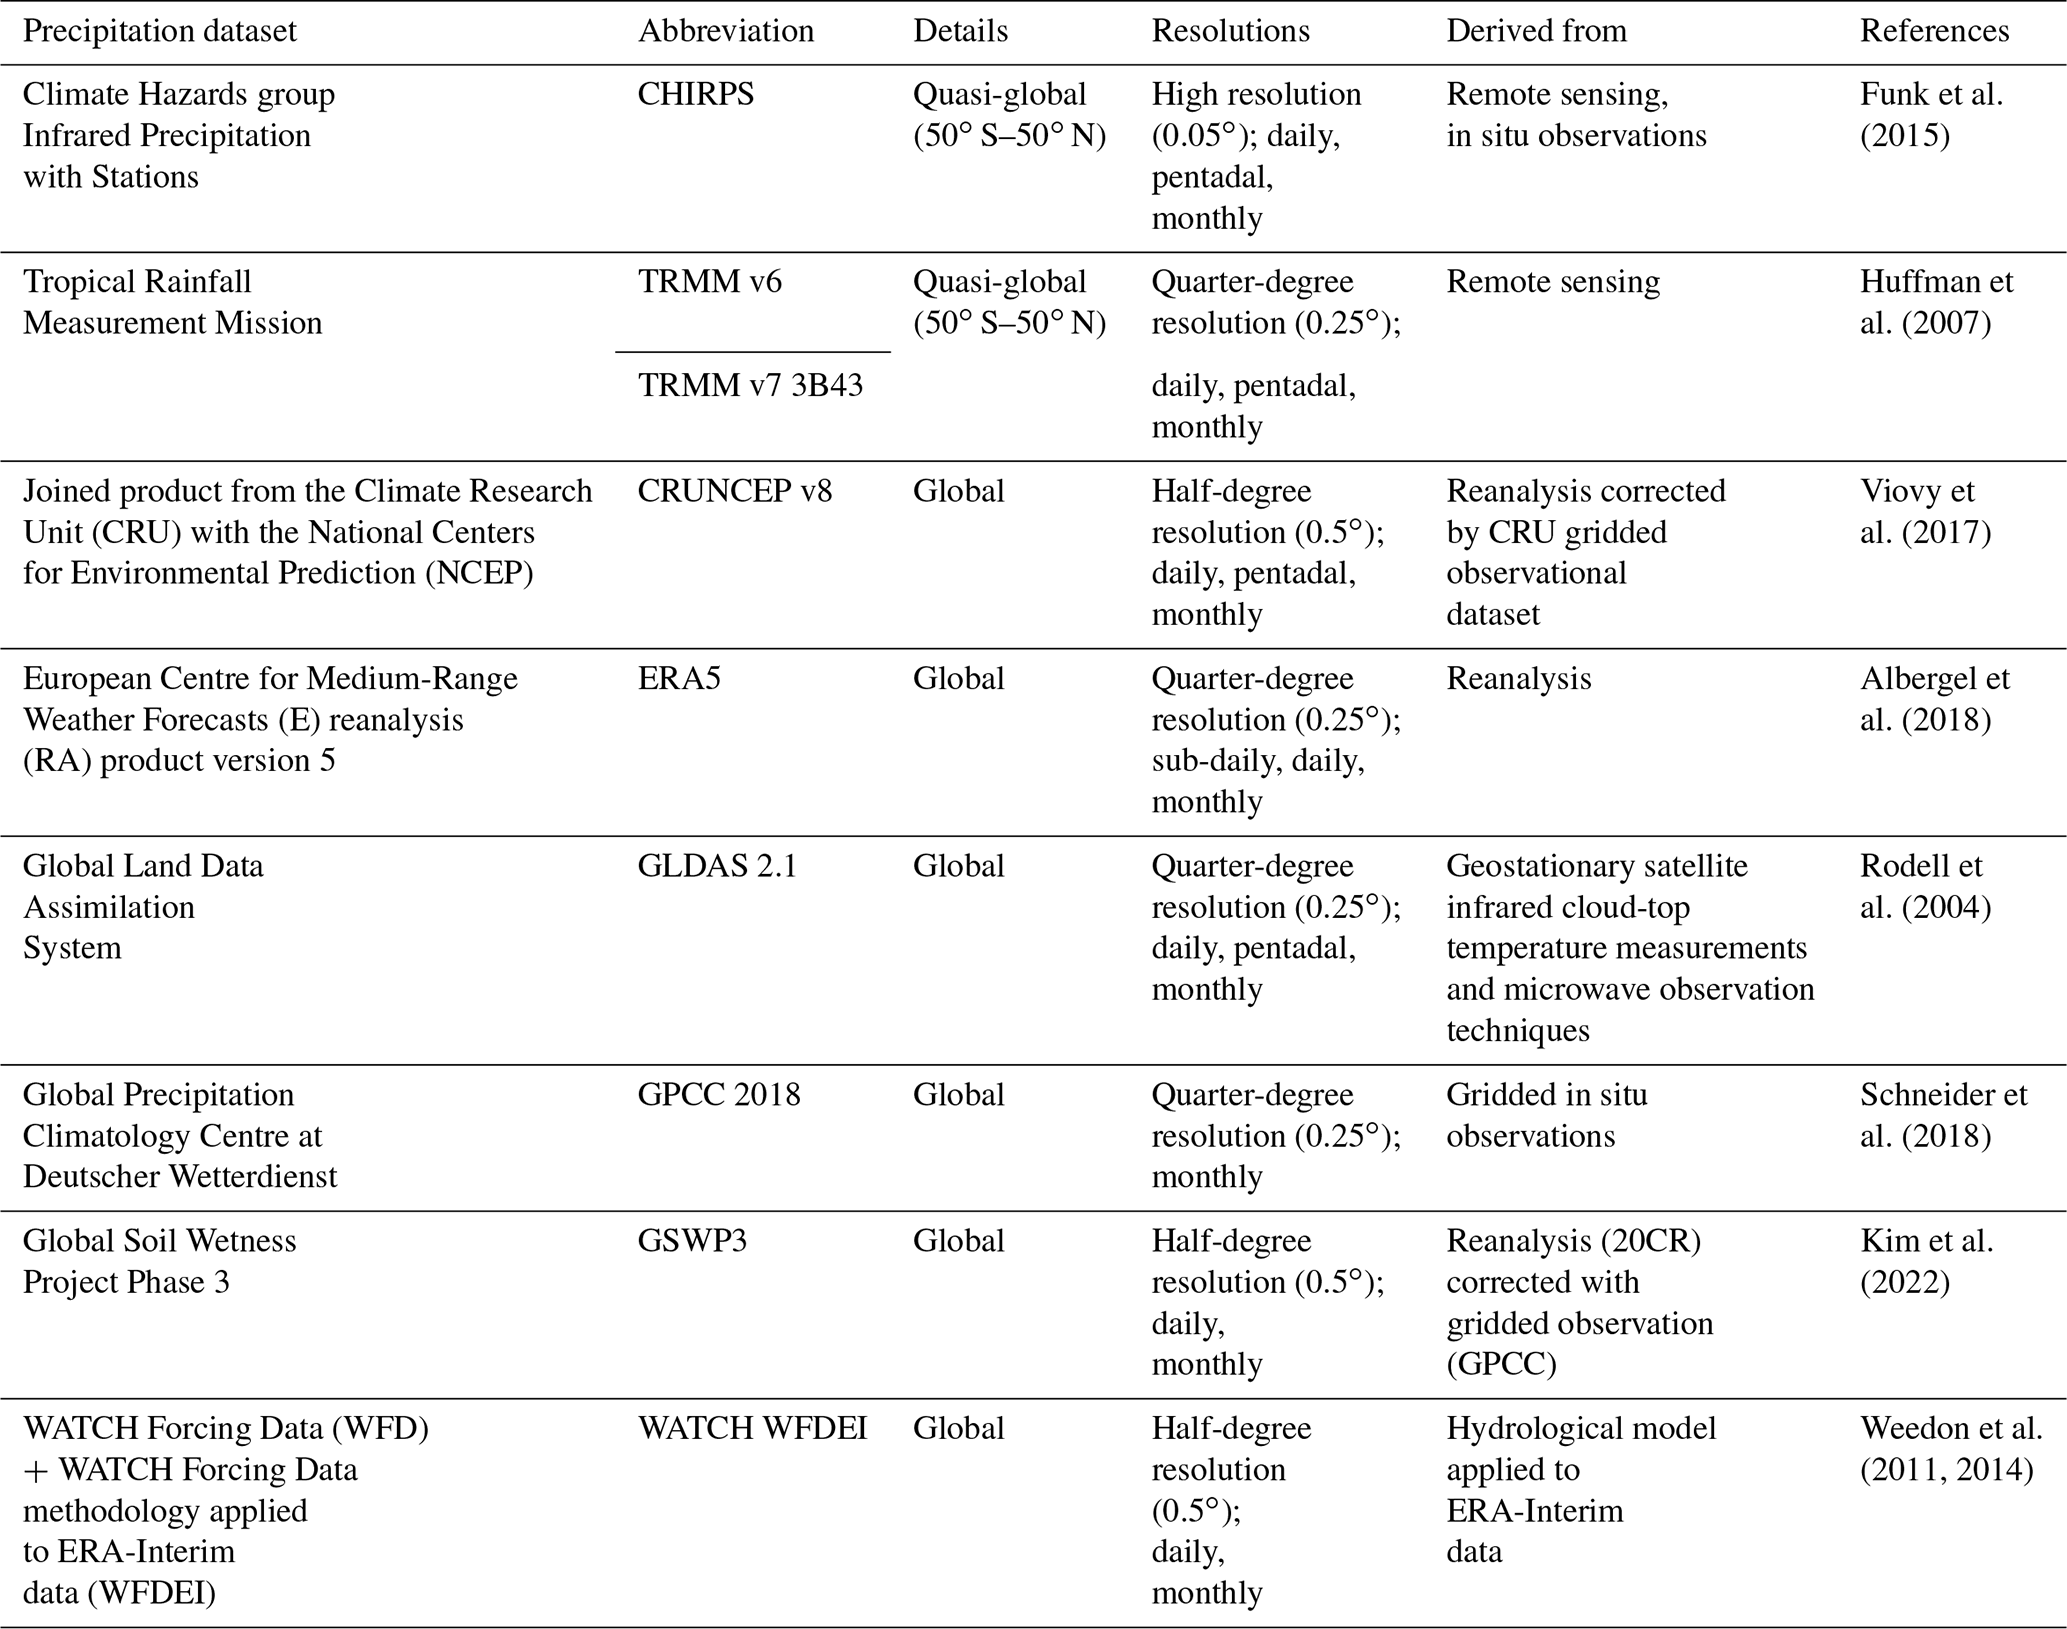
In the following, we briefly describe the nine precipitation datasets applied in our study (see also Table 1): the Tropical Rainfall Measuring Mission (TRMM v7) product (Huffman et al., 2007) is a precipitation-only dataset based on multiple microwave–infrared satellite data, developed as a joint product between NASA and the Japan Aerospace Exploration Agency (JAXA). We also included the predecessor, v6, for comparison in our study, because it has been frequently and prominently used to derive drought impacts to the Amazon basin (e.g. Lewis et al., 2011; Phillips et al., 2009) and shows significantly lower precipitation throughout the basin compared to v7 (Seto et al., 2011). CHIRPS (Climate Hazards group Infrared Precipitation with Station) is a novel dataset (Funk et al., 2015) which is a quasi-global (full longitude but only 50∘ S–50∘ N latitude extent) precipitation-only merged product, based on multi-satellite estimates (similar to TRMM 6 and TRMM 7) and approx. 2000 in situ observations per month in South America. TRMM 6, TRMM 7 and CHIRPS share the quasi-global spatial extent; however, in comparison to TRMM 6 and TRMM 7 with a resolution of , CHIRPS has a much higher spatial resolution of . ERA5 (Muñoz-Sabater et al., 2018) shows improvements in e.g. land evapotranspiration, surface soil moisture and turbulent heat fluxes over its predecessor, ERA-Interim (Albergel et al., 2018), which we decided not to include in our study, as it showed higher systematic errors over tropical areas (Nogueira, 2020). Similarly, CRUNCEP (Viovy, 2018) is generated based on a reanalysis from the National Centers for Environmental Prediction (NCEP) and the National Center for Atmospheric Research (NCAR), corrected with the CRU TS 3.2 (Time Series; Harris et al., 2014) dataset. GPCC is mainly based on data from rain-gauge land stations. Similar to CRUNCEP, it is also based on the NCEP Reanalysis dataset and has been used in global drought studies (Ziese et al., 2014). Both GPCC and CRUNCEP cover the longest periods of all selected datasets in this study with time spans from 1891 until 2016 and from 1901 until 2016, respectively. WATCH WFDEI (Weedon et al., 2011, 2014) is based on the reanalysis ERA-Interim corrected with GPCC precipitation. GSWP3 (Kim et al., 2022) is based on the atmospheric reanalysis method “20CR” (Twentieth Century Reanalysis version 2; Compo et al., 2013), which has been dynamically downscaled to resolution. Corrections with observational data have been applied not only to precipitation but also to short-/longwave radiation, air temperature and the daily temperature range. Both WATCH WFDEI and GSWP end in the year 2010. The GLDAS 2.1 dataset is built by using the Noah land surface model forced by the Goddard Earth Observing System (GEOS) Data Assimilation System with corrected precipitation and radiation (Rodell et al., 2004; Sheffield et al., 2006). Starting in January 2000 (version 2.1), it is the dataset with the latest time onset and hence defines the lower-bound time interval considered in this study. For the 2015/16 drought event, only seven datasets were available, as three of the datasets (TRMM 6, GSWP3 and WATCH WFDEI) end before. All datasets were (if not directly available) aggregated to spatial resolution and to monthly time steps.
Table 1Overview of the 10 precipitation datasets used in our study. Columns show the name of the dataset, the official abbreviation, the short abbreviation used here, the spatial and temporal resolution, and the references.
2.3 Drought indices and evaluation of drought area and extent
2.3.1 Calculation of maximum climatological water deficit (MCWD)
We calculate MCWD based on Aragão et al. (2007) defining water deficit (WD) as follows:
where WD(t) stands for water deficit, which is calculated for a time step t, in this case monthly; P(t) is for monthly precipitation; and ET(t) is for monthly evapotranspiration. To estimate the impacts of persistent drought events, the cumulative water deficit (CWD) is defined as the accumulation of water deficit of each month of the hydrological year (see below for details), for which P(t) is smaller than ET(t); hence WD(t) is negative. MCWD is the most negative value of CWD(t) over a specific period. As proposed by Aragão et al. (2007), we use a fixed value of mm per month derived from ground measurements of evapotranspiration in different locations and seasons in Amazonia (da Rocha et al., 2004; von Randow et al., 2004). As a result, water deficit builds up whenever monthly rainfall P(t) falls below 100 mm.
We calculate annual MCWD for the hydrological year from October of the previous year to September of the succeeding year; e.g. the MCWD for the year 2005 is calculated from October 2004 to September 2005 (similar to Lewis et al., 2011). CWD and consequently MCWD are reset after each hydrological year.
In contrast to e.g. Lewis et al. (2011), we use the relative MCWD anomaly (from now also denoted as rMCWD) as our main drought indicator. For deriving rMCWD, we estimate the absolute MCWD anomaly (from now also denoted as aMCWD) for 2005 and 2010, respectively, by first calculating the mean MCWD for the “baseline” period from 2000 to 2010 and second by subtracting the mean MCWD from 2005 and 2010, respectively. The rMCWD anomaly is then estimated as the normalised deviation of the aMCWD anomaly in units of standard deviation. The same procedure was applied for the rMCWD anomaly for 2016, extending the baseline period from 2000 to 2016.
We define relative thresholds of rMCWD anomaly as moderate, rMCWD anomaly as severe and rMCWD as extreme drought stress. Previously, levels of drought stress were based on aMCWD anomaly (often also referred to as ΔMCWD, e.g. Lewis et al., 2011), with aMCWD anomaly mm as moderate drought stress because at this level, tree mortality already significantly increased in inventory plots.
By comparing empirical cumulative density functions of aMCWD and rMCWD anomalies (Fig. S1 and Sect. S1 in the Supplement) we are also able to give absolute estimates for our relative thresholds with aMCWD mm, aMCWD mm and aMCWD mm reflecting moderate, severe and extreme drought stress, respectively. Choosing relative over absolute anomalies enables a direct comparison of MCWD to the other drought indices used in this study. We used the rMCWD anomaly for every analysis conducted in our study. We also estimated seasonal patterns of cumulative water deficit (CWD) by defining rCWD similarly to rMCWD as the relative anomaly of each month's CWD in units of standard deviation.
2.3.2 Calculation of rainfall anomaly index (RAI)
For the rainfall anomaly index, dry-season rainfall was taken as the mean precipitation from July–September following Lewis et al. (2011). Like for the MCWD estimation, we calculated the mean dry-season rainfall from a baseline period of 2000–2010 to investigate the drought impacts of 2005 and 2010, and for 2016 we selected a baseline period from 2000 to 2016 excluding 2005, 2010 and 2016. The relative rainfall anomaly index (rRAI) was estimated as “standardised anomaly” from the baseline period similarly to the rMCWD anomaly calculation. As rRAI only reflects the precipitation anomaly during July and September, it can also be described as a dry-season anomaly.
2.3.3 Calculation of the self-calibrating Palmer Drought Severity Index (scPDSI)
The self-calibrating Palmer Drought Severity Index (scPDSI, Wells et al., 2004) has in recent studies been used to assess the impacts of droughts on the Amazon basin (e.g. Jiménez-Muñoz et al., 2016). It improves the original PDSI by using a self-calibrating procedure based on historical climate data, eliminating the empirically derived climatic characteristics. Next to precipitation, it also takes monthly evapotranspiration ET into account. In our study, we use ET data generated from DOLCE and GLEAM (Sect. 2.4). Additionally, the scPDSI takes soil water capacity as input, which we assumed here as a constant value of 100 mm. scPDSI was estimated using the R package scPDSI (Ruida et al., 2018).
To enable cross-comparison with the rMCWD and rRAI anomalies, we selected identical baseline periods from 2000 to 2010 for the 2005 and 2010 events and from 2000 to 2016 for the 2016 drought event. Again, we used the relative deviation rscPDSI, defined as “standardised anomaly” from the baseline period of monthly scPDSI values as the drought indicator.
2.4 Evapotranspiration datasets
In addition to assuming a constant evapotranspiration of mm for the calculation of MCWD, for the calculation of scPDSI we use the two ET datasets GLEAM and DOLCE. The Global Land Evaporation Amsterdam Model (GLEAM) v3a dataset (Martens et al., 2017) is derived from a set of algorithms incorporating satellite-observed soil moisture, vegetation optical depth, reanalysis air temperature and radiation, and multiple precipitation datasets. The Derived Optimal Linear Combination Evapotranspiration (DOLCE; Hobeichi et al., 2018) dataset is derived by combining and weighting multiple other evapotranspiration datasets, also including GLEAM.
2.5 Calculation of drought area and extent
Each grid cell's area was approximated as a trapezoid to its boundary coordinates (in resolution), resulting in an area between 2900 and 3090 km2 per grid cell. Accumulating the associated areas over all grid cells resulted in a total area of 5.94×10⁶ km2 representing the Amazon basin. Note that for comparison of our results with Lewis et al. (2011), differences in absolute areas arise because of differences in study area size (5.94×10⁶ vs. 5.3×10⁶ km2, respectively). For the calculation of the drought-affected area, we summed up the area of grid cells that matched the respective drought classification (e.g. rMCWD anomaly for extreme drought stress). The spatial agreement of drought location among datasets was estimated by selecting the grid cells matching the drought classification per dataset and subsequently counting the number of datasets per grid cells showing the respective drought classification.
All areas in the following section are expressed as a percentage with respect to the entire Amazon basin according to our delineation (5.94×10⁶ km2). For an overview of the areas affected in millions of square kilometres, see Tables S1 and S2.
3.1 Comparison of total drought area based on the relative MCWD anomaly
We first evaluate differences in rMCWD for 2016 across the datasets (Fig. 1). Here, we find that the spatial patterns of the rMCWD anomaly generally match across the available datasets, showing severe and extreme drought stress mainly in the northern Amazon basin. Only GLDAS diverges, showing extreme drought stress in the central and western part of Amazonia (Fig. 1d), where none of the other datasets show any drought stress during the same year. The other datasets mostly differ in the intensity of the drought stress. While ERA5 and TRMM 7 show values of rMCWD in the Columbian part of the basin, CRUNCEP and GPCC do show such a strong drought impact only in northern Brazil. The absolute areas of drought stress across different severity levels are similar across most datasets with only GLDAS showing a significantly larger area affected by extreme drought stress of rMCWD .
Across all precipitation datasets, in 2005, an area ranging from 37 % to 51 % (mean 45 %) of the whole Amazon basin was moderately affected (Table S1, Fig. 2a). ERA5 displayed the smallest area affected by moderate drought (2.2×10⁶ km2; Table 1, Fig. 2), while CHIRPS and CRUNCEP showed a vast affected area (3.0×10⁶ km2), an area about 36 % larger than displayed by ERA5. For severe and extreme drought conditions, ERA5 shows the smallest affected area with 3 % and 1 % of the basin affected. For severe drought conditions, CRUNCEP suggests that an area approximately 3 times larger was affected compared to ERA5 (0.2×10⁶ vs. 0.6×10⁶ km2). CRUNCEP and GLDAS also encompass the largest area of extreme drought stress (0.2×10⁶ km2; 3 % of the basin less than rMCWD ; Fig. 2a).
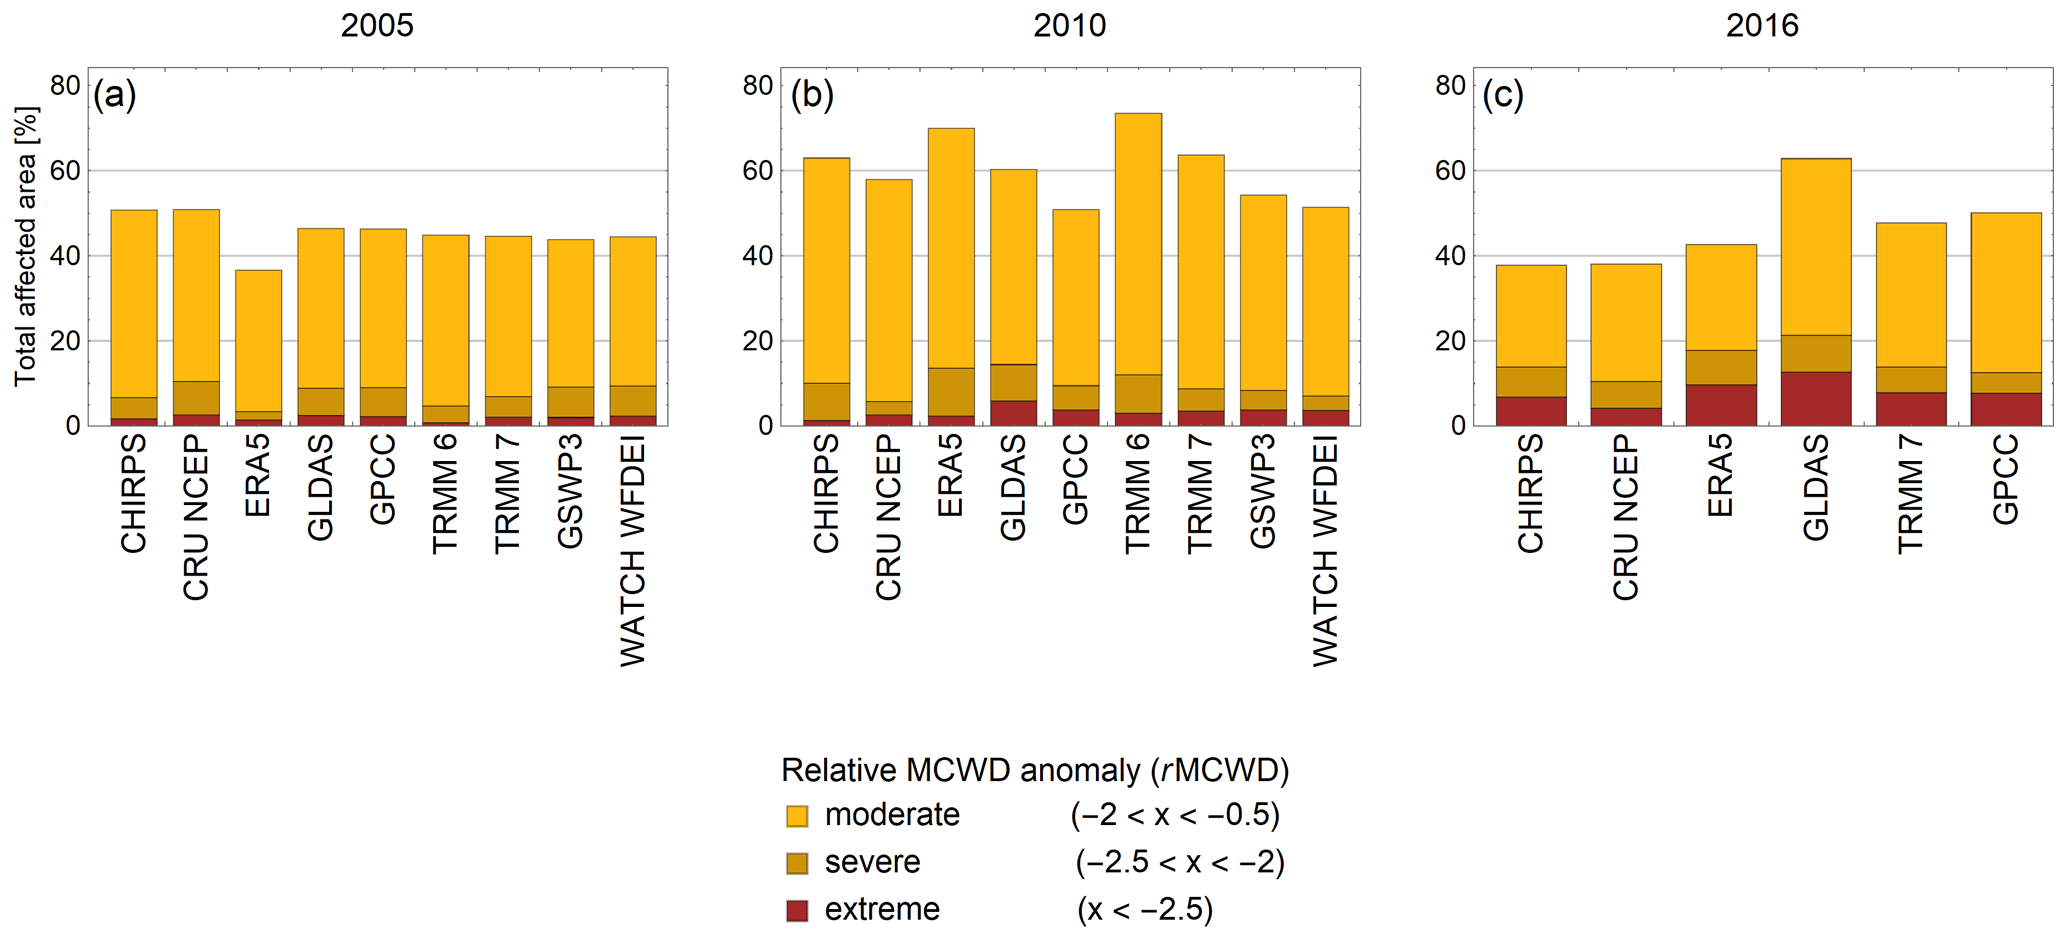
Figure 2Total area of the Amazon basin affected by drought stress (%) according to the relative MCWD anomaly for each of the precipitation datasets. Displayed are the three drought events: (a) 2005, (b) 2010 and (c) 2016. The total area representing the Amazon basin in our study is 5.94×10⁶ km2. For absolute area affected, see Tables S2 and S3.
During the 2010 drought, a larger area ranging between a minimum of 52 % (GPCC) and a maximum of 74 % (TRMM 6) was affected by moderate drought stress, which is about 36 % larger than during the 2005 drought (3.6×10⁶ vs. 2.7×10⁶ km2; Table S1, Fig. 2). In addition, the area under severe drought stress was on average 25 % larger compared to 2005, and the area affected by extreme drought was double the size of the 2005 drought event. Particularly, GLDAS and TRMM 6 showed the largest area affected throughout the three drought classifications (Fig. 2b).
For 2016, two datasets (CHIRPS and CRUNCEP) showed with 38 % a considerably smaller area that was moderately affected by drought stress compared to GLDAS with 63 % of the area affected, respectively (datasets ranging between 2.2×10⁶ and 3.7×10⁶ km2). Generally, in 2016, the size of the area affected by moderate drought was between the size of the area affected in 2005 and 2010, but the extent of severely and extremely drought-affected areas was larger. Here, particularly GLDAS followed by GPCC showed the largest affected area, with 21 % severely affected and 6 % extremely affected (Table S2).
3.2 Spatial agreement of rainfall datasets using the rMCWD anomaly
While the agreement of the total area affected by drought is relatively high (see Sect. 3.1), the datasets only partly agree on the spatial extent and location of extreme drought conditions, particularly during the 2010 and 2016 events (Fig. 3). For 2005, all datasets agree on the drought epicentre being in central Amazonia. Datasets agree that an area of about 15 % of the Amazon basin was at least moderately affected (Fig. 3a). Only a small overlap was found for the area affected by severe and extreme drought stress (Fig. 3b, c). Here, only half of the datasets agreed on 4 % of central Amazonia being severely and 1.5 % being extremely affected.
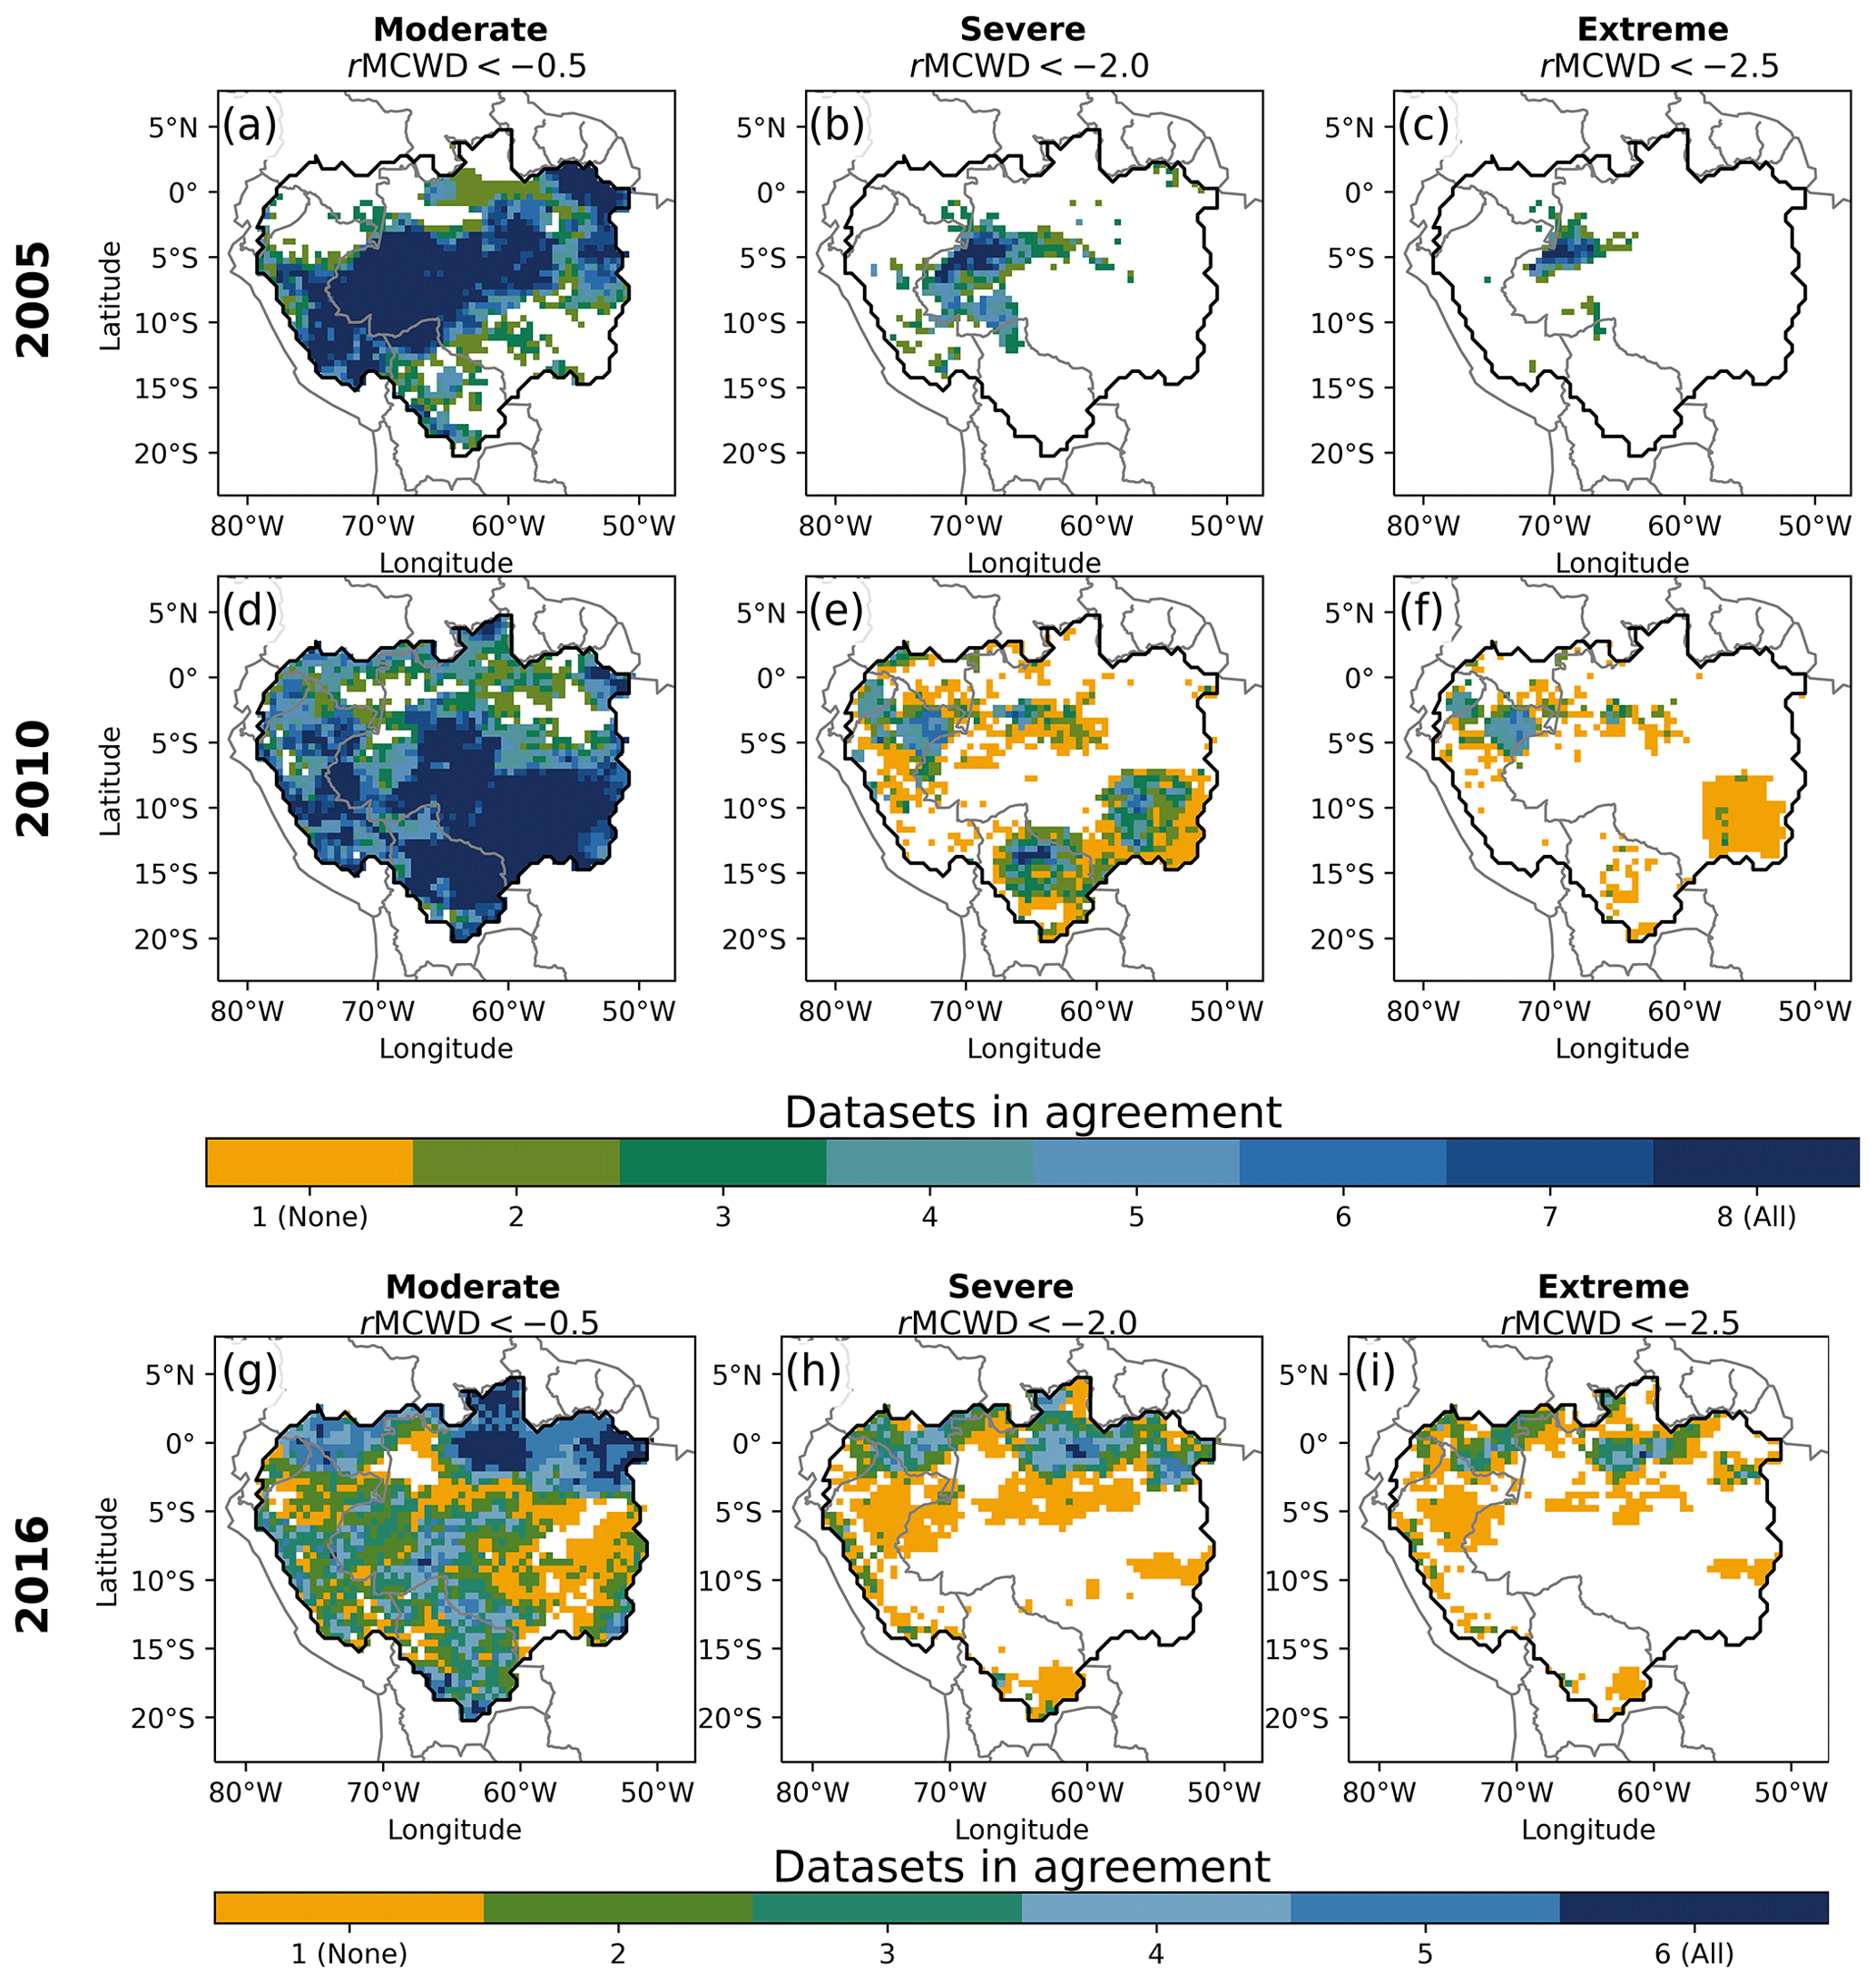
Figure 3Agreement of precipitation datasets on drought area as identified by relative MCWD anomalies. In columns, different levels of drought severity are displayed, and rows show the different drought years: (a–c) 2005, (d–f) 2010 and (g–i) 2016. The colours indicate the number of datasets that agree on a specific drought level in a given pixel. Drought severity levels are defined as moderate (rMCWD ), severe (rMCWD ) and extreme (rMCWD ). Orange pixels indicate areas where only one dataset shows the respective drought stress (no agreement is labelled “None”). White pixels represent areas where no dataset shows any drought signal. Note that in panels (a)–(f), TRMM 6 and GSWP3 were excluded, as they were either very similar to their successor (TRMM 7) or due to a similar reanalysis procedure (WATCH WFDEI). In panels (g)–(i), only six datasets were included which cover the full time period until 2016.
For 2010, all datasets agreed on an affected area of 21 % in the Amazon basin, and half of the datasets agreed on an area of 60 % of the Amazon basin being moderately affected by drought stress (Fig. 3d). The 2010 drought displayed no central hotspot, but rather there are three most affected areas in the eastern, southern and central parts of Amazonia on which most of the datasets agreed (Fig. 3d). Severe drought stress in 2010 was in the southern part of Amazonia, where four datasets agreed (Fig. 3e), while for extreme drought stress almost no overlap between datasets was found (Fig. 3f).
For 2016, all datasets agreed on an area of about 7 % of moderate drought stress, and half of the datasets agreed on 51 % of the basin being affected (Fig. 3g). Agreement for severe and extreme drought stress was lower compared to the other drought years (Fig. 3h, i). Most of the datasets located the epicentre of the drought in the northwestern Amazon basin. Some datasets also showed the south-central part of the basin being severely affected (Fig. 3i).
We could not find any pronounced biases between the precipitation datasets (Figs. S3–S5) but rather a generally higher correlation of the rMCWD anomalies for 2005 compared to 2010 and 2016. Only ERA5 and GLDAS showed some spikes in the rMCWD anomalies that are located within the high-latitude regions of the Andes.
3.3 Constant vs. varying evapotranspiration rates: effects on drought severity and extent estimates
We find that assuming a constant ET rate of 100 mm per month is only realistic in the northern part of the Amazon basin and only when compared to the DOLCE dataset (Fig. 4a, b), which shows ET rates of about 100 mm per month during both the wettest (as averaged between June and August) and the driest months (as averaged between January and March). Using GLEAM, average ET rates are between 30 % and 50 % higher than 100 mm per month during the wettest months (Fig. 4c) and remain higher than 100 mm per month also in the northern part during the dry season (Fig. 4f). Evapotranspiration rates can be as low as 50 mm per month on average throughout the driest months for both ET datasets in the south of the basin (Fig. 4b and f).
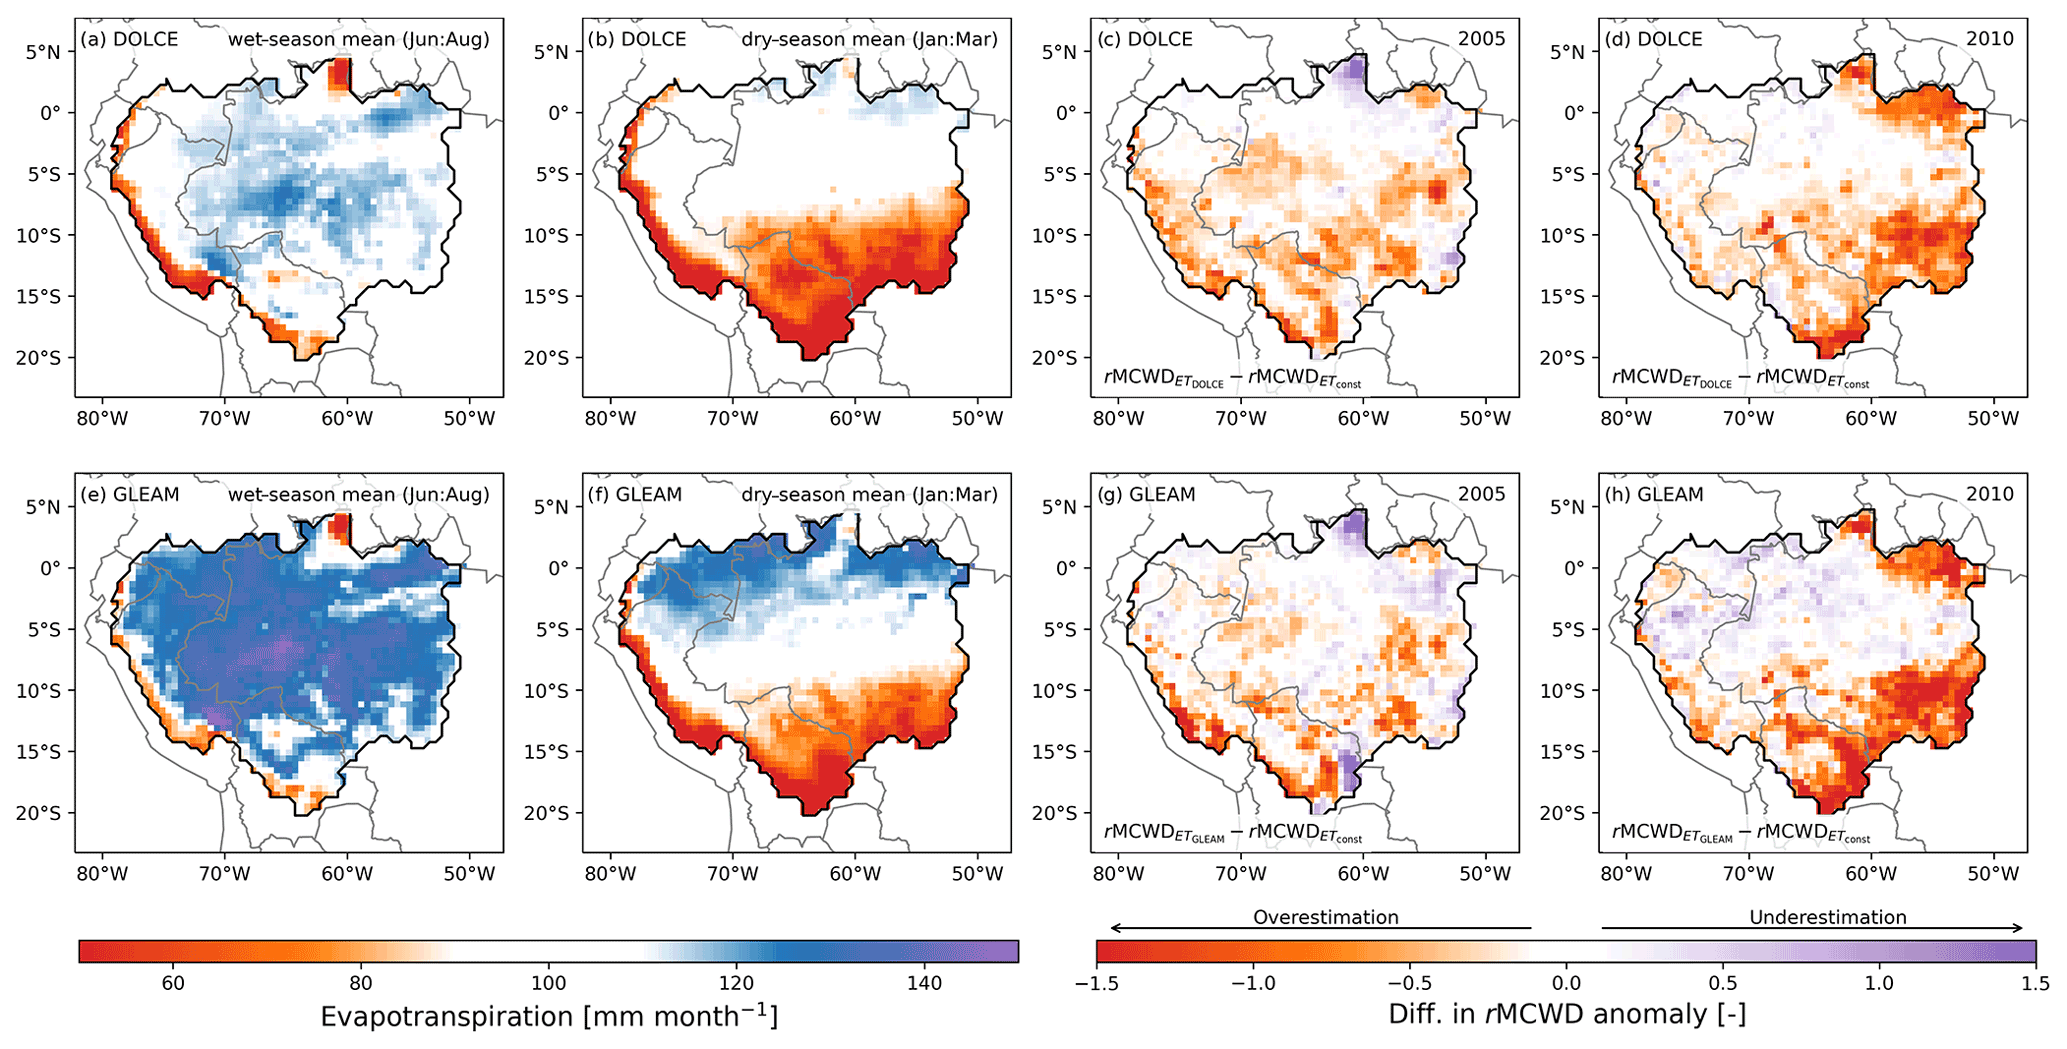
Figure 4(a, b, e, f) Spatial pattern of ET for the dry and wet season for the DOLCE and GLEAM datasets and the differences between using the two ET datasets to calculate the rMCWD anomaly and the rMCWD based on the assumption of constant ET =100 mm per month for (c, g) 2005 and (d, h) 2010. Wet- and dry-season ET is calculated as a mean from June to August and January to March, respectively. Negative (positive) differences in the rMCWD anomalies indicate an overestimation (underestimation) of drought stress when using ET =100 mm per month compared to the respective evapotranspiration dataset.
This spatial heterogeneity in evapotranspiration rates has implications for the extent and severity of drought stress expressed as the rMCWD anomaly when compared to using constant evapotranspiration. Using the two evapotranspiration datasets we find lower drought impacts across most parts of the Amazon basin for the 2 years of 2005 and 2010 (Fig. 4c, d, g, h). In 2005 the mean area of moderate drought stress was lower when using variable ET: 44 % of the basin for GLEAM and 39 % for DOLCE, compared 46 % for a constant ET. Interestingly, these differences were not particularly located in the epicentre of drought during that year (see Fig. 3a, b, c) but rather in the south and the high-latitude regions toward the Andes (Fig. 4c, g). The total area of severe drought stress did only slightly decrease from 9 % (constant ET) to 8 % (GLEAM) and 7 % (DOLCE). In 2010, we find stronger differences between variable and constant ET. The area of moderate drought stress is 52 % for GLEAM and 49 % for DOLCE, which is significantly lower than the 60 % when using constant evapotranspiration. For this year the areas of these differences (Fig. 4d, h) strongly overlap with the epicentres of the drought (see Fig. 3d, e, f). Consequently, also the areas of severe drought stress are lower (7 % for GLEAM, 8 % for DOLCE) compared to using constant evapotranspiration (12 %). We find similar patterns for 2016 (not shown), where the mean area of severe drought stress is approximately 11 % for both GLEAM and DOLCE, which is lower compared to using constant ET (15 %).
3.4 Comparison of drought indices: rMCWD, rscPDSI and rRAI anomalies
Similar to rMCWD, there is variable agreement among datasets when evaluating the other two drought metrics, rRAI and rscPDSI (Fig. 5). The largest dry-season anomaly (rRAI) in 2005 was displayed by GPCC with 6.5 % (0.4×10⁶ km2; Table 2), followed by TRMM 7 with 5.7 % of the Amazon basin being severely affected. ERA5 showed with 3 % the smallest area affected. In 2005, spatial patterns of rRAI matched with rMCWD anomalies despite rMCWD anomalies showing a larger area affected by severe drought stress (Fig. 5a, d). rscPDSI displayed the smallest area affected by drought stress in 2005 also with GPCC and TRMM 7 showing the largest severely affected area with 5.5 % and 3.1 %, respectively. All other datasets showed less than 1 % of severely drought-affected areas in 2005. The small spatial area of rscPDSI differed compared to the other two drought indicators (Fig. 5a, d, g): some areas showed a strong disagreement between drought indices; e.g. central Amazonia was hit by severe drought stress according to rMCWD and rRAI (with three to four climate datasets in agreement), while, in contrast, rscPDSI did not indicate abnormally dry conditions there.
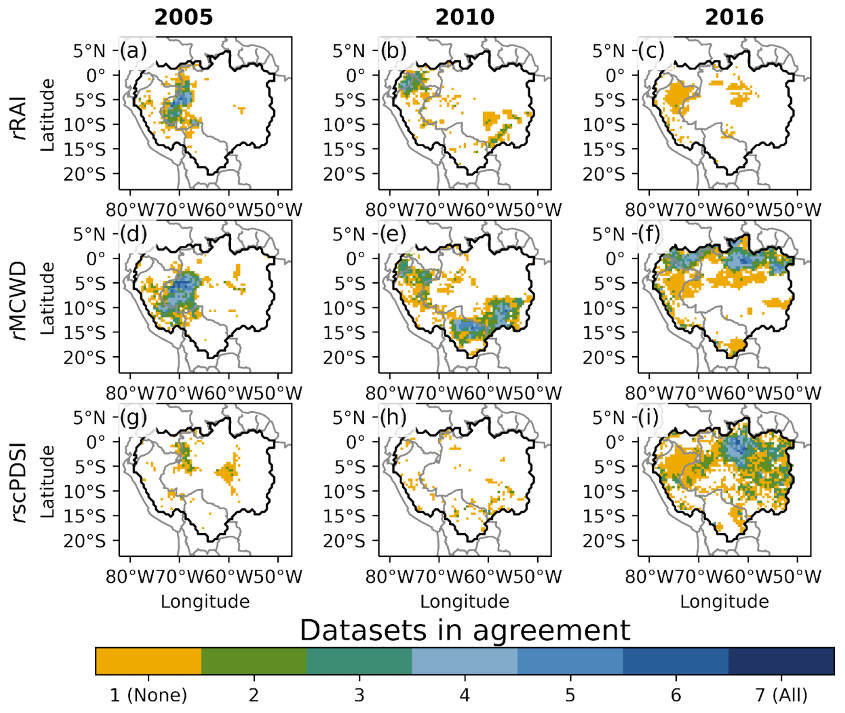
Figure 5Agreement of precipitation datasets on drought area as identified by different drought metrics. Comparison of the Amazon drought events in 2005, 2010 and 2016 (columns) vs. three different drought indexes (rows): (a–c) rMCWD, (d–f) rscPDSI and (g–i) rRAI. Only the area affected by severe drought stress is displayed, which is defined equally for each of the drought indices. Orange pixels indicate areas where only one dataset shows the respective drought stress (“None”). White pixels represent areas where no dataset shows any drought signal.
Table 2Fraction of overall variability in rMCWD anomaly based on precipitation datasets, drought indicators and evapotranspiration datasets.

In 2010, the differences in drought-affected areas were even more pronounced between the three indices (Fig. 5b, e, h). Here, ERA5 and TRMM 7 showed the largest areas affected by severe drought stress based on the dry-season rRAI anomaly with 7 % and 5 %, respectively. Using rscPDSI all datasets showed an area between 1 % and 2.5 % being severely affected. Interestingly, the area affected based on rMCWD roughly encompasses the area affected by rRAI but additionally shows a large area in the southeastern part of the basin being affected by severe drought stress (Fig. 5b, e).
In 2016, rscPDSI shows the largest area affected by drought stress with GLDAS showing 39 % (followed by TRMM 7, 16 %) of the basin being severely affected. Four datasets agreed on the affected area in the northeastern part of the basin (Fig. 5i). Only one dataset (GLDAS) showed severe drought stress in 2016 when calculating dry-season rainfall anomalies (rRAI, Fig. 5c), indicating no pronounced anomalies in dry-season rainfall according to all other datasets. rMCWD and rscPDSI roughly agreed on the northern part of the basin being severely affected (Fig. 5f, i).
Average seasonal patterns are quite consistent across datasets but differ depending on the choice of drought index and drought event (Fig. 6). The strongest (most negative) rainfall anomaly was visible from May to July during the 2005 drought event (Fig. 6a). Accumulating such low rainfall estimates resulted in very low values of rCWD during that period (Fig. 6d) in 2005. rscPDSI values were also low but more constant throughout the year (Fig. 6g).
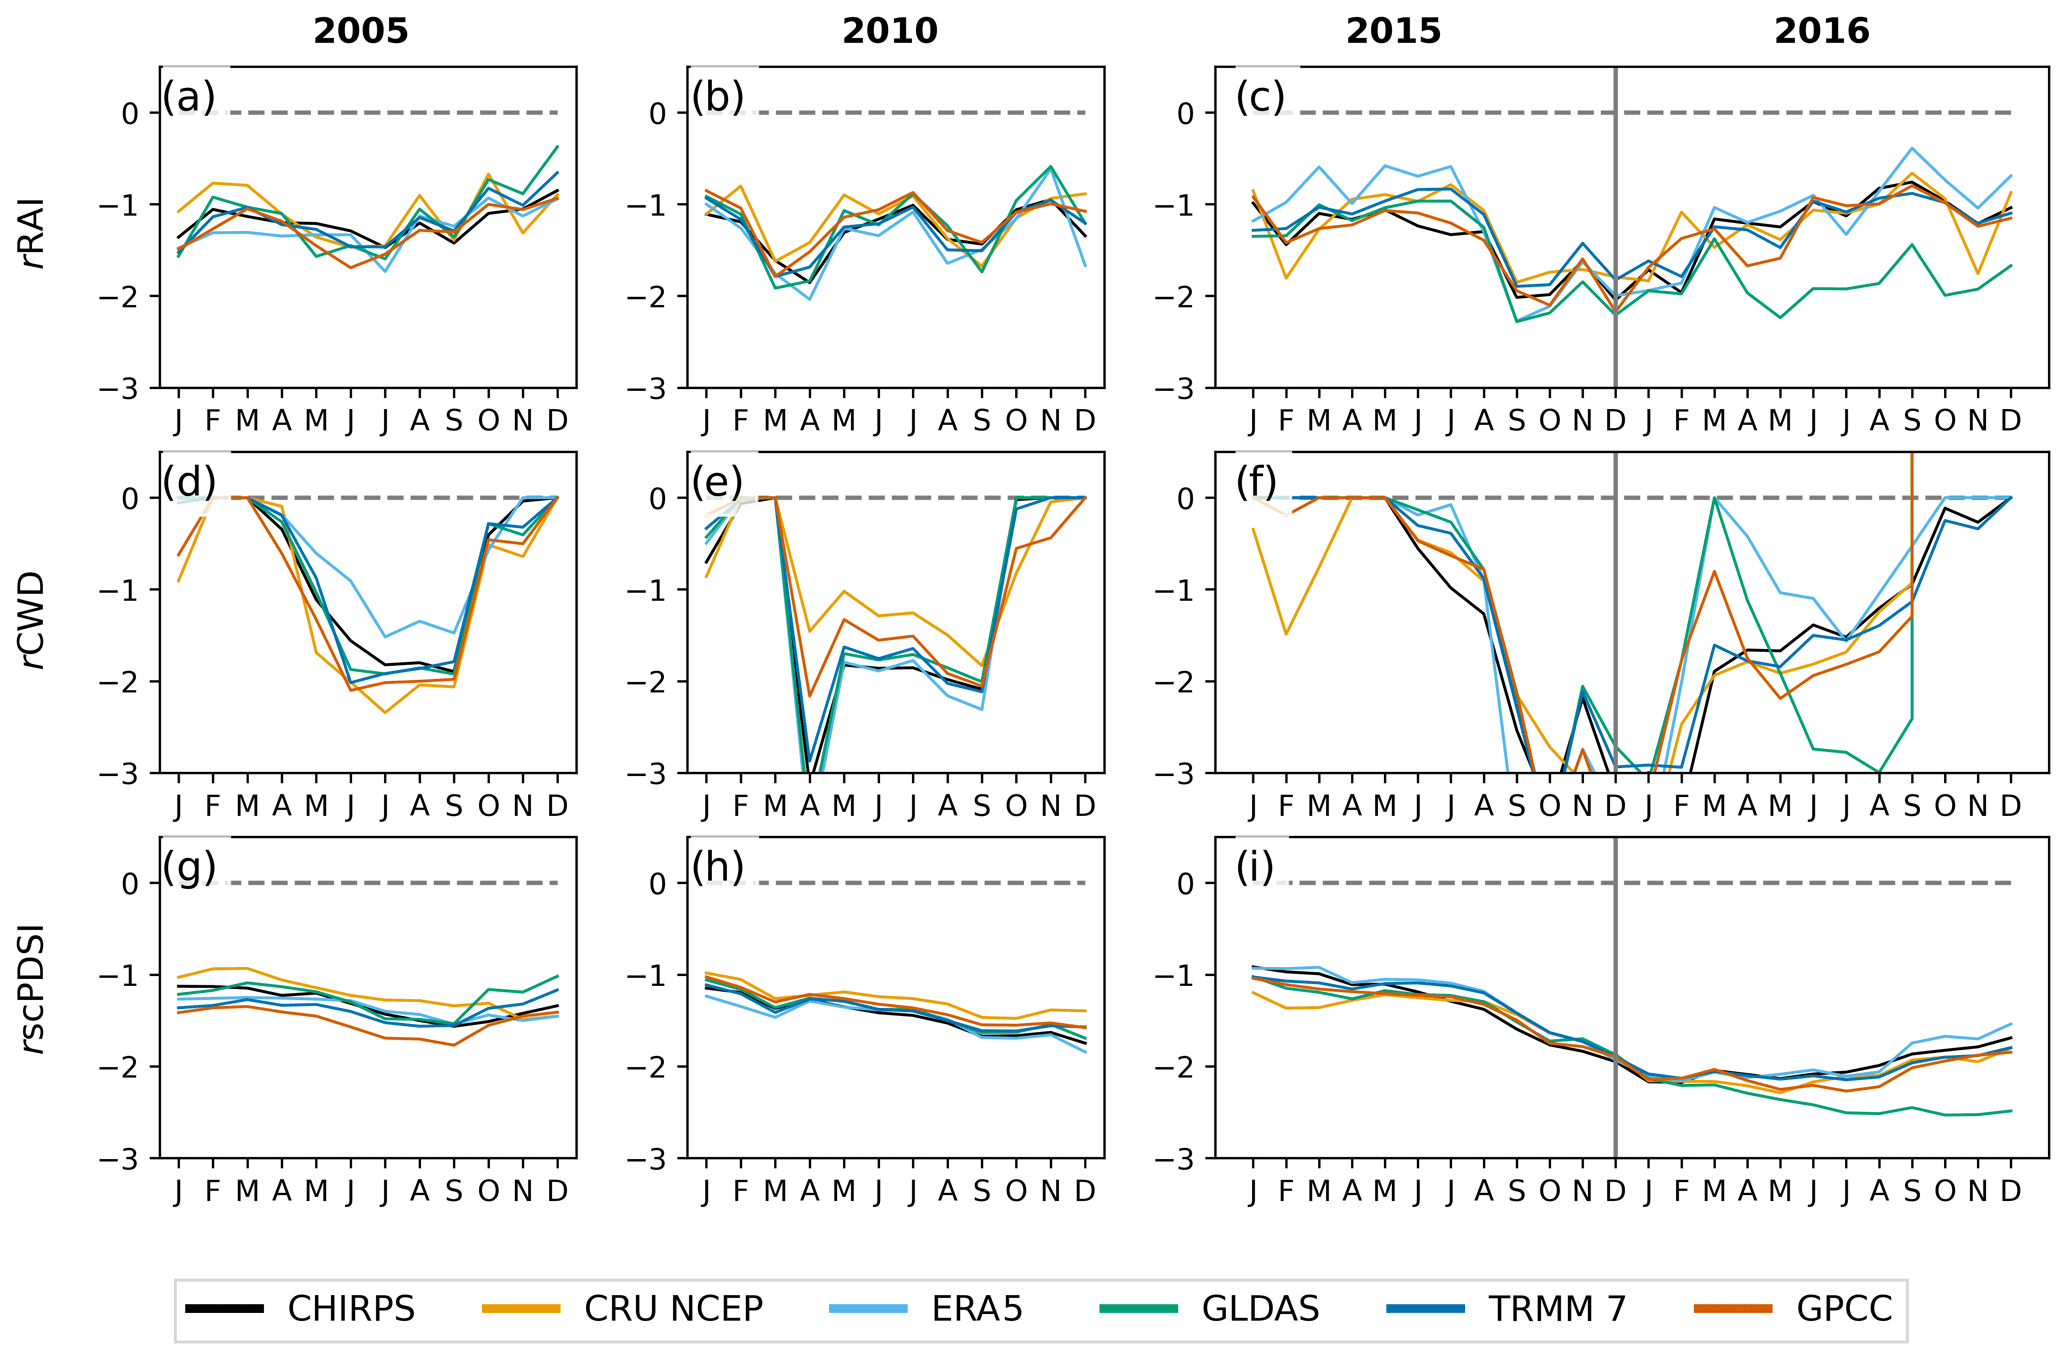
Figure 6Monthly development of the Amazon drought events in 2005, 2010 and 2016 (columns) as described by the three different drought indices (rows): (a–c) rMCWD, (d–f) rscPDSI and (g–i) relative rainfall anomaly (rRAI). Coloured lines indicate the indices of the 10th percentile of all grid cells of each of the different precipitation datasets. The indices are estimated as the relative deviation from a 2001 to 2016 baseline period for each month.
The 2010 drought followed similar patterns regarding rRAI with a lower absolute impact during May to July compared to 2005 (Fig. 6b). Interestingly, the wet-season months March to May showed a strong anomaly during 2010 compared to the 2005 event. Subsequently, rCWD was also already lower during the wet season in 2010 compared to 2005 (Fig. 6e). rscPDSI anomalies values were similar for 2010 compared to 2005 with a slight downward trend towards the end of the year (Fig. 6g, h).
To investigate the seasonal patterns of 2016, we also considered the drought indices of 2015, since both years were El Niño years. We found a strong rainfall anomaly already starting during September 2015 continuing until April 2016 (Fig. 6c). Consequently, also rCWD values were very low during that period (Fig. 6f). While rMCWD was applied as the maximum value from October to September, drought stress before October of the previous year cannot be accounted for when using rMCWD. The 2-year drought impact was also visible using scPDSI (Fig. 6i), showing a steady decline from 2015 to 2016.
3.5 Overall variability: precipitation datasets vs. drought indices vs. evapotranspiration datasets
When assessing the variability in drought severity and extent across the nine different precipitation datasets, the two drought indices (rMCWD and rscPDSI) and the two evapotranspiration datasets (DOLCE and GLEAM), we find that across all drought events the choice of drought index accounts for roughly 60 % of the variability, while both the precipitation dataset and the evapotranspiration dataset account for 20 % each (Table 2).
We assessed the severity and spatial extent of the extreme drought years 2005, 2010 and 2015/16 in the Amazon region by computing different drought indices using a range of precipitation datasets. When analysing how drought conditions are captured in nine different precipitation datasets for the Amazon basin, we find that while the datasets mostly agree on the extent of the drought area, they differ in their location of drought
4.1 Critical aspects regarding the detection of drought events in the Amazon basin
4.1.1 Drought indices
The idea of defining water deficit based on evapotranspiration rates goes back to Stephenson (1998), and the MCWD is now one of the most widely used indicators to assess drought stress in tropical forests (Lewis et al., 2011; Phillips et al., 2009; Esquivel-Muelbert et al., 2019). In its simplest form the calculation of MCWD only requires precipitation data and assumes a constant evapotranspiration (ET) rate of 100 mm per month (Aragão et al., 2007). Although the simplicity of rMCWD and aMCWD is a main advantage, a fixed ET (which we also used in our study) is inappropriate for regions other than the lowland tropics, where the lower supply of energy may result in lower ET values. Most importantly, an approximated ET does not account for either seasonal variation (driven mainly by radiation, temperature and phenology) or spatial variation in ET related to soil and root properties (Malhi et al., 2009). Hence, changes in rMCWD purely account for changes in rainfall (Phillips et al., 2009). In contrast, scPDSI is driven with spatially and temporally resolved evapotranspiration data. However, currently available evapotranspiration products for the Amazon rainforest show significant differences in areas and extent of evapotranspiration (Sörensson and Ruscica, 2018), hence introducing another source of uncertainty when using them for the calculation of drought indices. In the last decade, better products of spatially and temporally resolved evapotranspiration data (e.g. ERA5) have been developed, and an increasing number of studies are now estimating MCWD based on such data (e.g. Staal et al., 2020). However, using a constant evapotranspiration (ET) rate of 100 mm per month across the Amazon rainforest is still very common (e.g. Flack-Prain et al., 2019; Koch et al., 2021).
Using variable evapotranspiration consistently reduced the moderately drought-affected area by 5 %–10 % per drought event (Fig. 4). Extending the baseline period of the MCWD calculation to include also years before 2001 leads to overall lower MCWD values and, hence, an increased intensity of the three drought events. This finding highlights the drought anomaly that the recent decade from 2001 to 2016 has compared to the years before that period.
The key difference between the three drought indices applied in our study is the temporal resolution: RAI is only calculated for the three driest months (July–September), and thus, for example, a rainy season with deficient rainfall is not captured. MCWD, in contrast, accumulates over 12 months and is reset to zero at the end of the hydrological year. In this way, drought events caused by low precipitation in both dry and rainy seasons are captured; however, drought events lasting for more than a year are not detected. scPDSI captures multi-year drought events and is not reset to zero at the end of the hydrological year.
These differences between the drought indicators can be seen for the three drought events analysed in this study. For 2005, rRAI and rMCWD values roughly match in location of the epicentre, indicating a particularly strong anomaly during the dry season (Fig. 5a, d). This does not apply to the 2010 drought event, where despite some dry-season anomalies an even stronger anomaly during the wet season is visible (Fig. 6b, e). The 2015/16 drought event is classified as a severe multi-year drought according to Yang et al. (2018), which is also displayed in our analysis when using rscPDSI (Fig. 6i). rMCWD and rRAI, however, do not agree on a spatially and temporally extensive drought event in 2016 (Fig. 5c, f, i) but instead display distinct regions of severe drought stress. Seasonal patterns of the three drought indices support this assumption (Fig. 6): resetting rMCWD once per year neglects any influences from drought events of the preceding year (Fig. 6c). While the drought indices used in this study showed pronounced differences in spatial and temporal dynamics, including all of them can help better understand the different characteristics that drought events can have in the Amazon basin.
A common drawback of all drought metrics used in our study is their incapability to explicitly represent the effect of increasing atmospheric vapour pressure deficit (VPD) on plant water stress. A steady amplification of atmospheric vapour pressure deficit (VPD) has been detected over the Amazon basin (Barkhordarian et al., 2019; Rifai et al., 2019). Such stronger atmospheric water demand leads to additional water loss of plants during drought, subsequently increasing the severity of droughts. Hence, the role of VPD during a drought and as a driver for plant stress should not be underestimated (Grossiord et al., 2020). With increasing data availability and better estimates of VPD across the Amazon region, it should be included in future drought assessments (Castro et al., 2020). One possibility for accounting for the influences of VPD is choosing temporally and spatially resolved evapotranspiration instead of constant evapotranspiration in the calculation of MCWD. Future studies could further investigate the relationships between MCWD, ET and VPD and the impacts on biomass.
Furthermore, in the last decade, new methods have been developed that assess impacts of drought on ecosystems; e.g. analyses based on solar-induced fluorescence (SIF) data show that tall forests are less sensitive to rainfall compared to short forests (Giardina et al., 2018). Also, vegetation optical depth (VOD), used as a proxy for water content in forests, is a promising satellite-derived indicator of mortality and impacts of droughts on forests (Rao et al., 2019). However, conducting analyses over the Amazon rainforest based on VOD is difficult because of the limited penetration depth of microwaves in dense tropical forests (Chaparro et al., 2019) and the influences of vegetation water status (Xu et al., 2021). So far, VOD data could only be applied with limited success across tropical rainforests (Konings and Gentine, 2017). Future studies should estimate the impacts of droughts based on multiple drought characteristics. For example, Toomey et al. (2011) show that considering both heat stress and soil moisture stress greatly improves the explanatory power of drought impacts in the Amazon basin.
4.1.2 Precipitation datasets
For the three drought events in 2005, 2010 and 2016, CHIRPS, GLDAS and ERA5 diverted the most from the other datasets regarding the spatial drought extent. ERA5 shows the smallest area of moderate drought stress during 2005 but one of the largest areas in 2010 (Fig. 2). We found no obvious bias between the precipitation datasets regarding distribution and frequency of monthly rainfall (Fig. S2), with only ERA5 showing higher rainfall more frequently. Although TRMM 7 and CHIRPS are based on the same satellite data as their input, they differ regarding the size of the drought area, especially during 2016 (Fig. 2). Lewis et al. (2011) estimated an area of 47 % (2.5×10⁶ km2) of the Amazon basin moderately affected in 2005 using the TRMM 6 dataset, which compares well with the size of the affected area for most datasets analysed in our study (considering our 0.6×10⁶ km2 larger study area; see Sect. 2). For 2010, Lewis et al. (2011) reported an area of 3.2×10⁶ km2 being affected in comparison to 4.5×10⁶ km2 in our analysis using TRMM 6 with very similar spatial patterns. The newer product, TRMM 7, however, shows less frequent rainfall but heavier rainfall than CHIRPS, maintaining a similar total amount of precipitation (Giles et al., 2020). Also, both versions (TRMM 6 and TRMM 7) differ regarding the total area affected by drought stress in 2005 and in particular in 2010, where TRMM 6 showed a 10 % larger area of the Amazon basin affected. This can be explained by the generally higher precipitation rates detected in the TRMM 7 dataset in comparison to TRMM 6 (Seto et al., 2011), leading to lower absolute values of rMCWD. Spatially, this difference was most pronounced in the western and northern parts of Amazonia, in the states of Acre and Roraima, and in Peru. Because of such higher precipitation rates in TRMM 7 as compared to TRMM 6 and subsequently the much stronger drought response according to our analysis, studies based on TRMM 6 only might overstate the actual drought conditions and should be revisited. Precipitation datasets usually show remarkable differences in the representation of occurrence, frequency, intensity and location of events, mainly due to their nature of high spatial and temporal variability (Covey et al., 2016; Dirmeyer et al., 2012). Generally, the sparse network of observations in the Amazon rainforest may explain the differences across precipitation datasets and drought indices for datasets that rely on station data. Within the last decade, the number of observations increased, due to a new denser network of stations. This may improve the reanalysis models that are used for several precipitation datasets applied here; however, it does not improve datasets that only rely on gauge observations. Bias correction is also applied different across precipitation datasets. CRUNCEP and WATCH WFDEI use two different gridded bias-correction inputs, while the simulated precipitation fields of ERA5 do not use any bias corrections. Different datasets that are used for bias corrections can give very different results on regional scales (Doblas-Reyes et al., 2021).
Jiménez-Muñoz et al. (2016) quantified drought extent using scPDSI and found that 40 %, 25 % and 10 % of the Amazon basin were affected by moderate, severe and extreme drought stress, respectively, in March 2016. While we did not evaluate scPDSI directly but focused on rscPDSI to allow for a better cross-comparison to the other drought indicators, we found similar patterns for moderate drought stress (47 % of the basin affected) but different patterns under severe (11 %) and extreme (1 %) drought stress when evaluating rscPDSI using the ERA5 dataset. Our estimation diverted from the results of Jiménez-Muñoz et al. (2016) not only because of our different drought classification but also due to a different reference area (see Sect. 2).
In addition, Jiménez-Muñoz et al. (2016) used spatially resolved information on soil water capacity when calculating scPDSI and a longer baseline period (onset year is 1979 in their study vs. 2000 in our study). Furthermore, the choice of the precipitation dataset plays an important role. Compared to the datasets considered in our study, ERA5 showed the weakest drought impact during the 2016 drought event. GLDAS and TRMM 7 showed a much stronger drought impact with over 70 % of the area moderately and between 15 % and 39 % severely affected (Table S2). This is particularly interesting because recent studies identify TRMM 7, CHIRPS and ERA5 as the best precipitation datasets when compared to gauge observations in South America (Albergel et al., 2018; Burton et al., 2018; Rifai et al., 2019). The higher scPDSI variability across the precipitation datasets can be explained with the more complex algorithm (including the self-calibrating mechanism) the index has compared to MCWD and RAI.
4.1.3 Evapotranspiration datasets
Using a dataset with variable ET instead of a constant ET of 100 mm per month leads to smaller areas affected by drought stress depending on the year and drought location (Fig. 4). According to our findings using a constant ET of 100 mm per month introduces not only a change in drought-affected areas but also a bias, as drought intensity and spatial extent are consistently higher for all drought years. The reason for this bias lies within the calculation of MCWD, which computes stronger deficits for higher values of ET (e.g. 100 mm per month) than for lower values (e.g. 50 mm per month) during months with low precipitation. This bias can be rather small during drought events that are located in the northern, wetter parts of the basin (as in 2005), but it can also be quite strong for droughts that are located in the southern parts which have a more pronounced dry season (as in 2010).
4.2 Implications for drought impact analyses in the Amazon rainforest
Drought leads to increased tree mortality and carbon losses in tropical forests (Hubau et al., 2020; Lewis et al., 2011; Phillips et al., 2009). With the prospect of more severe and frequent droughts in a future climate, more precise estimates of how much carbon is lost from reductions in growth and drought-induced mortality are necessary. Currently, the Amazon rainforest is acting as a carbon sink, thereby removing CO2 from the atmosphere, but with more frequent and severe drought events, this sink is already declining (Hubau et al., 2020). Lewis et al. (2011) estimated a total loss of biomass for the Amazon basin in 2005 of 1.6 PgC and a 38 % more severe impact of 2.2 PgC for 2010 based on TRMM 6. Using TRMM 7 instead of TRMM 6 and using variable ET would likely decrease the impact of the 2010 drought on vegetation carbon as calculated in Lewis et al. (2011).
The affected areas (Fig. 2) for the drought events might be underestimated, as (1) the total duration of the 2016 drought was longer than 12 months (see the above paragraph and Fig. 6) and can hence not be fully captured by the standard 12-month period of the aMCWD and rMCWD calculation used in this study and (2) potential lag effects due to delayed plant mortality within the subsequent years are not considered so far. We would recommend for future studies to investigate the relationship of biomass losses with other drought indices (such as scPDSI) in a similar manner as done in Lewis et al. (2011). As the biomass of the Amazon rainforest is heterogeneously distributed (e.g. Saatchi et al., 2011), large-scale drought-induced biomass losses which result from a severe aMCWD anomaly should be interpreted carefully. Differences in the amount of biomass in different forest types, species compositions and critical hydraulic processes should be considered when estimating potential biomass losses under drought stress (Feldpausch et al., 2016). A step forward would be to use, for example, remotely sensed biomass maps to account for regional biomass distributions (e.g. Avitabile et al., 2016) or to simulate drought impacts with dynamic global vegetation models (DGVMs). DGVMs simulate the carbon and water cycle of the biosphere in a process-based way, accounting for the interplay of carbon uptake and water loss through stomatal opening; evapotranspiration (ET); carbon assimilation via photosynthesis; and carbon allocation to different plant compartments such as leaves, wood and roots (e.g. Schaphoff et al., 2018; Smith et al., 2014). The simulated response of tropical forests in DGVMs is particularly sensitive to precipitation input under present and future climate change scenarios (e.g. Seiler et al., 2015). Therefore, we recommend using multiple climate forcing datasets to test for climate data uncertainty also under present climate conditions. Particularly, studies based on TRMM 6 should possibly be revisited and complemented with more forcing datasets for their analysis.
We find substantial variation in the spatial extent, location and timing of the extreme drought events in the years 2005, 2010 and 2016 in the Amazon basin. Depending on the precipitation dataset and drought index used, the area affected by severe (extreme) drought varied between 0 % and 39 % (0 % and 13.7 %) for the 2016 event. Especially the area under severe drought conditions changed from almost no severe drought stress (five out of six datasets) when using rRAI to greater than 10 % when using rMCWD and rscPDSI instead. The variation partly results from the application of different drought metrics (rMCWD, rRAI and rscPDSI) and from differences in the underlying precipitation datasets. Such differences also propagate when quantifying the impacts of droughts on the carbon cycle of the Amazon rainforest and result in a large variability in biomass carbon losses for a particular drought year. The estimated intensity of droughts depends predominantly on the selected drought indicator and to a lesser extent on the choices of precipitation and evapotranspiration dataset.
We, therefore, recommend applying several drought metrics; climate (precipitation) datasets; and, if available, evapotranspiration datasets to account for model uncertainty when assessing the spatial extent, duration and location of droughts. We regard it as an important step when assessing drought impacts on tropical rainforests also under current climate conditions. Communicating the uncertainty in the estimation of drought events and their impacts on the Amazon rainforest is highly relevant, and thus, multiple datasets should be applied by any large-scale study on drought impacts on vegetation.
All scripts to reproduce analysis and figures are available at https://github.com/PhillipPapastefanou/DroughtAnalysis (Papastefanou, 2021).
CHIRPS can be accessed from ftp://ftp.chg.ucsb.edu/pub/org/chg/products/CHIRPS-2.0/ (Climate Hazards Group, 2020). CRUNCEP can be accessed from https://crudata.uea.ac.uk/cru/data/ncep/ (CRU – NCEP/NCAR Reanalysis, 2020). ERA5 can be accessed from https://www.ecmwf.int/en/forecasts/datasets/reanalysis-datasets/era5 (European Centre for Medium-Range Weather Forecasts, 2020). GLDAS can be accessed from https://ldas.gsfc.nasa.gov/gldas/forcing-data (Rodell and the NASA Goddard Space Flight Center, 2020). TRMM 6 and 7 can be accessed from https://disc.gsfc.nasa.gov/datasets/ (Huffman and Bolvin, 2019). GPCC can be accessed from https://opendata.dwd.de/climate_environment/GPCC/html/download_gate.html (Schneider et al., 2019). WATCH WFDEI can be accessed from ftp://rfdata:forceDATA@ftp.iiasa.ac.at (Hadley Centre for Climate Prediction and Research, 2019). DOLCE can be accessed from https://researchdata.edu.au/derived-optimal-linear-dolce-v30/1697055 (Hobeichi, 2022). GLEAM can be accessed from https://www.gleam.eu/datasets (Martens et al., 2019).
The supplement related to this article is available online at: https://doi.org/10.5194/bg-19-3843-2022-supplement.
PP and AR conceived the study and wrote the first draft of the manuscript. PP manipulated the data and conducted the analysis. PP, CZ, ZA, AAC, JCJ, LFCR, RR, BS, AS, KT, CV, NV, CR and AR contributed to the development of the analysis and the writing of the manuscript.
The contact author has declared that none of the authors has any competing interests.
Publisher’s note: Copernicus Publications remains neutral with regard to jurisdictional claims in published maps and institutional affiliations.
This research has been supported by the Bundesministerium für Bildung und Forschung (grant no. 01LP1610A).
This paper was edited by Eyal Rotenberg and reviewed by two anonymous referees.
Albergel, C., Dutra, E., Munier, S., Calvet, J.-C., Munoz-Sabater, J., de Rosnay, P., and Balsamo, G.: ERA-5 and ERA-Interim driven ISBA land surface model simulations: which one performs better?, Hydrol. Earth Syst. Sci., 22, 3515–3532, https://doi.org/10.5194/hess-22-3515-2018, 2018.
Aragão, L. E. O. C., Malhi, Y., Roman-Cuesta, R. M., Saatchi, S., Anderson, L. O., and Shimabukuro, Y. E.: Spatial patterns and fire response of recent Amazonian droughts, Geophys. Res. Lett., 34, L07701, https://doi.org/10.1029/2006GL028946, 2007.
Avitabile, V., Herold, M., Heuvelink, G. B. M., Lewis, S. L., Phillips, O. L., Asner, G. P., Armston, J., Ashton, P. S., Banin, L., Bayol, N., Berry, N. J., Boeckx, P., Jong, B. H. J., DeVries, B., Girardin, C. A. J., Kearsley, E., Lindsell, J. A., Lopez-Gonzalez, G., Lucas, R., Malhi, Y., Morel, A., Mitchard, E. T. A., Nagy, L., Qie, L., Quinones, M. J., Ryan, C. M., Ferry, S. J. W., Sunderland, T., Laurin, G. V., Gatti, R. C., Valentini, R., Verbeeck, H., Wijaya, A., and Willcock, S.: An integrated pan-tropical biomass map using multiple reference datasets, Glob. Change Biol., 22, 1406–1420, https://doi.org/10.1111/gcb.13139, 2016.
Barkhordarian, A., Saatchi, S. S., Behrangi, A., Loikith, P. C., and Mechoso, C. R.: A Recent Systematic Increase in Vapor Pressure Deficit over Tropical South America, Sci. Rep., 9, 15331, https://doi.org/10.1038/s41598-019-51857-8, 2019.
Blacutt, L. A., Herdies, D. L., de Gonçalves, L. G. G., Vila, D. A., and Andrade, M.: Precipitation comparison for the CFSR, MERRA, TRMM3B42 and Combined Scheme datasets in Bolivia, Atmos. Res., 163, 117–131, https://doi.org/10.1016/j.atmosres.2015.02.002, 2015.
Burton, C., Rifai, S., and Malhi, Y.: Inter-comparison and assessment of gridded climate products over tropical forests during the 2015/2016 El Niño, Philos. T. Roy. Soc. B, 373, 20170406, https://doi.org/10.1098/rstb.2017.0406, 2018.
Cai, W., Santoso, A., Wang, G., Yeh, S.-W., An, S.-I., Cobb, K. M., Collins, M., Guilyardi, E., Jin, F.-F., Kug, J.-S., Lengaigne, M., McPhaden, M. J., Takahashi, K., Timmermann, A., Vecchi, G., Watanabe, M., and Wu, L.: ENSO and greenhouse warming, Nat. Clim. Change, 5, 849–859, https://doi.org/10.1038/nclimate2743, 2015.
Castro, A. O., Chen, J., Zang, C. S., Shekhar, A., Jimenez, J. C., Bhattacharjee, S., Kindu, M., Morales, V. H., and Rammig, A.: OCO-2 Solar-Induced Chlorophyll Fluorescence Variability across Ecoregions of the Amazon Basin and the Extreme Drought Effects of El Niño (2015–2016), 12, 1202–1202, https://doi.org/10.3390/rs12071202, 2020.
Chaparro, D., Duveiller, G., Piles, M., Cescatti, A., Vall-llossera, M., Camps, A., and Entekhabi, D.: Sensitivity of L-band vegetation optical depth to carbon stocks in tropical forests: a comparison to higher frequencies and optical indices, Remote Sens. Environ., 232, 111303, https://doi.org/10.1016/j.rse.2019.111303, 2019.
Climate Hazards Group: Climate Hazards Group Infrared Precipitation with Stations, Department of Geography, University of California at Santa Barbara [data set], ftp://ftp.chg.ucsb.edu/pub/org/chg/products/CHIRPS-2.0/, last access: 5 November 2020.
Coelho, C. A. S., Cavalcanti, I. A. F., Costa, S. M. S., Freitas, S. R., Ito, E. R., Luz, G., Santos, A. F., Nobre, C. A., Marengo, J. A., and Pezza, A. B.: Climate diagnostics of three major drought events in the Amazon and illustrations of their seasonal precipitation predictions, Met. Apps, 19, 237–255, https://doi.org/10.1002/met.1324, 2012.
Compo, G. P., Sardeshmukh, P. D., Whitaker, J. S., Brohan, P., Jones, P. D., and McColl, C.: Independent confirmation of global land warming without the use of station temperatures, Geophys. Res. Lett., 40, 3170–3174, https://doi.org/10.1002/grl.50425, 2013.
Covey, C., Gleckler, P. J., Doutriaux, C., Williams, D. N., Dai, A., Fasullo, J., Trenberth, K., and Berg, A.: Metrics for the Diurnal Cycle of Precipitation: Toward Routine Benchmarks for Climate Models, J. Climate, 29, 4461–447129, https://doi.org/10.1175/JCLI-D-15-0664.1, 2016.
da Rocha, H. R., Goulden, M. L., Miller, S. D., Menton, M. C., Pinto, L. D. V. O., de Freitas, H. C., and e Silva Figueira, A. M.: SEASONALITY OF WATER AND HEAT FLUXES OVER A TROPICAL FOREST IN EASTERN AMAZONIA, Ecol. Appl., 14, 22–32, https://doi.org/10.1890/02-6001, 2004.
Dirmeyer, P. A., Schlosser, C. A., and Brubaker, K. L.: Precipitation, Recycling, and Land Memory: An Integrated Analysis, J. Hydrometeorol., 10, 278–288, https://doi.org/10.1175/2008JHM1016.1, 2009.
Dirmeyer, P. A., Cash, B. A., Kinter, J. L., Jung, T., Marx, L., Satoh, M., Stan, C., Tomita, H., Towers, P., Wedi, N., Achuthavarier, D., Adams, J. M., Altshuler, E. L., Huang, B., Jin, E. K., and Manganello, J.: Simulating the diurnal cycle of rainfall in global climate models: resolution versus parameterization, Clim. Dynam., 39, 399–418, https://doi.org/10.1007/s00382-011-1127-9, 2012.
Doblas-Reyes, F. J., Sorensson, A. A., Almazroui, M., Dosio, A., Gutowski, W. J., Haarsma, R., Hamdi, R., Hewitson, B., Kwon, W.-T., Lamptey, B. L., Maraun, D., Stephenson, T. S., Takayabu, I., Terray, L., Turner, A., and Zuo, Z.: Linking global to regional climate change, edited by: Masson-Delmotte, V., Zhai, P., Pirani, A., Connors, S. L., Pean, C., Berger, S., Caud, N., Chen, Y., Goldfarb, L., Gomis, M. I., Huang, M., Leitzell, K., Lonnoy, E., Matthews, J. B. R., Maycock, T. K., Waterfield, T., Yelekci, O., Yu, R., and Zhou, B., in: Climate Change 2021: The Physical Science Basis, Contribution of Working Group I to the Sixth Assessment Report of the Intergovernmental Panel on Climate Change, Cambridge University Press, Cambridge, United Kingdom and New York, NY, USA, 1363–1512, https://doi.org/10.1017/9781009157896.012, 2021.
Döll, P. and Lehner, B.: Validation of a new global 30-min drainage direction map, J. Hydrol., 258, 214–231, https://doi.org/10.1016/S0022-1694(01)00565-0, 2002.
Espinoza, J. C., Sörensson, A. A., Ronchail, J., Molina-Carpio, J., Segura, H., Gutierrez-Cori, O., Ruscica, R., Condom, T., and Wongchuig-Correa, S.: Regional hydro-climatic changes in the Southern Amazon Basin (Upper Madeira Basin) during the 1982–2017 period, Journal of Hydrology: Regional Studies, 26, 100637, https://doi.org/10.1016/j.ejrh.2019.100637, 2019.
Esquivel-Muelbert, A., Baker, T. R., Dexter, K. G., et al.: Compositional response of Amazon forests to climate change, Glob. Change Biol., 25, 39–56, https://doi.org/10.1111/gcb.14413, 2019.
European Centre for Medium-Range Weather Forecasts: ERA5 [data set], https://www.ecmwf.int/en/forecasts/datasets/reanalysis-datasets/era5, last access: 3 March 2020.
Feldpausch, T. R., Phillips, O. L., Brienen, R. J. W., Gloor, E., Lloyd, J., Lopez-Gonzalez, G., Monteagudo-Mendoza, A., Malhi, Y., Alarcón, A., Álvarez Dávila, E., Alvarez-Loayza, P., Andrade, A., Aragao, L. E. O. C., Arroyo, L., Aymard C., G. A., Baker, T. R., Baraloto, C., Barroso, J., Bonal, D., Castro, W., Chama, V., Chave, J., Domingues, T. F., Fauset, S., Groot, N., Honorio Coronado, E., Laurance, S., Laurance, W. F., Lewis, S. L., Licona, J. C., Marimon, B. S., Marimon-Junior, B. H., Mendoza Bautista, C., Neill, D. A., Oliveira, E. A., Oliveira dos Santos, C., Pallqui Camacho, N. C., Pardo-Molina, G., Prieto, A., Quesada, C. A., Ramírez, F., Ramírez-Angulo, H., Réjou-Méchain, M., Rudas, A., Saiz, G., Salomão, R. P., Silva-Espejo, J. E., Silveira, M., ter Steege, H., Stropp, J., Terborgh, J., Thomas-Caesar, R., van der Heijden, G. M. F., Vásquez Martinez, R., Vilanova, E., and Vos, V. A.: Amazon forest response to repeated droughts, Global Biogeochem. Cy., 30, 964–982, https://doi.org/10.1002/2015GB005133, 2016.
Flack-Prain, S., Meir, P., Malhi, Y., Smallman, T. L., and Williams, M.: The importance of physiological, structural and trait responses to drought stress in driving spatial and temporal variation in GPP across Amazon forests, Biogeosciences, 16, 4463–4484, https://doi.org/10.5194/bg-16-4463-2019, 2019.
Forkel, M., Drüke, M., Thurner, M., Dorigo, W., Schaphoff, S., Thonicke, K., von Bloh, W., and Carvalhais, N.: Constraining modelled global vegetation dynamics and carbon turnover using multiple satellite observations, Sci. Rep., 9, 18757, https://doi.org/10.1038/s41598-019-55187-7, 2019.
Funk, C., Peterson, P., Landsfeld, M., Pedreros, D., Verdin, J., Shukla, S., Husak, G., Rowland, J., Harrison, L., Hoell, A., and Michaelsen, J.: The climate hazards infrared precipitation with stations – a new environmental record for monitoring extremes, Sci. Data, 2, 150066, https://doi.org/10.1038/sdata.2015.66, 2015.
Giardina, F., Konings, A. G., Kennedy, D., Alemohammad, S. H., Oliveira, R. S., Uriarte, M., and Gentine, P.: Tall Amazonian forests are less sensitive to precipitation variability, Nat. Geosci., 11, 405–409, https://doi.org/10.1038/s41561-018-0133-5, 2018.
Giles, J. A., Ruscica, R. C., and Menéndez, C. G.: The diurnal cycle of precipitation over South America represented by five gridded datasets, Int. J. Climatol., 40, 668–686, https://doi.org/10.1002/joc.6229, 2020.
Gloor, M., Barichivich, J., Ziv, G., Brienen, R., Schöngart, J., Peylin, P., Ladvocat Cintra, B. B., Feldpausch, T., Phillips, O., and Baker, J.: Recent Amazon climate as background for possible ongoing and future changes of Amazon humid forests, Global Biogeochem. Cy., 29, 1384–1399, https://doi.org/10.1002/2014GB005080, 2015.
Golian, S., Javadian, M., and Behrangi, A.: On the use of satellite, gauge, and reanalysis precipitation products for drought studies, Environ. Res. Lett., 14, 075005, https://doi.org/10.1088/1748-9326/ab2203, 2019.
Grossiord, C., Buckley, T. N., Cernusak, L. A., Novick, K. A., Poulter, B., Siegwolf, R. T. W., Sperry, J. S., and McDowell, N. G.: Plant responses to rising vapor pressure deficit, New Phytol., 226, 1550–1566, https://doi.org/10.1111/nph.16485, 2020.
Hadley Centre for Climate Prediction and Research: The WFDEI Meteorological Forcing Data, Met Office, Ministry of Defence, United Kingdom [data set], ftp://rfdata:forceDATA@ftp.iiasa.ac.at, last access: 2 February 2019.
Harris, I., Jones, P. D., Osborn, T. J., and Lister, D. H.: Updated high-resolution grids of monthly climatic observations – the CRU TS3.10 Dataset, Int. J. Climatol., 34, 623–642, https://doi.org/10.1002/joc.3711, 2014.
Hobeichi, S.: Derived Optimal Linear Combination Evapotranspiration – DOLCE v3.0, ARC Centre of Excellence for Climate Extremes [data set], https://researchdata.edu.au/derived-optimal-linear-dolce-v30/1697055, last access: 1 March 2022.
Hobeichi, S., Abramowitz, G., Evans, J., and Ukkola, A.: Derived Optimal Linear Combination Evapotranspiration (DOLCE): a global gridded synthesis ET estimate, Hydrol. Earth Syst. Sci., 22, 1317–1336, https://doi.org/10.5194/hess-22-1317-2018, 2018.
Hubau, W., Lewis, S. L., Phillips, O. L., et al.: Asynchronous carbon sink saturation in African and Amazonian tropical forests, Nature, 579, 80–87, https://doi.org/10.1038/s41586-020-2035-0, 2020.
Huffman, G. J., Bolvin, D. T., Nelkin, E. J., Wolff, D. B., Adler, R. F., Gu, G., Hong, Y., Bowman, K. P., and Stocker, E. F.: The TRMM Multisatellite Precipitation Analysis (TMPA): Quasi-Global, Multiyear, Combined-Sensor Precipitation Estimates at Fine Scales, J. Hydrometeorol., 8, 38–55, https://doi.org/10.1175/JHM560.1, 2007.
Huffman, G. J. and Bolvin, D. T.: Tropical Rainfall Measurement Mission, Mesoscale Atmospheric Processes Laboratory, NASA Goddard Space Flight Center [data set], https://disc.gsfc.nasa.gov/datasets/, last access: 5 March 2019.
Jiang, M., Medlyn, B. E., Drake, J. E., Duursma, R. A., Anderson, I. C., Barton, C. V. M., Boer, M. M., Carrillo, Y., Castañeda-Gómez, L., Collins, L., Crous, K. Y., De Kauwe, M. G., dos Santos, B. M., Emmerson, K. M., Facey, S. L., Gherlenda, A. N., Gimeno, T. E., Hasegawa, S., Johnson, S. N., Kännaste, A., Macdonald, C. A., Mahmud, K., Moore, B. D., Nazaries, L., Neilson, E. H. J., Nielsen, U. N., Niinemets, Ü., Noh, N. J., Ochoa-Hueso, R., Pathare, V. S., Pendall, E., Pihlblad, J., Piñeiro, J., Powell, J. R., Power, S. A., Reich, P. B., Renchon, A. A., Riegler, M., Rinnan, R., Rymer, P. D., Salomón, R. L., Singh, B. K., Smith, B., Tjoelker, M. G., Walker, J. K. M., Wujeska-Klause, A., Yang, J., Zaehle, S., and Ellsworth, D. S.: The fate of carbon in a mature forest under carbon dioxide enrichment, Nature, 580, 227–231, https://doi.org/10.1038/s41586-020-2128-9, 2020.
Jimenez, J. C., Barichivich, J., Mattar, C., Takahashi, K., Santamaría-Artigas, A., Sobrino, J. A., and Malhi, Y.: Spatio-temporal patterns of thermal anomalies and drought over tropical forests driven by recent extreme climatic anomalies, Philos. T. Roy. Soc. B, 373, 20170300, https://doi.org/10.1098/rstb.2017.0300, 2018.
Jimenez, J. C., Marengo, J. A., Alves, L. M., Sulca, J. C., Takahashi, K., Ferrett, S., and Collins, M.: The role of ENSO flavours and TNA on recent droughts over Amazon forests and the Northeast Brazil region, Int. J. Climatol., 41, 3761–3780, https://doi.org/10.1002/joc.6453, 2019.
Jiménez-Muñoz, J. C., Mattar, C., Barichivich, J., Santamaría-Artigas, A., Takahashi, K., Malhi, Y., Sobrino, J. A., and van der Schrier, G.: Record-breaking warming and extreme drought in the Amazon rainforest during the course of El Niño 2015–2016, Sci. Rep., 6, 33130, https://doi.org/10.1038/srep33130, 2016.
Kim, H.: Global Soil Wetness Project Phase 3 Atmospheric Boundary Conditions, Institute of Industrial Science, The University of Tokyo [data set], https://doi.org/10.20783/DIAS.501, 2017.
Koch, A., Hubau, W., and Lewis, S. L.: Earth System Models Are Not Capturing Present-Day Tropical Forest Carbon Dynamics, Earth's Future, 9, e2020EF001874, https://doi.org/10.1029/2020EF001874, 2021.
Konings, A. G. and Gentine, P.: Global variations in ecosystem-scale isohydricity, Glob. Change Biol., 23, 891–905, https://doi.org/10.1111/gcb.13389, 2017.
Lewis, S. L., Brando, P. M., Phillips, O. L., van der Heijden, G. M. F., and Nepstad, D.: The 2010 Amazon Drought, Science, 331, 554–554, https://doi.org/10.1126/science.1200807, 2011.
Malhi, Y., Roberts, J. T., Betts, R. A., Killeen, T. J., Li, W., and Nobre, C. A.: Climate Change, Deforestation, and the Fate of the Amazon, Science, 319, 169–172, https://doi.org/10.1126/science.1146961, 2008.
Malhi, Y., Aragao, L. E. O. C., Galbraith, D., Huntingford, C., Fisher, R., Zelazowski, P., Sitch, S., McSweeney, C., and Meir, P.: Exploring the likelihood and mechanism of a climate-change-induced dieback of the Amazon rainforest, P. Natl. Acad. Sci. USA, 106, 20610–20615, https://doi.org/10.1073/pnas.0804619106, 2009.
Marengo, J. A. and Espinoza, J. C.: Extreme seasonal droughts and floods in Amazonia: causes, trends and impacts: EXTREMES IN AMAZONIA, Int. J. Climatol., 36, 1033–1050, https://doi.org/10.1002/joc.4420, 2016.
Marengo, J. A., Nobre, C. A., Tomasella, J., Cardoso, M. F., and Oyama, M. D.: Hydro-climatic and ecological behaviour of the drought of Amazonia in 2005, Phil. T. Roy. Soc. B, 363, 1773–1778, https://doi.org/10.1098/rstb.2007.0015, 2008a.
Marengo, J. A., Nobre, C. A., Tomasella, J., Oyama, M. D., Sampaio de Oliveira, G., de Oliveira, R., Camargo, H., Alves, L. M., and Brown, I. F.: The Drought of Amazonia in 2005, J. Climate, 21, 495–516, https://doi.org/10.1175/2007JCLI1600.1, 2008b.
Marengo, J. A., Tomasella, J., Alves, L. M., Soares, W. R., and Rodriguez, D. A.: The drought of 2010 in the context of historical droughts in the Amazon region: DROUGHT AMAZON 2010, Geophys. Res. Lett., 38, L12703, https://doi.org/10.1029/2011GL047436, 2011.
Martens, B., Miralles, D. G., Lievens, H., van der Schalie, R., de Jeu, R. A. M., Fernández-Prieto, D., Beck, H. E., Dorigo, W. A., and Verhoest, N. E. C.: GLEAM v3: satellite-based land evaporation and root-zone soil moisture, Geosci. Model Dev., 10, 1903–1925, https://doi.org/10.5194/gmd-10-1903-2017, 2017.
Martens, B., Miralles, D. G., Lievens, H., van der Schalie, R., de Jeu, R. A. M., Fernández-Prieto, D., Beck, H. E., Dorigo, W. A., and Verhoest, N. E. C.: GLEAM v3 [data set], https://www.gleam.eu/datasets, last access: 22 April 2019.
Miralles, D. G., Gentine, P., Seneviratne, S. I., and Teuling, A. J.: Land-atmospheric feedbacks during droughts and heatwaves: state of the science and current challenges: Land feedbacks during droughts and heatwaves, Ann. NY Acad. Sci., 1436, 19–35, https://doi.org/10.1111/nyas.13912, 2019.
Muñoz-Sabater, J., Dutra, E., Balsamo, G., Boussetta, S., Zsoter, E., Albergel, C., and Agusti-Panareda, A.: ERA5-Land: an improved version of the ERA5 reanalysis land component, Joint ISWG and LSA-SAF Workshop IPMA, Lisbon, 26–28, 2018.
Nogueira, M.: Inter-comparison of ERA-5, ERA-interim and GPCP rainfall over the last 40 years: Process-based analysis of systematic and random differences, J. Hydrol., 583, 124632, https://doi.org/10.1016/j.jhydrol.2020.124632, 2020.
Papastefanou, P.: Scripts for reproducing the analysis, figures and tables of the bg-2020-425 study, Github [code], https://github.com/PhillipPapastefanou/DroughtAnalysis (last access: 31 August 2022), 2021.
Phillips, O. L., Aragão, L. E. O. C., Lewis, S. L., Fisher, J. B., Lloyd, J., López-González, G., Malhi, Y., Monteagudo, A., Peacock, J., Quesada, C. A., van der Heijden, G., Almeida, S., Amaral, I., Arroyo, L., Aymard, G., Baker, T. R., Bánki, O., Blanc, L., Bonal, D., Brando, P., Chave, J., de Oliveira, Á. C. A., Cardozo, N. D., Czimczik, C. I., Feldpausch, T. R., Freitas, M. A., Gloor, E., Higuchi, N., Jiménez, E., Lloyd, G., Meir, P., Mendoza, C., Morel, A., Neill, D. A., Nepstad, D., Patiño, S., Peñuela, M. C., Prieto, A., Ramírez, F., Schwarz, M., Silva, J., Silveira, M., Thomas, A. S., Steege, H. ter, Stropp, J., Vásquez, R., Zelazowski, P., Dávila, E. A., Andelman, S., Andrade, A., Chao, K.-J., Erwin, T., Di Fiore, A., C., E. H., Keeling, H., Killeen, T. J., Laurance, W. F., Cruz, A. P., Pitman, N. C. A., Vargas, P. N., Ramírez-Angulo, H., Rudas, A., Salamão, R., Silva, N., Terborgh, J., and Torres-Lezama, A.: Drought Sensitivity of the Amazon Rainforest, Science, 323, 1344–1347, https://doi.org/10.1126/science.1164033, 2009.
Physical Sciences Laboratory: CRU – NCEP/NCAR Reanalysis, Boulder Colorado, https://crudata.uea.ac.uk/cru/data/ncep/, last access: 1 December 2020.
Rao, K., Anderegg, W. R. L., Sala, A., Martínez-Vilalta, J., and Konings, A. G.: Satellite-based vegetation optical depth as an indicator of drought-driven tree mortality, Remote Sens. Environ., 227, 125–136, https://doi.org/10.1016/j.rse.2019.03.026, 2019.
Rifai, S. W., Li, S., and Malhi, Y.: Coupling of El Niño events and long-term warming leads to pervasive climate extremes in the terrestrial tropics, Environ. Res. Lett., 14, 105002, https://doi.org/10.1088/1748-9326/ab402f, 2019.
Rodell, M., Houser, P. R., Jambor, U., Gottschalck, J., Mitchell, K., Meng, C.-J., Arsenault, K., Cosgrove, B., Radakovich, J., Bosilovich, M., Entin, J. K., Walker, J. P., Lohmann, D., and Toll, D.: The Global Land Data Assimilation System, B. Am. Meteorol. Soc., 85, 381–394, https://doi.org/10.1175/BAMS-85-3-381, 2004.
Rodell, M. and the NASA Goddard Space Flight Center: Global Land Data Assimilation System [data set], https://ldas.gsfc.nasa.gov/gldas/forcing-data, last access: 1 December 2020.
Ruida, Z., Chen, X., Wang, Z., Lai, C., and Goddard, S.: Package scPDSI, https://github.com/Sibada/scPDSI, 2018.
Ruiz-Vásquez, M., Arias, P. A., Martínez, J. A., and Espinoza, J. C.: Effects of Amazon basin deforestation on regional atmospheric circulation and water vapor transport towards tropical South America, Clim. Dynam., 54, 4169–4189, https://doi.org/10.1007/s00382-020-05223-4, 2020.
Saatchi, S. S., Harris, N. L., Brown, S., Lefsky, M., Mitchard, E. T. A., Salas, W., Zutta, B. R., Buermann, W., Lewis, S. L., Hagen, S., Petrova, S., White, L., Silman, M., and Morel, A.: Benchmark map of forest carbon stocks in tropical regions across three continents, P. Natl. Acad. Sci. USA, 108, 9899–9904, https://doi.org/10.1073/pnas.1019576108, 2011.
Schaphoff, S., von Bloh, W., Rammig, A., Thonicke, K., Biemans, H., Forkel, M., Gerten, D., Heinke, J., Jägermeyr, J., Knauer, J., Langerwisch, F., Lucht, W., Müller, C., Rolinski, S., and Waha, K.: LPJmL4 – a dynamic global vegetation model with managed land – Part 1: Model description, Geosci. Model Dev., 11, 1343–1375, https://doi.org/10.5194/gmd-11-1343-2018, 2018.
Schneider, U., Becker, A., Finger, P., Anja, M.-C., and Markus, Z.: GPCC Full Data Monthly Version 2018.0 at 0.5∘: Monthly Land-Surface Precipitation from Rain-Gauges built on GTS-based and Historic Data, Global Precipitation Climatology Centre (GPCC), Deutscher Wetterdienst [data set], https://doi.org/10.5676/DWD_GPCC/FD_M_V2018_050, 2018.
Schneider, U., Hänsel, S., Finger, P., Rustemeier, E., and Ziese, M.: GPCC Full Data Monthly Product Version 2022 [data set], https://opendata.dwd.de/climate_environment/GPCC/html/download_gate.html, last access: 2 March 2019.
Seiler, C., Hutjes, R. W. A., Kruijt, B., and Hickler, T.: The sensitivity of wet and dry tropical forests to climate change in Bolivia, J. Geophys. Res.-Biogeo., 120, 399–413, https://doi.org/10.1002/2014JG002749, 2015.
Seto, S., Iguchi, T., and Meneghini, R.: Comparison of TRMM PR V6 and V7 focusing heavy rainfall, in: 2011 IEEE International Geoscience and Remote Sensing Symposium, IGARSS 2011, Vancouver, BC, Canada, IEEE, 2582–2585, https://doi.org/10.1109/IGARSS.2011.6049769, 2011.
Sheffield, J., Goteti, G., and Wood, E. F.: Development of a 50-Year High-Resolution Global Dataset of Meteorological Forcings for Land Surface Modeling, J. Climate, 19, 3088–3111, https://doi.org/10.1175/JCLI3790.1, 2006.
Smith, B., Wårlind, D., Arneth, A., Hickler, T., Leadley, P., Siltberg, J., and Zaehle, S.: Implications of incorporating N cycling and N limitations on primary production in an individual-based dynamic vegetation model, Biogeosciences, 11, 2027–2054, https://doi.org/10.5194/bg-11-2027-2014, 2014.
Sörensson, A. A. and Ruscica, R. C.: Intercomparison and Uncertainty Assessment of Nine Evapotranspiration Estimates Over South America, Water Resour. Res., 54, 2891–2908, https://doi.org/10.1002/2017WR021682, 2018.
Staal, A., Fetzer, I., Wang-Erlandsson, L., Bosmans, J. H. C., Dekker, S. C., van Nes, E. H., Rockström, J., and Tuinenburg, O. A.: Hysteresis of tropical forests in the 21st century, Nat. Commun., 11, 4978, https://doi.org/10.1038/s41467-020-18728-7, 2020.
Stephenson, N.: Actual evapotranspiration and deficit: biologically meaningful correlates of vegetation distribution across spatial scales, J Biogeogr., 25, 855–870, https://doi.org/10.1046/j.1365-2699.1998.00233.x, 1998.
Toomey, M., Roberts, D. A., Still, C., Goulden, M. L., and McFadden, J. P.: Remotely sensed heat anomalies linked with Amazonian forest biomass declines, Geophys. Res. Lett., 38, L19704, https://doi.org/10.1029/2011GL049041, 2011.
van der Ent, R. J., Savenije, H. H. G., Schaefli, B., and Steele-Dunne, S. C.: Origin and fate of atmospheric moisture over continents: ORIGIN AND FATE OF ATMOSPHERIC MOISTURE, Water Resour. Res., 46, W09525, https://doi.org/10.1029/2010WR009127, 2010.
Viovy, N.: CRUNCEP Version 7 – Atmospheric Forcing Data for the Community Land Model, Research Data Archive at the National Center for Atmospheric Research, Computational and Information Systems Laboratory [data set], Boulder, CO, https://doi.org/10.5065/PZ8F-F017, 2018.
von Randow, C., Manzi, A. O., Kruijt, B., de Oliveira, P. J., Zanchi, F. B., Silva, R. L., Hodnett, M. G., Gash, J. H. C., Elbers, J. A., Waterloo, M. J., Cardoso, F. L., and Kabat, P.: Comparative measurements and seasonal variations in energy and carbon exchange over forest and pasture in South West Amazonia, Theor. Appl. Climatol., 78, 5–26, https://doi.org/10.1007/s00704-004-0041-z, 2004.
Weedon, G. P., Gomes, S., Viterbo, P., Shuttleworth, W. J., Blyth, E., Österle, H., Adam, J. C., Bellouin, N., Boucher, O., and Best, M.: Creation of the WATCH Forcing Data and Its Use to Assess Global and Regional Reference Crop Evaporation over Land during the Twentieth Century, J. Hydrometeorol., 12, 823–848, https://doi.org/10.1175/2011JHM1369.1, 2011.
Weedon, G. P., Balsamo, G., Bellouin, N., Gomes, S., Best, M. J., and Viterbo, P.: The WFDEI meteorological forcing data set: WATCH Forcing Data methodology applied to ERA-Interim reanalysis data, Water Resour. Res., 50, 7505–7514, https://doi.org/10.1002/2014WR015638, 2014.
Wells, N., Goddard, S., and Hayes, M. J.: A Self-Calibrating Palmer Drought Severity Index, J. Climate, 17, 2335–2351, https://doi.org/10.1175/1520-0442(2004)017<2335:ASPDSI>2.0.CO;2, 2004.
Willmott, C. J., Rowe, C. M., and Philpot, W. D.: Small-Scale Climate Maps: A Sensitivity Analysis of Some Common Assumptions Associated with Grid-Point Interpolation and Contouring, Am. Cartographer, 12, 5–16, https://doi.org/10.1559/152304085783914686, 1985.
Xu, X., Konings, A. G., Longo, M., Feldman, A., Xu, L., Saatchi, S., Wu, D., Wu, J., and Moorcroft, P.: Leaf surface water, not plant water stress, drives diurnal variation in tropical forest canopy water content, New Phytol., 231, 122–136, https://doi.org/10.1111/nph.17254, 2021.
Yang, H., Piao, S., Zeng, Z., Ciais, P., Yin, Y., Friedlingstein, P., Sitch, S., Ahlström, A., Guimberteau, M., Huntingford, C., Levis, S., Levy, P. E., Huang, M., Li, Y., Li, X., Lomas, M. R., Peylin, P., Poulter, B., Viovy, N., Zaehle, S., Zeng, N., Zhao, F., and Wang, L.: Multicriteria evaluation of discharge simulation in Dynamic Global Vegetation Models, J. Geophys. Res.-Atmos., 120, 7488–7505, https://doi.org/10.1002/2015JD023129, 2015.
Yang, Y., Saatchi, S. S., Xu, L., Yu, Y., Choi, S., Phillips, N., Kennedy, R., Keller, M., Knyazikhin, Y., and Myneni, R. B.: Post-drought decline of the Amazon carbon sink, Nat. Commun., 9, 3172, https://doi.org/10.1038/s41467-018-05668-6, 2018.
Zang, C. S., Buras, A., Esquivel-Muelbert, A., Jump, A. S., Rigling, A., and Rammig, A.: Standardized drought indices in ecological research: Why one size does not fit all, Glob. Change Biol., 26, 322–324, https://doi.org/10.1111/gcb.14809, 2020.
Zemp, D. C., Schleussner, C.-F., Barbosa, H. M. J., van der Ent, R. J., Donges, J. F., Heinke, J., Sampaio, G., and Rammig, A.: On the importance of cascading moisture recycling in South America, Atmos. Chem. Phys., 14, 13337–13359, https://doi.org/10.5194/acp-14-13337-2014, 2014.
Zemp, D. C., Schleussner, C.-F., Barbosa, H. M. J., Hirota, M., Montade, V., Sampaio, G., Staal, A., Wang-Erlandsson, L., and Rammig, A.: Self-amplified Amazon forest loss due to vegetation-atmosphere feedbacks, Nat. Commun., 8, 14681, https://doi.org/10.1038/ncomms14681, 2017.
Zeng, N., Yoon, J.-H., Marengo, J. A., Subramaniam, A., Nobre, C. A., Mariotti, A., and Neelin, J. D.: Causes and impacts of the 2005 Amazon drought, Environ. Res. Lett., 3, 014002, https://doi.org/10.1088/1748-9326/3/1/014002, 2008.
Ziese, M., Schneider, U., Meyer-Christoffer, A., Schamm, K., Vido, J., Finger, P., Bissolli, P., Pietzsch, S., and Becker, A.: The GPCC Drought Index – a new, combined and gridded global drought index, Earth Syst. Sci. Data, 6, 285–295, https://doi.org/10.5194/essd-6-285-2014, 2014.