the Creative Commons Attribution 4.0 License.
the Creative Commons Attribution 4.0 License.
 | 06 Sep 2022
Accounting for non-rainfall moisture and temperature improves litter decay model performance in a fog-dominated dryland system
J. Robert Logan
Kathe E. Todd-Brown
Kathryn M. Jacobson
Peter J. Jacobson
Roland Vogt
Sarah E. Evans
Historically, ecosystem models have treated rainfall as the primary moisture source driving litter decomposition. In many arid and semi-arid lands, however, non-rainfall moisture (fog, dew, and water vapor) plays a more important role in supporting microbial activity and carbon turnover. To date though, we lack a robust approach for modeling the role of non-rainfall moisture in litter decomposition. We developed a series of simple litter decay models with different moisture sensitivity and temperature sensitivity functions to explicitly represent the role of non-rainfall moisture in the litter decay process. To evaluate model performance, we conducted a 30-month litter decomposition study at 6 sites along a fog and dew gradient in the Namib desert, spanning almost an eightfold difference in non-rainfall moisture frequency. Litter decay rates in the field correlated with fog and dew frequencies but not with rainfall. Including either temperature or non-rainfall moisture sensitivity functions improved model performance, but the combination of temperature and moisture sensitivity together provided more realistic estimates of litter decomposition than relying on either alone. Model performance was similar regardless of whether we used continuous moisture sensitivity functions based on relative humidity or a simple binary function based on the presence of moisture, although a Gaussian temperature sensitivity outperformed a monotonically increasing Q10 temperature function. We demonstrate that explicitly modeling non-rainfall moisture and temperature together is necessary to accurately capture litter decay dynamics in a fog-affected dryland system and provide suggestions for how to incorporate non-rainfall moisture into existing Earth system models.
- Article
(14679 KB) - Full-text XML
- BibTeX
- EndNote


Drylands play an important part in the global carbon cycle, but we still lack a strong understanding of carbon cycling in these systems. Historically, ecosystem models have underestimated dryland litter decomposition rates (Parton et al., 2007; Adair et al., 2008). This is partly because the models are driven by rainfall, assuming little to no decay between precipitation events. While rainfall pulses play a large role in dryland systems (Noy-Meir, 1973; Seely and Louw, 1980), considering rain alone does not fully capture litter decomposition in these systems. This may be partially because much decomposition occurs at and above the soil surface, and aboveground litter decomposition is less sensitive to large rain pulses than belowground decay (Austin, 2011; Jacobson and Jacobson, 1998). Abiotic processes including photodegradation, aeolian erosion, and thermal degradation that drive aboveground litter decomposition can degrade litter regardless of moisture conditions (Austin, 2011) and rain events as little as 1 mm can facilitate microbial activity (Collins et al., 2008). Finally, non-rainfall moisture (NRM: fog, dew, and water vapor) can support substantial biotic decomposition of plant litter, even in the absence of rain (Jacobson et al., 2015; Dirks et al., 2010; Wang et al., 2017; Logan et al., 2021). These findings demonstrate that carbon and nutrient cycling in drylands are not restricted to precipitation pulses and that NRM is a crucial driver of dryland biogeochemical cycles. As our understanding of the importance of NRM in arid and semi-arid ecosystems evolves, we need to update our conceptual and predictive models to incorporate these important drivers of ecosystem processes.
Despite growing recognition of NRM's importance, current litter decay models do not explicitly account for its ability to support decomposition. This is partly because field-based studies of NRM-driven decomposition are scarce and so far, have mostly focused on documenting single cases and understanding mechanisms. Recent studies have shown that the rate of NRM-driven decomposition depends on many factors including the frequency of humid conditions (Evans et al., 2020), the composition of decomposer communities (Logan et al., 2021; Wenndt et al., 2021), and interactions with other processes, such as photodegradation (Wang et al., 2015; Gliksman et al., 2017; Logan et al., 2022). These insights have been very helpful in demonstrating that NRM-driven decomposition occurs and identifying its various mechanisms. However, before we can incorporate NRM into mechanistic Earth system models, we need multiyear studies that quantify the relationship between NRM and mass loss across a range of environmental conditions (Bonan et al., 2013), something that has not been done to date.
One recent attempt to model NRM-driven decomposition has shed light on this challenge. Evans et al. (2020) developed a model that treated decomposition as a pulse process that could be triggered by either rain or NRM when conditions met a given criterion (i.e., when relative humidity was above a given threshold or when dew was present as determined by a leaf wetness sensor). They found that accounting for NRM produced mass loss estimates that were considerably higher than those from a rain-only model and that these new estimates were within the range observed in the field. This approach showed that NRM can improve mass loss estimates, but it included several simplifying assumptions that need to be tested before NRM can be incorporated into models more generally. First, the authors modeled annual mass loss by measuring instantaneous respiration rates and scaling them up to annual time scales. This showed that the NRM-driven biotic activity on the scale of individual events can be used to estimate long-term mass loss rates over several months, albeit with wide error estimates. A better approach would be to validate model predictions by formally integrating rates of mass loss at multiple sites and in multiyear field studies (Bonan et al., 2013). Studies where NRM meteorology and decomposition are both measured and quantifiably linked to one another are currently lacking.
Second, their model treated decomposition as essentially a pulse process that could be triggered by either rainfall or NRM, but responded similarly to both (in other words, as long as the threshold condition was met, decomposition was considered to be “on”). While rainfall and NRM may induce similar decomposition rates for a similar moisture level, this approach does not allow the possibility of continuous responses. For example, CO2 fluxes are strongly correlated with litter moisture content (Jacobson et al., 2015), which varies with relative humidity (Tschinkel, 1973; Dirks et al., 2010), so a sensitivity function that allows instantaneous decay rates to vary depending on the magnitude of the NRM event may be more appropriate than a simple threshold trigger.
Finally, their model did not include temperature dependence, despite decomposition being highly sensitive to temperature in almost all terrestrial systems (Sierra, 2012; Sierra et al., 2015). Relative humidity is closely linked to air temperature, and average temperature during NRM events is often considerably lower than during rain events (Logan et al., 2021). Developing more powerful NRM-driven litter decay models may therefore require incorporating continuous moisture responses and temperature sensitivities to accurately capture decomposition dynamics, although to date these remain untested.
We set out to determine whether incorporating NRM into a simple litter decay model improved model performance in an NRM-dominated system. We tested multiple potential relationships between meteorological variables and litter decay rates in an attempt to parameterize a model of NRM-driven decomposition. We had two main objectives:
-
Use a novel dataset to evaluate multiple methods of modeling litter decomposition as a function of NRM.
-
Determine how important temperature sensitivity is in NRM-driven litter decomposition models.
Since existing studies examining decomposition under different moisture regimes are limiting (Jacobson et al., 2015; Evans et al., 2020), we draw upon literature on soil organic matter decomposition and rainfall-driven litter decomposition to identify potential moisture and temperature sensitivity functions (Sierra et al., 2015). To evaluate models, we conducted a 30-month, multisite litter decomposition study that spanned an eightfold magnitude of NRM frequency. By placing litter across this gradient and making continuous meteorological measurements alongside mass loss, we were able to quantify the relationship between NRM and litter decay on a multiyear time scale for the first time. Finally, we used a Bayesian-Monte Carlo approach to parameterize mass loss models using several temperature and moisture sensitivity functions and used model selection criteria to identify the best models.
2.1 Empirical measurements
We conducted our study in the central Namib desert in western Namibia. The Namib desert is a coastal fog desert, with a steep NRM gradient across a narrow geographic range (Eckardt et al., 2013). Rain is scarce in the Namib desert and NRM is expected to be responsible for the vast majority of litter decomposition (Evans et al., 2020). We leveraged the FogNet weather array, a network of meteorological stations throughout the central Namib desert that is part of the Southern African Science Service Centre for Climate Change and Adaptive Land Management (SASSCAL; http://www.sasscalweathernet.org/, last access: 1 July 2022) and maintained by the Gobabeb Namib Research Institute (https://www.gobabeb.org/, last access: 1 July 2022) (Fig. A1 in the Appendix). Each station measures air temperature, relative humidity, wind speed and direction, soil temperature, leaf wetness state, rainfall, and fog precipitation on a Juvik fog screen. The sites are all located within 70 km of one another but span an order of magnitude in NRM frequency: wet conditions (fog or dew) occur for 3.1 % of the period (quantified by hours wet) at the driest site and 25.3 % at the wettest; a characterization of meteorology across these sites was part of this study. Weather data were recorded once per minute and converted to hourly averages for analysis.
At six sites, we deployed senesced tillers of Stipagrostis sabulicola to monitor mass loss. S. sabulicola is the dominant grass in the Namib Sand Sea with widely distributed congenerics across Africa and Asia (Roth-Nebelsick et al., 2012; GrassBase – The Online World Grass Flora, 2021). Since litter-associated fungal communities can respond differently to NRM based on their history of exposure to different moisture regimes (Logan et al., 2021), we collected all tillers from the same site (Gobabeb) so the initial fungal community would be the same. To avoid potential microclimate effects of traditional litter bags (Xie, 2020), we measured mass loss by placing tillers in litter racks, custom-made wooden frames designed to hold grass tillers while keeping them completely exposed to ambient solar radiation and moisture conditions (Fig. A2) (Evans et al., 2020; Logan et al., 2021). Every 6 months for 30 months (19 January 2018 to 12 August 2020; 936 days in total), we collected a subset of 10 tillers at each site and weighed them. Tillers were destructively harvested at each time point; so in our final dataset, each tiller was weighed prior to deployment and once again when it was collected.
Precolonization is a very important step in standing-litter decomposition since it can “prime” litter to be more ready to degrade once it reaches the soil surface; this contributes to changes in litter decay rates over time. To assess the effects of NRM on litter decomposition throughout the decay process, we deployed litter at two stages of decay. Categories were based on previous observations of S. sabulicola decay in situ in the Namib desert (Logan et al., 2021). Early-stage tillers were tillers that had senesced in the preceding 2 months, had no visible fungal growth, and had visibly intact cuticles (Fig. A2). Late-stage tillers were harvested from upright plants that had likely been standing for at least 1 year post-senescence and were characterized by coverings of light and dark pigmented fungi and a cracked cuticle that was considerably more permeable to water. Previous work found similar measures of gross litter quality (including C : N ratios, total lignin, and lignin : N content) between litter at these two stages, and found that the primary difference between the two is the level of fungal colonization and state of cuticle degradation, with late-stage tillers harboring much larger fungal communities (Logan et al., 2021). Since we only collected standing grass litter that had not yet fallen over, our terminology of “early” and “late” does not reflect the entire decomposition process but is meant to highlight relative successional differences between the litter stages based on time since senescence and saprophytic community size.
2.2 Model description
To model the effect of NRM on litter decomposition, we began by modeling decay rates using a simple exponential model of the form:
where M(t) is mass at time t, M0 is initial mass, and keff is the effective litter decay constant. This approach captures typical litter decay dynamics, with a rapid initial decay phase followed by slower mass loss over time, but does not differentiate between slow and rapid litter pools. We determined an effective decay rate for each site and litter stage, plotting this as a function of the total NRM time and accumulated rainfall at that site.
This approach, whereby we fit a separate effective decay rate for sites with different climates, is a common approach to describe how litter decomposition varies under different climatic conditions (Zhang et al., 2008). However, because it treats mass loss as solely dependent on the decay rate and time, this approach does not explicitly include temperature or moisture. To determine how moisture and temperature influenced litter decay, we incorporated NRM and temperature dependence by allowing them to modify an intrinsic litter decay (kint) term, which represents the rate of litter decay under ideal, non-limiting conditions according to
where h(t) and g(t) are sensitivity functions for NRM and temperature, respectively. Unlike the simple model described by Eq. (1), in this model, the litter decay rate (kint) is the maximum rate under ideal temperature and moisture conditions, which is then modified downward by the sensitivity functions (with the exception of Q10 temperature sensitivity function that allows increasing decomposition above a reference temperature); see next section for sensitivity functions. This allowed us to test specific hypothesized relationships between moisture and litter decay rates, both within and between sites depending on how we choose to fit the parameters (i.e., separate fits for each site or global parameter estimates). Using a one-pool model allowed us to simplify the intrinsic decay component of the model and focus on the effect of different temperature and moisture sensitivities. We discretized the model using hourly meteorological data, calculating the rate of mass loss for each hour as:
2.3 Sensitivity functions
Since litter decomposition can occur in response to dew and fog (Jacobson et al., 2015) or water vapor under humid conditions even in the absence of liquid water (Dirks et al., 2010), we tested separate sensitivity functions based on either relative humidity levels, or based on a measurement of the presence of liquid water. Sensitivity functions are presented in Table 1 and shown in Fig. 1. The threshold model is binary, allowing decomposition to happen at the intrinsic litter decay rate if and only if relative humidity is above a specified threshold (RT). This simple approach has yielded mass loss estimates similar to those previously measured in the field (Evans et al., 2020). To account for possible saturation at high relative humidities, we also evaluated a logistic sensitivity model that allows the rate of decomposition potential to slow as relative humidity approaches 100 %. The exponential moisture model allows decomposition rates to increase exponentially with relative humidity, reflecting the relationship between litter moisture content and relative humidity that is often seen in both controlled (Tschinkel, 1973) and field conditions (Dirks et al., 2010). Each moisture sensitivity function was normalized to 1 when relative humidity was 100 %. Finally, we tested a fourth function based on the presence or absence of moisture as measured by a leaf wetness sensor, in which decomposition occurred at the intrinsic decay rate when the wetness sensors were wet and not at all when conditions were dry. Previous work showed that relative humidity can accurately predict leaf wetness state (Sentelhas et al., 2008; Evans et al., 2020), so we expected this model to perform similarly to the threshold model.
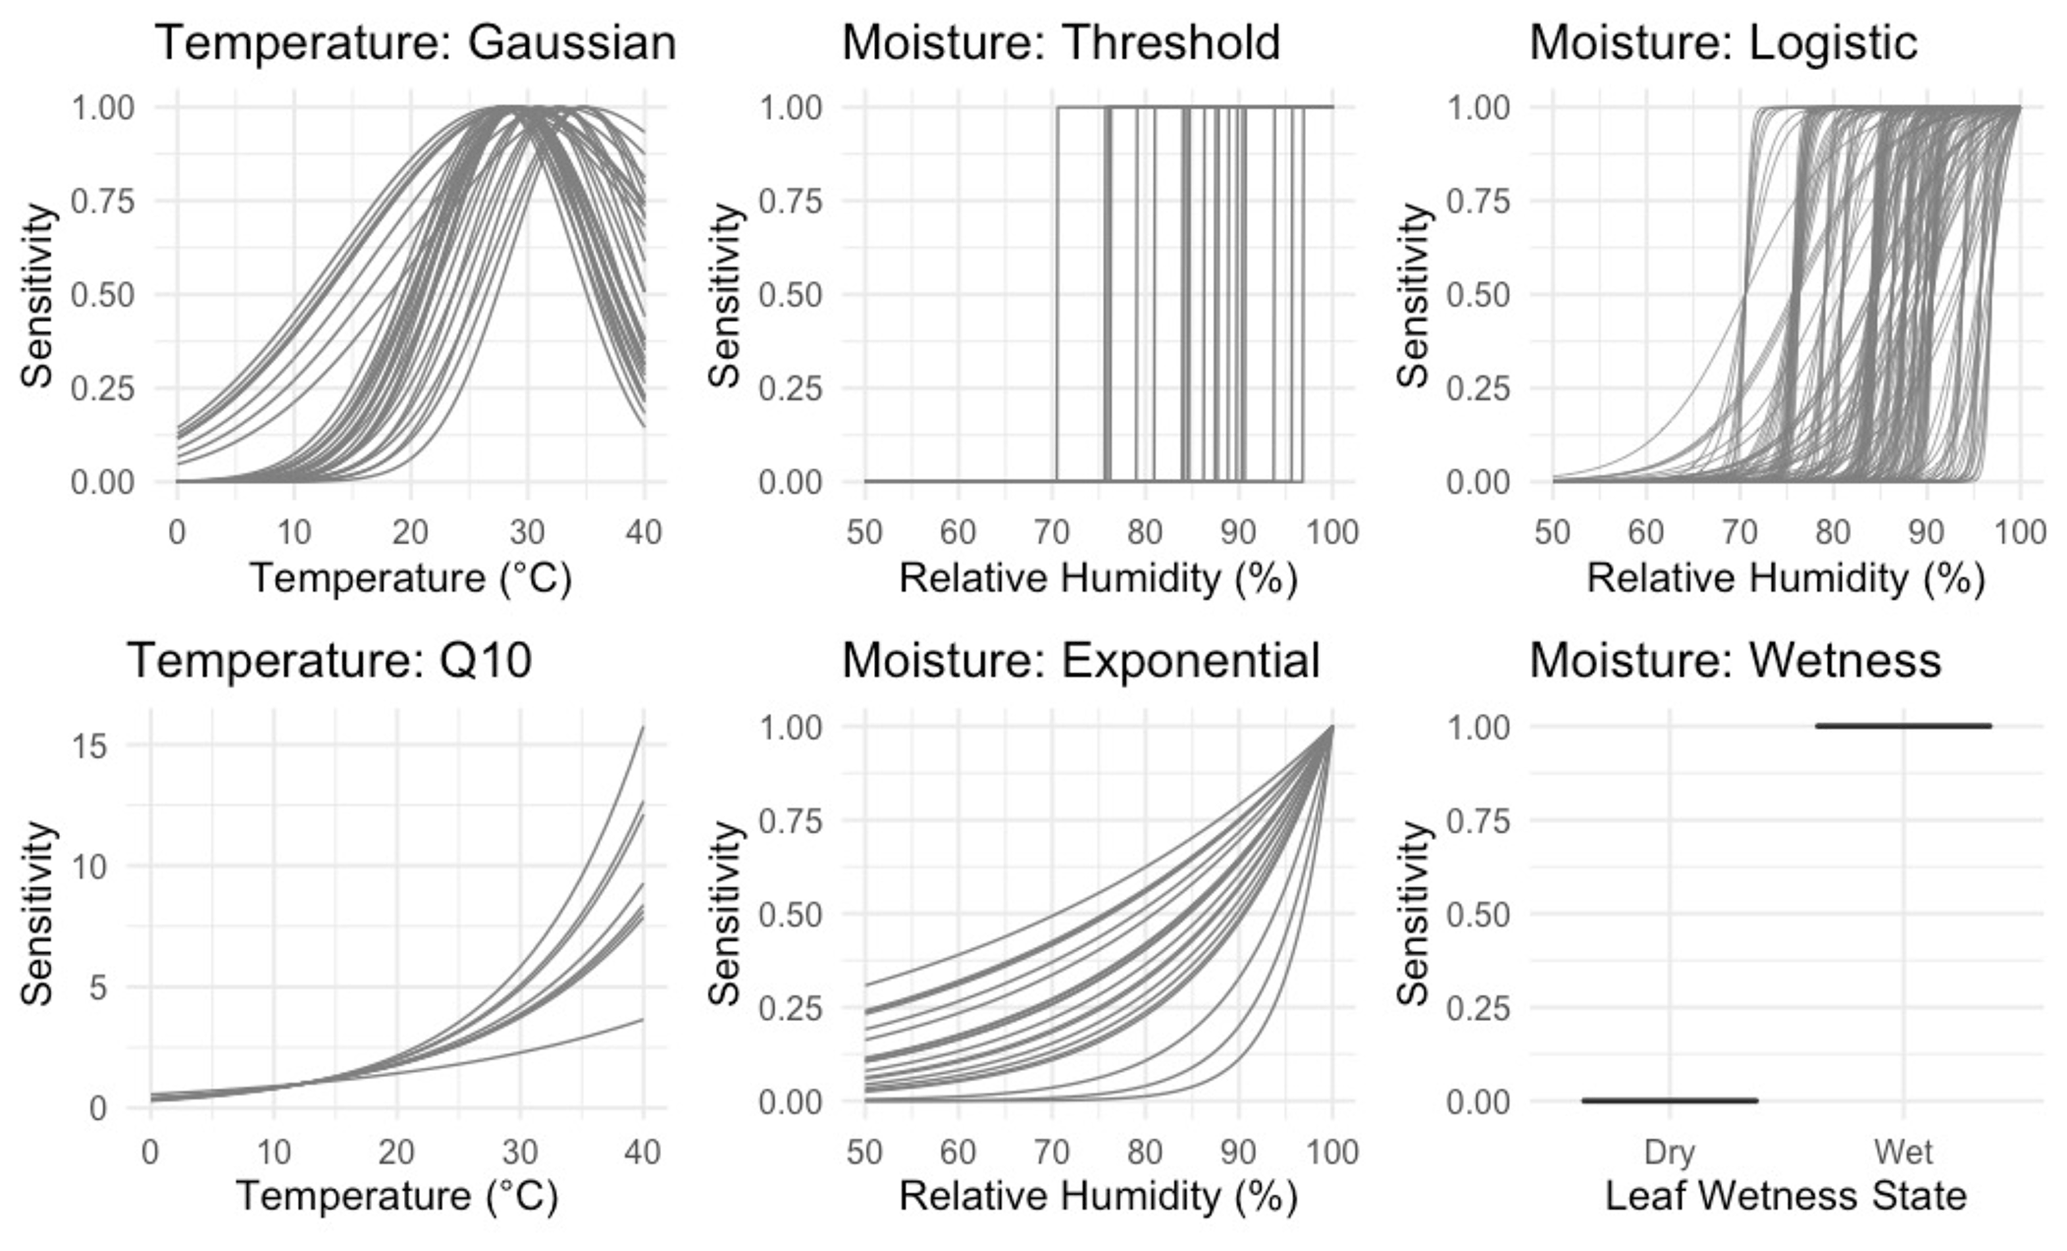
Figure 1Temperature and NRM sensitivity functions included in the models. Each curve shows one parameter combination chosen by random sampling using a normal distribution around a specified set of priors as identified in Table 2 (n=895 230 total combinations). The wetness moisture function has no parameter and is simply the proportion of time during each hour that the leaf wetness sensor detected the presence of moisture.
To model temperature dependence, we tested two common temperature sensitivity functions: a Q10 model and a Gaussian distribution. Q10 sensitivity is a monotonically increasing function that is used to model many biological process including litter decomposition (Sierra et al., 2015). Each increase of 10 ∘C above a reference temperature (Tref, often the site's mean temperature), results in an acceleration of the process in question by a given amount, called the Q10 coefficient. To account for possible negative temperature dependence above an optimum temperature (Topt), we also tested a Gaussian temperature sensitivity function. A Gaussian function is often particularly well suited for describing aggregated responses of entire communities (Low-Décarie et al., 2017), as is the case for the fungal communities on our tillers (Logan et al., 2021). Temperature sensitivity was normalized to 1 at Topt in the Gaussian model and Tref in the Q10 model. We tested each combination of moisture and temperature functions (as well as moisture-only and temperature-only versions) for a total of 15 different model structures and 895 230 model-parameter combinations.
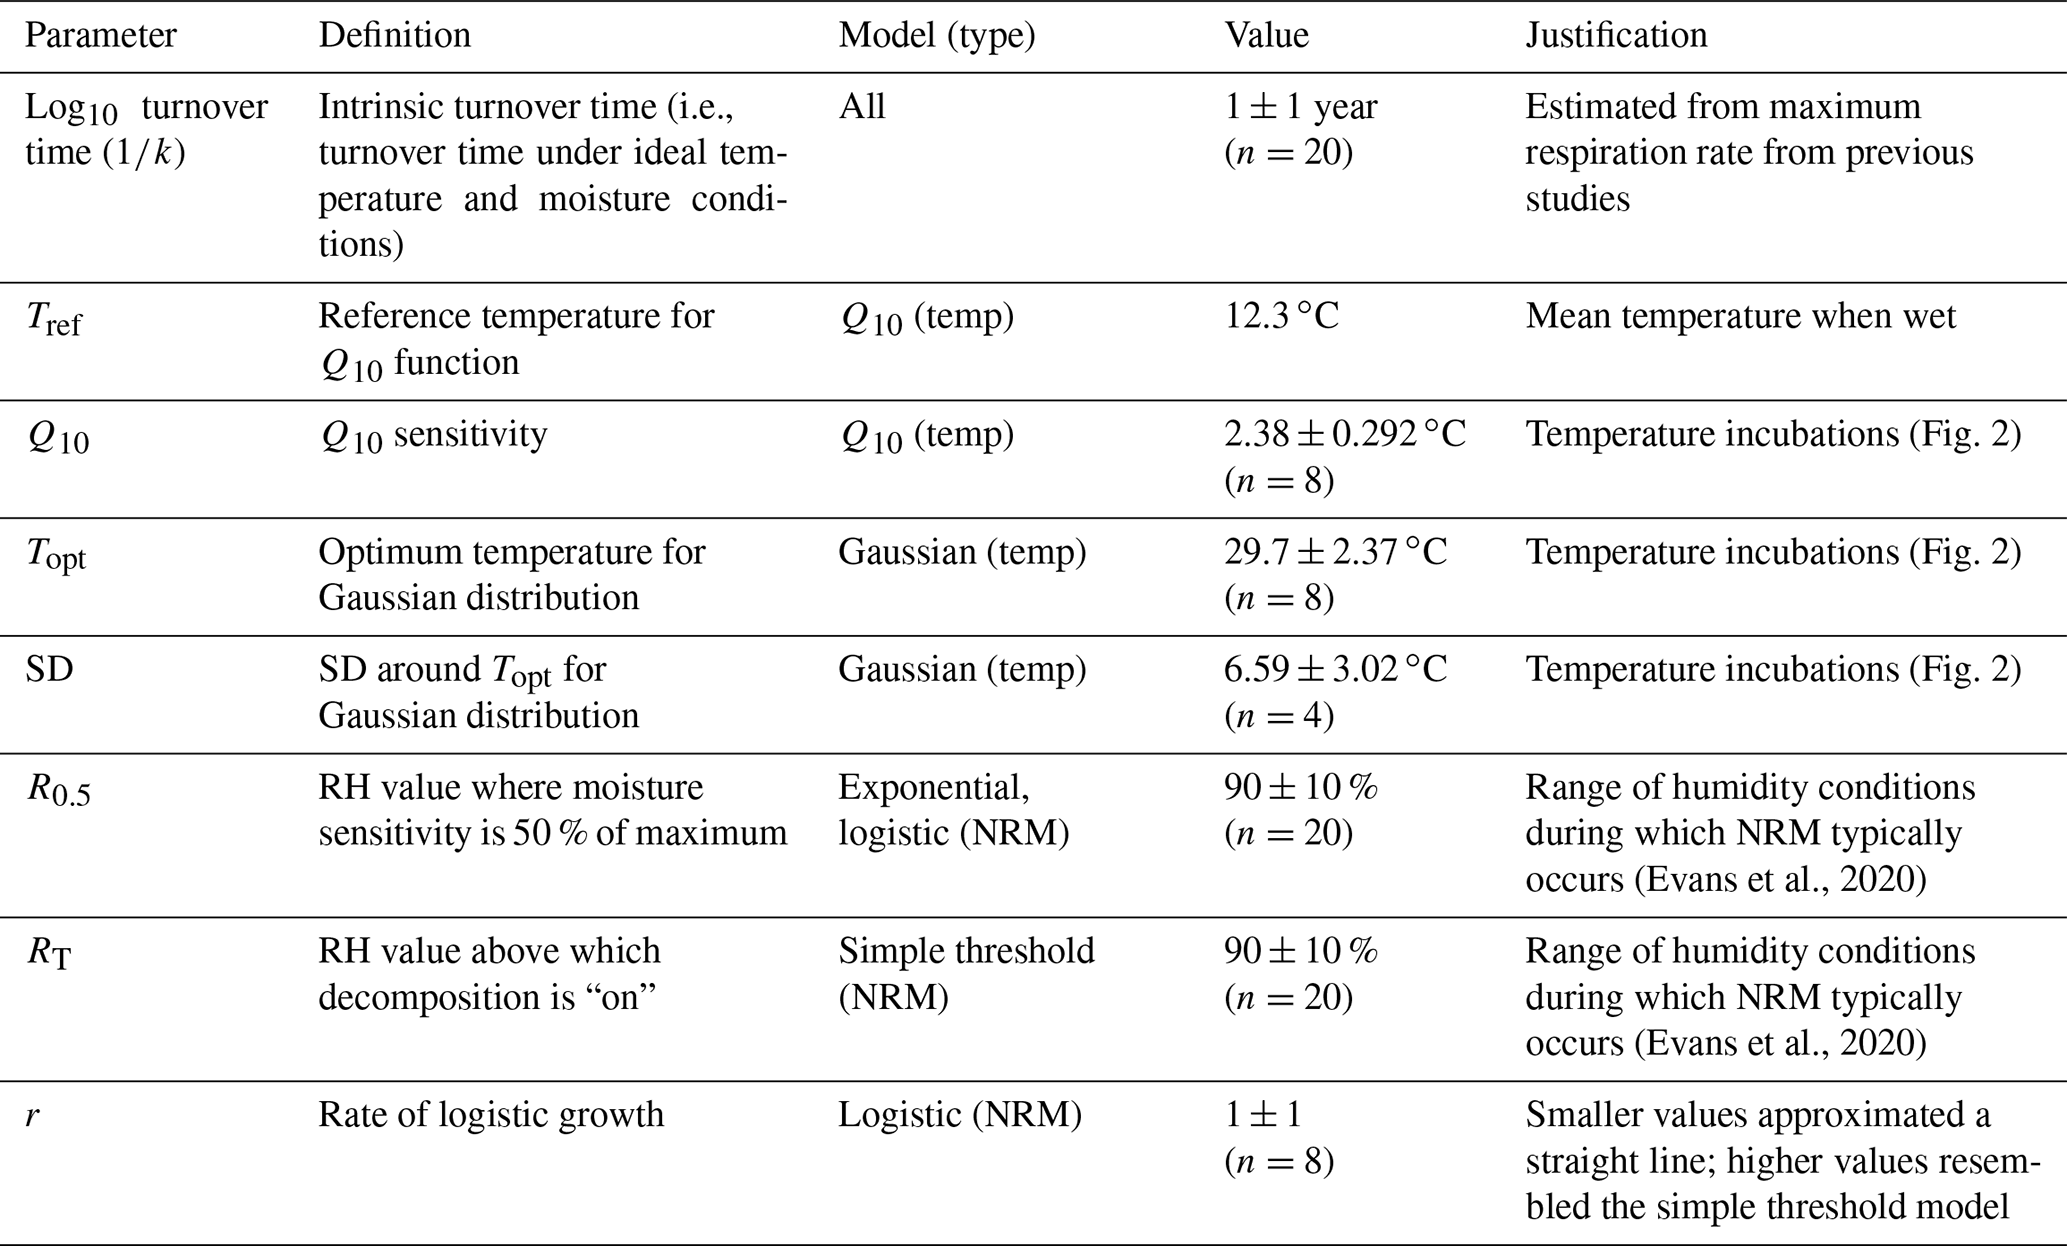
Table 1Moisture and temperature sensitivity functions. The first three moisture functions are based on relative humidity and the fourth is based on leaf wetness state. Moisture functions are normalized to 1 at 100 % relative humidity and temperature sensitivity functions are normalized to 1 at Tref and Topt. “RH” is relative humidity.

To understand the nature of the different models and compare them across a range of conditions, we performed two model runs. First, we explored a large parameter space to determine how parameters interact with one another across a wide range of hypothetical conditions. This included parameter values outside of realistic ranges (for example, relative humidity thresholds from 5 % to 99 % and an intrinsic litter turnover time from 0.1 to 100 years). This allowed us to see how parameters interacted with each other within the different models and explore general properties of each model. Next, to assess which models performed best under realistic conditions, we constrained the parameter space to more accurately reflect real world parameter values. For this model run, we determined optimal values for each parameter based on laboratory and field incubations and then randomly varied parameter combinations around these values; see next section for details. Parameter definitions as well as constrained values used in the second model run are reported in Table 2. Figure 1 shows the range of temperature and moisture sensitivities we used in the constrained model run.
We used the Akaike information criterion (AIC) to compare the constrained models to one another to determine which was the best fit to the data. AIC is a model selection criterion that rewards goodness of fit based on a log likelihood function while penalizing models with greater parameters to reduce overfitting biases (Aho et al., 2014). We report AIC values for all combinations of models from the constrained parameter run to compare model performance under realistic scenarios.
Table 2Parameter definitions and values used to constrain the second model run to realistic conditions. Values were randomly varied around means and standard deviations shown, with “n” denoting the number of iterations used for each parameter (n=895 230 total model-parameter combinations). For Q10, Topt, and SD, models were run with two standard deviations (i.e., twice the value shown below).
2.4 Constraining parameter space
We parameterized the models using a brute force approach where we randomized parameter inputs to represent conditions seen in the field (Table 2) and then selected the model-parameter combinations with the lowest AIC scores. To constrain temperature parameters, we performed a laboratory incubation of S. sabulicola tillers. We varied the temperature from 10 to 35 ∘C in 5 ∘C steps, allowing litter to equilibrate for 60 min before measuring respiration. We sprayed eight tillers with sterile deionized water until they were saturated to stimulate fungal activity and placed them in 55 mL acrylic tubes connected to a LI-8100A gas analyzer (LI-COR Biosciences, Lincoln, NE, USA), measuring mean flux during 3 min incubations. To measure the response of the specific fungal communities associated with litter used in the field study, all tillers used in the laboratory incubation were collected at Gobabeb, the same site where litter in the mass loss experiment was collected.
To calculate Q10, we excluded the measurements at 35 ∘C (when response becomes negative) and then used the Q10 function in the respirometry package in R to calculate a separate Q10 value for each tiller (Birk, 2021; R Core Team, 2020). For the reference temperature, we used the mean temperature when leaf wetness sensors were “wet” across all sites (12.3 ∘C). This value was fairly constant among sites, varying by less than 0.9 ∘C (Fig. A3). For the Gaussian temperature sensitivity parameters, we used the “optim” function in R to find the optimum temperature (Topt) and standard deviation (SD) around the optimum after normalizing flux rates to the maximum rate measured for each tiller (R Core Team, 2020).
The turnover time represents the litter's intrinsic decay rate under ideal temperature and moisture conditions and is equivalent to the inverse of kint, the exponential parameter in the decay function. To place a lower boundary on this value, we examined previous studies that measured respiration from S. sabulicola under wet conditions and extrapolated to estimate a minimum turnover time (in years) under ideal, non-limiting conditions. Jacobson et al. (2015) reported respiration rates from wet S. sabulicola tillers as high as 1.5 µg CO2-C g−1 L h−1, corresponding to an intrinsic turnover time of ∼0.63 years, assuming 50 % of plant litter mass is carbon. This is within the range of intrinsic turnover rates reported for other grasses (Zhang et al., 2008). We therefore used a turnover time with a mean of 1 year around a log-normal distribution. We varied the logistic growth parameter (r) of the logistic moisture sensitivity function around a value of 1, because at much lower values it began to resemble a straight line (i.e., no longer logistic sensitivity) and at higher values it converged on the simple threshold model.
3.1 Meteorological conditions and temperature incubations
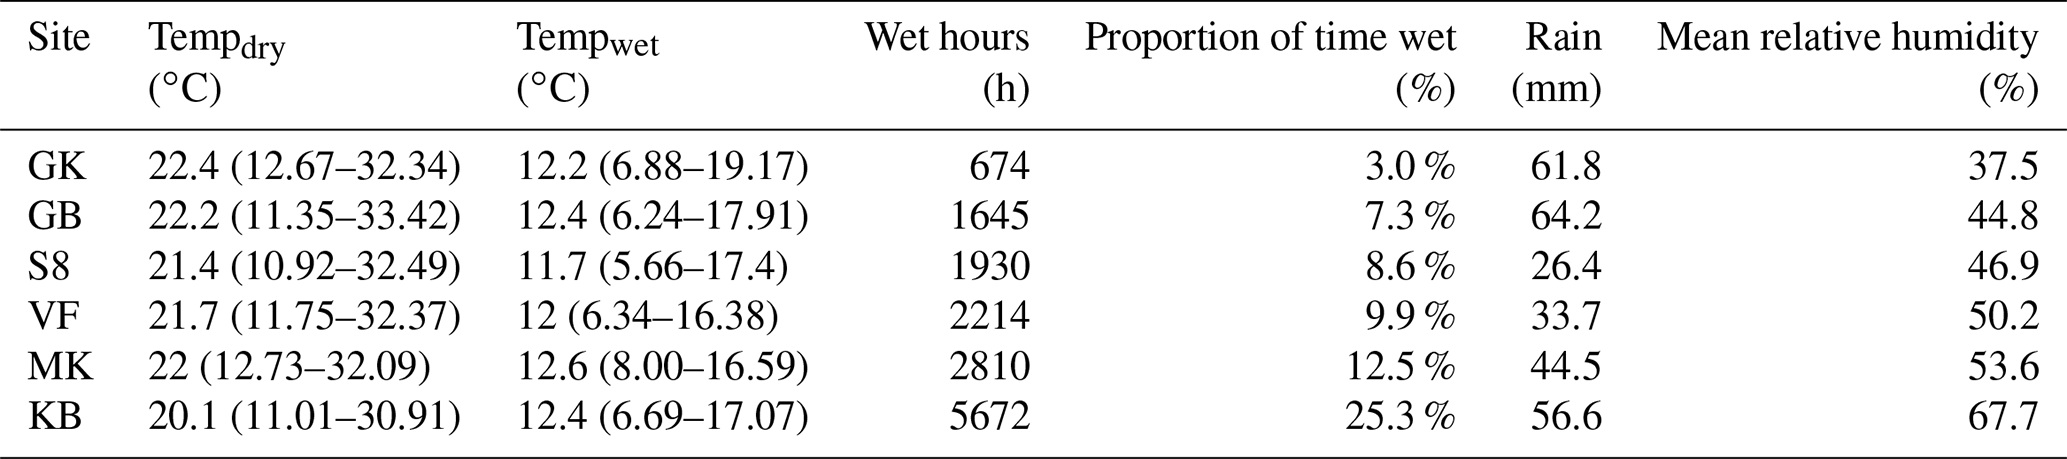
Moisture conditions varied substantially among the sites. Duration of wetness during the study period (as determined by leaf wetness sensors) ranged from 672 h (3.1 % of total hours) at the driest site (Garnet Koppie) to 5672 h (25.3 % of total hours) at the wettest site (Kleinberg). Drier sites tended to be warmer; mean temperature when dry was 2.3 ∘C warmer at the warmest site (Garnet Koppie) than at the coolest site (Kleinberg) (Table 3). Temperatures during NRM events were lower and less variable than temperatures during dry periods (Table 3). Wet conditions almost never occurred when temperatures were above 20 ∘C at any site (Fig. A3). Average relative humidity differed among the sites and was correlated with hours of wetness. Rainfall occurred at all sites during the study period, ranging from 26.4–64.2 mm, but did not correlate with NRM frequency. The optimum temperature for respiration in the incubations was 30 ∘C, with flux rate dropping at 35 ∘C (Fig. 2).
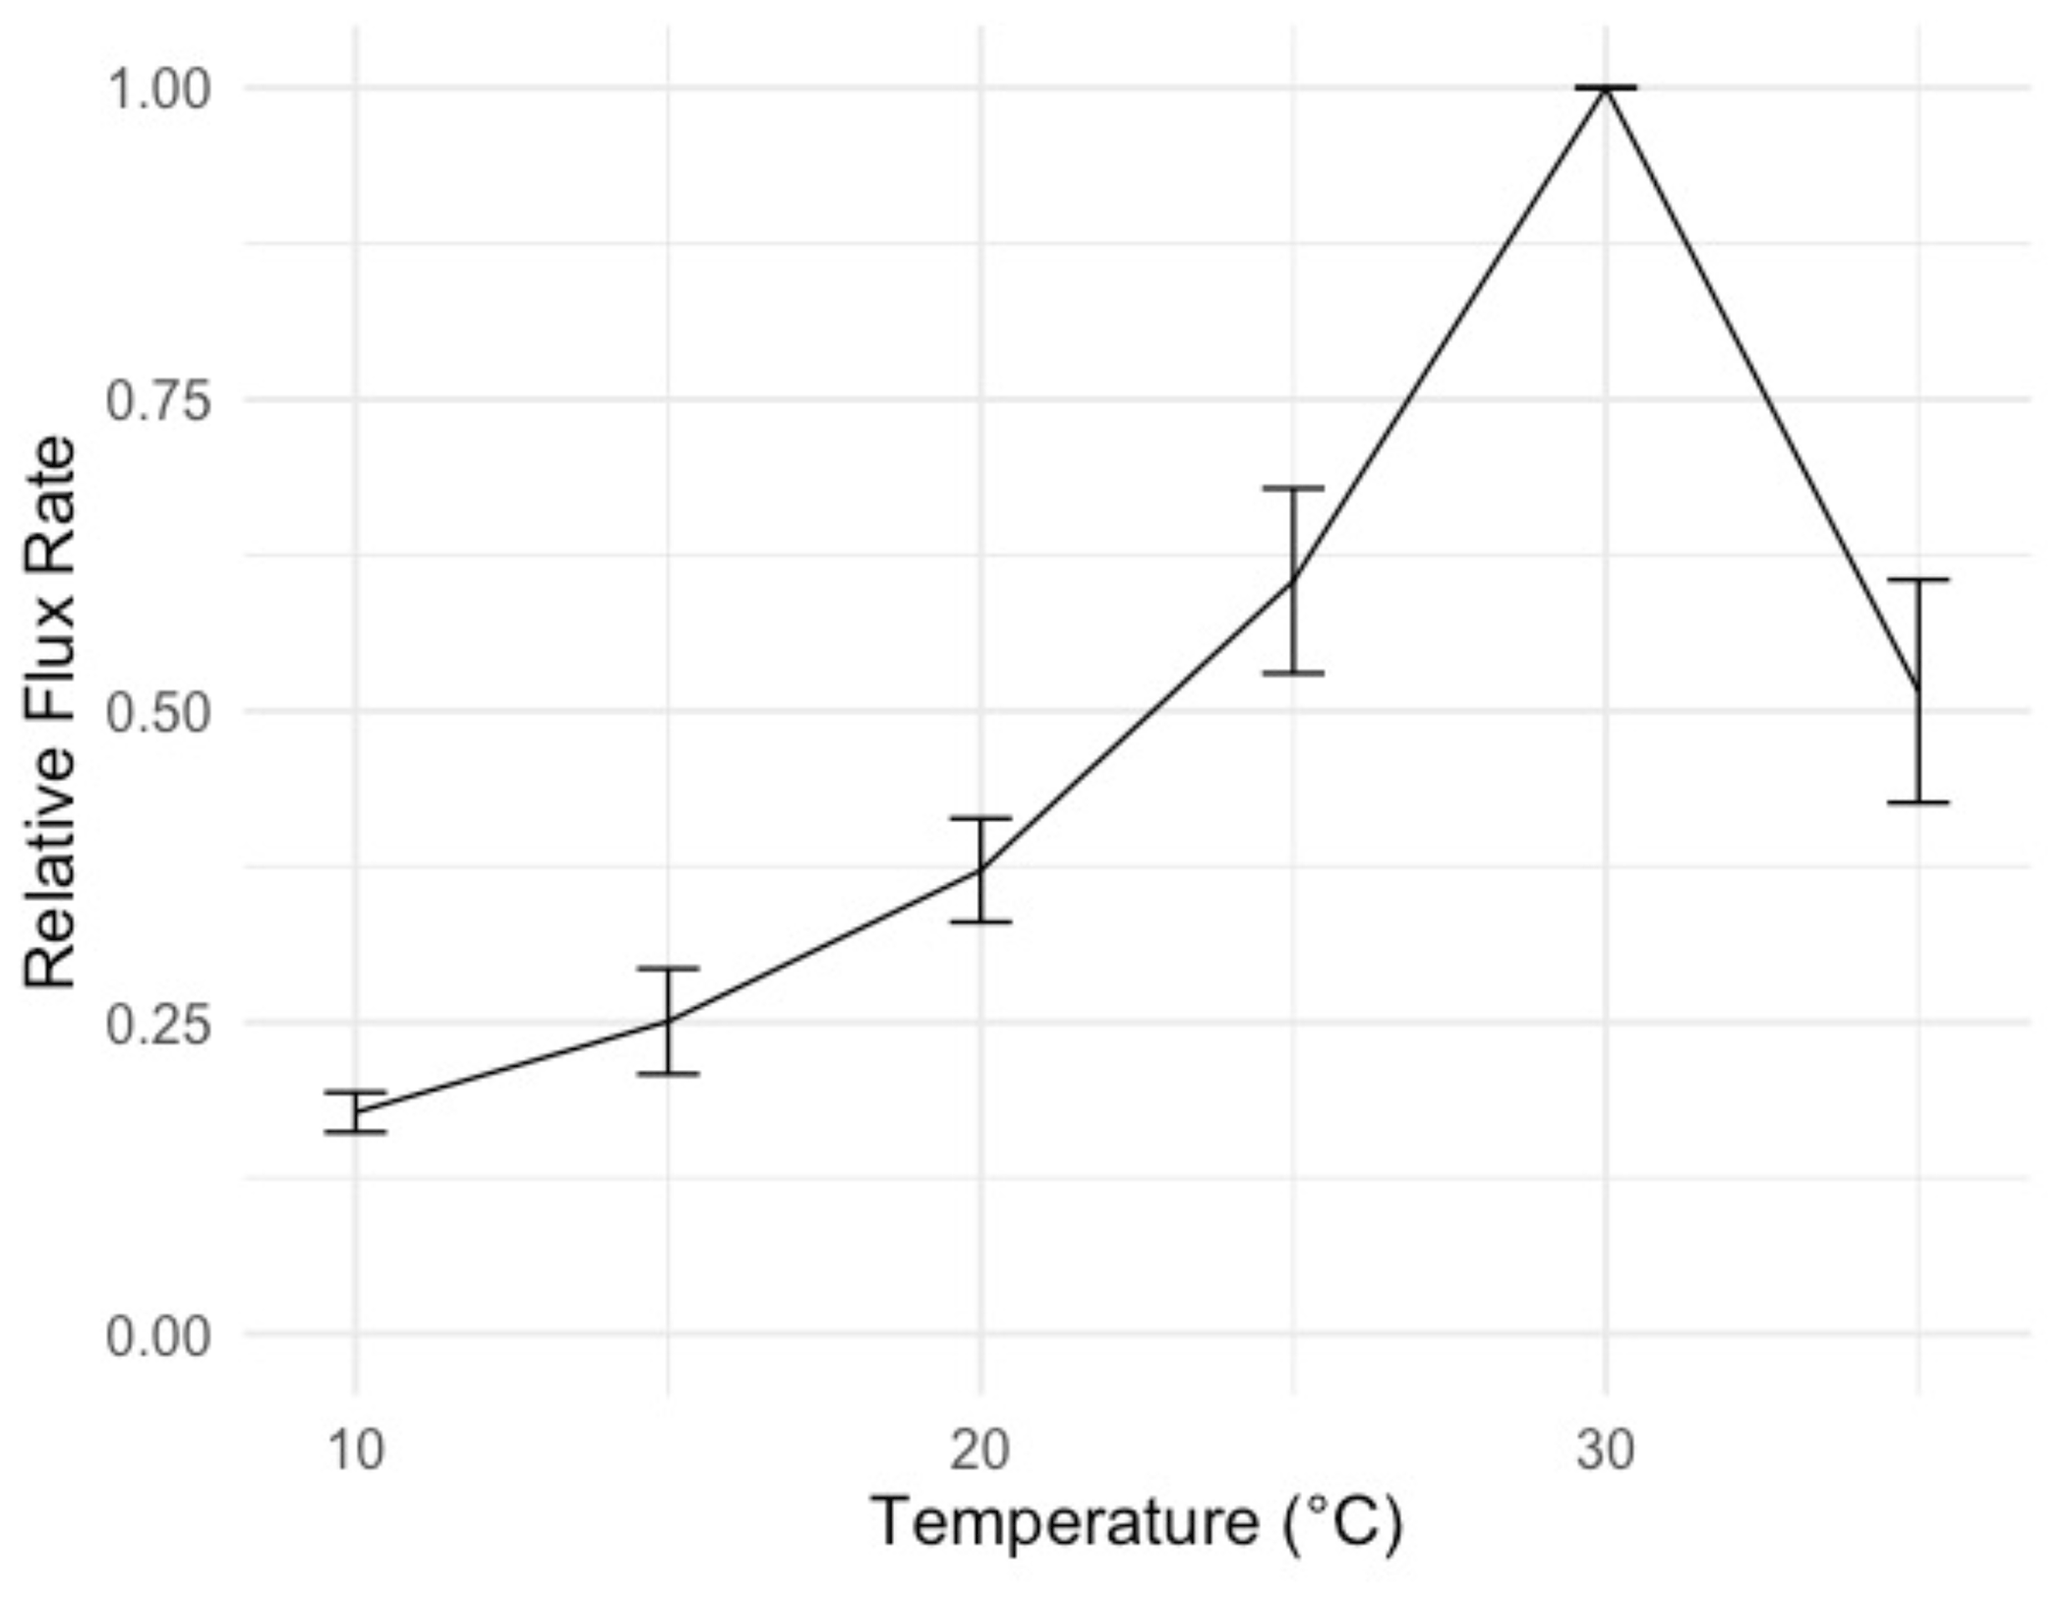
Figure 2Temperature sensitivity of respiration from S. sabulicola tillers in a laboratory incubation, used to constrain temperature parameters (mean ± 1 S.E.M., n=8). Flux rate is normalized to the rate at 30 ∘C. Tillers were sprayed with deionized water until saturated and respiration was measured at 5 ∘C intervals.
Table 3Summary of meteorological conditions at each site during the study showing mean temperature when dry, mean temperature when wet, wet hours during the entire study period (as determined by leaf wetness sensors), the proportion of total time when conditions were wet, accumulated rainfall during the study period, and mean relative humidity throughout the study period. Temperature ranges in parentheses report the middle 95 % of data. Mean temperatures apply to the time period used in this study but should not be used to infer mean annual temperatures for each site since the study lasted 2.5 years and therefore data from January–August are represented more than September–December. Full names for sites are included in Fig. A1.
3.2 Litter mass loss
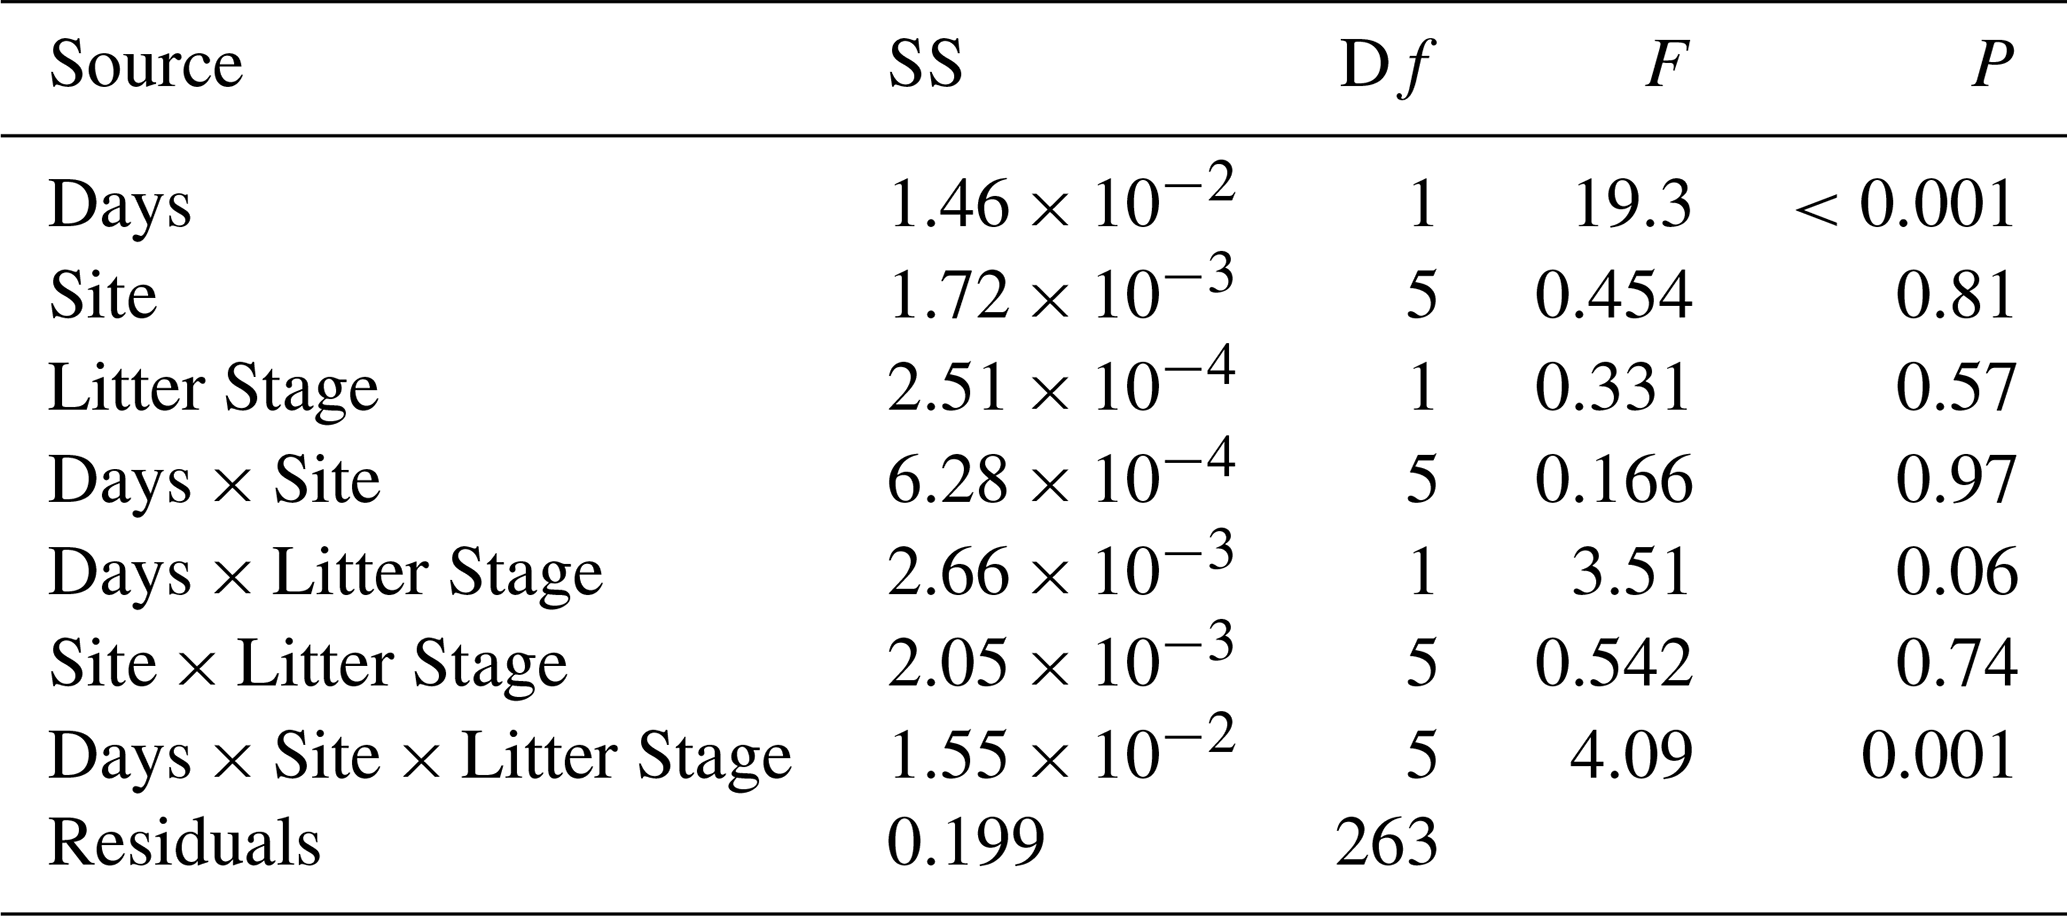
In general, mass loss was greater at sites with more NRM and lower at sites with less NRM (Figs. 3, A7). There was a significant three-way interaction between litter stage, site, and time (Table A1 in Appendix). Within each site, early-stage and late-stage litter decomposed at comparable rates for the first 18 months, but diverged after that depending on the site (Fig. 3). After 24 months at the 2 driest sites, early-stage litter lost more mass than late-stage litter. At the four wettest sites however, late-stage litter experienced the greater mass loss (Fig. 3).
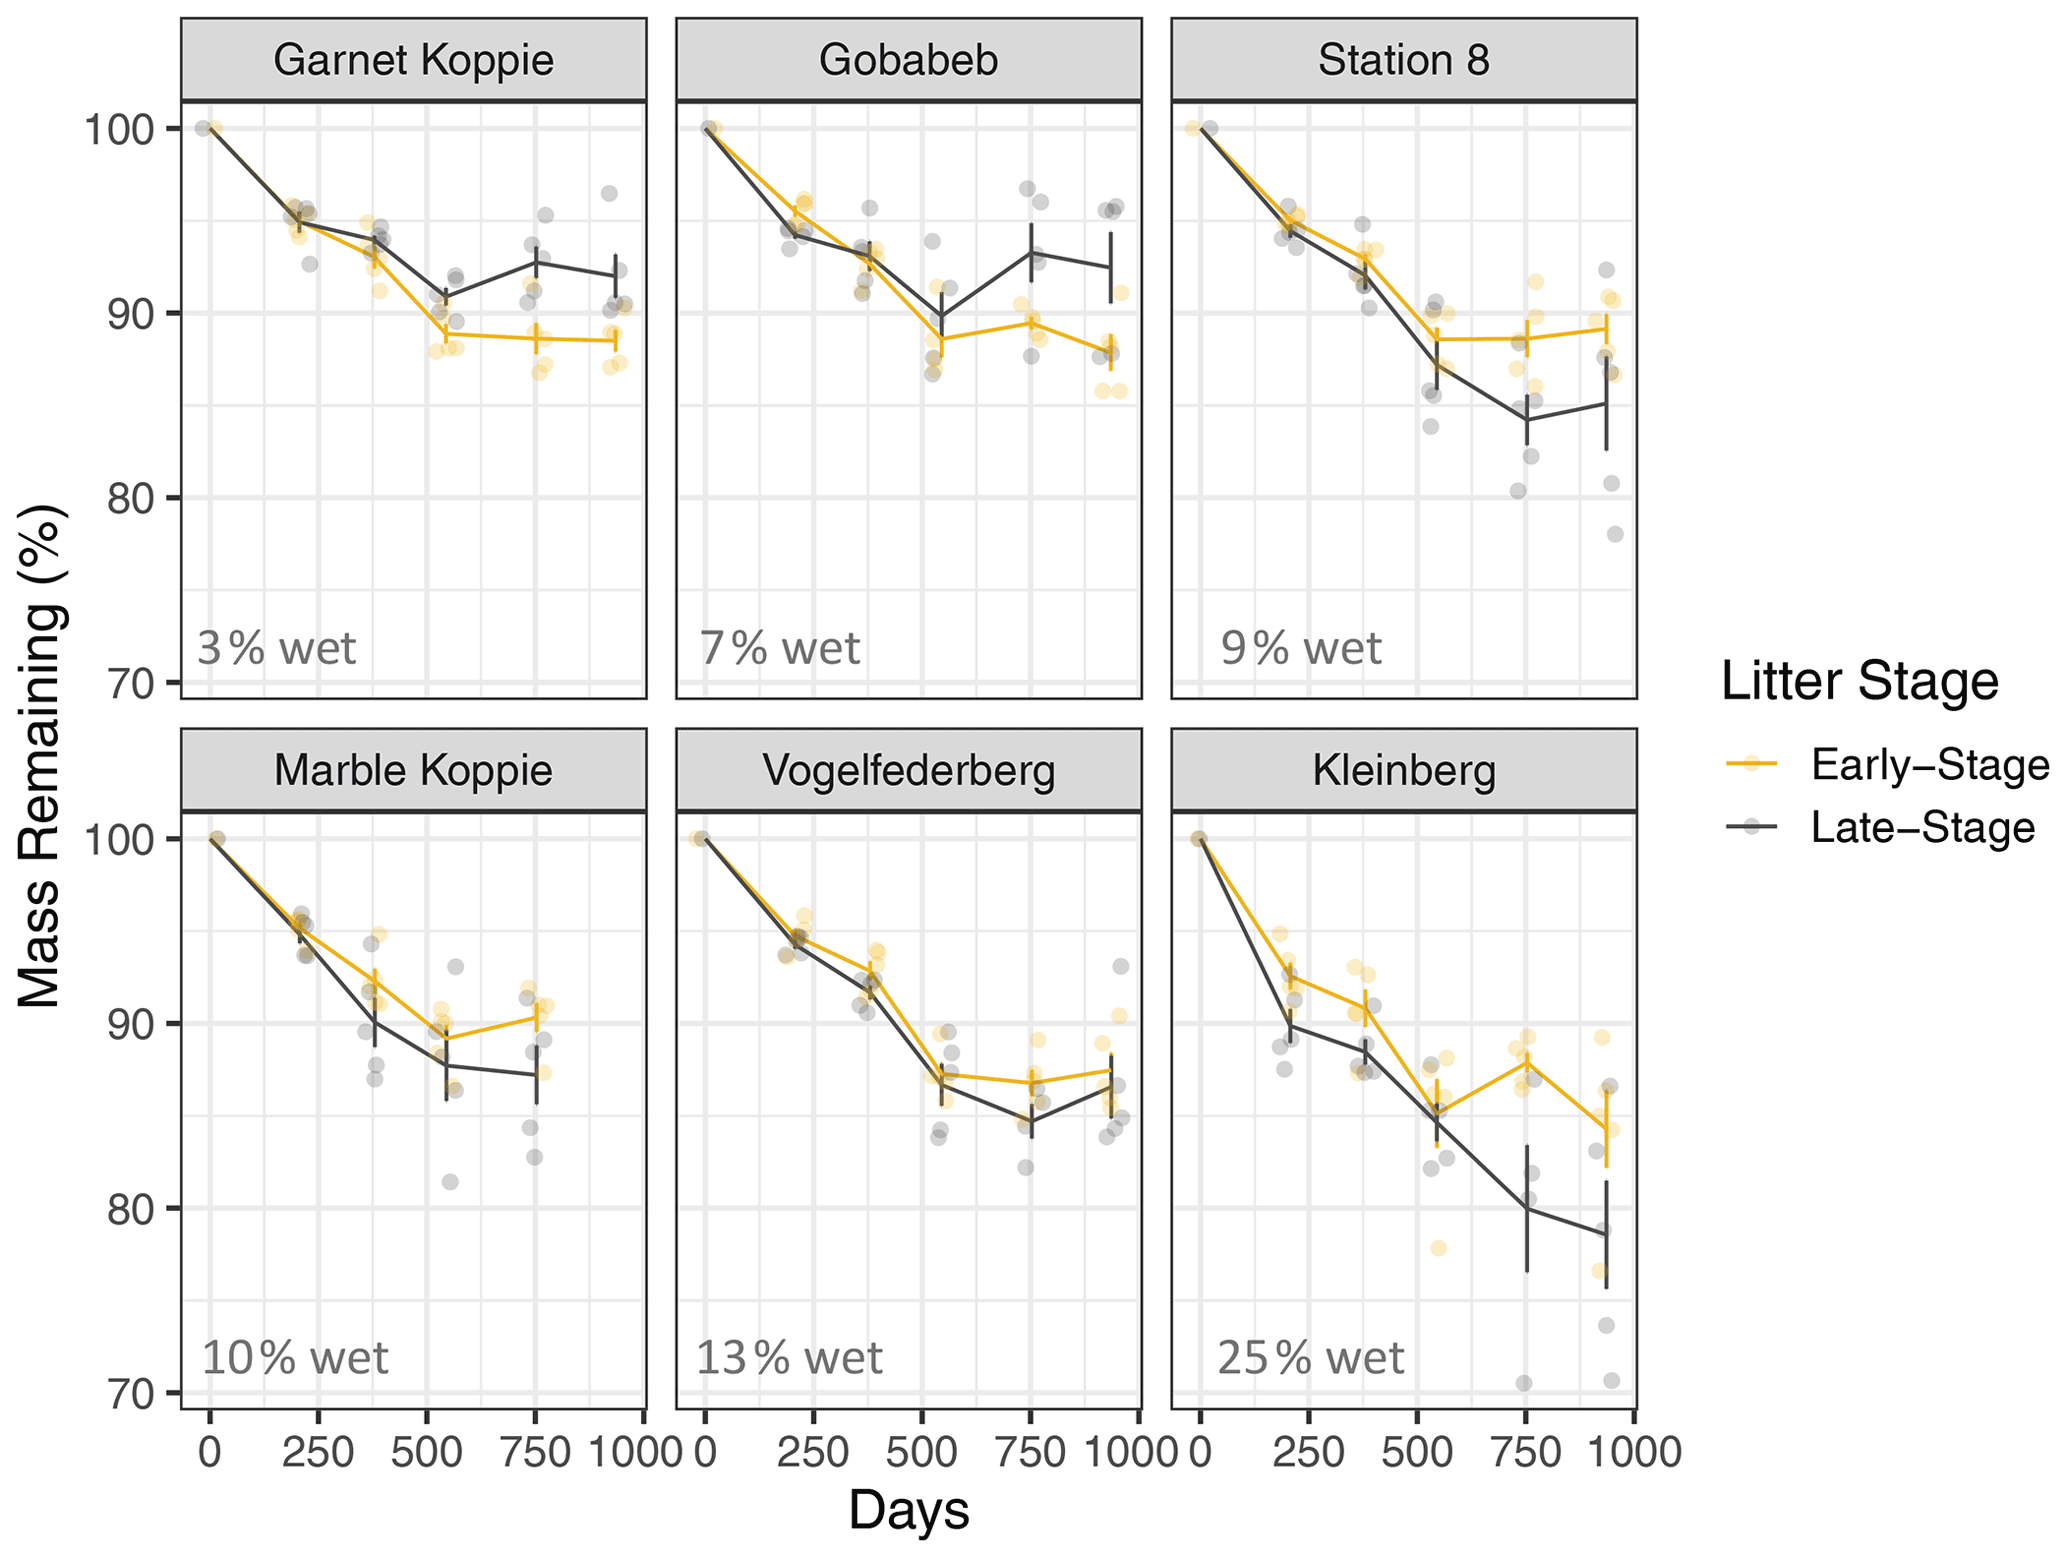
Figure 3Mass loss for early-stage (yellow) and late-stage (gray) tillers at each site (mean ± 1 S.E.M.). Percentage values in the bottom of each panel show the average proportion of time throughout the study period that the site has liquid water, as determined by a leaf wetness sensor. Note: tillers did not actually increase in mass; the apparent increase at some time points in some panels is merely a result of variation among tillers, since we destructively harvested tillers at each time point and could therefore not take repeated measurements of each tiller.
When we used a simple exponential decay model without temperature and moisture sensitivity (Eq. 1), the effective decay rate at each site was correlated with NRM duration but not with accumulated rainfall (Fig. 4). Late-stage litter (i.e., tillers with more well-established fungal communities) responded more strongly to NRM than did early-stage litter; for every additional 1000 h of wetness at a site, the effective decay rate increased by 0.0043 yr−1 for early-stage litter and 0.014 yr−1 for late-stage litter (Fig. 4).
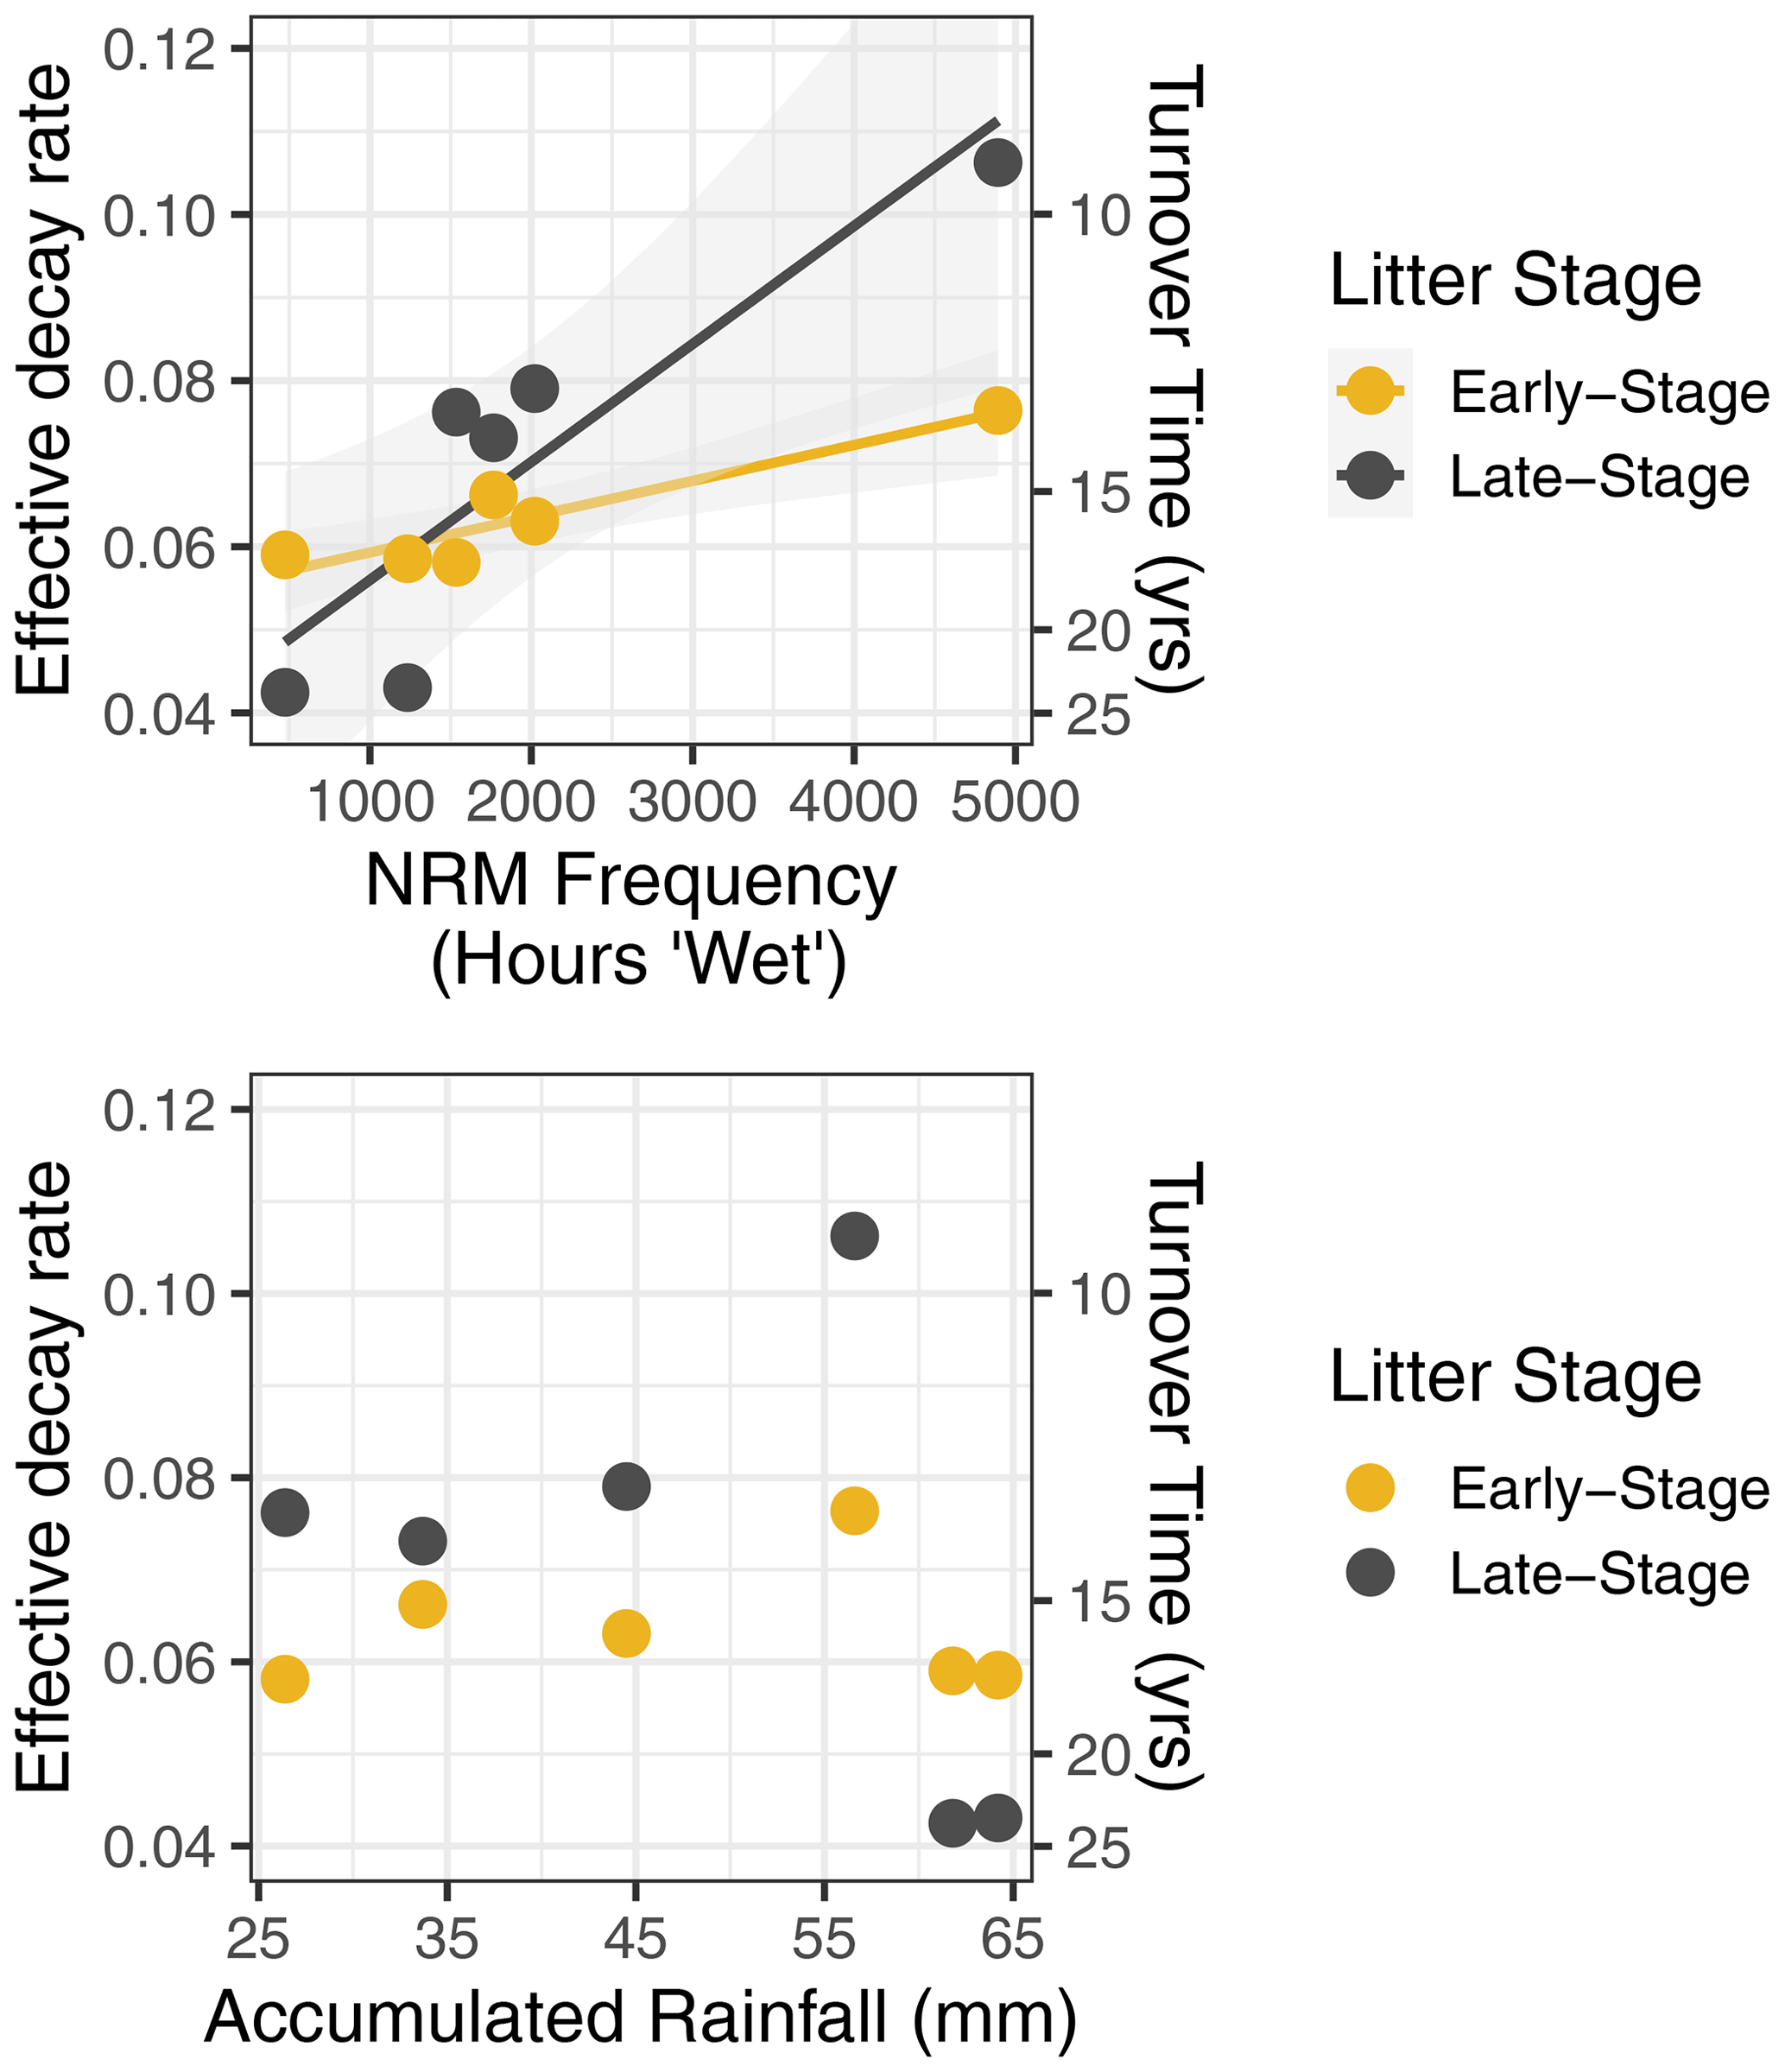
Figure 4Effective decay rate calculated without explicit temperature or NRM sensitivity (Eq. 1) relative to NRM frequency and accumulated rainfall during the study period. Among sites, decay rate constant was strongly correlated with the proportion of time that a site experienced NRM conditions (early-stage: R2=0.87, P=0.007, slope = ; late-stage: R2=0.80, P=0.02, slope = ) but was uncorrelated with total rainfall (early-stage: R2=0.01, P=0.87; late-stage: R2=0.14, P=0.46).
3.3 Model parameter space exploration
For the three NRM sensitivity functions based on relative humidity, parameter values showed a tradeoff between turnover time and RH thresholds (Fig. 5): parameter combinations with the lowest AIC scores featured either slow turnover times and a low RH threshold (bottom right of plots) or faster turnover times and high RH thresholds (upper middle of plots). When we fit parameters separately for each site instead of globally, AIC values improved, but the actual values of the best parameter combinations did not change (Fig. A4). Similarly, fitting parameters separately to early-stage and late-stage tillers did not produce different optimal parameter values (Fig. A5).
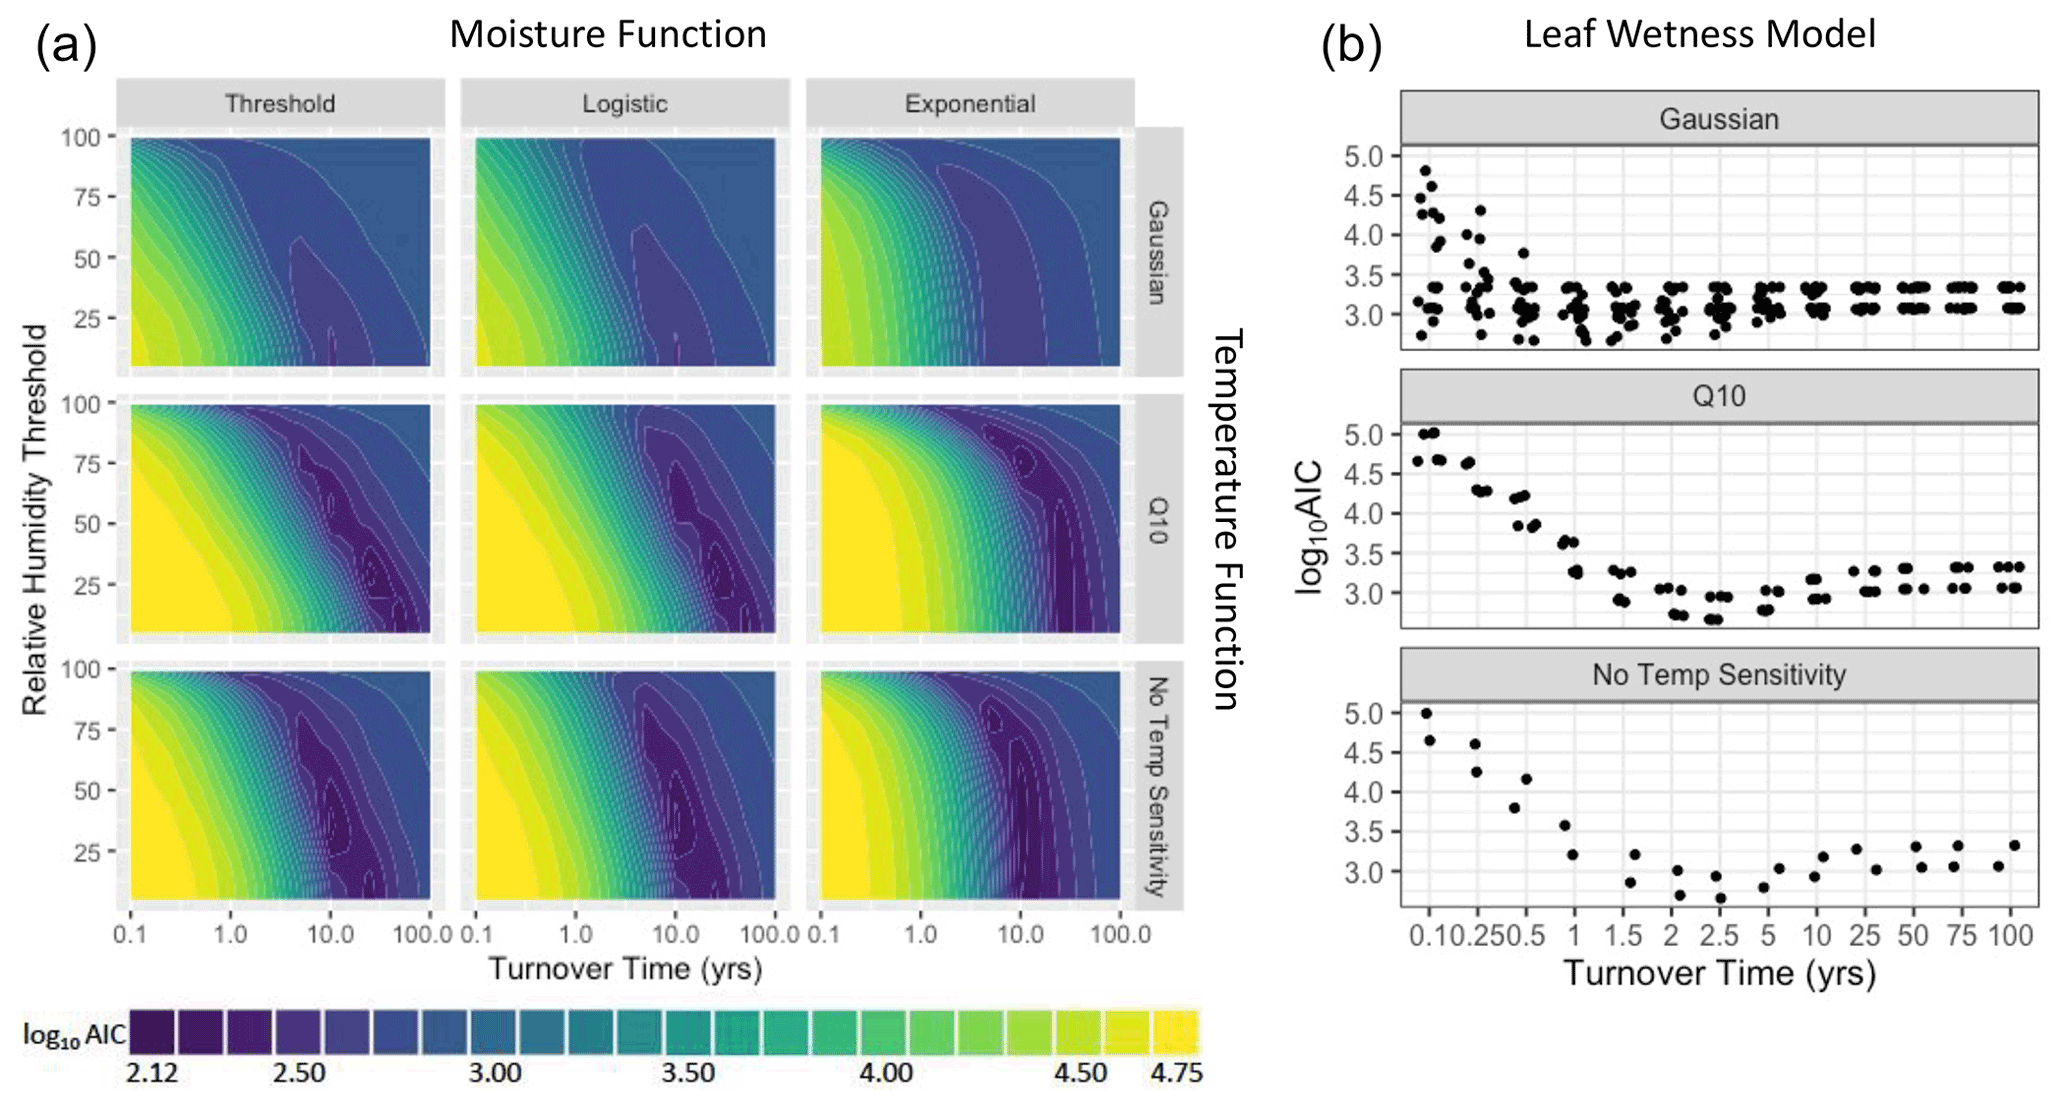
Figure 5Parameter fits for the first model run showing parameter combinations across a wide range of hypothetical conditions. (a) The three humidity-based NRM functions showing the relationship between turnover time () and relative humidity threshold (RT or R0.5). Colors represent log10 AIC scores; models with better fit to the data have lower scores. (b) Parameter estimation for the leaf wetness-based moisture function showing log10 AIC as a function of turnover time (). Plots have different numbers of points because of different numbers of temperature parameters that were tested (the Gaussian temperature function has two, the Q10 function has one, and the bottom plot has no temperature parameters, only early-stage and late-stage tiller combinations).
Models that included Q10 temperature sensitivity converged on slower intrinsic decay rates (i.e., longer turnover times) than those using a Gaussian temperature sensitivity or temperature-independent model (Fig. 5). The wetness sensitivity functions yielded an optimal litter turnover time of 2.5 years under a moisture-only and Q10 temperature sensitivity model (Fig. 5). Using a Gaussian temperature sensitivity yielded a faster intrinsic decay with an optimal turnover time of 0.5–1.5 years.
3.4 Model performance comparison
Models that included NRM sensitivity had better fits than the simple litter decay model, but the best models included both NRM and temperature sensitivity (Fig. 6). While model fit improved (AIC scores were lower) whenever NRM sensitivity was included, the degree to which NRM sensitivity improved the model fit depended on the temperature sensitivity function. In particular, models with Gaussian temperature sensitivity performed better than those with Q10 sensitivity or no temperature sensitivity, a finding consistent with the fall off in decay seen in the incubations (Fig. 2). Surprisingly, after controlling for temperature response, each of the four moisture functions had similar AIC scores, with no single moisture model performing appreciably better than the others (Fig. 6).

Figure 6Frequency distribution of model performance (log10 AIC scores) for each model combination of temperature and moisture sensitivities. Each observation represents one parameter combination after constraining as described in Table 2. Lower log10 AIC scores denote better model fit to the data. This figure only shows models constrained using realistic parameter estimates described in Table 2 (n=895 230).
Including temperature sensitivity alone (without NRM) did not improve model fit as well as modeling only NRM sensitivity (without temperature). All of the NRM-only models (Fig. 6, bottom row) had better fits than temperature-only models (Fig. 6, right column), although each showed a wide range depending on the specific parameter combinations. In fact, an unconstrained model with Q10 temperature sensitivity but no moisture sensitivity converged on an optimal Q10 value <1, indicating a negative temperature dependence of litter decomposition (Fig. A6), the opposite of what we observed in the temperature incubations.
When we compared one of the best models that included temperature and NRM sensitivity (specifically, a Gaussian temperature function and an exponential moisture function) to a simple decay model that had no temperature or NRM sensitivity but varied effective decay rate among sites (Eq. 1), we found that the temperature and NRM model performed better (Fig. 7). The Gaussian exponential model had lower AIC scores and the slope of the observed vs. predicted values was closer to 1, yielding more realistic mass loss predictions (0.85 for Gaussian exponential model, 0.71 for simple decay model).
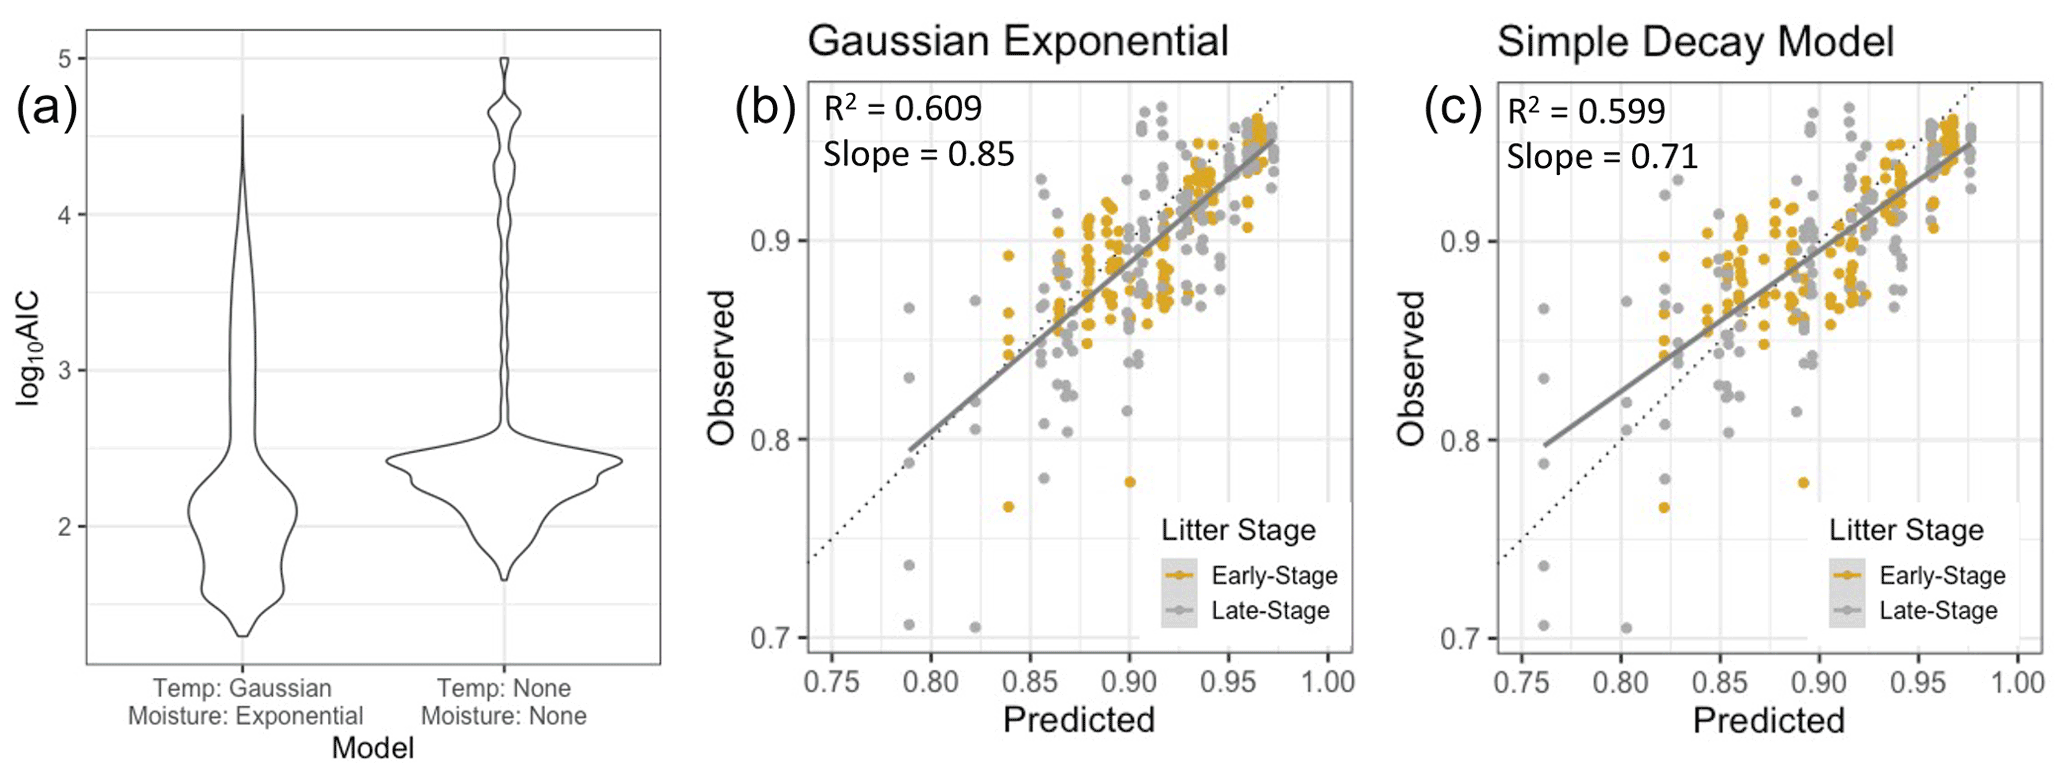
Figure 7(a) Fit of the model using Gaussian temperature sensitivity and exponential moisture sensitivity vs. a simple exponential decay model (without temperature or NRM sensitivity) in which Keff is allowed to vary independently for each site (lower log10 AIC scores denote better model fits). The simple decay model depicted here differs from the one in Fig. 6 because this one uses Keff and is not constrained to the same set of parameters. (b, c) Model predictions for the best version of the Gaussian exponential model versus the simple decay model with site-specific Keff values. Solid lines are the best fit lines and dotted lines are the ideal 1:1 line.
4.1 Model performance
Decomposition is a crucial component of Earth system models and NRM is an important moisture source in arid and mesic grasslands worldwide. In a first attempt at modeling NRM-driven decomposition, Evans et al. (2020) compared litter decay rates in a hyperarid and a mesic grassland, showing that decay rates are faster when NRM is more frequent. We build on this work by demonstrating a scalable quantification of the relationship between NRM, temperature, and litter decay rates. Doing so is an important step to improving Earth system models, which must be validated with field measurements made under realistic conditions (Bonan et al., 2013). Using a 30-month, multisite field experiment, we show that explicitly accounting for both temperature and NRM sensitivity improved a litter decay model in an NRM-affected system.
While incorporating either NRM sensitivity or temperature dependence improved model performance, it was the inclusion of both that led to the largest improvement. Decomposition temperature sensitivity often depends on moisture conditions (Petraglia et al., 2019). For example, in soils, temperature typically increases decay rates when moisture is abundant, but higher temperatures can dry out soils, slowing decomposition (Bear et al., 2014). Similarly, in our system, NRM increases litter moisture content (Jacobson et al., 2015), but fog and dew only form at cooler temperatures, when decomposition is slower; once temperatures get high enough (in this case, above 20 ∘C; Fig. A3), wet conditions soon cease, making the positive effects of temperature moot. We find that this nuance about NRM gives rise to unrealistic predictions when models include only one type of sensitivity but not the other. For example, in our unconstrained model run, a model with only temperature dependence, but no NRM sensitivity, converged on a Q10 temperature sensitivity <1, indicating negative temperature dependence (Fig. A6), even though incubation data clearly show a positive relationship across the range of conditions tillers experience in the field (Fig. 2). This shows that both temperature and NRM sensitivity were needed to realistically capture litter decay dynamics under NRM conditions, lest one mask the effects of the other, yielding unrealistic results.
The choice of temperature sensitivity function is often very important in modeling biological processes and can lead to quite different predictions (Low-Décarie et al., 2017). We found that model performance was better using a Gaussian rather than a Q10 temperature sensitivity function. Surprisingly, we found that the different NRM sensitivity functions, including both continuous and threshold functions, described litter decay dynamics similarly well. While the threshold, logistic, and wetness moisture sensitivity functions share a general form in which decomposition rates increase substantially above a specific relative humidity value, the exponential function simulates gradually increasing decay rates at different relative humidity values. In this sense, the exponential function more accurately mimics the moisture absorption curves seen in field and laboratory studies (Dirks et al., 2010; Evans et al., 2020; Tschinkel, 1973). Despite these differences, however, each of these functions led to similar model performance. This suggests that while explicitly including sensitivity to NRM is important, the specific manner in which moisture is represented in the model may be less important. NRM-explicit litter decay models in the future may be able to represent NRM with fewer parameters by adopting a simple threshold approach, eliminating the need to parameterize multiple moisture components. Since relative humidity is a standard meteorological measure (unlike leaf wetness), future models should be able to use existing data sources to incorporate NRM, eliminating the need to collect additional data with specialized instrumentation (Evans et al., 2020).
4.2 Litter properties
By deploying both recently senesced and precolonized litter, we were able to study the effect of NRM on litter decomposition at early and late stages in the decay process. The fact that early-stage litter decomposed faster than late-stage litter at the two driest sites is likely because early in the decay process decomposer communities are small and photodegradation of the cuticle is a more important contributor to mass loss than microbial decomposition (Logan et al., 2022). As a result, decomposition becomes more sensitive to moisture later in the decay process. Once fungal communities were well established (as on later-stage tillers), litter decomposition was more sensitive to moisture availability, which is why late-stage tillers decomposed faster at the wetter sites (Fig. 3). By deploying litter at different stages of decay across a wide moisture gradient, we showed that sensitivity of litter decomposition to NRM appears to increase over time.
Surprisingly, early-stage and late-stage litter had similar relative humidity thresholds for decomposition even though older litter tends to absorb more water during fog and dew events (Logan et al., 2022). In the absence of rain, litter moisture content rarely reaches biologically significant levels until relative humidity reaches at least 70 %–80 % (Dirks et al., 2010; Evans et al., 2020; Tschinkel, 1973), but this depends on several factors including the permeability of the litter to water, the amount of time it spends in humid conditions, and the decomposer community's sensitivity to moisture (Tschinkel, 1973; Logan et al., 2021, 2022). While the simple threshold-based moisture function performed very well in this study, future studies will likely need to parameterize the moisture threshold to fit the dominant litter type in their locales.
Despite converging on the same parameter values, model fits were much better for late-stage litter than for early-stage litter (Fig. A5). This could reflect the fact that the larger fungal communities on late-stage tillers enable them to respond to moisture more strongly than early-stage tillers, which do not yet have a large enough decomposer community to have a strong biological response to NRM. This is consistent with the results from our simple decay model (without explicit temperature and moisture sensitivity), which showed that effective litter decay rates for late-stage tillers were 3.3 times more sensitive to changes in NRM frequency than early-stage tillers (Fig. 4). Since the major differences between the early-stage and late-stage tillers used in this study are their degree of prior fungal colonization and their ability to absorb water, this reinforces the importance of fungal communities as mediators of decomposition response to NRM (Logan et al., 2021) and suggests that plant litter properties related to moisture absorption may influence NRM sensitivity (Logan et al., 2022). Examining whether these properties have the same influence on NRM-driven decay of other plant species may increase the generalizability of the response functions we present here.
4.3 Incorporating into existing Earth system models
Developing models that realistically predict carbon turnover is a multistep process that requires determining a model structure, parameterizing, and accounting for external forcings (Luo et al., 2015). Our goal was to compare several potential structures for modeling NRM-driven litter decomposition, but fully incorporating NRM sensitivity into existing Earth system models will require additional work. This includes identifying the appropriate temporal resolution at which to model NRM events. The time steps used by Earth system models have shortened considerably over the last two decades, to the point where processes that were once represented monthly are now modeled on hourly time scales or less (Sokolov et al., 2018; Bolker et al., 1998; Bonan et al., 2013). We used hourly averages of minute data to describe decomposition rates, but do not yet know what temporal resolution is necessary to fully capture NRM events. Future studies can compare estimates using minute data (that have the benefit of capturing the wetting and drying dynamics of litter at the start and end of NRM events) to daily time scales, that can estimate NRM-driven decomposition from daily mean relative humidity. In the case of longer (daily) time scales, temperature dependence may be best determined using the minimum daily temperature instead of mean temperature, since minimum temperatures are likely to occur at night when NRM is most common. Of course, these methods will require additional testing, but since our models were relatively insensitive to the specific nuances of how NRM was modeled, any of several approaches may be appropriate depending on the structure of the decomposition model in use.
We used relative humidity and leaf wetness sensor data to parameterize our moisture sensitivity functions but other methods of modeling moisture may work as well. Many ecosystem models treat soil water content (which regulates soil organic matter decomposition) as related to the ratio of rain to evapotranspiration (Necpálová et al., 2015). If NRM-driven decomposition can be captured by proxies constructed from evaporation, minimum temperature, and other values already included in carbon submodels, it may be easier to incorporate this novel process into existing modeling approaches. Fortunately, relative humidity is measured at meteorological stations worldwide and extensive data are available. Even in regions with data gaps, methods exist to estimate relative humidity from temperature datasets (Gunawardhana et al., 2017) and these can be incorporated into Earth system models to include NRM sensitivity without the need to collect additional data.
While our study focused exclusively on aboveground litter decay, NRM may have other effects on decomposition later in the decay process as well. NRM-driven decomposition removes carbon from the system before it reaches the soil surface, decreasing inputs to belowground pools. Additionally, NRM may accelerate belowground decomposition rates once litter is incorporated into the soil by promoting the development of larger (and specialized) microbial communities early in the decay process (Logan et al., 2021; Jacobson et al., 2015). Such soil-litter mixing often increases litter decomposition in dryland systems (Barnes et al., 2015, 2012; Hewins et al., 2013). Even more broadly, there are other processes for which models ignore the role of NRM that affect carbon cycling, like stimulating plant growth, and suppressing wildfires (Weathers, 1999; Emery et al., 2018). To improve our understanding of NRM-driven decomposition, studies can test the role of NRM-driven decomposition on both aboveground and belowground litter to identify how NRM affects linkages between these two pools.
NRM's role in litter decay has been observed in a wide range of ecosystems including Mediterranean shrublands (Gliksman et al., 2018; Dirks et al., 2010), salt-marshes (Newell et al., 1985), hyperarid deserts (Logan et al., 2021), and temperate steppes (Wang et al., 2017). One study found that NRM played a substantial role even a mesic prairie with mean annual precipitation of 897 mm (Evans et al., 2020), suggesting that NRM is important even when rainfall is relatively frequent. Our contribution does not therefore demonstrate the importance of NRM to litter decomposition in general, but shows that the frequency of NRM events strongly predicts litter mass loss across a wide range of moisture conditions and that this can be easily modeled using readily available moisture data. Although this study was conducted at the dry end of an aridity gradient, it still represented an eightfold magnitude of NRM frequency, showing that NRM can be easily incorporated into litter decay models. Explicitly incorporating NRM into models in mesic systems, where rainfall plays a greater role, will likely require including both rainfall and NRM sensitivity functions to identify the relative role of each as rainfall increases.
4.4 Limitations
Since our goal was to present a first attempt at incorporating NRM into litter decay models in an NRM-dominated ecosystem, we had to make several simplifications that likely underestimated litter decay rates. First, we only looked at standing dead litter not litter at the soil surface. Standing litter often decomposes faster than litter lying at the soil surface (Liu et al., 2015; Gliksman et al., 2018) and represents an important and, until recently, overlooked source of carbon turnover in drylands (Wang et al., 2017). While we did not look at litter at the soil surface, surface litter absorbs atmospheric moisture (Tschinkel, 1973) and may respond similarly to NRM, although to date no models we know of have looked at this across a range of NRM conditions, suggesting important avenues for future work.
Secondly, we focused only on coarse tillers not leafy material. In laboratory incubations, Jacobson et al. (2015) found that at high humidity the water content of S. sabulicola tillers (like those we used) increased slowly, reaching only 10.5 % after 2 h, with no detectable CO2 flux. In contrast, fine leaves reached a moisture content of 30.3 % and exhibited a flux rate of 0.99 µg CO2-C g L−1 min−1 after 2 h. In a field study, Evans et al. (2020) showed that gravimetric moisture content of S. sabulicola tillers could reach 0.35 g H2O g L−1 while leafy material could absorb as much as 1.45 g H2O g L−1 during NRM events, resulting in considerably higher respiration rates for leaves. Similarly, windblown detritus (litter that has become physically disconnected from the plant) makes up a considerable proportion of total litter mass in the Namib desert (Seely and Louw, 1980) and can absorb substantial water under humid conditions (Tschinkel, 1973). As a result, actual rates of NRM-driven decomposition across the whole landscape are likely higher than what we report here.
Finally, we focused only on the meteorological drivers of litter decomposition, although others factors play important roles as well. Photodegradation (Austin and Vivanco, 2006; King et al., 2012), macrodetritivore activity (Louw and Seely, 1982), and soil-litter mixing (Hewins et al., 2013; Lee et al., 2014) are all important drivers of litter decomposition in drylands. Since our goal was to quantify the relationship between NRM and litter turnover, we focused solely on NRM, but future studies can build on this work by combining our approach with other existing models. For instance, photodegradation can interact with NRM to accelerate carbon turnover, especially of standing litter (Wang et al., 2017; Logan et al., 2022), and accounting for photodegradation improves litter decay models (Chen et al., 2016; Adair et al., 2017). Combining these other mechanisms with the relative humidity-based litter decay model we present here may reveal additional interactions that can be validated by field studies. The fact that we were able to describe a large degree of litter decomposition by using a simple relative humidity-based and temperature-based model, however, demonstrates that NRM plays an important role in the litter decay process across a wide range of environmental conditions.
We show that the frequency of NRM is a major predictor of litter decomposition, and for the first time used data from a multisite field study to develop temperature and NRM sensitivity functions for a litter decay model. Temperature and moisture regimes are changing as a result of anthropogenic climate change (Byrne and O'Gorman, 2016) and our ability to predict how ecosystems respond depends, in part, on how well we can link biogeochemical cycles to their environmental drivers. NRM and rainfall are often controlled by different climatic drivers and may therefore respond differently under future climate change (Haensler et al., 2011; Dai, 2013; Forthun et al., 2006). By modeling the contribution of NRM to decomposition, in addition to that of rainfall, we can better predict how drylands will respond to changing moisture regimes, increasing our ability to manage these globally important systems.
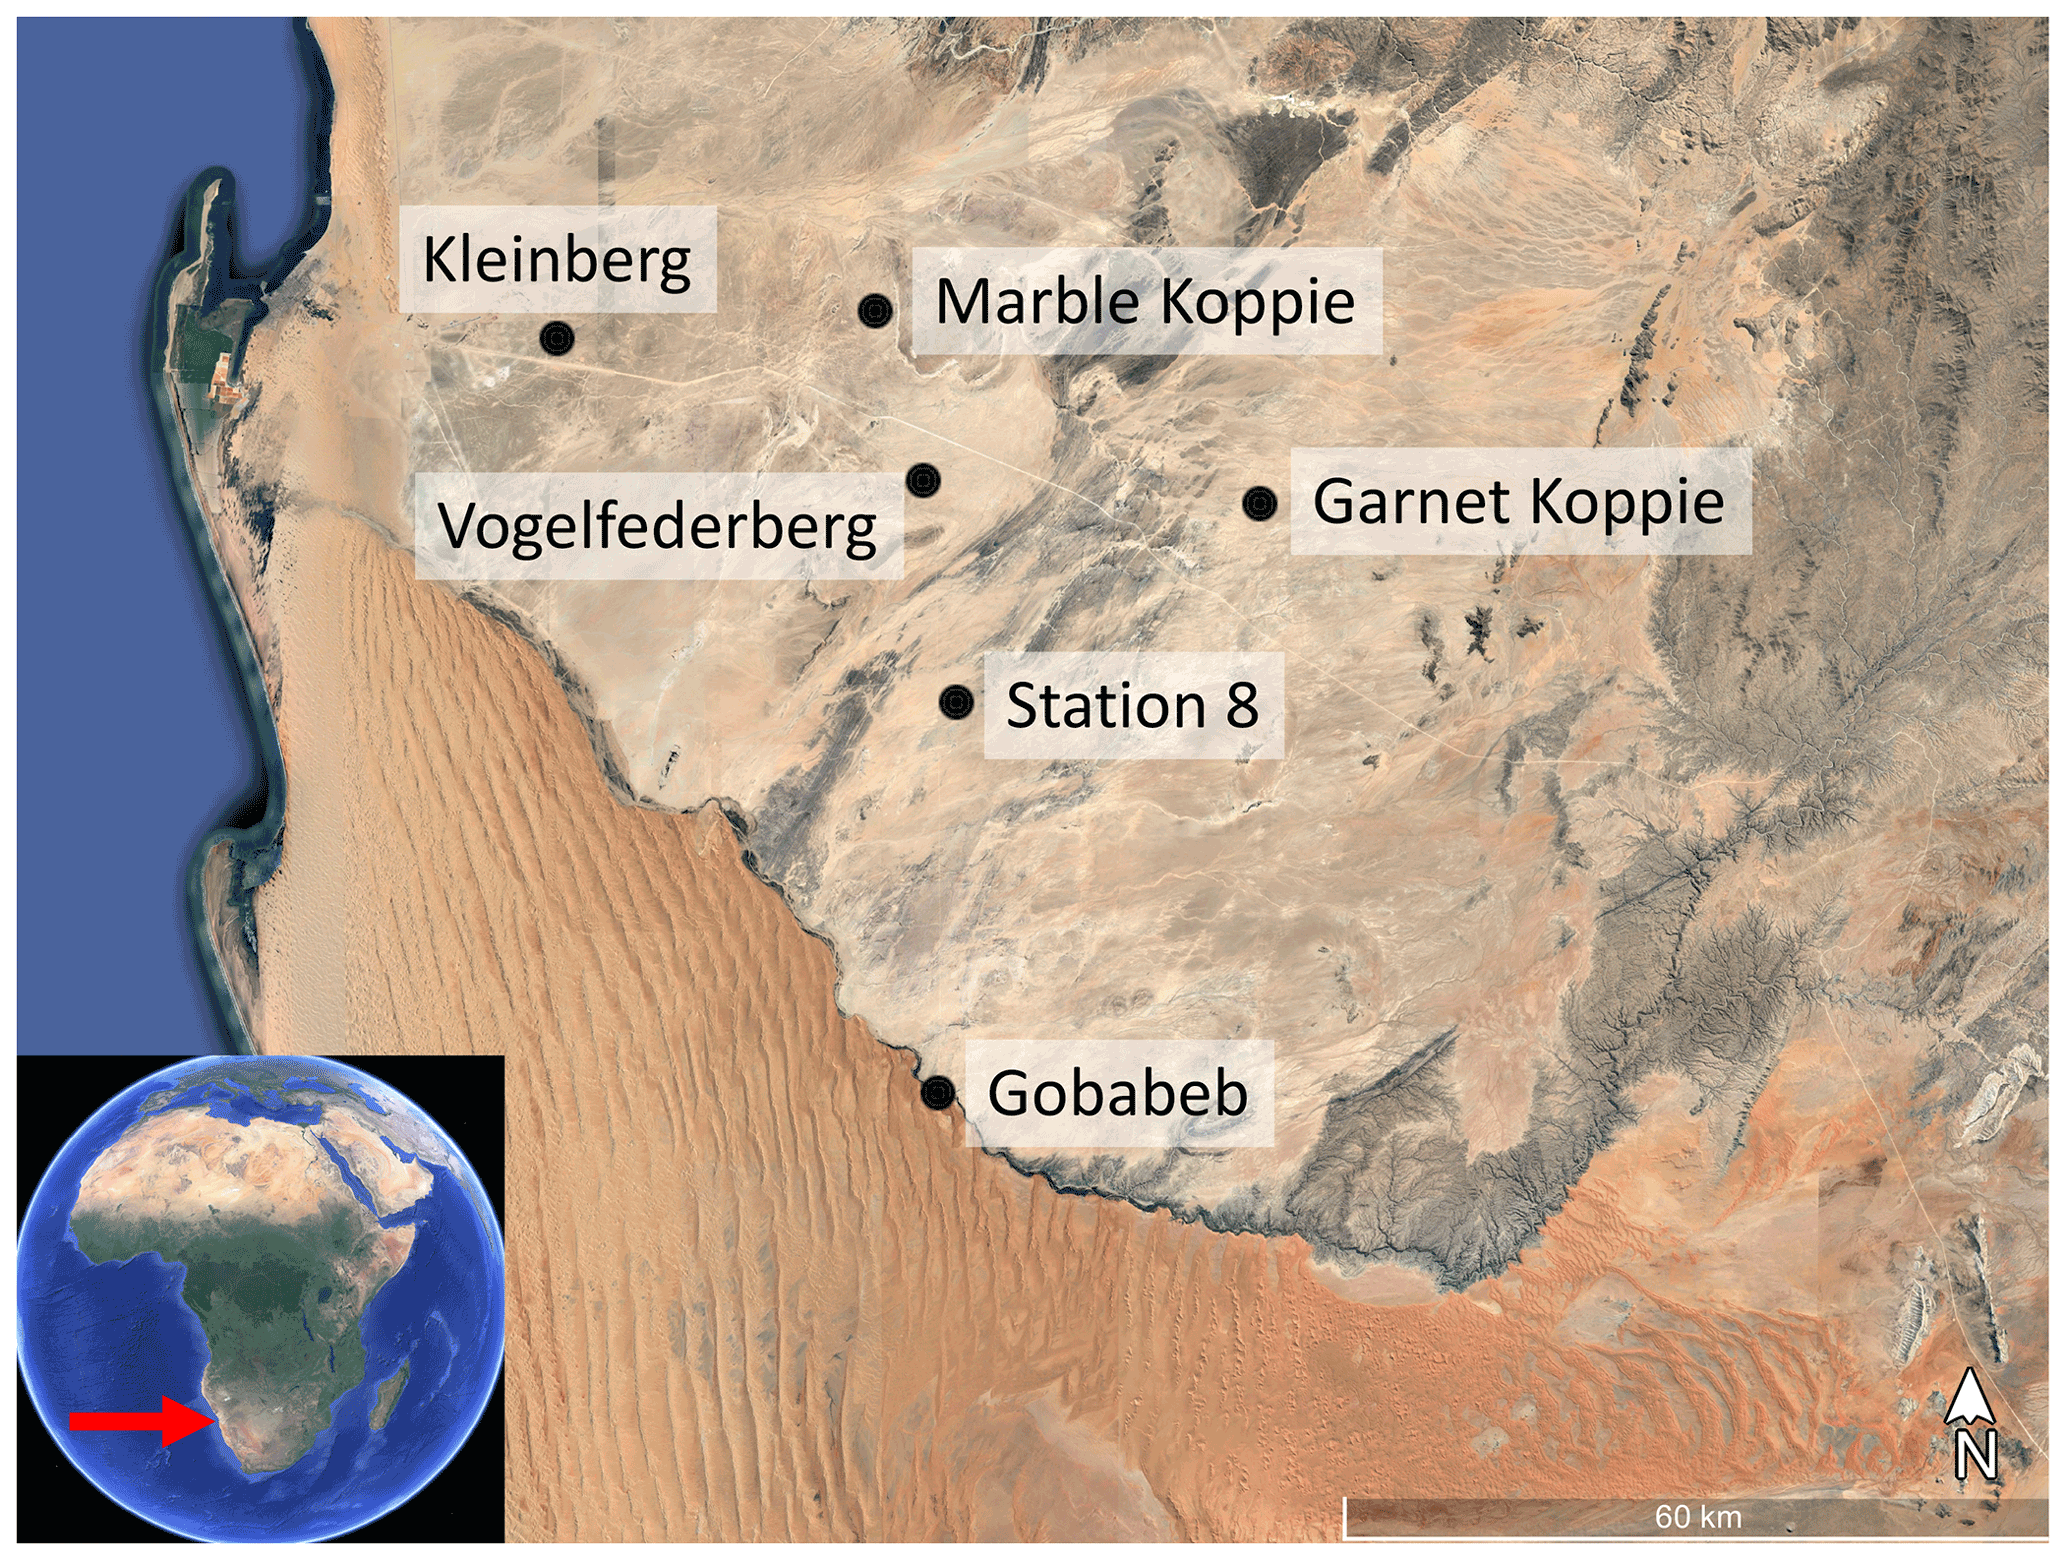
Figure A1Location of the six FogNet sites used in this study. All samples were collected from dunes of the Namib Sand Sea at Gobabeb. Background image © Google Earth.
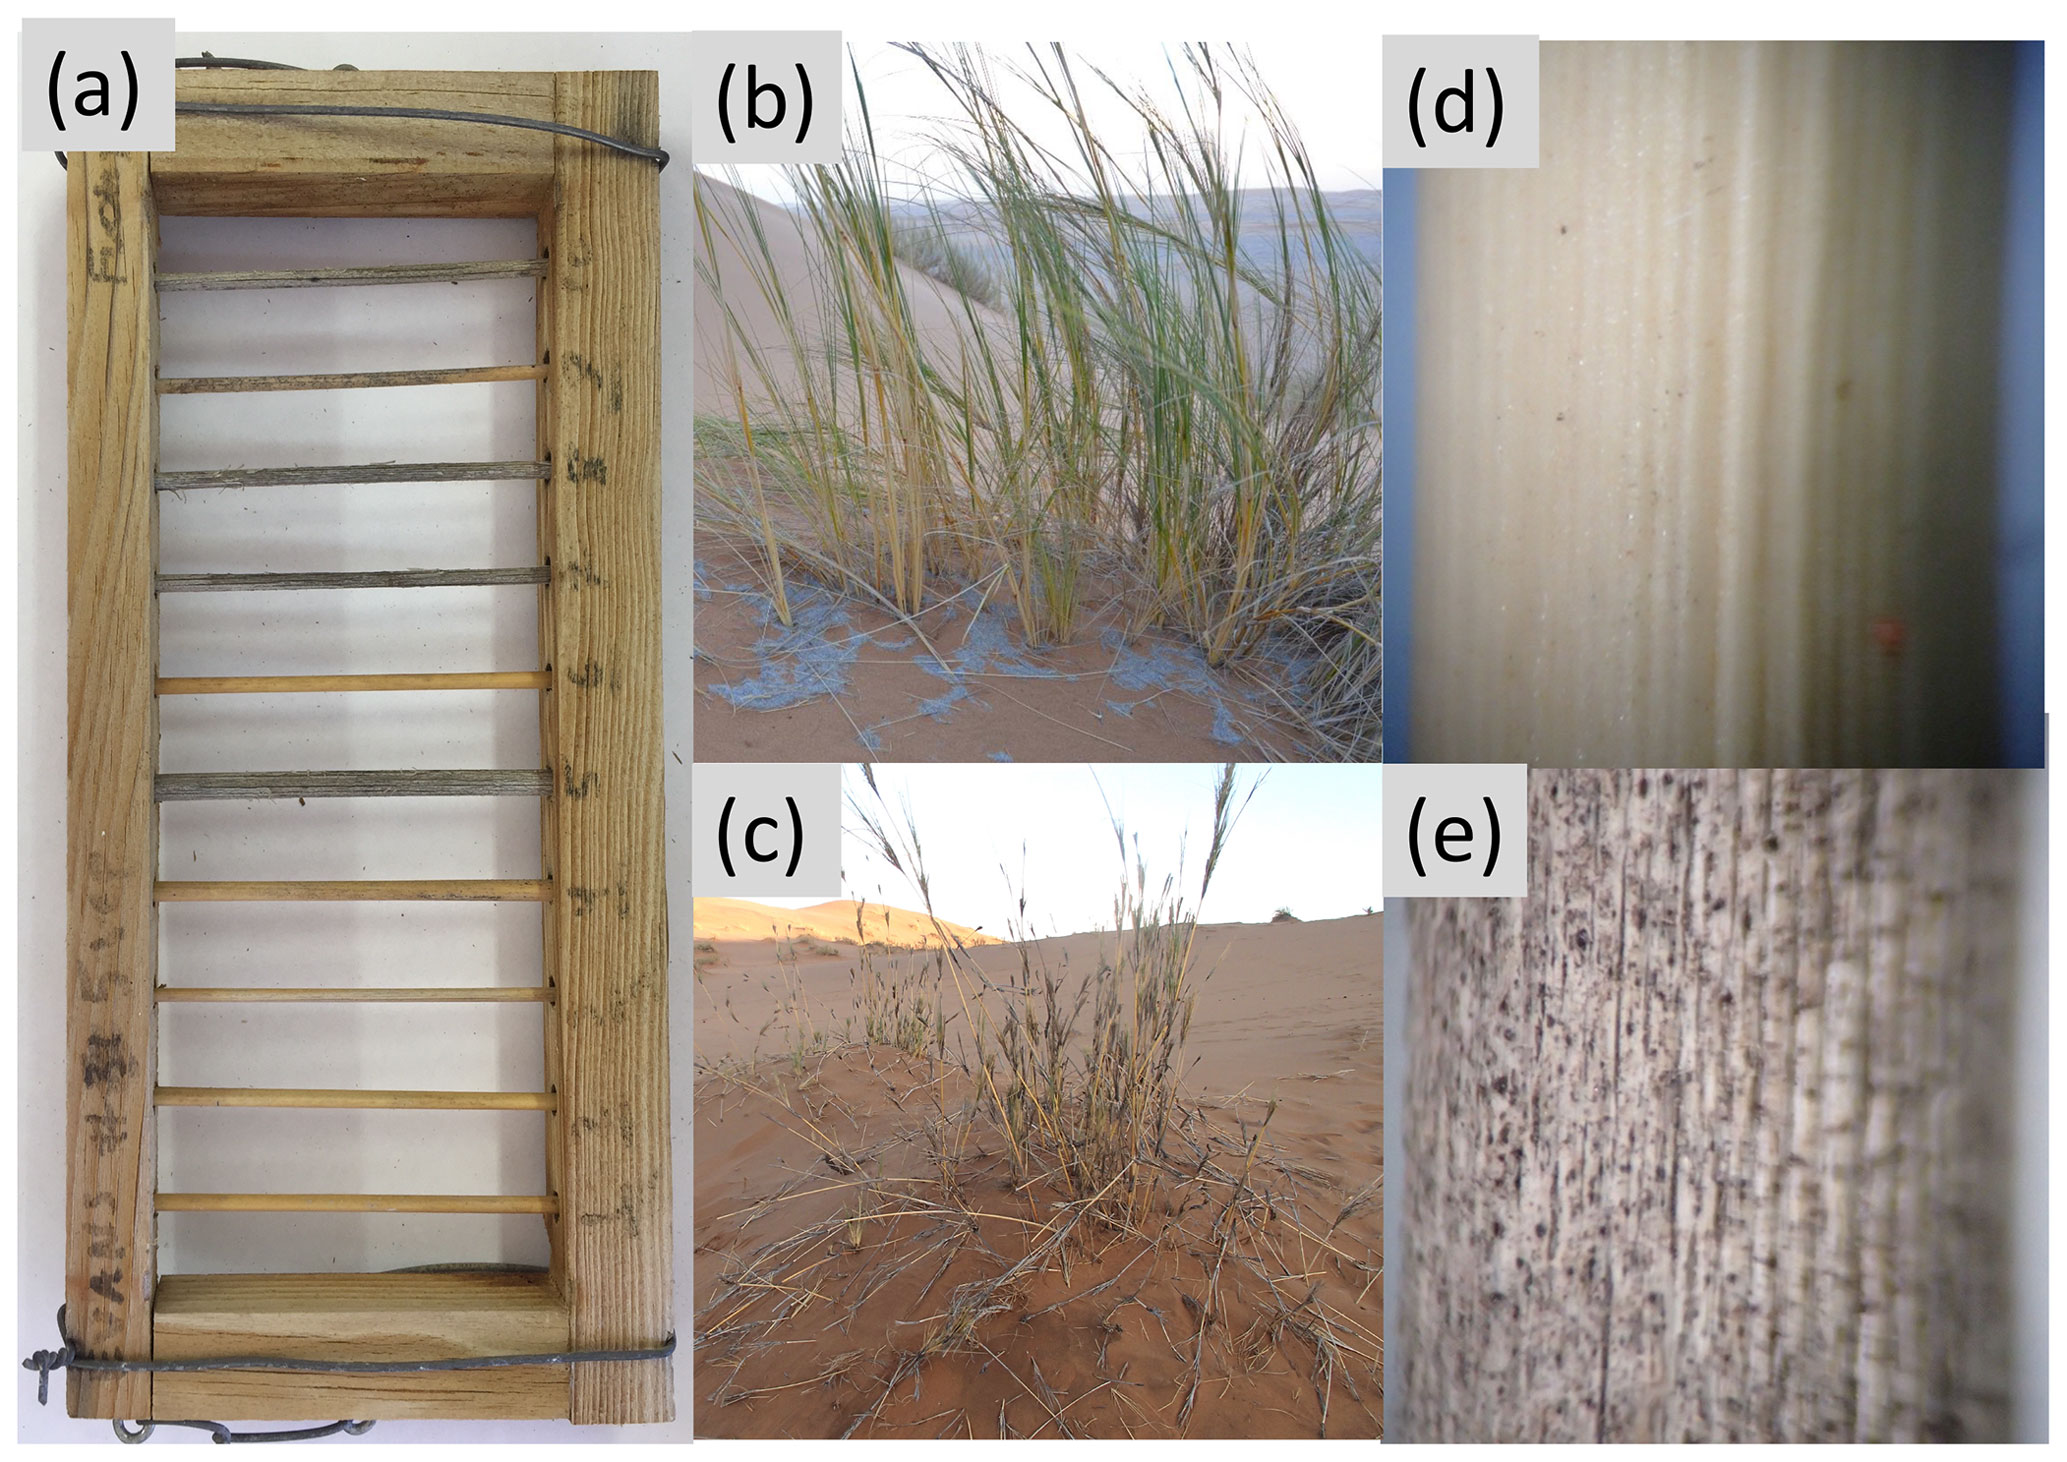
Figure A2(a) Example of a litter rack used instead of litter bag. The “rungs” of the “ladders” are Stipagrostis sabulicola stems ∼0.5 cm in diameter and 9 cm long. (b) Living S. sabulicola hummock growing in the dunes. (c) Dead S. sabulicola tillers like those used in this study. (d) Close up image of a recently senesced (early-stage) tiller with intact cuticles and little fungal growth. (e) Close up image of a late-stage tiller with cracked cuticle surface and substantial colonization by dark pigmented fungi.

Figure A3Frequency distributions of temperature when wet (turquoise) and dry (red) at the six sites during the study.
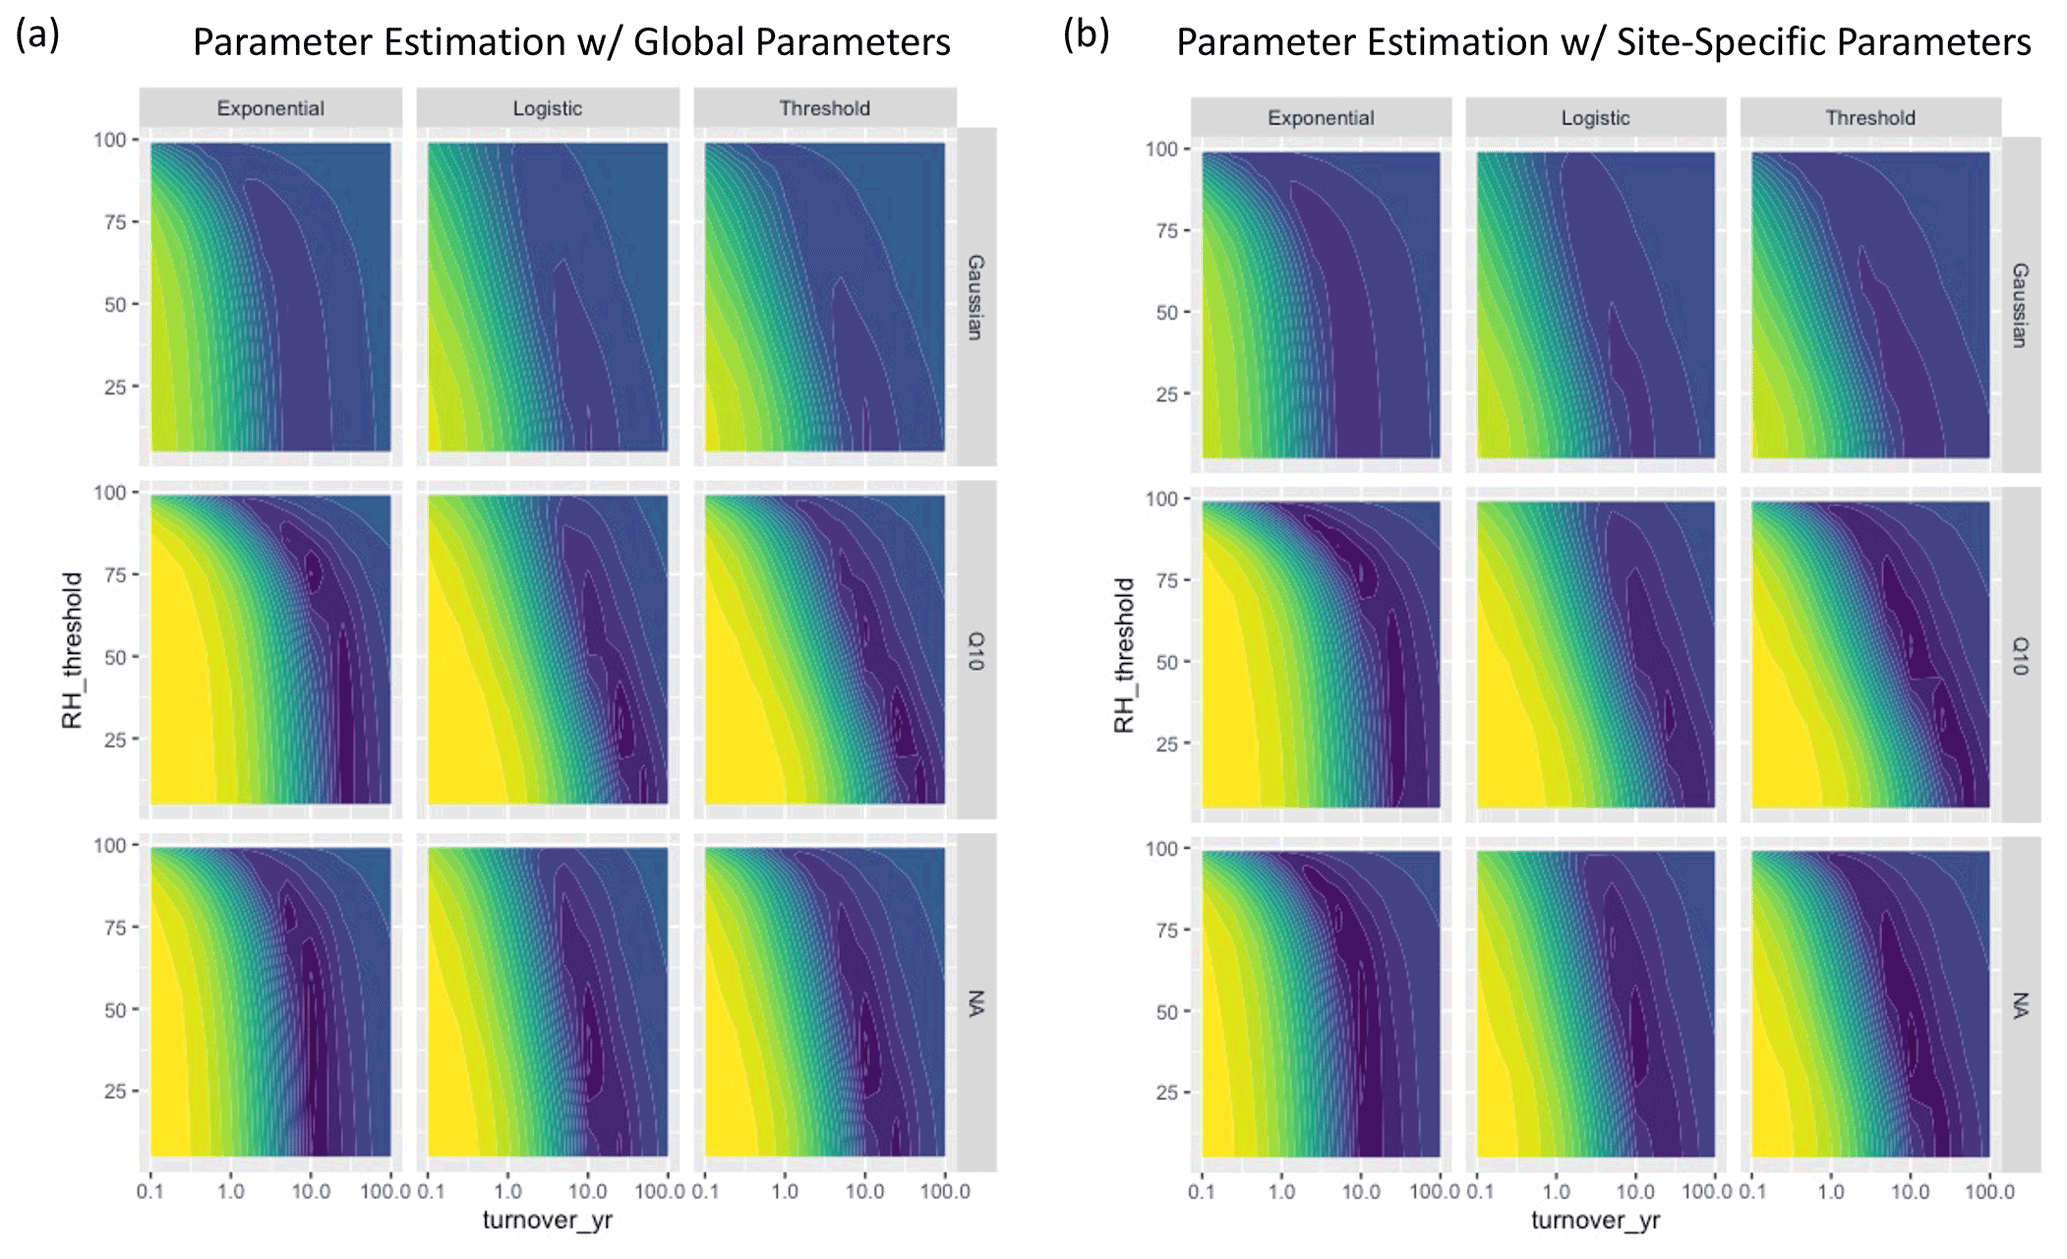
Figure A4Parameter fits for the humidity-based moisture models using (a) global parameters that were fitted across sites, and (b) site-specific parameters. Colors represent AIC scores with purple denoting lower values and yellow denoting higher values. The left panel is identical to Fig. 3 in the main text.
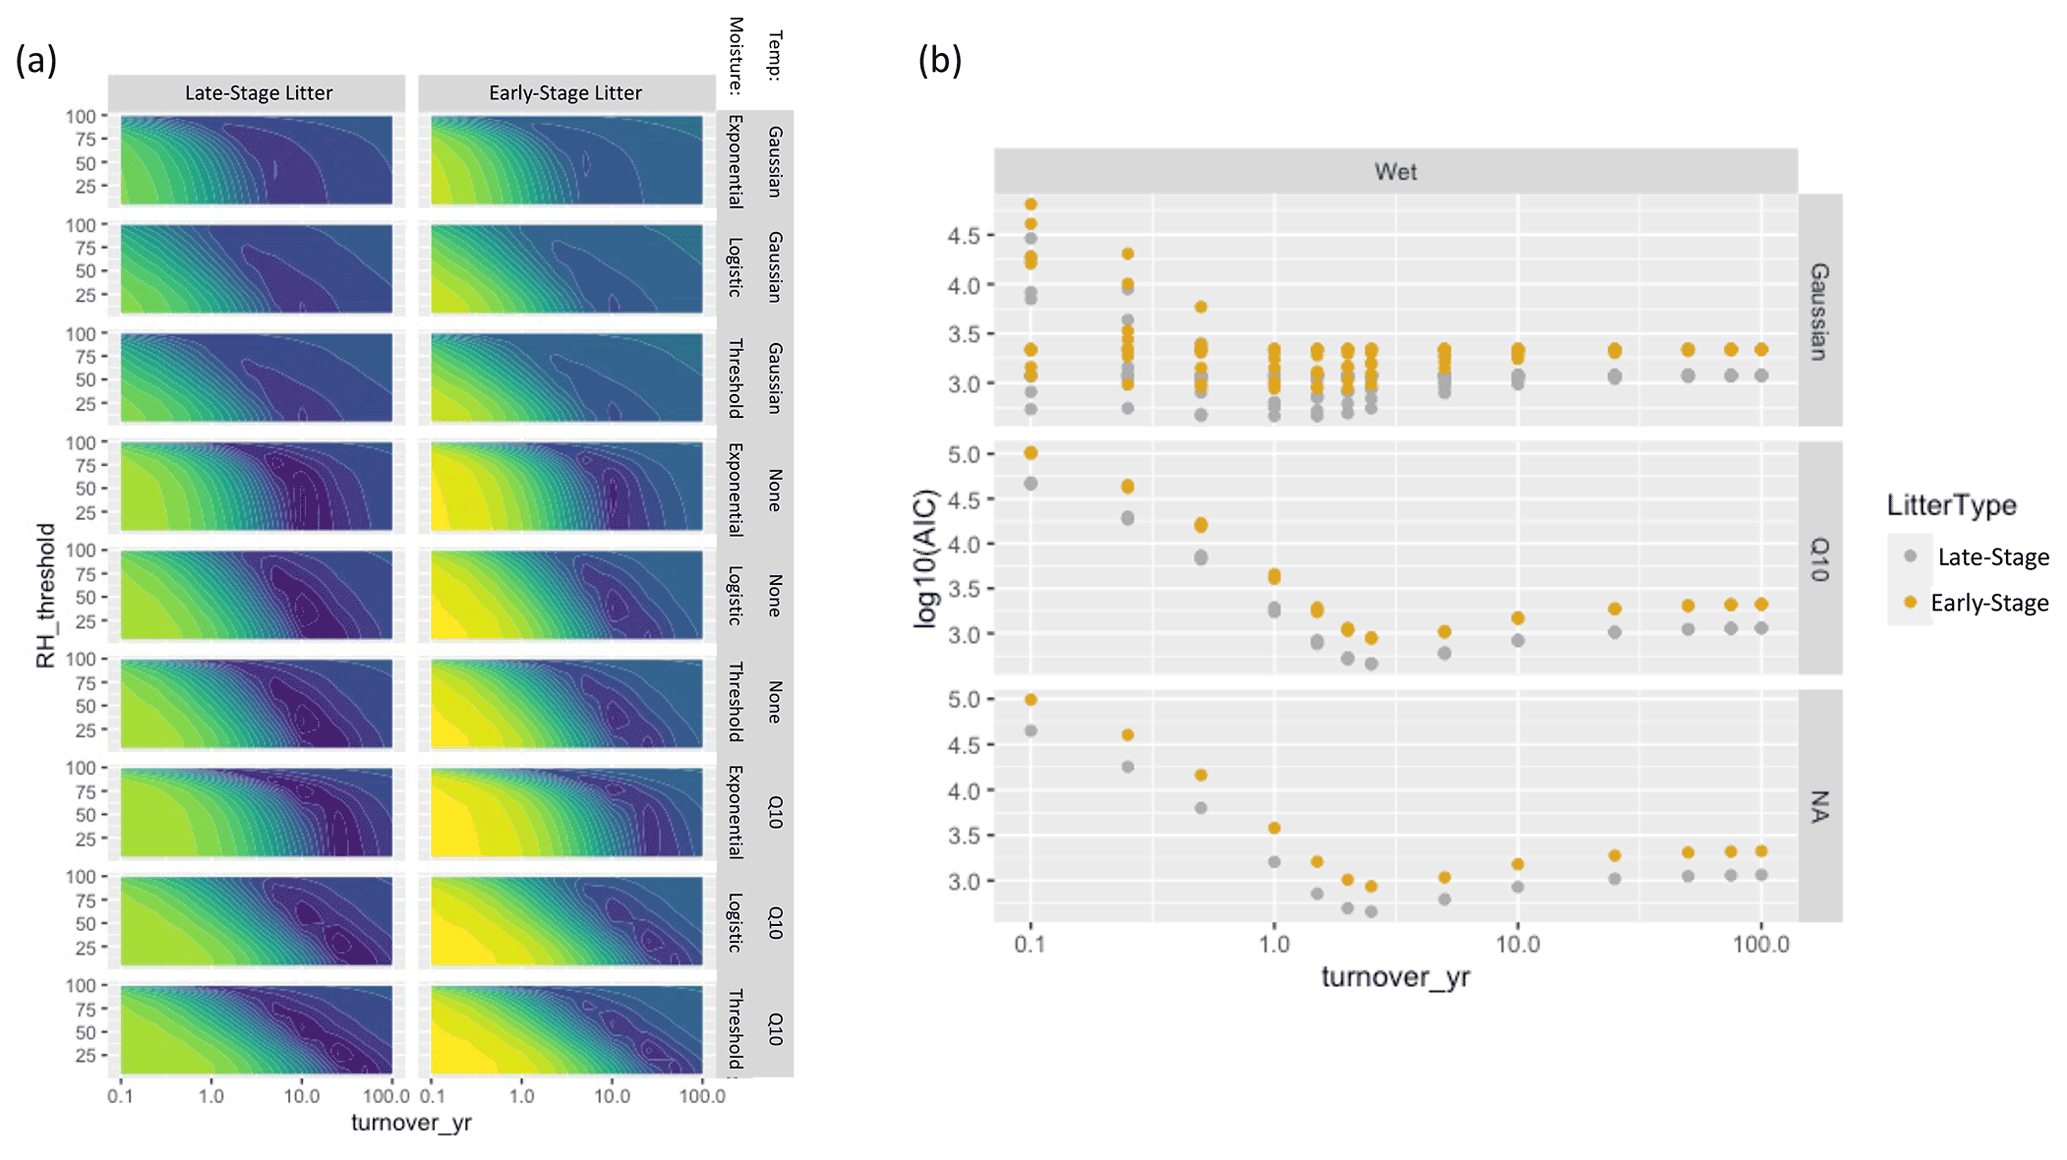
Figure A5(a) Parameter fits for the humidity-based models for late-stage litter (left) and early-stage litter (right). Colors represent AIC scores with purple denoting lower values and yellow denoting higher values. (b) Model fits for the wetness-based models, color-coded by litter stage (this is identical to the right panel of Fig. 5, but color coded to show differences in litter stage).

Figure A6(a) Parameter estimation plot of Q10 coefficient for an Q10-only model run (i.e., with no NRM sensitivity) showing model fit is best for Q10 values below 1. (b) Estimated Q10 sensitivity curves based on optimal value determined from (a).

Figure A7Photos of litter racks from each site (from driest on the left to wettest on the right) after 18 months in the field. The dark color on the racks from the wetter sites is from dark-pigmented fungal growth on both the tillers and the wooden frames after exposure to frequent NRM events.
Table A1ANOVA table of general mass loss model showing three-way interaction between time, site, and litter stage.
Data and code used in this paper are available as an R Markdown file at https://github.com/loganja3/NRM-Gradient-Project (Logan and Brown, 2022).
JRL, SEE, PJJ, and KMJ conceived the study. JRL designed the study and conducted fieldwork. JRL and KTB developed the model code and performed the simulations. PJJ and KMJ performed the laboratory incubations. RV collected and processed meteorological data. JRL conducted data analysis and statistics and prepared the manuscript with contributions from all co-authors.
The contact author has declared that none of the authors has any competing interests.
Publisher’s note: Copernicus Publications remains neutral with regard to jurisdictional claims in published maps and institutional affiliations.
We would like to thank the staff at the Gobabeb Namib Research Institute, the Namibian Ministry of Environment and Tourism, the National Botanical Research Institute, and the National Commission on Research, Science and Technology (permit number RPIV000102017) for their permission and support for this study. Special thanks to Martin Handjaba at Gobabeb for fieldwork in support of this project and to Lukas Mendel for assistance with laboratory incubations. The Southern African Science Service Centre for Climate Change and Adaptive Land Management provided the initial funding to establish the FogNet weather network and it is currently maintained by funding from the University of Basel. This work was also supported in part through computational resources and services provided by the Institute for Cyber-Enabled Research at Michigan State University. Thank you to the participants at the 2014 FogLife Colloquium, in particular Mary Seely and Theo Wassenaar, for their contributions in helping generate ideas for this project from the start. Finally, thank you to the Evans Lab, the KBS Writing Group and two reviewers for their feedback on earlier versions of this manuscript. This paper is KBS contribution number 2303.
Funding was provided by the U.S. National Science Foundation’s Graduate Research Fellowship Program, the W. K. Kellogg Biological Station at Michigan State University, Grinnell College, and the taxpayers of the United States and Michigan.
This paper was edited by Akihiko Ito and reviewed by two anonymous referees.
Adair, C., Parton, W., Del Grosso, S., Silver, W., Harmon, M., Hall, S., Burke, I., and Hart, S.: Simple three-pool model accurately describes patterns of long-term litter decomposition in diverse climates, Glob. Chang. Biol., 14, 2636–2660, https://doi.org/10.1111/j.1365-2486.2008.01674.x, 2008.
Adair, E. C., Parton, W. J., King, J. Y., Brandt, L. A., and Lin, Y.: Accounting for photodegradation dramatically improves prediction of carbon losses in dryland systems, Ecosphere, 8, 1–16, https://doi.org/10.1002/ecs2.1892, 2017.
Aho, K., Derryberry, D., and Peterson, T.: Model selection for ecologists: the worldviews of AIC and BIC, Ecology, 95, 631–636, 2014.
Austin, A. T.: Has water limited our imagination for aridland biogeochemistry?, Trends Ecol. Evol., 26, 229–35, https://doi.org/10.1016/j.tree.2011.02.003, 2011.
Austin, A. T. and Vivanco, L.: Plant litter decomposition in a semi-arid ecosystem controlled by photodegradation, Nature, 442, 555–558, https://doi.org/10.1038/nature05038, 2006.
Barnes, P. W., Throop, H. L., Hewins, D. B., Abbene, M. L., and Archer, S. R.: Soil Coverage Reduces Photodegradation and Promotes the Development of Soil-Microbial Films on Dryland Leaf Litter, Ecosystems, 15, 311–321, https://doi.org/10.1007/s10021-011-9511-1, 2012.
Barnes, P. W., Throop, H. L., Archer, S. R., Breshears, D. D., Mcculley, R. L., and Tobler, M. A.: Sunlight and Soil–Litter Mixing: Drivers of Litter Decomposition in Drylands, in: Progress in Botany, vol. 76, 273–302, https://doi.org/10.1038/1941023a0, 2015.
Bear, A. D. A., Jones, T. H., Kandeler, E., and Boddy, L.: Interactive effects of temperature and soil moisture on fungal-mediated wood decomposition and extracellular enzyme activity, Soil Biol. Biochem., 70, 151–158, https://doi.org/10.1016/j.soilbio.2013.12.017, 2014.
Birk, M. A.: respirometry: Tools for Conducting and Analyzing Respirometry Experiments, R package version 1.3.0., 2021.
Bolker, B. M., Pacala, S. W., and Parton, W. J.: Linear Analysis of Soil Decomposition: Insights from the CENTURY Model, Ecol. Appl., 8, 425–439, 1998.
Bonan, G. B., Hartman, M. D., Parton, W. J., and Wieder, W. R.: Evaluating litter decomposition in earth system models with long-term litterbag experiments: an example using the Community Land Model version 4 (CLM4), Glob. Chang. Biol., 19, 957–974, https://doi.org/10.1111/gcb.12031, 2013.
Byrne, M. P. and O'Gorman, P. A.: Understanding Decreases in Land Relative Humidity with Global Warming: Conceptual Model and GCM Simulations, J. Climate, 29, 9045–9061, https://doi.org/10.1175/JCLI-D-16-0351.1, 2016.
Chen, M., Parton, W. J., Adair, E. C., Asao, S., Hartman, M. D., and Gao, W.: Simulation of the effects of photodecay on long-term litter decay using DayCent, Ecosphere, 7, 1–22, https://doi.org/10.1002/ecs2.1631, 2016.
GrassBase – The Online World Grass Flora: http://www.kew.org/data/grasses-db.html, last access: 10 December 2021.
Collins, S. L., Sinsabaugh, R. L., Crenshaw, C., Green, L., Porras-Alfaro, A., Stursova, M., and Zeglin, L. H.: Pulse dynamics and microbial processes in aridland ecosystems, J. Ecol., 96, 413–420, https://doi.org/10.1111/j.1365-2745.2008.01362.x, 2008.
Dai, A.: Increasing drought under global warming in observations and models, Nat. Clim. Chang., 3, 52–58, https://doi.org/10.1038/nclimate1633, 2013.
Dirks, I., Navon, Y., Kanas, D., Dumbur, R., and Grüenzweig, J.: Atmospheric water vapor as driver of litter decomposition in Mediterranean shrubland and grassland during rainless seasons, Glob. Chang. Biol., 16, 2799–2812, https://doi.org/10.1111/j.1365-2486.2010.02172.x, 2010.
Eckardt, F. D., Soderberg, K., Coop, L. J., Muller, A. A., Vickery, K. J., Grandin, R. D., Jack, C., Kapalanga, T. S., and Henschel, J.: The nature of moisture at Gobabeb, in the central Namib Desert, J. Arid Environ., 93, 7–19, https://doi.org/10.1016/j.jaridenv.2012.01.011, 2013.
Emery, N. C., D'Antonio, C. M., and Still, C. J.: Fog and live fuel moisture in coastal California shrublands, Ecosphere, 9, 1–19, https://doi.org/10.1002/ecs2.2167, 2018.
Evans, S. E., Todd-brown, K. E. O., Jacobson, K. M., and Jacobson, P. J.: Non-rainfall moisture: A key driver of microbial respiration from standing litter in arid, semiarid, and mesic grasslands, Ecosystems, 23, 1154–1169, https://doi.org/10.1007/s10021-019-00461-y, 2020.
Forthun, G. M., Johnson, M. B., Schmitz, W. G., Blume, J., and Caldwell, R. J.: Trends in fog frequency and duration in the southeast United States, Phys. Geogr., 27, 206–222, https://doi.org/10.2747/0272-3646.27.3.206, 2006.
Gliksman, D., Rey, A., Seligmann, R., Dumbur, R., Sperling, O., Navon, Y., Haenel, S., De Angelis, P., Arnone III, J. A., and Grüenzweig, J. M.: Biotic degradation at night, abiotic degradation at day: positive feedbacks on litter decomposition in drylands, Glob. Chang. Biol., 23, 1564–1574, https://doi.org/10.1111/gcb.13465, 2017.
Gliksman, D., Navon, Y., Dumbar, R., Haenel, S., and Grüenzweig, J. M.: Higher rates of decomposition in standing vs. surface litter in a Mediterranean ecosystem during the dry and the wet seasons, Plant Soil, 428, 427–439, 2018.
Gunawardhana, L. N., Al-Rawas, G. A., and Kazama, S.: An alternative method for predicting relative humidity for climate change, Meteorol. Appl., 24, 551–559, https://doi.org/10.1002/met.1641, 2017.
Haensler, A., Cermak, J., Hagemann, S., and Jacob, D.: Will the southern african west coast fog be affected by future climate change?, Erdkunde, 65, 261–275, https://doi.org/10.3112/erdkunde.2011.03.04, 2011.
Hewins, D. B., Archer, S. R., Okin, G. S., Mcculley, R. L., and Throop, H. L.: Soil–Litter Mixing Accelerates Decomposition in a Chihuahuan Desert Grassland, Ecosystems, 16, 183–195, https://doi.org/10.1007/s10021-012-9604-5, 2013.
Jacobson, K. M. and Jacobson, P. J.: Rainfall regulates decomposition of buried cellulose in the Namib Desert, J. Arid Environ., 38, 571–583, https://doi.org/10.1006/jare.1997.0358, 1998.
Jacobson, K. M., van Diepeningen, A., Evans, S. E., Fritts, R., Gemmel, P., Marsho, C., Seely, M., Wenndt, A., Yang, X., and Jacobson, P.: Non-rainfall moisture activates fungal decomposition of surface litter in the Namib Sand Sea, PLoS One, 10, e0126977, https://doi.org/10.1371/journal.pone.0126977, 2015.
King, J. Y., Brandt, L. A., and Adair, E. C.: Shedding light on plant litter decomposition: advances, implications and new directions in understanding the role of photodegradation, Biogeochemistry, 111, 57–81, https://doi.org/10.1007/s10533-012-9737-9, 2012.
Lee, H., Fitzgerald, J., Hewins, D. B., McCulley, R. L., Archer, S. R., Rahn, T., and Throop, H. L.: Soil moisture and soil-litter mixing effects on surface litter decomposition: A controlled environment assessment, Soil Biol. Biochem., 72, 123–132, https://doi.org/10.1016/j.soilbio.2014.01.027, 2014.
Liu, G., Cornwell, W. K., Pan, X., Ye, D., Liu, F., Huang, Z., Dong, M., and Cornelissen, J. H. C.: Decomposition of 51 semidesert species from wide-ranging phylogeny is faster in standing and sand-buried than in surface leaf litters: implications for carbon and nutrient dynamics, Plant Soil, 396, 175–187, https://doi.org/10.1007/s11104-015-2595-1, 2015.
Logan, J. R. and Brown, K. T.: NRM Gradient Project, Github [code and data set], https://github.com/loganja3/NRM-Gradient-Project, last access: 19 June 2022.
Logan, J. R., Jacobson, K. M., Jacobson, P. J., and Evans, S. E.: Fungal Communities on Standing Litter Are Structured by Moisture Type and Constrain Decomposition in a Hyper-Arid Grassland Site Descriptions and Climatic Data, Front. Microbiol., 12, 1–15, https://doi.org/10.3389/fmicb.2021.596517, 2021.
Logan, J. R., Barnes, P. W., and Evans, S. E.: Photodegradation of plant litter cuticles enhances microbial decomposition by increasing uptake of non-rainfall moisture, Funct. Ecol., 36, 1727–1738, https://doi.org/10.1111/1365-2435.14053, 2022.
Louw, G. N. and Seely, M. K.: Ecology of Desert Organisms, Longman Group Limited, Essex, UK, 194 pp., 1982.
Low-Décarie, E., Boatman, T. G., Bennett, N., Passfield, W., Gavalás-olea, A., Siegel, P., and Geider, R. J.: Predictions of response to temperature are contingent on model choice and data quality, Ecol. Evol., 7, 10467–10481, https://doi.org/10.1002/ece3.3576, 2017.
Luo, Y., Ahlström, A., Allison, S. D., Batjes, N. H., Brovkin, V., Carvalhais, N., Chappell, A., Ciais, P., Davidson, E. A., Finzi, A., Georgiou, K., Guenet, B., Hararuk, O., Harden, J. W., He, Y., Hopkins, F., Jiang, L., Koven, C., Jackson, R. B., Jones, C. D., Lara, M. J., Liang, J., Mcguire, A. D., Parton, W., Peng, C., Randerson, J. T., Salazar, A., Sierra, C. A., Smith, M. J., Tian, H., Todd-brown, K. E. O., Torn, M., Groenigen, K. J., Wang, Y. P., West, T. O., Wei, Y., Wieder, W. R., Xia, J., Xu, X., Xu, X., and Zhou, T.: Toward more realistic projections of soil carbon dynamics by Earth system models, Global Biogeochem. Cy., 30, 40–56, https://doi.org/10.1002/2015GB005239.Received, 2015.
Necpálová, M., Anex, R. P., Fienen, M. N., Del Grosso, S. J., Castellano, M. J., Sawyer, J. E., Iqbal, J., Pantoja, J. L., and Barker, D. W.: Understanding the DayCent model: Calibration, sensitivity , and identifiability through inverse modeling, Environ. Model. Softw., 66, 110–130, https://doi.org/10.1016/j.envsoft.2014.12.011, 2015.
Newell, S. Y., Fallon, R. D., Rodriguez, R. M. C., and Groene, L. C.: Influence of rain, tidal wetting and relative humidity on release of carbon dioxide by standing-dead salt-marsh plants, Oecologia, 68, 73–79, 1985.
Noy-Meir, I.: Desert Ecosystems: Environment and Producers, in: Annual Review of Ecology and Systematics Vol. 4, edited by: Johnston, R., Frank, P., and Michener, C., Annual Reviews Inc., Palo Alto., 1973.
Parton, W., Silver, W. L., Burke, I. C., Grassens, L., Harmon, M. E., Currie, W. S., King, J. Y., Adair, E. C., Brandt, L. A., Hart, S. C., and Fasth, B.: Global-Scale Similarities in Nitrogen Release Patterns During Long-Term Decomposition, Science, 315, 361–364, 2007.
Petraglia, A., Cacciatori, C., Chelli, S., Fenu, G., Calderisi, G., Gargano, D., Abeli, T., Orsenigo, S., and Carbognani, M.: Litter decomposition: effects of temperature driven by soil moisture and vegetation type, Plant Soil, 455, 187–200, 2019.
R Core Team: R: A language and environment for statistical computing, https://www.R-project.org/, last access: 10 October 2020.
Roth-Nebelsick, A., Ebner, M., Miranda, T., Gottschalk, V., Voigt, D., Gorb, S., Stegmaier, T., Sarsour, J., Linke, M., and Konrad, W.: Leaf surface structures enable the endemic Namib desert grass Stipagrostis sabulicola to irrigate itself with fog water, J. R. Soc. Interface, 9, rsif20110847, https://doi.org/10.1098/rsif.2011.0847, 2012.
Seely, M. K. and Louw, G. N.: First approximation of the effects of rainfall on the ecology of a Namib Desert dune ecosystem, J. Arid Environ., 3, 25–54, 1980.
Sentelhas, P. C., Marta, A. D., Orlandini, S., Santos, E. A., Gillespie, T. J., and Gleason, M. L.: Suitability of relative humidity as an estimator of leaf wetness duration, Agric. For. Meteorol., 148, 392–400, https://doi.org/10.1016/j.agrformet.2007.09.011, 2008.
Sierra, C. A.: Temperature sensitivity of organic matter decomposition in the Arrhenius equation: some theoretical considerations, Biogeochemistry, 1–15, https://doi.org/10.1007/s10533-011-9596-9, 2012.
Sierra, C. A., Trumbore, S. E., Davidson, E. A., Vicca, S., and Janssens, I.: Sensitivity of decomposition rates of soil organic matter with respect to simultaneous changes in temperature and moisture, J. Adv. Model. Earth Syst., 335–356, https://doi.org/10.1002/2014MS000358.Received, 2015.
Sokolov, A., Kicklighter, D., Schlosser, A., Wang, C., Monier, E., Brown-Steiner, B., Primm, R., Forest, C., Gao, X., Libardoni, A., and Eastham, S.: Description and Evaluation of the MIT Earth System Model (MESM), J. Adv. Model. Earth Syst., 10, 1759–1789, https://doi.org/10.1029/2018MS001277, 2018.
Tschinkel, W. R.: The sorption of water vapor by windborne plant debris in the Namib Desert, 2, 21–24, 1973.
Wang, J., Liu, L., Wang, X., and Chen, Y.: The interaction between abiotic photodegradation and microbial decomposition under ultraviolet radiation, Glob. Chang. Biol., 21, 2095–2104, https://doi.org/10.1111/gcb.12812, 2015.
Wang, J., Liu, L., Wang, X., Yang, S., Zhang, B., Li, P., Qiao, C., Deng, M., and Liu, W.: High night-time humidity and dissolved organic carbon content support rapid decomposition of standing litter in a semi-arid landscape, Funct. Ecol., 31, 1659–1668, https://doi.org/10.1111/1365-2435.12854, 2017.
Weathers, K. C.: The importance of cloud and fog in the maintenance of ecosystems, Trends Ecol. Evol., 14, 214–215, https://doi.org/10.1016/S0169-5347(99)01635-3, 1999.
Wenndt, A. J., Evans, S. E., Diepeningen, A. D. van, Logan, J. R., Jacobson, P. J., Seely, M. K., and Jacobson, K. M.: Why plants harbor complex endophytic fungal communities: Insights from perennial bunchgrass Stipagrostis sabulicola in the Namib Sand Sea, Front. Microbiol., 12, 1–13, https://doi.org/10.3389/fmicb.2021.691584, 2021.
Xie, Y.: A meta-analysis of critique of litterbag method used in examining decomposition of leaf litters, J. Soils Sediments, 20, 1881–1886, https://doi.org/10.1007/s11368-020-02572-9, 2020.
Zhang, D., Hui, D., Luo, Y., and Zhou, G.: Rates of litter decomposition in terrestrial ecosystems: global patterns and controlling factors, J. Plant Ecol., 1, 85–93, https://doi.org/10.1093/jpe/rtn002, 2008.