the Creative Commons Attribution 4.0 License.
the Creative Commons Attribution 4.0 License.
 | 08 Sep 2022
Carbon dynamics at the river–estuarine transition: a comparison among tributaries of Chesapeake Bay
Paul A. Bukaveckas
Sources and transformation of carbon (C) were quantified using mass balance and ecosystem metabolism data for the upper segments of the James, Pamunkey and Mattaponi estuaries. The goal was to assess the role of external (river inputs and tidal exchange) vs. internal (metabolism) drivers in influencing the forms and fluxes of C. C forms and their response to river discharge differed among the estuaries based on their physiographic setting. The James, which receives the bulk of inputs from upland areas (Piedmont and Mountain), exhibited a higher ratio of inorganic to organic C and larger inputs of particulate organic C (POC). The Pamunkey and Mattaponi receive a greater proportion of inputs from lowland (Coastal Plain) areas, which were characterized by low dissolved inorganic C (DIC) and POC and elevated dissolved organic C (DOC). I anticipated that transport processes would dominate during colder months when discharge is elevated and metabolism is low and that biological processes would predominate in summer, leading to attenuation of C throughputs via degassing of CO2. Contrary to expectations, the highest retention of organic C occurred during periods of high throughput, as elevated discharge resulted in greater loading and retention of POC. In summer, internal cycling of C via production and respiration was large in comparison to external forcing despite the large riverine influence in these upper-estuarine segments. The estuaries were found to be net heterotrophic based on retention of organic C, export of DIC, low primary production relative to respiration and a net flux of CO2 to the atmosphere. In the James, greater contributions from phytoplankton production resulted in a closer balance between production and respiration, with autochthonous production exceeding allochthonous inputs. Combining the mass balance and metabolism data with bioenergetics provided a basis for estimating the proportion of C inputs utilized by the dominant metazoan. The findings suggest that invasive catfish utilize 15 % of total organic C inputs and up to 40 % of allochthonous inputs to the James.
- Article
(6058 KB) - Full-text XML
- BibTeX
- EndNote


Inland waters play an important role in the global carbon cycle by storing, transforming and transporting carbon from land to sea. Comparatively little is known about carbon dynamics at the river–estuarine transition. A study of tributaries of Chesapeake Bay showed that biological processes exerted a strong effect on carbon transformations. Peak carbon retention occurred during periods of elevated river discharge and was associated with trapping of particulate matter.
Inland waters occupy a small proportion of surface area but play a disproportionately large role in landscape-scale C fluxes (Cole et al., 2007; Butman et al., 2016; Tranvik et al., 2018; Holgerson and Raymond, 2016). River networks act as transport systems delivering C products of mineral weathering (dissolved inorganic C, DIC) and plant decomposition (dissolved organic C, DOC; particulate organic C, POC) from the terrestrial realm to the coastal ocean (Meybeck, 2003). Inland waters also function as reactors in which biotic and abiotic processes act to augment, transform or attenuate C fluxes. Aquatic primary production supplements terrestrial DOC and POC inputs and, by providing more labile forms of C, may facilitate the decomposition of older, recalcitrant terrestrial C. Decomposition of aquatic and terrestrial organic matter returns C to the atmosphere, which, along with C sequestration via sediment burial, results in the attenuation of C fluxes to the coastal zone (Richey et al., 2002; Vorosmarty et al., 2003; Middelburg and Herman, 2007; Tranvik et al., 2009). Acting against these processes are fluvial forces that hasten throughputs of C and favor transport over processing. Along the flow path from mountains to the sea, aquatic systems differ greatly in their capacity to attenuate C fluxes depending on factors such as water residence time, ecosystem metabolism and capacity for sediment accrual. Relatively complete C budgets are relatively rare, in part due to the effort involved in quantifying C fluxes from various sources (Hanson et al., 2015).
Estuaries are potentially important sites for C processing and transport given that they intercept the bulk of terrestrial runoff to the oceans. They contain complex mixtures of organic matter originating from diverse sources including terrestrial inputs, estuarine primary production, lateral inputs (e.g., tidal marshes and floodplain forests) and marine-derived organic matter (Raymond and Hopkinson, 2003; Tzortziou et al., 2008). As a result, estuarine organic matter includes a complex mixture of compounds that differ in chemical composition and bioavailability. Most of the organic matter delivered by rivers to estuaries is of terrestrial origin, though recent work suggests that autochthonous riverine sources may be important during periods of low river flow (Hosen et al., 2021). The quantity and quality of riverine organic matter is dependent in part on forms of terrestrial vegetation and the extent to which this material is altered by photochemical and microbial processes along the flow path from upland areas through river networks (Raymond and Bauer, 2000; Stedmon et al., 2006; Creed et al., 2015; Zametske et al., 2018; Voss et al., 2020). Historically, terrestrial organic matter inputs were considered largely recalcitrant in part due to their age and their high C:N ratio, though bioassay experiments and non-conservative mixing curves indicate that a fraction is labile (e.g., Moran et al., 1999; Wiegner and Seitzinger, 2001). Del Giorgio and Pace (2008) showed that the Hudson River estuary acted as a pipe transporting terrestrial DOC seaward while also functioning as a reactor whereby bacterial activity decomposed POC generated via autochthonous production. Raymond and Hopkinson (2003) showed that estuarine primary production contributes significant quantities of “young” DOC which fueled the majority of heterotrophic respiration. In the context of assessing estuarine influences on C transport and retention, comparatively little attention has been focused on processes occurring at the river–estuarine transition.
Tidal freshwaters occur at the transition from riverine to estuarine conditions. They are a common feature of river-dominated estuaries throughout the world but have received relatively little attention for their role in modifying elemental fluxes from land to sea (Hoitink and Jay, 2016; Ward et al., 2017; Jones et al., 2020). A key feature of tidal freshwaters is the occurrence of bidirectional flows associated with incoming and outgoing tides (Jones et al., 2017). The combination of freshwater and tidal conditions arises because tidal forces propagate inland beyond the point where mixing of fresh and marine waters occurs. The back and forth of tidal flows reduces net seaward movement resulting in longer transit time that allows for the development of plankton communities and the potential for greater biological influence on C forms and retention. Our prior work in the James Estuary has documented higher rates of ecosystem metabolism in the tidal-freshwater segment relative to adjacent riverine and lower-estuarine segments (Tassone and Bukaveckas, 2019; Bukaveckas et al., 2020). High rates of metabolism and depletion of dissolved inorganic nutrients was associated with the presence of chlorophyll a and productivity maxima in the tidal-fresh zone (Bukaveckas et al., 2011; Qin and Shen, 2017). Other studies have also documented tidal freshwaters as biogeochemical hotspots (Vincent et al., 1996; Muylaert et al., 2005; Hoffman et al., 2008; Lionard et al., 2008; Amann et al., 2015; Young et al., 2021; Xu et al., 2021).
Long water residence time and high rates of ecosystem metabolism in the tidal-fresh zone may favor the importance of internal processes (production and respiration) over external (hydrologic) forces in regulating C throughputs. During periods of low river discharge, longer water residence in the estuary allows for the accrual of phytoplankton biomass and greater phytoplankton production, which may result in net autotrophy and greater export of organic C relative to DIC. Alternatively, the production of autochthonous labile C may facilitate mineralization of allochthonous C inputs (“priming effect”), resulting in CO2 release and attenuation of organic and total C exports (Bianchi, 2011; Steen et al., 2016; Ward et al., 2016). During periods of elevated discharge, freshwater replacement time in the upper estuary is short, thereby favoring transport over retention. However, our recent work has shown that the bulk of N and P retention in the tidal-fresh zone of the James Estuary occurs during periods of high sediment loading (Bukaveckas et al., 2018). Although retention of dissolved N and P was highest during peak production in summer, the trapping of particulate N and P in winter accounted for the bulk of total N and P retention. These findings suggest that retention of particulate and total C may be highest during periods of elevated river discharge.
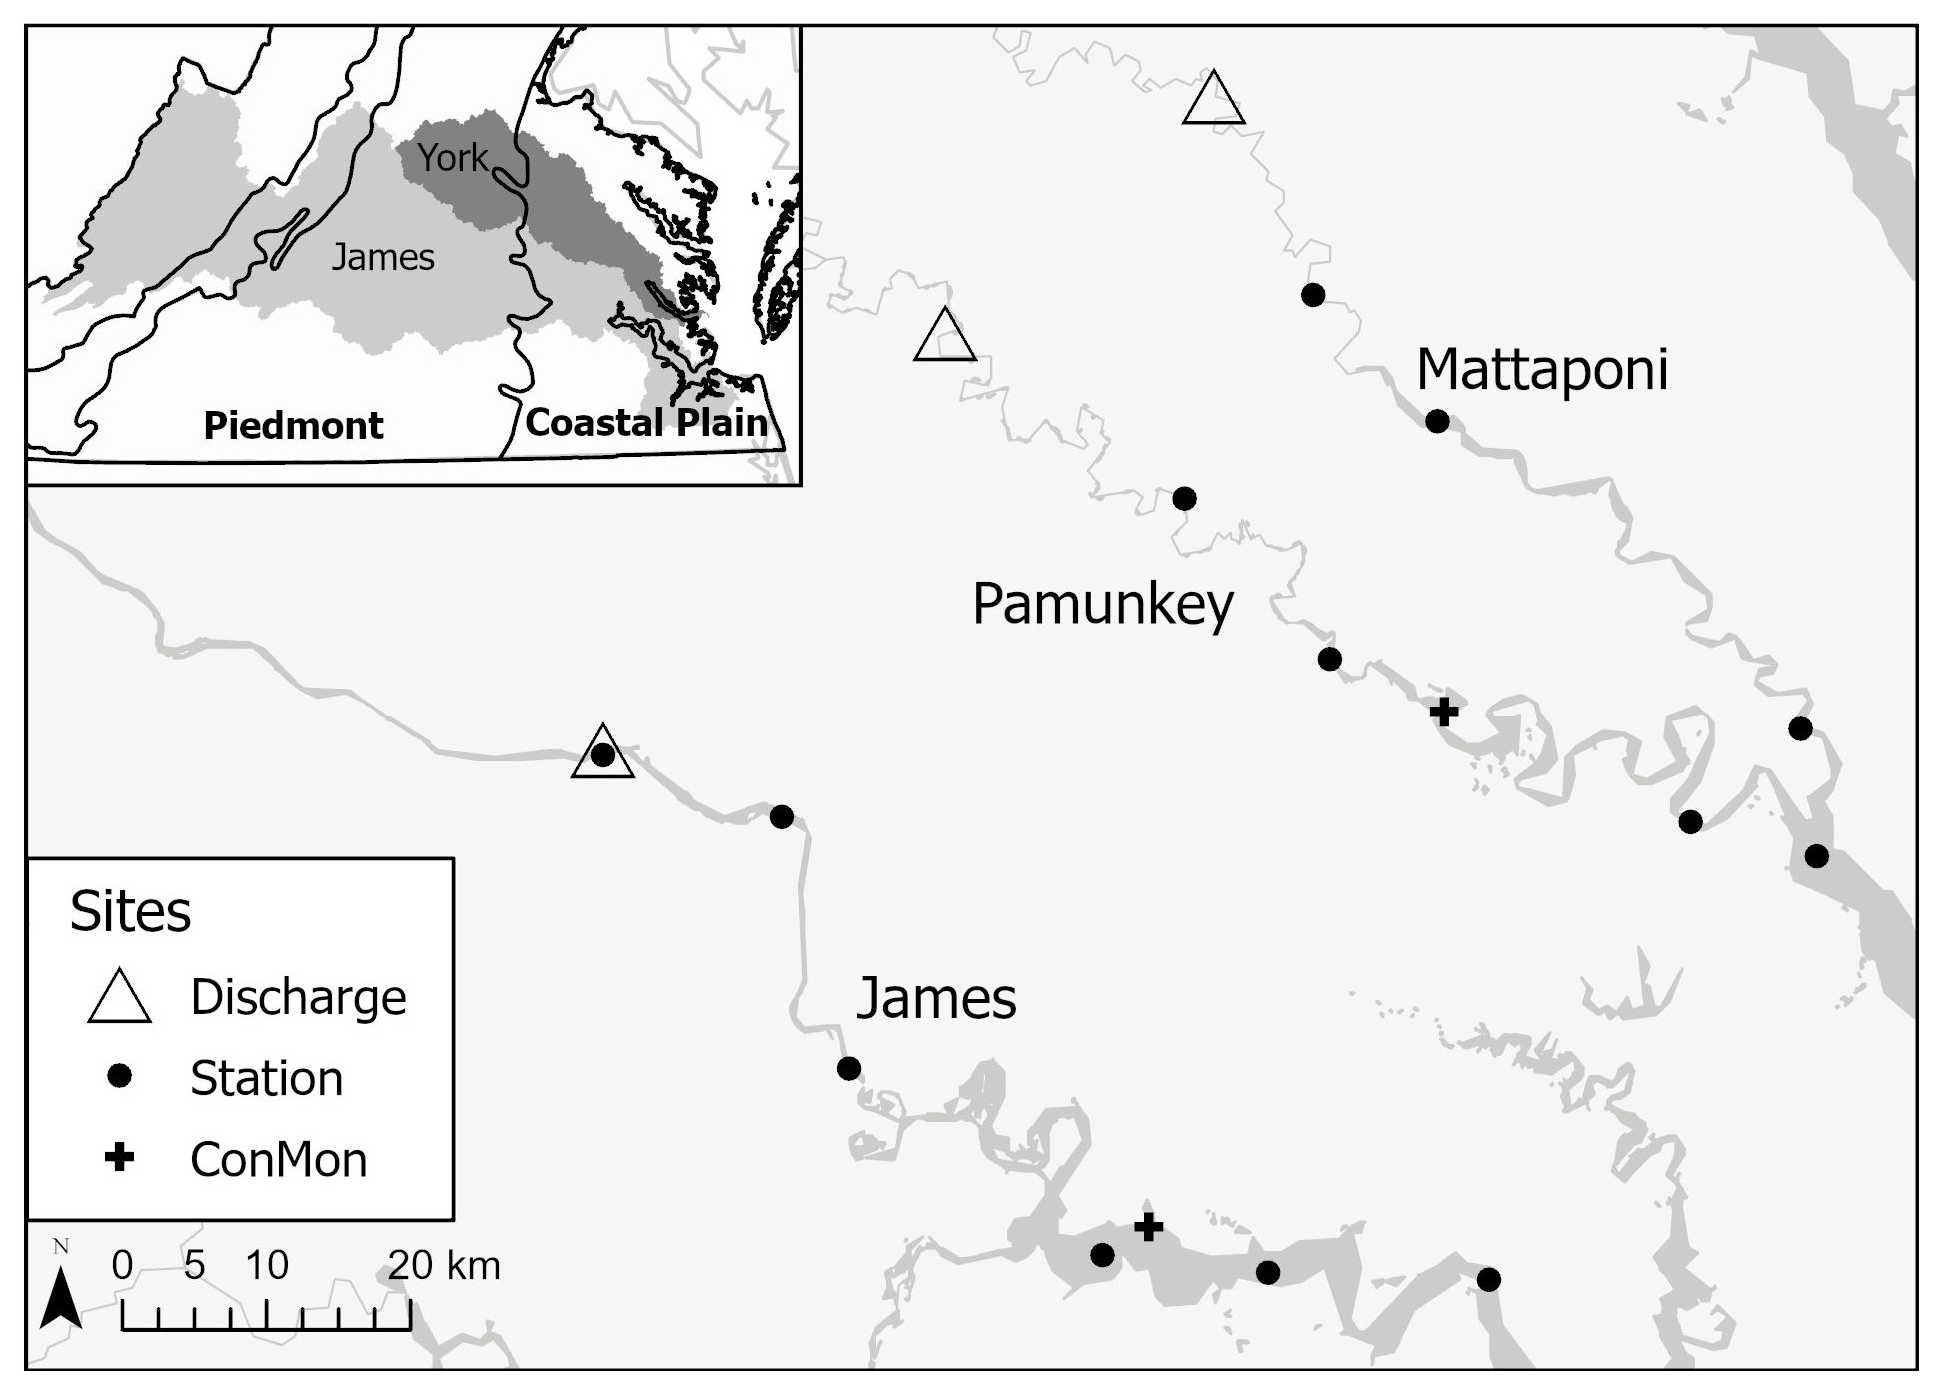
Figure 1Map showing USGS discharge gauging locations, estuarine sampling sites and continuous dissolved oxygen monitoring locations (ConMon) on the Mattaponi, Pamunkey and James. Inset: James and York watersheds in relation to physiographic provinces.
The goal of this study was to assess the relative importance of external (river inputs and tidal exchange) vs. internal (metabolism) drivers in influencing C forms and retention in the upper estuary. Mass balance results and ecosystem metabolism data were used to assess C inputs, outputs, transformation and retention in the tidal-fresh segments of the James, Pamunkey and Mattaponi estuaries. A key difference among the estuaries is their geographic setting across lowland (Coastal Plain) and upland (Piedmont and Mountain) areas (Fig. 1). Freshwater inputs to the James tidal-fresh segment are largely (90 %) derived from upland sources (i.e., above the Fall Line), whereas local (Coastal Plain) tributaries contribute ∼10 % (based on the proportion of the contributing area below the Fall Line). By contrast the Pamunkey and Mattaponi estuaries receive a greater proportion of freshwater inputs from local (Coastal Plain) sources (36 % and 51 %, respectively). Higher sediment yield from upland sources should result in greater POC inputs to the James relative to the Pamunkey and the Mattaponi. I also expected that higher gross primary production (GPP) and ecosystem respiration (ER) in the phytoplankton-dominated James Estuary would exert a stronger influence on C transformations relative to the Pamunkey and Mattaponi, which are dominated by submerged and emergent aquatic vegetation. Lastly, extensive floodplain and wetland areas along the Pamunkey and Mattaponi would be expected to contribute greater DOC inputs relative to the James. For the James Estuary, C mass balance and metabolism data were used to estimate allochthonous and autochthonous inputs and to assess constraints on food web energetics.
2.1 Study sites
This study focuses on the upper segments of the two southern tributaries of Chesapeake Bay (James and York estuaries), the latter of which is comprised of two sub-estuaries (Pamunkey and Mattaponi). This is the third in a series of papers that rely in part on comparisons among these estuaries to draw inferences about processes occurring at the river–estuarine transition. Previous papers focused on the influence of storm events on river and estuarine metabolism and water quality (Bukaveckas et al., 2020) and on factors regulating water clarity and primary production (Henderson and Bukaveckas, 2021). The proximity of the estuaries facilitated frequent sampling (1–2-week intervals) that is needed to characterize C fluxes. The study reach within the James Estuary is the tidal-fresh segment, which extends 88 km from the Fall Line (Richmond, Virginia) to the confluence with the Chickahominy River, and accounts for ∼50 % of the length of the estuary. Study reaches for the Pamunkey and Mattaponi estuaries encompassed the tidal-fresh and oligohaline segments, extending 86 km to their confluence with the York Estuary. The river basins fall within the biome of temperate deciduous forest. Though highly fragmented, the area is still predominantly rural and forested (∼70 %) with small contributions from agricultural lands (row crops and hay fields; 23 %) and urban–suburban areas (6 %; Smock et al., 2005). The predominant trees include a variety of oak, hickory, sweetgum, tulip tree and loblolly pine. Floodplain forests along the Pamunkey and Mattaponi are dominated by bald cypress, swamp black gum and water tupelo. Soils of the region are old and highly weathered, with Ultisols predominating over much of the area.
2.2 Data collection
For the James, I am able to present a relatively complete C budget inclusive of Fall Line loads, local tributary inputs and tidal fluxes of inorganic and organic fractions (DIC, DOC, POC). These results are based on data collected from river and estuarine stations over a 10-year span (2010–2019). For the Pamunkey and Mattaponi, the scope is more limited both in the time span over which data were collected (2017–2019) and due to the lack of data on Fall Line DIC and chloride inputs, which precludes estimation of tidal exchange using Cl mass balance. For the James and Pamunkey, previously published estimates of GPP and ecosystem respiration derived from in situ diel oxygen cycles are used to assess their effect on C transformations. Seasonal patterns in CO2 concentrations and air–water exchange are provided for all three estuaries.
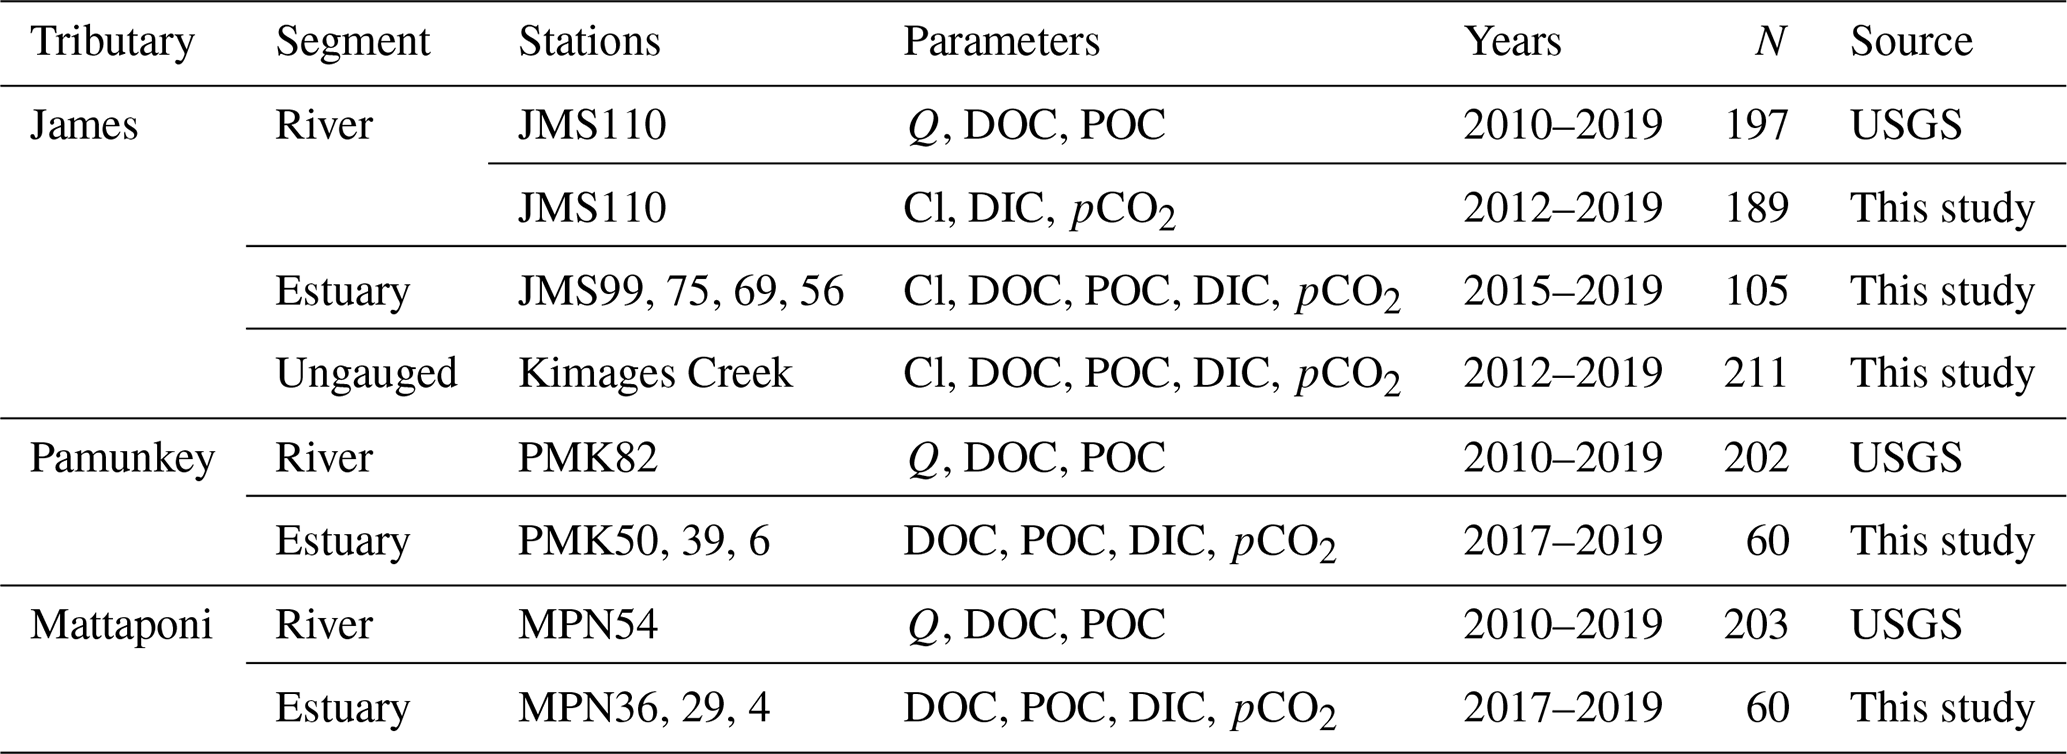
Table 1Data collection sites include USGS Fall Line gauging stations (Q denotes discharge), estuarine sampling sites and an ungauged Coastal Plain tributary of the James (Kimages Creek). Station numbers denote distance in river miles from the confluence with Chesapeake Bay (James, JMS) or the York (Pamunkey, PMK; Mattaponi, MPN). Observations denote the number of sampling dates for water chemistry within the specified time span.
2.3 C inputs and estuarine export
External C loads for the three estuaries were derived from (a) measured discharge and concentration at the Fall Line and (b) estimated contributions from ungauged tributaries below the Fall Line. Fall Line loads were based on data collected by the USGS at gauging stations located on the James, Pamunkey and Mattaponi rivers. Fall Line samples were collected at approximately monthly intervals, with supplemental samples collected during periods of high discharge. Approximately 200 measurements of DOC and POC were obtained at each of the gauging sites over the 10-year span (Table 1), along with continuous measurements of river discharge. For the James, the USGS data were supplemented by measuring DIC and Cl at the Fall Line at 1–2-week intervals during 2012–2019 (189 samples collected). Seasonal, interannual and discharge-dependent variation in riverine C concentrations was analyzed using generalized additive models (see “Statistics”). The models were used to predict daily concentrations at each site and, in combination with daily discharge, to derive daily loading values at the Fall Line. Local (ungauged) runoff was estimated as a constant fraction of the daily Fall Line discharge based on the proportion of catchment area represented by tributaries entering below the Fall Line. Daily concentrations were used in combination with Fall Line discharge, below Fall Line discharge and total discharge to derive daily input and export fluxes. Daily fluxes were summed over the budget interval (typically 1–2 weeks) and used, in conjunction with the change in mass of Cl in the estuary between the start and end of each interval, to solve for the net tidal flux of Cl.
The mass of Cl required to balance each budget interval was used in combination with measurements of Cl concentrations in tidal inflow and outflow, as represented by stations located on either side of the seaward boundary of our study reach (JMS69 and JMS56) to derive the effective volume of tidal exchange. This represents the volume of “new” water entering the study reach from the lower estuary with each tidal cycle. The James has an elongate shape that is typical of estuaries that occupy flooded river valleys. The back and forth of tidal flows means that the bulk of the water leaving on an outgoing tide returns on the subsequent incoming tide, and only a small proportion of the large tidal flux is new water. For the James, the effective volume of exchange is equivalent to 8 % of the tidal prism (Bukaveckas and Isenberg, 2013). For this study, estimates of the volume of tidal exchange were derived for each budget interval (N=309 for 2011–2019). The effective volume of exchange was used along with measured C concentrations of tidal inflows and outflows to determine the net exchange of C at the seaward boundary of the study reach. Net tidal fluxes for each budget interval were aggregated to monthly values and presented as daily areal values for comparison to riverine input and export fluxes. Lastly, monthly estimates of estuarine C retention were derived based on the difference between input and output fluxes taking into account changes in mass storage within the estuary.
For DIC, our estimation of retention also took into account air–water CO2 exchange (see below).
2.4 Estuarine metabolism
Previously published estimates of gross primary production (GPP) and ecosystem respiration were used to assess internal C transformations for the James and Pamunkey (Bukaveckas et al., 2020). Rates of metabolism were derived from continuous (15 min) monitoring of dissolved oxygen at stations located within our study segments of the James and Pamunkey (Fig. 1). The James monitoring station is located at the Virginia Commonwealth University (VCU) Rice Center Research Pier, approximately 2 km from our JMS75 sampling location. The Pamunkey station (White House Landing) is operated by the Virginia Institute of Marine Science and located near the mid-point of our study segment. Similar equipment (YSI 6600 or EXO sondes) and protocols are used at the two stations including routine (2–3 weeks) maintenance and calibration of sondes as per manufacturer recommendations. Daily GPP and ER were derived using the single-station open-water method. Following Caffrey (2003, 2004), 15 min DO measurements were smoothed to 30 min averages and multiplied by water depth to obtain areal rates of oxygen flux at 30 min intervals throughout the day.
Atmospheric exchange (AE) was derived at 30 min intervals based on water column DO saturation and a generic estuarine gas transfer coefficient. A previous analysis using 23 years of station data for the James showed that estimates of atmospheric exchange derived from oxygen saturation and the fixed gas transfer coefficient were not significantly different from exchange coefficients derived using variable water velocity and wind speed (Tassone and Bukaveckas, 2019). ER was derived by extrapolating nightly O2 fluxes to a 24 h period. GPP was derived as the sum of daytime oxygen production, and ER was during daylight hours. Oxygen-based values were converted to C assuming a photosynthetic quotient of 1.2 and a respiratory quotient of 1.
2.5 Sampling and analysis
Methods were described previously (Bukaveckas et al., 2011, 2020; Henderson and Bukaveckas, 2021) and are summarized here. Data were collected from four stations in the James tidal-fresh segment, three stations in each of the Pamunkey and Mattaponi study reaches, and one tributary stream (Kimages Creek) located at the VCU Rice Center (Fig. 1; Table 1). Estuarine sites were sampled by boat in the main channel except in the upper, narrow sections of the Pamunkey and Mattaponi where samples were collected from shore in areas of active flow. Owing to vertically well-mixed conditions (no temperature or salinity stratification), water samples and in situ measurements were obtained near the surface (∼0.5 m). Water temperature and salinity were measured using a YSI ProDSS sonde. The partial pressure of carbon dioxide in water and air was measured in the field using a PP Systems EGM-4 portable infrared CO2 analyzer calibrated at 0 and 2000 ppm. Water samples were analyzed for chlorophyll a (chl a), POC, DIC, DOC and Cl. Samples for chl a and POC were filtered through Whatman GF/A glass filters (0.5 µm nominal pore size). Filters for chl a analyses were extracted for 18 h in buffered acetone and analyzed on a Turner Designs TD-700 fluorometer (Arar and Collins, 1997). Filters for POC analysis were dried at 60 ∘C for 48 h, fumed with HCl to remove inorganic carbon and analyzed on a PerkinElmer CHN analyzer. Chloride concentrations were determined using a Skalar segmented flow analyzer by the ferricyanide method (APHA, 1998). Samples for DIC and DOC were filtered in the field through Whatman GF/A filters and analyzed using a Shimadzu TOC analyzer.
2.6 Air–water CO2 fluxes
Air–water exchange of CO2 was calculated using the equation from Cai and Wang (1998):
where KT is the gas transfer velocity, KH is the solubility constant, and pCO2 is the partial pressure of CO2 in water and air. The solubility constant was derived according to the equation of Weiss (1974), taking into account water temperature and salinity recorded at the time of CO2 measurement. Gas transfer velocities were initially derived from daily average wind speed (U10 corrected) measured at the VCU Rice Center Research Pier (James) and the Taskinas Creek National Estuarine Research Reserve (Pamunkey and Mattaponi). Gas transfer velocities derived from wind speed generally fell within the range of 1 to 1.5 m d−1, which is low in comparison to the global average (5.7 m d−1, Raymond et al., 2017) and to values that are considered appropriate for large rivers (4.3 m d−1, Alin et al., 2011; Reiman and Xu, 2019). Based on these considerations, a value of 4.3 m d−1 was used for all calculations (see “Discussion” for further consideration of gas transfer velocities).
2.7 Statistics
Generalized additive models (GAMs) were used to model river and estuarine C and Cl concentrations based on discharge, day of year (to capture seasonal patterns) and decimal date (to depict interannual variation). GAMs are gaining increasing usage for modeling water chemistry due to their ability to account for non-linear effects and to fit trends of a form that is not known a priori (Morton and Henderson, 2008; Murphy et al., 2019; Yang and Moyer, 2020; Wiik et al., 2021). The GAM analysis was performed using the “mgcv” package in R (Wood, 2006). The package default thin plate regression spline was used to depict the effect sizes of discharge and decimal date; a cyclic cubic regression spline was used to depict seasonal effects. The default output for the effect size was shifted to center on the mean of the modeled dependent variable to show the response of the GAM model within the range of the dependent variable.
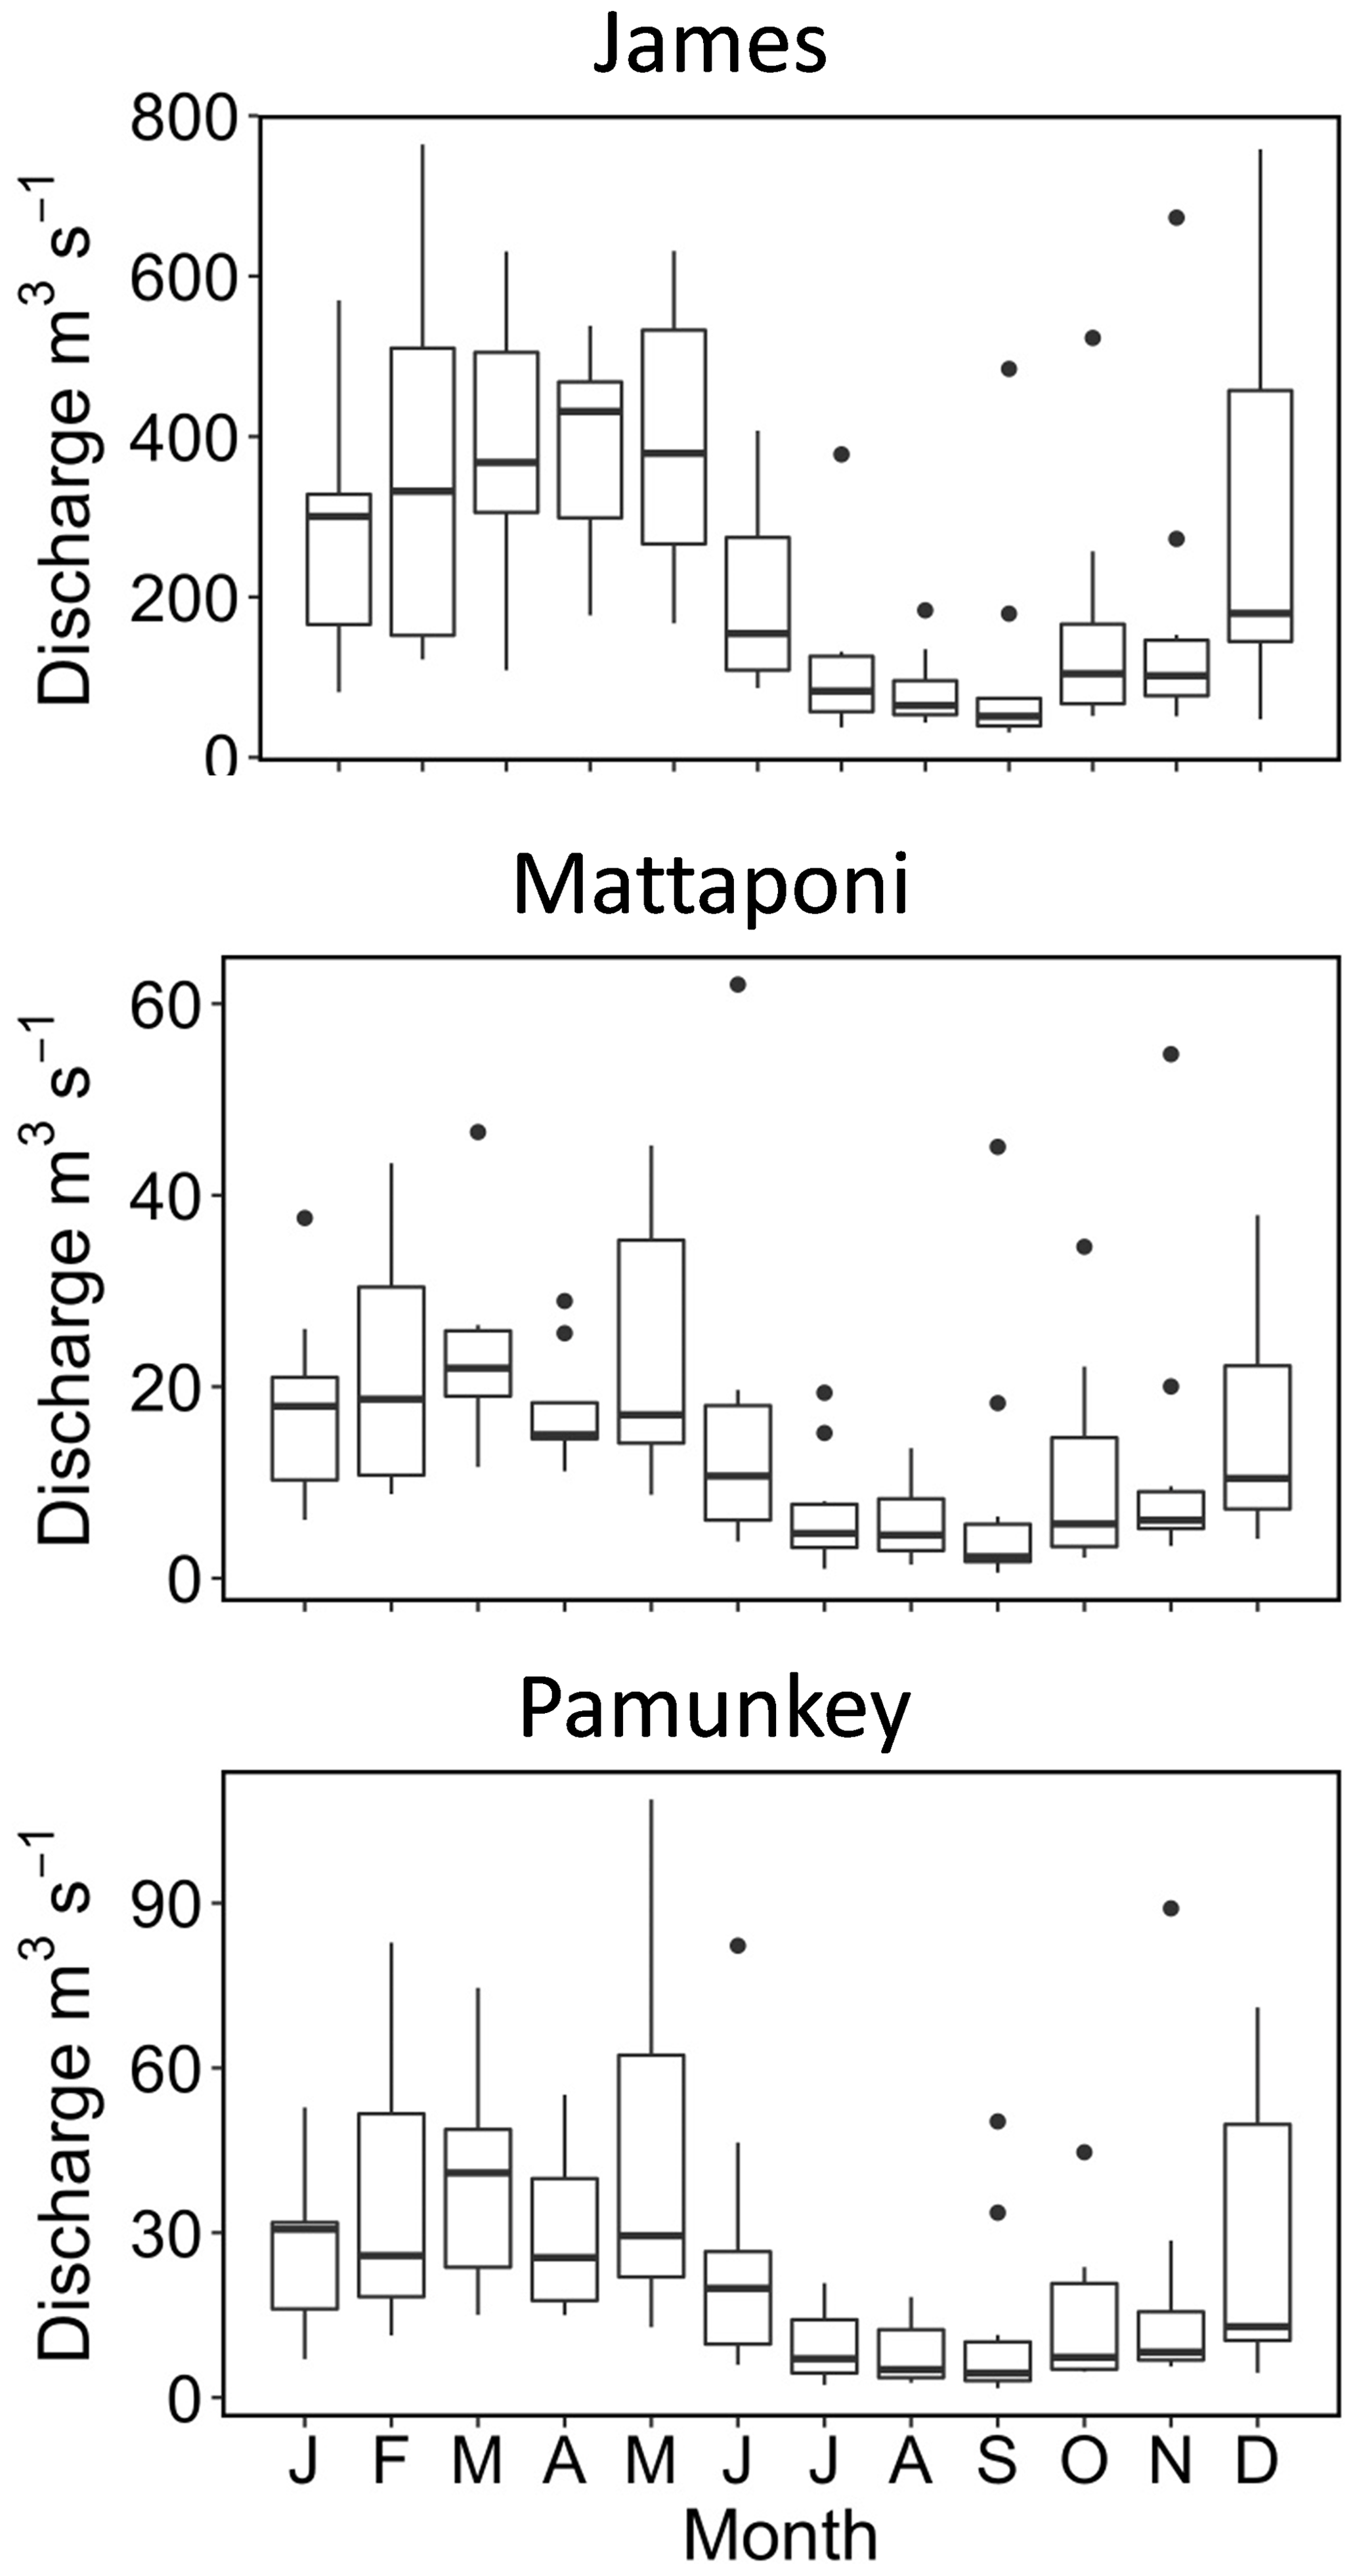
Figure 2Seasonal variation in instantaneous discharge measured at the Fall Line of the James, Mattaponi and Pamunkey rivers. Here and in subsequent figures, symbols denote median (bar), 25 % and 75 % tiles (box), 5 % and 95 % tiles (whiskers), and outliers (dots).
3.1 Estuarine hydrology
The James, Pamunkey and Mattaponi rivers exhibit similar hydrographs with the highest monthly average discharge during January–May and the lowest discharge in July–November (Fig. 2). Average monthly discharge in winter–spring is approximately 4-fold higher in comparison to summer–fall. Median freshwater replacement times (FRTs), taking into account Fall Line inputs plus local (ungauged) tributaries, were 30 d (James), 46 d (Mattaponi) and 60 d (Pamunkey) during the period of study. The mass of Cl in the James tidal-fresh segment varied by >20-fold from seasonal minimum values during high discharge (∼7 mg L−1) to peak values (>100 mg L−1) during summer base flow (Fig. 3). These seasonal increases in estuarine Cl were most pronounced in summers with low freshwater inputs (e.g., 2012, 2017, 2019). Despite the large seasonal variation, Cl changed relatively slowly within the estuary (median of 0.5 % d−1), as input and output fluxes were largely offset. In late summer (August–October), the development of strong Cl gradients across the seaward boundary of the study reach resulted in high rates of Cl gain and loss via tidal exchange. As the lower tidal-fresh segment accounts for the bulk of total volume (80 %), increases in Cl at the seaward end of the study reach had a large effect on estuarine Cl mass. By volume, the effective tidal exchange derived from the Cl mass balance was equivalent to 7.4 % (median) and 14±1 % (mean and SE) of the tidal prism.
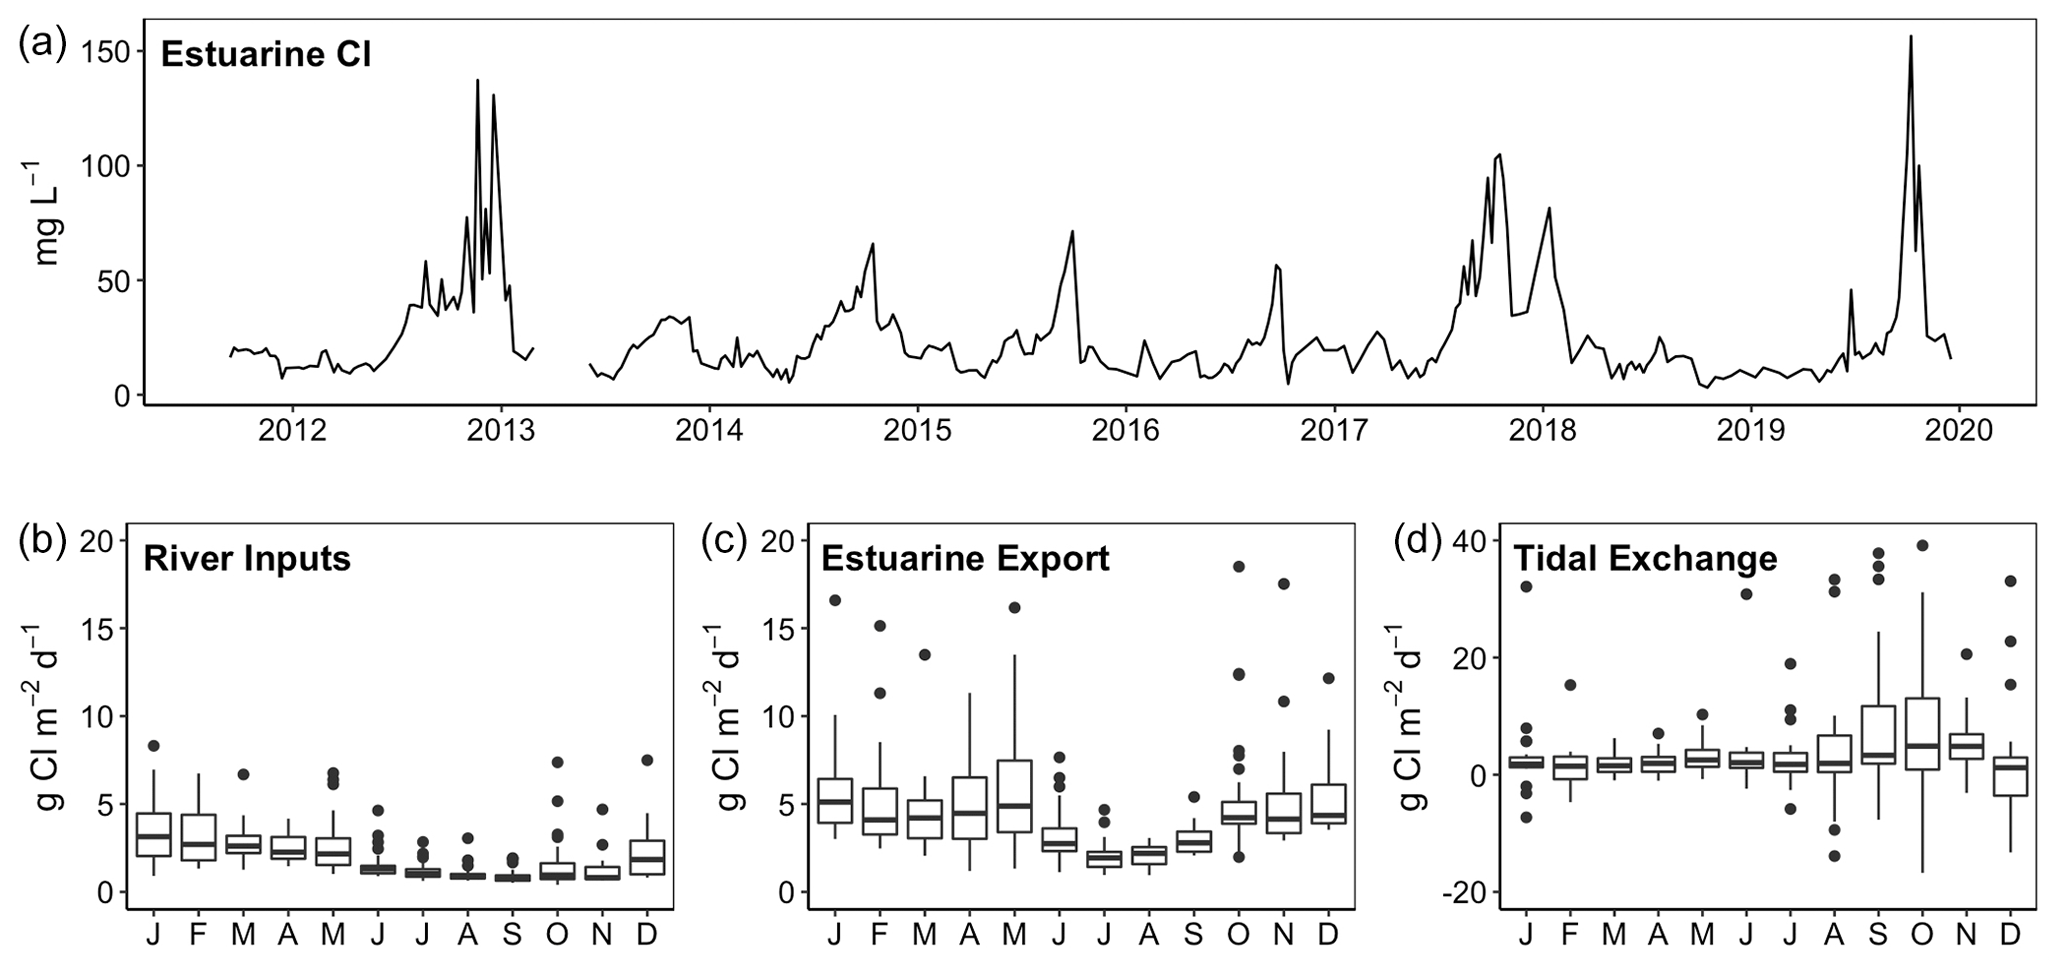
Figure 3Time series of chloride concentrations in the tidal-fresh segment of the James Estuary (a) and chloride fluxes associated with river inputs, estuarine export and net tidal exchange (b–d).
Table 2GAM analysis of seasonal (day of year; DoY), interannual (date) and discharge-dependent variation in river, tributary and estuarine DOC, POC, DIC, pCO2 and Cl. Data are for riverine and upper-estuarine segments of the James, Mattaponi and Pamunkey as well as a local (below Fall Line) tributary (Kimages Creek). Statistics include the adjusted R2, root mean square error (RMSE as mg L−1, except pCO2 as ppmv) and significance of s values with their effective degrees of freedom.
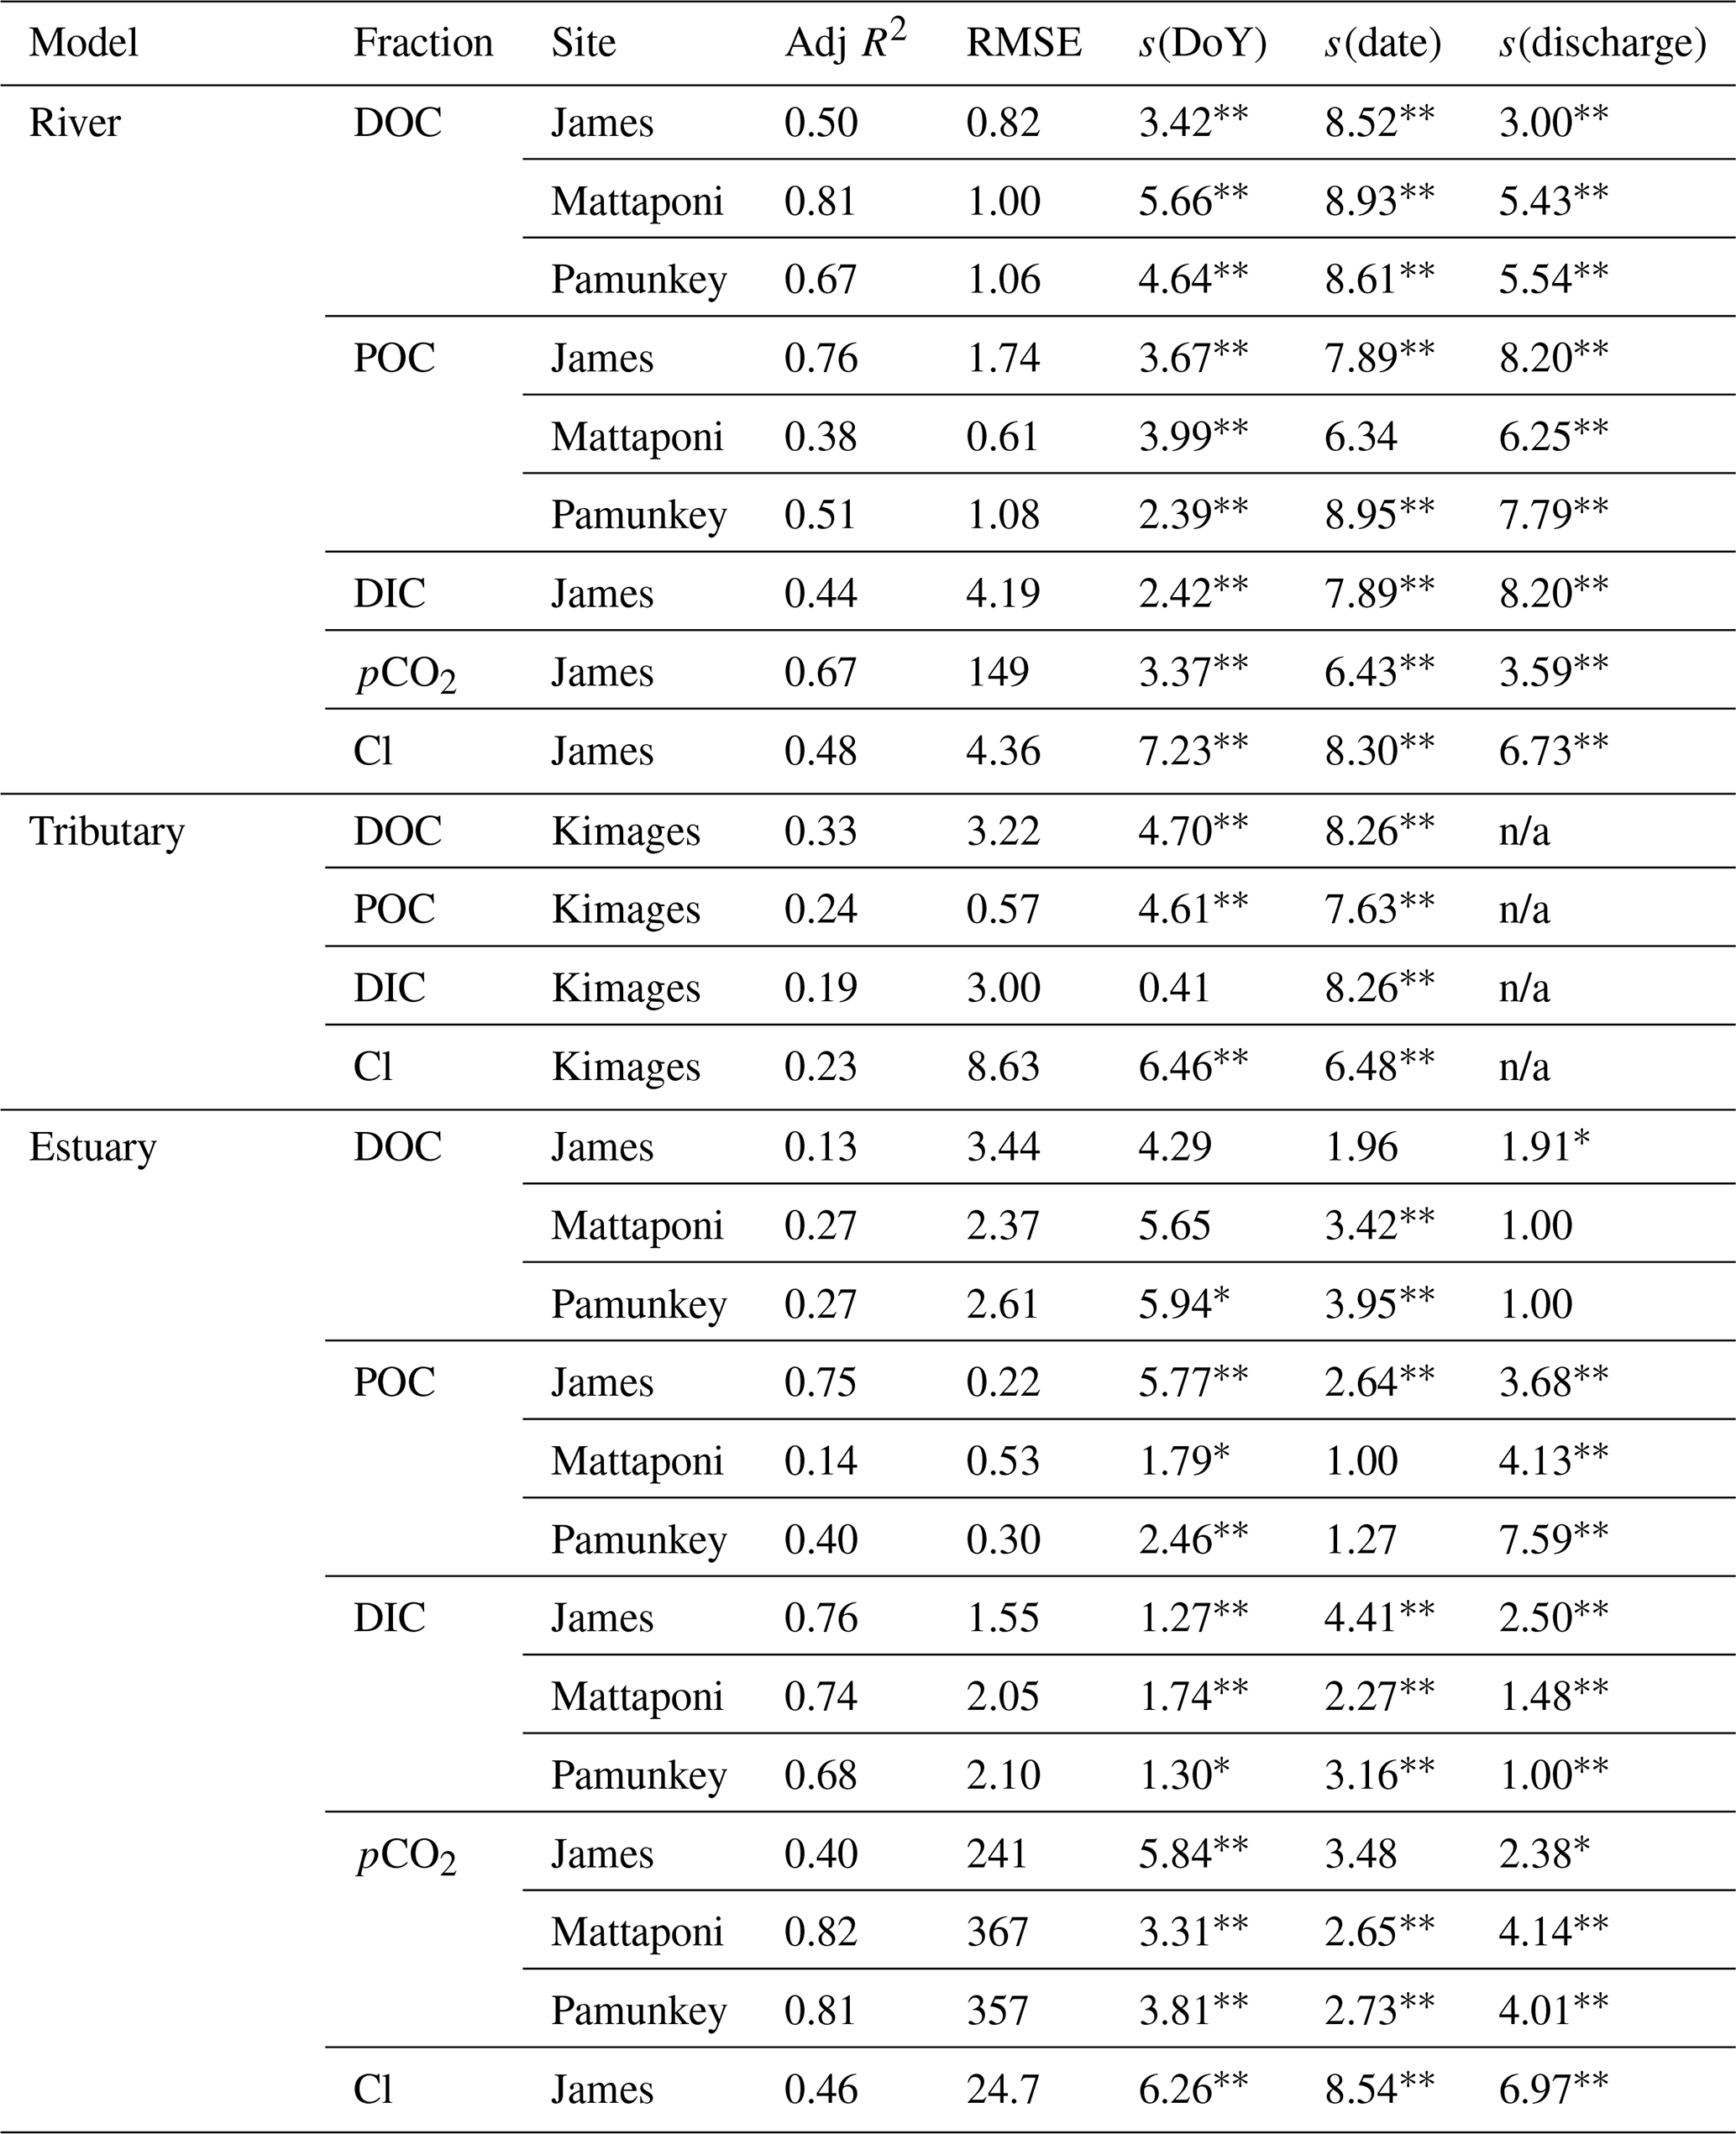
∗ denotes p<0.05, denotes p<0.001. n/a: not applicable.
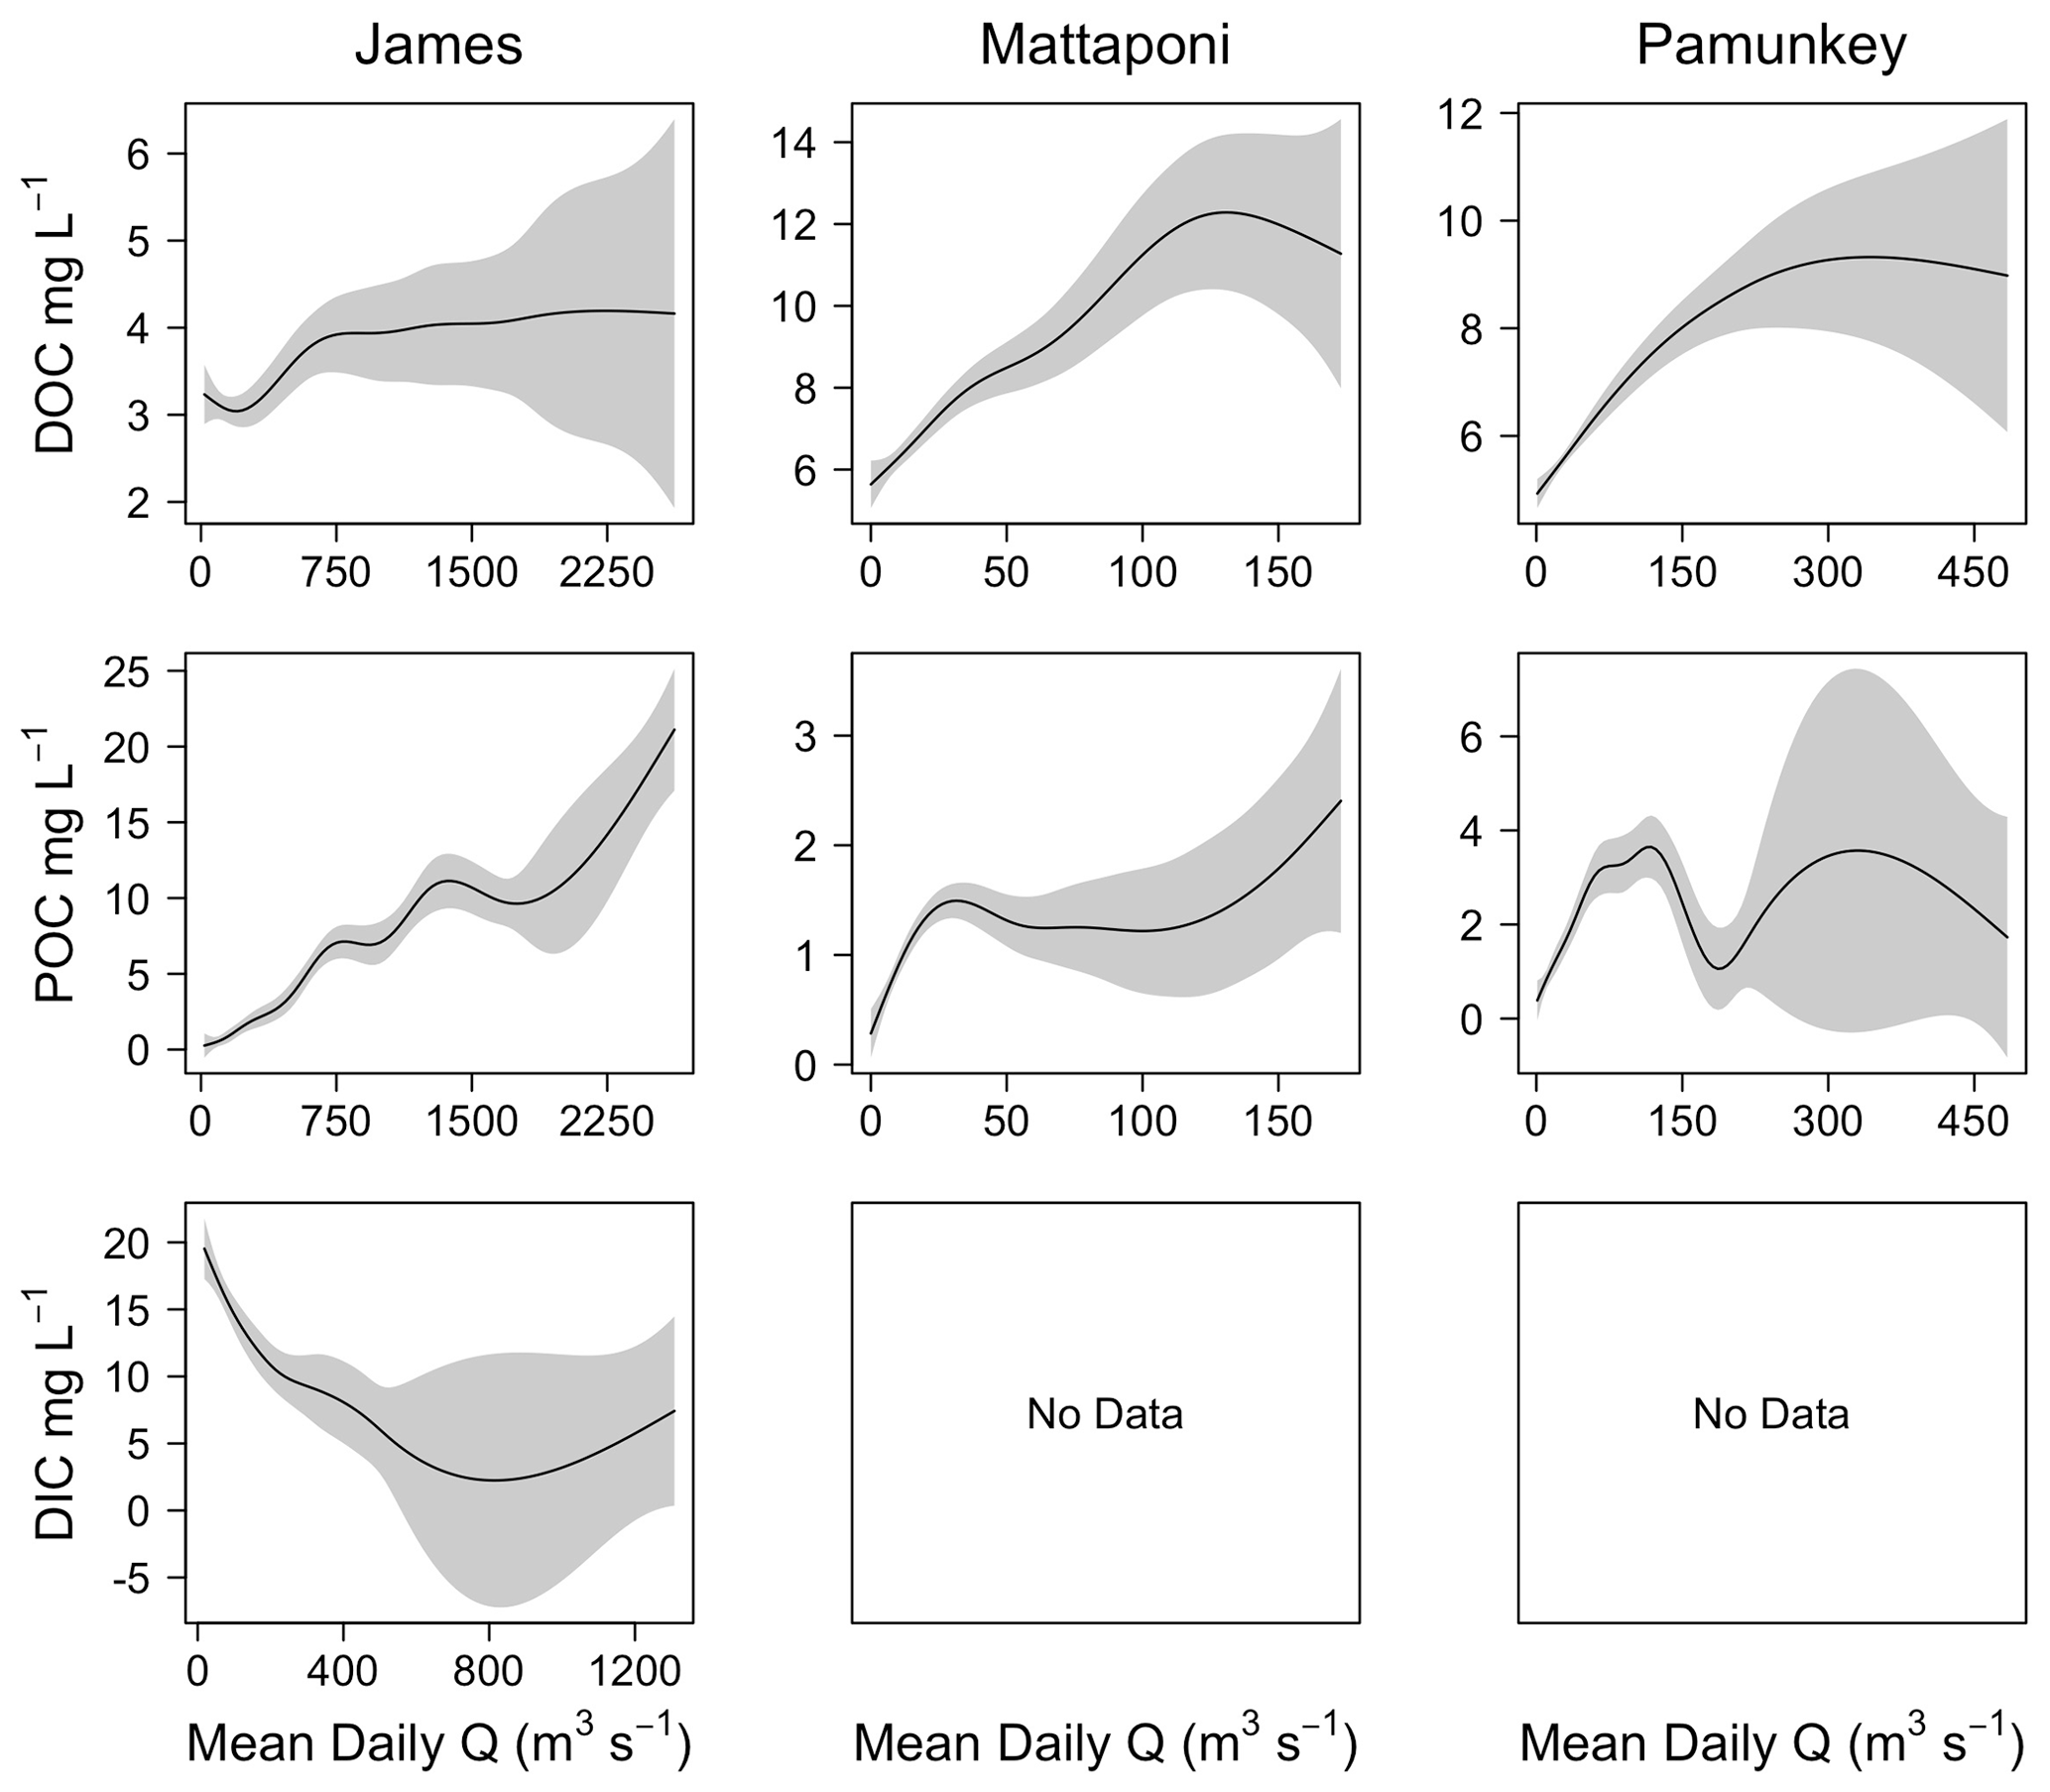
Figure 4Results from GAM analysis depicting changes in riverine DOC, POC and DIC as a function of discharge (Q) for the James, Mattaponi and Pamunkey rivers.
3.2 Discharge effects on river and estuarine C
Discharge was a significant factor influencing riverine C concentrations, though the strength of these effects differed among C fractions and among the three tributaries. Increasing discharge was associated with increasing river DOC in the Mattaponi (from 6 to 12 mg L−1) and Pamunkey (from 5 to 9 mg L−1) but had little effect on James River DOC, which was generally low over the range of observed discharge (3–4 mg L−1; Fig. 4). Generalized additive models incorporating discharge, seasonal and interannual variation accounted for 50 % to 81 % of the variation in river DOC (Table 2). Increasing discharge was associated with large increases in POC in the James River (up to 20 mg L−1). The effects of discharge on river POC were weaker in the Mattaponi and Pamunkey, where concentrations were generally low over the range of discharge (<2 and <4 mg L−1, respectively). Increasing discharge was associated with large decreases in DIC in the James River (from 20 to 1 mg L−1). Overall, increasing discharge resulted in higher DOC concentrations in the Pamunkey and Mattaponi rivers, higher POC concentrations in the James River, and lower DIC concentrations in the James River.
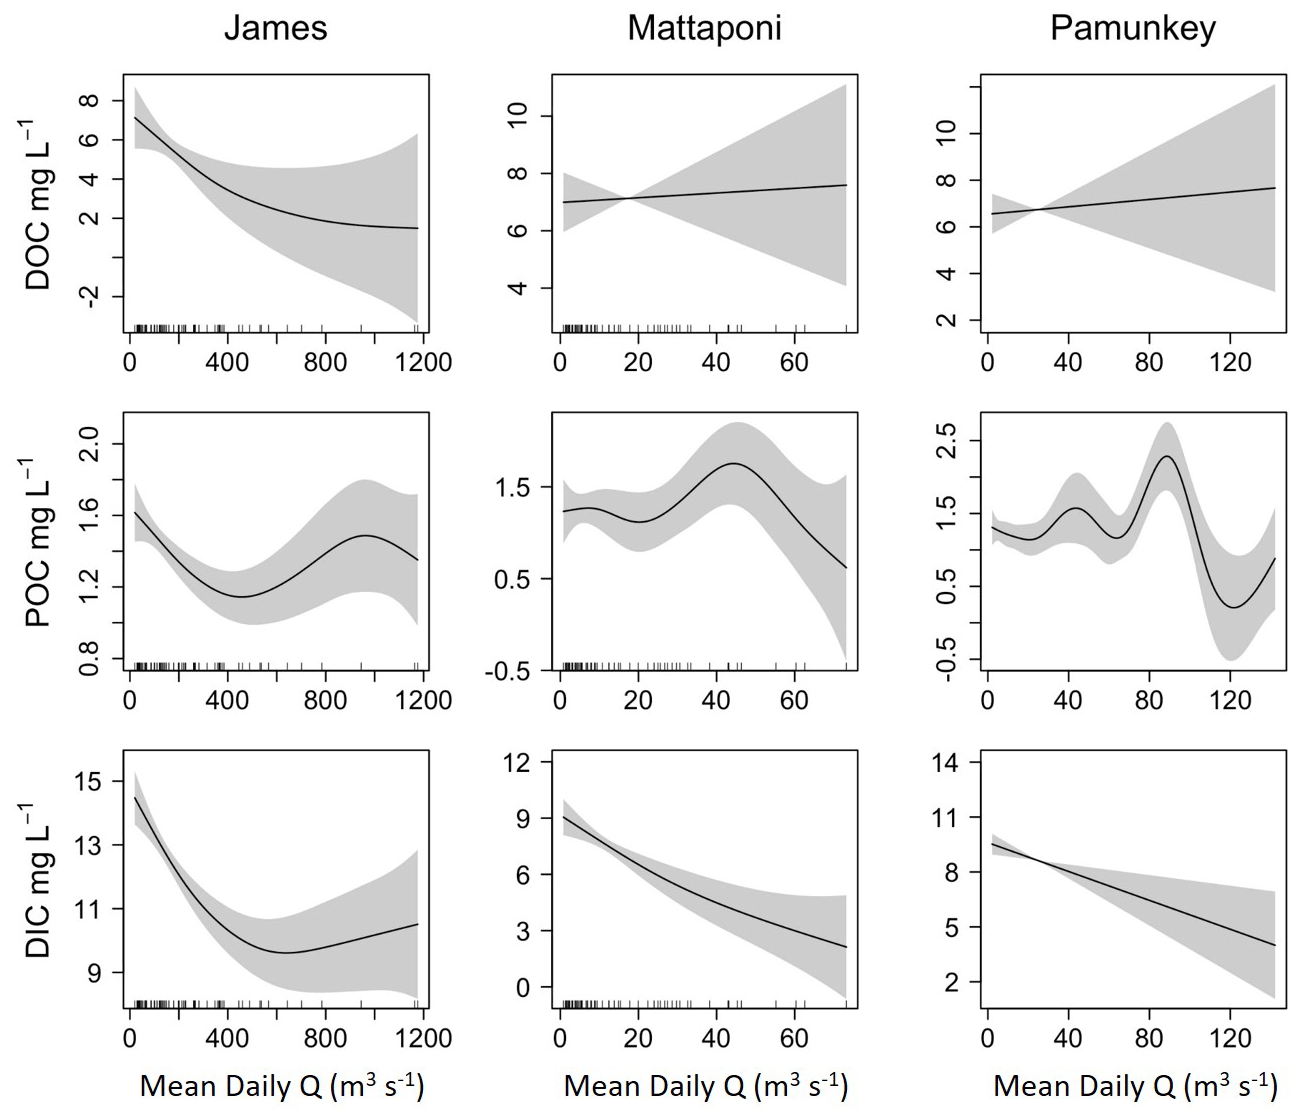
Figure 5Results from GAM analysis depicting the effects of discharge (Q) on estuarine DOC, POC and DIC for the James, Mattaponi and Pamunkey estuaries. Concentrations are volume-weighted averages among estuarine sampling locations.
Although increases in discharge had a positive effect on riverine DOC and POC, estuarine concentrations were only weakly and, in some cases, negatively affected by increasing discharge (Fig. 5). In the James, estuarine DOC concentrations were typically higher than riverine values such that increases in river discharge resulted in a reduction in estuarine DOC. In the Pamunkey and Mattaponi, increasing discharge had little effect on estuarine DOC, as estuarine concentrations were similar to river concentrations. Discharge was not a significant predictor of variation in DOC for the Pamunkey and Mattaponi estuaries (Table 2). Similar findings for POC showed weak seasonal, interannual and discharge-dependent effects and a low proportion of explained variation for the Pamunkey and Mattaponi estuaries. In contrast, POC concentrations in the James Estuary were strongly influenced by season, with predicted concentrations rising from 1 to 2 mg L−1 during winter to summer. POC concentrations were negatively related to discharge. Increasing discharge had a significant negative effect on DIC in all three estuaries, which decreased by 5–6 mg L−1 over the observed range of discharge. Overall, these findings show that river discharge had strong negative effects on estuarine DIC but little influence on estuarine DOC and POC. Significant seasonal variation in POC was observed in the James but not the Pamunkey or Mattaponi.
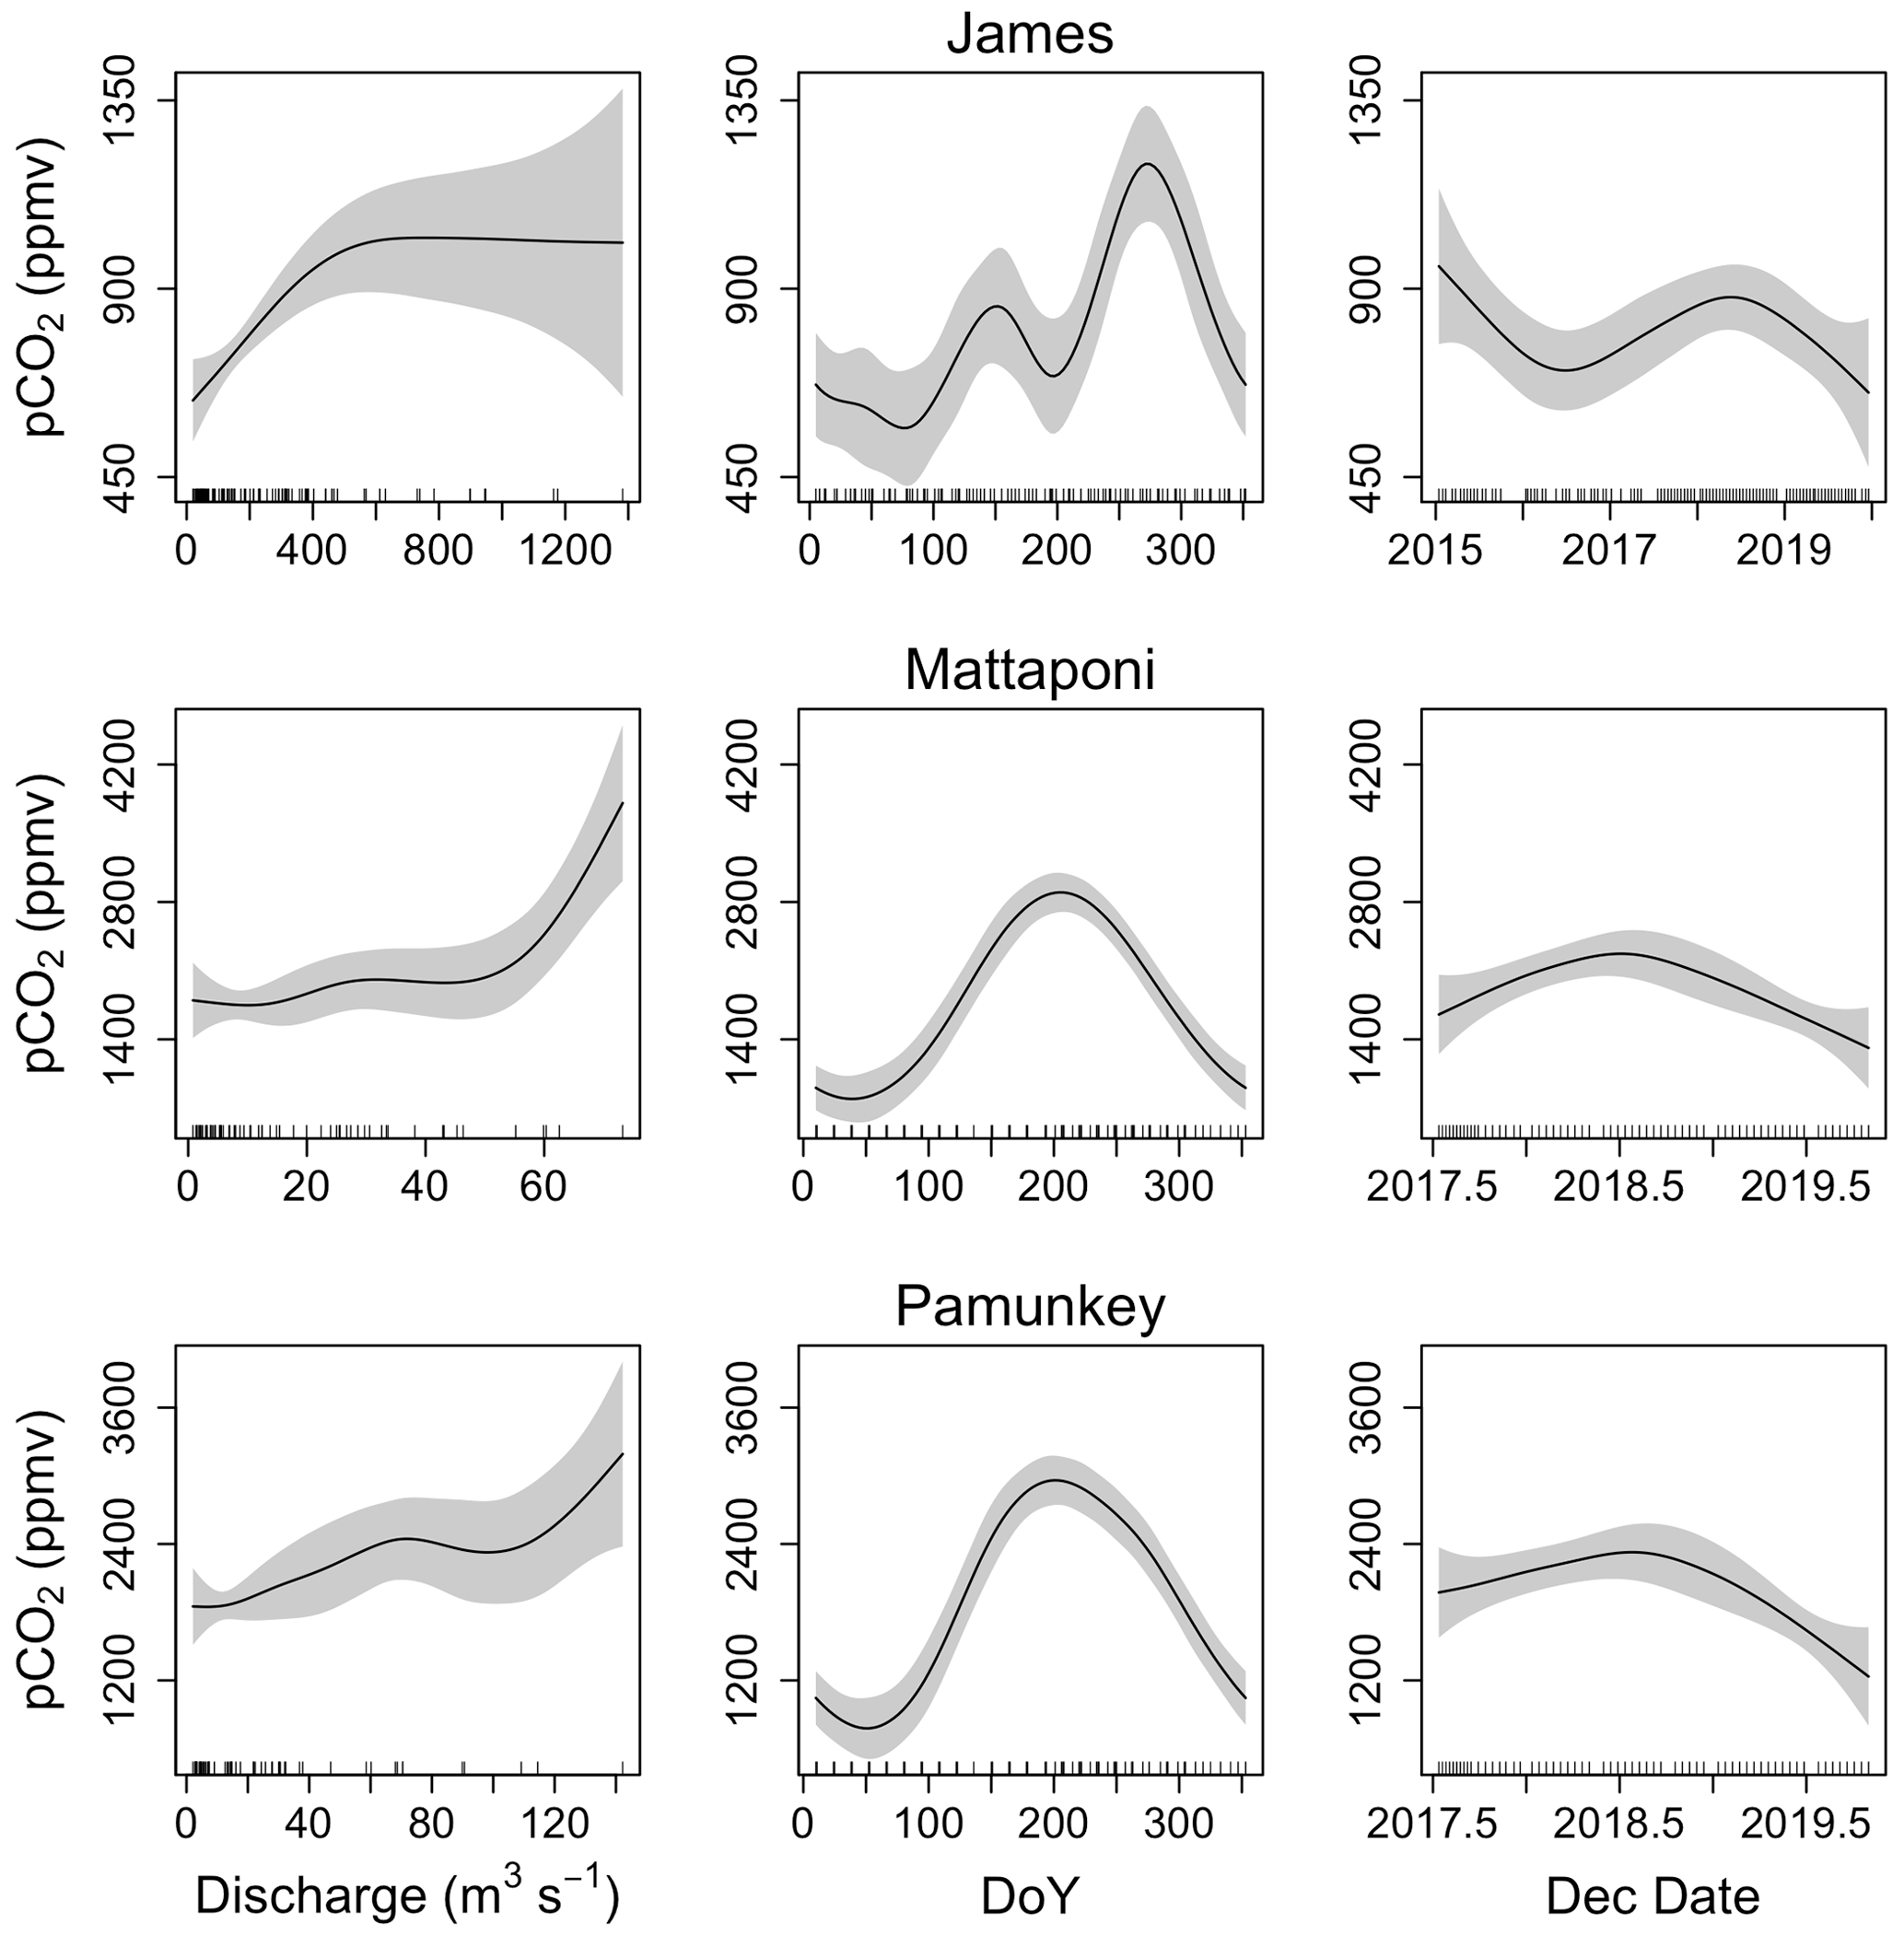
Figure 6Results from GAM analysis depicting seasonal (day of year; DoY), interannual (decimal date) and discharge-dependent variation in pCO2 of the James, Mattaponi and Pamunkey estuaries. Analyses were based on volume-weighted averages from 3–4 sampling locations in each estuary.
3.3 Estuarine pCO2
GAM analysis revealed significant seasonal and discharge-dependent variation in estuarine pCO2 (Table 2). The effects of discharge on estuarine pCO2 differed among the three tributaries (Fig. 6). In the Pamunkey and Mattaponi, there was little effect of discharge, except in the upper quartile of the range, which was associated with rising estuarine pCO2. In the James, estuarine pCO2 increased linearly over the lower one-third range of discharge and thereafter plateaued. The Mattaponi and Pamunkey exhibited large seasonal variations in estuarine pCO2. Peak summer concentrations (∼2600 ppmv) were 2-fold higher in comparison to winter minimum values (∼1200 ppmv;). A more complex seasonal pattern was observed in the James with bimodal peaks in spring and fall (850 and 1250 ppmv, respectively) bracketing low concentrations in mid-summer. In summer, significantly lower pCO2 was observed at sites located at the chl a maximum (JMS75: 789 ppmv, JMS69: 644 ppmv) relative to stations in the upper tidal-fresh segment (JMS99: 1007 ppmv) and the most seaward station (JMS56: 909 ppmv; p<0.01). The two stations located at the chl a maximum were the only sites to exhibit periodic undersaturation of pCO2. The low values at these stations were not observed in winter. There was little longitudinal variation in pCO2 among stations in the Pamunkey and Mattaponi. Overall, annual average concentrations in the Pamunkey (2010 ± 117 ppmv) and Mattaponi (1900 ± 120 ppmv) were more than 2-fold higher relative to the James (784 ± 77 ppmv). Higher pCO2 concentrations in the Pamunkey and Mattaponi estuaries were associated with larger air–water CO2 fluxes (2.97 ± 0.17 and 2.77 ± 0.17 g C m−2 d−1, respectively) relative to the James (0.87 ± 0.05 g m−2 d−1; Fig. 7). Strong seasonal patterns were observed in the Pamunkey and Mattaponi with monthly average fluxes ranging from 1–2 g m−2 d−1 in winter to 3–4 g m−2 d−1 in summer, whereas fluxes from the James were similar year-round (∼1 g m−2 d−1).
3.4 C fluxes and retention
C fluxes into and out of the James Estuary varied seasonally (Fig. 8). DOC inputs followed expected seasonal patterns with peak values during months with elevated discharge (January–May) and minimum values during predominantly low discharge in July–November. Seasonal variation in DOC inputs was closely matched by export fluxes. Net tidal fluxes were negligible by comparison owing to small differences in concentration across the segment boundary. Monthly DOC retention was generally negative, indicating net export of DOC. On an annual basis, the DOC balance was −0.10 ± 0.02 g m−2 d−1, with export exceeding inputs by 11 ± 5 %. Riverine inputs of POC varied seasonally with the highest values in January–May and generally low values in June–December. By contrast, estuarine export of POC was consistently low throughout the year. As a result, POC retention was highest in January–May. Net tidal fluxes were positive, indicating a loss of POC with each tidal cycle, but these fluxes were small in comparison to river inputs. On an annual basis, the net retention of POC was 0.59 ± 0.11 g m−2 d−1, corresponding to 72 ± 4 % of inputs. DIC input and output fluxes followed a similar pattern as for DOC, with peak values in months with high discharge. Taking into account estuarine export and atmospheric fluxes, the James was a net source of DIC with losses (4.25 g m−2 d−1) exceeding inputs (2.82 g m−2 d−1) by 51 %.
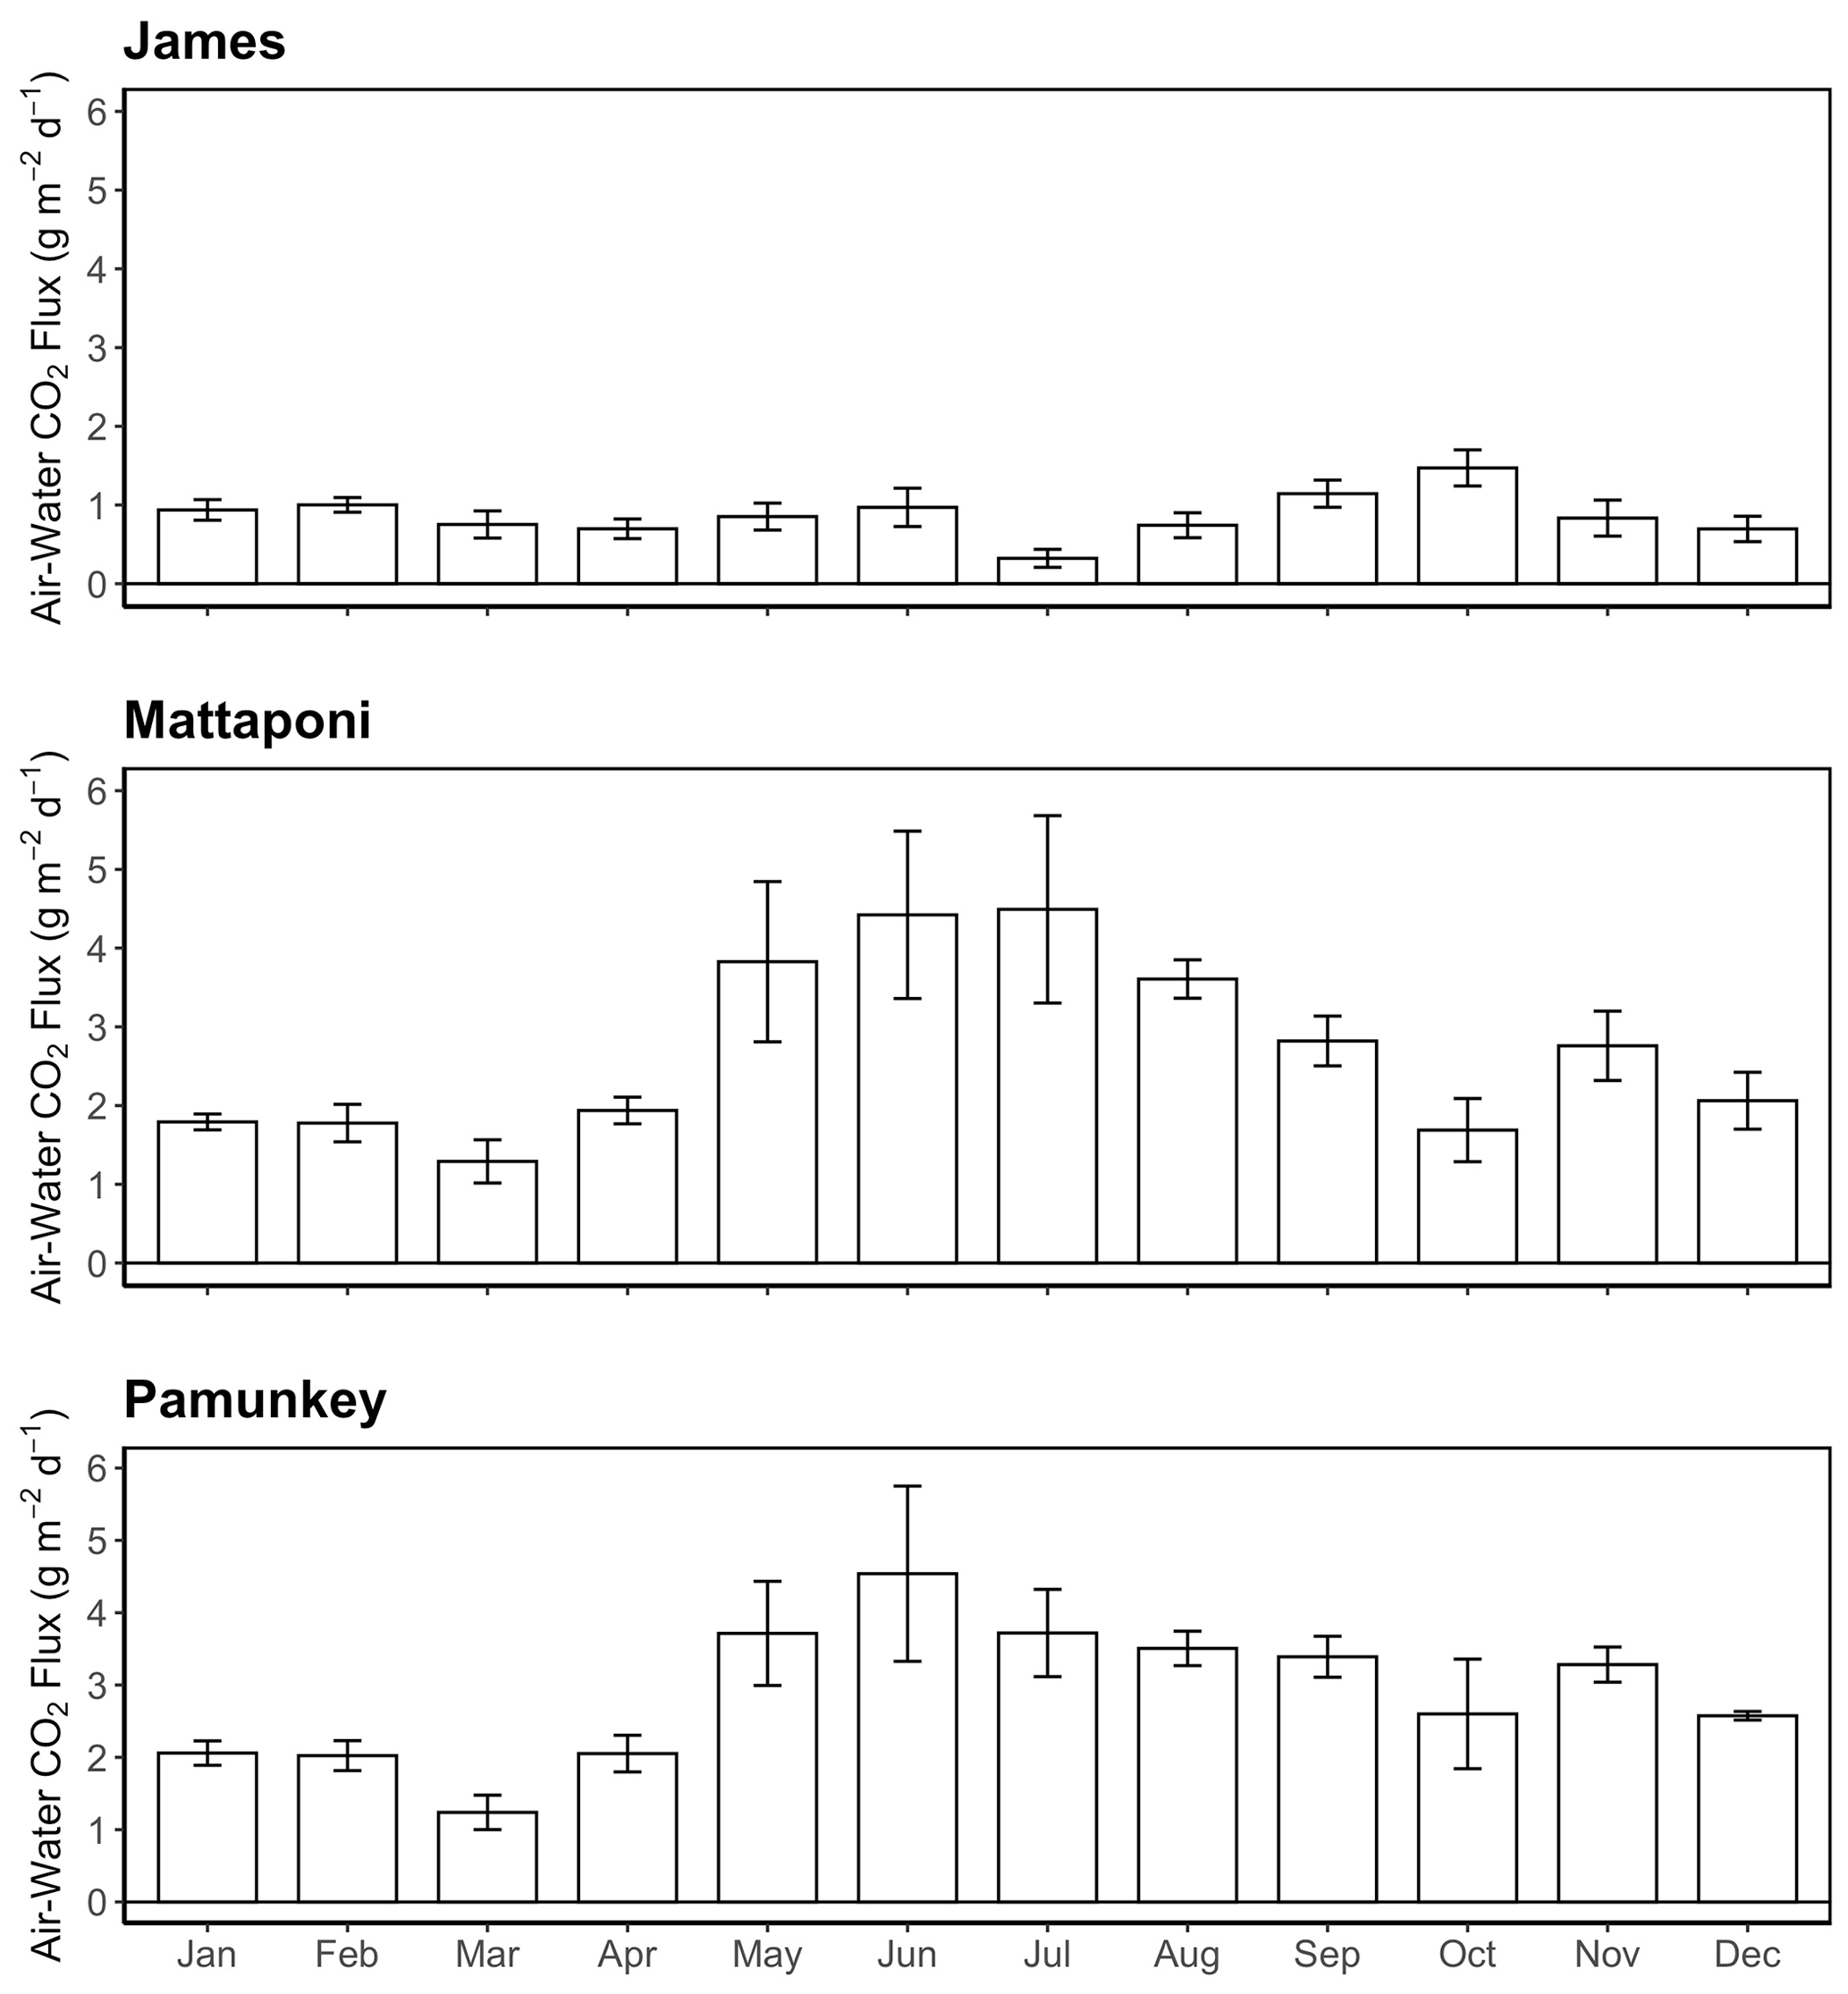
Figure 7Monthly average values of air–water CO2 fluxes for the James, Mattaponi and Pamunkey estuaries. Positive values denote efflux of CO2 from the estuary.
Our mass balance analysis does not explicitly consider the role of point source inputs in the estuarine C budget. Point sources that discharge to the tidal-fresh segment of the James are principally wastewater treatment plants (WWTPs) and some industries associated with the Richmond metro area. The volume of effluent discharged to the James is small (annual average of 15–21 m3 s−1 during 2007–2014) in comparison to annual average river discharge (∼225 m3 s−1). But as effluent may contain elevated C concentrations, point sources could potentially contribute an appreciable fraction of C inputs. Point sources typically do not report C concentrations as part of their effluent monitoring; therefore we carried out a 2-year study of DIC, DOC and POC concentrations in effluent from the largest point source (City of Richmond WWTP). Effluent POC concentrations (1.54 ± 0.13 mg L−1) were comparable to riverine values, whereas effluent DOC (13.1 ± 1.2 mg L−1) and DIC (22.7 ± 1.6 mg L−1) were 2-fold higher relative to riverine concentrations. These values were extrapolated to all point source inputs to the James as a first approximation of their potential importance to the estuarine C budget. Daily average POC loads from point sources were too small to appreciably affect our estimate of estuarine POC retention. Point source inputs of DOC (0.21 g m−2 d−1) and DIC (0.36 g m−2 d−1) were equivalent to 23 % and 12 % (respectively) of riverine inputs. Taking into account point source contributions, the mass balance shows that the James tidal-fresh segment is a net sink for DOC (0.12 g m−2 d−1) and POC (0.61 g m−2 d−1) and a net source of DIC (1.07 g m−2 d−1). Overall, the James tidal-fresh segment was nearly in balance (within 6 %) for total C inputs and outputs.
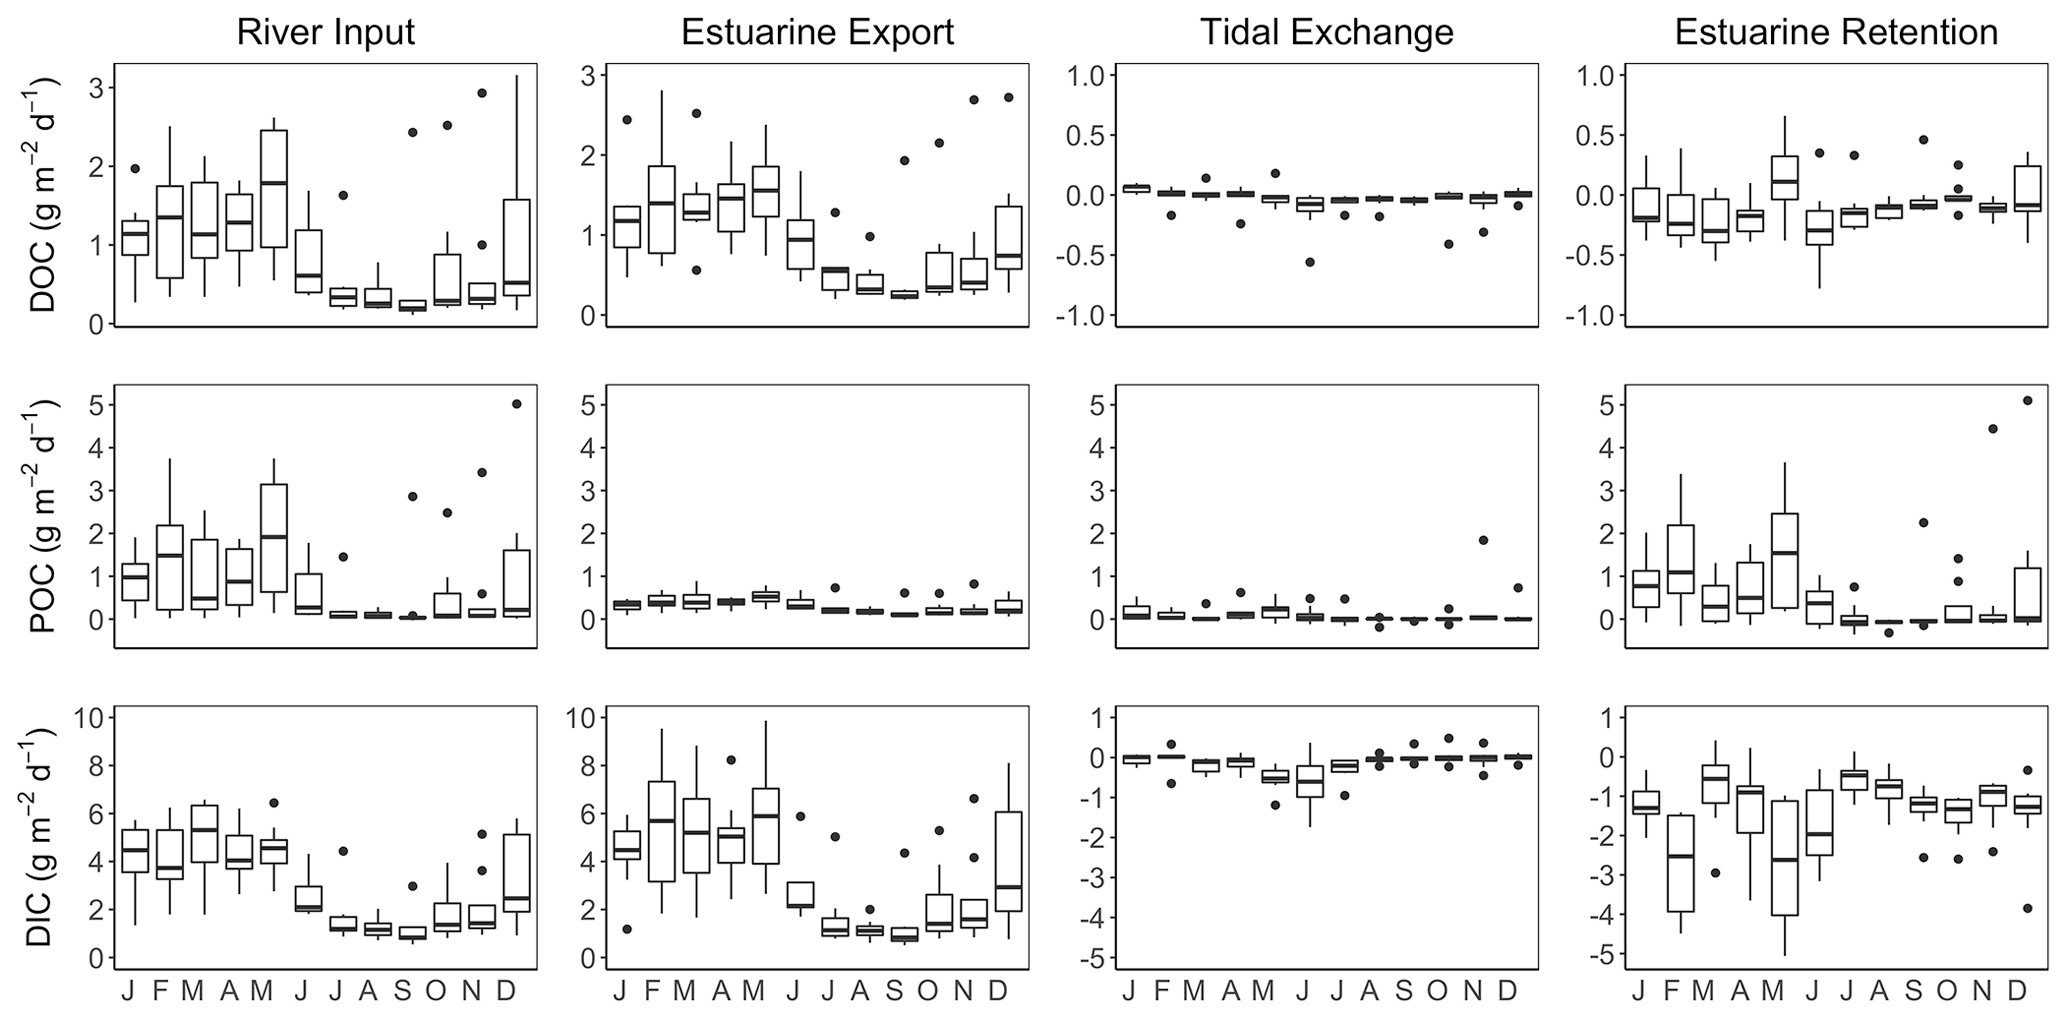
Figure 8Seasonal variation in DOC, POC and DIC fluxes associated with riverine inputs, estuarine export, tidal exchange and estuarine retention for the tidal-freshwater segment of the James Estuary (note differences in y-axis scaling). Negative values for estuarine retention denote a net loss. DIC retention estimates take into account atmospheric losses of CO2.
Annual average DOC loads to the Pamunkey (0.67 ± 0.11 g m−2 d−1) and Mattaponi (0.89 ± 0.12 g m−2 d−1) were similar to the James (0.91 ± 0.12 g m−2 d−1) on an areal basis. Seasonal variation in DOC inputs followed patterns in discharge with peak values in winter–spring and minimum values in summer–fall (Fig. 9). Export fluxes closely matched river inputs on a seasonal basis and balanced to within 10 % on an annual basis. Riverine POC inputs to the Pamunkey and Mattaponi were considerably lower relative to the James. For the James, POC inputs were nearly equal to DOC inputs, whereas for the Pamunkey and Mattaponi, DOC accounted for the bulk of OC inputs (79 % and 86 %, respectively). Export of POC from the Pamunkey and Mattaponi matched inputs to within 10 % on an annual basis.
3.5 Estuarine metabolism
Rates of GPP and ER were compared to standing stocks (areal values) of DIC and POC to assess the potential influence of C fixation and remineralization on estuarine C concentrations (Fig. 10). In the James, GPP and ER followed expected seasonal patterns with peak values (3.5–4.0 g C m−2 d−1) during June–September and low values (<1 g C m−2 d−1) in colder months. GPP and ER tracked closely throughout the year, with ER exceeding GPP in colder months and being equal to, or occasionally smaller (June–July) than, GPP in warmer months. C fluxes associated with GPP and ER were small in comparison to ambient concentrations of DIC, which ranged from 30 to 40 g m−2. By contrast, POC production via GPP was comparable to ambient concentrations of POC, which ranged from 3 g m−2 in colder months to 6 g m−2 in warmer months. Metabolism of the Pamunkey Estuary was lower and more heterotrophic in comparison to the James. ER varied seasonally from 0.5 to 1.8 g C m−2 d−1, whereas GPP was persistently low throughout the year (<0.5 g C m−2 d−1). Standing stocks of DIC were large by comparison, ranging from 10 to 40 g m−2. GPP was small in comparison to standing stocks of POC (3 to 5 g m−2).
4.1 Riverine C inputs and estuarine concentrations
An analysis of C dynamics in the upper portions of the James, Mattaponi and Pamunkey estuaries revealed differences in dominant forms of C and variable responses to changes in river discharge. The James was dominated by products of mineral weathering as DIC accounted for 73 % of total C with smaller contributions from DOC (20 %) and POC (7 %). By contrast, organic forms accounted for a larger fraction (49 %) of total C in the Pamunkey and Mattaponi. These differences are attributed to variable contributions from local (Coastal Plain) vs. upland (Mountain and Piedmont) runoff. The James Estuary receives inputs from a large catchment with the bulk of runoff (90 %) derived from above the Fall Line. By contrast, the Pamunkey and Mattaponi estuaries receive a greater proportion of their inputs from local tributaries situated within the Coastal Plain. Local floodplains and tidal marshes contribute DOC, while the predominantly sandy soils of the Coastal Plain have low capacity for retaining DOC and contribute little DIC. Differences in source waters may also account for contrasting response in river and estuarine C to high-discharge events. Larger increases in POC were observed during discharge events in the James, relative to the Pamunkey and Mattaponi. Prior studies documented higher sediment yields from the Mountain and Piedmont regions in comparison to the Coastal Plain (Gellis et al., 2009). In the James River, changes in C concentrations with increasing discharge were asynchronous, as DIC was negatively related to discharge, whereas POC showed a positive relationship. These findings suggest that DIC export from the watershed is limited by weathering rates (source limited), whereas POC export is transport limited (Wymore et al., 2021). For DIC, this resulted in a dilution response in both the river and estuary, whereas high discharge resulted in a flushing response (enrichment) of POC in the river and estuary. Dilution of estuarine DIC during high discharge was also reported in the nearby Delaware Estuary and linked to reductions in acid neutralizing capacity and greater sensitivity to acidification (Joesef et al., 2017). For DOC, a strong flushing response was observed in the Pamunkey and Mattaponi rivers but not the James. Higher DOC concentrations following storm events have been attributed to greater leaching from soils due to higher water elevation and soil inundation (Zarnetske et al., 2018; Patrick et al., 2020). The extensive wetlands and floodplains along the Mattaponi and Pamunkey likely serve as source areas for DOC. Prior work showed that differences in source waters played a role in determining underwater light conditions in these estuaries, as light attenuation in the James was strongly regulated by suspended particulate matter, whereas dissolved organic matter had a greater role in attenuating light in the Pamunkey and Mattaponi estuaries (Henderson and Bukaveckas, 2021). Overall, our findings showed strong concentration–discharge relationships in riverine waters, whereas estuarine responses were weaker and more variable. Inter-estuarine differences in C forms and response to discharge were linked to differences in the physiographic setting of the estuarine catchments.
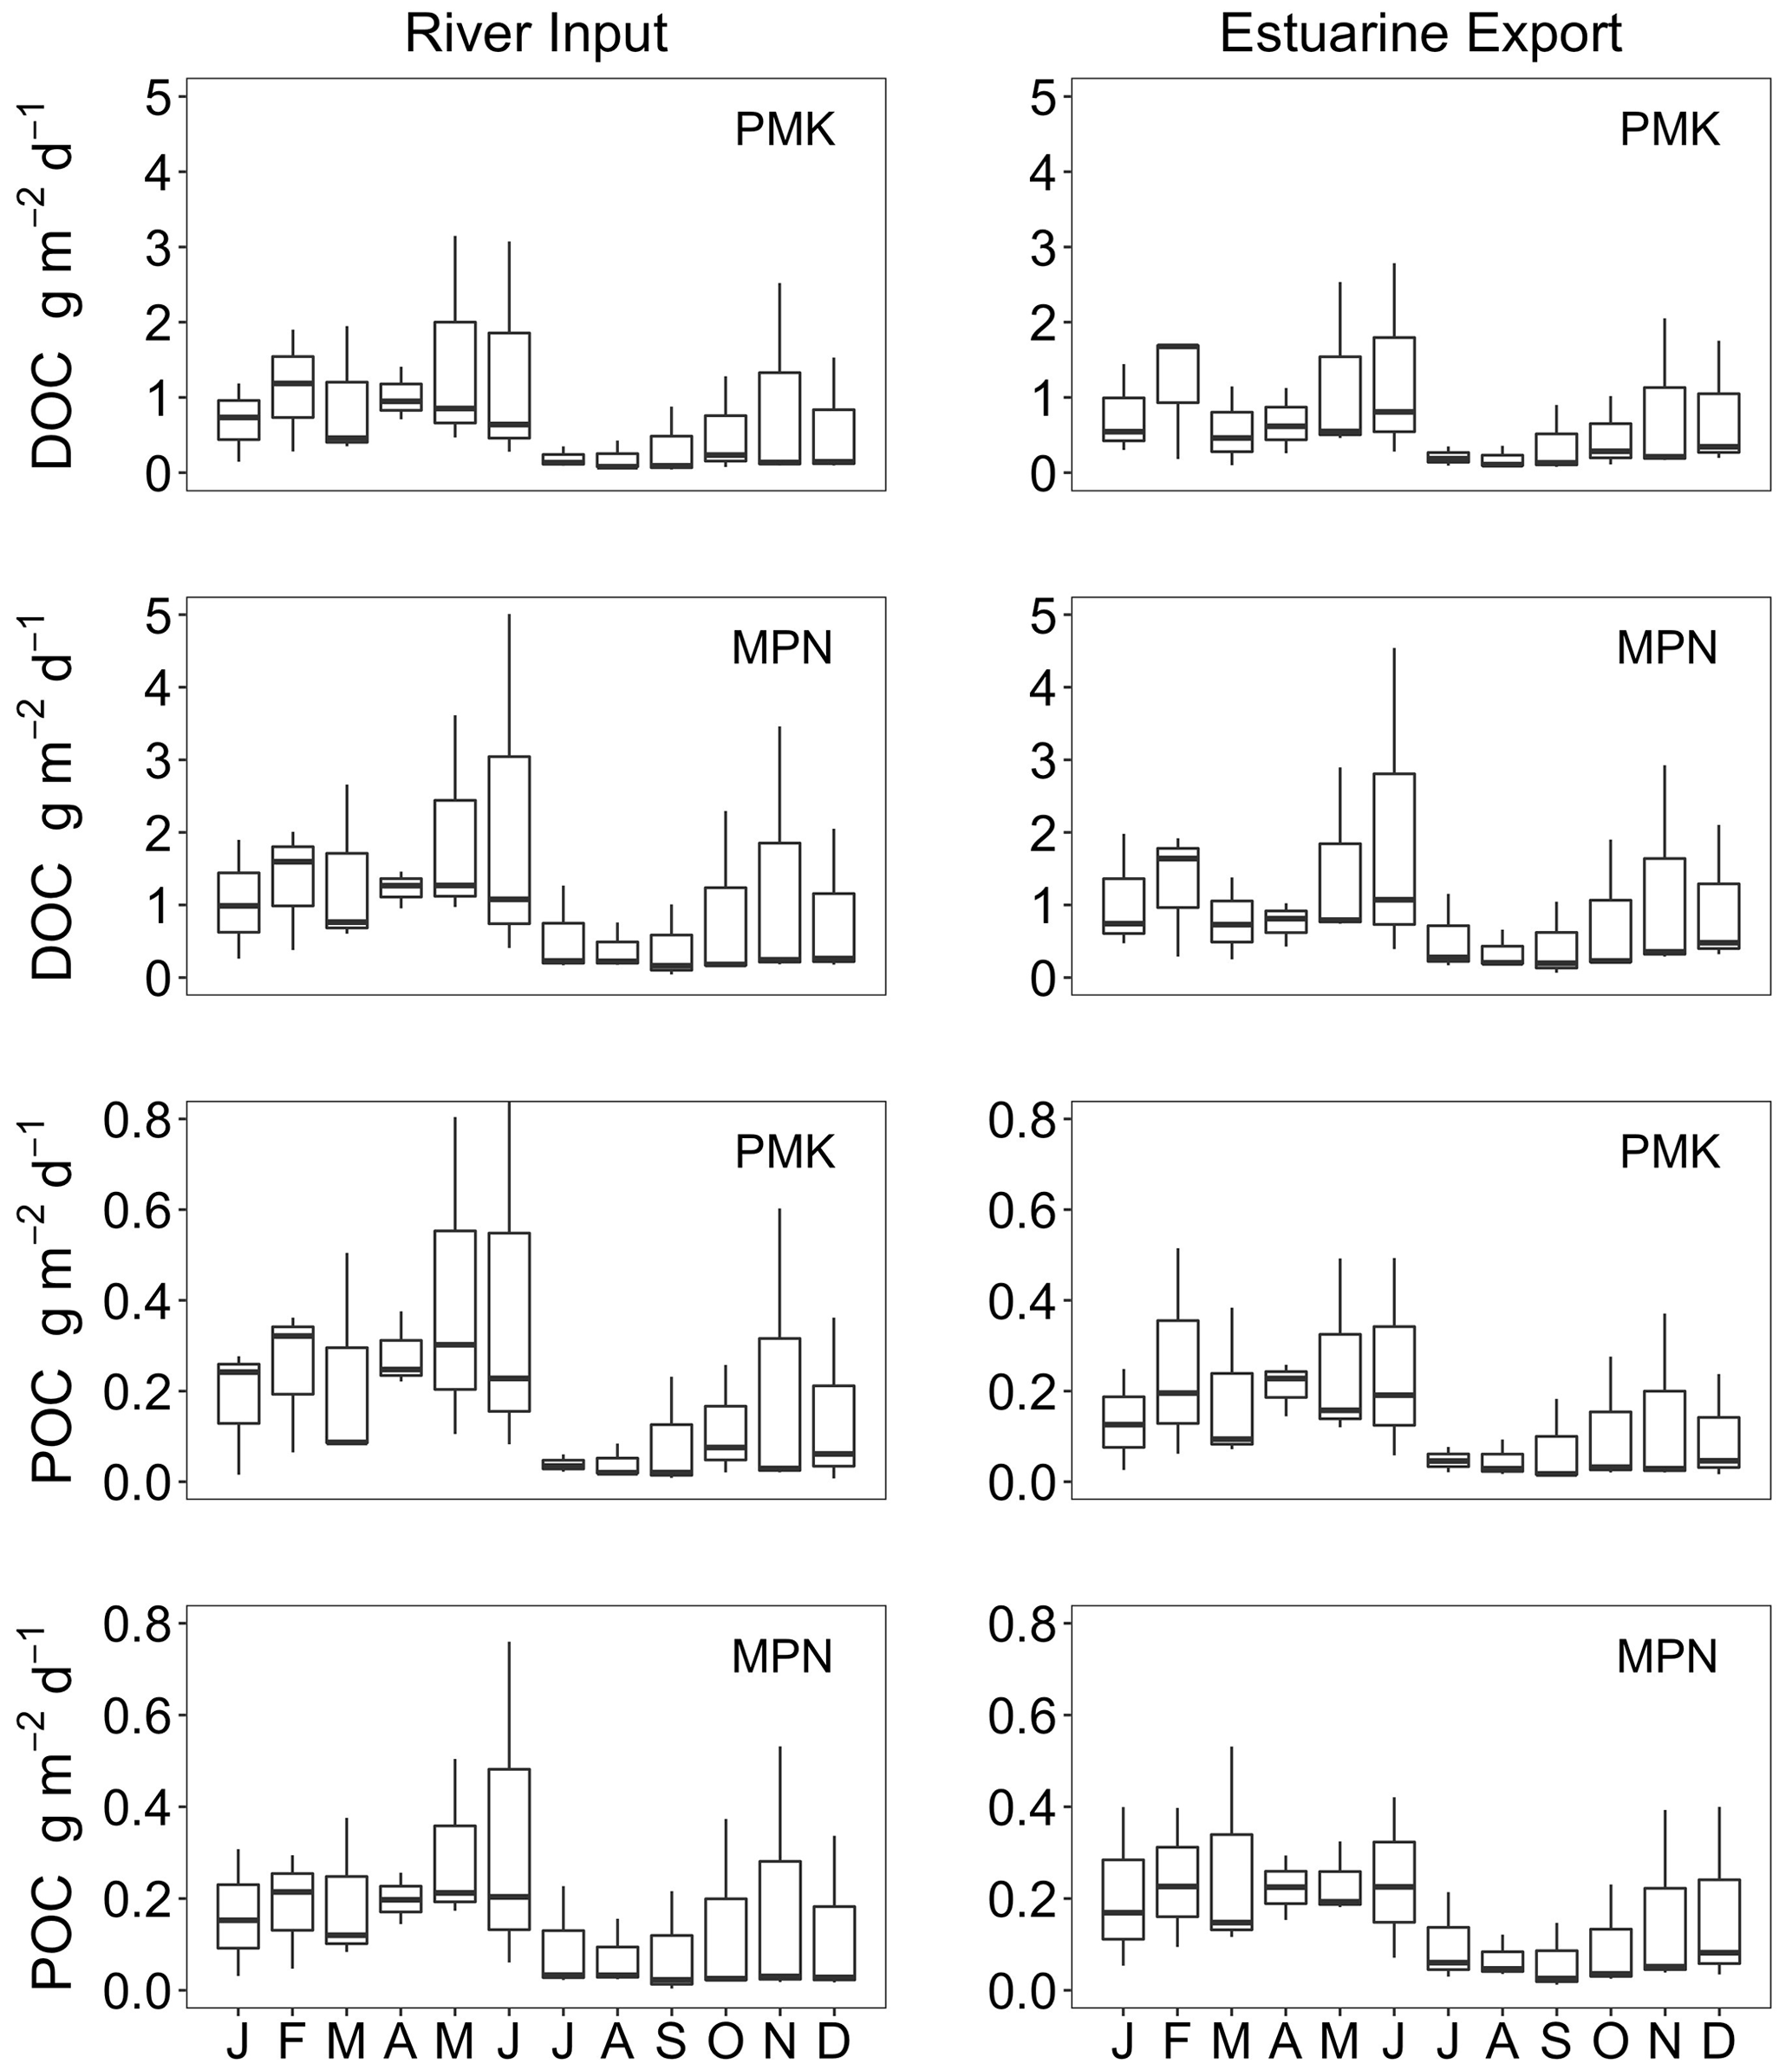
Figure 9River input and estuarine export fluxes of DOC and POC for the Pamunkey (PMK) and Mattaponi (MPN) estuaries.
4.2 C mass balance
The tidal-freshwater segment of the James Estuary was a net sink for POC and DOC and a net source for DIC. On an annual basis, external organic matter inputs were attenuated by 28 % (±3) within the tidal-fresh segment. The mass balance indicates that a high proportion (72 %) of POC inputs were retained in the tidal-fresh segment and that retention of POC accounted for the bulk (84 %) of organic matter retention. Amann et al. (2012) similarly documented high retention of POC in tidal freshwaters of the river Elbe. The transition from fluvial to tidal conditions favors the settling of suspended particulate matter, which contained ∼10 %–20 % organic matter (Bukaveckas et al., 2019). Peak retention occurred during periods of elevated discharge when inputs of particulate matter to the estuary were highest. Our findings do not support the view that inland waters function primary as transport systems (“pipes”) during periods of elevated discharge (Zarnetske et al., 2018), as the bulk of organic matter retention occurred during high flows in winter and was associated with the retention of particulates. High retention of particulate C is consistent with prior results showing that peak retention of N and P occurred during colder months with elevated river discharge (Bukaveckas and Isenberg, 2013). Retention of dissolved N and P was highest during low discharge in summer, but this accounted for a relatively small proportion of total N and P retention on an annual basis. For C, as for N and P, the mass of particulate matter delivered to the estuary during high discharge appears to be the most important determinant of the amount retained within the estuary. The counterintuitive finding that peak retention occurs during periods of high transport (when pipe conditions might prevail) is based on a consideration of the fate of both dissolved and particulate organic matter, as the former largely passes through, while the latter is highly retained. The retention of particulate matter reflects the underlying hydrodynamics of estuaries, as well as lakes, where the rapid dissipation of fluvial forces promotes high retention of particulate matter during periods of elevated discharge.
For the James, atmospheric losses were a small component of the C budget, equivalent to 18 % of riverine total C inputs and 15 % of total C export. Volta et al. (2016) similarly report that CO2 loss via evasion was ∼15 % of C export from North Sea estuaries. By contrast, CO2 evasion from the Pamunkey and Mattaponi was appreciably greater (by 3-fold) relative to the James. Our pCO2 concentrations for the Pamunkey were similar to those previously reported by Raymond et al. (2000), whereas our air–water flux values were higher (∼3 g C m−2 d−1 vs. ∼0.7 g C m−2 d−1). Comparisons of CO2 fluxes are complicated by uncertainty regarding atmospheric exchange (Raymond and Cole, 2001; Borges et al., 2004; Raymond et al., 2017; Ward et al., 2017). Raymond et al. (2000) used what they considered a conservative exchange coefficient (1.1 m d−1). More recent studies have adopted higher exchange coefficients, particularly for systems where tidal and fluvial forces likely play a greater role in determining boundary layer conditions than are predicted from wind-based models. Wind speeds are low in the upper segments of these estuaries because the prevailing winds (south-southwest) are nearly perpendicular to the long axis of the channel, which runs mostly east–west. Turbulence generated by strong tidal forces in shallow channels likely plays a greater role in influencing boundary conditions for gas exchange (Raymond and Cole, 2001; Borges et al., 2004). These conditions support the use of higher exchange coefficients than would be derived from wind speed alone.
Tidal fluxes were not a large component of the mass balance for any of the C fractions. Although the volume of water exchanged during a tidal cycle was large (tidal prism: 28 % of estuarine volume), the elongate shape of the estuary dictates that water leaving on an outgoing tide returns on the subsequent incoming tide. Results from the Cl mass balance suggest that the net tidal exchange was ∼7 % of the tidal prism, equivalent to 2 % of estuarine volume. In addition, weak C gradients across the lower boundary of the study reach indicate that tidal inputs and outputs are largely offset.

Figure 10Seasonal variation in ecosystem metabolism (GPP, ER) in comparison to DIC and POC concentrations in the James and Pamunkey estuaries.
4.3 Metabolism and carbon
Mass balance and metabolism data provide independent evidence that these estuaries are net heterotrophic. The mass balance indicates that on an annual basis the James Estuary is a sink for organic C and a source of inorganic C. This finding is consistent with the metabolism results showing that ecosystem respiration exceeds GPP. Greater heterotrophy was observed in the Pamunkey where respiration rates were comparable to the James, but GPP was substantially lower. This finding was consistent with the observed higher CO2 concentrations and efflux. The evasion of CO2 from the Pamunkey and Mattaponi was large (3×) in comparison to riverine inputs of DOC and POC, whereas CO2 loss from the James was ∼50 % of riverine organic matter (OM) inputs. Greater heterotrophy of the former is attributed to differences in hydrogeomorphology and forms of primary production. Higher chlorophyll a values in the James indicate greater phytoplankton contributions to GPP, which brings the tidal-fresh segment more closely in balance with respect to production and respiration. The Pamunkey and Mattaponi have low chlorophyll a by comparison (Bukaveckas et al., 2020) but extensive lateral floodplains and emergent marshes (Hupp et al., 2009; Noe and Hupp, 2009; Lake et al., 2013). Decomposition of terrestrial organic matter during floodplain inundation may account for the high CO2 concentrations and air–water fluxes during high-discharge conditions. Van Dam et al. (2018) similarly reported that high CO2 losses during flooding events accounted for 30 %–40 % of annual emissions from North Carolina estuaries. An accounting of changes in floodplain C stores before and after inundation events is needed to better understand their role in supporting respiration in these systems. Organic matter inputs following senescence of emergent vegetation may also contribute to higher rates of respiration and CO2 evasion. Emergent plant production would not be captured in the diel dissolved-O2-based estimates of ecosystem GPP, which may overestimate heterotrophy in this system. Overall, C mass balance and ecosystem metabolism data show that the upper segments of these estuaries are net heterotrophic. This finding is consistent with a meta-analysis of metabolism data showing that estuaries are generally net heterotrophic (Hoellein et al., 2013) but contrasts with recent work by Brodeur et al. (2019) showing that the Susquehanna River and mainstem Chesapeake Bay are a net sink for DIC and therefore net autotrophic. In the case of Chesapeake Bay, it may be that much of the terrestrial organic matter (or at least, the POC fraction) is captured in the tributaries, thereby favoring a prevalence of autochthony over allochthony and GPP in excess of R.
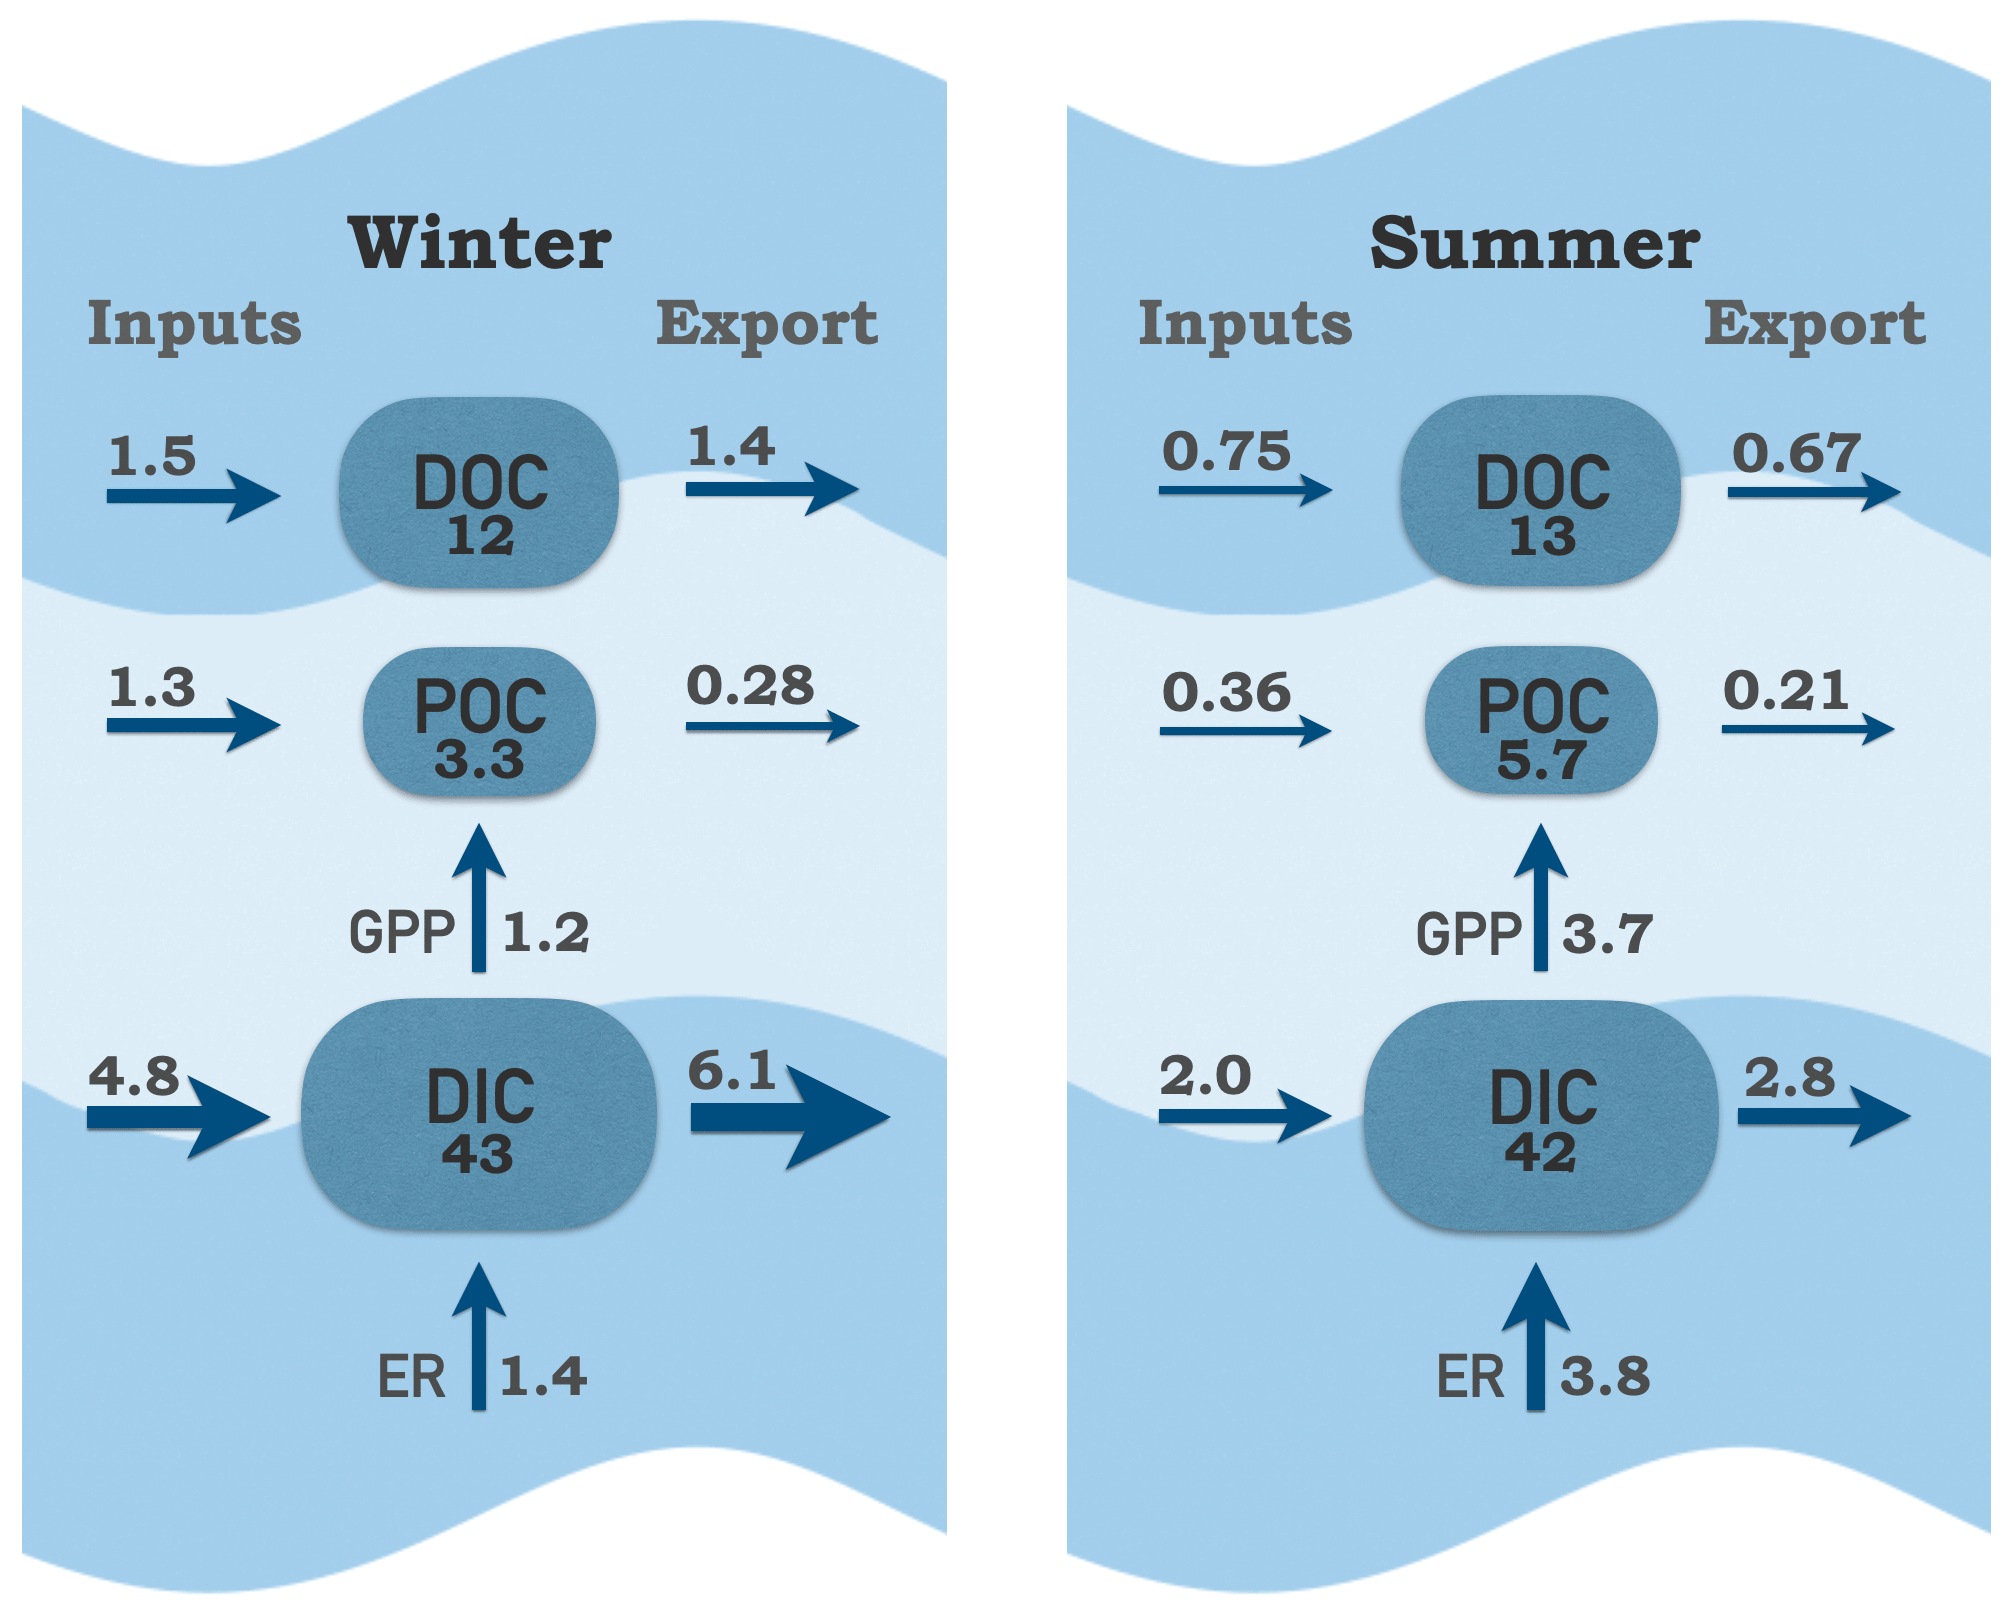
Figure 11Carbon pools and fluxes within the tidal-fresh segment of the James Estuary during winter (January–May) and summer (June–September). Inputs include riverine, local tributary and point source contributions; exports include tidal exchange and atmospheric losses of CO2. Carbon pools are boxes (g C m−2); fluxes are arrows (g C m−2 d−1).
Despite the large riverine influence in these upper-estuarine segments, internal cycling of C via production and respiration was large in comparison to external forcing via fluvial and tidal exchange (Fig. 11). In summer, remineralization of C via respiration was almost 2-fold greater in comparison to external DIC inputs. In winter, the balance tipped strongly in favor of external inputs as riverine DIC contributions were 3-fold greater than internal production via respiration. Internal production of POC via GPP was an order of magnitude higher than external inputs of POC in summer. In winter, GPP contributions were approximately equal to external inputs of POC. Based on GPP, the estimated turnover time of the POC pool was 1.5 d in summer. Taking into account that 60 % of POC in the James is algal (Wood et al., 2016), the estimated phytoplankton turnover time was 0.9 d. The high rates of internal biological processing relative to throughputs of C places the James toward the lake end, rather than the stream–river end, on the metabolism and residence time spectrum (Hotchkiss et al., 2018). This is likely a consequence of tidal conditions, which allow for longer water residence time compared to non-tidal rivers. Proximal nutrient inputs (from riverine and point sources) and poor water clarity (due to suspended sediments) likely also contribute to the dominance of phytoplankton over aquatic plants in this system. If recent increases in water clarity continue (Henderson and Bukaveckas, 2021), we would expect a shift toward macrophyte dominance, lower GPP:ER and a diminished influence of internal C cycling.
The tidal-fresh segment of the James has moderately low DIC and high GPP, which raises the question whether primary production is limited by the availability of inorganic C. Our data show that daily autotrophic C demand is small (∼10 %) relative to the available DIC pool. In summer, DIC requirements to sustain GPP exceed the rate of external supply via river inputs, but remineralization of C via respiration is approximately equal to GPP, indicating that internal cycling is sufficiently large to preclude C limitation. However, a case could be made for potential C limitation of photosynthesis due to depletion of pCO2. The diffusion of CO2 in water occurs more slowly than in air, potentially resulting in depletion during periods of high autotrophic demand. In the James, low CO2, with occasional undersaturation, was observed in summer at stations corresponding to the chl a maximum. Other studies in riverine settings have shown that phytoplankton can reduce CO2 to near or below atmospheric equilibrium (Raymond et al., 1997; Crawford et al., 2017). As CO2 is energetically favored for carbon fixation, depletion of CO2 may reduce production efficiency and alter community structure by favoring taxa capable of using bicarbonates. A number of prior studies have linked primary production and pCO2 (Jansson et al., 2012; Low-Decarie et al., 2015; Hasler et al., 2016). Our CO2 data were collected mid-morning, closer to the diel maximum than the afternoon minimum (Crosswell et al., 2017; Reiman and Xu, 2019), thereby potentially underestimating CO2 depletion. The possibility that phytoplankton-driven CO2 depletion in the James may affect production and community composition cannot be discounted, though this effect appears limited to mid-summer and stations located at the chl a maximum.
4.4 C sources and consumer energetics
Lastly, I consider the utility of our C mass balance for understanding trophic energetics of the James food web, particularly with respect to autochthony and allochthony. Combining mass balance, ecosystem metabolism and bioenergetics is a potentially powerful approach to advancing our understanding of C cycles, but there are few examples, often, as in this case, due to a lack of data on consumer production (Ruegg et al., 2021). From a mass flux perspective, a comparison of autochthonous (GPP: 719 ± 32 g C m−2 yr−1) and allochthonous (POC: 298 ± 56, DOC: 340 ± 44 g C m−2 yr−1) inputs suggests that internal C sources are nearly equal (54 ± 4 %) to external inputs, despite the large riverine influence in the upper estuary. These estimates can be refined to better reflect availability for consumers by discounting GPP by 40 % to reflect loss via autotrophic respiration (Ruegg et al., 2021) and taking into account the fraction of POC and DOC that is retained (28 ± 3 %). By this estimate, autochthonous production contributes 70 % (431 g C m−2 yr−1), and allochthonous inputs 30 % (203 g C m−2 yr−1) of C available to consumers. These percentages are based on annualized values though their relative importance varies seasonally with the majority of GPP occurring in May to October and the bulk of POC delivered in January to May.
Comparisons of mass fluxes may not be indicative of C supporting secondary production if consumers preferentially utilize one source over another. A number of studies have suggested that autochthonous sources account for a disproportionately large fraction of C assimilation due to the higher nutritional quality of algae over partially decomposed terrestrial plant matter (Brett et al., 2009; Thorp and Bowes, 2017). Stable isotope analysis of the James food web has shown that the dominant metazoans by biomass, which are benthic omnivores (catfish, adult gizzard shad), carry a predominantly terrestrial C signature, whereas zooplankton and planktivorous fish (juvenile gizzard shad, threadfin shad) were dependent on autochthonous C sources (Wood et al., 2016). These patterns were consistent with analysis of basal resources showing that the sediments in the estuary were largely (90 %) comprised of terrestrial C, whereas seston contained a greater fraction of autochthonous C (60 % in summer).
The lack of secondary production data does not allow us to align C supply from autochthonous and allochthonous sources with C demands of consumers. However, the rate of biomass removal for one of the dominant metazoans (catfish) can be used as a first approximation of their annual production. Catfish were introduced to the James during the 1970s and 1980s and now dominate the fishery (Fabrizio et al., 2018), which has led to questions about their influence on food webs and ecosystem processes (Greenlee and Lim, 2011; Hilling et al., 2019; Schmitt et al., 2019). The biomass of catfish removed from the James represents a conservative estimate of their annual production in that current harvest rates have not brought about declines in the catfish population, indicating that annual production exceeds the amount of biomass removed (Orth et al., 2017). During 2010–2020, the commercial harvest of catfish in the tidal James averaged 1 000 000 lb yr−1 (approximately 450 000 kg yr−1; data provided by the Virginia Marine Resources Commission), which, taking into account the area of the fresh–brackish estuary, yields a harvest rate of 8.6 kg ha−1 yr−1. In addition to the commercial harvest, piscivorous birds are an important component of biomass removal. Here we focus on predation by bald eagles and osprey, as there are census data during the breeding season (from areal surveys) and estimates of catfish contributions to adult and nestling diets (from direct observations and stable isotopes; Garman et al., 2010). Based on census data and bioenergetics modeling, fish consumption by bald eagles and osprey was estimated at 0.6 kg ha−1 d−1 for the James tidal-fresh segment. Taking into account the contribution of catfish to the diet of bald eagles and osprey (∼35 %) yields an estimate of catfish biomass removal of 77 kg ha−1 yr−1, which is ∼9-fold higher than for commercial fisheries. With further corrections for the moisture content (75 %; Cresson et al., 2017) and C content of fish tissues (45 %; Tanner et al., 2000), the total catfish removal by birds and commercial fishing is 0.96 g C m−2 yr−1. Their trophic position in the James (trophic level: 3.1; Orth et al., 2017) suggests a production efficiency of ∼1 % (Ruegg et al., 2021), which yields an estimated C demand to maintain this level of production/harvest of 96 g C m−2 yr−1. The C demand for this introduced species corresponds to 15 % of C available to consumers from allochthonous and autochthonous sources. Stable isotope data indicate that catfish in the James tidal-fresh zone obtain 9 % of their C from autochthonous sources and 81 % from allochthonous sources (Wood et al., 2016). Applying these values suggests that 2 % of GPP and 41 % of allochthonous inputs are required to sustain current levels of catfish biomass removal from the James tidal-fresh zone. The high rate of utilization for allochthonous inputs is consistent with our prior finding that consumer-mediated recycling is an important component of nutrient supply and may account for the lack of response in primary production to large reductions in point source nutrient inputs (Wood et al., 2014).
This paper provides an accounting of C fluxes at the river–estuarine transition for three tributaries of Chesapeake Bay over a span of years and discharge conditions. The findings show that the relative importance of external (river inputs and tidal exchange) vs. internal (metabolism) drivers differed among the three estuaries based on their physiographic setting and forms of primary production. Estuarine C forms were influenced by variable contributions from upland (DIC-rich, POC-rich) and lowland (DOC-rich) sources. Peak organic matter retention was associated with trapping of POC during high-discharge conditions. Tidal exchange was not an important component of the C budget, whereas biological transformations via production and respiration were large in the phytoplankton-dominated James Estuary. Contrary to expectations, autochthonous sources accounted for the bulk of organic matter inputs despite the large riverine influence on the upper estuary. Commercial harvest data and previously derived estimates of piscivory by birds provided a basis for estimating consumer C demand, albeit for a single dominant species and at a coarse (annualized) scale. Further progress in aligning C flows to food web energetics depends on the availability of production data for a greater range of consumers and at shorter time intervals. Bringing together C mass balance, ecosystem metabolism and consumer production data would enable a potentially powerful approach for advancing our understanding of how the timing and sources of C inputs constrain trophic energetics.
Data can be accessed upon request to the corresponding author.
The author has declared that there are no competing interests.
Publisher’s note: Copernicus Publications remains neutral with regard to jurisdictional claims in published maps and institutional affiliations.
Thanks go to Samantha Rogers who drafted figures for this paper; to David Hopler, Spencer Tassone and William Mac Lee who carried out the field and lab work and to Donald Orth for helpful discussions regarding catfish in the James. I am grateful to the USGS for providing discharge, DOC and POC data for Fall Line stations and to the Virginia Institute of Marine Science for making available dissolved oxygen data from the Pamunkey. This paper is dedicated to Jon Cole for his contributions to our understanding of C cycling in inland waters and in appreciation of his ability to turn numbers into interesting stories.
This paper was edited by Aninda Mazumdar and reviewed by Sayak Basu and two anonymous referees.
Alin, S. R., de Fatima, F. L., Rasera, M., Salimon, C. I., Richey, J. E., Holtgrieve, G. W., Krusche, A. V., and Snidvongs, A.: Physical controls on carbon dioxide transfer velocity and flux in low-gradient river systems and implications for regional carbon budgets, J. Geophys. Res.-Biogeo., 116, G01009, https://doi.org/10.1029/2010JG001398, 2011.
Amann, T., Weiss, A., and Hartmann, J.: Carbon dynamics in the freshwater part of the Elebe estuary, Germany: Implications of improving water quality, Eastuar. Coast. Shelf S., 107, 112–121, 2012.
Amann, T., Weiss, A., and Hartmann, J.: Inorganic carbon fluxes in the inner Elbe Estuary, Germany, Estuar. Coast., 38, 192–210, 2015.
Bianchi, T. S.: The role of terrestrially derived organic carbon in the coastal ocean: a changing paradigm and the priming effect, P. Natl. Acad. Sci. USA, 108, 19473–19481, 2011.
Borges, A. V., Delille, B., Schiettecatte, L.-S., Gazeau, F., Abril, G., and Frankignoulle, M.: Gas transfer velocities of CO2 in three European estuaries (Randers Fjord, Scheldt, and Thames), Limnol. Oceanogr., 49, 1630–1641, 2004.
Brett, M. T., Kainz, M., Taipale, S., and Seshan, H.: Phytoplankton, not allochthonous carbon, sustains herbivorous zooplankton production, P. Natl. Acad. Sci. USA, 106, 21197–21201, 2009.
Brodeur, J. R., Chen, B., Su, J., Xu, Y.-Y., Hussain, N., Scaboo, K. M., Zhang, Y., Testa, J. M., and Cai, W.-J.: Chesapeake Bay inorganic carbon: distribution and seasonal variability, Front. Mar. Sci., 6, 99, https://doi.org/10.3389/fmars.2019.00099, 2019.
Bukaveckas, P. A. and Isenberg, W. N.: Loading, transformation and retention of nitrogen and phosphorus in the tidal freshwater James River (Virginia), Estuar. Coast., 36, 1219–1236, 2013.
Bukaveckas, P. A. and Wood, J. D.: Nitrogen retention in a restored tidal stream (Kimages Creek, VA) assessed by mass balance and tracer approaches, J. Environ. Qual., 43, 1614–1623, 2014.
Bukaveckas, P. A., Barry, L. E., Beckwith, M. J., David, V., and Lederer, B.: Factors determining the location of the chlorophyll maximum and the fate of algal production within the tidal freshwater James River, Estuar. Coast., 34, 569–582, 2011.
Bukaveckas, P. A., Beck, M., Devore, D., and Lee, W. M.: Climate variability and its role in regulating C, N and P retention in the James River Estuary, Eastuar. Coast. Shelf S., 205, 161–173, 2018.
Bukaveckas, P. A., Katarzyte, M., Schlegel, A., Spuriene, R., Egerton, T. A., and Vaiciute, D.: Composition and settling properties of suspended particulate matter in estuaries of the Chesapeake Bay and Baltic Sea regions, J. Soils Sediment., 19, 2580–2593, 2019.
Bukaveckas, P. A., Tassone, S., Lee, W. M., and Franklin, R. B.: The influence of storm events on metabolism and water quality of riverine and estuarine segments of the James, Mattaponi and Pamunkey Rivers, Estuar. Coast., 43, 1585–1602, 2020.
Butman, D., Stackpoole, S., Stets, E. G., McDonald, C. P., Clow, D. W., and Striegl, R. G.: Aquatic carbon cycling in the conterminous United States and implications for terrestrial carbon accounting, P. Natl. Acad. Sci. USA, 113, 58–63, 2016.
Caffrey, J. M.: Production, respiration and net ecosystem metabolism in U.S. estuaries, Environ. Monitor. Assess., 81, 207–219, 2003.
Caffrey, J. M.: Factors controlling net ecosystem metabolism in U.S. estuaries, Estuaries, 27, 90–101, 2004.
Cai, W.-J. and Wang, Y.: The chemistry, fluxes and sources of carbon dioxide in the estuarine waters of the Satilla and Altamaha Rivers, Georgia, Limnol. Oceanogr., 43, 657–668, 1998.
Cole, J. J., Prairie, Y. T., Caraco, N. F., McDowell, W. H., Tranvik, L. J., Striegl, R. G., Duarte, C. M., Kortelainen, P., Downing, J. A., Middelburg, J. J., and Melack, J. M.: Plumbing the global carbon cycle: integrating inland waters into the terrestrial carbon budget, Ecosystems, 10, 171–184, 2007.
Crawford, J. T., Butman, D., Loken, L.C., Stadler, P., Kuhn, C., and Striegl, R. G.: Spatial variability of CO2 concentrations and biogeochemistry in the Lower Columbia River, Inland Waters, 7, 417–427, 2017.
Creed, I. F., McKnight, D. M., Pellerin, B. A., Green, M. B., Bergamaschi, B. A., Aiken, G. R., Burns, D. A., Findlay, S. E. G., Shanley, J. B., Striegl, R. G., Aulenbach, B. T., Clow, D. W., Laudon, H., McGlynn, B. L., McGuire, K. J., Smith, R. A., and Stackpoole, S. M.: The river as a chemostat: fresh perspectives on dissolved organic matter flowing down the river continuum, Can. J. Fish. Aquat. Sci., 72, 1272–1285, 2015.
Cresson, P., Travers-Trolet, M., Rouquette, M., Timmerman, C.-A., Giraldo, C., Lefebvre, S., and Ernande, B.: Underestimation of chemical contamination in marine fish muscle tissue can be reduced by considering variable wet:dry weight ratios, Mar. Pollut. Bull., 123, 279–285, 2017.
Crosswell, J. R., Anderson, I. C., Stanhope, J. W., Van Dam, B., Brush, M. J., Ensign, S. H., Piehler, M. F., McKee, B., Bost, M., and Paerl, H. W.: Carbon budget of a shallow lagoonal estuary: transformations and source-sink dynamics along the river-estuary-ocean continuum, Limnol. Oceangr., 62, 29–45, 2017.
del Giorgio, P. A. and Pace, M. L.: Relative independence of organic carbon transport and processing in a large temperate river: The Hudson River as both pipe and reactor, Limnol. Oceangr., 53, 185–197, 2008.
Fabrizio, M. C., Tuckey, T. D., Latour, R. J., White, G. C., and Norris, A. J.: Tidal habitats support large numbers of invasive blue catfish in a Chesapeake Bay sub-estuary, Estuar. Coast., 41, 827–840, 2018.
Garman, G., Viverette, C., Watts, B., and Macko, S.: Predator-prey Interactions among Fish-eating Birds and selected Fishery Resources in the Chesapeake Bay: Temporal and Spatial Trends and Implications for Fishery Assessment and Management, William and Mary Center for Conservation Biology Technical Report #349, https://scholarworks.wm.edu/ccb_reports/349 (last access: 20 July 2021), 2010.
Gellis, A. C. Hupp, C. R., Pavich, M. J., Landwehr, J. M., Banks, W. S. L., Hubbard, B. E., Langland, M. J., Ritchie, J. C., and Reuter, J. M.: Sources, transport, and storage of sediment in the Chesapeake Bay Watershed, U.S. Geological Survey Scientific Investigations Report, 2008–5186, 2009.
Greenlee, R. S. and Lim, C. N.: Searching for equilibrium: population parameters and variable recruitment in introduced blue catfish populations in four Virginia tidal river systems, Am. Fish. Soc. Symp., 77, 349–367, 2011.
Hanson, P. C., Pace, M. L., Carpenter, S. R., Cole, J. J., and Stanley, E. H.: Integrating landscape carbon cycling: research needs for resolving organic carbon budgets of lakes, Ecosystems, 18, 363–375, 2015.
Hasler, C. T., Butman, D., Jeffrey, J. D., and Suski, C. D.: Freshwater biota and rising pCO2?, Ecol. Lett., 19, 98–108, 2016.
Henderson, R. and Bukaveckas, P. A.: Factors governing light attenuation in upper segments of the James and York Estuaries and their influence on primary producers, Estuar. Coast., 45, 470–484, https://doi.org/10.1007/s12237-021-00983-6, 2021.
Hilling, C. D., Bunch, A. J., Emmel, J. A., Schmitt, J. D., and Orth, D. J.: Growth and mortality of invasive flathead catfish in the tidal James River, Virginia, J. Fish Wildlife Manage., 10, 641–652, 2019.
Hoellein, T. J., Bruesewitz, D. A., and Richardson, D. C.: Revisiting Odum (1956): a synthesis of aquatic ecosystem metabolism, Limnol. Oceangr., 58, 2089–2100, 2013.
Hoffman, J. C., Bronk, D. A., and Olney, J. E.: Organic matter sources supporting lower food web production in the tidal freshwater portion of the York River estuary, Estuar. Coast., 31, 898–911, 2008.
Hotchkiss, E. R., Sadro, S., and Hanson, P. C.: Toward a more integrative perspective on carbon metabolism across lentic and lotic inland waters, Limnol. Oceangr. Lett., 3, 57–63, 2018.
Hoitink, A. J. F. and Jay, D. A.: Tidal river dynamics: implications for deltas, Rev. Geophys., 54, 240–272, 2016.
Holgerson, M. A. and Raymond, P. A.: Large contribution to inland water CO2 and CH4 emissions from very small ponds, Nat. Geosci., 9, 222–226, https://doi.org/10.1038/ngeo2654, 2016.
Hosen, J. D., Aho, K. S., Fair, J. H., Kyzivat, E. D., Matt, S., Morrison, J., Stubbins, A., Weber, L. C., Yoon, B., and Raymond, P. A.: Source switching maintains dissolved organic matter chemostasis across discharge levels in a large temperate river network, Ecosystems, 24, 227–247, 2021.
Hupp, C. R., Pierce, A. R., and Noe, G. B.: Floodplain geomorphic processes and environmental impacts of human alteration along Coastal Plain rivers, USA, Wetlands, 29, 413–429, 2009.
Jansson, M., Karlsson, J., and Jonsson, A.: Carbon dioxide super-saturation promotes primary production in lakes, Ecol. Lett., 15, 527–532, 2012.
Joesoef, A., Kirchman, D. L., Sommerfield, C. K., and Cai, W.-J.: Seasonal variability of the inorganic carbon system in a large coastal plain estuary, Biogeosciences, 14, 4949–4963, https://doi.org/10.5194/bg-14-4949-2017, 2017.
Jones, A. E., Hodges, B. R., McClelland, J. W., Hardison, A. K., and Moffett, K. B.: Residence-time-based classification of surface water systems, Water Resour. Res., 53, 5567–5584, 2017.
Jones, A. E., Hardison, A. K., Hodges, B. R., McClelland, J. W., and Moffett, K. B.: Defining a riverine tidal freshwater zone and its spatiotemporal dynamics, Water Resour. Res., 56, e2019WRR026619, https://doi.org/10.1029/2019WR026619, 2020.
Lake, S. J., Brush, M. J., Anderson, I. C., and Kator, H. I.: Internal versus external drivers of periodic hypoxia in a coastal plain tributary estuary: the York River, Virginia, Mar. Ecol. Prog. Ser., 492, 21–39, 2013.
Lionard, M., Muylaert, K., Hanoutti, A., Maris, T., Tackx, M., and Vyverman W. Inter-annual variability in phytoplankton summer blooms in the freshwater tidal reaches of the Schelde estuary (Belgium), Eastuar. Coast. Shelf S., 79, 694–700, 2008.
Low-Decarie, E., Bell, G., and Fussman, G. F.: CO2 alters community composition and response to nutrient enrichment of freshwater phytoplankton, Oecologia, 177, 875–883, 2015.
Meybeck, M.: Global analyses of river systems: from Earth system controls to Anthropocene syndromes, Philos. T. Roy. Soc. B, 358, 1935–1955, 2003.
Middelburg, J. J. and Herman, P. M. J.: Organic matter processing in tidal estuaries, Mar. Chem., 106, 127–147, 2007.
Moran, M. A., Sheldon, W. M., and Sheldon, J. E.: Biodegradation of riverine dissolved organic carbon in five estuaries of the southeastern United States, Estuaries, 22, 55–64, 1999.
Morton, R. and Henderson, B. L.: Estimation of non-linear trends in water quality: an improved approach using generalized additive models, Water Resour. Res., 44, W07420, https://doi.org/10.1029/2007WR006191, 2008.
Murphy, R. R., Perry, E., Harcum, J., and Keisman, J.: A Generalized Additive Model approach to evaluating water quality: Chesapeake Bay case study, Environ. Modell. Softw., 118, 1–13, 2019.
Muylaert, K., Tackx, M., and Vyverman, W.: Phytoplankton growth rates in the tidal freshwater reaches of the Schelde estuary (Belgium) estimated using a simple light-limited primary production model, Hydrobiologia, 540, 127–140, 2005.
Noe, G. B. and Hupp, C. R.: Retention of riverine sediment and nutrient loads by Coastal Plain floodplains, Ecosystems, 12, 728–746, 2009.
Orth, D. J., Jiao, Y., Schmidt, J. D., Hilling, C. D., Emmel, J. A., and Fabrizio, M. C.: Dynamics and Role of Non-native Blue Catfish Ictalurus furcatus in Virginia's Tidal Waters, Final Report submitted to Virginia Department of Game and Inland Fisheries, https://doi.org/10.13140/RG.2.2.35917.54246, 2017.
Patrick, C. J., Yeager, L., Armitage, A. R., Carvallo, F., Congdon, V. M., Dunton, K. H., Fisher, M., Hardison, A. K., Hogan, J. D., Hosen, J., Hu, X., Reese, B. K., Kinard, S., Kominoski, J. S., Lin, X., Liu, Z., Montagna, P. A., Pennings, S. C., Walker, L., Weaver, C. A., and Wetz, M.: A system level analysis of coastal ecosystem responses to hurricane impacts, Estuar. Coast., 43, 943–959, 2020.
Qin, Q. and Shen, J.: The contribution of local and transport processes to phytoplankton biomass variability over different time scales in the Upper James River, Virginia, Eastuar. Coast. Shelf S., 196, 123–133, 2017.
Raymond, P. A., Bauer, J. E., and Cole, J. J.: Atmospheric CO2 evasion, dissolved inorganic carbon production, and net heterotrophy in the York River estuary, Limnol. Oceangr., 45, 1707–1717, 2000.
Raymond, P. A., Caraco, N. F., and Cole, J. J.: Carbon dioxide concentration and atmospheric flux in the Hudson River, Estuaries, 20, 381–390, 1997.
Raymond, P. A. and Cole, J. J.: Gas exchange in rivers and estuaries: Choosing a gas transfer velocity, Estuaries, 24, 312–317, 2001.
Raymond, P. A., Hartmann, J., Lauerwald, R., Sobek, S., McDonald, C. P., Hoover, M., Butman, D., Striegl, R. G., Mayorga, E., Humborg, C., Kortelainen, P., Durr, H., Meybeck, M., Ciais, P., and Guth, P.: Global carbon dioxide emissions from inland waters, Nature, 503, 355–359, 2017.
Raymond, P. A. and Bauer, J. E.: Bacterial consumption of DOC during transport through a temperate estuary, Aquat. Microb. Ecol., 22, 1–12, 2000.
Raymond, P. A. and Hopkinson, C. S.: Ecosystem modulation of dissolved carbon age in a temperate marsh-dominated estuary, Ecosystems, 6, 694–705, 2003.
Reiman, J. H. and Xu, Y. J.: Diel variability of pCO2 and CO2 outgassing from the lower Mississippi River: implications for riverine CO2 outgassing estimation, Water, 11, 43, https://doi.org/10.3390/w11010043, 2019.
Richey, J. E., Melack, J. M., Aufdenkampe, A., Ballester, V. M., and Hess, L. L.: Outgassing from Amazonian rivers and wetlands as a large tropical source of atmospheric CO2, Nature, 416, 617–620, 2002.
Ruegg, J., Conn, C. C., Anderson, E. P., Battin, T. J., Bernhardt, E. S., Canadell, M. B., Bonjour, S. M., Hosen, J. D., Marzolf, N. S., and Yackulic, C. B.: Thinking like a consumer: linking aquatic basal metabolism and consumer dynamics, Limnol. Oceangr. Lett., 6, 1–17, 2021.
Schmitt, J. D., Peoples, B. K., Castello, L., and Orth, D. J.: Feeding ecology of generalist consumers: a case study of invasive blue catfish Ictalurus furcatus in Chesapeake Bay, Virginia, USA, Environ. Biol. Fish., 102, 443–465, 2019.
Smock, L. A., Wright, A. B., and Benke, A. C.: Atlantic coast rivers of the southeastern United States, edited by: Benke, A. C. and Cushing, C., Cushing Rivers of North America, Elsevier Academic Press, 73–122, 2005.
Stedmon, C. A., Markager, S., Sondergaard, M., Vang, T., Laubel, A., Borch N. H., and Windelin, A.: Dissolved organic matter (DOM) export to a temperate estuary: Seasonal variations and implications of land use, Estuar. Coast., 29, 388–400, 2006.
Steen, A. D., Quigley L. M., and Buchan, A.: Evidence for the priming effect in a planktonic estuarine microbial community, Front. Mar. Sci., 3, https://doi.org/10.3389/fmars.2016.00006, 2015.
Tassone, S. and Bukaveckas, P. A.: Seasonal, interannual and longitudinal patterns in estuarine metabolism derived from diel oxygen data using multiple computational approaches, Estuar. Coast., 42, 1032–1051, 2019.
Thorp, J. H. and Bowes, R. E.: Carbon sources in riverine food webs: new evidence from amino acid isotope techniques, Ecosystems, 20, 1029–1041, 2017.
Tranvik, L. J., Downing, J. A., Cotner, J. B., Loiselle, S. A., Striegl, R. G., Ballatore, T. J., Dillon, P., Finlay, K., Fortino, K., Knoll, L. B., Kortelainen, P. L., Kutser, T., Larsen, S., Laurion, I., Leech, D. M., McCallister, S. L., McKnight, D. M., Melack, J. M., Overholt, E., Porter, J. A., Prairie, Y., Renwick, W. H., Roland, F., Sherman, B. S., Schindler, D. W., Sobek, S., Tremblay, A., Vanni, M. J., Verschoor, A. M., von Wachenfeldt, E., and Weyhenmeyer, G. A.: Lakes and reservoirs as regulators of carbon cycling and climate, Limnol. Oceangr., 54, 2298–2314, 2009.
Tranvik, L. J., Cole, J. J., and Prairie, Y. T.: The study of carbon in inland waters – from isolated ecosystems to players in the global carbon cycle, Limnol. Oceangr. Lett., 3, 41–48, 2018.
Tzortziou, M., Neale, P. J., Osburn, C. L., Megonigal, J. P., Maie, N., and Jaffe, R.: Tidal marshes as a source of optically and chemically distinctive colored dissolved organic matter in the Chesapeake Bay, Limnol. Oceangr., 53, 148–159, 2008.
Van Dam, B. R., Crosswell, J. R., and Paerl, H. W.: Flood-driven CO2 emissions from adjacent North Carolina estuaries during Hurricane Joaquin (2015), Mar. Chem., 207, 1–12, 2018.
Vincent, W. F., Dodson, J. J., Bertrand, N., and Frenette, J.-J.: Photosynthetic and bacterial production gradients in a larval fish nursery: The St. Lawrence River transition zone, Mar. Ecol. Prog. Ser., 139, 227–238, 1996.
Volta, C., Laruelle, G. G., and Regnier, P.: Regional carbon and CO2 budgets of North Sea tidal estuaries, Eastuar. Coast. Shelf S., 176, 76–90, 2016.
Vorosmarty, C. J., Meybeck, M., Fekete, B. M., Sharma, K. P., Green, P., and Syvitski, J. P. M.: Anthropogenic sediment retention: major global impact from registered river impoundments, Glob. Planet. Change, 39, 169–190, 2013.
Voss, M., Asmala, E., Bartl, I., Carstensen, J., Conley, D. J., Dippner, J. W., Humborg, C., Lukkari, K., Petkuviene, J., Reader, H., Stedmon, C., Vybernaite-Lubiene, I., Wannicke, N., and Zilius, M.: Origin and fate of dissolved organic matter in four shallow Baltic Sea estuaries, Biogeochemistry, 154, 385–403, https://doi.org/10.1007/s10533-020-00703-5, 2020.
Ward, N. D., Bianchi, T. S., Sawakuchi, H. O., Gagne-Maynard, W., Cunha, A. C., Brito, D. C., Neu, V., Valerio, A. D., da Silva, R., Krusche, A. V., Richey, J. E., and Keil, R. G.: The reactivity of plant-derived organic matter and the potential importance of priming effects in the lower Amazon River, J. Geophys. Res.-Biogeo., 121, 1522–1539, 2016.
Ward, N. D., Bianchi, T. S., Medeiros, P. M., Seidel, M., Richey, J. E., Keil, R. G., and Sawakuchi, H. O.: Where carbon goes when water flows: carbon cycling across the aquatic continuum, Front. Mar. Sci., 4, https://doi.org/10.3389/fmars.2017.00007, 2017.
Wiegner, T. N., Seitzinger, S. P., Gilbert, P. M., and Bronk, D. A.: Bioavailability of dissolved organic nitrogen and carbon from nine rivers in the eastern United States, Aquat. Microb. Ecol., 43, 277–287, 2006.
Wiik, E., Haig, H. A., Hayes, N. M., Finlay, K., Simpson, G. L., Vogt, R. J. and Leavitt, P. R.: Generalized additive models of climatic and metabolic controls of subannual variation in pCO2 in productive hardwater lakes, J. Geophys. Res.-Biogeo., 123, 1940–1959, 2021.
Wood, S.: Generalized Additive Models: an Introduction with R, 1 Edn., Chapman and Hall/CRC, Boca Raton, FL, 2006.
Wood, J. D. and Bukaveckas, P. A.: Increasing severity of phytoplankton nutrient limitation following reductions in point source inputs to the tidal freshwater segment of the James River Estuary, Estuar. Coast., 37, 1188–1201, 2014.
Wood, J. D., Elliott, D., Garman, G. C., Hopler, D., Lee, W. M., McIninch, S., Porter, A. J., and Bukaveckas, P. A.: Autochthony, allochthony and the role of consumers in influencing the sensitivity of aquatic systems to nutrient enrichment, Food Webs, 7, 1–12, 2016.
Wymore, A. S., Fazekas, H. M., and McDowell, W. H.: Quantifying the frequency of synchronous carbon and nitrogen export to the river network, Biogeochemistry, 152, 1–12, 2021.
Xu, X., Wei, H. C., Barker, G., Holt, K., Julian, S., Light, T., Melton, S., Salamanca, A., Moffett, K. B., McClelland, J. W., and Hardison, A. K.: Tidal freshwater zones as hotspots for biogeochemical cycling: sediment organic matter decomposition in the lower reaches of two South Texas rivers, Estuar. Coast., 44, 722–733, 2021.
Yang, G. and Moyer, D. L.: Estimation of non-linear water quality trends in high-frequency monitoring data, Sci. Total Environ., 715, 136686, https://doi.org/10.1016/j.scitotenv.2020.136686, 2020.
Young, M., Hoew, E., O'Rear, T., Berridge, K., and Moyle, P.: Food web fuel differs across habitats and seasons of a tidal freshwater estuary, Estuar. Coast., 44, 286–301, 2021.
Zarnetske, J. P., Bouda, M., Abbott, B. W., Saiers, J., and Raymond, P. A.: Generality of hydrologic transport limitation of watershed organic carbon flux across ecoregions of the United States, Geophys. Res. Lett., 45, 11702–11711, 2018.