the Creative Commons Attribution 4.0 License.
the Creative Commons Attribution 4.0 License.
 | 14 Sep 2022
Consistent responses of vegetation gas exchange to elevated atmospheric CO2 emerge from heuristic and optimization models
Stefano Manzoni
Simone Fatichi
Xue Feng
Gabriel G. Katul
Danielle Way
Giulia Vico
Elevated atmospheric CO2 concentration is expected to increase leaf CO2 assimilation rates, thus promoting plant growth and increasing leaf area. It also decreases stomatal conductance, allowing water savings, which have been hypothesized to drive large-scale greening, in particular in arid and semiarid climates. However, the increase in leaf area could reduce the benefits of elevated CO2 concentration through soil water depletion. The net effect of elevated CO2 on leaf- and canopy-level gas exchange remains uncertain. To address this question, we compare the outcomes of a heuristic model based on the Partitioning of Equilibrium Transpiration and Assimilation (PETA) hypothesis and three model variants based on stomatal optimization theory. Predicted relative changes in leaf- and canopy-level gas exchange rates are used as a metric of plant responses to changes in atmospheric CO2 concentration. Both model approaches predict reductions in leaf-level transpiration rate due to decreased stomatal conductance under elevated CO2, but negligible (PETA) or no (optimization) changes in canopy-level transpiration due to the compensatory effect of increased leaf area. Leaf- and canopy-level CO2 assimilation is predicted to increase, with an amplification of the CO2 fertilization effect at the canopy level due to the enhanced leaf area. The expected increase in vapour pressure deficit (VPD) under warmer conditions is generally predicted to decrease the sensitivity of gas exchange to atmospheric CO2 concentration in both models. The consistent predictions by different models that canopy-level transpiration varies little under elevated CO2 due to combined stomatal conductance reduction and leaf area increase highlight the coordination of physiological and morphological characteristics in vegetation to maximize resource use (here water) under altered climatic conditions.
- Article
(4079 KB) - Full-text XML
-
Supplement
(299 KB) - BibTeX
- EndNote


Elevated atmospheric CO2 concentration causes stomatal closure and reduces transpiration while increasing net CO2 assimilation at the leaf level (Medlyn et al., 2001). These leaf-level observations led to the hypothesis that whole stand-, or catchment-scale transpiration would also be reduced as a consequence of increasing atmospheric CO2 concentrations. Results from Earth system models (Fowler et al., 2019; Mankin et al., 2019; Betts et al., 2007; Swann et al., 2016) seem to support this hypothesis. Nevertheless, empirical evidence of decreased transpiration based on runoff measurements is limited (Ukkola et al., 2016). This discrepancy may be explained by the fact that Earth system models do not always include all the indirect effects of elevated CO2 on plants (De Kauwe et al., 2021), such as increased plant growth and leaf area (Pan et al., 2022; Norby et al., 1999). Higher growth is also in part stimulated indirectly via reduced transpiration rate and hence less frequent water stress. Leaf area has been observed to increase the most in water-limited ecosystems (Donohue et al., 2013) and in open canopies (Bader et al., 2013; Duursma et al., 2016), but it also increases in some mesic forests (McCarthy et al., 2006; Norby et al., 1999), as well as in crops and herbaceous natural vegetation (Pritchard et al., 1999). This increase in the canopy-level evaporating surface area could counterbalance the reduction in leaf-level transpiration caused by stomatal closure, but it is not clear if and under which conditions these two effects balance out.
There is empirical evidence for the compensatory effects of stomatal closure and leaf area increase on canopy-level transpiration under elevated CO2. The compensatory effect has been observed in water-limited ecosystems, where total evapotranspiration is already at its upper limit (Donohue et al., 2013; Schymanski et al., 2015), as well as in mesic forests, where transpiration rates can be insensitive to atmospheric CO2 (Tor-ngern et al., 2015; Schäfer et al., 2002). More generally, canopy transpiration rates are unaffected or can even increase under elevated atmospheric CO2 when the canopy is relatively open (leaf area index, LAI <5 m2 m−2; Donohue et al., 2017). Similarly at the catchment scale, evapotranspiration did not change significantly with increasing CO2 concentrations, as evidenced by minor variations in runoff attributed to trends in atmospheric CO2 (Knauer et al., 2017; Yang et al., 2021). All these findings suggest that the net effect of increasing atmospheric CO2 concentration on canopy transpiration appears lower than its effect at the leaf level.
In line with these empirical results, a detailed process-based model predicted that the direct effect of elevated atmospheric CO2 on stomatal conductance is likely to be compensated by the indirect effects of higher evaporative flux through larger leaf area, especially in dry and semi-arid regions (Fatichi et al., 2016, 2021). In particular, elevated atmospheric CO2 did not affect evapotranspiration at dry sites and caused a small decline (−4 % to −7 %) at wet or intermediately wet sites, where increases in leaf area did not significantly improve light capture (Fatichi et al., 2016). Similarly, an optimality-based model showed that reduced stomatal conductance in response to elevated CO2 was offset by increased leaf area mainly in water-limited environments with low canopy coverage, whereas such a compensatory effect did not emerge in energy-limited environments (Schymanski et al., 2015). When considering plant acclimation to elevated CO2 using the same model, evapotranspiration in water-limited ecosystems even increased because of deepening roots and reduced bare soil evaporation due to shading. Finally, only partial compensation by leaf area was predicted by the model DESPOT, resulting in lowering of canopy-level transpiration under elevated CO2 (Buckley, 2008). Therefore, empirical and modelling results consistently point to some compensation of leaf-level stomatal downregulation by increased leaf area, at least in water-limited systems and in young stands. Nevertheless, the question remains as to how the net effect of elevated atmospheric CO2 on canopy-level gas exchange varies across ecosystems when CO2 concentrations change in concert with increasing vapour pressure deficit (VPD, or D) and soil aridity.
Compared to complex process-based models, parsimonious analytical models can provide more direct understanding and theoretical insight into this question. Analytical models of plant gas exchange have been formulated based on different assumptions, ranging from heuristic relationships to eco-evolutionary theory. An example of the first type is the heuristic Partitioning of Equilibrium Transpiration and Assimilation (PETA) model, which describes how leaf area index (LAI), canopy and leaf transpiration, and CO2 assimilation are expected to vary in response to elevated atmospheric CO2 concentrations (Donohue et al., 2017, 2013). This model is based on the observation that leaf-level water use efficiency increases linearly with atmospheric CO2 concentration and assumes a set of relations between the relative changes in CO2 assimilation and transpiration rates, as well as between the relative changes in climatic conditions (e.g. VPD) and leaf area associated with increasing atmospheric CO2 concentrations. An alternative approach is to consider plant responses to changes in environmental conditions as optimized by natural selection (Harrison et al., 2021). Along these lines, optimal stomatal conductance models were developed on the assumption that net CO2 assimilation is maximized due to stomatal regulation of gas exchange (Cowan and Farquhar, 1977; Mencuccini et al., 2019). Both heuristic and optimization approaches provide closed-form solutions for gas exchange rates as a function of environmental conditions and plant characteristics, illustrating in a transparent way the compound effects of atmospheric CO2 concentrations and other climatic conditions such as VPD and soil aridity. However, predictions from these two analytical models have never been compared.
Optimal stomatal conductance models are sensitive to changes in atmospheric CO2 to different degrees depending on how they are formulated. Among the numerous models available (Mencuccini et al., 2019; Wang et al., 2020, and references therein), we focus here on those formulated as an optimal control problem in which stomatal conductance is solved through time. In these models, CO2 responses depend on how the net CO2 assimilation rate is represented and how the Lagrange multiplier for the optimization problem (λ, interpreted as marginal water use efficiency) is set (Katul et al., 2010; Medlyn et al., 2011; Buckley and Schymanski, 2014). A key limitation of these optimization approaches is that λ remained unspecified and has thus been regarded as a fitting parameter because changes in soil water availability during dry periods have not been explicitly considered. This approach is equivalent to performing an “instantaneous” optimization without considering the soil water dynamics or changes in leaf area that can feed back to leaf gas exchange, albeit at longer timescales compared to the opening and closure of stomata in response to environmental stimuli (Buckley and Schymanski, 2014). Considering λ as a fitting parameter captures some trends in the data with respect to environmental stimuli such as vapour pressure deficit, temperature, or photosynthetically active radiation but does not provide theoretical insights into stomatal responses to elevated CO2. In a more theoretically complete approach, the stomatal optimization problem can be formulated to explicitly consider the impact of stomatal conductance on the dynamic nature of soil water – in other words, accounting for the constraint that utilizing water quickly today necessarily reduces its availability tomorrow (Feng et al., 2022). With this “dynamic feedback” approach to stomatal optimization, λ becomes an internal variable to be solved for in the optimization (Manzoni et al., 2013; Mrad et al., 2019). This dynamic feedback approach considers soil water as a limited resource, but it can be further generalized by also considering the limitations on the transpiration rate imposed by reduced water transport from the soil to the leaves (Lu et al., 2020). The combined stomatal and leaf area responses to atmospheric CO2 concentrations have not been explored with these three variants of stomatal optimization models, specifically (i) instantaneous optimization (OPT1), (ii) dynamic feedback optimization with no effect of water limitation in dry conditions (OPT2), and (iii) dynamic feedback optimization including the effect of water limitation in dry conditions (OPT3).
In this contribution, the PETA model and the three optimization model variants are compared, providing a set of predictions in the form of compact analytical equations. These equations, in turn, quantify the sensitivity of gas exchange rates (especially transpiration) to changing climatic conditions and thus address the following questions:
-
How do physiological (stomatal conductance) and morphological (leaf area) adjustments coordinate to determine leaf and canopy gas exchange rates under atmospheric CO2 concentrations?
-
How do these physiological and morphological adjustments vary under combined changes in CO2 concentration and atmospheric or soil drought?
By comparing the predictions of the PETA and optimization models, a theoretical perspective on these questions is offered while identifying advantages and limitations in these different modelling approaches.
Both the PETA and optimization models describe leaf and canopy exchanges of water vapour and CO2. They rest on three key simplifications. First, the entire canopy is subject to the same conditions and well-coupled to the atmosphere; i.e. the “big leaf” approximation is used (Sect. 2.1). Second, plants are assumed to have reached an equilibrium at yearly to decadal timescales; i.e. they have acclimated to the atmospheric conditions by varying their growing season LAI (which is prescribed in both models) and stomatal conductance. At the shorter timescale of a dry-down, plants are assumed to maintain static leaf area, while they can still adjust stomatal conductance in response to variations in soil water. Third, photosynthetic capacity and vapour pressure deficit are considered fixed over the dry-down duration but allowed to vary at climatic timescales (in this way, they are treated as model parameters instead of dynamic or control variables). The models differ in the way stomatal responses are modelled (Fig. 1, Sect. 2.2 and 2.3), but, to facilitate the model inter-comparison, the same dependence of LAI to atmospheric CO2 concentration was considered. All symbols are defined in Table 1.
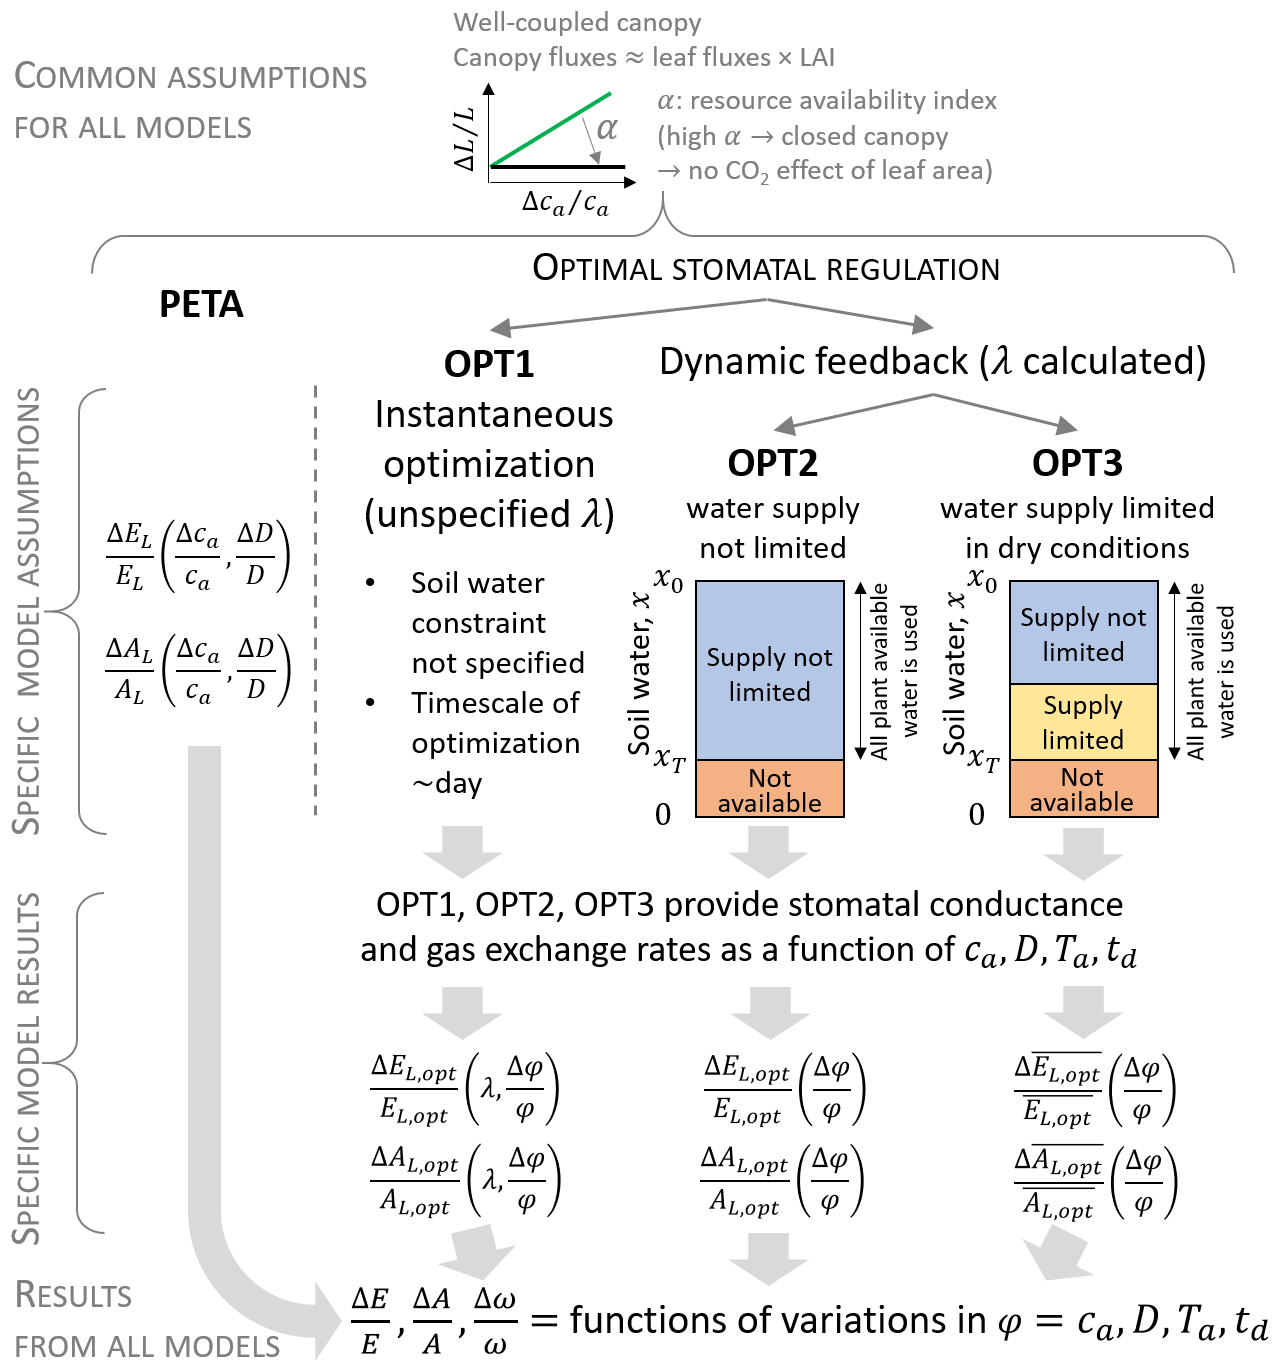
Figure 1Conceptual representation of the PETA and stomatal optimization models used to assess gas exchange responses (transpiration E and net CO2 assimilation A) to changes in atmospheric CO2 concentrations ca, vapour pressure deficit D (either independent of or caused by changes in air temperature Ta), and length of a representative dry-down td (during which soil moisture x decreases from the initial value x0 to xT). Three variants of the stomatal optimization model are considered: (i) instantaneous optimization (OPT1, where the marginal water use efficiency λ is unspecified), (ii) dynamic feedback optimization with no effect of water limitation in dry conditions (OPT2), and (iii) dynamic feedback optimization including the effect of water limitation in the “supply-limited” regime (OPT3). In the heuristic PETA model, leaf-level gas exchange responses (subscript L) follow from the empirical relation between water use efficiency () and ca and D, whereas they are results of optimal stomatal regulation in the optimization models (subscript opt). Overbar indicates temporal averaging during a representative dry-down period; φ indicates a generic climatic variable (ca, D, Ta, or td).
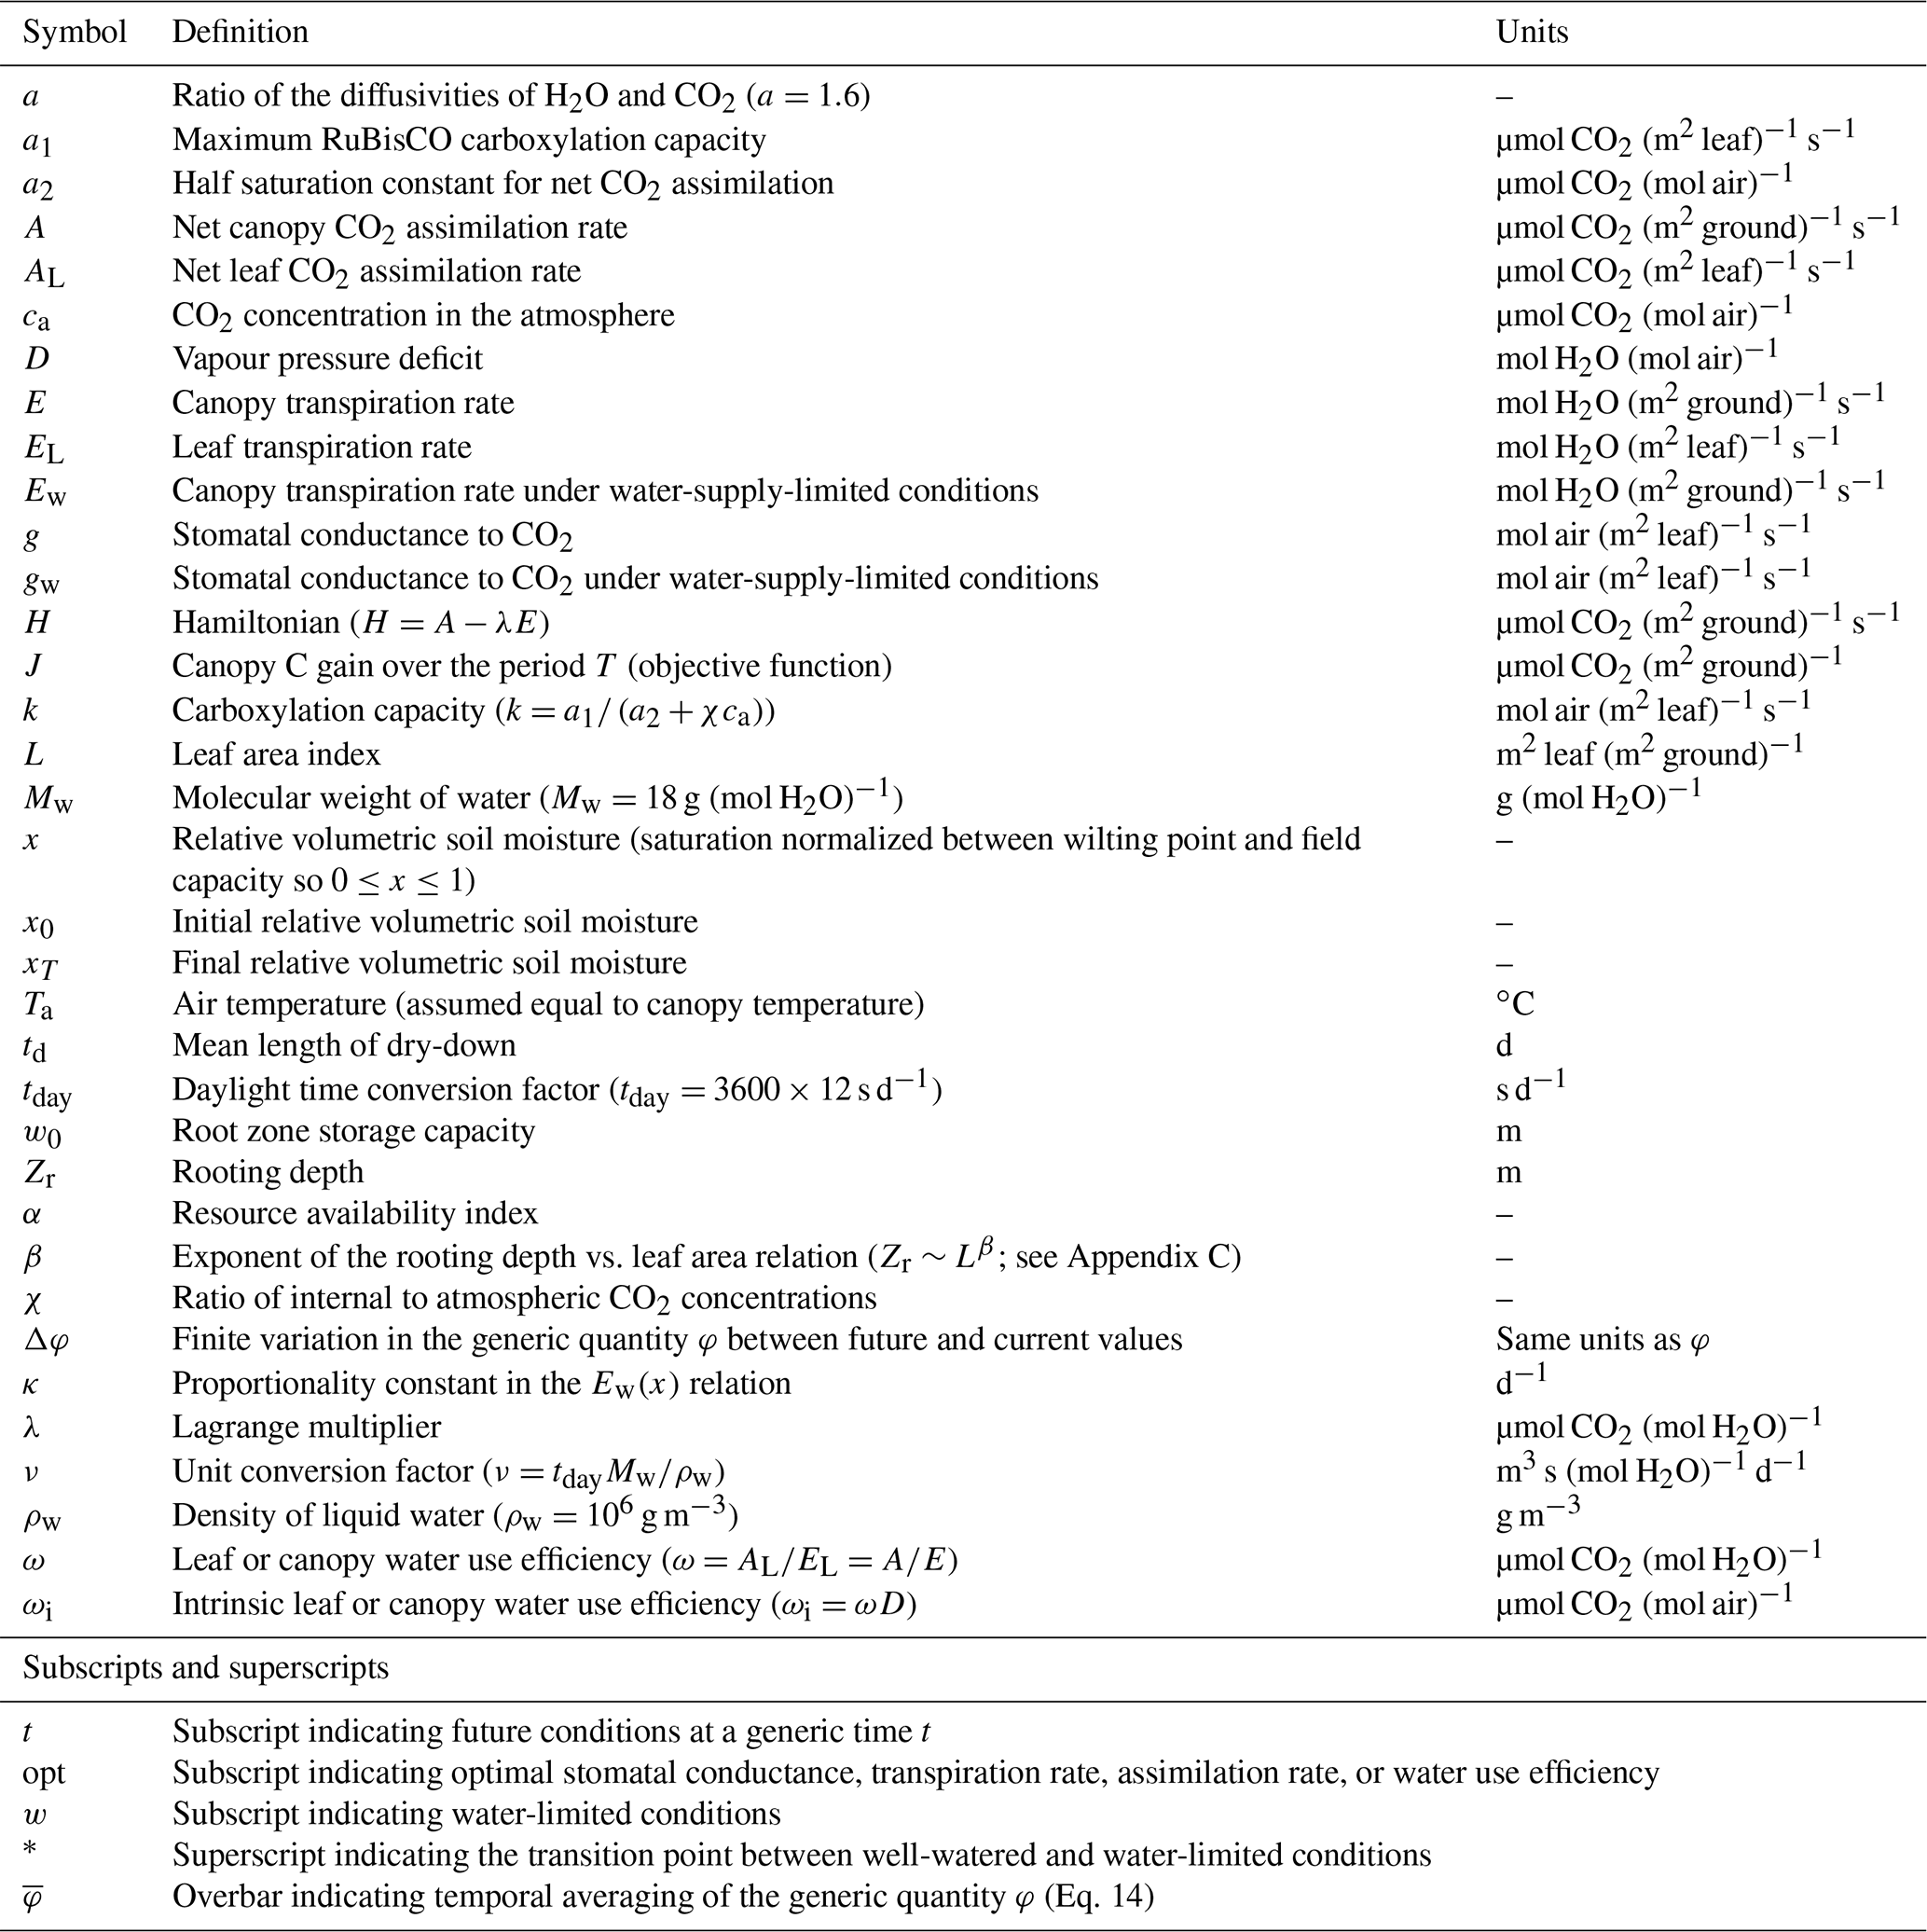
Table 1Definitions of symbols (including units) and subscripts and superscripts.
2.1 Leaf- and canopy-level transpiration and assimilation rates
Leaf-level transpiration rate EL (mol H2O (m2 leaf)−1 s−1) and leaf CO2 uptake rate AL (µmol CO2 (m2 leaf)−1 s−1) are described as diffusion-driven processes with negligible leaf boundary layer resistance,
where in the first equation, a=1.6 is the ratio between the diffusivities of water vapour and CO2 (nondimensional), g is the stomatal conductance to CO2 (mol air (m2 leaf)−1 s−1), and D is the atmospheric vapour pressure deficit expressed as a molar fraction (mol H2O (mol air)−1). In the second equation, AL is described as a CO2 flux mediated by g and driven by the difference between atmospheric and leaf internal CO2 concentrations (respectively ca and ci, expressed in µmol CO2 (mol air)−1). Mass conservation further implies that the rate of CO2 uptake into the leaf must equal the net CO2 assimilation rate. The net assimilation rate can be modelled as a function of internal CO2 concentration as
where a1 and a2 are temperature-dependent kinetic constants that we assume are independent of ca as a first approximation, and k is the maximum RuBisCO carboxylation capacity (mol air (m2 leaf)−1 s−1). The parameters defining k can be related to light availability and temperature, but we assume here that light is fixed, and long-term mean temperature is varied as a model parameter. Following Katul et al. (2010), ci in the denominator of the second term is approximated as χci≈ca, where χ is the long-term ratio of leaf internal to atmospheric CO2 concentration so that . This assumption is reasonable when a2 is commensurate to or larger than ci (which is expected for RuBisCO-limited assimilation). As a result, AL is a linear function of ci, but as atmospheric CO2 concentration varies over long timescales, resulting changes in k lead to a flattening of the A−ci slope. Moreover, this approximation allows retaining variations in ci when ca (Katul et al., 2010). Equating the rates of CO2 uptake and assimilation yields a relation between AL and g (e.g. Hari et al., 1986),
Therefore, increasing atmospheric CO2 concentration affects the net CO2 assimilation rate via two direct effects; it increases the available CO2 in the leaf (through ca), and it decreases the marginal return on CO2 fixation at high CO2 concentrations (through k). Temperature effects on k are considered using the temperature response functions for RuBisCO-limited assimilation of Medlyn et al. (2002). While AL is described by Eq. (3) in the three variants of the optimization model, in the PETA model, the response of AL to environmental variations is described based on heuristic arguments that combine water and CO2 fluxes from Eq. (1) (Sect. 2.2).
Compared to the equations above, nonlinear models of assimilation accounting for RuBisCO or RuBP regeneration limitation (Farquhar et al., 1980; Vico et al., 2013; Katul et al., 2010) would yield a more complex relation between AL and g. These complex relations allow the exploration of short-term responses of gas exchange to variations in temperature, VPD, and photosynthetically active radiation (Medlyn et al., 2011; Katul et al., 2010; Vico et al., 2013). However, here we focus on long-term responses to CO2 concentration, which are not affected by the specific choice of assimilation kinetics, as demonstrated in the following. We thus select the simplest model for AL for the sake of mathematical tractability.
Further assuming the big-leaf approximation and that the canopy is well-coupled with the atmosphere, the canopy-level transpiration (E) and CO2 assimilation rates (A) can be estimated as the leaf-level exchange scaled up by the LAI (L)
Hence, by promoting plant growth and larger LAI, elevated atmospheric CO2 levels can have an indirect effect on gas exchange mediated by L – in addition to any direct effects on g or AL. This linear scaling does not capture nonlinear effects of leaf area on CO2 uptake, such as decreasing returns of higher LAI due to self-shading and redistribution of nitrogen (dePury and Farquhar, 1997). It also neglects the effect of aerodynamic resistance on canopy gas exchange, which can be large in dense canopies (Juang et al., 2008). However, this simplification does not strongly affect the sensitivity of gas exchange rates to changes in atmospheric CO2 concentrations (Donohue et al., 2017). Therefore, we expect that the consequences of increasing LAI on gas exchange could be magnified at high LAI values with this model, though this effect should be relatively small.
Knowing transpiration and CO2 assimilation rates, the instantaneous water use efficiency (WUE) is given as . The intrinsic water use efficiency (i.e. the ratio of net CO2 assimilation rate and stomatal conductance) is linked to ω as ωi=ωD. Due to the linear scaling from leaf to canopy levels, both WUE and intrinsic WUE are numerically the same at these two spatial scales.
2.2 Partitioning of Equilibrium Transpiration and Assimilation (PETA) model
The PETA model is formulated as a set of relations between the relative changes of variables related to leaf gas exchange and the relative change in atmospheric CO2 concentration and VPD. In Donohue et al. (2013, 2017), the premise of PETA is that leaf-level WUE (ω) scales linearly with ca (see also Lavergne et al., 2019) and inversely with the square root of VPD. This relation can be explained by the definition of WUE using Eq. (1) for AL and EL; i.e. , where χ decreases with increasing D as a result of stomatal closure while photosynthesis continues, leading to (Donohue et al., 2013, and references therein). The relative change in ω depends, by definition, on AL and EL, and thus also on ca and D according to the following relations (Donohue et al., 2017):
In Eq. (5) and in the following, the symbol Δ indicates a finite (not infinitesimal) variation, i.e. the value at a future time t minus the current time value (e.g. . The equality on the far right-hand side of Eq. (5) is obtained by noting that , which allows the variation in ω to be expressed as a function of the relative variation in D rather than the variation in its square root. The PETA model then links heuristically the expected relative changes in L, AL, and EL to changes in ω as driven by ca and D and to “resource availability” as quantified by an index α (0. This index represents how far vegetation is from the maximum L expected for that location. High α indicates an old stand or in general a stand with L close to the maximum, where additional leaf area increases are not possible (see also Sect. 2.5). With these premises, the relative changes are expressed heuristically in the PETA model as (Donohue et al., 2017)
When changes in D are small, and variations in WUE are mostly driven by ca, Eq. (5) reduces to , and the variations in L, AL, and EL can be recalculated accordingly. The relations between leaf area and gas exchange rates with ca implicit in Eq. (6) can be explained as follows:
-
In an open canopy far from the maximum L for that site (i.e. α→0), increases in ca allow higher leaf area (, while CO2 assimilation rate per leaf area remains unchanged (, and transpiration rate per leaf area decreases (i.e. ca causes a structural response compensated for by stomatal closure at the leaf level).
-
In a closed canopy (i.e. α→1), increases in ca do not cause changes in leaf area, which is already near the maximum value for that site (; however, net assimilation rate per leaf area increases (, while transpiration rate per leaf area remains unchanged (.
The relations between relative changes in canopy transpiration and photosynthesis and changes in ca are found by multiplying the leaf-level fluxes by L (Eq. 4), obtaining
Equations (6) and (7) link the changes in gas exchange rates to the changes in atmospheric CO2 concentration for a given canopy status as represented by α. Equation (7) also shows that canopy transpiration can vary unless both leaf-level transpiration and leaf area index are constant. Specifically, E increases with L if all else is held constant, but the simultaneous changes in ca (negatively affecting EL) and L compensate each other, leading to small variations in E. This result of the PETA model differs from a key assumption of the stomatal optimization model (Sect. 2.3.2 and 2.3.3). Finally, we can calculate the variation in intrinsic WUE (,
A simplified version of the PETA model is described in Appendix A and used to develop analytical arguments in the “Discussion” section.
2.3 Optimal stomatal control models
The optimal stomatal conductance model is formulated as an optimal control problem with the objective to maximize net CO2 assimilation at the canopy level over a set time interval td (duration of a representative dry period), subject to the constraint that soil moisture x is limited. This model also assumes that plants, over a period much longer than td, can alter allocation and thus leaf area in response to atmospheric CO2 concentration (as in the PETA model). Detailed mathematical derivations are provided in Appendix B. Here we report only the equations for optimal stomatal conductance, based on which all gas exchange rates can be calculated (Eqs. 1, 3, and 4). Solving the optimization problem involves the calculation of the Lagrange multiplier (λ), an auxiliary variable that accounts for the soil moisture constraint and that can be interpreted as the marginal water use efficiency. Three different analytical equations for the optimal g are obtained depending on the specific assumptions made when setting up the optimization problem: (i) instantaneous optimization where λ is treated as a fitting parameter (OPT1), (ii) dynamic feedback optimization where λ is derived mathematically before obtaining the optimal stomatal conductance but where transpiration is independent of soil moisture until the available water has been consumed (OPT2), and (iii) dynamic feedback optimization where transpiration is reduced as soil dries (OPT3).
In versions OPT2 and OPT3, a model of soil moisture dynamics needs to be added to the gas exchange equations. Neglecting evaporation from the soil or canopy surface, the soil water balance during a dry-down with negligible precipitation can be written (in units of metres per day) as
where x is the plant-available relative soil moisture (i.e. the saturation level rescaled between 0 at the wilting point and 1 at field capacity, as in Porporato et al., 2004), w0 is the root zone water storage capacity (m), ν is a unit conversion factor to make the units of E in Eq. (4) (mol H2O (m2 ground)−1 s−1) consistent with typical units used in water balance equations (m d−1): ν=tday (m3 s (mol H2O)−1 d−1), with s d−1: active transpiration period in a day; Mw=18 g (mol H2O)−1: molecular weight of water; and ρw=106 g m−3: density of liquid water. The dry-down starts at a soil moisture x0 below field capacity so that the only water loss from the soil in Eq. (9) is E and lasts for a period T, leaving a residual amount of water xT at the end.
2.3.1 OPT1: instantaneous stomatal optimization
If stomatal conductance is allowed to vary through time but independently of soil moisture, the Lagrange multiplier of the optimization is time-invariant. Substituting Eqs. (1) and (3) in Eq. (B2) in Appendix B1 and solving for g yields (Hari et al., 1986; Katul et al., 2010; Lloyd and Farquhar, 1994; Palmroth et al., 1999)
where λ is regarded as an adjustable parameter. Because the effects of soil moisture dynamics on stomatal conductance are neglected, this approach is termed instantaneous optimization. For a set value of λ, Eq. (10) describes the short-term responses of stomatal conductance to ca, D, and any environmental condition affecting k. However, this equation neglects the fact that soil water is limited; i.e. no constraints are imposed on how much water can be transpired in a given time interval.
2.3.2 OPT2: dynamic feedback optimization with transpiration rate independent of soil moisture
A more realistic approach that overcomes the limitation of a freely adjustable λ is determining the value of λ by imposing the constraint that the initial soil moisture x0 is depleted, leaving only xT at the end of the time interval td. This constraint provides an additional equation that allows us to determine λ (Eq. B3 in Appendix B1). Thus, λ in OPT2 is not simply an adjustable parameter (as it has been treated previously), but rather a clearly defined property of the coupled soil–plant system, including the ending soil moisture and the duration of the dry period. With the obtained λ, the optimal stomatal conductance is found as (solid line in Fig. 2a)
which shows that stomatal conductance (and thus also transpiration and net CO2 assimilation rates) is independent of time or soil moisture but varies with soil water storage capacity, w0(x0−xT), and other environmental conditions (recall that ca, D, and k are time invariant during the dry-down but allowed to vary at longer timescales over which climatic changes occur). It is important to emphasize that this specific stomatal conductance trajectory is not a result of our assumption that all available water is used. Rather, it is the solution that best balances the water consumption rate over time to maximize net assimilation. Even without a direct dependence of gas exchange on soil moisture (which is explored in OPT3), this solution accounts for soil moisture dynamics because faster transpiration reduces soil water storage more rapidly. In this sense, this approach is denoted dynamic feedback optimization.
Equation (11) could be also found by simply imposing that the stomatal conductance adjusts to use all the water in the allotted time (details are shown in Sect. 3.1). Therefore, assuming optimal stomatal control and a finite amount of plant-available water results in a stomatal conductance equation that is independent of the atmospheric CO2 concentration (no direct control) but that is inversely proportional to LAI. This implies an inverse, indirect control of atmospheric CO2 concentration on leaf-level stomatal conductance. In contrast, leaf-level net CO2 assimilation rate increases with atmospheric CO2 concentration (direct control), even though this effect decreases at high ca due to the dependence of k on ca (in Eq. 2). The canopy-level optimal stomatal conductance and CO2 assimilation rate are simply obtained from the leaf-level quantities using Eq. (4).
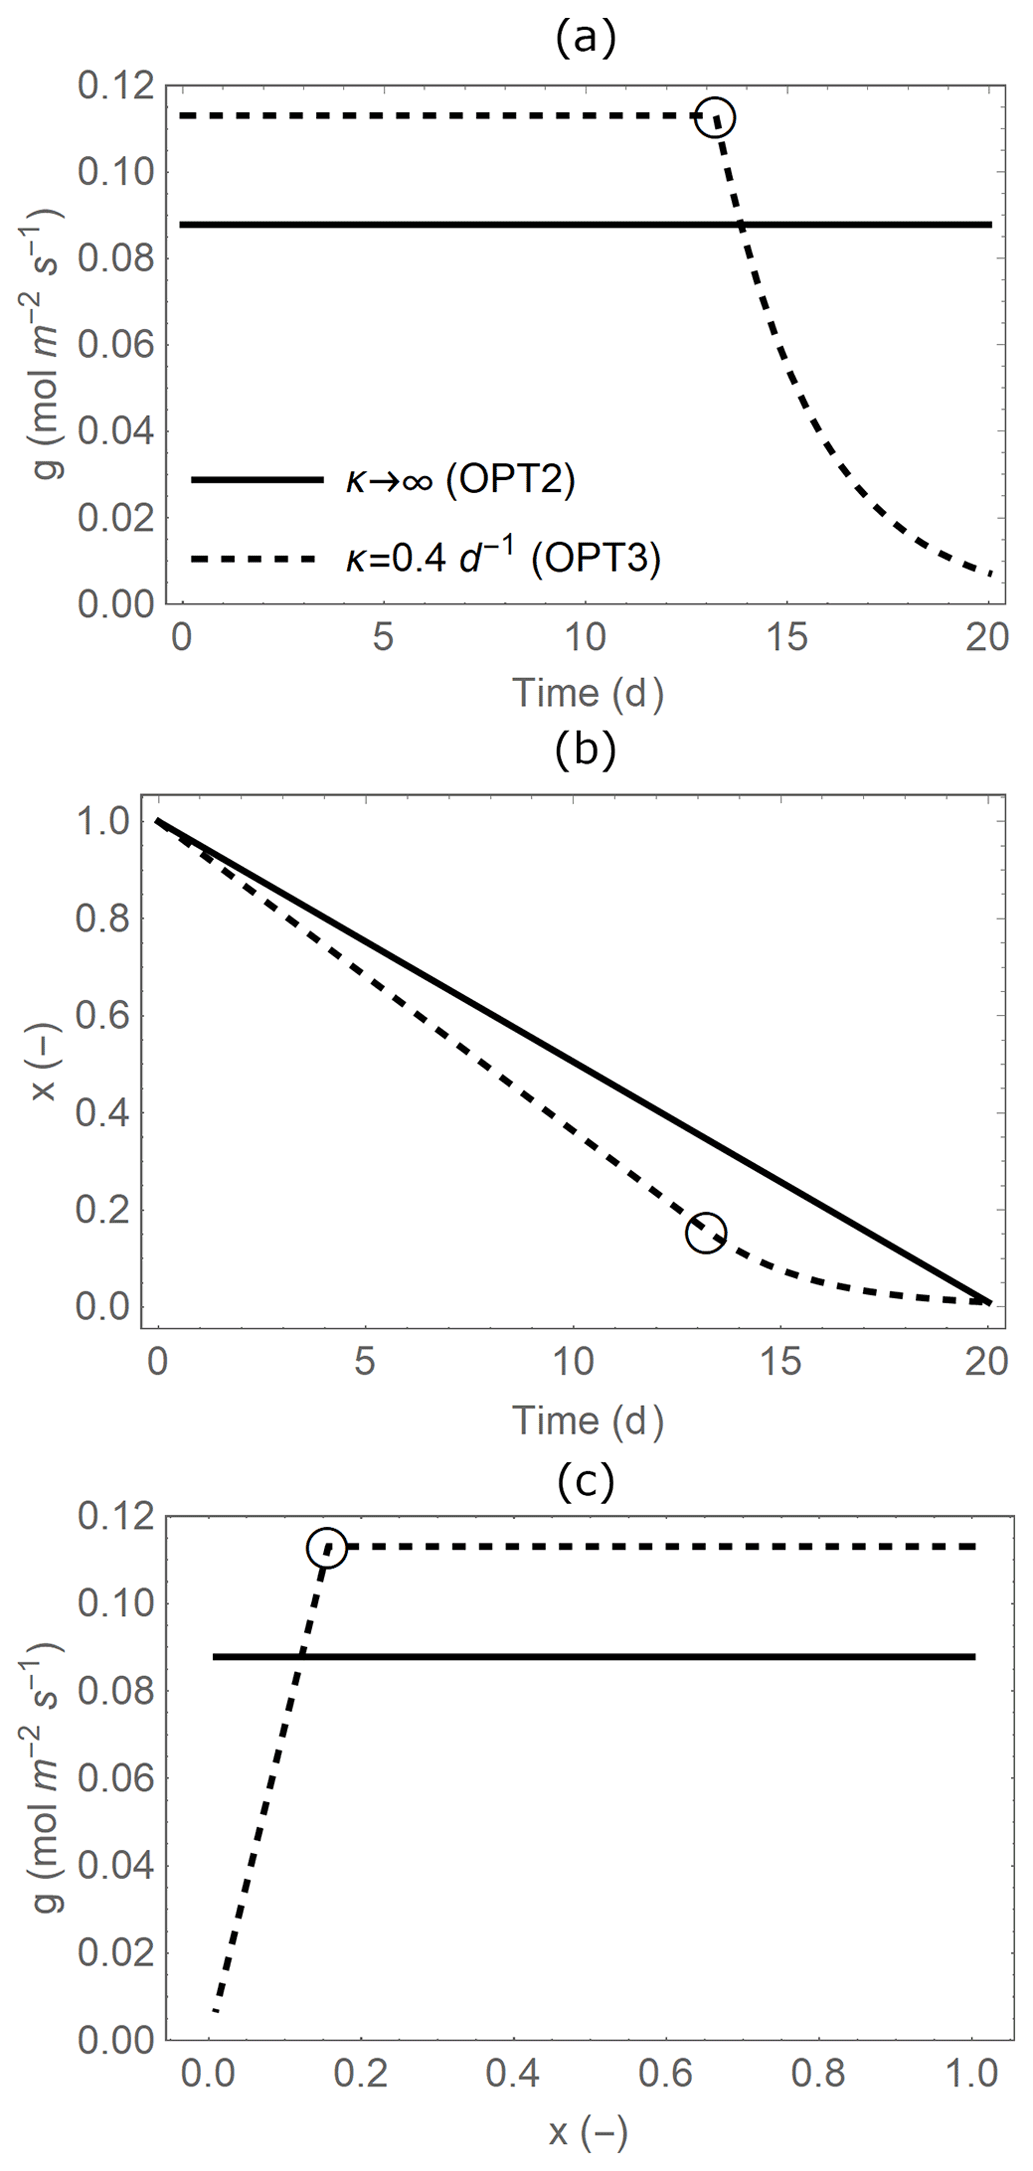
Figure 2Temporal trajectories of (a) leaf-level stomatal conductance (g), (b) plant available soil moisture (x), and (c) relations between g and x (with time increasing from right to left) during a single dry period of duration td=20 d. Line styles indicate when water supply from the soil is unlimited (OPT2: solid line, infinite κ; Sect. 2.3.2) or limited in dry conditions (OPT3: dashed line, finite κ; Sect. 2.3.3). Open circles indicate the transition points to water-limited conditions (x∗ and at time t∗; see details in Appendix B). Parameter values are as in Table 2.
The equations of OPT2 can be used in two ways. Environmental conditions and soil parameters can be set to the long-term mean values and λ determined accordingly with Eq. (B3) in Appendix B1; the same mean conditions can be used in Eq. (11) (in combination with the equations for transpiration and net assimilation rates) to study the responses of gas exchange to long-term climatic changes. This is the approach we follow in this contribution. Alternatively, one can calculate λ based on the long-term mean environmental conditions and soil parameters; insert that specific value in Eq. (10); and then study the short-term responses of stomatal conductance to changes in ca, D, and k for given λ. This solution still accounts for the dynamic feedback mechanism but allows responses to fluctuations around the long-term mean conditions to be studied as captured by the value of λ.
2.3.3 OPT3: dynamic feedback optimization with transpiration rate limited by soil moisture
Different from OPT1 and OPT2, we now consider soil moisture limitations on gas exchange (dashed lines in Fig. 2). Stomatal conductance is reduced as soil moisture decreases during a dry period because of the combined effect of lowered water pressures along the soil–plant system and reduced conductance to water transport in the soil and the plant xylem (Cruiziat et al., 2002; Klein, 2014). As a result, transpiration rate proceeds at a high and stable rate in well-watered conditions but decreases approximately linearly as soil moisture declines due to stomatal closure and limited water supply from the soil (Sadras and Milroy, 1996). Based on this assumption, stomatal conductance decreases linearly with x in dry conditions (i.e. late in the dry down, after a threshold time denoted by t∗; dashed line at low x in Fig. 2c),
In contrast, in well-watered conditions, stomatal conductance can be optimized. The optimal stomatal conductance is calculated with Eq. (10) after finding the Lagrange multiplier specific to model OPT3, which differs from that in OPT2 because the boundary conditions of the optimization have changed. Therefore, when the soil is relatively moist, optimal stomatal conductance is found with an equation similar to OPT2 but modified to account for the fact that stomatal conductance will become water-limited when (dashed line at high x in Fig. 2c),
The specific value of t∗ is determined as explained in Appendix B.
Predictions of the OPT3 model are functions of time and must be interpreted as time series, different from the time-invariant gas exchange rates of the other models (OPT1, OPT2, and PETA). Thus, to compare results of OPT3 to those from the other models, the time-averaged gas exchange rates are calculated as
where φ is used to represent any of the gas exchange variables (EL, AL, E, A), and the overbar indicates temporal averaging.
2.4 Comparing the results of optimization and PETA models
To compare the results of the optimization models with those of the PETA model, the relative changes in leaf transpiration and assimilation rates are calculated as
where EL,opt and AL,opt are evaluated at baseline (current) environmental conditions, and subscript t indicates future climatic conditions. To make the equations of the PETA and optimization models comparable, future values of ca, D, L, and td appearing in the equations for the optimal gas exchange rates are expressed as , , , and . Furthermore, the same LAI changes are included in both the PETA and optimization models by combining Eqs. (5) and (6) to determine . Leaf-level rates in the optimization model variants are scaled up to the canopy-level as in the PETA model (Eq. 7), thus including the additional indirect effect of atmospheric CO2 concentration on LAI.
The relative changes for transpiration can be re-written in a compact form at both the leaf and canopy levels for OPT2 and OPT3 (after some algebraic manipulation of Eqs. (1, 4, and 11),
In particular, Eq. (16) shows that changes in canopy transpiration are predicted to be independent of changes in LAI or atmospheric CO2 concentration but only depend on changes in dry-period duration.
While in the PETA model the water use efficiency ω is prescribed (Eq. 5), in the optimization model ω is obtained as a result of the optimization, . Accordingly, variations in ω in the optimization model induced by changing CO2 concentration and VPD are calculated as
Similarly, the variations in intrinsic water use efficiency are found using the definition ωi=ωD as
In scenarios in which VPD does not change in the future (i.e. Dt=D), the variations in WUE and intrinsic WUE are the same.
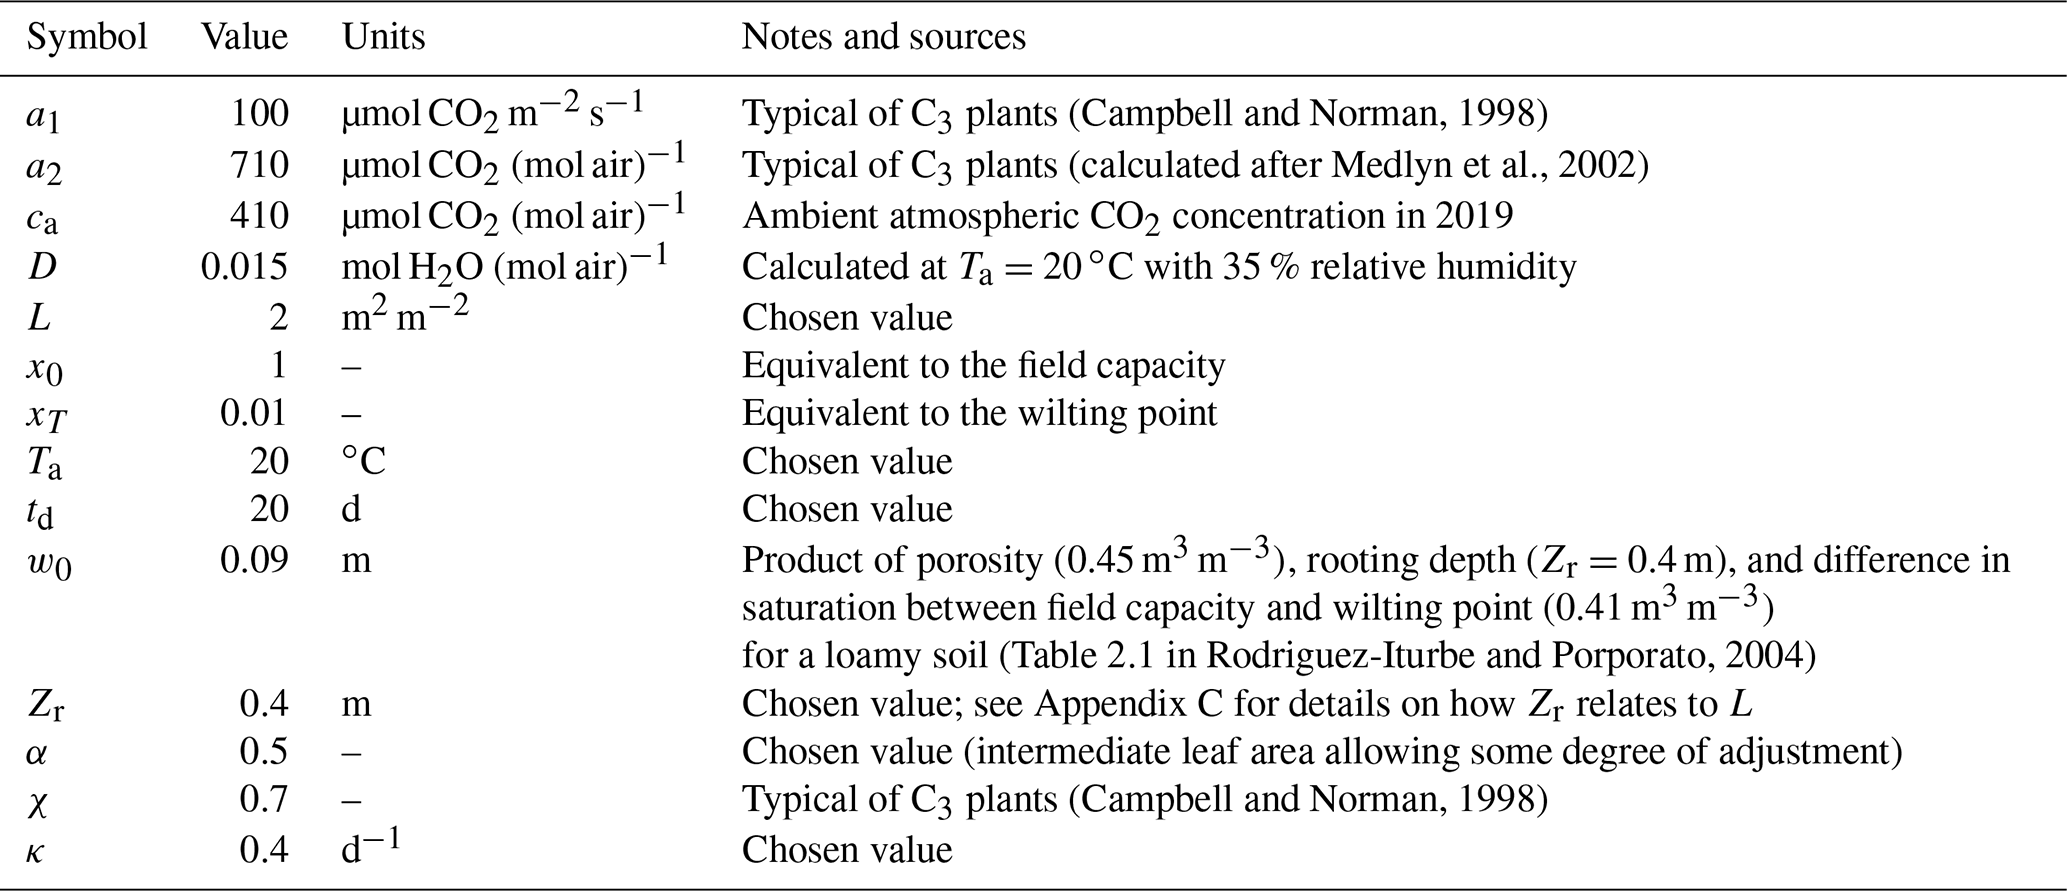
Table 2Baseline parameter values (relative variations in ca, D, Ta, and L are calculated with respect to the values reported here).
2.5 Model parameters and climate change scenarios
The models are parameterized for a generic vegetation type and a baseline climate (Table 2), from which variations in gas exchanges for a wide range of future climate conditions are evaluated. In both the PETA and optimization models, LAI varies with atmospheric CO2 concentration and VPD in the same manner (top of Fig. 1). Growth chamber and FACE experiments showed that LAI generally increases in open canopies and young stands with increasing atmospheric CO2 concentration across plant functional types (symbols in Fig. 3). However, the rate of increase varies depending on growth conditions, with the LAI of closed-canopy and older plant communities responding less to increasing CO2 levels than those of younger communities (Bader et al., 2013; Duursma et al., 2016). We test these effects by varying the parameter α (Donohue et al., 2017, 2013), which increases from zero, when leaf area responds the most to increasing CO2 concentration (open canopy with low leaf area index and/or young plants), to one, when leaf area is unresponsive (closed canopy with high leaf area index and/or older plants). The intermediate value α=0.5 is selected for the analyses involving simultaneous changes in atmospheric CO2 concentration, VPD, and length of the dry period.
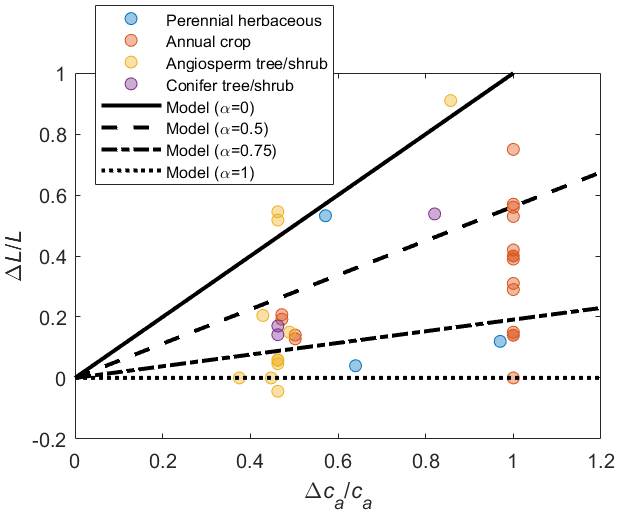
Figure 3Relative change in leaf area () as a function of relative change in atmospheric CO2 concentration () across plant functional types (colours); lines show how the change in leaf area is modelled depending on the canopy status, indicated by α (higher α implies larger leaf area under ambient conditions and therefore lower sensitivity to changes in ca; Eq. 6). The effect of variations in vapour pressure deficit on leaf area is not considered in this figure, so that . The same variations in L due to ca (for given α) are prescribed in both the PETA and optimization models. Data points represent temporal averages of leaf area changes in response to elevated ca at plant to stand scales, shown to illustrate the range of observed responses (data and sources are reported in the Supplement).
In the PETA model, α is the only adjustable parameter, so no further parameter selection is necessary. In the optimization model, we selected parameter values representative of A−ci curves for C3 plants (Table 2). Soil parameters determining the water storage capacity w0 are selected for a loamy soil and intermediate rooting depth (Table 2.1 in Rodriguez-Iturbe and Porporato, 2004). The baseline values of ca, D, and td represent current climatic conditions under a mild temperature regime. The assumed dry-down length of td=20 d corresponds to a dry spell length for which vegetation is adapted; i.e. td is interpreted as a characteristic time between the length of the average dry period and that of an actual drought that would cause irreversible damage or mortality. The baseline L=2 m2 m−2 is reasonable for a relatively open canopy, meeting the assumption of well-coupled conditions.
The ca, td, and D are allowed to vary in the ranges expected under future climatic conditions. We explore a range of ca from 400 to 800 µmol CO2 (mol air)−1 (maximum ), in line with atmospheric CO2 concentration being expected to approximately double from 2016 to 2100 according to an intermediate-emission scenario (SSP3-7.0; IPCC, 2021).
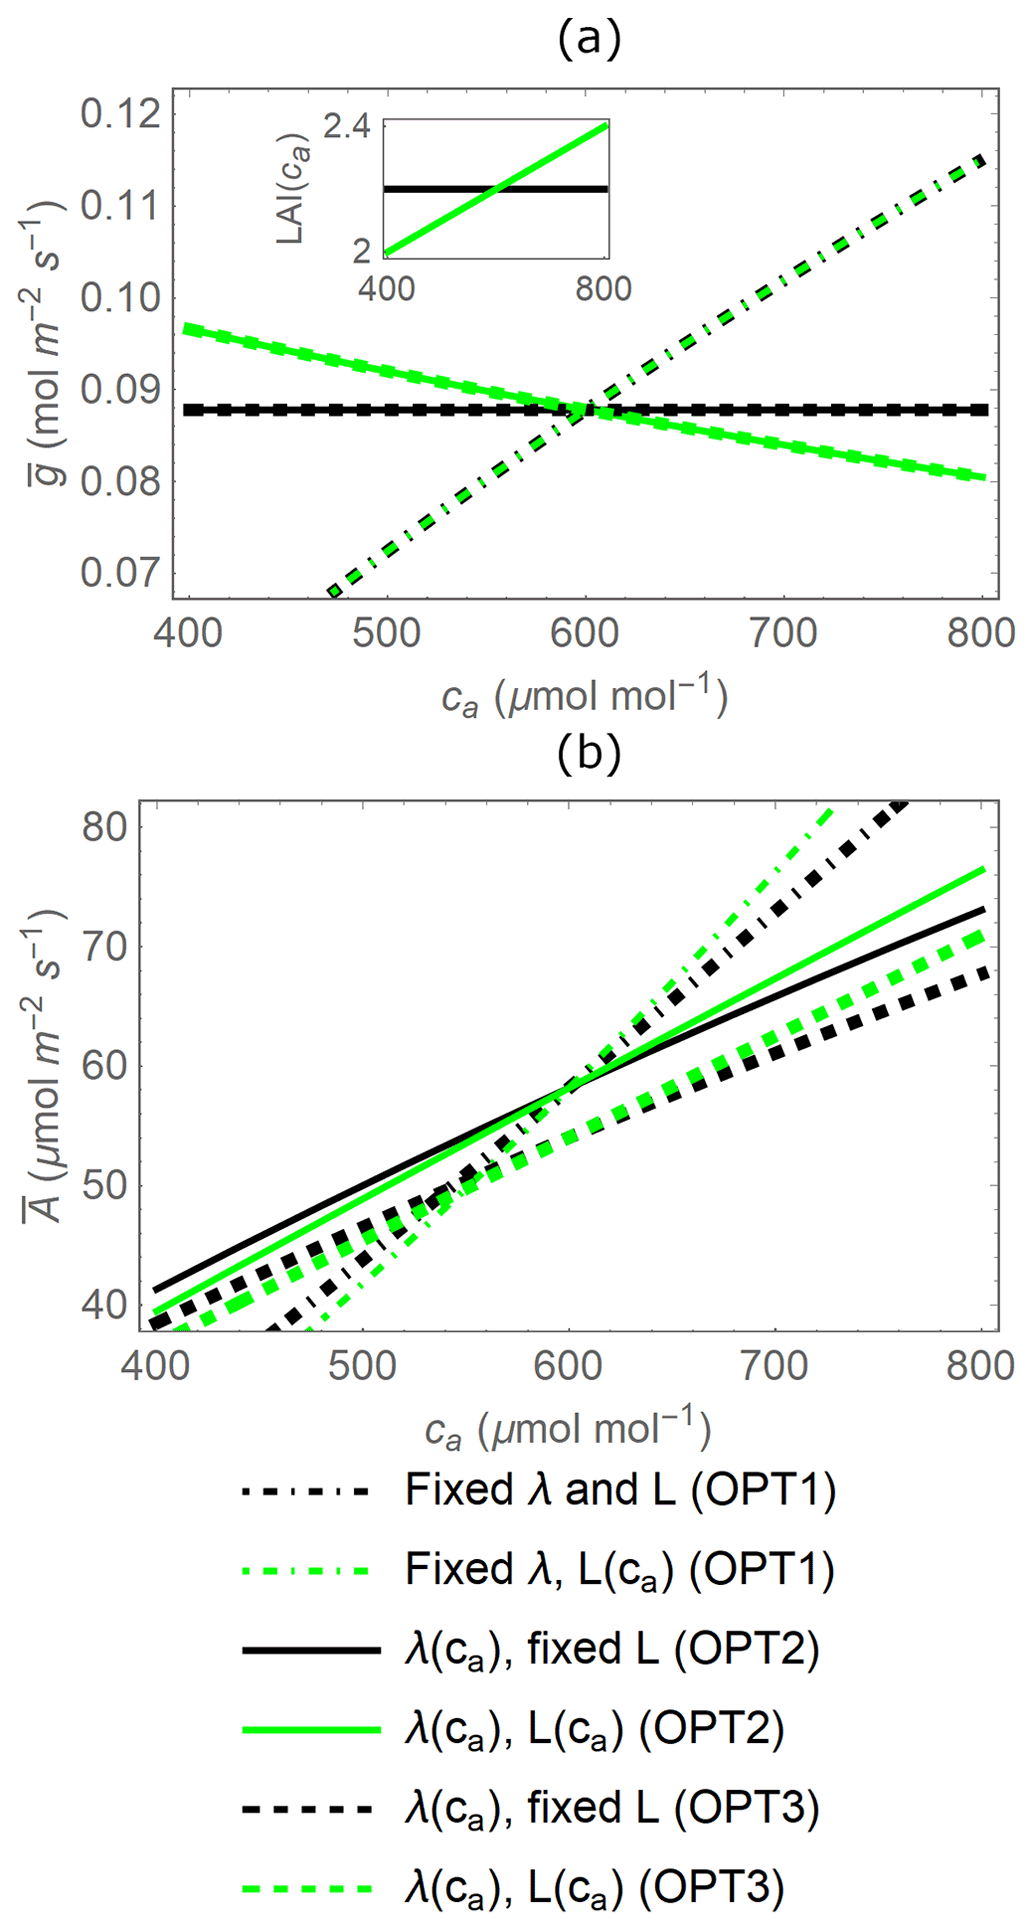
Figure 4Effect of atmospheric CO2 concentration (ca) on gas exchange as predicted by three variants of the stomatal optimization model (identified by different line dashing). (a) Mean stomatal conductance () and (b) mean canopy net CO2 assimilation rate () during a dry period of td=20 d as a function of ca, when transpiration is either independent of soil moisture (OPT2, solid lines) or water-limited in dry conditions (OPT3, dashed lines) and with leaf area index (L) acclimating with increasing ca or fixed (green vs. black lines, respectively). The dot-dashed lines refer to the instantaneous optimal stomatal conductance (OPT1), obtained from Eq. (10) with λ set to a constant value (Eq. B3 at ca=600 µmol CO2 (mol air)−1). Note that lines of different thickness are used to distinguish overlapping curves. The inset in (a) shows how L varies with ca; to make visual comparisons easier, L variations are centred around a common value for all model variants at ca=600 µmol CO2 (mol air)−1. Parameter values are as in Table 2.
The VPD can be changed by letting relative humidity vary at constant temperature or by letting temperature vary at constant relative humidity. The first scenario allows isolation of the effect of VPD on stomatal conductance and transpiration alone. In the second scenario, VPD affects both water and CO2 exchanges because of direct effects on the former and indirect effects on the latter via photosynthetic capacity (Medlyn et al., 2002), which in turn also affects gas exchange in the optimization models (again via k). To compare the two scenarios, VPD is varied in the same range, even though projected variations in VPD are mostly attributed to warming (relative humidity variations are expected to be moderate). Taking the United States as an example, VPD is expected to increase between ∼40 % and ∼65 % by the end of the century, depending on the general circulation model used for the projections, with a median of ∼50 % (Ficklin and Novick, 2017; Yuan et al., 2019). While this value is probably higher than the global average, we use it as an upper bound for our sensitivity analyses (maximum ).
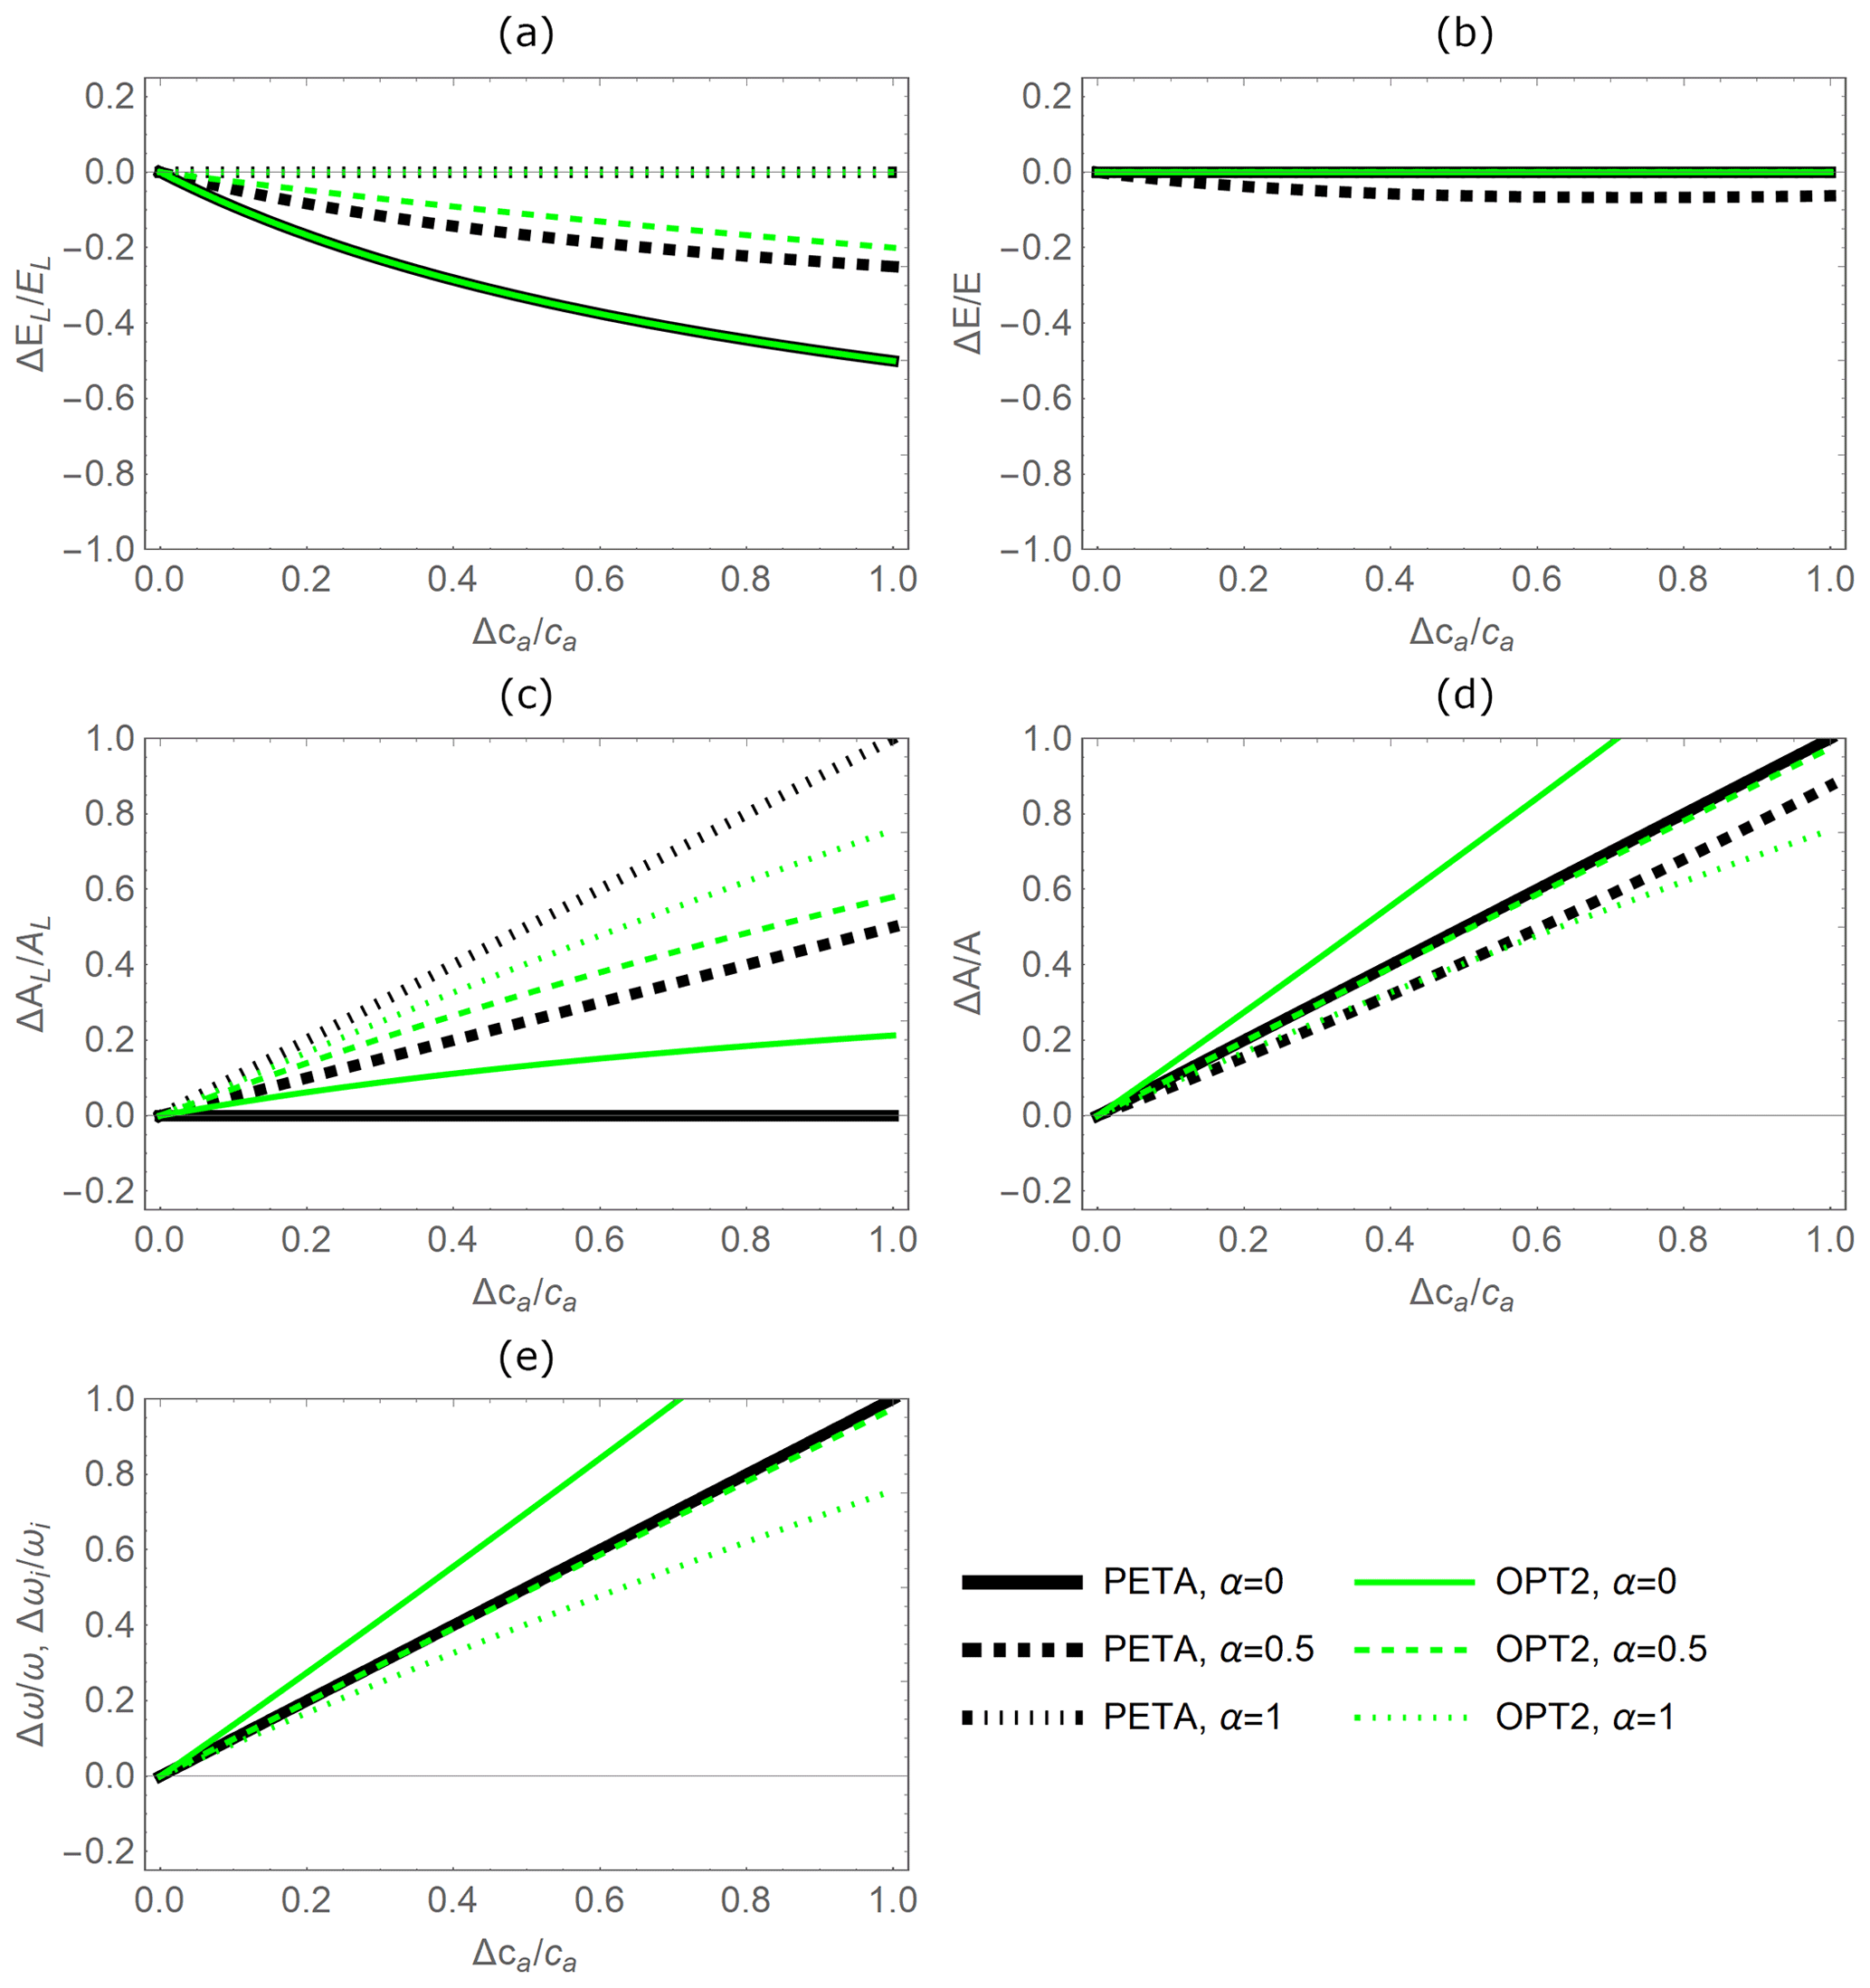
Figure 5Relative changes in leaf-level (a, c) and canopy-level (b, d) gas exchange rates as a function of relative change in atmospheric CO2 concentration ca, as predicted by the PETA model (black lines) and the optimal stomatal control model OPT2 (green lines): (a) leaf-level transpiration rate (EL), (b) canopy-level transpiration rate (E), (c) leaf-level assimilation rate (AL), (d) canopy-level assimilation rate (A), and (e) water use efficiency (ω; equivalent to intrinsic WUE at constant VPD). Changes in ca have both direct and indirect effects on the CO2 and water vapour exchange rates; the indirect effects are mediated by changes in leaf area that also depend on canopy status, indicated by α (Fig. 3): lower values of α refer to open-canopy conditions with largest leaf area stimulation by elevated ca; for α=1 leaf area is constant. Vapour pressure deficit and dry-period length are equal to the baseline values (Table 2).
Dry-period lengths during the growing season have been shifting towards either longer or shorter lengths depending on location, with historical variations up to % per decade (Breinl et al., 2020). Because of this large variability in historical times and the large uncertainty in projected dry period durations, we consider td variations between −50 % and 50 % ( ranges from −0.5 to +0.5).
We start by comparing the effects of atmospheric CO2 concentration on gas exchange in the three variants of the optimization model (Fig. 4). Next, the CO2 effects are assessed in both the PETA and optimization models at fixed VPD, but with different values of α (Fig. 5). Finally, the combined effects of CO2 concentration and VPD (Figs. 6–7) and CO2 concentration and dry-period length (Fig. 8) are assessed in both models. An additional analysis is conducted in Appendix C to test how a coordinated deepening of the roots and increased leaf area index could affect the gas exchange sensitivity to elevated CO2.
3.1 Optimal stomatal conductance under varying atmospheric CO2 concentration
Different variants of the optimization model predict contrasting responses to atmospheric CO2 concentration. The instantaneous optimization OPT1 (in which λ is a fixed parameter; Eq. 10) predicts increasing stomatal conductance with increasing ca regardless of LAI (dot-dashed black and green lines in Fig. 4a). Conversely, with increasing ca, the dynamic feedback optimization OPT2 (Eq. 11) predicts that stomatal conductance is stable when LAI is fixed or decreasing when LAI acclimates with ca (solid black and green lines in Fig. 4a, respectively).
The mean stomatal conductance ( over the dry-down is independent of whether soil water becomes limiting or not (comparing between OPT2 and OPT3) because is only a function of the total available soil water (solid and dashed lines in Fig. 4a). This result occurs despite the fact that OPT2 and OPT3 are defined using different functional dependences of g on x; i.e. the optimal stomatal conductance obtained from OPT3 (Eq. 13) is higher in well-watered conditions but decreases at low soil moisture (dashed line in Fig. 2c) compared to the model variant without soil moisture limitations (solid line in Fig. 2c). The can be derived analytically by formulating the constraint that soil water is limited as a relation between total transpiration amount and available soil water,
Using the definition of temporal average, Eq. (19) can be written as
Recalling Eqs. (1) and (4), the mean stomatal conductance can thus be expressed as
which is independent of the specific trajectory g(t), but it is indirectly dependent on ca via L.
Canopy-level net CO2 assimilation rate increases with ca in all optimization models due to the direct CO2 fertilization effect, but more so when leaf area acclimates (green vs. black lines in Fig. 4b), and at a higher rate with the instantaneous optimization approach (dot-dashed vs. solid lines in Fig. 4b). In contrast to the mean stomatal conductance, the mean net CO2 assimilation rate does depend on whether soil water is limiting or not (i.e. the specific g(t) matters) due to the nonlinear nature of the AL(g) relation (Eq. 3). In particular, diminishing returns at high g cause to be lower when optimal g from OPT3 is higher under well-watered conditions and lower in dry conditions, compared to OPT2 with time-invariant g. This explains why the dashed lines in Fig. 4b are lower than the corresponding solid lines.
Therefore, based on the results in Fig. 4, the inclusion of the dynamic feedback (OPT2 and OPT3) in the stomatal optimization model produces plausible responses to elevated ca. The dynamic feedback variants are also more suitable given our focus on long-term responses of gas exchange. Conversely, the stomatal response to elevated CO2 of OPT1 is not realistic because λ is independent of ca (Fig. 4a; see also Sect. 4.4). In contrast, the responses of both dynamic feedback approaches are plausible. In the following comparisons with the PETA model, we consider only the optimization model without any water limitation effect (OPT2) because the relative changes in gas exchange rates are essentially the same when including water limitation (OPT3; results not shown), despite variations in the absolute rates.
3.2 Gas exchange responses to changes in atmospheric CO2 concentration
The relative variations in gas exchange rates and water use efficiency predicted under elevated CO2 concentration by the PETA and optimization model with dynamic feedback but absence of water limitation (OPT2) are broadly consistent (Fig. 5). As CO2 concentration increases, both models predict decreasing leaf-level (Fig. 5a, except for α=0) but stable canopy-level transpiration rates (Fig. 5b) and increasing net CO2 assimilation rates at both the leaf and canopy levels (Fig. 5c, d). Therefore, water use efficiency (ω) increases with increasing atmospheric CO2 concentration (Fig. 5e). In the PETA model, the increase in ω is linear with CO2 by definition (Eq. 5), while it is slightly nonlinear for the optimization models.
The predicted sensitivity of the gas exchange responses varies between the PETA and optimization models, depending on the canopy status (i.e. α), in particular for the rate of net CO2 assimilation (Fig. 5c, d). At the leaf level, higher α reduces the sensitivity of transpiration rates but enhances that of net CO2 assimilation rates to increasing CO2 concentration in both models (compare dotted and solid lines in Fig. 5a, c). In contrast, at the canopy level, higher α reduces the net CO2 assimilation responses to CO2 concentration in the PETA model (Fig. 5d). Conversely, by construction, canopy-level transpiration is independent of atmospheric CO2 according to the optimality model (Eq. 20; all green lines overlap on the axis in Fig. 5b). By definition, ω is independent of α in the PETA model (all black lines are overlapping in Fig. 5e), whereas a more open canopy (lower α) increases the sensitivity of ω to changes in CO2 concentration according to the optimality model. In the following analyses, we prescribed the intermediate value α=0.5.
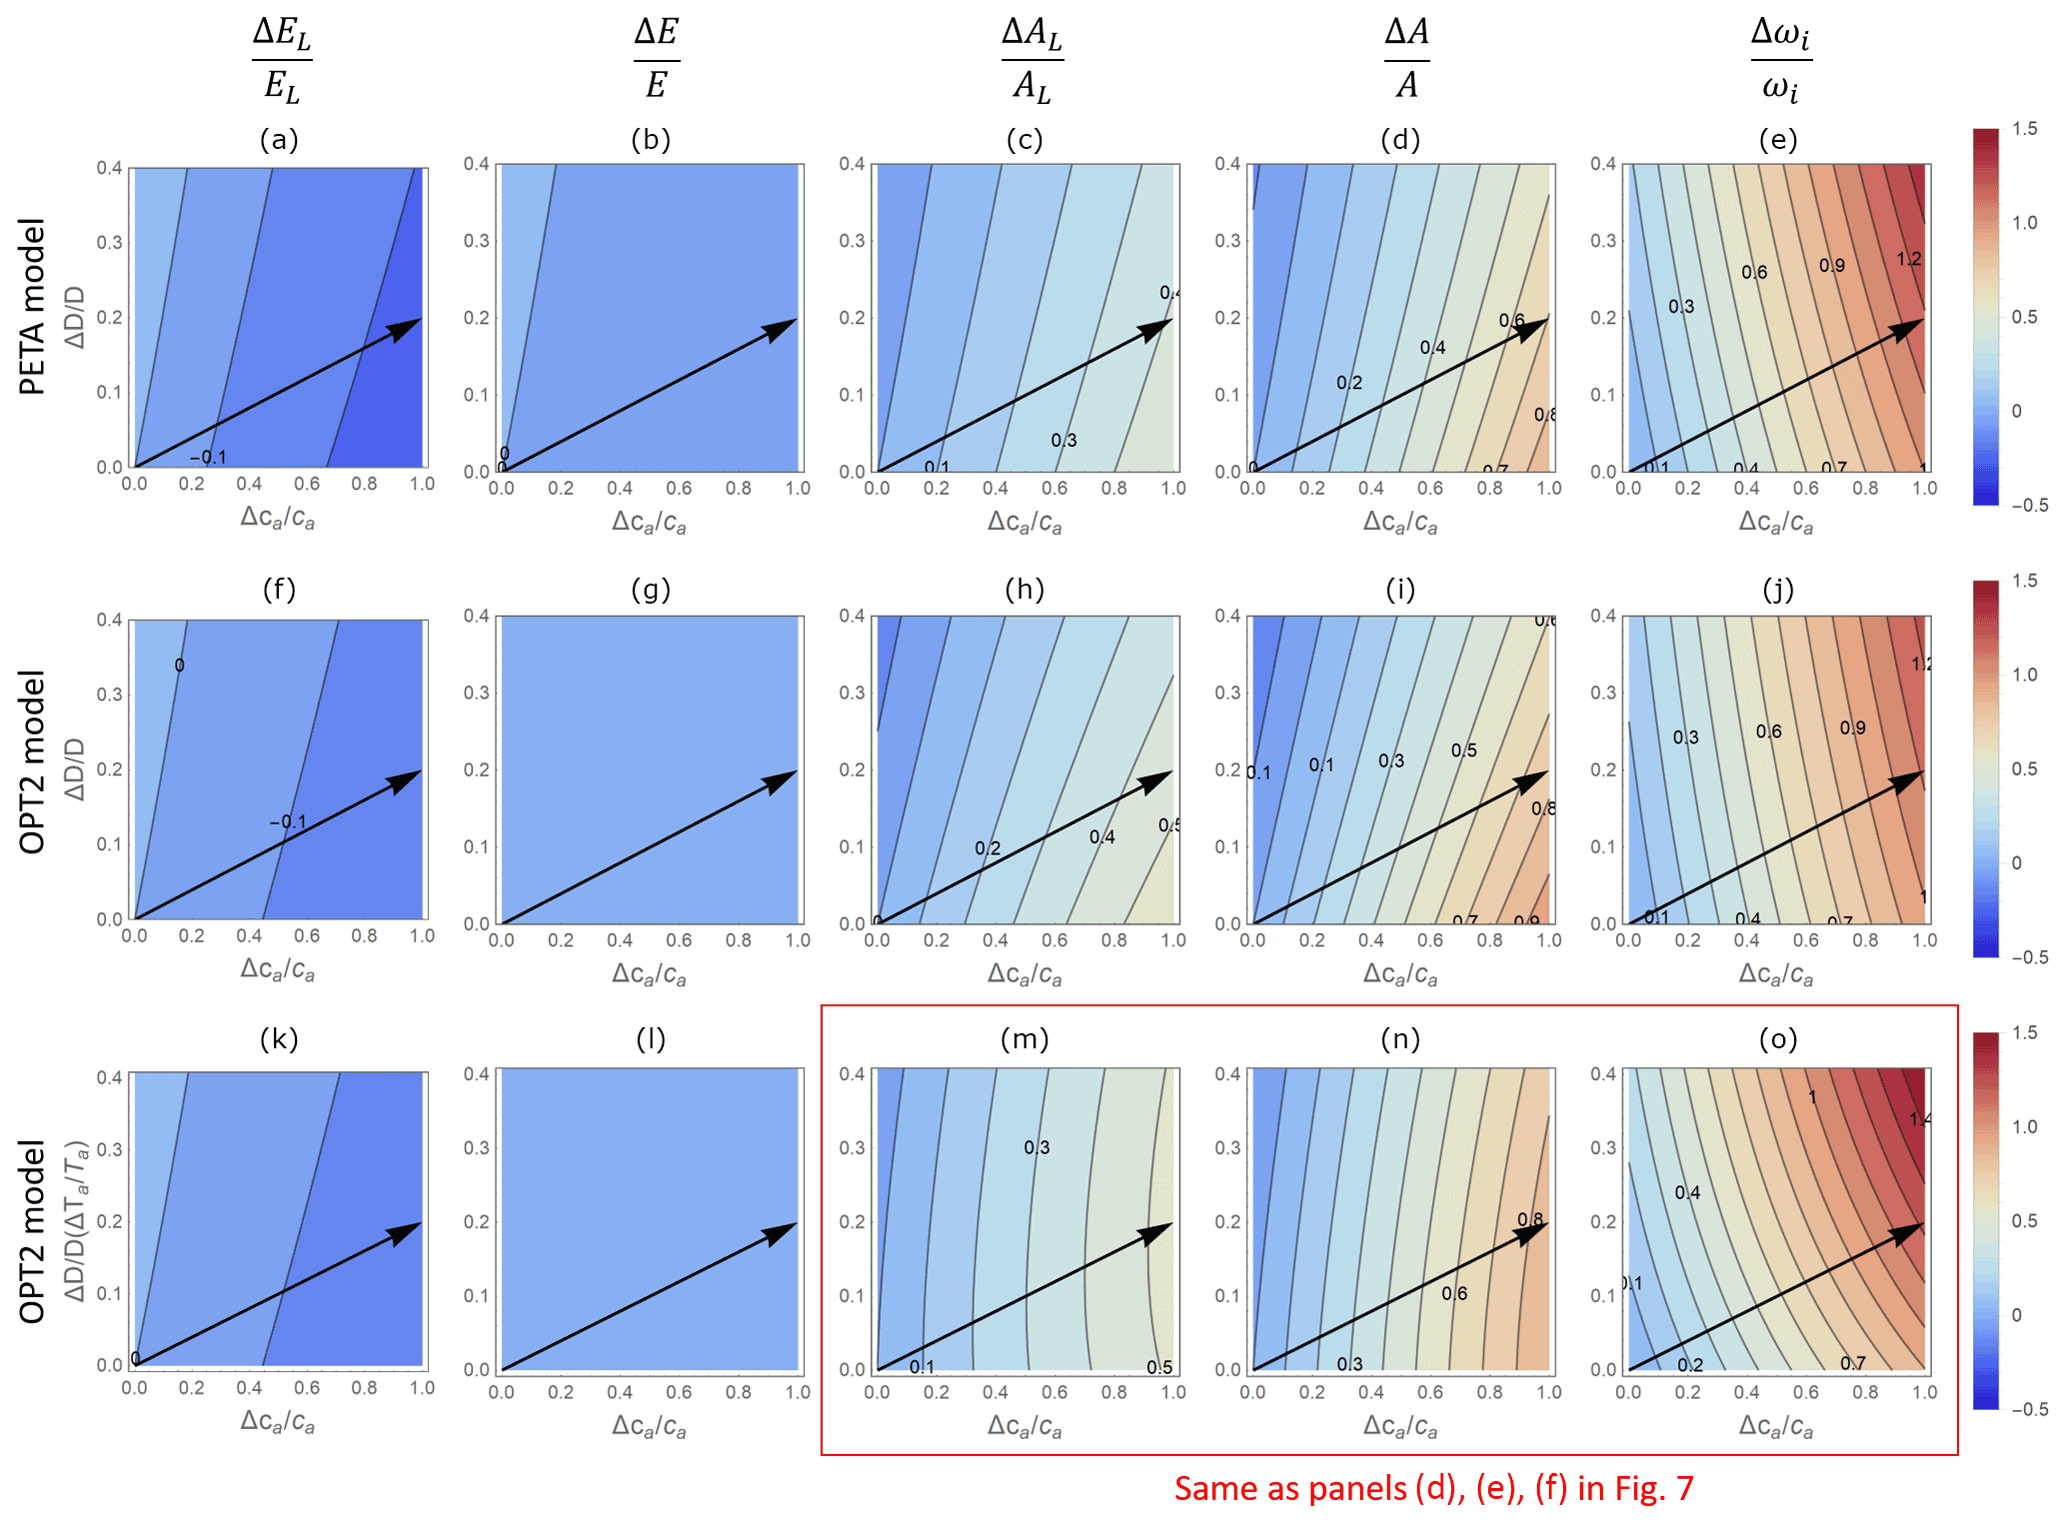
Figure 6Contour plots of relative changes in leaf-level (a, c, f, h, k, m) and canopy-level (b, d, g, i, l, n) gas exchange rates as a function of relative changes in atmospheric CO2 concentration ca (x axis) and vapour pressure deficit D (y axis), as predicted by the PETA model (top panels) and the optimal stomatal control model OPT2 (centre and bottom panels): (a, f, k) leaf-level transpiration rate (EL), (b, g, l) canopy-level transpiration rate (E), (c, h, m) leaf-level assimilation rate (AL), (d, i, n) canopy-level assimilation rate (A), and (e, j, o) intrinsic water use efficiency (ωi). In (f)–(j), D is varied by letting the relative humidity change at constant temperature Ta (i.e. the assimilation rate constants do not co-vary with D); in (k)–(o), changes in D are expressed as a function of changes in temperature Ta at constant relative humidity, set at 50 % (i.e. the assimilation rate constants co-vary with D due to the effect of Ta). Leaf area index varies with ca and D according to Eq. (6) with α=0.5. Black arrows indicate hypothetical temporal trends in D and ca assuming a CO2 concentration doubling and associated D and Ta increase. The dry-period length is assumed to be constant and equal to the baseline value (Table 2).
3.3 Gas exchange responses to combined changes in atmospheric CO2 concentration, VPD, and dry-period length
The gas exchange patterns driven by ca and D are largely consistent between the PETA and optimization models. In both the PETA and OPT2 models, at a given ca, higher VPD slightly increases leaf-level transpiration (Fig. 6a, f, k) but has no effect on canopy-level transpiration (Fig. 6b, g, l). In the PETA model, this effect occurs because leaf area decreases with increasing VPD (Eqs. 5 and 6). The decrease in stomatal conductance at higher VPD in both models, and irrespective of how the change in VPD is imposed, causes the intrinsic water use efficiency to increase (Fig. 6e, j, o). Moreover, higher VPD decreases leaf- and canopy-level net CO2 assimilation when VPD is varied at fixed temperature (Fig. 6c–d for PETA, Fig. 6h–i for OPT2). However, when VPD is varied because of changing temperature (which also affects photosynthetic parameters; bottom row in Fig. 6), at high ca, leaf-level net CO2 assimilation increases and then decreases slightly as VPD is increased (Fig. 6m). In contrast, canopy-level net CO2 assimilation decreases (Fig. 6n). Following a hypothetical climate change trajectory with simultaneous increases in ca and D (arrows in Fig. 6), higher VPD reduces the improvement in canopy-level net CO2 assimilation rate caused by elevated CO2 alone while leading to a greater improvement in intrinsic water use efficiency.
While the responses of transpiration rates are the same regardless of how the variation in VPD is produced, patterns in net CO2 assimilation rates (and thus also water use efficiency) depend strongly on the selected baseline temperature in the optimization model, as shown in Fig. 7. Here, only results from the optimization model OPT2 are shown because the PETA model cannot attribute variations in VPD to relative humidity or temperature. At low baseline Ta (top row in Fig. 7), higher VPD enhances net CO2 assimilation because changes in VPD are driven by temperature increases that also promote photosynthesis (i.e. the baseline Ta is well below the photosynthetic thermal optimum). In contrast, at high baseline Ta (bottom row), temperature increases driving VPD inhibit photosynthesis (i.e. the baseline Ta is close to the photosynthetic thermal optimum, but future growth temperature increases above the optimum). The case shown in the central row (same as in Fig. 6) is intermediate between these two extremes. As a result, simultaneously increasing VPD and ca along the arrows in Fig. 7 cause a faster or slower increase in net CO2 assimilation than would occur due to changes in ca alone, depending on whether the baseline temperature is sufficiently lower or higher than the thermal optimum, respectively. Accordingly, with increasing baseline Ta, the ca-driven enhancement of intrinsic water use efficiency also decreases (Fig. 7c, f, i).
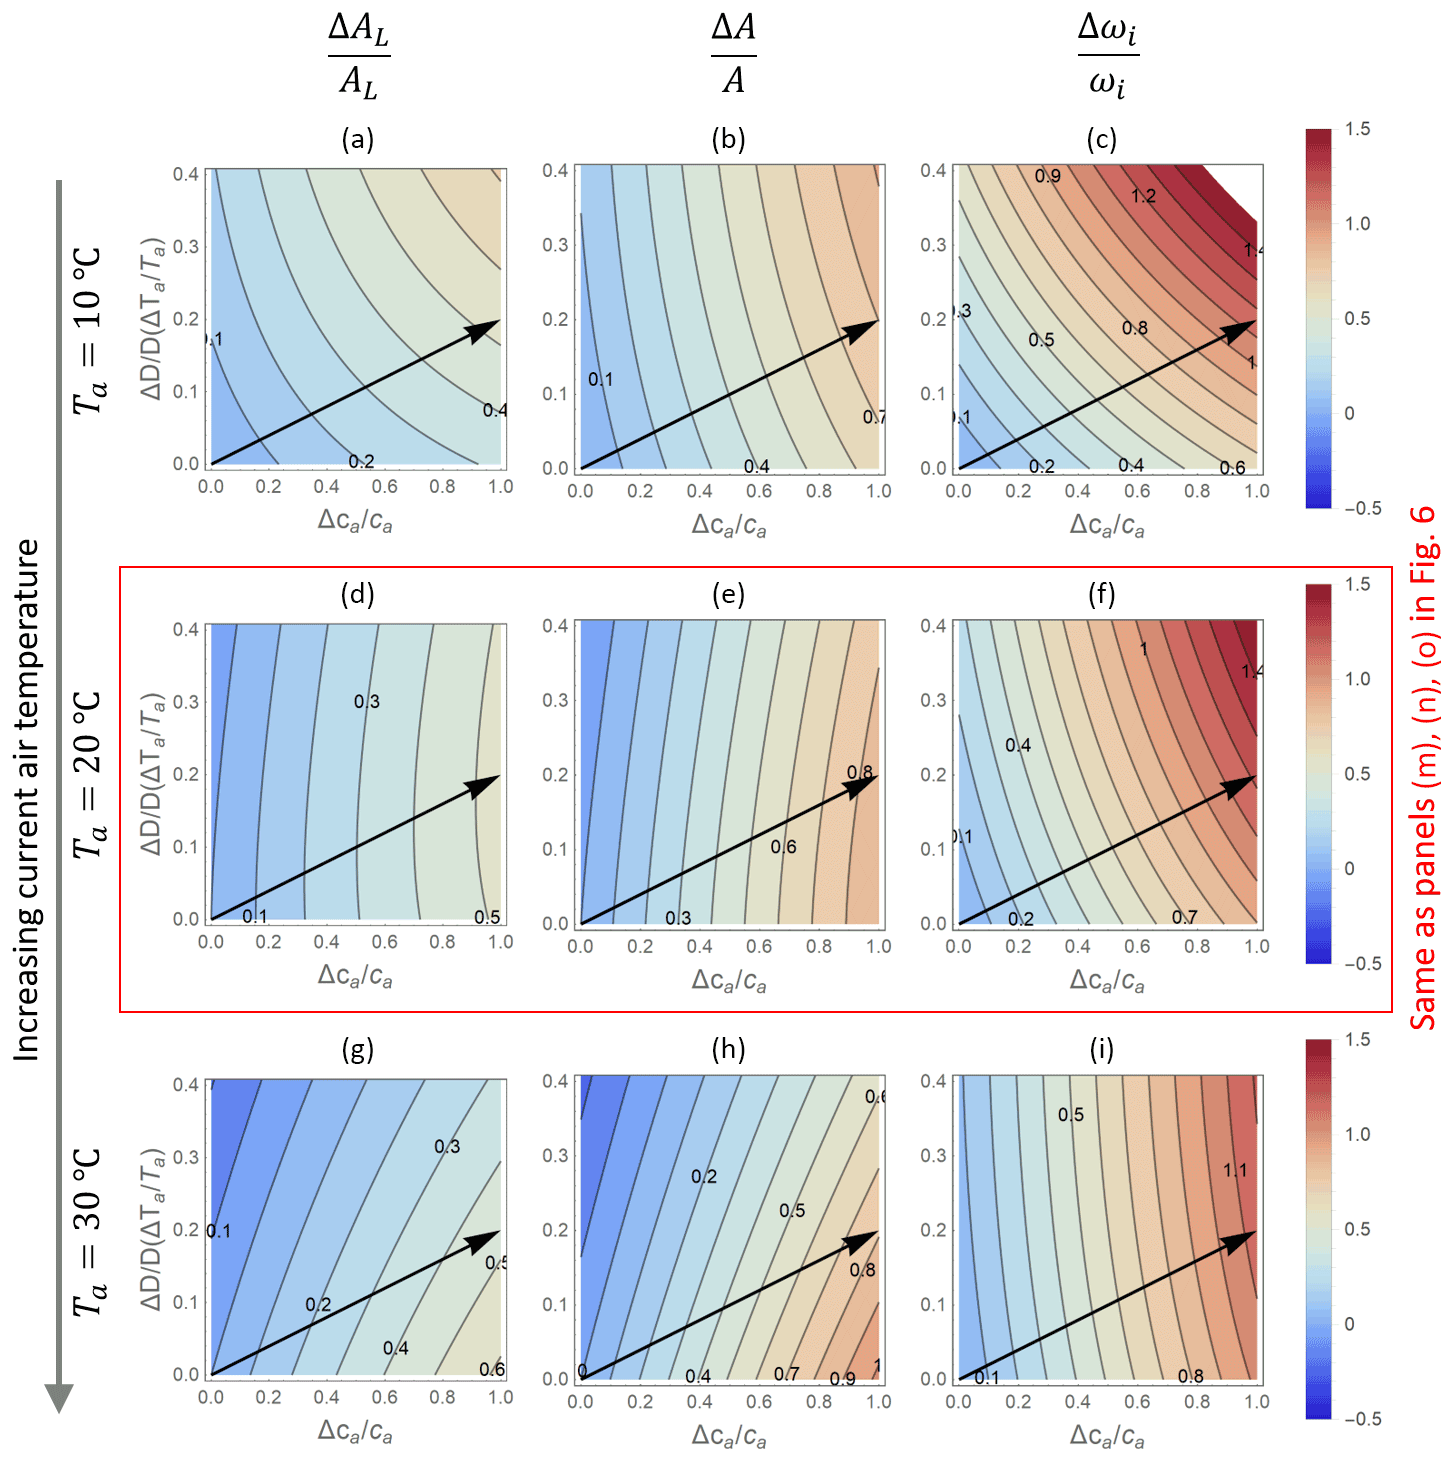
Figure 7Contour plots of relative changes in leaf- (AL; a, d, g) and canopy-level (A; b, e, h) net CO2 assimilation rates, as well as intrinsic water use efficiency (ωi; c, f, i) as a function of relative changes in atmospheric CO2 concentration ca (x axis) and vapour pressure deficit D (y axis), as predicted by the optimal stomatal control model OPT2. The baseline temperature used to calculate relative changes is increased from (a)–(c) (Ta=10 ∘C) to (g)–(t) (30 ∘C), with (d)–(f) corresponding to Fig. 6m–o (Ta=20 ∘C). Changes in D are expressed as a function of changes in temperature Ta at constant relative humidity (increasing from top to bottom to keep the same baseline VPD). Other parameters are as in Fig. 6.
Changing the length of the mean dry period leads to contrasting responses of the PETA and optimization models (Fig. 8), mostly because PETA does not include any effect of soil moisture on the CO2 responses (i.e. predicted responses are independent of td; Fig. 8a–e). In the optimization model, for a given ca, longer dry periods lower all gas exchange rates (Fig. 8f–i) while increasing the intrinsic water use efficiency (Fig. 8j). Following a hypothetical trajectory of increasing ca and td (solid arrows in Fig. 8f–j), the lengthening of the dry periods – similar to increasing VPD – reduces the positive effect of elevated CO2 on net CO2 assimilation compared to a scenario where only ca is increased. The opposite pattern occurs if we assume wetting (shorter td) is associated with elevated CO2 (dashed arrows in Fig. 8f–j).
4.1 Water availability constrains leaf and canopy transpiration responses to atmospheric CO2 (question 1)
Vegetation acclimates and adapts to increasing atmospheric CO2 concentration by adjusting tissue-level traits, biomass allocation, and ultimately community composition. Even in a CO2-fertilized world, several other resources might limit vegetation growth, including light, nutrients, and water. It is therefore reasonable to expect that growth patterns will adjust so that the available resources are used effectively. These adjustments might occur at different biological levels and temporal scales (organ, whole plant, community) and can be large and possibly of opposite sign. However, we can expect that their net effects converge towards an effective use of any limiting resource in addition to carbon. As a result, despite potentially large variations in individual plant traits, limiting resources would be utilized to the maximum extent possible. In other words, quoting out of context, “Se vogliamo che tutto rimanga com'è bisogna che tutto cambi” (for everything to remain as it is, everything must change) (Tomasi di Lampedusa, G., 1958, Il Gattopardo).
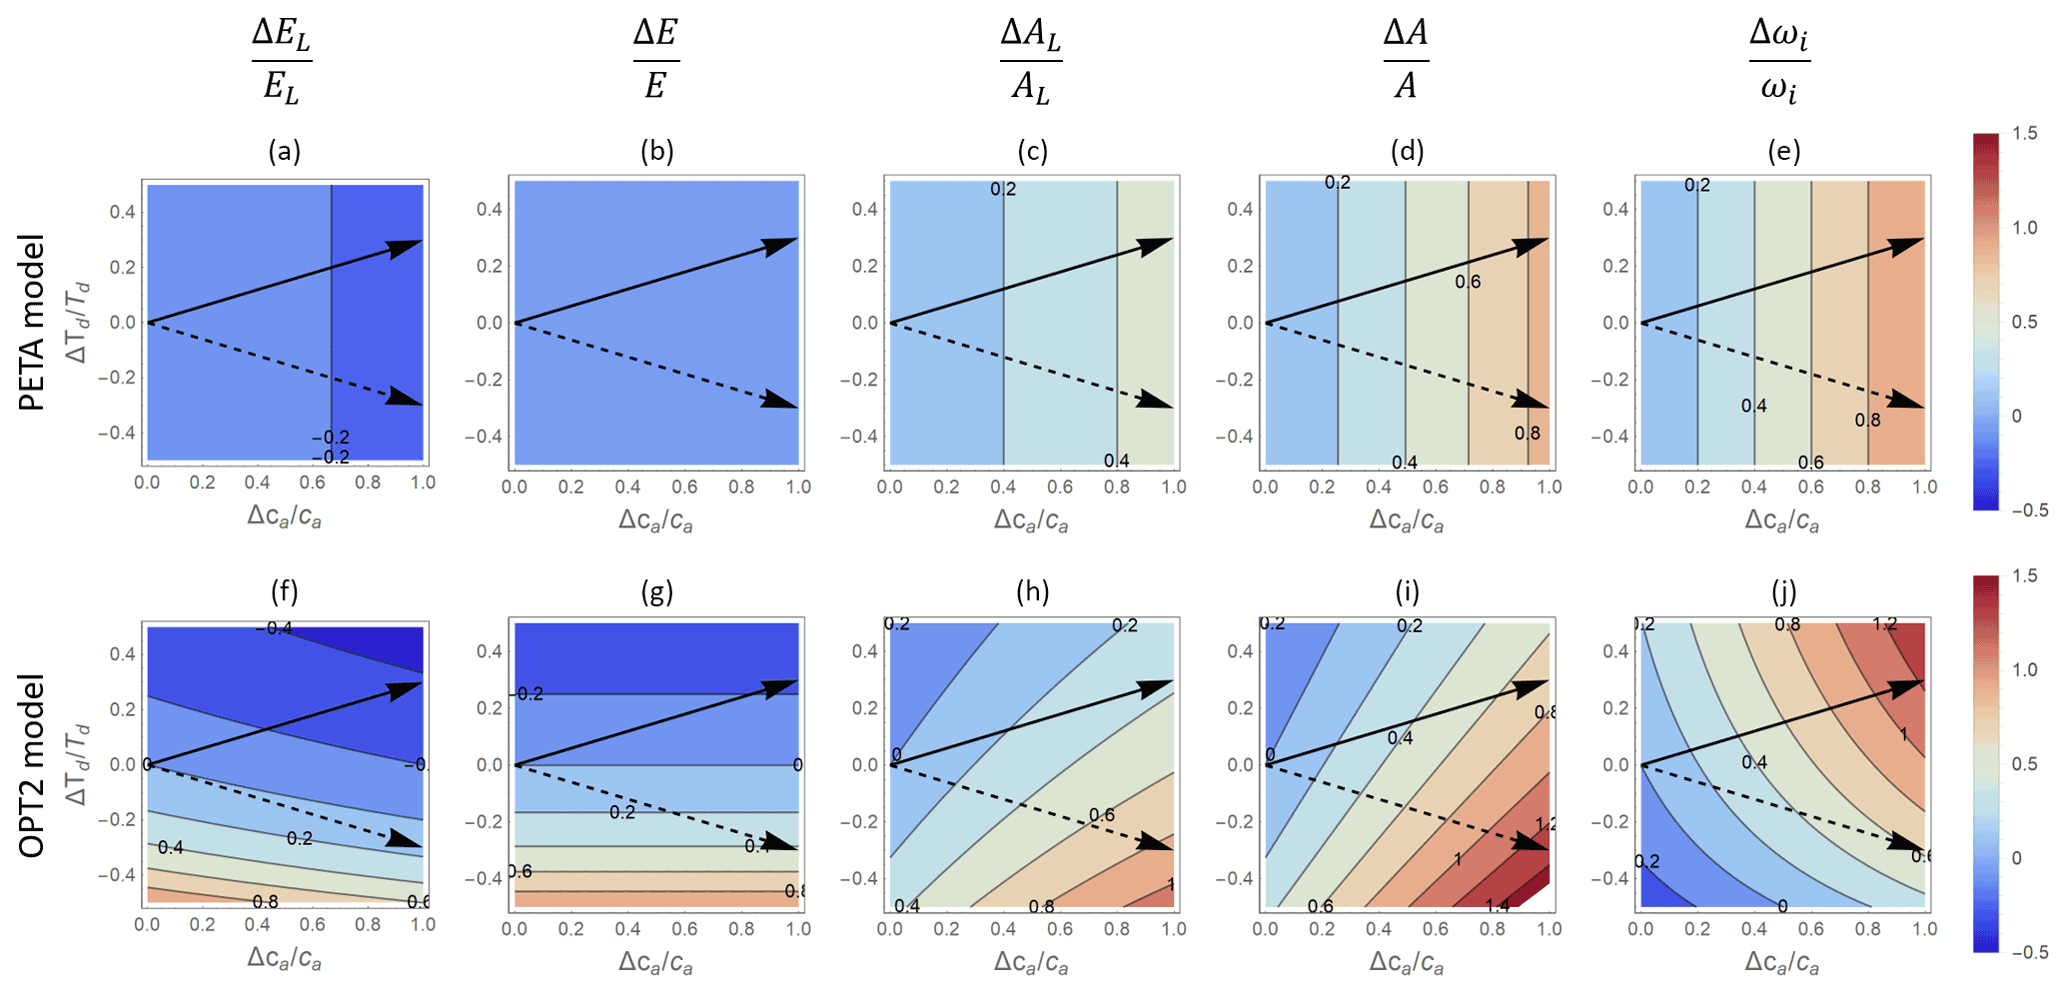
Figure 8Contour plots of relative changes in leaf-level (a, c, f, h) and canopy-level (b, d, g, i) gas exchange rates as a function of relative changes in atmospheric CO2 concentration ca (x axis) and dry-period length td (y axis), as predicted by the PETA model (top panels) and the optimal stomatal control model OPT2 (bottom panels): (a, f) leaf-level transpiration rate (EL), (b, g) canopy-level transpiration rate (E), (c, h) leaf-level assimilation rate (AL), (d, i) canopy-level assimilation rate (A), and (e, j) intrinsic water use efficiency (ωi). Leaf area index varies with ca and D according to Eq. (6) with α=0.5. Black arrows indicate hypothetical temporal trends in td and ca in locations where td will lengthen (solid arrow) or shorten (dashed arrow) as ca increases. The vapour pressure deficit is assumed to be constant and equal to the baseline value (Table 2).
Both the PETA and dynamic feedback optimization models predict that in fully acclimated plants and for a given soil water availability and VPD, increasing atmospheric CO2 concentration will cause a decrease in leaf-level transpiration and have no effect on transpiration at the canopy level. This is in contrast to short-term responses in which stomatal conductance and thus leaf-level transpiration were observed to decrease under elevated CO2 concentrations, when plants are not yet fully acclimated. However, PETA and optimization model predictions are consistent with both long-term observations in presumably fully acclimated plants (Schäfer et al., 2002) and results from other, more detailed models (Fatichi et al., 2016). The decreased sensitivity of transpiration rate to elevated CO2 is expected in the long-term when allowing plant or community-averaged traits besides stomatal conductance to optimally acclimate (or adapt) because constraints in resources other than CO2 become important and ultimately determine gas exchange and plant growth (Schymanski et al., 2015). Predicting long-term gas exchange under elevated CO2 thus requires considering the full spectrum of plant adjustments, especially in ecosystems where water is a known limiting factor.
If indeed plants adjust leaf area and stomatal conductance to use the available water, in semiarid or seasonally dry ecosystems, soil moisture values should be stable in long-term CO2 enrichment experiments. However, soil moisture can be higher under elevated CO2 conditions, contradicting the assumption of the optimization model (Lu et al., 2016a; Fay et al., 2012). Water availability increases as observed in these studies might occur only in the short-term because CO2 enrichment had not been running long enough for plants and communities to fully acclimate. Moreover, our simplified model does not include intra- or inter-specific competition occurring in response to elevated CO2 (e.g. Fay et al., 2012), which can alter water use strategies by intensifying water consumption at high soil moisture (Manzoni et al., 2013) and therefore cause a deviation from the optimal stomatal conductance behaviour we derived here. Other empirical evidence instead supports the assumption that soil water is a main constraint for transpiration – especially in water-limited ecosystems where atmospheric demand is high and where evapotranspiration tends to match precipitation on an annual basis (Williams et al., 2012) or even exceed it during the growing season due to soil water storage.
Both the PETA and optimization models predict increasing leaf- and canopy-level net CO2 assimilation rates with increasing ca – a well-known response (Ainsworth and Long, 2005; Norby et al., 1999). As a consequence of combined changes in transpiration and net CO2 assimilation, WUE and intrinsic WUE also increase. Indeed, changes in WUE estimated from flux towers and isotope composition of tree rings can be more than proportional (Keenan et al., 2013; Mastrotheodoros et al., 2017) or almost proportional to changes in ca (Dekker et al., 2016; Frank et al., 2015; Lavergne et al., 2019). Our results suggest relative changes in intrinsic WUE between 0.15 and 0.29 % ppm−1 with the lower values when VPD is assumed fixed and higher values when it increases together with CO2 concentration (Figs. 6 and 7). Values reported in previous studies tend to overlap to this range or be higher: 0.22 %–0.35 % ppm−1 (for broadleaf and conifers, respectively; Frank et al., 2015), 0.3 %–0.75 % ppm−1 (with variation between angiosperms and conifers and among climates; Adams et al., 2020), 0.41 % ppm−1 (Penuelas et al., 2011), 0.44 % ppm−1 (Saurer et al., 2014), 0.52 % ppm−1 (Dekker et al., 2016). Our estimates were obtained without any parameter adjustment (for the PETA model, only α could be adjusted; for the optimization model, physiological and soil parameters could be varied within reasonable ranges). Therefore, we consider the predictions of intrinsic WUE sensitivity accurate, given the simplicity of our approach.
4.2 Atmospheric CO2 and vapour pressure deficit interact in defining gas exchange responses (question 2)
The effect of elevated atmospheric CO2 is mediated by changes in other environmental variables related to water availability, such as VPD and the duration of dry periods. For a given ca, increasing VPD has little or no effect on transpiration rates because, in the PETA model, relative changes in VPD have small effects on WUE (they appear under the square root of Eq. 5) and hence on EL (Eq. 6). If gas exchanges were only controlled by diffusion (without leaf internal CO2 drawdown by photosynthesis), VPD would have a stronger effect on transpiration rates, as shown in Appendix A for the case of the PETA model. Similarly, minor VPD effects in the optimization model are due to soil water constraining transpiration, with stomatal conductance adjusting accordingly. Indeed, because of this constraint, , where D is interpreted as the long-term mean VPD (Eq. 21). Had we calculated λ from long-term environmental conditions (so that λ is a constant in OPT2 or OPT3) and then let VPD vary for given ca, LAI, and other conditions to simulate short-term VPD responses, we would have instead obtained , consistent with observations in short-term measurements. In fact, the declines in stomatal and canopy conductance with increasing D when all other environmental conditions are fixed were well captured by with m=0.5–0.6 (Oren et al., 1999). This logarithmic relation can be approximated by (Katul et al., 2009). Confirming these results, in a recent meta-analysis, increasing VPD decreased g and net CO2 assimilation rate but increased leaf transpiration rate (Lopez et al., 2021). However, in the same study, the plant-level transpiration rate also increased with VPD, with a saturating effect, which is in contrast with the model-predicted small increase (according to PETA) or no change (according to optimization) in E as VPD increases (Fig. 6). More complex canopies and structural adjustments not considered here – e.g. rooting depth (see Appendix C) – might allow plants to access more water when the evaporative demand is higher, explaining higher-than-predicted plant-level transpiration in that meta-analysis.
Reductions in g cause less-than-proportional reductions in net CO2 assimilation rates (Eq. 3), resulting in increasing intrinsic WUE with increasing VPD for a given ca. Such a response was observed at the ecosystem level, regardless of changes in soil moisture, leading to the projection (under RCP 8.5) that intrinsic WUE could increase by 10 % to 35 % by 2100 because of the increase in VPD alone (Zhang et al., 2019), in line with results in Fig. 6.
Increasing VPD (driven by either temperature or relative humidity) in conjunction with ca has limited effects on transpiration rates and increases the sensitivity of intrinsic WUE to ca in both models (Fig. 6), whereas the sensitivity of net CO2 assimilation varies with temperature in the optimization model (Fig. 7). This temperature effect is caused by the direct temperature dependence of photosynthetic kinetics (Medlyn et al., 2002) and the indirect effect via VPD. As the growth temperature is increased (i.e. moving towards lower latitudes), the optimization model predicts decreasing sensitivity of net CO2 assimilation to changes in ca when VPD variations are driven by warming. Lower sensitivities at high growth temperatures are due to negative effects of warming on photosynthesis implemented in the model as the growth temperature moves beyond the thermal optimum of photosynthesis. At timescales beyond weeks to months, photosynthesis is expected to acclimate to warming, increasing the thermal optimum, although not as much as temperature itself (Vico et al., 2019; Smith et al., 2020; Kumarathunge et al., 2019). Accounting for thermal acclimation (which we have neglected) could thus partly compensate for the warming-induced decline in sensitivity of net assimilation to ca, but warming could also have other consequences that are not considered here. For example, warming can lengthen the growing season and change nutrient availability and biomass allocation to leaves vs. roots (Way and Oren, 2010), which in turn might affect the equilibrium LAI and photosynthetic capacity. Considering all these factors is beyond the scope here, where we restricted temperature effects to the kinetics of photosynthesis and warming-induced air drying.
4.3 Atmospheric CO2 and dry-down duration interact in defining gas exchange responses (question 2)
The dry-down duration affects the gas exchange response to elevated ca only in the optimization model OPT2, where td appears explicitly in the equations. Not surprisingly, longer dry periods cause stomatal conductance to be downregulated, resulting in decreased gas exchange rates, while shorter ones increase them. This result is perhaps best understood by considering Eq. (21), where, all else being equal, . This prediction is a consequence of the assumption that plants have evolved to use all soil water during the hypothetical dry-down of duration td and that the total water storage during the dry period is fixed regardless of its duration. If longer td were instead associated with incomplete recharge, resulting in lowered initial soil moisture x0, the exponent of the vs. td relation would be even more negative. As a result, all gas exchange rates would decrease with lengthening of td faster than in Fig. 8. Notably, longer dry periods increase WUE because as stomata close, the slope of the AL(g) relation in our simple model steepens (Eq. 3). In fact, Eq. (2) suggests that for , AL(g)≈k ca, and (a minimum slope corresponding to no stomatal limitation). Conversely, when , AL(g)≈g ca, and , which is the maximum attainable slope when all CO2 taken up is also assimilated.
While typical rain exclusion experiments alter rewetting intensities more than dry-period durations, rainfall manipulations where the same amount of water is concentrated into fewer, more intense events could provide a suitable testing ground for these predictions. The advantage of these experiments compared to observations along a natural climatic gradient is that all conditions except rainfall event timing and amount are the same, as in our numerical experiments, where we let one or two factors vary at a time. Consistent with model results, both net CO2 assimilation rates and stomatal conductance decrease when rainfall frequency is reduced in a grassland ecosystem (Knapp et al., 2002; Fay et al., 2002). These reduced gas exchanges lower plant productivity but also promote allocation to roots when rainfall frequency is reduced (Fay et al., 2003), suggesting that flexible allocation to belowground tissues might complement the stomatal conductance and leaf area adjustments that are the focus of the simple models used here. Lower rainfall frequency (for given total precipitation) can also increase productivity in semi-arid ecosystems where fewer larger events promote soil moisture thanks to higher infiltration and lower evaporation from the soil surface (Heisler-White et al., 2008). These factors in the water balance were not explicitly considered here but can be important to determine the amount of available water, which in turn is the key constraint for stomatal responses to elevated atmospheric CO2.
4.4 Model assumptions and limitations
The choice of the specific limiting factor for photosynthesis leads to a range of optimal stomatal conductance solutions as a function of the Lagrange multiplier λ and other environmental conditions. Equation (3) assumes that the net CO2 assimilation rate depends linearly on leaf internal CO2 concentration, with an additional effect of atmospheric CO2 concentration that allows capturing the nonlinear nature of the A−ci curve. Other assumptions can be imposed, including light-limited (Medlyn et al., 2011) or CO2- and light-co-limited photosynthesis (Vico et al., 2013; Dewar et al., 2018). The resulting stomatal conductance can be mathematically similar to or different from Eq. (10), and in particular with contrasting dependencies on atmospheric CO2 concentration. For example, the optimization model OPT2 that we selected for its mathematical simplicity does not correctly predict the short-term stomatal closure observed when atmospheric CO2 concentration is increased (Fig. 4a). This is a known pathology of this formulation (Medlyn et al., 2011; Katul et al., 2010; Buckley and Schymanski, 2014), but assuming RuBP-limited photosynthesis or co-limitation also leads to the same issue, even though it appears at lower ca (Vico et al., 2013; Dewar et al., 2018). Interestingly, also optimizing to maximize carbon gains minus water transport costs per unit of net CO2 assimilation (Prentice et al., 2014) results in increasing stomatal conductance with ca at pre-industrial ca values (Fig. S2 in Joshi et al., 2022). In the stomatal optimization models, these erroneous responses arise because at low CO2 concentration a small increase in stomatal conductance results in large net CO2 assimilation gains compared to the higher water losses, resulting in the counterintuitive opening of stomata as atmospheric CO2 concentration is increased. This issue appears when λ is fixed (i.e. using the instantaneous optimization approach without acclimation), instead of being determined while solving the optimization problem or being heuristically increased at higher CO2 concentration (Katul et al., 2010; Manzoni et al., 2011).
As long as the Hamiltonian of the optimization problem is independent of soil moisture (i.e. , the Lagrange multiplier is time invariant ( because a necessary condition for the optimization is (Manzoni et al., 2013). The numerical value of this time-invariant λ can be determined by imposing the condition that all available water is used by the end of the dry period. Accounting for this constraint and thus calculating λ in Eq. (10) (or any analogous formulations based on other assumptions) leads to an optimal stomatal conductance value that essentially reflects the constraint imposed on water availability (Eqs. 11 or 13) – regardless of the assumed kinetics of photosynthesis. In turn, this means that any assumption on the factor limiting photosynthesis will lead to the same optimal stomatal conductance value as long as the Lagrange multiplier is solved for within the optimization problem. Therefore, the predictions of the optimization model after imposing the constraint of limited water availability are expected to be similar for any choice of the net CO2 assimilation model.
Other models based on instantaneous maximization of C gains for given costs offer alternative frameworks to predict responses to atmospheric CO2 concentrations and other environmental changes (Sperry et al., 2017; Mencuccini et al., 2019; Huang et al., 2018; Bassiouni and Vico, 2021; Prentice et al., 2014; Joshi et al., 2022). For example, the model based on Prentice et al. (2014) correctly predicts the observed short-term decrease in stomatal conductance under elevated atmospheric CO2 (Eq. C1 in Stocker et al., 2020) without invoking leaf area adjustments. While these approaches are physiologically plausible in the way they balance instantaneous C gains and losses, and their predictions compare well with observed trends, they do not guarantee that the water use is optimal over a given time interval. In other words, instantaneous maximization models rest on the assumption that future C gains are so uncertain that maximizing short-term gains is more convenient (in an evolutionary sense). In contrast, models based on optimal control theory rest on the assumption that future gains are expected because climatic conditions are to some degree predictable (rain on average occurs every td days) or that plant responses have been adapted to “anticipate” these long-term, probabilistic conditions. These approaches can be seen as end-member cases along a continuum or of possible optimization strategies.
In more complex models, it was assumed that not only stomatal conductance, but also LAI or rooting depth were optimized to reach a certain objective (typically maximize long-term productivity) (Schymanski et al., 2015). Here instead, LAI was prescribed – not optimized – as a function of ca and environmental conditions as reflected by α. Combining stomatal and leaf area optimization would have resulted in a more complex model that would have been difficult to compare to the PETA model. Rooting depth or root density were also not optimized nor were they varied in the analyses shown in Fig. 5–8 as they are not included as parameters in the PETA model. However, deeper or denser roots might allow access to a larger soil water store. If elevated CO2 increases leaf area and plant size overall, allometric relations would predict a corresponding increase in root biomass and spatial extent (see Chapter 6 in Hunt and Manzoni, 2015; Kempes et al., 2011). Consistent with this expectation, an optimality model predicted deeper roots and higher root area indices under elevated CO2, which supplied water to support higher transpiration rates than seen under ambient CO2 (Schymanski et al., 2015). These arguments are developed in Appendix C, where we show that the optimal stomatal conductance would be less sensitive to elevated CO2 compared to Fig. 5–8 if deeper roots develop under elevated CO2, resulting in a slight positive effect of elevated CO2 on transpiration. However, these deviations are minor for realistic values of the exponent of the rooting depth vs. leaf area index relation.
Besides root allocation, we also neglected evaporation from the soil or canopy surface. Changes in LAI do not affect strongly the partitioning of evapotranspiration into transpiration and evaporation, thanks to two compensating mechanisms: with increasing LAI, interception and subsequent evaporation from leaf surfaces increase, while heating of the soil surface is reduced, thus also reducing evaporation (Fatichi and Pappas, 2017; Paschalis et al., 2018). Therefore, even without explicitly modelling evaporation from the soil, the relative changes in gas exchange (as presented here) should be correctly predicted.
For simplicity, we restricted our analysis to deterministic conditions – a single “representative” dry-down with prescribed initial and final soil moisture states and duration. All these features of dry periods should be treated as stochastic because rainfall timing and amounts are inherently stochastic (Rodriguez-Iturbe and Porporato, 2004). Stomatal optimization can be studied also in a stochastic rainfall scenario consisting of consecutive dry-downs of random initial states and durations, where rainfall is characterized by a constant mean event frequency and daily intensity. Under long-term steady-state conditions, the optimization of CO2 assimilation integrated over an infinite time period can be replaced by the integral over all possible states of the stochastic processes (i.e. over all values of stochastic soil moisture) (Lu et al., 2016b, 2020). The resulting solution reflects the expected stomatal behaviour under the probabilistic (in contrast to deterministic) temporal evolution of soil moisture. Stomatal conductance and transpiration rate were predicted to increase with mean annual precipitation (especially so with high rainfall frequency for given total precipitation), with a saturation effect at high precipitation. Moreover – and consistent with our results – optimal water use under stochastic rainfall was not predicted to change under elevated atmospheric CO2. Similarly, plants should evolve towards more intensive use of water when rainfall frequency or amount per event increases, at least in recruitment-limited plant communities (Lindh and Manzoni, 2021). This effect is qualitatively similar to our prediction of higher transpiration with increasing water storage capacity.
Despite increasing atmospheric CO2 concentration and VPD, only small changes in canopy-scale evapotranspiration have been observed or predicted by vegetation models (Fatichi et al., 2016; Knauer et al., 2017; Yang et al., 2021). That long-term transpiration is a “conserved” hydrological quantity had been already noted when comparing forests under current climatic conditions (Roberts, 1983), suggesting that vegetation acclimates in such a way as to maintain stable transpiration under a given climate. This behaviour could be the result of a number of compensatory feedback mechanisms, including acclimation of leaf area together with stomatal conductance. We quantified the consequences of simultaneous changes in stomatal conductance and leaf area for gas exchange by means of two analytical models of stomatal conductance and their variants: PETA and stomatal optimization. Both model approaches predict low sensitivity of canopy transpiration rates to a changing climate, indicating that morphological adjustments (leaf area increase) compensate physiological adjustments (stomatal closure). However, this similar outcome is due to different reasons. In the PETA model, this was the result of a set of heuristic assumptions on how gas exchange varies with leaf area and water use efficiency, whereas, in the optimization models, this stemmed from water availability setting constraints on canopy transpiration. Moreover, when leaf area increases in response to elevated CO2, stomata close according to the optimization models, regardless of the chosen formulation for net CO2 assimilation. With stable transpiration and predicted increases in net CO2 assimilation rates in both model approaches, intrinsic water use efficiency is also predicted to increase under elevated CO2. Finally, the sensitivity of net CO2 assimilation, and to some degree of intrinsic water use efficiency, to changes in CO2 concentration is mediated by warming-induced increases in VPD. Drier air is expected to decrease the positive effect of elevated CO2 concentrations on net CO2 assimilation and increase the CO2 effect on water use efficiency. However, at growth temperatures close to the photosynthetic thermal optimum, the positive effect of rising CO2 concentration on net assimilation is reduced because warming might cause a decline in assimilation rates. Increases in VPD, air temperature, and dry-down durations may have all contributed to the observation that the rate of intrinsic water use efficiency has increased more than proportionally to the current rise in atmospheric CO2 levels. Overall, these results imply that physiological and morphological traits acclimate to changing environmental conditions in a coordinated manner to ensure that limiting resources such as water are used efficiently.
To support the arguments in Sect. 4.2, a simplified version of the PETA model is derived here considering that, in free-air CO2 enrichment experiments, is roughly constant at a fixed VPD (Ainsworth and Long, 2005). This leads to instead of as postulated above to derive Eq. (5). This simplification is equivalent to ignoring the dependence of the intercellular to ambient CO2 concentration ratio on D (i.e. 1−χ is constant) and attributing the sensitivity to D to only diffusion through the stomata. With this assumption, a simplified PETA model is obtained in which
This simplified model can be used to separate the effects of diffusion limitations to gas exchange from either diffusion and biochemical limitations (using the full PETA model with ω calculated from Eq. 5, as shown in Fig. 6). By promoting CO2 transport from the atmosphere to the leaf, biochemical demand lowers the negative effect of stomatal closure at high VPD. Therefore, the combined effects of stomatal closure and biochemical limitations, which draw down leaf internal CO2 concentrations, would reduce the sensitivity of net CO2 assimilation and leaf and canopy transpiration to higher VPD at a fixed ca. In fact, combining the simplified Eq. (A1) with Eq. (6), we find , suggesting a stronger increase in EL with VPD compared to the case of compound diffusion and biochemical demand (i.e. . The relative change in leaf net assimilation (; Eq. 6) scales as when biochemical demand is accounted for (Eq. 5) and as when it is not (Eq. A1). Taking the ratio, we find that biochemical demand changes by a factor of and by a factor of compared to the case of simple gas diffusion, indicating that biochemical demand increases the sensitivities of gas exchange when increasing VPD.
To set up the optimal stomatal conductance model, we start from the assumption that plants regulate stomatal conductance (g) to maximize canopy-level net assimilation (A) during a typical dry-down period (td),
Because soil moisture (x) is depleted as plants transpire, the soil water balance (Eq. 9) is included as a constraint to the optimization. Maximizing CO2 assimilation at the leaf level would be mathematically equivalent (see Eq. 4) since leaf area index is not treated as a control variable but as a time-invariant parameter during a dry-down (as in, for example, Manzoni et al., 2013). However, plants can still alter allocation and thus leaf area in response to atmospheric CO2 concentration at climatic timescales (years to decades), which are much longer than the daily to weekly scales at which the optimization problem is formulated. This means that changes in leaf area are treated as a change in the model parameter L. In Eq. (B1), the leaf net CO2 assimilation rate is explicitly written as a function of g and x to emphasize the dependence of both on the control variable (g) and the state variable representing the constraint (x). This optimal control problem can be solved by using the Euler–Lagrange formulation that reduces to maximizing the Hamiltonian (H) with respect to g. That is, defining the Hamiltonian as , we obtain
where the first term on the left-hand side of Eq. (B2) is ignored because H is independent of ; λ is the Lagrange multiplier, and in the second term E is the sum of all fluxes of water lost from the soil (in this case, only the transpiration rate), expressed in mol H2O (m2 ground)−1 s−1. With this choice of units for the water loss term, λ is expressed in µmol CO2 (mol H2O)−1. Other choices for the units of A and E would not affect the results of the following calculations, except for the numerical value of λ. Three variants of the optimization model can now be described, as explained in Sect. 2.3 and illustrated in Fig. 1: (i) instantaneous optimization (undetermined λ; OPT1), (ii) dynamic feedback optimization with transpiration continuing till plant-available soil water is depleted (λ derived mathematically; OPT2), and (iii) dynamic feedback with transpiration reduced in dry soil (λ derived mathematically; OPT3). In this Appendix we focus on the derivations of OPT2 and OPT3.
B1 Derivation of OPT2: dynamic feedback optimization with transpiration rate independent of soil moisture
A more realistic approach that overcomes the limitation of a freely adjustable λ is determining the value of λ by imposing the constraint that the initial soil moisture x0 is depleted, leaving only xT at the end of the time interval td. This means that we impose as the soil moisture at the end of the dry-down described by Eq. (9), where transpiration depends on gopt(λ) from Eq. (10); i.e. . With this constraint in place, the only unknown is λ, which is found as (Manzoni et al., 2013)
The linear scaling of λ with ca in Eq. (B3) is not externally imposed (as in Katul et al., 2010) but is an emergent property of the optimization with limited water availability. In this sense, λ is not simply an adjustable parameter (as it has been treated previously, as in OPT1), but rather a clearly defined property of the coupled soil–plant system, including the amount of water available in the soil. Substituting Eq. (B3) into Eqs. (10) and (3), the values of optimal stomatal conductance and optimal leaf-level CO2 assimilation rate are found as (solid line in Fig. 2a)
Using the optimal stomatal conductance in Eq. (11), the soil water balance of Eq. (9) can be solved to obtain the time trajectory of soil moisture during the dry-down (solid line in Fig. 2b),
where, on the right-hand side, it is clear that the optimal solution leads to a linear decrease in soil moisture from the initial soil moisture x0 to the final value xT. When limited soil moisture constrains water flows, optimal stomatal conductance deviates from the time-invariant value of Eq. (11), leading to a nonlinear decrease in x during a dry period, as explained in OPT3.
B2 Derivation of OPT3: dynamic feedback optimization with transpiration rate limited by soil moisture
The decrease in transpiration during drying is often included in soil–plant–atmosphere models through a piecewise linear function, representing water-stress-induced reductions in E (Federer, 1979; Sloan et al., 2021). These observations motivate the inclusion of a further constraint in the optimization relative to OPT1 and OPT2, in the form of a soil-moisture-limited transpiration rate under dry conditions that effectively constrains the allowable range of stomatal conductance (Manzoni et al., 2013),
Here, the subscript “w” refers to water-limited conditions, ν adjusts the units so that Ew has the same units as E (i.e. mol H2O (m2 ground)−1 s−1), and κ is a coefficient with units of “per day” (d−1) that captures the effect of limited rate of water supply from the bulk soil to the roots. For simplicity, κ can be approximated as the saturated hydraulic conductivity (m d−1) divided by the soil water storage capacity w0 (m). This approximation implies that Ew scales linearly with soil moisture, thus neglecting the nonlinear effect of soil moisture on hydraulic conductivity under unsaturated conditions (Mualem, 1986). Therefore, we expect slower reductions in transpiration as soil dries compared to using a nonlinear relation between Ew and x.
Since (Eqs. 1 and 4), and the water flux through the soil–plant–atmosphere continuum is conserved at the daily (or longer) timescale, we can equate water supply from the soil (Ew) and demand by the canopy (E) and obtain Ew=agDL, where g is different from the optimal value due to the limited water supply from the soil. Solving for g yields the stomatal conductance under water-limited conditions (dashed line at low x in Fig. 2c),
This value of stomatal conductance represents a so-called “boundary” for the optimization problem. Because the transpiration rate is a linear function of soil moisture (Eq. B7), the time trajectory of x in water-limited conditions is found by solving Eq. (9) as (dashed line at in Fig. 2b),
where t is measured since the beginning of the dry period, and x∗ and t∗ are respectively the soil moisture and the time at the transition between well-watered and water-limited regimes (open circles in Fig. 2). The stomatal conductance at the transition point is also found by substituting in Eq. (12).
Next, we can determine x∗, t∗, and λ∗. Three equations are set up to match the optimal solution under well-watered conditions and the water-limited solution in dry conditions: (i) a continuity condition for stomatal conductance, (ii) a continuity condition for soil moisture, and (iii) a constraint on the amount of soil water left at the end of the dry period (set at xT as in OPT2):
The system of Eqs. (B9)–(B11) can be solved to obtain the unknowns x∗, t∗, and λ∗ (and thus also gopt for the initial phase at . To this aim, Eqs. (B9) and (B10) are solved as a function of t∗,
whereas the remaining condition in Eq. (B11) can be solved numerically for t∗ for a given x∗ (open circles in Fig. 2). Because optimal g is time-invariant for , we can also conclude that for any t before the breakpoint t∗. This solution of the optimization problem based on the continuity equations at the boundary between well-watered and water-limited regimes leads to the same result obtained by adding a Lagrange multiplier within the Hamiltonian to account for the constraint of Eq. (12) (Manzoni et al., 2013).
To summarize the solution of the OPT3 model (dashed lines in Fig. 2), optimal stomatal conductance is initially constant and equal to (Eq. 13), until soil moisture becomes limiting at x∗. At this point, stomatal conductance is constrained by water supply from the soil and is given by gw (Eq. 12). The more limiting the water supply, the longer the time under water limitation and the higher is in the initial phase of the dry-down to ensure that all the soil water is used. After calculating stomatal conductance, transpiration and net CO2 assimilation rates are obtained using Eqs. (1) and (3) as before.
In this Appendix, we explore the consequences of coordination between rooting depth (Zr), which affects the soil water storage capacity (w0), and leaf area index (L) on gas exchange predicted by the stomatal optimization model OPT2. We start by showing theoretical and empirical evidence for relations between Zr and L and then demonstrate analytically their consequences on optimal stomatal conductance and thus on net assimilation and transpiration rates.
Aboveground biomass (including leaves) and Zr co-vary during plant growth as deeper roots are necessary to acquire soil resources and to stabilize the plant as it grows. To account for this coordinated allocation above and below ground, a scaling relation controlled by the exponent β can be postulated,
Allometric theory predicts that plant leaf area scales as plant height to the third power and that root extent (lateral and vertical) scales linearly with height (Kempes et al., 2011). It follows that Zr of an individual plant should scale as leaf area to , or – for a given plant density – Zr at the plant population level should scale with L with . Data from herbaceous vegetation suggest β=0.40 – significantly higher than , though numerically close (Fig. C1a). These data were obtained from plants growing over a few months only and without physical limits to root extension. Therefore, this scaling relation can be regarded as an extreme case of coordination between rooting depth and leaf area. However, a shallow bedrock, hard pans, groundwater, or permafrost set physical limits to the vertical extent of roots, suggesting that in adult trees with constrained root extent, β=0. Indeed, trends in Zr with leaf area as tree size (and thus age) increases are not as well defined as for herbaceous vegetation growing in unconstrained soil (Pirtel et al., 2021), and the scaling exponent approaches zero (Fig. C1b). It should be noted that the number of data points for trees is limited, leading to high uncertainty in β because most studies on root-leaf coordination compare species rather than following changes in rooting depth and leaf area as trees age. Between these two end-member cases – coordinated rooting depth and leaf area with β≈0.4 vs. fixed, physically constrained rooting depth) – we expect a range of plausible relations between leaf area index and rooting depth.
Equation (11) shows that the optimal stomatal conductance scales as the ratio of w0 over L, where w0 is the product of Zr, soil porosity, and difference in saturation between field capacity and wilting point. Therefore, accounting for the possible coordination of w0 and L via Eq. (C1), the leaf area effect on stomatal conductance becomes
This equation indicates that optimal stomatal conductance is inversely related to L (and thus atmospheric CO2 concentration) as long as β<1, which is likely the case based on the results shown in Fig. C1. When β=0 (i.e. Zr independent of L), the analytical solution used in the main text is recovered. When β increases, the effect of higher L on stomatal conductance decreases, which in turn alters the predicted optimal stomatal conductance–atmospheric CO2 concentration relations, as illustrated in Fig. C2. Increasing values of β reduces the LAI-mediated negative effect of elevated CO2 on optimal stomatal conductance and leaf transpiration (Fig. C2a), creates a positive CO2 effect on canopy transpiration (which is insensitive to CO2 concentration when β=0) (Fig. C2b), and enhances the positive CO2 effect on both leaf and canopy net assimilation (Fig. C2c–d). In contrast, the positive CO2 effect on water use efficiency is reduced when β>0. However, for reasonable values of β between 0 and 0.4, the effects on the CO2 responses are minor (green shaded area in Fig. C2), and only for unrealistically high β values (e.g. β=1; dotted curves in Fig. C2) does the response of stomatal conductance become flat and does that of canopy transpiration become large and positive.

Figure C1Maximum rooting depth as a function of leaf area during plant growth, as measured (a) across herbaceous wild and cultivated species and (b) in four groups of conifer tree species. Both root depth and leaf area are normalized by the maximum values for each species to allow a visual comparison (data from Sadras et al., 1989; Chilundo et al., 2017; Bell, 2005; Sheley and Larson, 1994; Pirtel et al., 2021; Kumar et al., 2013; Wasyliw and Karst, 2020). The red curves are allometric scaling relations obtained through nonlinear least square (NLS) fitting of the data: normalized root depth-normalized leaf areaβ (a β=0.40 (confidence interval: 0.37–0.44), R2=0.87; b β=0.14 (confidence interval: 0.03–0.25), R2=0.31). The dashed green curves are theoretical scaling relations with (Kempes et al., 2011). The dotted green curves represent the unrealistic case of isometric scaling (β=1), shown only for reference.
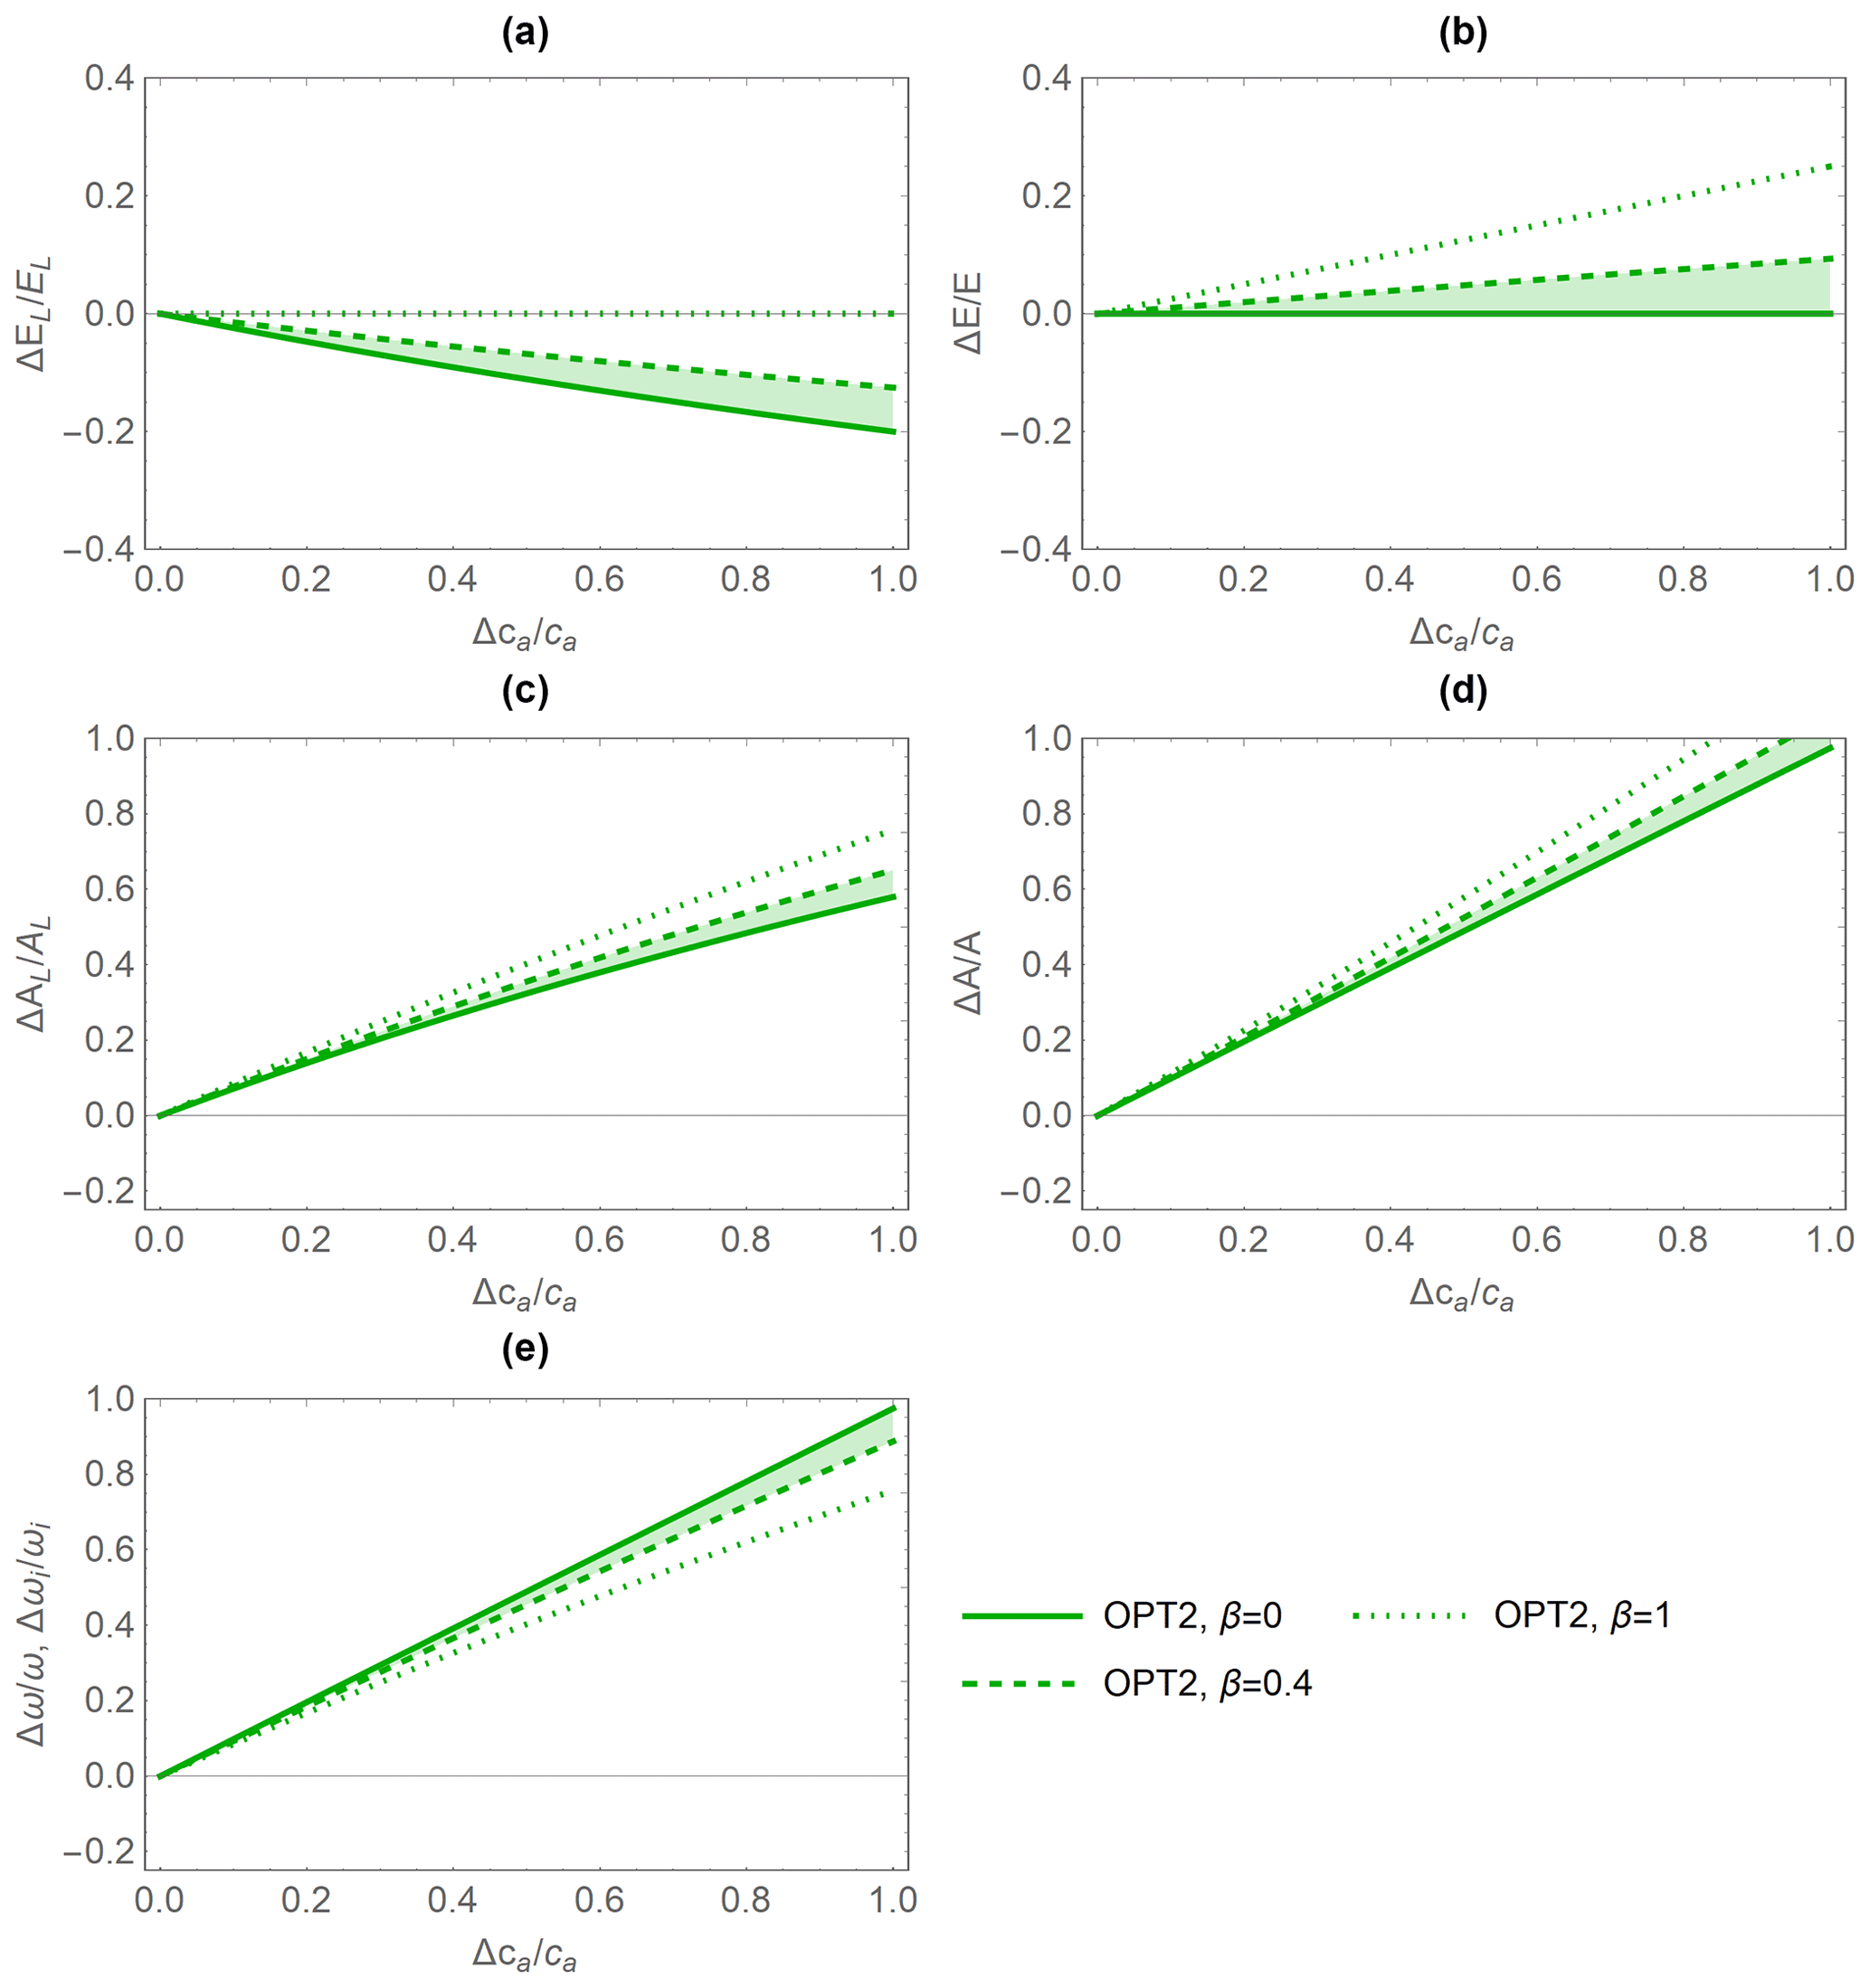
Figure C2Relative changes in leaf-level (a, c) and canopy-level (b, d) gas exchange rates as a function of relative change in atmospheric CO2 concentration ca, as predicted by the optimal stomatal control model OPT2 for different values of the root depth–leaf area scaling exponent (β): (a) leaf-level transpiration rate (EL), (b) canopy-level transpiration rate (E), (c) leaf-level assimilation rate (AL), (d) canopy-level assimilation rate (A), and (e) water use efficiency (ω). The solid lines correspond to the limiting case of fixed rooting depth (β=0); the dashed lines correspond to the empirically derived scaling exponent β=0.4; the dotted lines represent the unrealistic case of isometric scaling (β=1). The shaded area between the solid and dashed curves indicates the range of feasible outcomes. Vapour pressure deficit and dry-period length are fixed (Table 2); α=0.5.
Data shown in Fig. 3 are reported in the Supplement.
The supplement related to this article is available online at: https://doi.org/10.5194/bg-19-4387-2022-supplement.
SM, GGK, and GV designed the study, with feedback from all co-authors. SM developed the model, produced the results, and drafted the manuscript. All co-authors commented on the draft and contributed to the manuscript.
The contact author has declared that none of the authors has any competing interests.
This article is part of the special issue “Global change effects on terrestrial biogeochemistry at the plant–soil interface”. It is not associated with a conference.
Publisher’s note: Copernicus Publications remains neutral with regard to jurisdictional claims in published maps and institutional affiliations.
We thank Stanislaus J. Schymanski for his in-depth comments on an earlier version of the manuscript and Benjamin Stocker and an anonymous reviewer for insightful comments during the discussion phase. The “Discussion” section also benefitted from comments by Yair Mau and Yuval Bayer.
This research has been supported by the European Research Council, under the European Union’s Horizon 2020 research and innovation programme (grant no. 101001608 – SMILE to Stefano Manzoni); the Svenska Forskningsrådet Formas (grant nos. 2018-01820 and 2018-02787); the United States National Science Foundation (CAREER award DEB-2045610 to Xue Feng and AGS-2028633 to Gabriel Katul); and the United States Department of Energy (DE-SC0022072 to Gabriel Katul).
The article processing charges for this open-access publication were covered by Stockholm University.
This paper was edited by Emily Solly and reviewed by Benjamin Stocker and one anonymous referee.
Adams, M. A., Buckley, T. N., and Turnbull, T. L.: Diminishing CO2-driven gains in water-use efficiency of global forests, Nat. Clim. Change, 10, 466–471, https://doi.org/10.1038/s41558-020-0747-7, 2020.
Ainsworth, E. A. and Long, S. P.: What have we learned from 15 years of free-air CO2 enrichment (FACE)?, A meta-analytic review of the responses of photosynthesis, canopy properties and plant production to rising CO2, New Phytol., 165, 351–371, 2005.
Bader, M., Leuzinger, S., Keel, S., Siegwolf, R., Hagedorn, F., Schleppi, P., and Korner, C.: Central European hardwood trees in a high-CO2 future: synthesis of an 8-year forest canopy CO2 enrichment project, J. Ecol., 101, 1509–1519, https://doi.org/10.1111/1365-2745.12149, 2013.
Bassiouni, M. and Vico, G.: Parsimony vs predictive and functional performance of three stomatal optimization principles in a big-leaf framework, New Phytol., 231, 586–600, https://doi.org/10.1111/nph.17392, 2021.
Bell, L.: Relative growth rate, resource allocation and root morphology in the perennial legumes, Medicago sativa, Dorycnium rectum and D-hirsutum grown under controlled conditions, Plant Soil, 270, 199–211, https://doi.org/10.1007/s11104-004-1495-6, 2005.
Betts, R., Boucher, O., Collins, M., Cox, P., Falloon, P., Gedney, N., Hemming, D., Huntingford, C., Jones, C., Sexton, D., and Webb, M.: Projected increase in continental runoff due to plant responses to increasing carbon dioxide, Nature, 448, 1037–1041, https://doi.org/10.1038/nature06045, 2007.
Breinl, K., Di Baldassarre, G., Mazzoleni, M., Lun, D., and Vico, G.: Extreme dry and wet spells face changes in their duration and timing, Environ. Res. Lett., 15, 074040, https://doi.org/10.1088/1748-9326/ab7d05, 2020.
Buckley, T. N.: The role of stomatal acclimation in modelling tree adaptation to high CO2, J. Exp. Bot., 59, 1951–1961, 2008.
Buckley, T. N. and Schymanski, S. J.: Stomatal optimisation in relation to atmospheric CO2, New Phytol., 201, 372–377, https://doi.org/10.1111/nph.12552, 2014.
Campbell, G. S. and Norman, J. M.: An Introduction to Environmental Biophysics, 2 Edn., Springer, 286 pp., 1998.
Chilundo, M., Joel, A., Wesstrom, I., Brito, R., and Messing, I.: Response of maize root growth to irrigation and nitrogen management strategies in semi-arid loamy sandy soil, Field Crops Res., 200, 143–162, https://doi.org/10.1016/j.fcr.2016.10.005, 2017.
Cowan, I. and Farquhar, G. D.: Stomatal Function in Relation to Leaf Metabolism an Environment, Integration of Activity in the Higher Plants, Sym. Soc. Exp. Biol., 31, 471–505, 1977.
Cruiziat, P., Cochard, H., and Ameglio, T.: Hydraulic architecture of trees: main concepts and results, Ann. For. Sci., 59, 723–752, https://doi.org/10.1051/forest:2002060, 2002.
De Kauwe, M. G., Medlyn, B. E., and Tissue, D. T.: To what extent can rising [CO2] ameliorate plant drought stress?, New Phytol., 231, 2118–2124, https://doi.org/10.1111/nph.17540, 2021.
Dekker, S. C., Groenendijk, M., Booth, B. B. B., Huntingford, C., and Cox, P. M.: Spatial and temporal variations in plant water-use efficiency inferred from tree-ring, eddy covariance and atmospheric observations, Earth Syst. Dynam., 7, 525–533, https://doi.org/10.5194/esd-7-525-2016, 2016.
dePury, D. G. G. and Farquhar, G. D.: Simple scaling of photosynthesis from leaves to canopies without the errors of big-leaf models, Plant Cell Environ., 20, 537–557, 1997.
Dewar, R., Mauranen, A., Makela, A., Holtta, T., Medlyn, B., and Vesala, T.: New insights into the covariation of stomatal, mesophyll and hydraulic conductances from optimization models incorporating nonstomatal limitations to photosynthesis, New Phytol., 217, 571–585, https://doi.org/10.1111/nph.14848, 2018.
Donohue, R. J., Roderick, M. L., McVicar, T. R., and Farquhar, G. D.: Impact of CO2 fertilization on maximum foliage cover across the globe's warm, arid environments, Geophys. Res. Lett., 40, 3031–3035, https://doi.org/10.1002/grl.50563, 2013.
Donohue, R. J., Roderick, M. L., McVicar, T. R., and Yang, Y. T.: A simple hypothesis of how leaf and canopy-level transpiration and assimilation respond to elevated CO2 reveals distinct response patterns between disturbed and undisturbed vegetation, J. Geophys. Res.-Biogeo., 122, 168–184, https://doi.org/10.1002/2016jg003505, 2017.
Duursma, R., Gimeno, T., Boer, M., Crous, K., Tjoelker, M., and Ellsworth, D.: Canopy leaf area of a mature evergreen Eucalyptus woodland does not respond to elevated atmospheric [CO2] but tracks water availability, Global Change Biol., 22, 1666–1676, https://doi.org/10.1111/gcb.13151, 2016.
Farquhar, G. D., Caemmerer, S. V., and Berry, J. A.: A biochemical-model of photosynthetic CO2 assimilation in leaves of C-3 species, Planta, 149, 78–90, 1980.
Fatichi, S. and Pappas, C.: Constrained variability of modeled T:ET ratio across biomes, Geophys. Res. Lett., 44, 6795–6803, https://doi.org/10.1002/2017GL074041, 2017.
Fatichi, S., Leuzinger, S., Paschalis, A., Langley, J. A., Barraclough, A. D., and Hovenden, M. J.: Partitioning direct and indirect effects reveals the response of water-limited ecosystems to elevated CO2, P. Natl. Acad. Sci. USA, 113, 12757–12762, https://doi.org/10.1073/pnas.1605036113, 2016.
Fatichi, S., Peleg, N., Mastrotheodoros, T., Pappas, C., and Manoli, G.: An ecohydrological journey of 4500 years reveals a stable but threatened precipitation-groundwater recharge relation around Jerusalem, Sci. Adv., 7, eabe6303, https://doi.org/10.1126/sciadv.abe6303, 2021.
Fay, P. A., Carlisle, J. D., Danner, B. T., Lett, M. S., McCarron, J. K., Stewart, C., Knapp, A. K., Blair, J. M., and Collins, S. L.: Altered rainfall patterns, gas exchange, and growth in grasses and forbs, Int. J. Plant Sci., 163, 549–557, 2002.
Fay, P. A., Carlisle, J. D., Knapp, A. K., Blair, J. M., and Collins, S. L.: Productivity responses to altered rainfall patterns in a C4-dominated grassland, Oecologia, 137, 245–251, 2003.
Fay, P. A., Jin, V. L., Way, D. A., Potter, K. N., Gill, R. A., Jackson, R. B., and Polley, H. W.: Soil-mediated effects of subambient to increased carbon dioxide on grassland productivity, Nat. Clim. Change, 2, 742–746, https://doi.org/10.1038/NCLIMATE1573, 2012.
Federer, C. A.: Soil-plant-atmosphere model for transpiration and availability of soil-water, Water Resour. Res., 15, 555–562, https://doi.org/10.1029/WR015i003p00555, 1979.
Feng, X., Lu, Y., Jiang, M., Katul, G. G., Manzoni, S., Mrad, A., and Vico, G.: Instantaneous stomatal optimization results in suboptimal carbon gain due to legacy effects, Plant Cell Environ., PCE14427, https://doi.org/10.1111/pce.14427, 2022.
Ficklin, D. L. and Novick, K. A.: Historic and projected changes in vapor pressure deficit suggest a continental-scale drying of the United States atmosphere, J. Geophys. Res.-Atmos., 122, 2061–2079, https://doi.org/10.1002/2016JD025855, 2017.
Fowler, M., Kooperman, G., Randerson, J., and Pritchard, M.: The effect of plant physiological responses to rising CO2 on global streamflow, Nat. Clim. Change, 9, 873–879, https://doi.org/10.1038/s41558-019-0602-x, 2019.
Frank, D., Poulter, B., Saurer, M., Esper, J., Huntingford, C., Helle, G., Treydte, K., Zimmermann, N., Schleser, G., Ahlstrom, A., Ciais, P., Friedlingstein, P., Levis, S., Lomas, M., Sitch, S., Viovy, N., Andreu-Hayles, L., Bednarz, Z., Berninger, F., Boettger, T., D'Alessandro, C., Daux, V., Filot, M., Grabner, M., Gutierrez, E., Haupt, M., Hilasvuori, E., Jungner, H., Kalela-Brundin, M., Krapiec, M., Leuenberger, M., Loader, N., Marah, H., Masson-Delmotte, V., Pazdur, A., Pawelczyk, S., Pierre, M., Planells, O., Pukiene, R., Reynolds-Henne, C., Rinne, K., Saracino, A., Sonninen, E., Stievenard, M., Switsur, V., Szczepanek, M., Szychowska-Krapiec, E., Todaro, L., Waterhouse, J., and Weigl, M.: Water-use efficiency and transpiration across European forests during the Anthropocene, Nat. Clim. Change, 5, 579–583, 2015.
Hari, P., Mäkelä, A., Korpilahti, E., and Holmberg, M.: Optimal control of gas exchange, Tree Physiol., 2, 169–175, 1986.
Harrison, S. P., Cramer, W., Franklin, O., Prentice, I. C., Wang, H., Brännström, Å., de Boer, H., Dieckmann, U., Joshi, J., Keenan, T. F., Lavergne, A., Manzoni, S., Mengoli, G., Morfopoulos, C., Peñuelas, J., Pietsch, S., Rebel, K. T., Ryu, Y., Smith, N. G., Stocker, B. D., and Wright, I. J.: Eco-evolutionary optimality as a means to improve vegetation and land-surface models, New Phytol., 231, 2125–2141, https://doi.org/10.1111/nph.17558, 2021.
Heisler-White, J. L., Knapp, A. K., and Kelly, E. F.: Increasing precipitation event size increases aboveground net primary productivity in a semi-arid grassland, Oecologia, 158, 129–140, https://doi.org/10.1007/s00442-008-1116-9, 2008.
Huang, C.-W., Domec, J.-C., Palmroth, S., Pockman, W. T., Litvak, M. E., and Katul, G. G.: Transport in a coordinated soil-root-xylem-phloem leaf system, Adv. Water Resour., 119, 1–16, https://doi.org/10.1016/j.advwatres.2018.06.002, 2018.
Hunt, A. G. and Manzoni, S.: Networks on Networks, Morgan & Claypool Publishers, 175 pp., https://doi.org/10.1088/978-1-6817-4159-8, 2015.
IPCC: Climate Change 2021: The Physical Science Basis. Contribution of Working Group I to the Sixth Assessment Report of the Intergovernmental Panel on Climate Change, Cambridge University Press, Cambridge (UK) and New York, NY (USA), https://doi.org/10.1017/9781009157896, 2021.
Joshi, J., Stocker, B. D., Hofhansl, F., Zhou, S., Dieckmann, U., and Prentice, I. C.: Towards a unified theory of plant photosynthesis and hydraulics, bioRxiv, https://doi.org/10.1101/2020.12.17.423132, 2022.
Juang, J. Y., Katul, G. G., Siqueira, M. B., Stoy, P. C., and McCarthy, H. R.: Investigating a hierarchy of Eulerian closure models for scalar transfer inside forested canopies, Bound.-Lay. Meteorol., 128, 1–32, 2008.
Katul, G., Palmroth, S., and Oren, R.: Leaf stomatal responses to vapour pressure deficit under current and CO2-enriched atmosphere explained by the economics of gas exchange, Plant Cell Environ., 32, 968–979, 2009.
Katul, G., Manzoni, S., Palmroth, S., and Oren, R.: A stomatal optimization theory to describe the effects of atmospheric CO2 on leaf photosynthesis and transpiration, Ann. Bot., 105, 431–442, 2010.
Keenan, T. F., Hollinger, D. Y., Bohrer, G., Dragoni, D., Munger, J. W., Schmid, H. P., and Richardson, A. D.: Increase in forest water-use efficiency as atmospheric carbon dioxide concentrations rise, Nature, 499, 324–327, https://doi.org/10.1038/nature12291, 2013.
Kempes, C. P., West, G. B., Crowell, K., and Girvan, M.: Predicting Maximum Tree Heights and Other Traits from Allometric Scaling and Resource Limitations, PLoS ONE, 6, e20551, https://doi.org/10.1371/journal.pone.0020551, 2011.
Klein, T.: The variability of stomatal sensitivity to leaf water potential across tree species indicates a continuum between isohydric and anisohydric behaviours, Funct. Ecol., 28, 1313–1320, https://doi.org/10.1111/1365-2435.12289, 2014.
Knapp, A. K., Fay, P. A., Blair, J. M., Collins, S. L., Smith, M. D., Carlisle, J. D., Harper, C. W., Danner, B. T., Lett, M. S., and McCarron, J. K.: Rainfall variability, carbon cycling, and plant species diversity in a mesic grassland, Science, 298, 2202–2205, 2002.
Knauer, J., Zaehle, S., Reichstein, M., Medlyn, B., Forkel, M., Hagemann, S., and Werner, C.: The response of ecosystem water-use efficiency to rising atmospheric CO2 concentrations: sensitivity and large-scale biogeochemical implications, New Phytol., 213, 1654–1666, https://doi.org/10.1111/nph.14288, 2017.
Kumar, R., Shankar, V., and Kumar Jat, M.: Efficacy of Nonlinear Root Water Uptake Model for a Multilayer Crop Root Zone, J. Irrig. Drain. Eng., 139, 898–910, https://doi.org/10.1061/(ASCE)IR.1943-4774.0000626, 2013.
Kumarathunge, D. P., Medlyn, B. E., Drake, J. E., Tjoelker, M. G., Aspinwall, M. J., Battaglia, M., Cano, F. J., Carter, K. R., Cavaleri, M. A., Cernusak, L. A., Chambers, J. Q., Crous, K. Y., De Kauwe, M. G., Dillaway, D. N., Dreyer, E., Ellsworth, D. S., Ghannoum, O., Han, Q., Hikosaka, K., Jensen, A. M., Kelly, J. W. G., Kruger, E. L., Mercado, L. M., Onoda, Y., Reich, P. B., Rogers, A., Slot, M., Smith, N. G., Tarvainen, L., Tissue, D. T., Togashi, H. F., Tribuzy, E. S., Uddling, J., Vårhammar, A., Wallin, G., Warren, J. M., and Way, D. A.: Acclimation and adaptation components of the temperature dependence of plant photosynthesis at the global scale, New Phytol., 222, 768–784, https://doi.org/10.1111/nph.15668, 2019.
Lavergne, A., Graven, H., De Kauwe, M. G., Keenan, T. F., Medlyn, B. E., and Prentice, I. C.: Observed and modelled historical trends in the water-use efficiency of plants and ecosystems, Global Change Biol., 25, 2242–2257, https://doi.org/10.1111/gcb.14634, 2019.
Lindh, M. and Manzoni, S.: Plant evolution along the “fast–slow” growth economics spectrum under altered precipitation regimes, Ecol. Model., 448, 109531, https://doi.org/10.1016/j.ecolmodel.2021.109531, 2021.
Lloyd, J. and Farquhar, G. D.: C-13 discrimination during CO2 assimilation by the terrestrial biosphere, Oecologia, 99, 201–215, 1994.
Lopez, J., Way, D., and Sadok, W.: Systemic effects of rising atmospheric vapor pressure deficit on plant physiology and productivity, Global Change Biol., 27, 1704–1720, https://doi.org/10.1111/gcb.15548, 2021.
Lu, X., Wang, L., and McCabe, M. F.: Elevated CO2 as a driver of global dryland greening, Sci. Rep., 6, 20716, https://doi.org/10.1038/srep20716, 2016a.
Lu, Y., Duursma, R. A., and Medlyn, B. E.: Optimal stomatal behaviour under stochastic rainfall, J. Theor. Biol., 394, 160–71, https://doi.org/10.1016/j.jtbi.2016.01.003, 2016b.
Lu, Y. J., Duursma, R. A., Farrior, C. E., Medlyn, B. E., and Feng, X.: Optimal stomatal drought response shaped by competition for water and hydraulic risk can explain plant trait covariation, New Phytol., 225, 1206–1217, https://doi.org/10.1111/nph.16207, 2020.
Mankin, J., Seager, R., Smerdon, J., Cook, B., and Williams, A.: Mid-latitude freshwater availability reduced by projected vegetation responses to climate change, Nat. Geosci., 12, 983–988, https://doi.org/10.1038/s41561-019-0480-x, 2019.
Manzoni, S., Katul, G., Fay, P. A., Polley, H. W., and Porporato, A.: Modeling the vegetation-atmosphere carbon dioxide and water vapor interactions along a controlled CO2 gradient, Ecol. Model., 222, 653–665, 2011.
Manzoni, S., Vico, G., Palmroth, S., Porporato, A., and Katul, G.: Optimization of stomatal conductance for maximum carbon gain under dynamic soil moisture, Adv. Water Resour., 62, 90–105, https://doi.org/10.1016/j.advwatres.2013.09.020, 2013.
Mastrotheodoros, T., Pappas, C., Molnar, P., Burlando, P., Keenan, T., Gentine, P., Gough, C., and Fatichi, S.: Linking plant functional trait plasticity and the large increase in forest water use efficiency, J. Geophys. Res.-Biogeo., 122, 2393–2408, https://doi.org/10.1002/2017JG003890, 2017.
McCarthy, H. R., Oren, R., Finzi, A. C., and Johnsen, K. H.: Canopy leaf area constrains [CO2]-induced enhancement of productivity and partitioning among aboveground carbon pools, P. Natl. Acad. Sci. USA, 103, 19356–19361, 2006.
Medlyn, B. E., Barton, C. V. M., Broadmeadow, M. S. J., Ceulemans, R., De Angelis, P., Forstreuter, M., Freeman, M., Jackson, S. B., Kellomaki, S., Laitat, E., Rey, A., Roberntz, P., Sigurdsson, B. D., Strassemeyer, J., Wang, K., Curtis, P. S., and Jarvis, P. G.: Stomatal conductance of forest species after long-term exposure to elevated CO2 concentration: a synthesis, New Phytol., 149, 247–264, 2001.
Medlyn, B. E., Dreyer, E., Ellsworth, D., Forstreuter, M., Harley, P. C., Kirschbaum, M. U. F., Le Roux, X., Montpied, P., Strassemeyer, J., Walcroft, A., Wang, K., and Loustau, D.: Temperature response of parameters of a biochemically based model of photosynthesis. II. A review of experimental data, Plant Cell Environ., 25, 1167–1179, https://doi.org/10.1046/j.1365-3040.2002.00891.x, 2002.
Medlyn, B. E., Duursma, R. A., Eamus, D., Ellsworth, D. S., Prentice, I. C., Barton, C. V. M., Crous, K. Y., de Angelis, P., Freeman, M., and Wingate, L.: Reconciling the optimal and empirical approaches to modelling stomatal conductance, Global Change Biol., 17, 2134–2144, https://doi.org/10.1111/j.1365-2486.2010.02375.x, 2011.
Mencuccini, M., Manzoni, S., and Christoffersen, B.: Modelling water fluxes in plants: from tissues to biosphere, New Phytol., 222, 1207–1222, https://doi.org/10.1111/nph.15681, 2019.
Mrad, A., Sevanto, S., Domec, J.-C., Liu, Y., Nakad, M., and Katul, G.: A Dynamic Optimality Principle for Water Use Strategies Explains Isohydric to Anisohydric Plant Responses to Drought, Front. For. Glob. Change, 2, 49, https://doi.org/10.3389/ffgc.2019.00049, 2019.
Mualem, Y.: Hydraulic conductivity of unsaturated soils: Prediction and formulas, in: Methods of Soil Analysis, Part I. Physical and Mineralogical Methods, edited by: Campbell, G. S., Jackson, R. D., Klute, A., Mortland, M. M., and Nielsen, D. R., American Society of Agronomy – Soil Science Socity of America, Madison, WI, 799–823, 1986.
Norby, R. J., Wullschleger, S. D., Gunderson, C. A., Johnson, D. W., and Ceulemans, R.: Tree responses to rising CO2 in field experiments: implications for the future forest, Plant Cell Environ., 22, 683–714, 1999.
Oren, R., Sperry, J. S., Katul, G. G., Pataki, D. E., Ewers, B. E., Phillips, N., and Schafer, K. V. R.: Survey and synthesis of intra- and interspecific variation in stomatal sensitivity to vapour pressure deficit, Plant Cell Environ., 22, 1515–1526, 1999.
Palmroth, S., Berninger, F., Nikinmaa, E., Lloyd, J., Pulkkinen, P., and Hari, P.: Structural adaptation rather than water conservation was observed in Scots pine over a range of wet to dry climates, Oecologia, 121, 302–309, 1999.
Pan, Y., Jackson, R. B., Hollinger, D. Y., Phillips, O. L., Nowak, R. S., Norby, R. J., Oren, R., Reich, P. B., Lüscher, A., Mueller, K. E., Owensby, C., Birdsey, R., Hom, J., and Luo, Y.: Contrasting responses of woody and grassland ecosystems to increased CO2 as water supply varies, Nat. Ecol. Evol., 6, 315–323, https://doi.org/10.1038/s41559-021-01642-6, 2022.
Paschalis, A., Fatichi, S., Pappas, C., and Or, D.: Covariation of vegetation and climate constrains present and future T/ET variability, Environ. Res. Lett., 13, 104012, https://doi.org/10.1088/1748-9326/aae267, 2018.
Penuelas, J., Canadell, J. G., and Ogaya, R.: Increased water-use efficiency during the 20th century did not translate into enhanced tree growth, Glob. Ecol. Biogeogr., 20, 597–608, https://doi.org/10.1111/j.1466-8238.2010.00608.x, 2011.
Pirtel, N. L., Hubbard, R. M., Bradford, J. B., Kolb, T. E., Litvak, M. E., Abella, S. R., Porter, S. L., and Petrie, M. D.: The aboveground and belowground growth characteristics of juvenile conifers in the southwestern United States, Ecosphere, 12, e03839, https://doi.org/10.1002/ecs2.3839, 2021.
Porporato, A., Daly, E., and Rodriguez-Iturbe, I.: Soil water balance and ecosystem response to climate change, Am. Nat., 164, 625–632, 2004.
Prentice, I. C., Dong, N., Gleason, S. M., Maire, V., and Wright, I. J.: Balancing the costs of carbon gain and water transport: testing a new theoretical framework for plant functional ecology, Ecol. Lett., 17, 82–91, https://doi.org/10.1111/ele.12211, 2014.
Pritchard, S. G., Rogers, H. H., Prior, S. A., and Peterson, C. M.: Elevated CO2 and plant structure: a review, Global Change Biol., 5, 807–837, https://doi.org/10.1046/j.1365-2486.1999.00268.x, 1999.
Roberts, J.: Forest transpiration – A conservative hydrological process, J. Hydrol., 66, 133–141, 1983.
Rodriguez-Iturbe, I. and Porporato, A.: Ecohydrology of Water-Controlled Ecosystems, Soil Moisture and Plant Dynamics, Cambridge University Press, Cambridge, ISBN 9780521036740, 2004.
Sadras, V. O. and Milroy, S. P.: Soil-water thresholds for the responses of leaf expansion and gas exchange: A review, Field Crops Res., 47, 253–266, 1996.
Sadras, V., Hall, A., Trapani, N., and Vilella, F.: Dynamics of rooting and root-length – leaf-area relationships as affected by plant-population in sunflower crops, Field Crops Res., 22, 45–57, https://doi.org/10.1016/0378-4290(89)90088-9, 1989.
Saurer, M., Spahni, R., Frank, D. C., Joos, F., Leuenberger, M., Loader, N. J., McCarroll, D., Gagen, M., Poulter, B., Siegwolf, R. T. W., Andreu-Hayles, L., Boettger, T., Dorado Linan, I., Fairchild, I. J., Friedrich, M., Gutierrez, E., Haupt, M., Hilasvuori, E., Heinrich, I., Helle, G., Grudd, H., Jalkanen, R., Levanic, T., Linderholm, H. W., Robertson, I., Sonninen, E., Treydte, K., Waterhouse, J. S., Woodley, E. J., Wynn, P. M., and Young, G. H. F.: Spatial variability and temporal trends in water-use efficiency of European forests, Global Change Biol., 20, 3700–3712, https://doi.org/10.1111/gcb.12717, 2014.
Schäfer, K. V. R., Oren, R., Lai, C.-T., and Katul, G. G.: Hydrologic balance in an intact temperate forest ecosystem under ambient and elevated atmospheric CO2 concentration, Global Change Biol., 8, 895–911, https://doi.org/10.1046/j.1365-2486.2002.00513.x, 2002.
Schymanski, S. J., Roderick, M. L., and Sivapalan, M.: Using an optimality model to understand medium and long-term responses of vegetation water use to elevated atmospheric CO2 concentrations, Aob Plants, 7, plv060, https://doi.org/10.1093/aobpla/plv060, 2015.
Sheley, R. and Larson, L.: Comparative growth and interference between cheatgrass and yellow starthistle seedlings, J. Range Manage., 47, 470–474, https://doi.org/10.2307/4002999, 1994.
Sloan, B. P., Thompson, S. E., and Feng, X.: Plant hydraulic transport controls transpiration sensitivity to soil water stress, Hydrol. Earth Syst. Sci., 25, 4259–4274, https://doi.org/10.5194/hess-25-4259-2021, 2021.
Smith, M. N., Taylor, T. C., van Haren, J., Rosolem, R., Restrepo-Coupe, N., Adams, J., Wu, J., de Oliveira, R. C., Silva, R., de Araujo, A. C., de Camargo, P. B., Huxman, T. E., and Saleska, S. R.: Empirical evidence for resilience of tropical forest photosynthesis in a warmer world, Nat. Plants, 6, 1225–1230, https://doi.org/10.1038/s41477-020-00780-2, 2020.
Sperry, J. S., Venturas, M. D., Anderegg, W. R. L., Mencuccini, M., Mackay, D. S., Wang, Y., and Love, D. M.: Predicting stomatal responses to the environment from the optimization of photosynthetic gain and hydraulic cost, Plant Cell Environ., 40, 816–830, https://doi.org/10.1111/pce.12852, 2017.
Stocker, B. D., Wang, H., Smith, N. G., Harrison, S. P., Keenan, T. F., Sandoval, D., Davis, T., and Prentice, I. C.: P-model v1.0: an optimality-based light use efficiency model for simulating ecosystem gross primary production, Geosci. Model Dev., 13, 1545–1581, https://doi.org/10.5194/gmd-13-1545-2020, 2020.
Swann, A., Hoffman, F., Koven, C., and Randerson, J.: Plant responses to increasing CO2 reduce estimates of climate impacts on drought severity, P. Natl. Acad. Sci. USA, 113, 10019–10024, https://doi.org/10.1073/pnas.1604581113, 2016.
Tor-ngern, P., Oren, R., Ward, E. J., Palmroth, S., McCarthy, H. R., and Domec, J.-C.: Increases in atmospheric CO2 have little influence on transpiration of a temperate forest canopy, New Phytol., 205, 518–525, https://doi.org/10.1111/nph.13148, 2015.
Ukkola, A., Prentice, I., Keenan, T., van Dijk, A., Viney, N., Myneni, R., and Bi, J.: Reduced streamflow in water-stressed climates consistent with CO2 effects on vegetation, Nat. Clim. Change, 6, 75–78, https://doi.org/10.1038/NCLIMATE2831, 2016.
Vico, G., Manzoni, S., Palmroth, S., Weih, M., and Katul, G.: A perspective on optimal leaf stomatal conductance under CO2 and light co-limitations, Agric. For. Meteorol., 182, 191–199, https://doi.org/10.1016/j.agrformet.2013.07.005, 2013.
Vico, G., Way, D. A., Hurry, V., and Manzoni, S.: Can leaf net photosynthesis acclimate to rising and more variable temperatures?, Plant Cell Environ., 42, 1913–1928, https://doi.org/10.1111/pce.13525, 2019.
Wang, Y., Sperry, J. S., Anderegg, W. R. L., Venturas, M. D., and Trugman, A. T.: A theoretical and empirical assessment of stomatal optimization modeling, New Phytol., 227, 311–325, https://doi.org/10.1111/nph.16572, 2020.
Wasyliw, J. and Karst, J.: Shifts in ectomycorrhizal exploration types parallel leaf and fine root area with forest age, J. Ecol., 108, 2270–2282, https://doi.org/10.1111/1365-2745.13484, 2020.
Way, D. A. and Oren, R.: Differential responses to changes in growth temperature between trees from different functional groups and biomes: a review and synthesis of data, Tree Physiol., 30, 669–688, https://doi.org/10.1093/treephys/tpq015, 2010.
Williams, C. A., Reichstein, M., Buchmann, N., Baldocchi, D., Beer, C., Schwalm, C., Wohlfahrt, G., Hasler, N., Bernhofer, C., Foken, T., Papale, D., Schymanski, S., and Schaefer, K.: Climate and vegetation controls on the surface water balance: Synthesis of evapotranspiration measured across a global network of flux towers, Water Resour. Res., 48, https://doi.org/10.1029/2011wr011586, 2012.
Yang, Y., McVicar, T. R., Yang, D., Zhang, Y., Piao, S., Peng, S., and Beck, H. E.: Low and contrasting impacts of vegetation CO2 fertilization on global terrestrial runoff over 1982–2010: accounting for aboveground and belowground vegetation–CO2 effects, Hydrol. Earth Syst. Sci., 25, 3411–3427, https://doi.org/10.5194/hess-25-3411-2021, 2021.
Yuan, W., Zheng, Y., Piao, S., Ciais, P., Lombardozzi, D., Wang, Y., Ryu, Y., Chen, G., Dong, W., Hu, Z., Jain, A., Jiang, C., Kato, E., Li, S., Lienert, S., Liu, S., Nabel, J., Qin, Z., Quine, T., Sitch, S., Smith, W., Wang, F., Wu, C., Xiao, Z., and Yang, S.: Increased atmospheric vapor pressure deficit reduces global vegetation growth, Sci. Adv., 5, eaax139, https://doi.org/10.1126/sciadv.aax1396, 2019.
Zhang, Q., Ficklin, D. L., Manzoni, S., Wang, L., Way, D., Phillips, R. P., and Novick, K. A.: Response of ecosystem intrinsic water use efficiency and gross primary productivity to rising vapor pressure deficit, Environ. Res. Lett., 14, 074023, https://doi.org/10.1088/1748-9326/ab2603, 2019.
- Abstract
- Introduction
- Theory
- Results
- Discussion
- Conclusions
- Appendix A: Separating diffusion and biochemical limitations to net assimilation using a simplified PETA model
- Appendix B: Derivation of the stomatal optimization models
- Appendix C: Covariation of rooting depth and leaf area index
- Data availability
- Author contributions
- Competing interests
- Special issue statement
- Disclaimer
- Acknowledgements
- Financial support
- Review statement
- References
- Supplement