the Creative Commons Attribution 4.0 License.
the Creative Commons Attribution 4.0 License.
 | 02 Nov 2022
Pore network modeling as a new tool for determining gas diffusivity in peat
Marjo Palviainen
Arianna Marchionne
Tiia Grönholm
Maarit Raivonen
Lukas Kohl
Annamari Laurén
Peatlands are globally significant carbon stocks and may become major sources of the greenhouse gases (GHGs) carbon dioxide and methane in a changing climate and under anthropogenic management pressure. Diffusion is the dominant gas transport mechanism in peat; therefore, a proper knowledge of the soil gas diffusion coefficient is important for the estimation of GHG emissions from peatlands. Pore network modeling (PNM) is a potential tool for the determination of gas diffusivity in peat, as it explicitly connects the peat microstructure and the characteristics of the peat pore network to macroscopic gas transport properties. In the present work, we extracted macropore networks from three-dimensional X-ray micro-computed tomography (µCT) images of peat samples and simulated gas diffusion in these networks using PNM. These results were compared to the soil gas diffusion coefficients determined from the same samples in the laboratory using the diffusion chamber method. The measurements and simulations were conducted for peat samples from three depths. The soil gas diffusion coefficients were determined under varying water contents adjusted in a pressure plate apparatus. We also assessed the applicability of commonly used gas diffusivity models to peat. The laboratory measurements showed a decrease in gas diffusivity with depth due to a decrease in air-filled porosity and pore space connectivity. However, gas diffusivity was not extremely low close to saturation, which may indicate that the structure of the macropore network is such that it enables the presence of connected diffusion pathways through the peat matrix, even in wet conditions. The traditional gas diffusivity models were not very successful in predicting the soil gas diffusion coefficient. This may indicate that the microstructure of peat differs considerably from the structure of mineral soils and other kinds of porous materials for which these models have been constructed and calibrated. By contrast, the pore network simulations reproduced the laboratory-determined soil gas diffusion coefficients rather well. Thus, the combination of the µCT and PNM methods may offer a promising alternative to the traditional estimation of soil gas diffusivity through laboratory measurements.
- Article
(1653 KB) - Full-text XML
- BibTeX
- EndNote


Peatlands have an important role in global carbon (C) cycling. Approximately 600 Gt of C is stored in peatlands as peat (Yu et al., 2010), which accounts for one-fifth of the total pool of soil organic C (Leifeld and Menichetti, 2018) and corresponds to more than a half of the C currently held in the atmosphere as carbon dioxide (CO2) (Limpens et al., 2008). Peatlands are vulnerable to management practices and changes in climate and may therefore become one of the major sources of the greenhouse gases (GHGs) CO2 and methane (CH4) in the global C cycle (Frolking et al., 2011; Leifeld et al., 2019). Drainage and lowering the water table (WT) increase the net CO2 emissions of peatlands and may turn them from sinks into sources of CO2 (Ojanen and Minkkinen, 2019; Günther et al., 2020). Many boreal peatlands may also become CO2 sources due to rapid climate warming (Qiu et al., 2020). Despite its low atmospheric concentration, CH4 accounts for about one-fifth of the global radiative forcing and is therefore the second most important anthropogenic GHG after CO2 (Saunois et al., 2020). Peatlands are significant natural sources of CH4 (Lai, 2009; Abdalla et al., 2016; Tsuruta et al., 2019), since about 30 % of global CH4 emissions originate from peatlands or other wetlands (Kirschke et al., 2013).
The emissions of CO2 and CH4 from peatlands are both tightly linked to the gas transport properties of peat, which control the transport of oxygen (O2) into peat profiles and the transport of CO2 and CH4 from peat to the atmosphere. The availability of O2, in turn, controls the decomposition pathway of organic matter in peat (Estop-Aragonés et al., 2012). O2 is transported from the atmosphere into the peat, where it is continuously consumed by heterotrophic respiration, which produces CO2. If the rate of O2 consumption exceeds its supply, O2 may become depleted in the peat. Under these conditions, the microbial metabolism changes to other electron acceptors, and finally, the production of CH4 starts (Bridgham et al., 2013). This is the case below the WT, where anaerobic conditions dominate permanently (Abdalla et al., 2016); however, anaerobic conditions may also occur in high-moisture unsaturated peat if the peat structure does not favor O2 transport (Fan et al., 2014).
Soil pore architecture is a fundamental physical characteristic of soil, and it controls many important soil functions such as water and gas transport and biogeochemical processes (Rabot et al., 2018; Schlüter et al., 2020). Diffusion is considered to be the primary gas transport mechanism in soils (Jin and Jury, 1996; Maier et al., 2020). Because the diffusion coefficients of O2, CO2, and CH4 in air are 4 orders of magnitude higher than in water (Ball and Smith, 2001), the gas diffusion capability of unsaturated soil is closely connected to the size and number of air-filled pores and the connections and pathways between the air-filled pores and the atmosphere. Because the distance of the WT from the soil surface is generally less than 1 m in peatlands (Sarkkola et al., 2010), small pores remain permanently filled with water. Macropores, defined as pores with an effective diameter of greater than 100 µm (Beven and Germann, 1982), are dominant conduits for gas transport and are important in many other soil functions (Reddy and DeLaune, 2008; McCarter et al., 2020). Macropores form a complex network with open and connected, dead-ended, and isolated individual pores (Rezanezhad et al., 2016). The connectivity of the macropore network regulates its transport properties (Koestel et al., 2020). Soil gas diffusivity decreases with increasing soil water content, as pores are removed from the transport network when they become water filled (Moldrup et al., 2004). Hysteresis – that is, the difference in soil water content at a specific water potential between drying and wetting – also affects the size and connectivity of the active pore network (Kiuru et al., 2022a).
The pore structure and other physical characteristics of peat differ considerably from those of mineral soil (McCarter et al., 2020). The unique properties such as high total porosity and low bulk density as well as the tendency to shrink and swell during drying and wetting affect the gas transport properties of peat (Rezanezhad et al., 2016). Peat pore space is characterized by macropores between partially decomposed plant remains and smaller pores inside the remains (Weber et al., 2017). Peat macroporosity is generally highest near the surface in undrained peatlands, because the degree of decomposition typically increases with depth and because the decomposition results in decreasing pore volumes (Päivänen, 1973). Because of the high total porosity, the water retention capacity of peat is higher than that of mineral soils, especially in wet conditions (Paavilainen and Päivänen, 1995; Walczak et al., 2002). The macropore network is considered to be more complex and more tortuous in peat than in mineral soils, which may result in a lower diffusion capability (Iiyama and Hasegawa, 2005).
The soil gas diffusion coefficient Ds depends on the air-filled porosity of the soil and the structural properties of the soil pore network (Jin and Jury, 1996). The relative gas diffusion coefficient or relative diffusivity (), where D0 is the gas diffusion coefficient in free air, is a gas-independent way to express the soil gas diffusion capability. A variety of models for have been developed and used to explore the relationship between the gas diffusivity and the physical properties of porous solids in general and of mineral soils in particular (e.g., Penman, 1940; Millington, 1959; Millington and Quirk, 1961; Campbell, 1985; Moldrup et al., 2004). Gas diffusivity models are needed in process-based models describing biogeochemical processes and GHG production and emission in soils (Blagodatsky and Smith, 2012; Xu et al., 2016). However, the applicability of the models to peat is questionable because of the unique physical characteristics of peat (Iiyama and Hasegawa, 2005). The impact of the complex and tortuous pore structure of peat may not be adequately represented in models designed for simplified porous media or mineral soils. To date, the gas diffusivity of peat has only been investigated in a few studies (King and Smith, 1987; Boon et al., 2013; Hamamoto et al., 2016a), and the rates of gas transport processes in peatlands remain poorly understood.
Soil structure characteristics are generally taken account of in gas diffusivity models by incorporating semi-empirical tortuosity–connectivity factors (Hamamoto et al., 2016b). X-ray micro-computed tomography (µCT) is a noninvasive and nondestructive imaging technique that can be used for explicit three-dimensional visualization and description of soil structure and pore architecture (Helliwell et al., 2013). Extracting a pore network from the µCT images allows the determination of the size of individual pores and their connectivity (e.g., Dong and Blunt, 2009; Gostick, 2017). Such data enable the use of pore network modeling (PNM), which can be used to simulate gas diffusion through soil and to determine Ds (Steele and Nieber, 1994; Gharedaghloo et al., 2018). Instead of simulating transport processes with direct numerical methods using the image void structures as the computational mesh, PNM simulates transport in a network of simplified pores, which are constructed on the basis of the actual pore geometry (Zhao et al., 2020). A great advantage of PNM is that it requires substantially less computational capacity than the direct simulation methods (Blunt et al., 2013; Xiong et al., 2016). Thus, the combination of µCT and PNM is a useful method for estimating soil gas diffusivity from the soil structural characteristics. However, few attempts have been made to apply this promising approach to peat (Gharedaghloo et al., 2018).
In this study, we determined the soil gas diffusion coefficients of peat samples that were collected from a boreal forested peatland. The objectives of this work were (1) to study the variation in the relative diffusivity of peat with depth and between different soil water content conditions; (2) to assess the capability of PNM to estimate and characterize the gas diffusion dynamics in peat; and finally (3) to investigate the applicability of widely used models for gas diffusivity to peat.
2.1 Field sampling
Peat samples were collected from a forested peatland site in southern Finland (60∘38′ N, 23∘57′ E, Lettosuo, Tammela). The site was drained in 1969 with parallel ditch drains in 40 m spacing. The long-term mean annual temperature and precipitation are 5.2 ∘C and 621 mm, respectively (Jokinen et al., 2021). The soil type is hemic Histosol, and the peat type is Carex peat. The site was originally a mesotrophic fen classified as a herb-rich tall-sedge birch–pine fen (Laine and Vasander, 1996). The forest stand is dominated by Scots pine (Pinus sylvestris L.) and downy birch (Betula pubescens Ehrh.). The dominant height of the trees is 20 m. The understory is composed of Norway spruce (Picea abies Karst.). The total stand volume is 230 m3 ha−1, and stocking is 2200 stems ha−1. The ground vegetation is composed of dwarf shrubs, with a coverage of 4 % (Vaccinium myrtillus L., V. vitis-idaea L.), and herbs (coverage 10.6 %). A detailed site description is available in Kiuru et al. (2022a).
Undisturbed peat samples were collected from seven randomly located pits and three different depths (0–5, 20–25, and 40–45 cm, later referred to as the top, middle, and bottom layer, respectively). A pit with a depth of 50–60 cm with an undisturbed vertical face was dug, after which the profile depth was measured with a ruler. Vertically oriented peat samples were extracted along the pit face into acrylic cylinders (diameter 50 mm, height 50 mm) using a sharp knife and scissors, paying attention to keeping the peat structure undisturbed.
2.2 Gas diffusivity measurement
Firstly, the undisturbed samples were saturated for 1 d at a constant temperature of 20 ∘C. Next, the samples were placed inside a pressure chamber in contact with a ceramic porous plate and were dehydrated by applying the pressures of 1, 3, 6, and 10 kPa. When the equilibrium state was reached, the soil samples were removed from the pressure chamber and weighed. The gas diffusivity measurement was then performed for each sample. The procedure was repeated for each moisture equilibrium. The sample volumes decreased upon drying during the experiment. At the end of the experiment, the sample height and diameter were measured to determine the shrinkage. The water retention measurement procedure is described in more detail in Kiuru et al. (2022a).
The bulk density of a peat sample was determined from its dry mass and the saturated volume, and the volumetric water contents at different matric potentials were also calculated in relation to the saturated volume, with the exception that the reduction of the sample volume due to shrinkage was taken into account at −10 kPa conditions. Total porosity was estimated from the bulk density and a mean particle density for organic soil of 1500 kg m−3 (Redding and Devito, 2006). Air-filled porosity was determined at each state as the difference between total porosity and the respective volumetric water content.
In order to determine the soil gas diffusivity values Ds, each peat sample was attached to a gas diffusion chamber (Currie, 1960; Edling, 1986). The diffusion chambers consisted of an empty cylindrical head space (diameter 50 mm, length 100 mm) composed of acrylic material that was air-tightly connected to the peat core. Each diffusion chamber was equipped with two silicone tubes through which nitrogen gas (N2) was circulated through the head space until the N2 content was around 99 %. Thereafter, the tubes were closed, and N2 started to diffuse out from the head space through the peat. N2 was chosen, because it is nontoxic and was neither produced nor consumed in significant quantities during the 3 h measurement. We measured the changes in N2 concentration inside the diffusion chamber with a gas syringe and a needle inserted through a rubber septum located at the bottom of the chamber.
Two gas samples were extracted from the head space during the experiment approximately 45 and 120 min after sealing the chamber. The gas samples (8 mL) were injected into helium-flushed, pre-evacuated 3 mL Exetainer vials (Labco, UK), and N2, O2, and CO2 concentrations were quantified using a gas chromatograph (Agilent 7890B) equipped with a thermal conductivity detector (Soinne et al., 2021). Samples were injected using a 0.5 mL loop and separated on a HayeSep Q 80/100 column (Agilent G3591-81004; 3 ft. by in.) followed by a HP-PLOT Molesieve column (Agilent 19095P-MS0; 50 m by 0.53 mm by 50 µm). Both columns were held isothermally at 40 ∘C. Helium was used as a carrier gas at constant pressure (30 psi), resulting in a flow rate of 16.3 mL min−1. The system was calibrated with a gas mixture that contained 5 % CO2, 16 % O2, and 79 % N2.
The soil gas diffusion coefficient (Ds, m2 s−1) was calculated using the following approximate formula (Bakker and Hidding, 1970):
where a is the air-filled porosity (m3 m−3) of the peat sample, ls (m) is the length of the sample, lc (m) is the length of the diffusion chamber head space, and ΔC1 and ΔC2 (mol m−3) are the gas concentration differences between the top and bottom of the sample at times t1 and t2 (s), respectively. The decrease in the sample length due to shrinkage was taken into account in the calculation at −10 kPa conditions. The mole fraction of N2 in free air was assumed to be 78 %. Of a total of 84 diffusion measurements, 16 were discarded because of strikingly inconsistent N2 concentration values for a sample between the gas sampling times or for a sample between different matric potential conditions at corresponding sampling times. The inconsistency was most probably caused by leakages in the diffusion measurement system or during gas sampling.
2.3 Comparison with existing models
We compared the calculated relative diffusivity () values with values obtained from commonly used gas diffusivity models by Currie (1960) and Millington and Quirk (1961), another model by Millington and Quirk (1960), and a more complex model by Moldrup et al. (2004). The models relate the relative diffusivity to air-filled porosity a and total porosity ε (m3 m−3). The model by Currie (1960) (hereafter referred to as the CC model) uses only the value of air-filled porosity to determine the relative diffusivity as
The parameters α and β can be regarded as relating to pore tortuosity and the pore size distribution, respectively. Commonly used values for soil with a high water content, α=0.9 and β=2.3, were suggested by Campbell (1985). The model by Millington and Quirk (1961) (MQ61) is a simple, nonlinear model that also requires the value of total porosity to predict the Ds(a) curve of soil:
Millington and Quirk (1960) also proposed another model (MQ60), expressed as
which has been shown to outperform the MQ61 model in some cases (Washington et al., 1994; Jin and Jury, 1996). The three-porosity model (TPM) presented by Moldrup et al. (2004) is given by
In addition to a and ε, it requires a third porosity value a100: air-filled porosity at −100 cmH2O (−10 kPa) matric potential. The parameter X describes the tortuosity and connectivity of soil, and it is obtained by assuming an empirically developed relationship between the soil gas diffusion coefficient at −100 cmH2O matric potential (D100) and the corresponding air-filled porosity (Moldrup et al., 2000):
The parameter X is obtained by combining Eqs. (5) and (6) as
The TPM model has been shown to give accurate predictions of Ds(a) curves across soil types and total porosities (Moldrup et al., 2004). The diffusion coefficient of N2 in free air was assumed to equal the diffusion coefficient of O2 in N2 at 20 ∘C, 0.202 cm2 s−1 (Rumble, 2021).
2.4 Pore network imaging and analyses
In addition to laboratory experiments, we studied how the pore network characteristics affect gas diffusion in peat using pore network simulations. The pore networks were extracted from µCT images taken from the same peat samples as used in the laboratory experiment, and the networks were used as the gas transfer domains in the simulations.
2.4.1 µCT imaging and image processing
The peat samples, which were at −10 kPa matric potential, were scanned in the micro-CT laboratory in the University of Helsinki with the GE Phoenix Nanotom system after the water retention experiment. The final voxel (cubic 3D image element) size after image reconstruction was 50 µm, and the resulting 3D images were 1142 by 1142 by 1152 voxels in size. The image preprocessing stage, including straightening, cropping, noise filtering, and binary segmentation, was performed using the Python image processing packages SciPy ndimage (Virtanen et al., 2020) and scikit-image (van der Walt et al., 2014) and the image analysis toolkit PoreSpy (Gostick et al., 2019). The images were segmented into void (air) and solid (water and organic material) volumes using the widely utilized global thresholding method by Otsu (1979). The final size of each binarized image was 1000 by 1000 by 1000 voxels, of which a cylindrical peat volume with a height of 1000 voxels and a diameter of 1000 voxels was selected for further analysis.
2.4.2 Pore networks
The extraction of pore networks from the 10003-voxel binary images and the determination of the pore network geometry were performed using a marker-based watershed segmentation method (Gostick, 2017) available in PoreSpy. Because the feature resolution of µCT-generated images is generally about twice the voxel size (Stock, 2008), the size of the smallest distinguishable feature was 100 µm. The extracted pore system can be divided into clusters of interconnected pores and a group of isolated pores. The largest of these clusters, which was assumed to be the only cluster that extends through the applied sample domain, was defined as the pore network. Network porosity was defined as the ratio of the combined volume of the pores in the network to the total volume of the network domain.
Pore volume was determined by the number of voxels in the pore region, and pore diameter was defined as the diameter of the largest sphere that fits inside the pore region. Similarly, throat diameter was defined as the diameter of the largest circle that fits inside the throat region. A stick-and-ball simplification of the pore network geometry was employed: the pores were considered as spheres centered at the centroids of the pore regions, and the throats were cylindrical tubes connecting adjacent pores. Because the centroids of two interconnected pores and the centroid of the throat between them were generally not collinear, the conduit length d between neighboring pores was determined as the sum of the distances between each pore centroid (pa and pb) and the throat centroid (t): . A more detailed description of the workflow from the µCT imaging to pore network extraction is found in Kiuru et al. (2022a).
2.5 Diffusion simulation with PNM
We used the open-source pore network modeling package OpenPNM (Gostick et al., 2016) for the simulation of water retention and gas diffusion through a pore network. OpenPNM has been recently used for the simulation of fluid flow in rocks, sediments, and mineral soil (e.g., Merey, 2019; Yang et al., 2019; Dong et al., 2022) but not for organic porous matter. The water retention simulation determined the extent and configuration of the air-filled pore network at each external pressure step, and diffusion simulation was then used to determine the effective diffusivity of the pore network. The maximum external pressure applied in the simulations, 2.88 kPa, was determined by the minimum throat diameter (100 µm). The water retention simulation was performed using the algorithm for drainage percolation in OpenPNM (see Kiuru et al., 2022a). The diffusion simulation gives the rate of the steady-state diffusion of a gas through an air-filled pore network. Mass conservation is required in each pore in the network, and the mass transfer between each pair of pores is determined by Fick's first law of diffusion. The effective diffusivity of the pore network, which can be interpreted as the simulated soil gas diffusion coefficient Dpnm, can finally be obtained using Fick's first law of diffusion as
where N (mol s−1) is the rate of steady-state diffusion through the network, L (m) is the length of the network domain, A (m2) is the cross-sectional area of the domain, and ΔC (mol m−3) is the concentration gradient between the opposite boundaries of the domain in the direction of the flow.
The network domain size used in the simulations had to be as close to the total sample size as possible so that comparison with the measured soil gas diffusion coefficients would be reasonable. Thus, no more than 100 voxels, corresponding to 5 mm slices, at the top and bottom of the sample images were ignored so that the influence of the roughness of the sample surfaces and the image reconstruction defects near the image boundaries were still excluded. The network domain was therefore 40 mm in height, and it included the whole cylindrical region in the horizontal direction. Because some of the top-layer samples had shrunk slightly in the vertical direction during the water retention experiment, the network domain height was reduced to 30 or 35 mm as needed. The resulting image was thereafter divided into four similar-shaped regions with horizontal dimensions of 500 by 500 voxels. A separate pore network was extracted for each region with PoreSpy. Diffusion simulations for the four subnetworks were performed using the same pressure steps in each simulation. The total effective diffusivity at each pressure step for the cylindrical network domain with a height of 800 voxels and a diameter of 1000 voxels was then calculated from the combined diffusion rates of the subnetworks and the cross-sectional area of the total network domain.
2.6 Statistics
We applied a one-way analysis of variance (ANOVA) followed by Tukey's pairwise multiple comparison test to determine the possible influence of depth on the soil gas diffusion coefficient. If residual normality and variance homogeneity could not be assumed, an independent sample t test was applied instead. A paired sample t test was applied to analyze the difference between the measured and simulated soil gas diffusion coefficients. The statistical analyses were conducted with the statistical function module in SciPy and the Python packages statsmodels (Seabold and Perktold, 2010) and hypothetical (Schlegel, 2020).
We also assessed the performance of the pore network simulations against the measured soil gas diffusion coefficients using a Bland–Altman plot (Bland and Altman, 1999; Giavarina, 2015). It is a graphical technique for assessing the agreement between values (X and Y) obtained from two different measurement methods. The Bland–Altman plot is constructed by plotting the differences between each pair of values (Xi−Yi) against the averages of the pairs of values (). An estimated agreement interval, which is bounded by the limits of agreement and covers 95 % of the difference range, is also shown in the plot.
We examined the agreement between measured and model-estimated relative diffusivity with several performance metrics. The Nash–Sutcliffe efficiency (Moriasi et al., 2007) is defined as
where SSres is the sum of the squares of the residuals between measured values Dmea and model-estimated values Dmod:
and SStot is the sum over the squared differences between the measurements and their mean :
Lin's concordance correlation coefficient ρc (Lin, 1989) assesses the degree of agreement between two continuous variables, taking into account both the linear relationship between the two variables and the deviation from the perfect agreement line (Dhanoa et al., 1999). The value of ρc ranges from 0 (no concordance) to 1 (perfect agreement). It is calculated as
where μm and μs are the means of measured and model-estimated values, respectively, σm and σs are the corresponding variances, and σms is the covariance between measured and model-estimated values.
The Akaike information criterion (AIC) (Akaike, 1974) takes into account the number of model parameters in performance comparison. AIC with a correction for small sample size is defined as (Burnham and Anderson, 2004)
where n is the sample size and K is the number of model parameters. AIC can only be used for a relative ranking of different models according to their performance (Tozzi et al., 2020). A smaller or more negative AIC indicates better model performance. The relative performance can be characterized by rescaling to
where AICmin is the minimum of the AIC values for i different models.
3.1 Soil gas diffusivity and air-filled porosity measurements
The air-filled porosities of the samples with successful gas diffusivity measurements differed significantly between the layers (ANOVA, p<0.05, Table 1). Air-filled porosity was highest in the top layer and decreased with depth. The difference between the middle and bottom layers was, however, nonsignificant at all matric potentials (Tukey's post hoc test, ) other than −1 kPa (independent sample t test, t(11)=4.15 and p=0.002). Air-filled porosity varied the most between samples in the bottom layer (relative standard deviation (RSD) at different matric potentials between 0.27 and 0.62) followed by the middle layer (RSD 0.24–0.37) and the top layer (RSD 0.08–0.44).
Table 1Means and standard deviations for the measured air-filled porosity (a, m m−3) of the peat samples at different matric potentials.
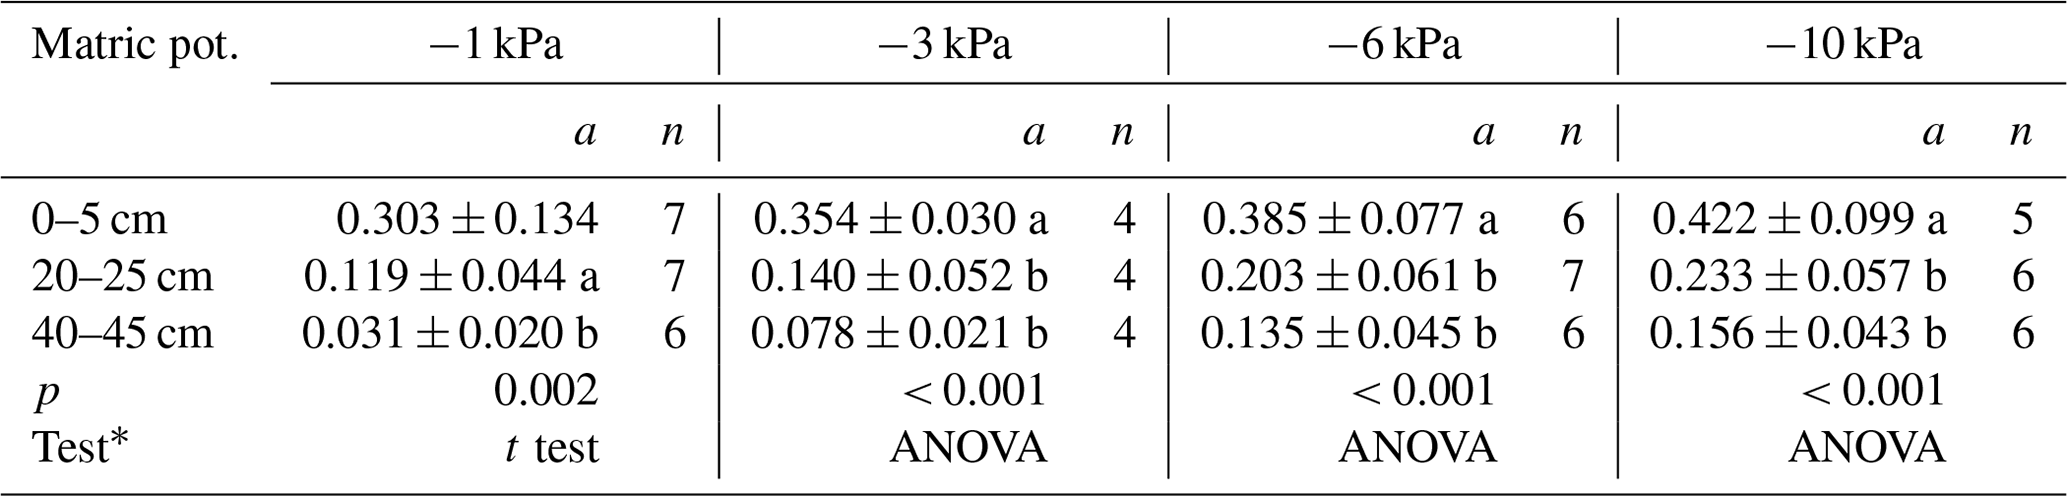
* ANOVA: F test and Tukey's test. ANOVA methods were not applicable to −1 kPa because of residual nonnormality and heteroscedasticity; an independent sample t test was performed instead. Different letters indicate a significant difference in air-filled porosity between different sampling depths (p<0.05).
The shrinkage of the samples in the vertical direction at −10 kPa matric potential was, on average, 6.3 % in the top layer, 3.7 % in the middle layer, and 2.3 % in the bottom layer. The vertical shrinkage was considered to be negligible at higher-matric-potential conditions. In addition, slight horizontal shrinkage was observed in some of the middle-layer and bottom-layer samples at −10 kPa conditions. The estimated decrease in the sample diameter was generally of the order of 1 to 2 % or less.
The soil gas diffusion coefficients of the peat samples also differed significantly between the sampling depths (ANOVA, p<0.05, Table 2). Similarly to air-filled porosity, the soil gas diffusion coefficient was highest in the top layer at all matric potentials and decreased with depth. However, no significant difference was observed between the middle and bottom layers (Tukey's post hoc test, p=0.9). ANOVA was not applicable to the −1 kPa samples, but there was no significant difference in Ds between the middle and bottom layers (independent sample t test, t(11)=1.19 and p=0.26). The variation in Ds between samples was largest in the bottom (RSD 0.34–0.66) and top (RSD 0.20–0.58) layers but also considerable in the middle layer (RSD 0.16–0.40).
Table 2Means and standard deviations for the measured N2 diffusion coefficients (Ds, cm2 s−1) of the peat samples at different matric potentials.
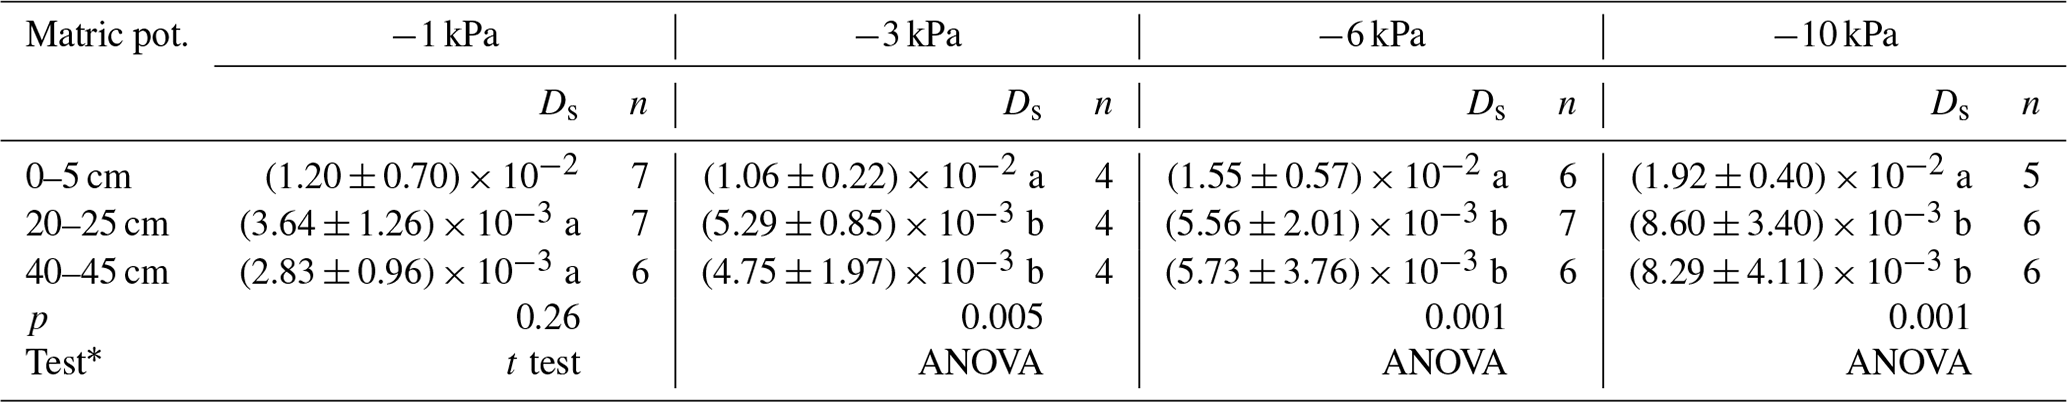
* ANOVA: F test and Tukey's test. ANOVA methods were not applicable to −1 kPa because of residual nonnormality and heteroscedasticity; an independent sample t test was performed instead. Different letters indicate a significant difference in the soil gas diffusion coefficient between different sampling depths (p<0.05).
While both air-filled porosity and the soil gas diffusion coefficient decreased with depth, they exhibited distinct depth profiles. The decrease in gas diffusivity between the top layer and the middle layer was generally slightly greater than the corresponding decrease in air-filled porosity. By contrast, the difference in the average soil gas diffusion coefficient between the middle and bottom layers was smaller than the difference in air-filled porosity, especially at lower matric potentials. Gas diffusivity remained rather high, even in nearly saturated peat with low air-filled porosity. By contrast, the increase in gas diffusivity with increasing air-filled porosity was moderate under drier conditions. However, the number of measurements with an air-filled porosity greater than 0.4 m3 m−3 was rather small.
3.2 Pore network simulations of diffusion
The conditions at −3 kPa matric potential corresponded most closely to the configuration of the air-filled pore networks extracted from the µCT images, as the feature resolution of the images, 100 µm, roughly equals the minimum air-filled pore dimension at −3 kPa conditions. Because some of the gas diffusion measurements at −3 kPa were not successful, only four of the seven samples from each layer were applicable to the comparison. The porosities of the pore networks were generally very well in line with the air-filled porosities of the corresponding peat samples at −3 kPa conditions (Fig. 1a). The difference between the measured air-filled porosity and the network porosity was not statistically significant (mean difference 0.01 m3 m−3; two-tailed paired sample t test for log-transformed values, and p=0.65), although it increased with increasing porosity. The measured air-filled porosity was higher than the network porosity in all the bottom-layer samples, while the opposite was the case in the middle layer. Network porosity was considerably higher than the measured air-filled porosity in one of the top-layer samples, because the void fraction of the µCT image was considerably overestimated.
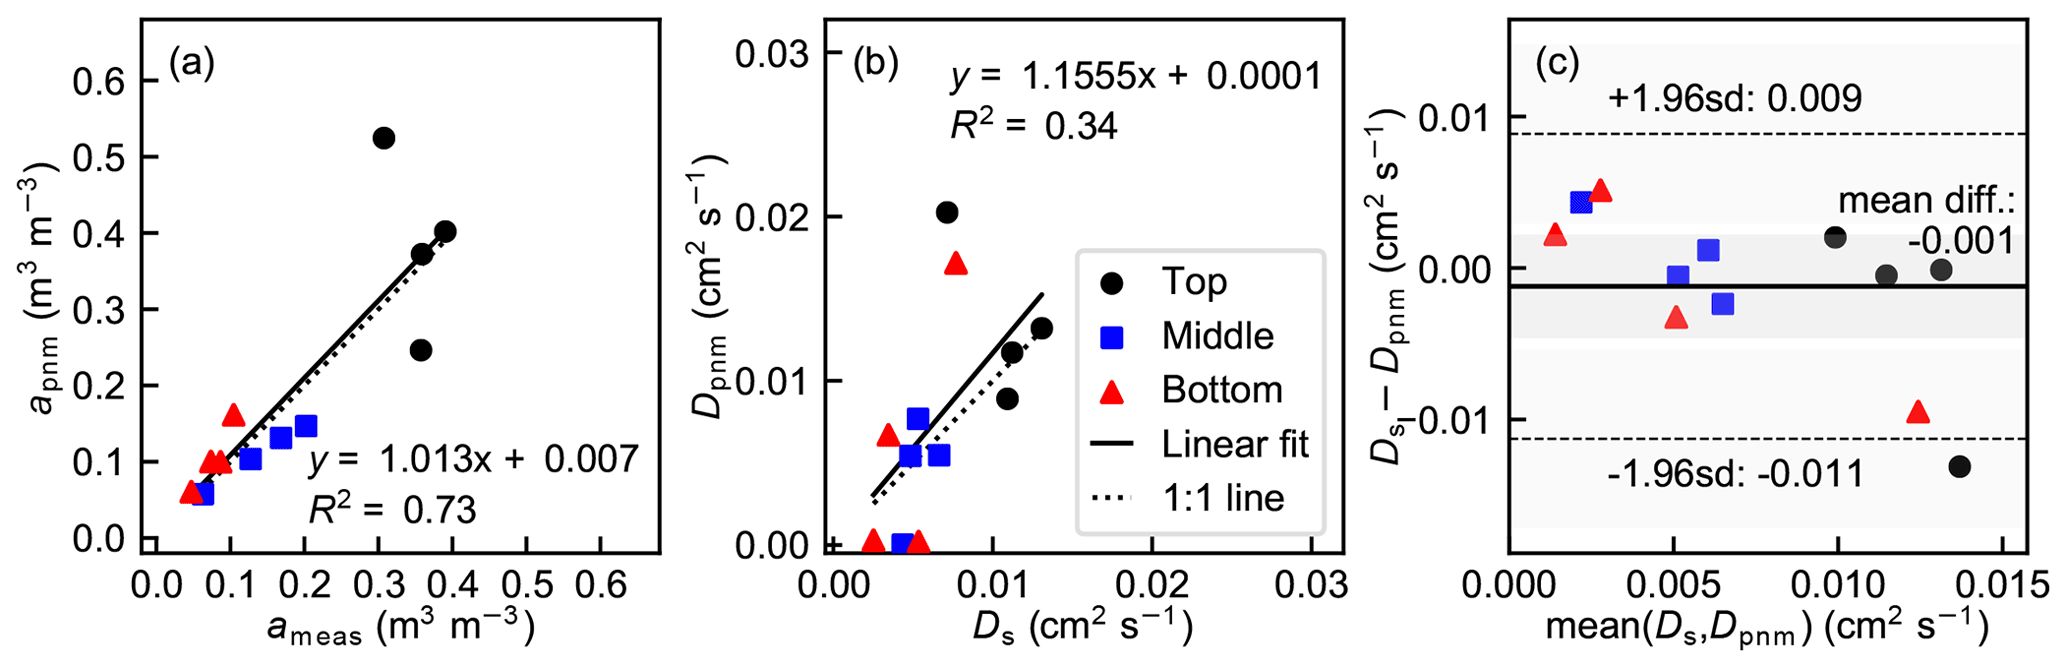
Figure 1(a) Comparison of measurement-derived air-filled porosity (ameas) at −3 kPa matric potential and the air-filled porosity of corresponding pore networks (apnm) for peat samples from the depths of 0–5 cm (top), 20–25 cm (middle), and 40–45 cm (bottom). The determination of ameas was performed by subtracting the measured volumetric water content from the total porosity of the sample. (b) Comparison of soil gas diffusion coefficients determined from measurements (Ds) at −3 kPa matric potential and obtained through pore network simulations (Dpnm) for peat samples from different depths. (c) Bland–Altman plot showing the difference between the soil gas diffusion coefficients obtained with the two determination methods against the average of the values obtained by the methods for each sample. The solid line represents the mean difference, darker gray shading shows the 95 % confidence interval (CI) of the mean difference, and the dashed lines and the lighter gray shading show the 95 % limits of agreement and their 95 % CI, respectively.
The soil gas diffusion coefficients obtained through the pore network simulations (Dpnm) corresponded well to those determined from measurements (Fig. 1b). There was no significant difference between Ds and Dpnm (mean difference 0.001 cm2 s−1; two-tailed paired sample t test, and p=0.45). The values obtained with PNM were notably smaller than the measured values at the lower end of the range of D (Fig. 1c). These cases corresponded to samples with low air-filled porosity, in which the connected pore networks extending through the whole sample domains were so sparse that their gas diffusion capability was very low. By contrast, two of the simulated soil gas diffusion coefficients were considerably higher than their measured counterparts. These discrepancies were due to overestimation of the network porosity (the top-layer sample) or a slight horizontal shrinkage generating continuous void space around the sample (the bottom-layer sample).
The pore network simulations showed considerable hysteresis in peat water content between wetting and drying conditions (Fig. 2). Air-filled porosity was higher at a specific matric potential during wetting than during drying, which resulted in a similar behavior in gas diffusivity. However, gas diffusivity in peat was lower at a specific air-filled porosity during wetting than during drainage (Fig. 2g–i).
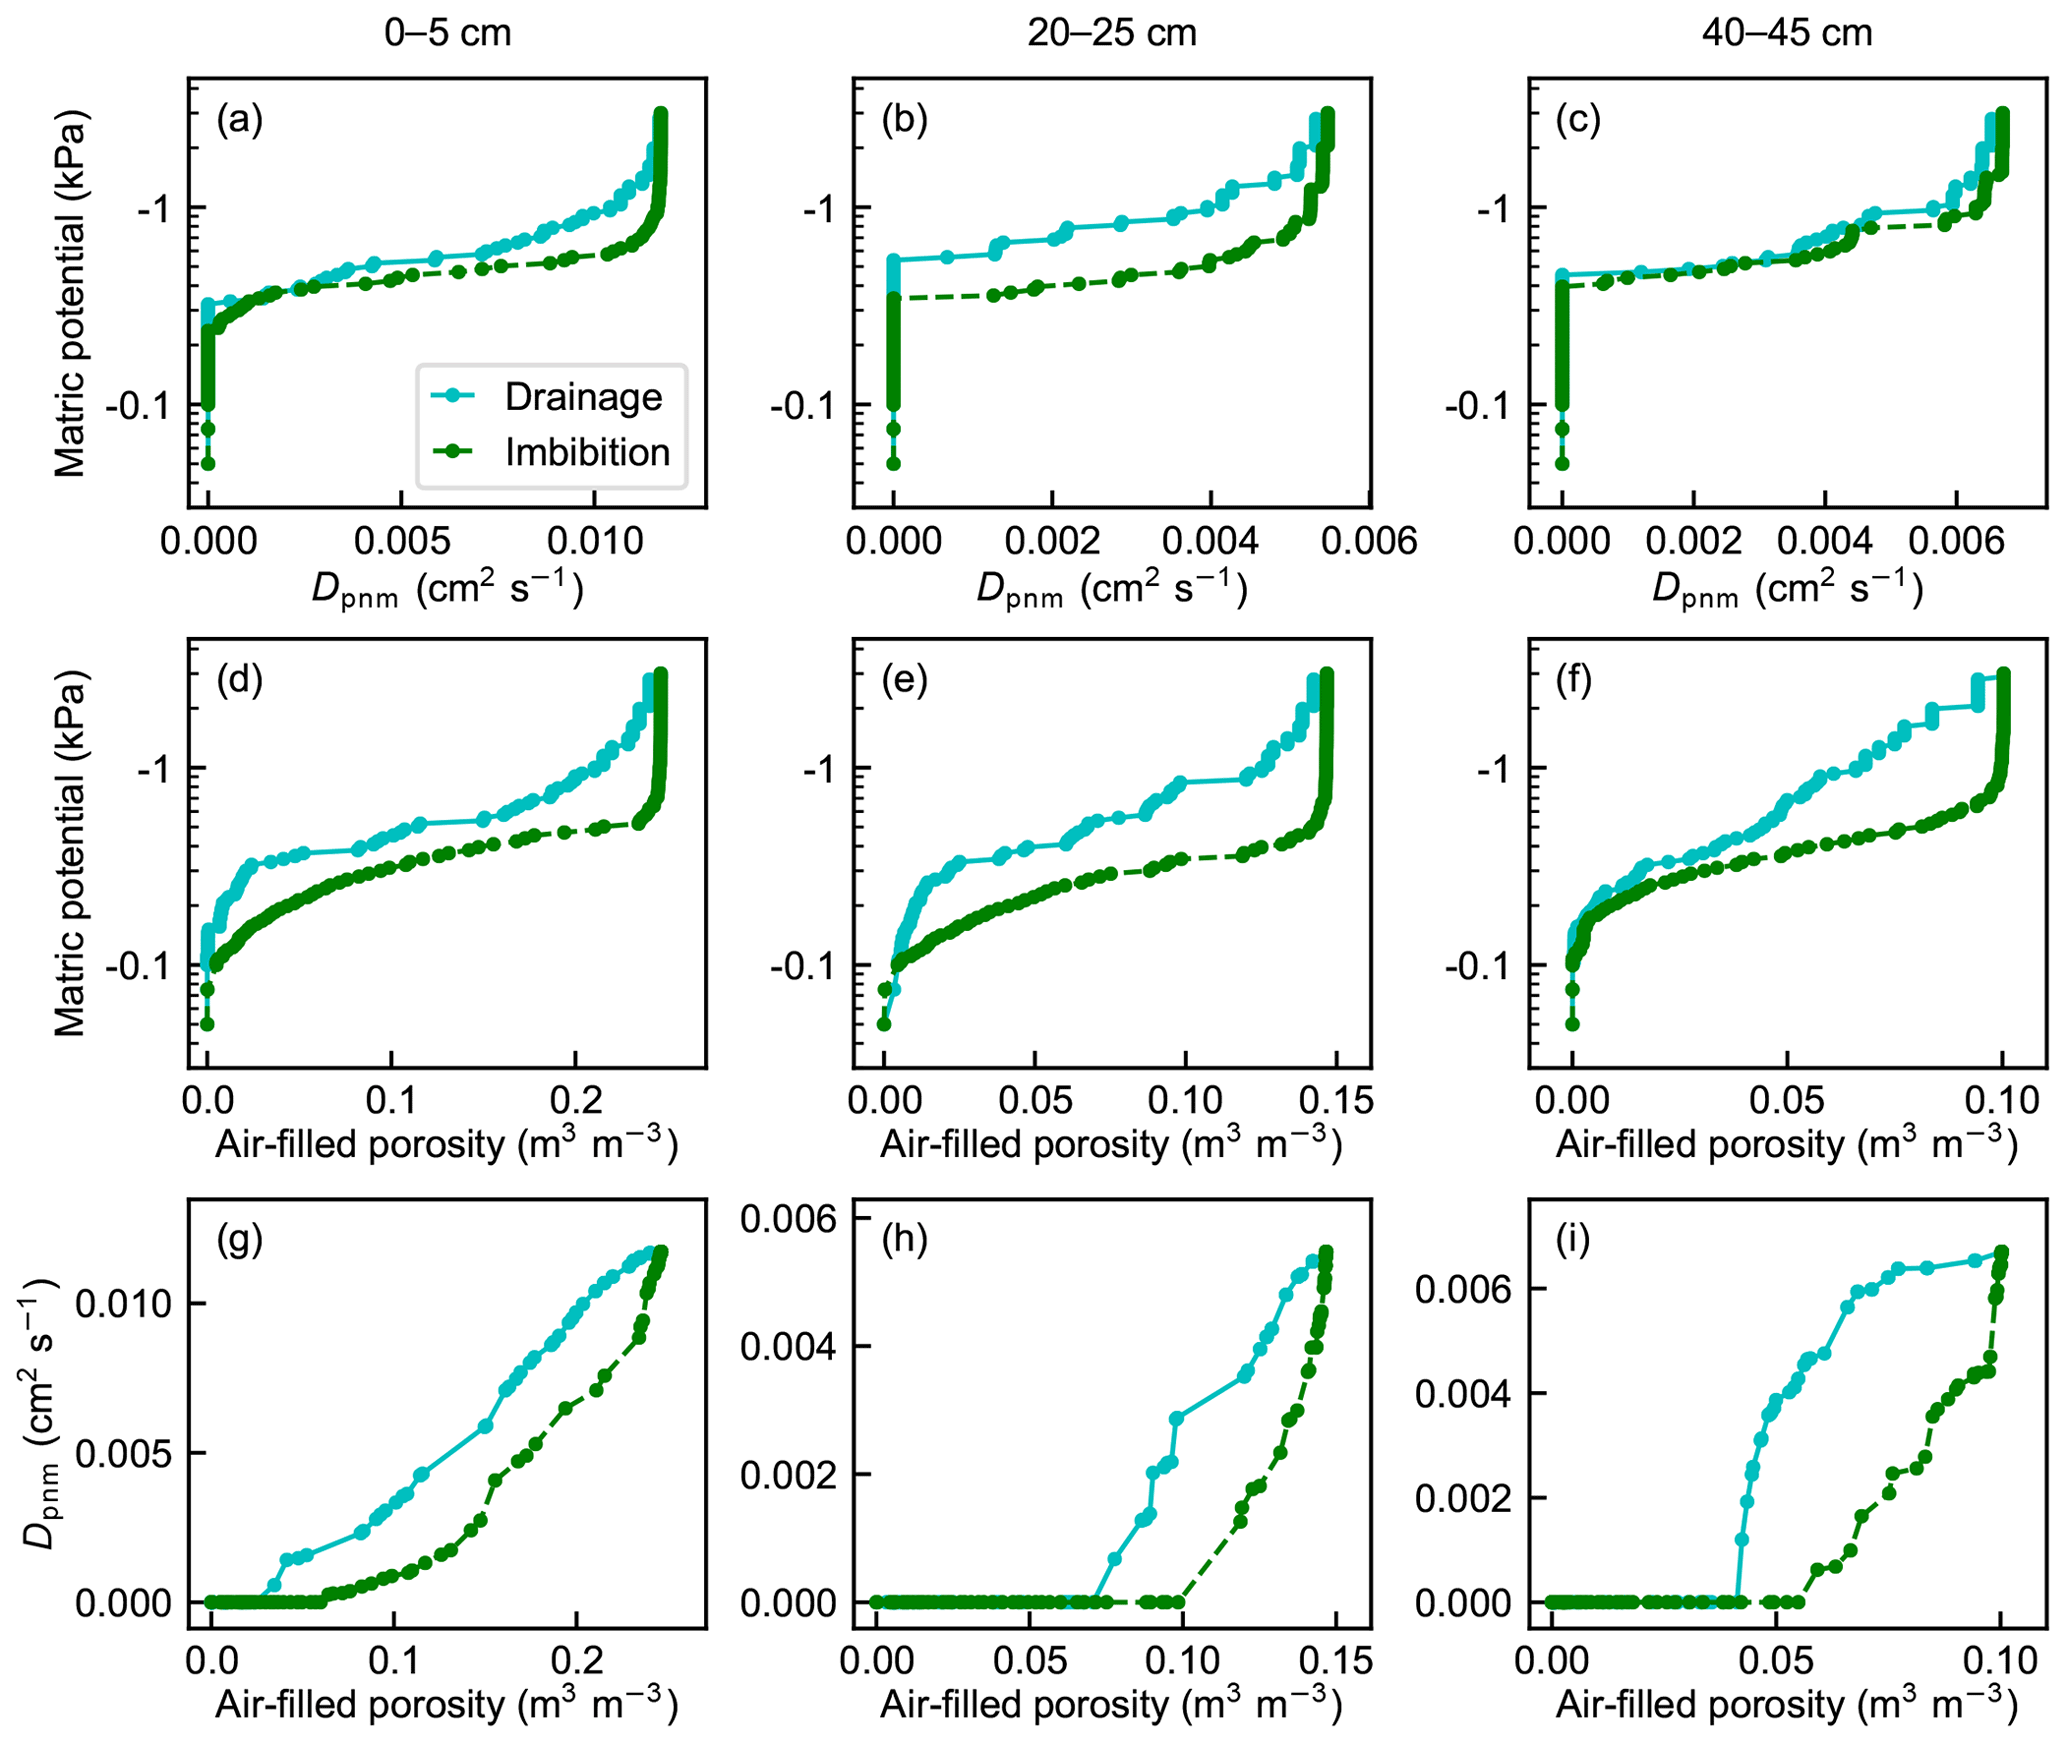
Figure 2Simulation results for selected peat samples from (a, d, g) 0–5 cm, (b, e, h) 20–25 cm, and (c, f, i) 40–45 cm depths: (a–c) soil gas diffusion coefficient and (d–f) air-filled porosity as a function of matric potential and (g–i) soil gas diffusion coefficient as a function of air-filled porosity.
3.3 Comparison of measured relative diffusivity with models
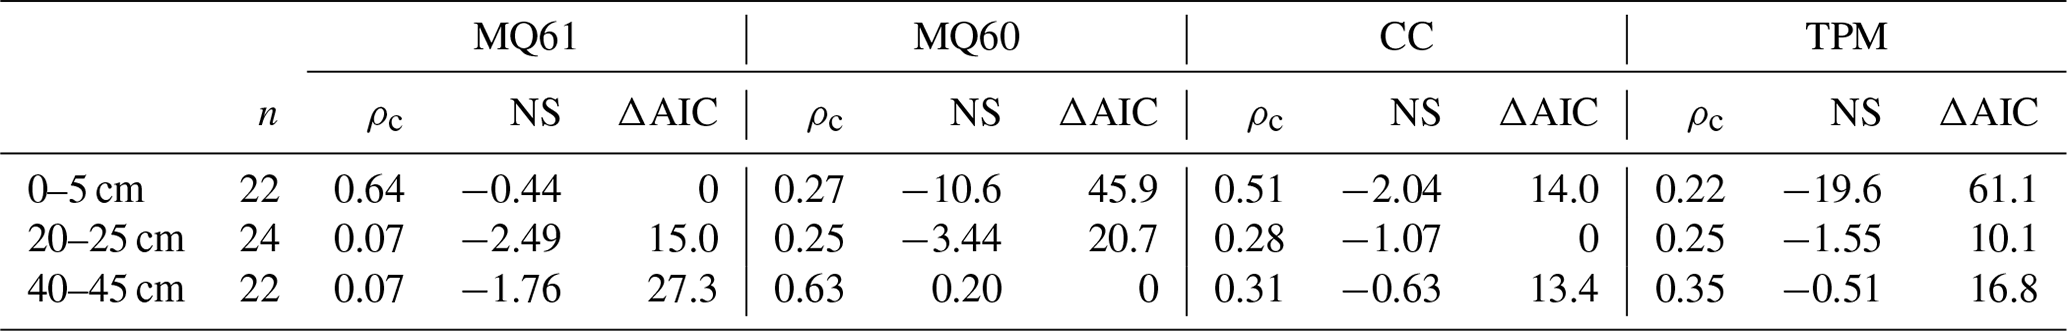
The agreement between measured relative diffusivities and those obtained with different gas diffusivity models varied with depth (Fig. 3). In the top layer with the highest porosity, the models tended to overestimate the relative diffusivity. By contrast, measured relative diffusivities were often considerably higher than any of the model-estimated values in the middle and bottom layers, especially at low air-filled porosity. The MQ61 model gave the best correspondence in the top layer, and the MQ60 model yielded the best agreement in the bottom layer (Table 3). In the middle layer, the CC model performed best, although the TPM model and the CC model yielded quite similar results for the middle and bottom layers. However, the relative diffusivity of one of the middle-layer samples was low in comparison to air-filled porosity, which was reflected in the goodness-of-fit analysis. If that sample was excluded from the analysis, the MQ60 model would give the best agreement, followed by the TPM model and the CC model, as in the bottom layer. Overall, the MQ61 model predicted the lowest values for all depths, whereas the MQ61 model gave the highest estimates.
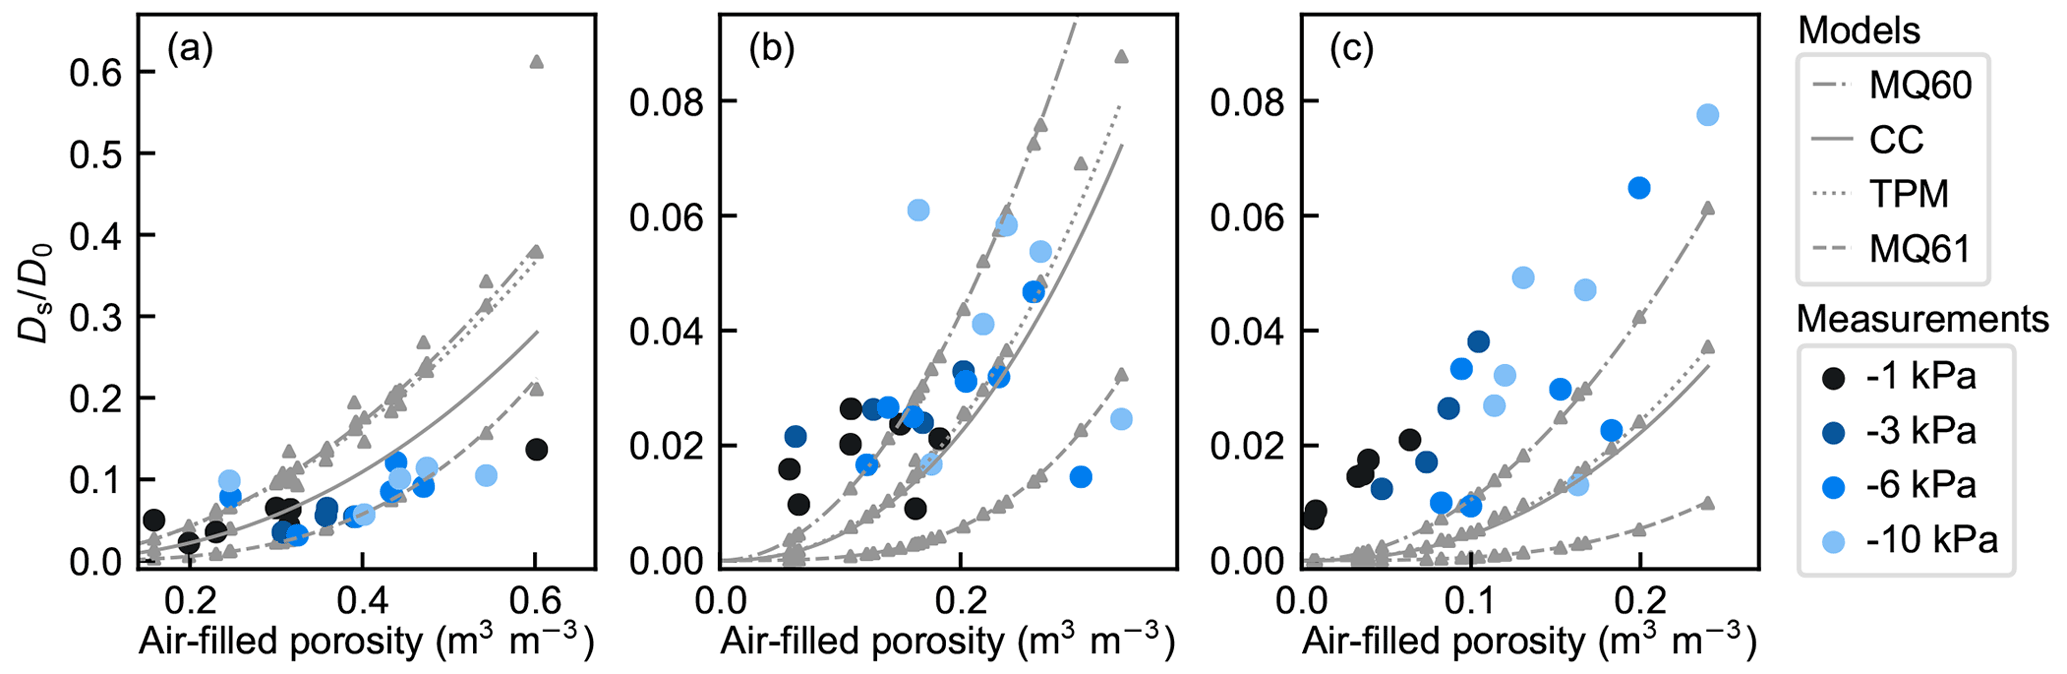
Figure 3Measured (circular markers) and model-estimated (lines) relative diffusivity () against air-filled porosity for peat samples from the depths of (a) 0–5 cm, (b) 20–25 cm, and (c) 40–45 cm. Individual values of models MQ60, MQ61, and TPM are presented by triangular gray markers, and corresponding reference lines obtained using average porosity values for each depth are also shown.
Table 3Lin's concordance correlation coefficients (ρc), Nash–Sutcliffe efficiency coefficients (NS), and Akaike information criterion differences (ΔAIC) for each of the applied models for relative diffusivity .
The relative diffusivity at −10 kPa conditions as a function of air-filled porosity is used as a basis for the diffusivity parameterization in the TPM model. The measured relative diffusivities were generally higher than the estimate given by Eq. (6) for air-filled porosity values less than 0.3, whereas the equation yielded substantially higher values than the measurements for a higher air-filled porosity (Fig. 4).

Figure 4Measured relative diffusivity at −100 cmH2O (−10 kPa) matric potential as a function of air-filled porosity and the empirical equation by Moldrup et al. (2000).
4.1 Soil gas diffusivity measurements
The relative diffusivity values obtained in the study, 0.01–0.15, were within ranges previously reported for peat in the literature (Iiyama and Hasegawa, 2005; Boon et al., 2013; Hamamoto et al., 2016a). Gas diffusivity was clearly highest in the top layer with the highest air-filled porosity, but the difference in gas diffusivity between the middle and bottom layers was rather small despite the notable decrease in air-filled porosity with depth (Table 2). Our findings are in line with a simulation study by Gharedaghloo et al. (2018), who found that gas diffusivity in Sphagnum peat decreased with depth at the topmost 15 cm layer. However, the gas diffusivities at the topmost 10 cm of the Sphagnum peat with an air-filled porosity range of 0.3 to 0.6 m3 m−3 were considerably higher than our results for Carex peat from a drained peatland, which may reflect the differences in peat structure. Peat type and decomposition stage are important factors affecting peat structure and transport properties (Liu and Lennartz, 2019). The pore size distribution of Carex peat is known to differ from that of Sphagnum peat because of higher susceptibility to decomposition (McCarter et al., 2020); enhanced decomposition due to oxic conditions in the unsaturated layer of a drained peatland further increases the differences (Kleimeier et al., 2017). By contrast, the relative diffusivity of slightly or moderately decomposed Sphagnum-dominated peat with an air-filled porosity of less than 0.15 m3 m−3 was generally lower than 0.02 and often lower than 0.01 in Iiyama and Hasegawa (2005) and in Hamamoto et al. (2016a), whereas the relative diffusivity was always 0.01 or higher and sometimes as high as 0.04 under similar conditions in our study.
The results support the notion that macropore networks and their evolution with soil water content have a significant role in gas diffusion in peat, as suggested in Kiuru et al. (2022a). The gas diffusion capability of soil decreases with decreasing air-filled porosity because of the diminishing and reshaping of the air-filled fraction of the pore network and the resulting decrease in pore connectivity (Moldrup et al., 2004). As smaller pores are filled with water, the air-filled pathways become more tortuous, and the transport paths through the soil matrix become longer. In addition, pore dimensions and the total macropore volume are reduced with depth in peat because of an increasing degree of organic matter decomposition and higher compression by overlying matter (Rezanezhad et al., 2016). However, the fact that gas diffusivity was not extensively suppressed deeper in the peat profile despite the constant decrease in air-filled volume with depth indicates that the connectivity of the macropore network remained high enough for gas transport to be sustained, even in low air-filled porosity conditions.
The structure and connectivity of the top-layer macropore networks differed greatly from those of the deeper-layer networks, as the following short overview shows. The macropore network metrics are presented in detail in Kiuru et al. (2022a). The average macropore volume in the top layer (0.32 mm3) was almost double the average volume in the middle and bottom layers (0.19 mm3 in both layers). However, the difference between median pore throat diameters was smaller, as the median diameters were 0.25, 0.23, and 0.20 mm in the top, middle, and bottom layers, respectively. The average pore coordination number – that is, the number of connections to a pore – was almost twice as large in the top-layer networks (6.0) as in the middle- and bottom-layer networks (3.3 and 3.1 in the middle and bottom layer, respectively). The geometrical tortuosity was also significantly lower in the top layer (1.6) than in the deeper layers (2.7 and 2.3). Thus, the lower connectivity and higher tortuosity of the middle-layer and bottom-layer samples were reflected in a lower gas diffusivity. However, the network metrics are not directly comparable to the diffusion measurements, because the volume of the network domain used in the calculation of the network metrics was smaller than the total sample volume.
The wide range in the values of the soil gas diffusion coefficient between samples from the same depth revealed the large heterogeneity of peat structure (Fig. 3). The variability in gas diffusivity reflects not only the spatial variability in air-filled porosity but also the complexity of the geometry, dimensions, and connectivity of the macropore space (Kiuru et al., 2022a). For example, the average pore coordination number varied from 3.8 to 8.3 and the geometrical tortuosity from 1.4 to 1.8 in the top-layer networks. In addition, gas diffusivity did not increase with porosity similarly in all samples because of the vertical variation in porosity in some samples. Vertical soil structure with alternating more porous and less porous layers may result in a fairly high average porosity but does not allow gas diffusion through the sample because of the obstructing effect induced by the less porous layers.
The shrinkage behavior of peat may have affected the soil gas diffusivity measurements under low-matric-potential conditions. Slight horizontal shrinkage was observed in many of the middle- and bottom-layer sample images, which were constructed at −10 kPa conditions. The gradual development of shrinkage with drying may have resulted in a progressively overestimated measured soil gas diffusion coefficient under increasingly lower matric potentials because of the continuous void space that was formed between the peat matrix and the cylinder wall. Gas leakage along the voids at the margin of the cylinder may have increased the observed gas diffusion rate. By contrast, the estimated N2 concentration difference between the diffusion chamber and free air was rather small during the second gas sampling in some of the top-layer samples with a high air-filled porosity at −10 kPa conditions, and the system may therefore have been close to equilibrium by that time. This may have resulted in too low a calculated soil gas diffusion coefficient.
The decrease in gas diffusivity with depth in wet conditions decreases the potential gas transfer rate through the unsaturated layer in peat. Therefore, it should be taken into account in, for example, the estimates of soil aeration and the development of process-based biogeochemical models. A simplified calculation for O2 diffusivity illustrates the difference. Let an unsaturated zone of depth 0.5 m be divided into three discrete layers with equal thickness. Let us further assume that O2 concentration at the surface corresponds to the atmospheric concentration of 300 g m−3 and that the concentration at the WT level is zero. If there are no O2 sinks in the unsaturated zone and if the diffusivities of these layers equal the averages of our results with roughly corresponding matric potential conditions (Table 2), the O2 flux through the unsaturated zone is approximately 30 . If the soil gas diffusion coefficient is set equal to the top-layer value in the entire unsaturated layer, the flux is approximately 80 – that is, about 3 times as high. These kinds of totally constant conditions are obviously not realistic in nature, because the vertical gradient of volumetric water content is high in unsaturated soil with a high WT, which strongly affects the change in soil gas diffusivity with depth.
4.2 Application of PNM to gas diffusion in peat
A network representation of pore space generated by X-ray tomography and image analysis provides detailed information on the topology and geometry of peat pore structures that cannot be obtained with traditional laboratory methods. PNM then combines the pore space connectivity described by network topology with a semi-analytical description of transport processes between two neighboring pores (Blunt et al., 2013). The pore network structure and the dimensions of the flow routes govern the capability of gas diffusion in peat. One of the aims of our study was to evaluate the applicability of PNM to the assessment of gas diffusivity in peat. Despite the limitations imposed by the applied imaging resolution (see Kiuru et al., 2022a) and the geometrical simplifications, the simulated soil gas diffusivity generally matched the measured values very well (Fig. 1). Even though the microscale description of the peat pore space geometry was considerably simplified by using the stick-and-ball representation with spherical pores and cylindrical throats, the overall performance of the pore network simulations was adequate, as the integrated contribution of the gas diffusion process in each network element to the effective diffusion capability of the whole network domain was generally well reproduced. Therefore, the effective performance of the PNM method in the simulation of the macroscopic gas diffusion process in peat can be considered good. The smallest throat diameter distinguishable in the µCT images was 100 µm, which corresponds to a matric potential of about −3 kPa. Thus, the images have apparently contained sufficient information for a proper representation of the pore structure relevant to gas diffusion at the −3 kPa conditions. The principal connected pore space made the major contribution to gas diffusion in the sample scale, whereas small throats and dead-end pores that were perhaps undetectable in the images may have had an insignificant effect on the gas transport behavior (Blunt et al., 2013). The pore network method is also suitable for the assessment of gas diffusivity in peat, because the resolution of 100 µm is sufficient for an accurate characterization of gas diffusion in unsaturated peat, where the WT typically remains close to the surface and where smaller pores are generally filled with water.
PNM has been extensively and successfully applied to the simulation of fluid flow and mass transport in porous media (e.g., Blunt et al., 2002; de Vries et al., 2017; Sadeghi et al., 2020). If the features and phenomena relevant to the simulated process are adequately identified and described, PNM is able to give reliable results (Xiong et al., 2016). Several features important in gas diffusion were well accounted for in our simulations. The topology and connectivity of the pore network, which was obtained directly from the µCT images, corresponded to that of the macropore space of the peat sample. The structural anisotropy of the pore space, which is a conspicuous characteristic of peat (McCarter et al., 2020), was incorporated into the topology of the pore network, as the orientation of each transport conduit was represented by the orientation of the throat in the three-dimensional pore network. As in Eq. (8), the diffusion rate between two pores is dependent on the length and the cross-sectional area of the conduit between them. The segmentation of the pore space to individual pores was not based on unequivocally determined criteria, which is always the case for soil (Nimmo, 2005), but the spatial coordinates and the cross-sectional areas of the resulting pores and throats were well defined. The watershed algorithm used in pore segmentation is also well suited to high-porosity materials, such as peat (Gostick, 2017). The simplification of the shapes of the transport conduits into spheres and cylinders was therefore the only major approximation that may have considerably affected the calculated diffusional conductance values of the conduits. In addition, the minimum conduit diameter of 100 µm was 3 orders of magnitude higher than the mean free path of air molecules at standard conditions (Rumble, 2021), and the Fickian diffusion approach remained valid.
However, not all simulation results corresponded to the measured values so closely. The primary reasons for the discrepancies were an incorrect pore network description induced by the limited imaging resolution and sample shrinkage. Pore network simulations underestimated the soil gas diffusion coefficient by an order of magnitude for some of the samples with an air-filled porosity of less than 0.1 m3 m−3. The structure of these samples may have been so dense and the pore dimensions so small that the narrowest portions of all the diffusion routes through the sample were largely indistinguishable in the images. By contrast, some of the soil gas diffusion coefficients were notably overestimated by the simulation. This resulted from an incorrect description of the pore network geometry due to inaccurate estimation of the air-filled volume of the images or from an incorrect determination of the extent of the connected pore space due to sample shrinkage. Too high an intensity threshold used in the image solid–void classification stage increased the network volume and the pore and throat dimensions and thus falsely enhanced the transport capacity of the network. Sample shrinkage affected the performance of the network generation process, because the µCT imaging was performed for samples at −10 kPa conditions, while the pore network distinguishable in the images corresponded to the extent of the air-filled pore space at −3 kPa conditions. If the sample had shrunk between −3 and −10 kPa conditions, the pore network structure extracted from the image was not representative for the conditions at −3 kPa. The shrinkage of the samples resulted in the generation of continuous void space between the sample and the cylinder wall, which was then classified as a part of the pore network and therefore increased the network transport capacity.
The applicability of PNM is strongly affected by the accuracy of the description of the pore space volume and dimensions by the network representation. The air-filled porosities of the networks corresponded very well to the measurement-based estimates at −3 kPa conditions (Fig. 1a). However, the inaccuracy of air-filled porosity calculations may complicate the issue. Values of peat particle density as low as 1300 kg m−3 have been reported for peat (Päivänen, 1973). Using the value 1400 kg m−3 instead of 1500 kg m−3 for particle density would result in 0.005 to 0.008 m3 m−3 smaller air-filled porosity values within the bulk density range of the samples – 110 to 180 kg m−3, as reported in Kiuru et al. (2022a). That would affect the comparison, especially at deeper layers with smaller air-filled porosity.
The effect of hysteresis on soil gas diffusivity is one of the issues that can be conveniently studied using PNM. Experimental determination of the differences in soil dynamics between drying and wetting conditions is complex and time-consuming (Likos et al., 2014), whereas the consequences of hysteresis for the evolution of air-filled pore structure can readily be estimated through water retention and imbibition simulations. However, changes in pore dimensions due to shrinking during drying and swelling during wetting may complicate the assessment of the hysteretic behavior of peat with PNM. According to our results, gas diffusivity at a specific matric potential was higher during wetting than during drying, thus qualitatively following the behavior of air-filled porosity. However, gas diffusion was rapidly suppressed with decreasing air-filled porosity, while gas diffusivity increased considerably faster in drying conditions (Fig. 2). In addition, the threshold air-filled porosity for gas transport was substantially higher in wetting than in drying conditions, especially in deeper layers. This can be explained by the dynamics of pore filling and emptying. The largest pores were readily emptied of water when saturated soil started to dry, whereas the smallest pores were the first ones to be filled with water during wetting. When the smallest pores near the bottom of the sample started to fill with water with an increasing matric potential, gas diffusivity started to decrease quickly, because the air-filled conduits between the top and bottom got blocked. The decrease was most pronounced in deeper layers where the fraction of the smallest pores was higher. This diminished the quantitative effect of hysteresis on gas diffusivity in peat.
Upscaling issues are a common challenge in the application of µCT-related methods and in the comparison of pore network simulations with the results of measurements performed in core scale and thus in the assessment of the validity of the PNM approach (Blunt et al., 2013). High-resolution images of samples of a size typically used in the measurements are very large, and image processing and pore network simulation in these networks would be computationally highly intensive. Therefore, the domain size used in PNM is often considerably below the core scale (Gharedaghloo et al., 2018). The heterogeneous structure of peat complicates the upscaling from µCT scale to core scale, because properties determined for a small volume may often not be statistically representative for the whole sample. This is the case especially for transport properties, which are affected by the tortuosity and connectivity of the medium (Mostaghimi et al., 2013). However, we were able to simulate and reproduce the gas diffusion behavior in wet peat satisfactorily in the core scale by combining the simulation results for four parallel networks despite the fact that some information on pore space connectivity was missed because of the domain division.
4.3 Applicability of gas diffusivity models to peat
Simple but efficient gas diffusivity models are needed for the characterization of gas transport in process-based models for simulating GHG production in peat and gas exchange between soil and the atmosphere (e.g., Fan et al., 2013; Raivonen et al., 2017) and for the estimation of soil GHG fluxes with the concentration gradient method (Sullivan et al., 2010; Maier and Schack-Kirchner, 2014). The applicability of gas diffusivity models constructed for porous materials in general (for example, the models by Currie, 1960, Millington and Quirk, 1960, and Millington and Quirk, 1961) or for mineral soils (for example, the model by Moldrup et al., 2004) to organic material such as peat is often considered poor (Iiyama and Hasegawa, 2005). In our study, the models were not able to reproduce the observed gas diffusivity behavior in peat very well, especially under high-matric-potential conditions. Measured relative diffusivities were higher than the model estimates under the conditions of low air-filled porosity. In addition, none of the examined gas diffusivity models significantly outperformed the other models. Higher model complexity did not increase its predictive capacity, as the three-parameter TPM model was not the best-performing option for any peat layer.
Our results are in line with Boon et al. (2013), who found that gas diffusion models, including CC and MQ61, underestimated the relative diffusivity in peat with air-filled porosity of less than 0.2. However, relative diffusivity also remained higher than the model estimates under higher air-filled porosity conditions in Boon et al. (2013). The MQ61 model also generally underestimated the relative diffusivity in peat, especially at the conditions of low air-filled porosity, in Hamamoto et al. (2016a). Iiyama and Hasegawa (2005) found that the MQ61 model performed better than the TPM model, the latter of which overestimated relative diffusivity in peat.
The unique physical structure of peat is an important factor behind the poor applicability of the traditional gas diffusivity models to peat. The application of gas diffusivity models with empirical parameters is known to be limited to soils similar to those used for calibration (Blagodatsky and Smith, 2012). The fact that the models underestimated the relative diffusivity under high-matric-potential conditions is in line with King and Smith (1987), who found that relative diffusivity in peat was generally higher at air-filled porosity values below 0.10 m3 m−3 and lower at air-filled porosity above 0.13 m3 m−3 than corresponding literature values for mineral soils. A large number of natural macropores is a characteristic feature of peat (Lennartz and Liu, 2019). The macropores are formed by partially decomposed plant residues and therefore form a highly connected network functioning as a channel system that facilitates gas diffusion despite a low bulk air-filled porosity. The theoretically based MQ61 model was derived assuming spherical pores and a uniform pore size distribution, which is a rough simplification, especially for peat that has a wide pore size distribution. However, the MQ61 model has also been shown to overestimate relative diffusivity for high air-filled porosity values in mineral soils (Jin and Jury, 1996; Moldrup et al., 2000).
By contrast, the measured gas diffusivity did not increase with increasing air-filled porosity as much as the gas diffusivity models estimated. For example, the parameterization (Eq. 6) used in the TPM model failed to capture the measured relative diffusivity at the upper end of the air-filled porosity range, 0.40–0.55 m3 m−3 (Fig. 4). These values are close to the total porosity of many mineral soils (Hillel, 1998). The TPM model, being developed on the basis of gas diffusivity measurements in mineral soil, may have failed to account for the pore structure and high macroporosity inherent to peat soils. The gas diffusivity of a porous medium is lower in the presence of more tortuous diffusion pathways (Moldrup et al., 2001). This supports the notion that peat may display a more complex configuration of air-filled pores and a larger number of dead-end pores, which do not contribute to gas transport, than mineral soil. Low gas diffusivity under the conditions of high air-filled porosity may also result from a vertically layered peat structure and anisotropic pore connectivity, which obstructs gas diffusion in the direction towards the atmosphere. In addition, the heterogeneous physical structure of peat impedes the determination of a specific gas diffusivity value for soil with certain bulk properties. Our results revealed large variation in gas diffusivity under specific air-filled porosity conditions.
The rapid decrease in gas diffusivity with depth predicted by the gas diffusivity models has a remarkable effect on gas transfer capacity through the unsaturated layer in comparison to the measured soil gas diffusivity. This may result in a significant underestimation of gas transfer rates in peat. A simplified calculation for CH4 diffusion shows the high impact of the difference between the measured and the model-estimated soil gas diffusion coefficients. Let an unsaturated zone of depth 0.5 m be divided into three layers with equal thickness. Let us further set the CH4 concentration in the air-filled pores at the WT level to 50 g m−3 and the concentration at the surface to zero. If there are no CH4 sinks in the unsaturated zone and if the diffusivities of these layers equal the measured average values (Table 2) as in the example calculation in Sect. 4.1, the CH4 flux through the unsaturated zone to the atmosphere is approximately 4 . By contrast, if the gas diffusivity model estimates calculated from the corresponding air-filled porosity values are used as the soil gas diffusion coefficients for each layer, the flux is only 0.006 to 0.5 . The main reason for the small fluxes predicted by the gas diffusivity models is the small estimated soil gas diffusion coefficient in the bottommost layer with low air-filled porosity.
We studied gas diffusivity in unsaturated peat using laboratory experiments and pore network simulations. With some exceptions, the simulations conducted using the macropore networks constructed from the µCT images of the peat samples were able to reproduce the measured gas diffusion dynamics characterized by the soil gas diffusion coefficient. Therefore, the µCT and PNM methods may offer a promising alternative to the traditional estimation of transport properties of peat through laboratory measurements, which are often prone to technical and procedural errors. The pore network approach also enables a more explicit investigation of relations between the physical structure of peat and its larger-scale gas transport properties. In addition, PNM can give insight into the pore-scale processes and phenomena that affect the GHG dynamics in peat. However, the performance of PNM is strongly dependent on the quality of µCT imaging and image processing and the success of pore network generation. If peat pore space topology and pore geometry are correctly represented by the pore network object, our results indicate that soil gas diffusivity can be estimated adequately using the PNM approach.
Gas diffusivity measurements for peat assist in the choice of a suitable description of gas diffusion processes and a proper parameterization of the soil gas diffusion coefficient in process-based models that are used to simulate biogeochemical processes and GHG production and emissions in peatlands. However, the gas diffusivity models investigated in this study were not very successful in estimating gas diffusivity in peat, especially in nearly saturated conditions. The gas diffusivity models constructed for uniform porous material or mineral soil were probably not able to account for the impact of the distinctive structure of peat. This highlights the need for further experimental research on gas diffusivity in different types of unsaturated peat over a wide air-filled porosity range.
The data that support the findings of this study are available at https://doi.org/10.5281/zenodo.7193268 (Kiuru et al., 2022b) and at https://doi.org/10.5281/zenodo.6327112 (Kiuru et al., 2022c). The µCT image, binary image, and pore network data are available from the corresponding author upon reasonable request. The image processing and simulation parts of this study used the publicly available packages PoreSpy and OpenPNM. The Python scripts used in the calculations and the simulation output are available at https://doi.org/10.5281/zenodo.7193268 (Kiuru et al., 2022b).
AL and TG developed the idea and designed the study. AL and MP collected the samples and performed the water retention and gas diffusivity measurements. LK performed the gas chromatography measurements. TG and MR organized the µCT imaging and 3D reconstruction. PK processed the images and designed and conducted the simulations. PK and AM conducted the computations and analyzed the data. PK performed the statistical analysis. PK wrote the manuscript with significant contributions from AM, AL, MP, and LK. All other authors provided edits and comments on the paper. AL and MR are responsible for the funding acquisition.
The contact author has declared that none of the authors has any competing interests.
Publisher’s note: Copernicus Publications remains neutral with regard to jurisdictional claims in published maps and institutional affiliations.
This research has been supported by the Academy of Finland (grant nos. 325168 and 325169). Lukas Kohl holds a Marie Skłodowska-Curie Actions fellowship under the European Commission's Horizon 2020 program (grant no. 843511). Maarit Raivonen acknowledges SRC at the Academy of Finland (SOMPA, no. 312932) and EU Horizon 2020 (VERIFY, no. 776810). This work used services of the Helsinki University X-Ray Micro-CT Laboratory, also funded by the Helsinki Institute of Life Science (HiLIFE) under the HAIP platform.
This research has been supported by the Academy of Finland (grant nos. 325168, 325169, and 312932), the Horizon 2020 Framework Programme, H2020 Excellent Science (PaTreME (grant no. 843511)), and the Horizon 2020 Framework Programme, H2020 Societal Challenges (VERIFY (grant no. 776810)).
This paper was edited by Ben Bond-Lamberty and reviewed by Haojie Liu and one anonymous referee.
Abdalla, M., Hastings, A., Truu, J., Espenberg, M., Mander, Ü., and Smith, P.: Emissions of methane from northern peatlands: a review of management impacts and implications for future management options, Ecol. Evol., 6, 7080–7102, https://doi.org/10.1002/ece3.2469, 2016. a, b
Akaike, H.: A new look at the statistical model identification, IEEE T. Automat. Contr., 19, 716–723, https://doi.org/10.1109/TAC.1974.1100705, 1974. a
Bakker, J. W. and Hidding, A.: The influence of soil structure and air content on gas diffusion in soils, Neth. J. Agr. Sci., 18, 37–48, https://doi.org/10.18174/njas.v18i1.17354, 1970. a
Ball, B. C. and Smith, K. A.: Gas movement and air-filled porosity, in: Soil and Environmental Analysis: Physical Methods, 2nd Edn., edited by: Smith, K. A. and Mullins, C. E., 499–538, Marcel Dekker, New York, NY, ISBN 978-0-8247-0414-8, 2001. a
Beven, K. and Germann, P.: Macropores and water flow in soils, Water Resour. Res., 18, 1311–1325, https://doi.org/10.1029/WR018i005p01311, 1982. a
Blagodatsky, S. and Smith, P.: Soil physics meets soil biology: Towards better mechanistic prediction of greenhouse gas emissions from soil, Soil Biol. Biochem., 47, 78–92, https://doi.org/10.1016/j.soilbio.2011.12.015, 2012. a, b
Bland, J. M. and Altman, D. G.: Measuring agreement in method comparison studies, Stat. Methods Med. Res., 8, 135–160, https://doi.org/10.1177/096228029900800204, 1999. a
Blunt, M. J., Jackson, M. D., Piri, M., and Valvatne, P. H.: Detailed physics, predictive capabilities and macroscopic consequences for pore-network models of multiphase flow, Adv. Water Resour., 25, 1069–1089, https://doi.org/10.1016/S0309-1708(02)00049-0, 2002. a
Blunt, M. J., Bijeljic, B., Dong, H., Gharbi, O., Iglauer, S., Mostaghimi, P., Paluszny, A., and Pentland, C.: Pore-scale imaging and modelling, Adv. Water Resour., 51, 197–216, https://doi.org/10.1016/j.advwatres.2012.03.003, 2013. a, b, c, d
Boon, A., Robinson, J. S., Nightingale, P. D., Cardenas, L., Chadwick, D. R., and Verhoef, A.: Determination of the gas diffusion coefficient of a peat grassland soil, Eur. J. Soil Sci., 64, 681–687, https://doi.org/10.1111/ejss.12056, 2013. a, b, c, d
Bridgham, S. D., Cadillo-Quiroz, H., Keller, J. K., and Zhuang, Q.: Methane emissions from wetlands: biogeochemical, microbial, and modeling perspectives from local to global scales, Glob. Change Biol., 19, 1325–1346, https://doi.org/10.1111/gcb.12131, 2013. a
Burnham, K. P. and Anderson, D. R.: Multimodel inference: Understanding AIC and BIC in model selection, Sociol. Method. Res., 33, 261–304, https://doi.org/10.1177/0049124104268644, 2004. a
Campbell, G. S.: Soil Physics with BASIC. Transport Models for Soil–Plant Systems, Developments in Soil Science 14, Elsevier, Amsterdam, the Netherlands, ISBN 0-444-42557-8, 1985. a, b
Currie, J. A.: Gaseous diffusion in porous media. Part 2. – Dry granular materials, Brit. J. Appl. Phys., 11, 318–324, https://doi.org/10.1088/0508-3443/11/8/303, 1960. a, b, c, d
de Vries, E. T., Raoof, A., and van Genuchten, M. T.: Multiscale modelling of dual-porosity porous media; a computational pore-scale study for flow and solute transport, Adv. Water Resour., 105, 82–95, https://doi.org/10.1016/j.advwatres.2017.04.013, 2017. a
Dhanoa, M. S., Lister, S. J., France, J., and Barnes, R. J.: Use of mean square prediction error analysis and reproducibility measures to study near infrared calibration equation performance, J. Near Infrared Spec., 7, 133–143, https://doi.org/10.1255/jnirs.244, 1999. a
Dong, H. and Blunt, M. J.: Pore-network extraction from micro-computerized-tomography images, Phys. Rev. E, 80, 036307, https://doi.org/10.1103/PhysRevE.80.036307, 2009. a
Dong, L., Zhang, W., Xiong, Y., Zou, J., Huang, Q., Xu, X., Ren, P., and Huang, G.: Impact of short-term organic amendments incorporation on soil structure and hydrology in semiarid agricultural lands, Int. Soil Water Conserv. Res., 10, 457–469, https://doi.org/10.1016/j.iswcr.2021.10.003, 2022. a
Edling, P.: Soil air. Volume and gas exchange mechanisms, Report 151, Swedish University of Agricultural Sciences, Department of Soil Sciences, Uppsala, Sweden, ISBN 91-576-2764-9, 1986. a
Estop-Aragonés, C., Knorr, K.-H., and Blodau, C.: Controls on in situ oxygen and dissolved inorganic carbon dynamics in peats of a temperate fen, J. Geophys. Res., 117, G02002, https://doi.org/10.1029/2011JG001888, 2012. a
Fan, Z., McGuire, A. D., Turetsky, M. R., Harden, J. W., Waddington, J. M., and Kane, E. S.: The response of soil organic carbon of a rich fen peatland in interior Alaska to projected climate change, Glob. Change Biol., 19, 604–620, https://doi.org/10.1111/gcb.12041, 2013. a
Fan, Z., Neff, J. C., Waldrop, M. P., Ballantyne, A. P., and Turetsky, M. R.: Transport of oxygen in soil pore-water systems: implications for modeling emissions of carbon dioxide and methane from peatlands, Biogeochemistry, 121, 455–470, https://doi.org/10.1007/s10533-014-0012-0, 2014. a
Frolking, S., Talbot, J., Jones, M. C., Treat, C. C., Kauffman, J. B., Tuittila, E.-S., and Roulet, N.: Peatlands in the Earth's 21st century climate system, Environ. Rev., 19, 371–396, https://doi.org/10.1139/a11-014, 2011. a
Gharedaghloo, B., Price, J. S., Rezanezhad, F., and Quinton, W. L.: Evaluating the hydraulic and transport properties of peat soil using pore network modeling and X-ray micro computed tomography, J. Hydrol., 561, 494–508, https://doi.org/10.1016/j.jhydrol.2018.04.007, 2018. a, b, c, d
Giavarina, D.: Understanding Bland Altman analysis, Biochem. Med. (Zagreb), 25, 141–151, https://doi.org/10.11613/BM.2015.015, 2015. a
Gostick, J., Aghighi, M., Hinebaugh, J., Tranter, T., Hoeh, M. A., Day, H., Spellacy, B., Sharqawy, M. H., Bazylak, A., Burns, A., Lehnert, W., and Putz, A.: OpenPNM: A pore network modeling package, Comput. Sci. Eng., 18, 60–74, https://doi.org/10.1109/MCSE.2016.49, 2016. a
Gostick, J. T.: Versatile and efficient pore network extraction method using marker-based watershed segmentation, Phys. Rev. E, 96, 023307, https://doi.org/10.1103/PhysRevE.96.023307, 2017. a, b, c
Gostick, J. T., Khan, Z. A., Tranter, T. G., Kok, M. D. R., Agnaou, M., Sadeghi, M., and Jervis, R.: PoreSpy: A Python toolkit for quantitative analysis of porous media images, J. Open Source Softw., 4, 1296, https://doi.org/10.21105/joss.01296, 2019. a
Günther, A., Barthelmes, A., Huth, V., Joosten, H., Jurasinski, G., Koebsch, F., and Couwenberg, J.: Prompt rewetting of drained peatlands reduces climate warming despite methane emissions, Nat. Commun., 11, 1644, https://doi.org/10.1038/s41467-020-15499-z, 2020. a
Hamamoto, S., Dissanayaka, S. H., Kawamoto, K., Nagata, O., Komtatsu, T., and Moldrup, P.: Transport properties and pore-network structure in variably-saturated Sphagnum peat soil, Eur. J. Soil Sci., 67, 121–131, https://doi.org/10.1111/ejss.12312, 2016a. a, b, c, d
Hamamoto, S., Moldrup, P., Kawamoto, K., Sakaki, T., Nishimura, T., and Komatsu, T.: Pore network structure linked by X-ray CT to particle characteristics and transport parameters, Soils Found., 56, 676–690, https://doi.org/10.1016/j.sandf.2016.07.008, 2016b. a
Helliwell, J. R., Sturrock, C. J., Grayling, K. M., Tracy, S. R., Flavel, R. J., Young, I. M., Whalley, W. R., and Mooney, S. J.: Applications of X-ray computed tomography for examining biophysical interactions and structural development in soil systems: a review, Eur. J. Soil Sci., 64, 279–297, https://doi.org/10.1111/ejss.12028, 2013. a
Hillel, D.: Introduction to Environmental Soil Physics, Academic Press, San Diego, California, ISBN 978-0-12-348525-0, 1998. a
Iiyama, I. and Hasegawa, S.: Gas diffusion coefficient of undisturbed peat soils, Soil Sci. Plant Nutr., 51, 431–435, https://doi.org/10.1111/j.1747-0765.2005.tb00049.x, 2005. a, b, c, d, e, f
Jin, Y. and Jury, W. A.: Characterizing the dependence of gas diffusion coefficient on soil properties, Soil Sci. Soc. Am. J., 60, 66–71, https://doi.org/10.2136/sssaj1996.03615995006000010012x, 1996. a, b, c, d
Jokinen, P., Pirinen, P., Kaukoranta, J.-P., Kangas, A., Alenius, P., Eriksson, P., Johansson, M., and Wilkman, S.: Climatological and oceanographic statistics of Finland 1991–2020, Reports 2021:8, Finnish Meteorological Institute, Helsinki, Finland, https://doi.org/10.35614/isbn.9789523361485, 2021. a
King, J. A. and Smith, K. A.: Gaseous diffusion through peat, J. Soil Sci., 38, 173–177, https://doi.org/10.1111/j.1365-2389.1987.tb02134.x, 1987. a, b
Kirschke, S., Bousquet, P., Ciais, P., Saunois, M., Canadell, J. G., Dlugokencky, E. J., Bergamaschi, P., Bergmann, D., Blake, D. R., Bruhwiler, L., Cameron-Smith, P., Castaldi, S., Chevallier, F., Feng, L., Fraser, A., Heimann, M., Hodson, E. L., Houweling, S., Josse, B., Fraser, P. J., Krummel, P. B., Lamarque, J.-F., Langenfelds, R. L., Le Quéré, C., Naik, V., O'Doherty, S., Palmer, P. I., Pison, I., Plummer, D., Poulter, B., Prinn, R. G., Rigby, M., Ringeval, B., Santini, M., Schmidt, M., Shindell, D. T., Simpson, I. J., Spahni, R., Steele, L. P., Strode, S. A., Sudo, K., Szopa, S., van der Werf, G. R., Voulgarakis, A., van Weele, M., Weiss, R. F., Williams, J. E., and Zeng, G.: Three decades of global methane sources and sinks, Nat. Geosci., 6, 813–823, https://doi.org/10.1038/ngeo1955, 2013. a
Kiuru, P., Palviainen, M., Grönholm, T., Raivonen, M., Kohl, L., Gauci, V., Urzainki, I., and Laurén, A.: Peat macropore networks – new insights into episodic and hotspot methane emission, Biogeosciences, 19, 1959–1977, https://doi.org/10.5194/bg-19-1959-2022, 2022a. a, b, c, d, e, f, g, h, i, j
Kiuru, P., Palviainen, M., Kohl, L., Marchionne, A., and Laurén, A.: Pore network modeling as a new tool for determining gas diffusivity in peat, Zenodo [code, data set], https://doi.org/10.5281/zenodo.7193268, 2022b. a, b
Kiuru, P., Palviainen, M., and Laurén, A.: Peat macropore networks – new insights into episodic and hotspot methane emission, Zenodo [data set], https://doi.org/10.5281/zenodo.6327112, 2022c. a
Kleimeier, C., Rezanezhad, F., Cappellen, P. V., and Lennartz, B.: Influence of pore structure on solute transport in degraded and undegraded fen peat soils, Mires Peat, 19, 18, https://doi.org/10.19189/MaP.2017.OMB.282, 2017. a
Koestel, J., Larsbo, M., and Jarvis, N.: Scale and REV analyses for porosity and pore connectivity measures in undisturbed soil, Geoderma, 366, 114206, https://doi.org/10.1016/j.geoderma.2020.114206, 2020. a
Lai, D. Y. F.: Methane dynamics in northern peatlands: A review, Pedosphere, 19, 409–421, https://doi.org/10.1016/S1002-0160(09)00003-4, 2009. a
Laine, J. and Vasander, H.: Ecology and vegetation gradients in peatlands, in: Peatlands in Finland, edited by: Vasander, H., 10–19, Finnish Peatland Society, Helsinki, Finland, ISBN 952-90-7971-0, 1996. a
Leifeld, J. and Menichetti, L.: The underappreciated potential of peatlands in global climate change mitigation strategies, Nat. Commun., 9, 1071, https://doi.org/10.1038/s41467-018-03406-6, 2018. a
Leifeld, J., Wüst-Galley, C., and Page, S.: Intact and managed peatland soils as a source and sink of GHGs from 1850 to 2100, Nat. Clim. Change, 9, 945–947, https://doi.org/10.1038/s41558-019-0615-5, 2019. a
Lennartz, B. and Liu, H.: Hydraulic functions of peat soils and ecosystem service, Front. Environ. Sci., 7, 92, https://doi.org/10.3389/fenvs.2019.00092, 2019. a
Likos, W. J., Lu, N., and Godt, J. W.: Hysteresis and uncertainty in soil water-retention curve parameters, J. Geotech. Geoenviron., 140, 04013050, https://doi.org/10.1061/(ASCE)GT.1943-5606.0001071, 2014. a
Limpens, J., Berendse, F., Blodau, C., Canadell, J. G., Freeman, C., Holden, J., Roulet, N., Rydin, H., and Schaepman-Strub, G.: Peatlands and the carbon cycle: from local processes to global implications – a synthesis, Biogeosciences, 5, 1475–1491, https://doi.org/10.5194/bg-5-1475-2008, 2008. a
Lin, L. I.-K.: A concordance correlation coefficient to evaluate reproducibility, Biometrics, 45, 255–268, https://doi.org/10.2307/2532051, 1989. a
Liu, H. and Lennartz, B.: Hydraulic properties of peat soils along a bulk density gradient – A meta study, Hydrol. Process., 33, 101–114, https://doi.org/10.1002/hyp.13314, 2019. a
Maier, M. and Schack-Kirchner, H.: Using the gradient method to determine soil gas flux: A review, Agr. Forest Meteorol, 192–193, 78–95, https://doi.org/10.1016/j.agrformet.2014.03.006, 2014. a
Maier, M., Gartiser, V., Schengel, A., and Lang, V.: Long term soil gas monitoring as tool to understand soil processes, Appl. Sci., 10, 8653, https://doi.org/10.3390/app10238653, 2020. a
McCarter, C. P. R., Rezanezhad, F., Quinton, W. L., Gharedaghloo, B., Lennartz, B., Price, J., Connon, R., and Van Cappellen, P.: Pore-scale controls on hydrological and geochemical processes in peat: Implications on interacting processes, Earth-Sci. Rev., 207, 103227, https://doi.org/10.1016/j.earscirev.2020.103227, 2020. a, b, c, d
Merey, Ş.: Prediction of transport properties for the Eastern Mediterranean Sea shallow sediments by pore network modelling, J. Petrol. Sci. Eng., 176, 403–420, https://doi.org/10.1016/j.petrol.2019.01.081, 2019. a
Millington, R.: Gas diffusion in porous media, Science, 130, 100–102, https://doi.org/10.1126/science.130.3367.100.b, 1959. a
Millington, R. J. and Quirk, J.: Transport in porous media, in: Transactions of the 7th International Congress of Soil Science. Vol. 1, edited by: Baren, F. A. V., 97–106, Elsevier, Amsterdam, the Netherlands, 1960. a, b, c
Millington, R. J. and Quirk, J.: Permeability of porous solids, T. Faraday Soc., 57, 1200–1207, https://doi.org/10.1039/TF9615701200, 1961. a, b, c, d
Moldrup, P., Olesen, T., Schjønning, P., Yamaguchi, T., and Rolston, D. E.: Predicting the gas diffusion coefficient in undisturbed soil from soil water characteristics, Soil Sci. Soc. Am. J., 64, 94–100, https://doi.org/10.2136/sssaj2000.64194x, 2000. a, b, c
Moldrup, P., Olesen, T., Komatsu, T., Schjønning, P., and Rolston, D. E.: Tortuosity, diffusivity, and permeability in the soil liquid and gaseous phases, Soil Sci. Soc. Am. J., 65, 613–623, https://doi.org/10.2136/sssaj2001.653613x, 2001. a
Moldrup, P., Olesen, T., Yoshikawa, S., Komatsu, T., and Rolston, D. E.: Three-porosity model for predicting the gas diffusion coefficient in undisturbed soil, Soil Sci. Soc. Am. J., 68, 750–759, https://doi.org/10.2136/sssaj2004.7500, 2004. a, b, c, d, e, f, g
Moriasi, D. N., Arnold, J. G., Van Liew, M. W., Bingner, R. L., Harmel, R. D., and Veith, T. L.: Model evaluation guidelines for systematic quantification of accuracy in watershed simulations, T. ASABE, 50, 885–900, https://doi.org/10.13031/2013.23153, 2007. a
Mostaghimi, P., Blunt, M. J., and Bijeljic, B.: Computations of absolute permeability on micro-CT images, Math. Geosci., 45, 103–125, https://doi.org/10.1007/s11004-012-9431-4, 2013. a
Nimmo, J. R.: Porosity and pore-size distribution, in: Encyclopedia of Soils in the Environment, Vol. 3, edited by: Hillel, D., 295–303, Elsevier, Oxford, UK, ISBN 978-0-12-348530-4, 2005. a
Ojanen, P. and Minkkinen, K.: The dependence of net soil CO2 emissions on water table depth in boreal peatlands drained for forestry, Mires Peat, 24, 27, https://doi.org/10.19189/MaP.2019.OMB.StA.1751, 2019. a
Otsu, N.: A threshold selection method from gray-level histograms, IEEE T. Syst. Man Cyb., 9, 62–66, https://doi.org/10.1109/TSMC.1979.4310076, 1979. a
Paavilainen, E. and Päivänen, J. Eds.: Peatland Forestry: Ecology and Principles, Springer-Verlag, Berlin, Germany, ISBN 978-3-642-08198-9, 1995. a
Päivänen, J.: Hydraulic conductivity and water retention in peat soils, Acta For. Fenn., 129, 1–70, https://doi.org/10.14214/aff.7563, 1973. a, b
Penman, H. L.: Gas and vapour movements in the soil: I. The diffusion of vapours through porous solids, J. Agr. Sci., 30, 437–462, https://doi.org/10.1017/S0021859600048164, 1940. a
Qiu, C., Zhu, D., Ciais, P., Guenet, B., and Peng, S.: The role of northern peatlands in the global carbon cycle for the 21st century, Glob. Ecol. Biogeogr., 29, 956–973, https://doi.org/10.1111/geb.13081, 2020. a
Rabot, E., Wiesmeier, M., Schlüter, S., and Vogel, H.-J.: Soil structure as an indicator of soil functions: A review, Geoderma, 314, 122–137, https://doi.org/10.1016/j.geoderma.2017.11.009, 2018. a
Raivonen, M., Smolander, S., Backman, L., Susiluoto, J., Aalto, T., Markkanen, T., Mäkelä, J., Rinne, J., Peltola, O., Aurela, M., Lohila, A., Tomasic, M., Li, X., Larmola, T., Juutinen, S., Tuittila, E.-S., Heimann, M., Sevanto, S., Kleinen, T., Brovkin, V., and Vesala, T.: HIMMELI v1.0: HelsinkI Model of MEthane buiLd-up and emIssion for peatlands, Geosci. Model Dev., 10, 4665–4691, https://doi.org/10.5194/gmd-10-4665-2017, 2017. a
Redding, T. E. and Devito, K. J.: Particle densities of wetland soils in northern Alberta, Canada, Can. J. Soil Sci., 86, 57–60, https://doi.org/10.4141/S05-061, 2006. a
Reddy, K. R. and DeLaune, R. D.: Biogeochemistry of Wetlands: Science and Applications, CRC Press, Boca Raton, Florida, ISBN 978-1-56670-678-0, 2008. a
Rezanezhad, F., Price, J. S., Quinton, W. L., Lennartz, B., Milojevic, T., and Van Cappellen, P.: Structure of peat soils and implications for water storage, flow and solute transport: A review update for geochemists, Chem. Geol., 429, 75–84, https://doi.org/10.1016/j.chemgeo.2016.03.010, 2016. a, b, c
Rumble, J. R. (Ed.): CRC Handbook of Chemistry and Physics, 102nd Edn. (Internet Version 2021), CRC Press/Taylor & Francis, Boca Raton, FL, 2021. a, b
Sadeghi, M. A., Agnaou, M., Barralet, J., and Gostick, J.: Dispersion modeling in pore networks: A comparison of common pore-scale models and alternative approaches, J. Contam. Hydrol., 228, 103578, https://doi.org/10.1016/j.jconhyd.2019.103578, 2020. a
Sarkkola, S., Hökkä, H., Koivusalo, H., Nieminen, M., Ahti, E., Päivänen, J., and Laine, J.: Role of tree stand evapotranspiration in maintaining satisfactory drainage conditions in drained peatlands, Can. J. Forest Res., 40, 1485–1496, https://doi.org/10.1139/X10-084, 2010. a
Saunois, M., Stavert, A. R., Poulter, B., Bousquet, P., Canadell, J. G., Jackson, R. B., Raymond, P. A., Dlugokencky, E. J., Houweling, S., Patra, P. K., Ciais, P., Arora, V. K., Bastviken, D., Bergamaschi, P., Blake, D. R., Brailsford, G., Bruhwiler, L., Carlson, K. M., Carrol, M., Castaldi, S., Chandra, N., Crevoisier, C., Crill, P. M., Covey, K., Curry, C. L., Etiope, G., Frankenberg, C., Gedney, N., Hegglin, M. I., Höglund-Isaksson, L., Hugelius, G., Ishizawa, M., Ito, A., Janssens-Maenhout, G., Jensen, K. M., Joos, F., Kleinen, T., Krummel, P. B., Langenfelds, R. L., Laruelle, G. G., Liu, L., Machida, T., Maksyutov, S., McDonald, K. C., McNorton, J., Miller, P. A., Melton, J. R., Morino, I., Müller, J., Murguia-Flores, F., Naik, V., Niwa, Y., Noce, S., O'Doherty, S., Parker, R. J., Peng, C., Peng, S., Peters, G. P., Prigent, C., Prinn, R., Ramonet, M., Regnier, P., Riley, W. J., Rosentreter, J. A., Segers, A., Simpson, I. J., Shi, H., Smith, S. J., Steele, L. P., Thornton, B. F., Tian, H., Tohjima, Y., Tubiello, F. N., Tsuruta, A., Viovy, N., Voulgarakis, A., Weber, T. S., van Weele, M., van der Werf, G. R., Weiss, R. F., Worthy, D., Wunch, D., Yin, Y., Yoshida, Y., Zhang, W., Zhang, Z., Zhao, Y., Zheng, B., Zhu, Q., Zhu, Q., and Zhuang, Q.: The Global Methane Budget 2000–2017, Earth Syst. Sci. Data, 12, 1561–1623, https://doi.org/10.5194/essd-12-1561-2020, 2020. a
Schlegel, A.: hypothetical – Hypothesis and statistical testing in Python, Github, https://github.com/aschleg/hypothetical (last access: 13 October 2022), 2020. a
Schlüter, S., Sammartino, S., and Koestel, J.: Exploring the relationship between soil structure and soil functions via pore-scale imaging, Geoderma, 370, 114370, https://doi.org/10.1016/j.geoderma.2020.114370, 2020. a
Seabold, S. and Perktold, J.: Statsmodels: Econometric and statistical modeling with Python, in: Proceedings of the 9th Python in Science Conference, edited by: van der Walt, S. and Millman, J., Austin, Texas, 28 June–3 July 2010, 92–96, https://doi.org/10.25080/Majora-92bf1922-011, 2010. a
Soinne, H., Keskinen, R., Räty, M., Kanerva, S., Turtola, E., Kaseva, J., Nuutinen, V., Simojoki, A., and Salo, T.: Soil organic carbon and clay content as deciding factors for net nitrogen mineralization and cereal yields in boreal mineral soils, Eur. J. Soil Sci., 72, 1497–1512, https://doi.org/10.1111/ejss.13003, 2021. a
Steele, D. D. and Nieber, J. L.: Network modeling of diffusion coefficients for porous media: I. Theory and model development, Soil Sci. Soc. Am. J., 58, 1337–1345, https://doi.org/10.2136/sssaj1994.03615995005800050008x, 1994. a
Stock, S. R.: Recent advances in X-ray microtomography applied to materials, Int. Mater. Rev., 53, 129–181, https://doi.org/10.1179/174328008X277803, 2008. a
Sullivan, B. W., Dore, S., Kolb, T. E., Hart, S. C., and Montes-Helu, M. C.: Evaluation of methods for estimating soil carbon dioxide efflux across a gradient of forest disturbance, Glob. Change Biol., 16, 2449–2460, https://doi.org/10.1111/j.1365-2486.2009.02139.x, 2010. a
Tozzi, R., Masci, F., and Pezzopane, M.: A stress test to evaluate the usefulness of Akaike information criterion in short-term earthquake prediction, Sci. Rep.-UK, 10, 21153, https://doi.org/10.1038/s41598-020-77834-0, 2020. a
Tsuruta, A., Aalto, T., Backman, L., Krol, M. C., Peters, W., Lienert, S., Joos, F., Miller, P. A., Zhang, W., Laurila, T., Hatakka, J., Leskinen, A., Lehtinen, K. E. J., Peltola, O., Vesala, T., Levula, J., Dlugokencky, E., Heimann, M., Kozlova, E., Aurela, M., Lohila, A., Kauhaniemi, M., and Gomez-Pelaez, A. J.: Methane budget estimates in Finland from the CarbonTracker Europe-CH4 data assimilation system, Tellus B, 71, 1565030, https://doi.org/10.1080/16000889.2018.1565030, 2019. a
van der Walt, S., Schönberger, J. L., Nunez-Iglesias, J., Boulogne, F., Warner, J. D., Yager, N., Gouillart, E., Yu, T., and the scikit-image contributors: scikit-image: image processing in Python, PeerJ, 2, e453, https://doi.org/10.7717/peerj.453, 2014. a
Virtanen, P., Gommers, R., Oliphant, T. E., Haberland, M., Reddy, T., Cournapeau, D., Burovski, E., Peterson, P., Weckesser, W., Bright, J., van der Walt, S. J., Brett, M., Wilson, J., Millman, K. J., Mayorov, N., Nelson, A. R. J., Jones, E., Kern, R., Larson, E., Carey, C. J., Polat, İ., Feng, Y., Moore, E. W., VanderPlas, J., Laxalde, D., Perktold, J., Cimrman, R., Henriksen, I., Quintero, E. A., Harris, C. R., Archibald, A. M., Ribeiro, A. H., Pedregosa, F., van Mulbregt, P., and SciPy 1.0 Contributors: SciPy 1.0: fundamental algorithms for scientific computing in Python, Nat. Methods, 17, 261–272, https://doi.org/10.1038/s41592-019-0686-2, 2020. a
Walczak, R., Rovdan, E., and Witkowska-Walczak, B.: Water retention characteristics of peat and sand mixtures, Int. Agrophys., 16, 161–165, 2002. a
Washington, J. W., Rose, A. W., Ciolkosz, E. J., and Dobos, R. R.: Gaseous diffusion and permeability in four soil profiles in central Pennsylvania, Soil Sci., 157, 65–76, https://doi.org/10.1097/00010694-199402000-00001, 1994. a
Weber, T. K. D., Iden, S. C., and Durner, W.: A pore-size classification for peat bogs derived from unsaturated hydraulic properties, Hydrol. Earth Syst. Sci., 21, 6185–6200, https://doi.org/10.5194/hess-21-6185-2017, 2017. a
Xiong, Q., Baychev, T. G., and Jivkov, A. P.: Review of pore network modelling of porous media: Experimental characterisations, network constructions and applications to reactive transport, J. Contam. Hydrol., 192, 101–117, https://doi.org/10.1016/j.jconhyd.2016.07.002, 2016. a, b
Xu, X., Yuan, F., Hanson, P. J., Wullschleger, S. D., Thornton, P. E., Riley, W. J., Song, X., Graham, D. E., Song, C., and Tian, H.: Reviews and syntheses: Four decades of modeling methane cycling in terrestrial ecosystems, Biogeosciences, 13, 3735–3755, https://doi.org/10.5194/bg-13-3735-2016, 2016. a
Yang, Y., Wang, K., Zhang, L., Sun, H., Zhang, K., and Ma, J.: Pore-scale simulation of shale oil flow based on pore network model, Fuel, 251, 683–692, https://doi.org/10.1016/j.fuel.2019.03.083, 2019. a
Yu, Z., Loisel, J., Brosseau, D. P., Beilman, D. W., and Hunt, S. J.: Global peatland dynamics since the Last Glacial Maximum, Geophys. Res. Lett., 37, L13402, https://doi.org/10.1029/2010GL043584, 2010. a
Zhao, J., Qin, F., Derome, D., Kang, Q., and Carmeliet, J.: Improved pore network models to simulate single-phase flow in porous media by coupling with lattice Boltzmann method, Adv. Water Resour., 145, 103738, https://doi.org/10.1016/j.advwatres.2020.103738, 2020. a