the Creative Commons Attribution 4.0 License.
the Creative Commons Attribution 4.0 License.
 | 05 Dec 2022
Drivers of intermodel uncertainty in land carbon sink projections
Lukas Gudmundsson
Laibao Liu
Vincent Humphrey
Sonia I. Seneviratne
Over the past decades, land ecosystems removed from the atmosphere approximately one-third of anthropogenic carbon emissions, highlighting the importance of the evolution of the land carbon sink for projected climate change. Nevertheless, the latest cumulative land carbon sink projections from 11 Earth system models participating in the Coupled Model Intercomparison Project phase 6 (CMIP6) show an intermodel spread of 150 Pg C (i.e., ∼ 15 years of current anthropogenic emissions) for a policy-relevant scenario, with mean global warming by the end of the century below 2 ∘C relative to preindustrial conditions. We hypothesize that this intermodel uncertainty originates from model differences in the sensitivities of net biome production (NBP) to atmospheric CO2 concentration (i), to air temperature (ii), and to soil moisture (iii), as well as model differences in average conditions of air temperature (iv) and soil moisture (v). Using multiple linear regression and a resampling technique, we quantify the individual contributions of these five drivers for explaining the cumulative NBP anomaly of each model relative to the multi-model mean. We find that the intermodel variability of the contributions of each driver relative to the total NBP intermodel variability is 52.4 % for the sensitivity to temperature, 44.2 % for the sensitivity to soil moisture, 44 % for the sensitivity to CO2, 26.2 % for the average temperature, and 21.9 % for the average soil moisture. Furthermore, the sensitivities of NBP to temperature and soil moisture, particularly at tropical regions, contribute to explain 34 % to 65 % of the cumulative NBP deviations from the ensemble mean of the two models with the lowest carbon sink (ACCESS-ESM1-5 and UKESM1-0-LL) and of the two models with the highest sink (CESM2 and NorESM2-LM), highlighting the primary role of the response of NBP to interannual climate variability. Overall, this study provides insights on why each Earth system model projects either a low or high land carbon sink globally and across regions relative to the ensemble mean, which can focalize efforts to identify the representation of processes that lead to intermodel uncertainty.
- Article
(4093 KB) - Full-text XML
-
Supplement
(7281 KB) - BibTeX
- EndNote


During recent decades, ecosystems on land have taken up approximately one-third of anthropogenic carbon emissions to the atmosphere and are predominantly responsible for the year-to-year variations in the atmospheric carbon growth rate (Friedlingstein et al., 2020). While carbon emissions have been on the rise, land ecosystems have taken up more and more carbon, which has resulted in this approximately constant 30 % sink (Canadell et al., 2021). However, it remains unclear as to what level this capacity of land to remove carbon from the atmosphere can continue in the coming decades, with evidence pointing towards a less effective sink under increasing cumulative emissions (Gatti et al., 2021; Hubau et al., 2020; Koch et al., 2021; Raupach et al., 2014; IPCC, 2021). The future evolution of the land carbon sink is crucial to project how much global warming and consequent climate change the Earth will experience given a certain level of greenhouse gas emissions. It is thus linked to policy questions such as how much more carbon can we emit to limit global warming below the 2 or 1.5 ∘C thresholds decided in the 2015 Paris Agreement.
The net carbon flux from the atmosphere to the land is denoted as net biome production (NBP), and it is given by the carbon uptake of vegetation through photosynthesis (gross primary production, GPP) minus the losses of carbon to the atmosphere through autotrophic respiration (RA) and heterotrophic respiration (RH), as well as from ecosystem disturbances (DIS) such as fires. These fluxes are influenced by both atmospheric CO2 concentration and climate conditions. Rising atmospheric CO2 primarily favors higher GPP (fertilization effect), while it can indirectly enhance RA due to greater plant biomass and enhance RH due to higher microbial decomposition of fresh carbon supplied by increased litterfall and root-derived labile soil carbon, as well as higher priming of old soil organic matter fueled by this increased supply of labile soil carbon (Gao et al., 2020). Temperature conditions can influence all fluxes, with warming notably leading to an increase in respiration (Varney et al., 2020). In addition, the relevance of water–carbon interactions for the land carbon cycle has gained recognition in recent years (Canadell et al., 2021; Gentine et al., 2019; Green et al., 2019; Huang et al., 2020; Humphrey et al., 2018; Liu et al., 2020; Novick et al., 2016; Peters et al., 2018; Stocker et al., 2018). Observations indicate a high sensitivity of annual NBP to anomalies in terrestrial water storage at the global scale, which is underestimated by land surface models uncoupled from the atmosphere (Humphrey et al., 2018; Peters et al., 2018). Other factors such as incoming radiation and vapor pressure deficit (air dryness) clearly influence GPP and the land carbon sink (Fu et al., 2022; Grossiord et al., 2020; Humphrey et al., 2021; Novick et al., 2016); nevertheless, they are strongly correlated with temperature and soil moisture on monthly or longer timescales. Overall, CO2 fertilization increases global land NBP, while anthropogenic warming and associated climate change tend to reduce it (Arora et al., 2020; Canadell et al., 2021). Importantly, the response of NBP to interannual climate variability appears to be underestimated by multiple Earth system models, potentially implying a lower than expected capacity of land to remove carbon from the atmosphere during this century (Fu et al., 2022; Humphrey et al., 2018; Novick et al., 2016; Winkler et al., 2021).
Projections of the land carbon sink from Earth system models have shown a very substantial intermodel uncertainty since early Coupled Model Intercomparison Projects (CMIPs) (Bonan and Doney, 2018; Friedlingstein et al., 2006), and this continues to be the case for the latest models participating in CMIP6 (Arora et al., 2020; Canadell et al., 2021). While uncertainty in the projections is dominated by these intermodel differences, internal climate variability can also play an important role (Tokarska et al., 2020). As models continue to evolve, land carbon cycle processes can be represented differently across them, and some models may represent processes that others do not, contributing to the uncertainty. Phenology (Peano et al., 2021), water transport through vegetation and water stress (Lawrence et al., 2019), fire (Hantson et al., 2020), woody-plant mortality (De Kauwe et al., 2022; McDowell et al., 2022), and nutrient limitation (Davies-Barnard et al., 2020) are processes at the modeling frontier. The representation of the nitrogen cycle in more models was an important step forward going from CMIP5 to CMIP6 (Davies-Barnard et al., 2020). It is often the case that land carbon uptake is reduced when including nitrogen availability as a constraint (Arora et al., 2020; Canadell et al., 2021). In addition, several studies have proposed observational constraints for projections of different land carbon sink components and sensitivities (Cox et al., 2013; Liu et al., 2019; Mystakidis et al., 2016, 2017; Schlund et al., 2020; Varney et al., 2020). Despite this progress, land biogeochemical feedbacks occurring under climate change remain a major source of uncertainty for future carbon budgets.
The typical framework to study the evolution of the land carbon cycle and associated intermodel uncertainty is based on the carbon–concentration and carbon–climate feedback parameters (Arora et al., 2013, 2020; Friedlingstein et al., 2006). These feedback parameters are estimated from idealized simulations that increase atmospheric CO2 concentration 1 % yr−1 until 2 times (∼ 560 ppm) or 4 times (∼ 1120 ppm) its pre-industrial value and distinguish between its radiative and biogeochemical effects. Using these simulations, Arora et al. (2020) provide insights on why the global land carbon feedback parameters differ among models by comparing their changes in vegetation and soil carbon pools, their strength of the CO2 fertilization effect on GPP, residence time, allocation, and changes in carbon use efficiency globally. To complement these insights and further our understanding of the drivers of intermodel uncertainty in land carbon sink projections, we directly focus on local responses to CO2 concentration, temperature, and soil moisture under the SSP126 low-emission scenario (peak concentration of 471 ppm around 2075 and 446 ppm by 2100; Meinshausen et al., 2020).
In this study we aim to advance our understanding of the future evolution of the land carbon cycle, primarily for a policy-relevant scenario where global warming is limited to below 2 ∘C. Here we use an ensemble of Earth system models participating in CMIP6, as detailed in Sect. 2. A global and spatially explicit overview of the differences in NBP across models is given in Sect. 3. Section 4 describes across the model ensemble the following five proposed drivers of projected cumulative NBP: (i) sensitivity of NBP to CO2 concentration, (ii) sensitivity of NBP to air temperature, (iii) sensitivity of NBP to soil moisture, (iv) long-term average temperature, and (v) long-term average soil moisture. In Sect. 5 we quantify the contribution of each of these drivers for explaining the intermodel differences in cumulative NBP. Concluding remarks are provided in Sect. 6.
For the main analysis we employ all 11 models participating in CMIP6 that provide NBP, near-surface air temperature, and layered soil moisture data for the SSP126 scenario (Table S1 in the Supplement), which are publicly available at https://esgf-node.llnl.gov/search/cmip6/, last access: 30 November 2022. Data from all models are regridded to a common 2.5∘ × 2.5∘ longitude–latitude grid using second-order conservative remapping, and a land mask is applied to increase model comparability. The SSP126 scenario is a shared socio-economic pathway based on the world following an ecological transition (Riahi et al., 2017), for which global warming by the end of the century is projected to be less than 2 ∘C relative to preindustrial conditions. In addition, to estimate the sensitivity of NBP to CO2 concentration, we employ the 1pctCO2-bgc simulations in which atmospheric CO2 increases 1 % yr−1 and only its direct physiological effects on vegetation are considered, while neglecting the radiative effects (Jones et al., 2016). Information from other scenarios is used in some cases to complement the analysis.
An overview of the carbon cycle representation in the models analyzed in this study is provided in Table S1. Additional information about the models, except CMCC-ESM2 and EC-Earth3-Veg, is given by Arora et al. (2020). From all 11 models analyzed here, ACCESS-ESM1-5 is the only model that includes a phosphorous cycle in addition to nitrogen, whereas CanESM5, GFDL-ESM4, and IPSL-CM6A-LR do not include a nitrogen cycle, and CNRM-ESM2-1 only has an implicit representation of the nitrogen cycle. Fire emissions are not represented in 4 of the 11 models, namely ACCESS-ESM1-5, CanESM5, IPSL-CM6A-LR, and UKESM1-0-LL. Dynamic vegetation cover is only modeled by EC-Earth3-Veg, GFDL-ESM4, MPI-ESM1-2-LR, and UKESM1-0-LL. In addition, soil moisture storage capacity and discretization of soil layers can be very different across models (Table S2 in the Supplement). To increase comparability, here we compute soil moisture down to a depth of 30 cm for every model by summing the moisture of all corresponding layers. For cases when the 30 cm depth threshold is within the boundaries of a model layer, we assume that the moisture in the layer varies uniformly with depth and account proportionally for the moisture until the 30 cm threshold.
The cumulative global land carbon sink projections from 11 Earth system models until the year 2100 show large differences, with an ensemble range of 56.3 to 206.6 Pg C, a multi-model mean estimate of 144.7 Pg C, and an intermodel standard deviation of 47 Pg C (Fig. 1). The intermodel spread of 150.3 Pg C corresponds to approximately 40 % of the remaining carbon budget to limit global warming below 2 ∘C (with a 50 % likelihood) according to Table SPM.2 of IPCC (2021). Even though these differences are rather large it is important to note that they are smaller than those corresponding to higher-emission scenarios such as SSP585, where the range is approximately 100–700 Pg C. Thus, uncertainty increases as we move further away from the current state of the system to higher concentrations of greenhouse gases in the atmosphere. Differences across models are considerably larger than differences across realizations of individual models, which partly represent the internal variability of the system (Fig. S1 in the Supplement).
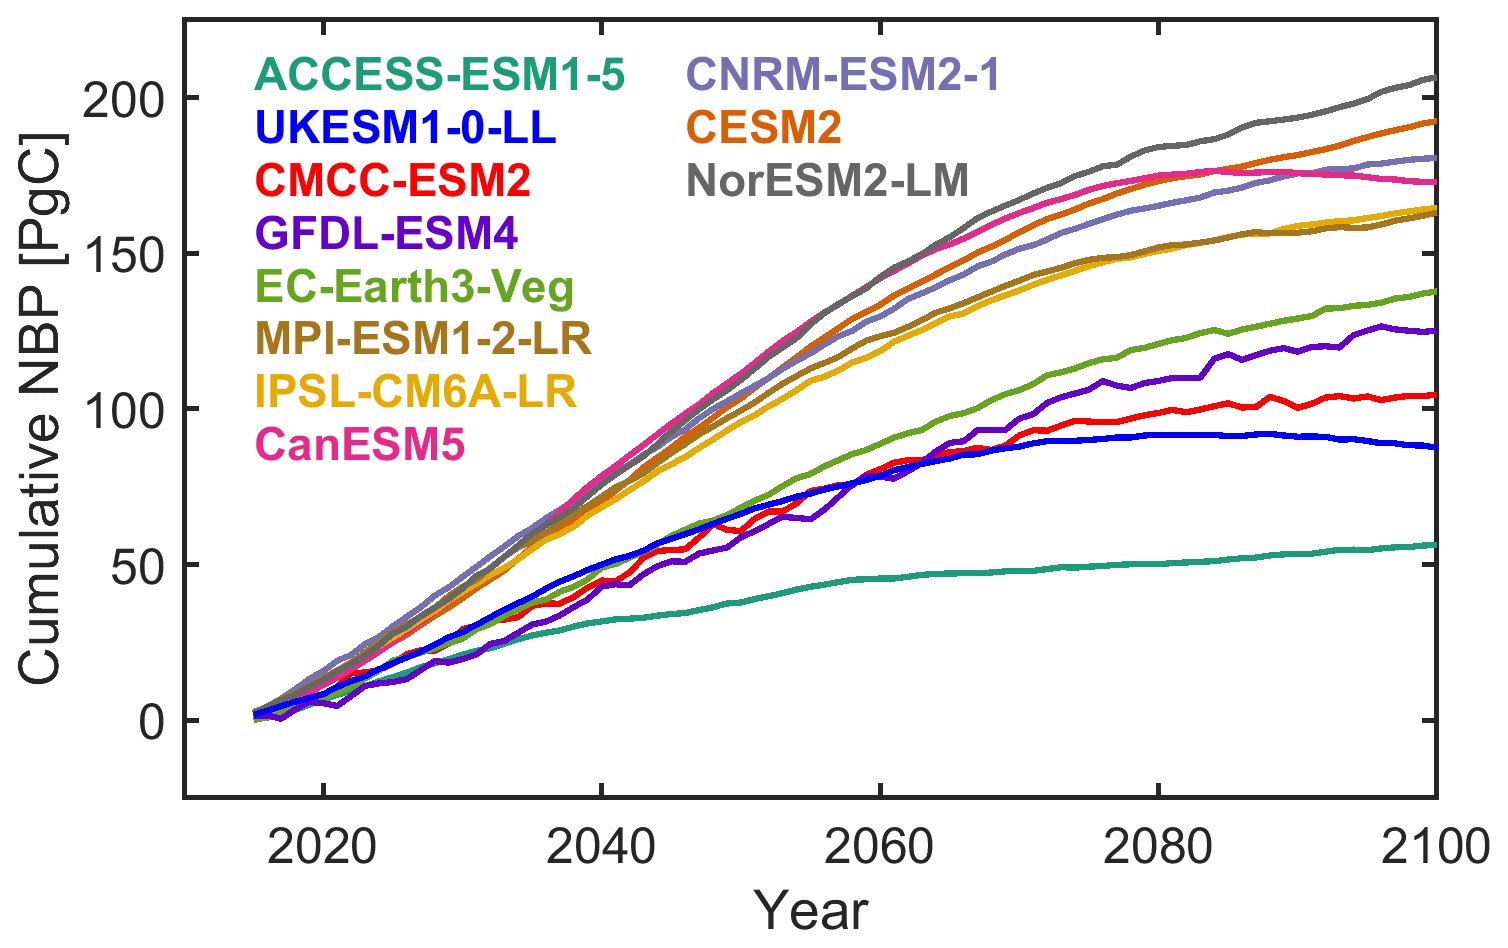
Figure 1Intermodel differences in projected global land NBP for scenario SSP126. Temporal evolution of projected global land cumulative NBP from individual models. The average value is shown for models with multiple realizations available. If a model does not have information over Greenland, NBP is set to zero. Cumulative global land NBP is estimated by multiplying the area-weighted average NBP by the land surface area excluding Antarctica (135.22 × 10⁶ km2).
Further insights on projected intermodel NBP differences are obtained by decomposing them into differences in GPP, autotrophic and heterotrophic respiration, and disturbances (Fig. S2 in the Supplement). There is no clear correspondence between models with higher global land GPP also having higher NBP, given that the loss terms are also generally higher. Moreover, the three models with the highest NBP project relatively low GPP as well as low carbon use efficiency (i.e., CUE = (GPP − RA) GPP), but heterotrophic respiration and disturbance losses are also low. The CUE ranges from 0.55 for CanESM5 to 0.41 for EC-Earth3-Veg and ACCESS-ESM1-5. Models that exhibit a relatively high CUE tend to also exhibit high heterotrophic respiration and thus moderate NBP. Lastly, we note that EC-Earth3-Veg and GFDL-ESM4 show the highest fluxes due to disturbances, mainly from fire emissions. Although DIS is rather small compared to GPP, RA, and RH, it is still large enough to substantially influence intermodel differences in NBP.
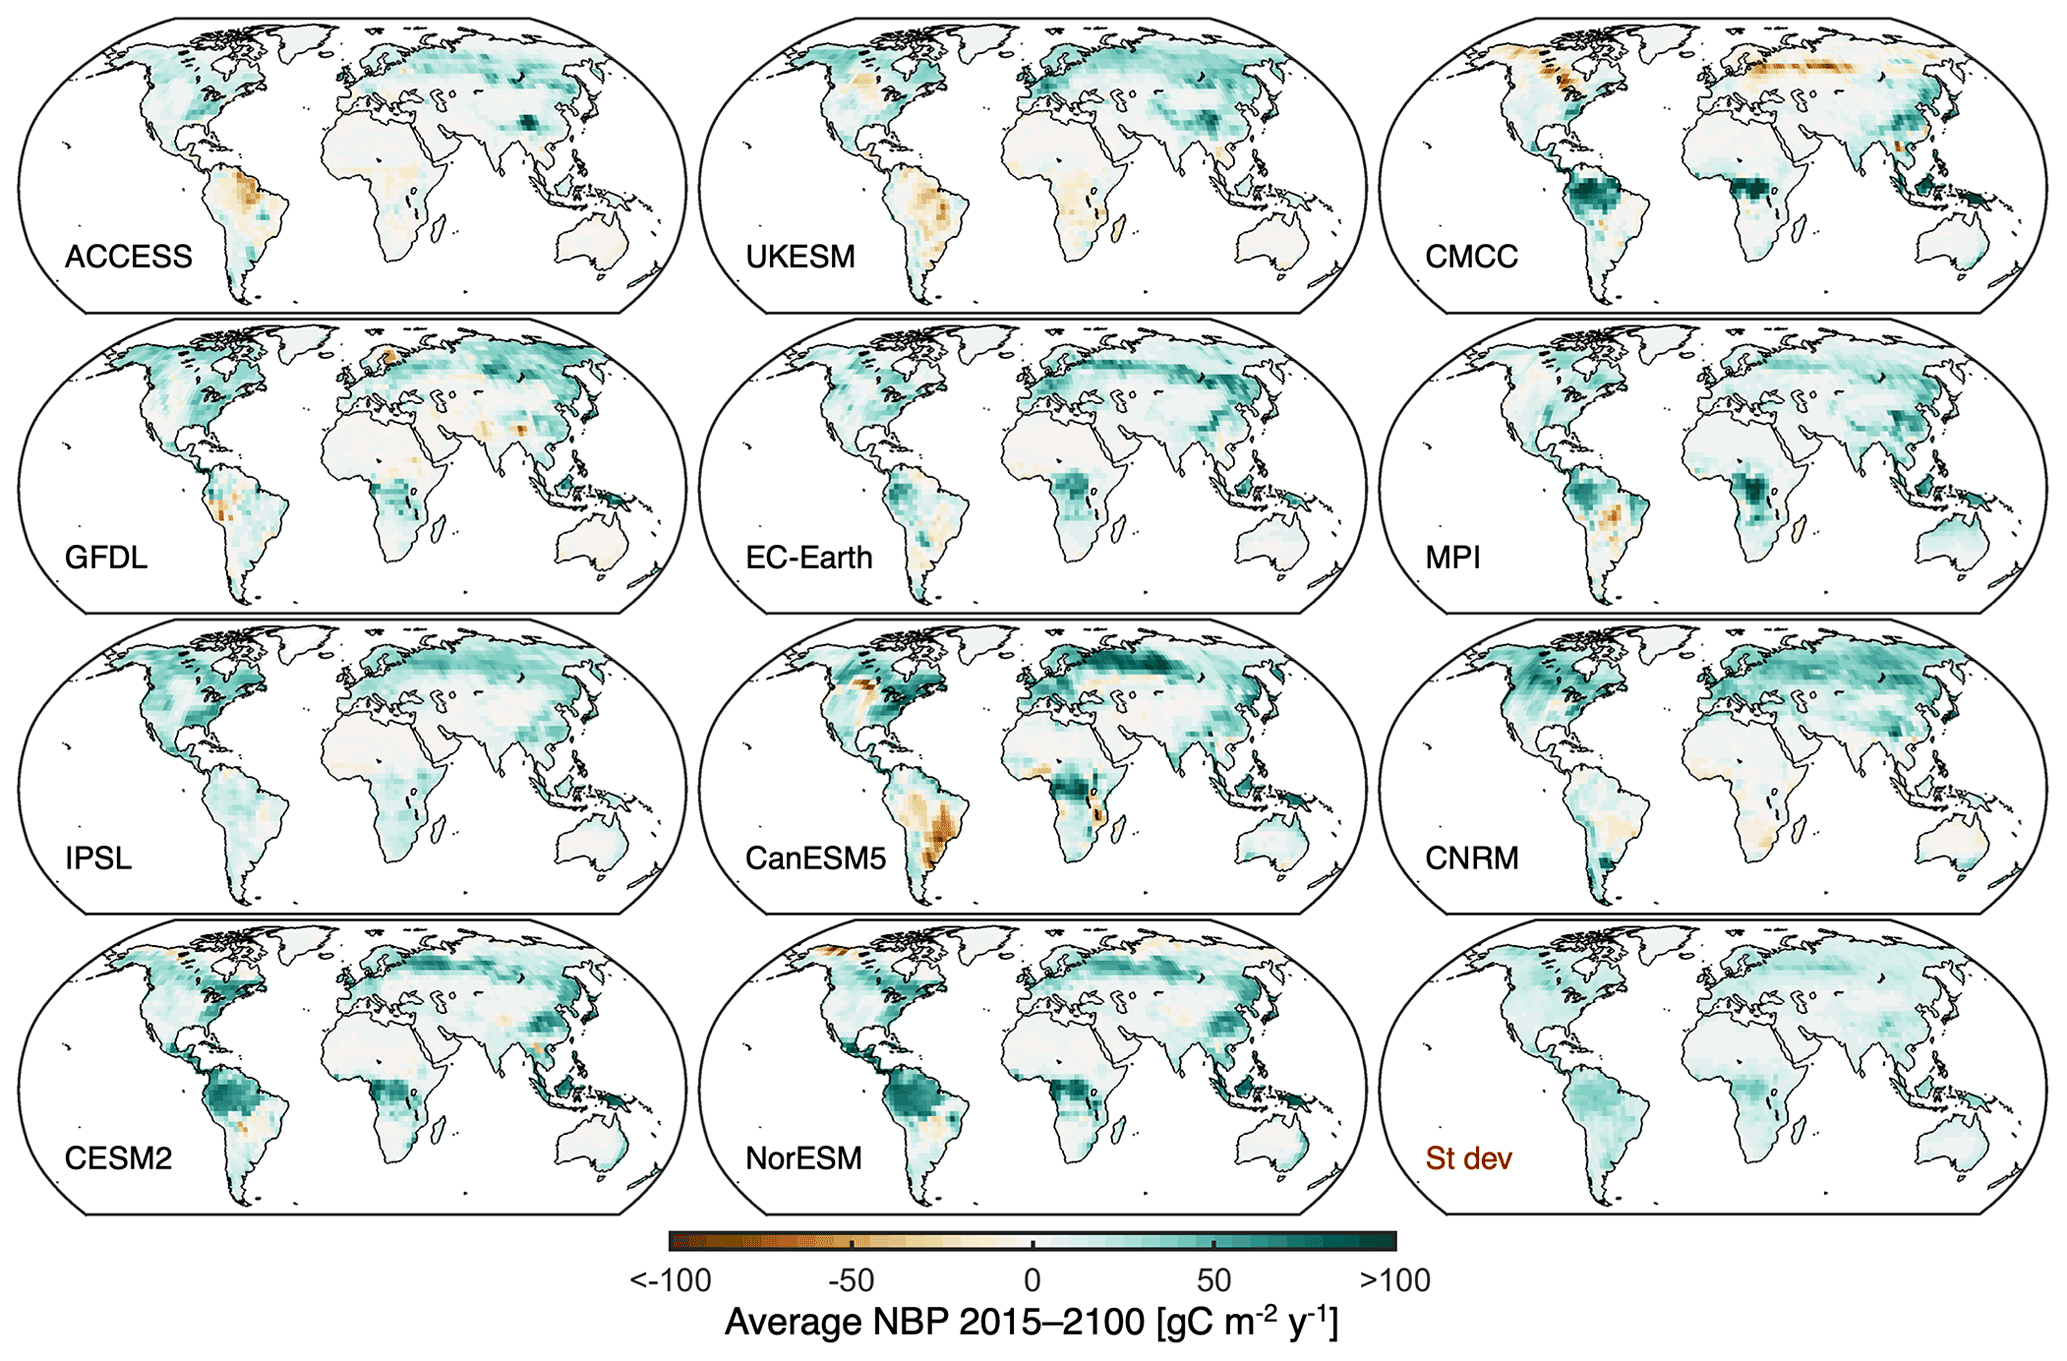
Figure 2Intermodel differences in regional projected NBP. Maps of average projected NBP during 2015 to 2100 from individual models. The intermodel standard deviation is shown at the bottom right.
The maps of cumulative NBP illustrate in more detail the characteristics of the projections from individual models (Fig. 2). Note that there can be models with similar global land NBP as indicated in Fig. 1, even though the underlying spatial distribution is markedly different. Take MPI-ESM1-2-LR and IPSL-CM6A-LR as an example; whereas the tropics – particularly central Africa – are the main sink in the MPI-ESM1-2-LR model, the northern mid and high latitudes contribute most of the sink in IPSL-CM6A-LR. The UKESM1-0-LL and CMCC-ESM2 models also show a very contrasting spatial pattern of cumulative NBP, despite having a relatively similar global land sink magnitude. The local intermodel standard deviation of projected NBP (bottom right panel of Fig. 2) points towards the tropics and boreal forests as the regions with higher discrepancies across models. In addition, models also show marked differences in the magnitude of the detrended interannual variability of NBP (Fig. S3 in the Supplement). EC-Earth3-Veg and GFDL-ESM4 have high interannual variability, as well as CMCC-ESM2 particularly over the boreal forests, whereas CESM2 and NorESM2-LM show the least variability.
Several factors can influence long-term NBP, with atmospheric CO2 concentration, air temperature (T), and soil moisture (SM) playing a potentially important role. Here we focus on the sensitivities of NBP to changes in these variables, as well as on the background conditions of T and SM across the model ensemble. Background conditions of atmospheric CO2 are prescribed and thus identical for all models. Other aspects such as land cover, incoming radiation, air humidity, carbon allocation, nutrient constraints, fire emissions, and interactions between CO2 with T and SM can also be relevant for NBP; however they are addressed only indirectly in this study.
4.1 Sensitivity of NBP to atmospheric CO2 concentration
The physiological effect of atmospheric CO2 concentration on NBP is dominated by its fertilization effect on GPP, while indirect CO2 effects on RA, RH, and DIS can also be substantial. Here we use the 1pctCO2-bgc simulations to estimate the sensitivity of NBP to CO2 concentration at every grid cell. These simulations do not have forced trends in temperature and soil moisture as they only account for the biogeochemical effects of rising CO2. However, when computing the change in NBP in these simulations, it is important to note that model differences can also arise from differences in GPP, RA, RH, and DIS related to how these fluxes are asymmetrically influenced in each model by interannual temperature and soil moisture variability.
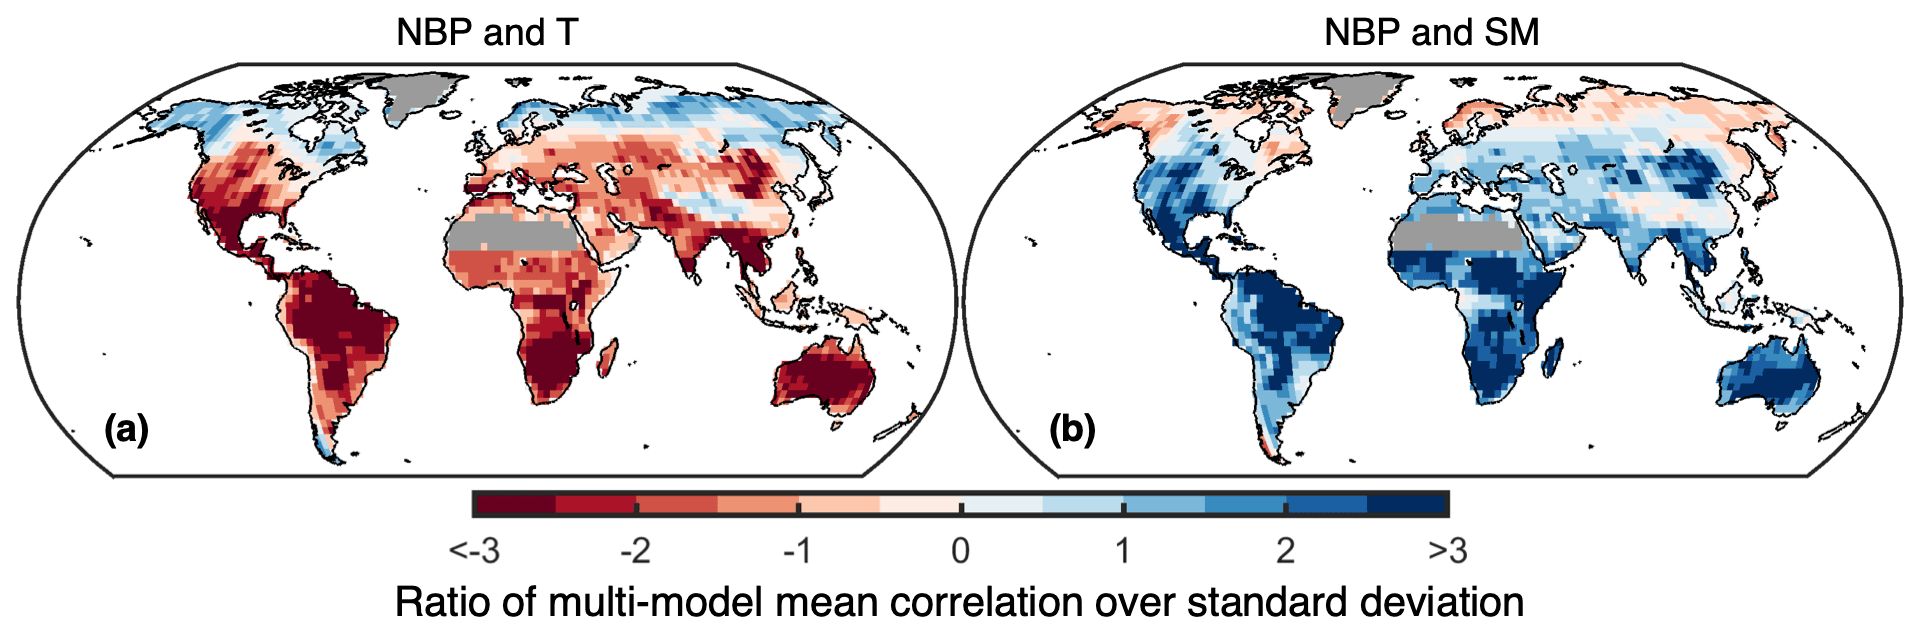
Figure 3Model agreement on the sensitivity of NBP to temperature and soil moisture. Shown is the ratio of the multi-model mean over the multi-model standard deviation for (a) the correlation between detrended annual NBP and detrended annual warm-season temperature and for (b) the correlation between detrended annual NBP and detrended annual warm-season soil moisture. Lighter colors indicate weaker correlations and/or higher model disagreement. Regions with 2015–2100 average GPP below 100 g C m2 yr−1 are masked.
The sensitivity of NBP to CO2 (sCO2) is computed as the slope of the linear regression based on the 30 annual values available in the simulations in which CO2 concentration ranges from approximately 375 to 500 ppm. Even though some of these concentrations are outside the range of 400–471 ppm spanned in the SSP126 scenario, the responses of NBP and GPP to CO2 concentration are still mostly linear for all models (Fig. S4 in the Supplement). If we were to limit the sample to be within the SSP126 CO2 concentration range, only 17 annual values would be available, which would reduce the confidence in the estimated regression slope. Counting with a larger sample size reduces the potential confounding effect of local temperature and soil moisture anomalies from individual years. To further avoid this confounding effect from individual years, we compute the regression slope 100 times after resampling with replacement from the 30-year time series. Finally, the median value of these regression slopes is used as the representative sensitivity from each model. In the case of models with multiple 1pctCO2-bgc simulations, the average value from all simulations is used. Given that no data are available from NorESM2-LM for the 1pctCO2-bgc simulation, we here assume that its sCO2 is the same as for CESM2 because both share the same land surface model (CLM5).
Increasing atmospheric CO2 concentration mostly favors an increase in NBP driven by enhanced photosynthesis, although with substantial intermodel differences in sCO2 at the tropics, boreal forests, North America, and eastern Australia (Fig. S5 in the Supplement). ACCESS-ESM1-5 and CMCC-ESM2 exhibit the lowest sCO2, whereas CNRM-ESM2-1 and CanESM5 exhibit the overall highest sCO2 (both models do not include a nitrogen cycle). The high sCO2 of CanESM5 is concentrated at the tropics, whereas for CNRM-ESM2-1 it comes from the mid and high latitudes. Other noteworthy features are the relatively high tropical sCO2 of CESM2 and NorESM2-LM, as well as the relatively high sCO2 of GFDL-ESM4 at high latitudes.
4.2 Sensitivity of NBP to temperature and soil moisture
Locally, annual warm or cold and wet or dry anomalies can influence annual NBP. The interannual sensitivity of NBP is therefore potentially indicative of the consequences of long-term changes in T and SM on the land carbon sink. In addition, an asymmetry in the response of NBP to a warm (dry) and cold (wet) anomaly of equal magnitude would influence cumulative NBP even if there were no long-term changes in T and SM. In this case too, a different sensitivity would contribute to a difference in cumulative NBP. Thus, model differences in the sensitivity of NBP to interannual variations in T and SM can potentially explain differences in cumulative NBP.
We estimate the sensitivity of NBP to temperature (sT) and soil moisture (sSM) from the detrended time series of annual mean NBP and detrended annual mean warm-season T and SM values from 2015 to 2100 given by the SSP126 simulations. Detrending the time series reduces the confounding effect of rising CO2 concentrations in these simulations, although potential alleviating effects of higher CO2 for NBP when facing T and SM anomalies are implicit within sT and sSM. The removed trends are computed using a locally weighted scatterplot smoother (LOWESS) fit with a 30-year window. In tropical latitudes (i.e., below 22.5∘ based on the model grid), we consider all months of the year, whereas in higher latitudes, we focus on the warmer months when vegetation is more active: March–October in the Northern Hemisphere and September–April in the Southern Hemisphere. We define sT and sSM as the covariance of NBP with T and SM, as opposed to the regression slope, to also account for intermodel differences in the interannual variability of T and SM (this is not necessary for sCO2 given that the interannual variability of CO2 is prescribed to be the same for all models). In addition to the covariance, we also compute the Pearson correlation to better describe the coupling of NBP with T and SM in the models. In the case of models with multiple simulations, the average covariance and average correlation are used.
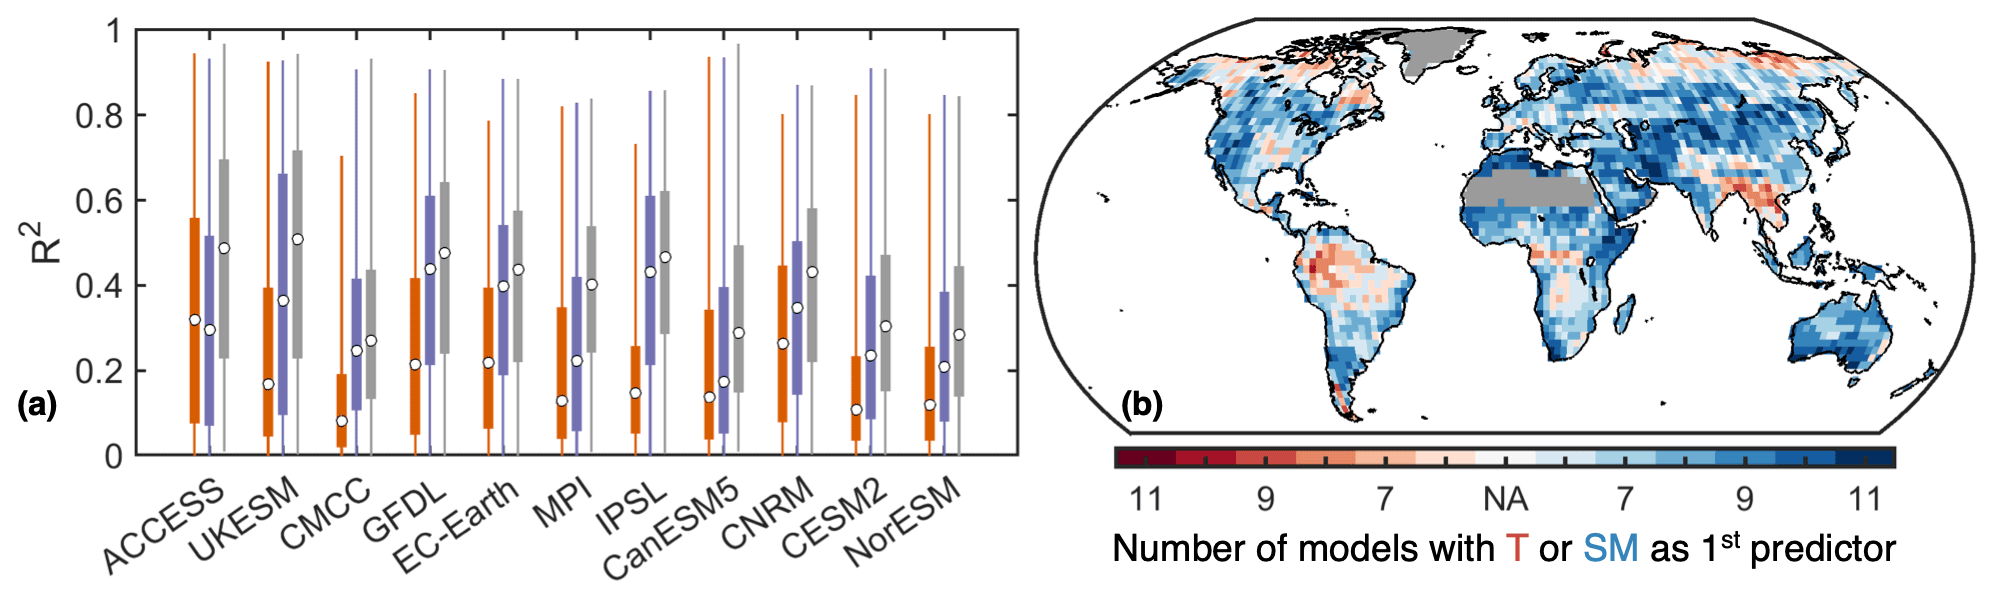
Figure 4Temperature and soil moisture as drivers of the detrended interannual variability of NBP. (a) Area-weighted distribution from all grid cells of the coefficient of determination (R2) between NBP with T (orange), SM (purple), and both T and SM from a stepwise linear regression (gray). The circle indicates the median, the boxes span the interquartile range, and the whiskers the full range. (b) Model agreement at each location where either T or SM is added first to the stepwise linear regression. Regions with 2015–2100 average GPP below 100 g C m2 yr−1 are omitted in panel (a) and masked in panel (b).
Anomalies in NBP and T are generally negatively correlated (years with higher T lead to lower NBP) throughout the world for most models, except at high latitudes, whereas the opposite is the case for the correlation with SM (years with higher SM lead to higher NBP) (Fig. 3). Nevertheless, there are several regions where the correlations are weaker and/or model disagreement is higher as indicated by values closer to zero of the multi-model mean over the standard deviation, e.g., southeast Asia, China, central Europe, central Africa (particularly for sSM), and throughout the boreal forests. Maps of the correlations and covariances from individual models are provided in the Supplement (Figs. S6–S9 in the Supplement). Some noteworthy features are the highly negative correlation of NBP with T and the highly positive correlation with SM over tropical South America for the ACCESS-ESM1-5, UKESM1-0-LL, GFDL-ESM4, EC-Earth3-Veg, and CanESM5 models; the highly positive covariance of NBP with SM over the boreal forests for CMCC-ESM2 and EC-Earth3-Veg; and the negative covariance of NBP with SM in southeast Asia, China, eastern North America, and southeast Brazil plus Uruguay for UKESM1-0-LL and MPI-ESM1-2-LR.
Although positive T anomalies often coincide with negative SM anomalies, we find that for most models and across most regions SM explains the detrended interannual variability of NBP better than T, as indicated by the squared correlations (Fig. 4a). Anomalies in SM explain 50 % of the variability in NBP over a quarter of the land area (excluding regions with average GPP below 100 g C m2 yr−1) on average across all models. Note that in general the interannual correlation of NBP and SM, as well as of NBP and T, is higher precisely where the interannual variability of NBP is higher (Figs. S3, S6 and S7). In addition, to explain the detrended interannual variability of NBP using both T and SM as predictors, we fit a stepwise linear regression. In this case the explained NBP variability increases, reaching an ensemble mean of 57 % over a quarter of the land area. Furthermore, we find that over 78 % of the land area there is a model majority for which SM is added as the first predictor (Fig. 4b). Notable exceptions are regions with large interannual NBP variability such as parts of the Amazon, central Africa, and southeast Asia, where T is added first for most models. However, note that there is no strong model agreement throughout many regions. Results are consistent when using SM down to 1 m depth instead of 30 cm (Fig. S10 in the Supplement). Overall, these findings highlight the importance of explicitly considering the sensitivity to SM, in addition to the sensitivity to T, as a driver of intermodel differences in NBP.
4.3 Average warm-season temperature and soil moisture conditions
Projected long-term average T and SM also influence the cumulative land carbon sink. NBP is reduced if conditions are generally too hot, cold, dry, or wet relative to an optimal state. Given that our focus is on cumulative NBP from 2015 to 2100 under the SSP126 scenario, we compute the average warm-season T and SM over the same 86-year period and scenario. We follow the same definition for the warm season as described in Sect. 4.2.
Local intermodel differences in projected average T and top 30 cm SM show a global mean standard deviation of 1.4 ∘C and 14.7 kg m−2 over land, with higher values at tropical forests, the United States, and Tibet for T and at very high latitudes for SM (Figs. S11 and S12 in the Supplement). GFDL-ESM4, MPI-ESM1-2-LR, IPSL-CM6A-LR, and EC-Earth3-Veg generally project lower temperatures, whereas higher temperatures are projected by ACCESS-ESM1-5 and UKESM1-0-LL in the tropics; by NorESM2-LM, CMCC-ESM2, and CESM2 at mid latitudes; and by CanESM5, CMCC-ESM2, IPSL-CM6A-LR, and CNRM-ESM2-1 at high latitudes. NorESM2-LM and CESM2 are clearly the models with the highest SM (both have CLM5 as their land surface model). On the other hand, MPI-ESM1-2-LR, IPSL-CM6A-LR, CanESM5, and UKESM1-0-LL are generally the driest models, as well as ACCESS-ESM1-5 in the tropics.
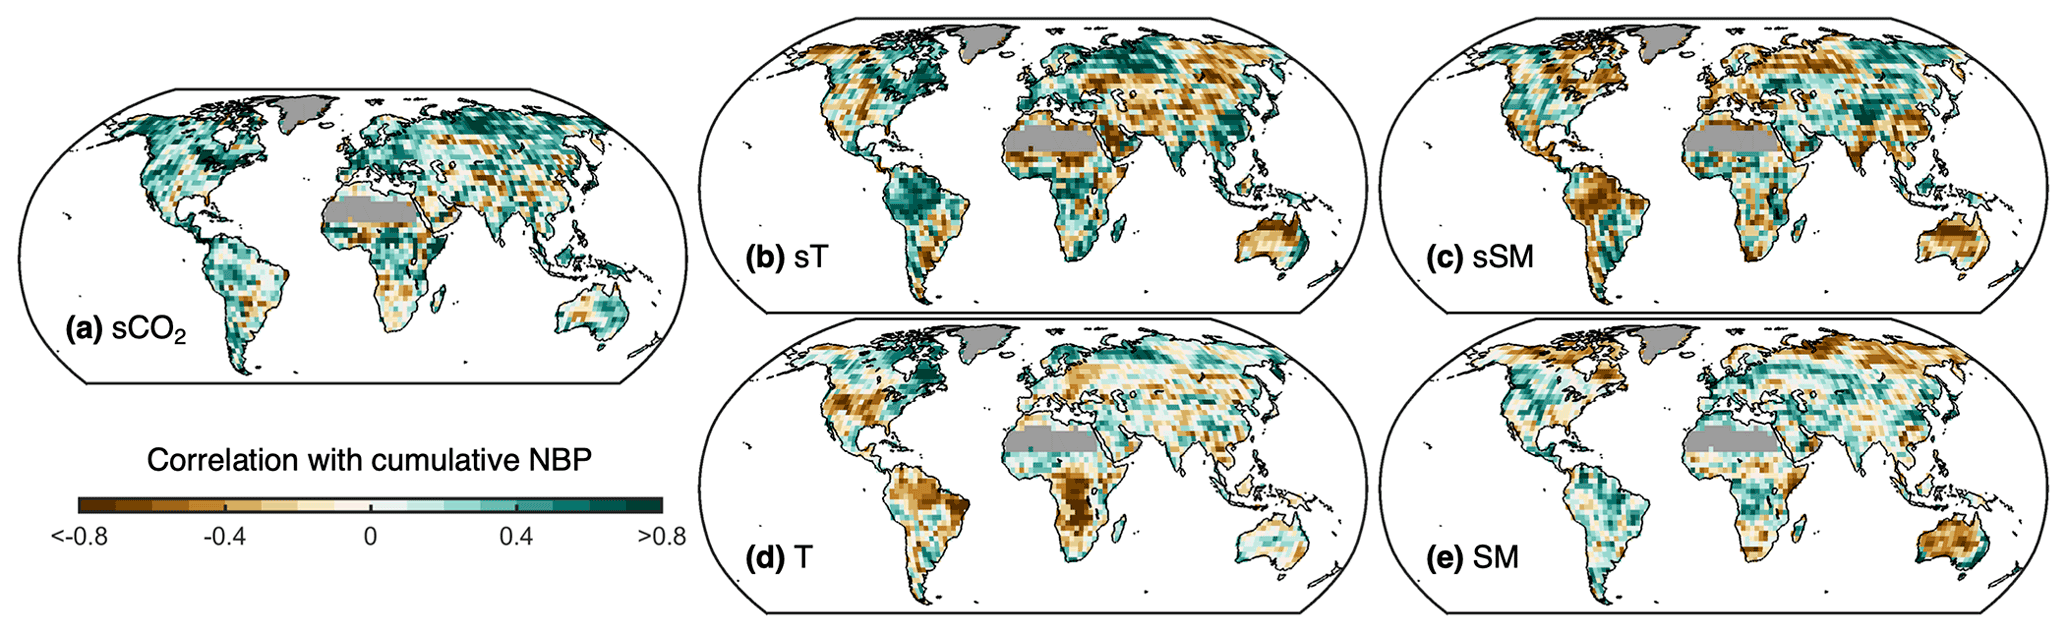
Figure 5Influence of model characteristics on projected cumulative NBP. Pearson correlation at each grid cell between cumulative NBP projected by each Earth system model and their (a) sensitivity to CO2 concentration (sCO2), (b) sensitivity to temperature (sT), (c) sensitivity to soil moisture (sSM), (d) long-term warm-season average temperature (T), and (e) long-term warm-season average soil moisture (SM). For panels (b) and (c), sT and sSM correspond either to the covariance or to the correlation of detrended annual anomalies of NBP with T and SM, depending on which has the strongest absolute correlation with projected cumulative NBP. Regions with 2015–2100 average GPP below 100 g C m2 yr−1 are masked.
To assess the effect and relevance of each of the five proposed drivers of intermodel differences in land carbon sink projections, we compute at each grid cell their correlation with cumulative NBP (Fig. 5). At each grid cell, for example, we correlate the sCO2 values obtained for each of the 11 models with the corresponding 11 values of cumulative NBP from each model. The dominant positive correlation for sCO2 indicates that models with higher sCO2 tend to project higher NBP, whereas the lack of correlation at some locations indicates that intermodel differences in NBP cannot be explained by differences in the strength of sCO2, potentially because of other NBP drivers. In addition, we find clear positive correlations of cumulative NBP with sT and negative correlations with sSM over multiple regions important for the land carbon sink, such as the Amazon, central Africa, India, China, eastern Australia, Europe, and the boreal forests. This suggests that models that have higher (lower) NBP during warmer (colder) than average years (i.e., higher sT) tend to project higher cumulative NBP in these regions, as do models that have higher (lower) NBP during drier (wetter) than average years (i.e., lower sSM). In other words, models for which annual NBP drops less during hotter and drier years yield higher cumulative NBP (recall Fig. 3). On the other hand, there are also other typically wet regions such as Indonesia and southeast South America where models that have higher (lower) NBP during wetter (drier) than average years (i.e., higher sSM) tend to project higher cumulative NBP. Additionally, we find that higher long-term average warm-season T in some models over central Africa, eastern Brazil, and the Amazon as well as central and western United States is associated with lower cumulative NBP. Higher NBP is favored over midwestern North America, the Amazon, European boreal forests, and eastern Australia for models with above average long-term mean warm-season SM.
To quantify the joint contributions of differences in sCO2, sT, sSM, T, and SM for explaining the intermodel differences in projected cumulative NBP, we fit a multiple linear regression at every grid cell. As noted in Sect. 4.2, for sT and sSM we use both the covariance and the correlation of detrended annual anomalies of NBP (NBPanom) with anomalies of warm-season temperature (Tanom) and soil moisture (SManom). Therefore, cumulative NBP of each model m is estimated according to Eq. (1):
where bi are the regression coefficients. Given that the number of predictor variables (7) is relatively high, and the sample size is relatively small (11 models), we are likely to obtain a good fit for the regression even if random variables are used instead of the proposed drivers. However, a regional spatial coherence on the signs of bi would only arise if there is an actual relation between NBP and the proposed drivers as seen in Fig. 5.
Instead of fitting the regression given by Eq. (1) only once at every grid cell using cumulative NBP from 2015 to 2100, we created 200 different bootstrap time series of 86 years by resampling with repetition from all projected years. Then for each of these time series we compute the cumulative NBP of individual models, as well as sT, sSM, T, and SM (not sCO2 as it is estimated from the 1pctCO2-bgc simulations), and finally fit the regression. This bootstrap approach introduces some uncertainty into our estimates of both the proposed drivers (Eq. 1, right-hand side) and the cumulative NBP (Eq. 1, left-hand side), which is further propagated into an uncertainty in terms of the regression coefficients bi. In this way we can provide a likely range for the contribution of each driver to explain a given model's anomalous behavior relative to the ensemble mean cumulative NBP.
The regression estimates capture well the local intermodel variability of cumulative NBP (Fig. S13 in the Supplement), and the regression coefficients bi show regionally coherent signs consistently across the bootstrap realizations (Fig. S14 in the Supplement), providing confidence in the robustness of the results. The net aggregated outcome of the local multiple linear regressions (MLRs) (Eq. 1) shows good agreement with average projected NBP from individual Earth system models (ESMs) at regional and global scales (Fig. 6). The average coefficient of determination (R2) across bootstraps between the ESM and MLR aggregated estimates is greater than 0.96 for both the global and regional estimates. Thus, most of the intermodel spread in cumulative NBP can be explained by the intermodel spread in the proposed drivers. Nevertheless, there are some discrepancies between the MLR estimate and the ESM projection of each model. The MLR generally underestimates the ESM values in the case of models projecting an above average land carbon sink, and it overestimates them for models projecting a below average sink. Most noticeable is the MLR underestimation of the land carbon sink modeled by NorESM2-LM, CESM2, and CanESM5, as well as the overestimation for UKESM1-0-LL, GFDL-ESM4, and CMCC-ESM2. The underestimation for NorESM2-LM and CESM2 arises mainly in the tropics, whereas for CanESM5 it also has a considerable contribution from high latitudes. In the case of UKESM1-0-LL the overestimation from the regression predominantly occurs in the tropics, whereas for GFDL-ESM4 the overestimation is highest at mid latitudes. For CMCC-ESM2 there is a large overestimation at high latitudes that is partially compensated by an underestimation at the tropics. These differences are likely due to nonlinear responses of NBP that are not captured by the multiple linear regression, due to potential interactions between the drivers and/or due to missing relevant drivers (e.g., differences in land cover, incoming radiation).
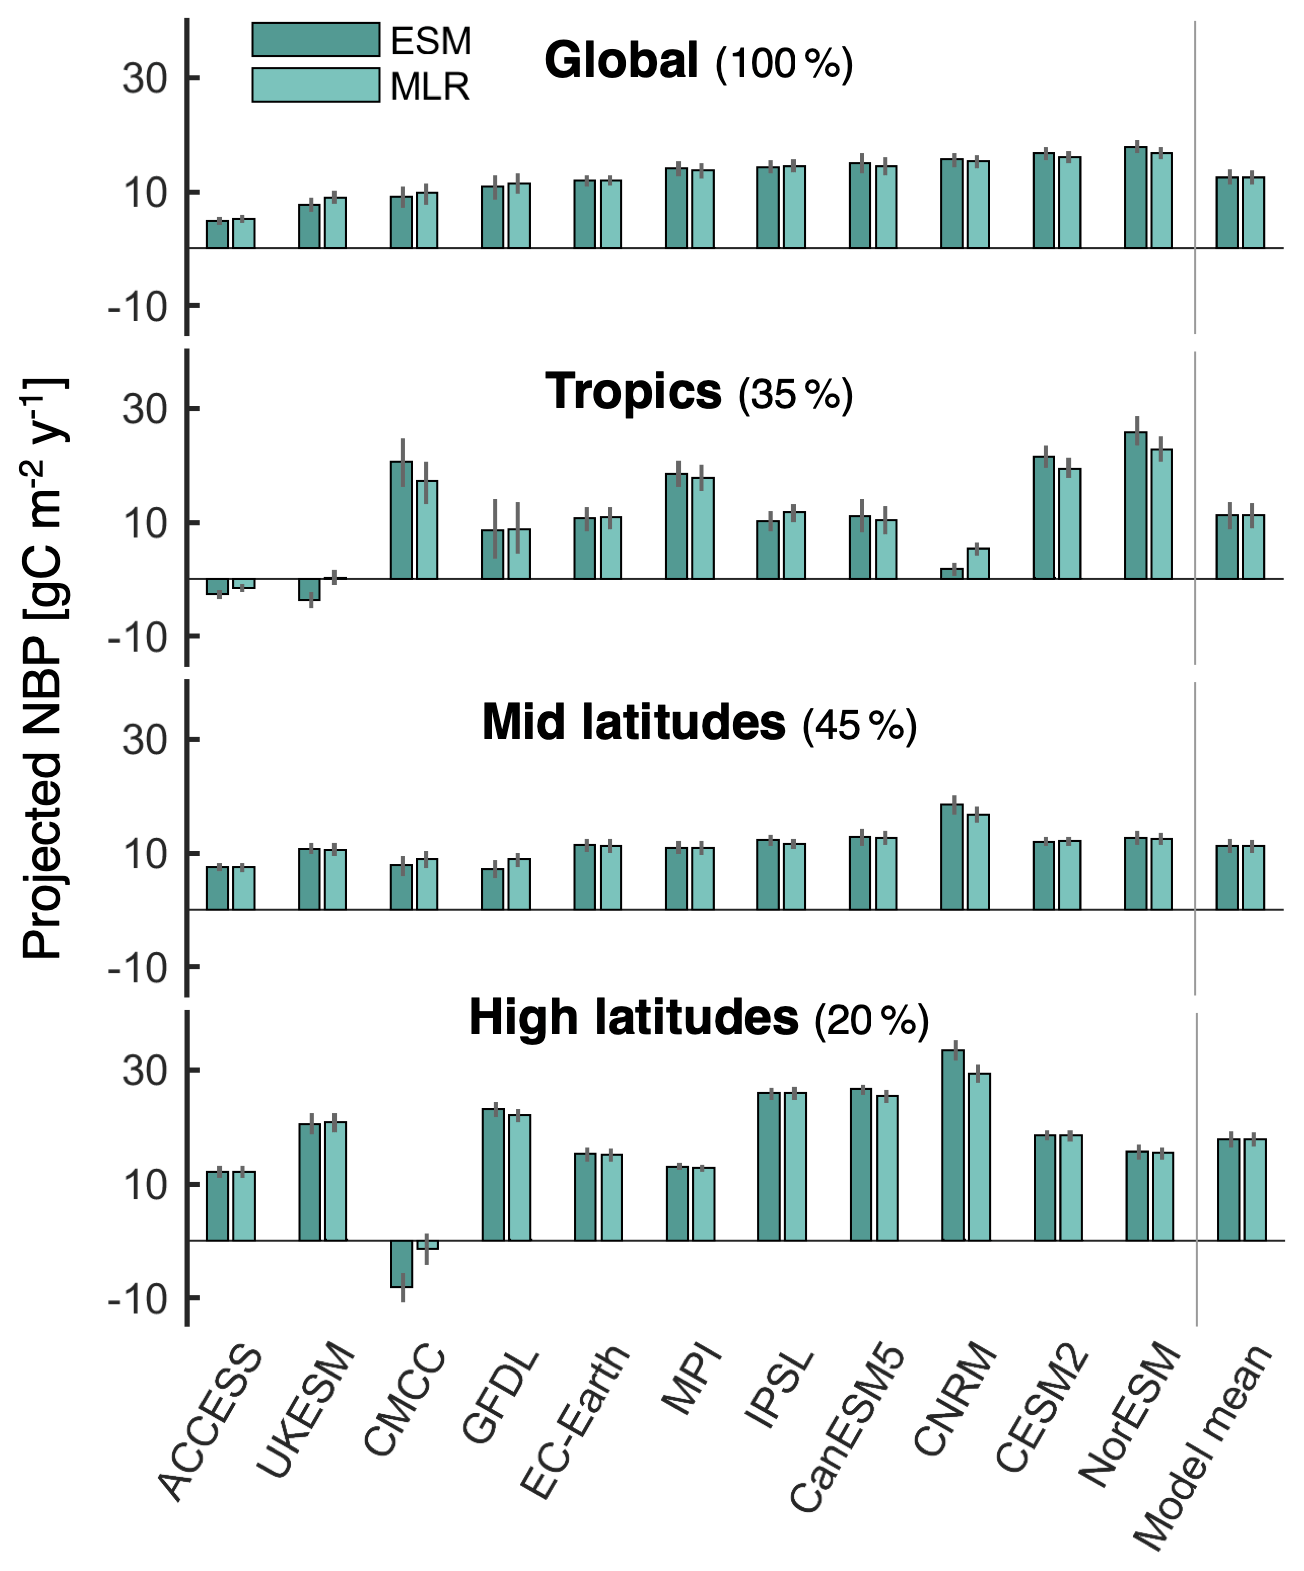
Figure 6Comparison of average projected NBP from Earth system models (ESMs) with the multiple linear regression (MLR) estimate. Colored bars indicate the mean from the 200 bootstrap samples, while uncertainty bars span from the 5th to the 95th percentile. The spatial average is shown for global land, the tropics (22.5∘ S–22.5∘ N), mid latitudes (22.5–47.5∘ N over North America, 22.5–55∘ N over Europe and Asia, and > 22.5∘ S), and high latitudes (> 47.5∘ N over North America and > 55∘ N over Europe and Asia). The land percentage comprised in each region is noted next to the title: tropics represent 35.1 % of the considered global land area, mid latitudes 44.8 %, and high latitudes 20.1 %.
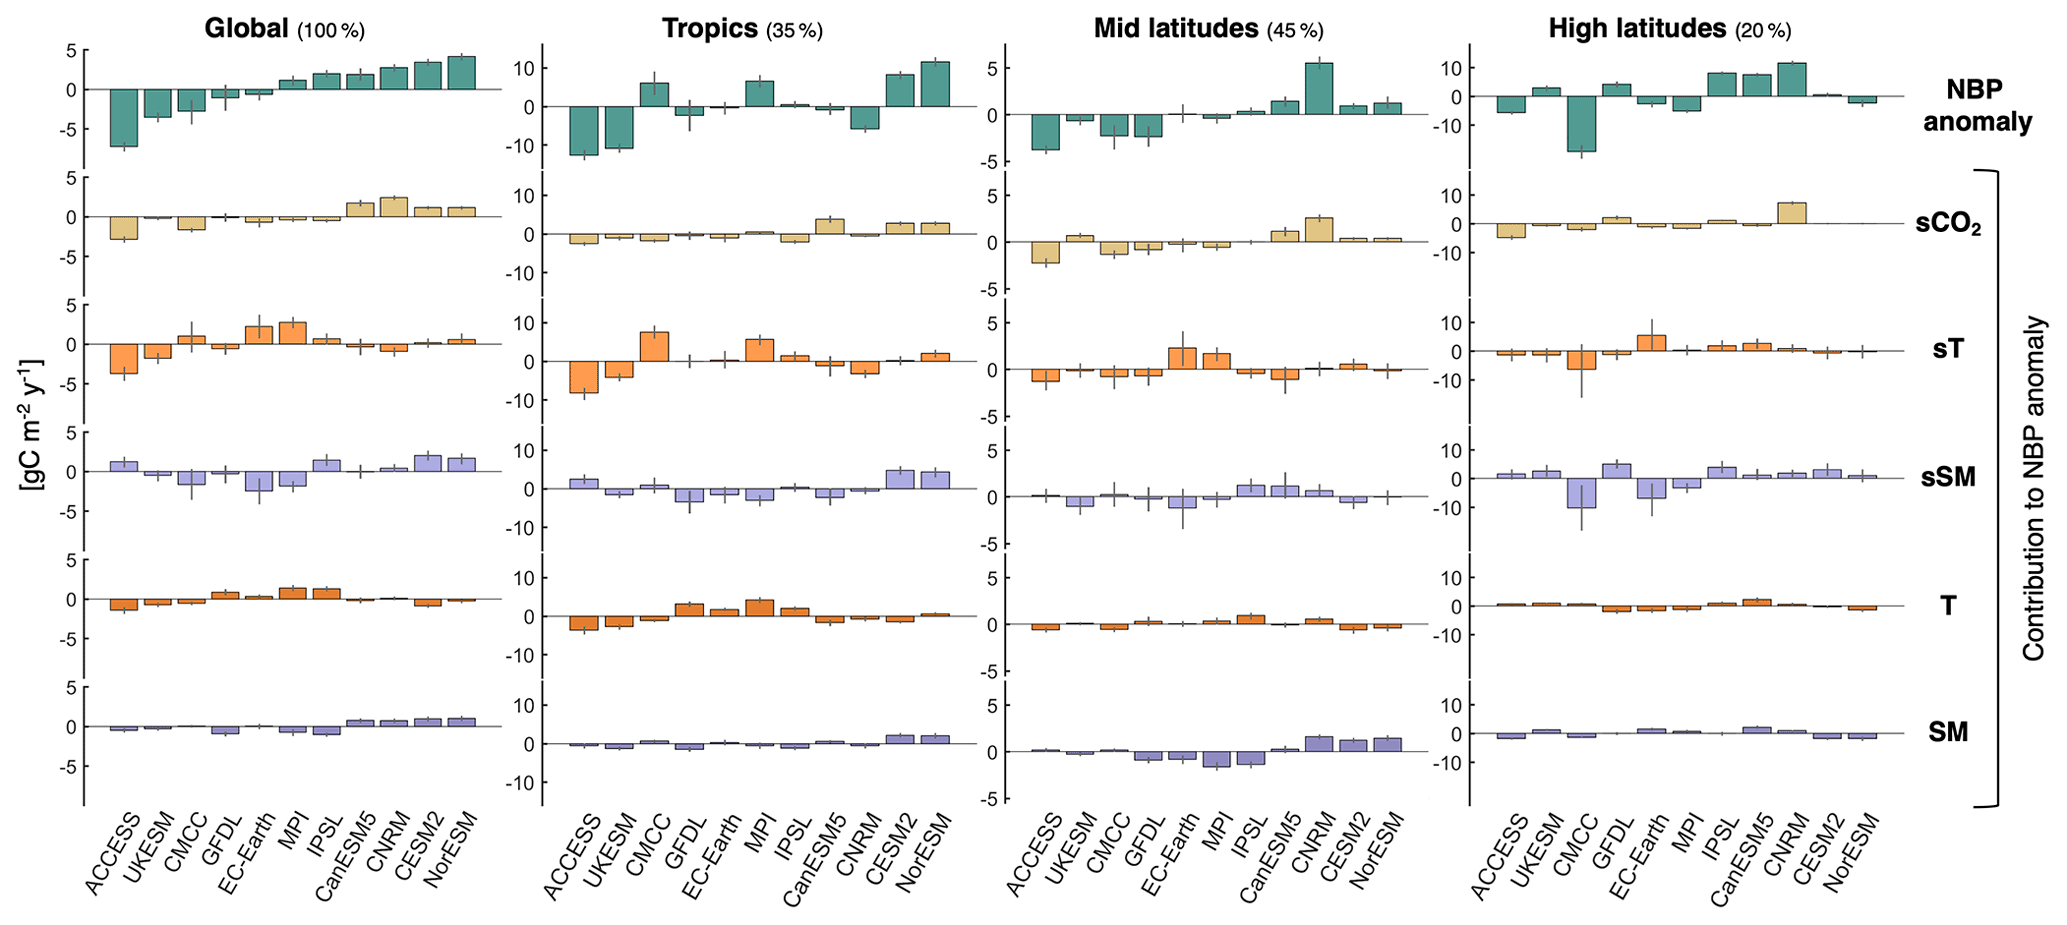
Figure 7Contributions of the drivers to explaining the anomaly in average projected NBP from individual models relative to the ensemble mean. Estimates are based on the multiple linear regression. Colored bars indicate the mean from the 200 bootstrap samples, while uncertainty bars span from the 5th to the 95th percentile. The spatial average is shown for global land, the tropics (22.5∘ S–22.5∘ N), mid latitudes (22.5–47.5∘ N over North America, 22.5–55∘ N over Europe and Asia, and > 22.5∘ S), and high latitudes (> 47.5∘ N over North America and > 55∘ N over Europe and Asia). The land percentage comprised in each region is noted next to the title: tropics represent 35.1 % of the considered global land area, mid latitudes 44.8 %, and high latitudes 20.1 %.
Given that the regression simulates well the projected NBP by the Earth system models, the individual terms of Eq. (1) (i.e., bi×driveri) can be used to quantify the contribution of each proposed driver to explain intermodel differences. The contributions of sT and sSM are obtained by lumping together both the correlation and covariance terms. Figure 7 shows how much each driver contributes to explaining each model's anomaly in projected NBP relative to the ensemble mean (see also Table S3 and Fig. S15 in the Supplement). For example, 39 % of the below average land carbon sink projected by ACCESS-ESM1-5 is due to its low sCO2 mainly outside the tropics (see Fig. S5), 51 % is due to its low sT mainly at the tropics (i.e., lower (higher) NBP during hotter (colder) than average years compared to other models; see Figs. S6 and S8), 20 % is due mainly to its high long-term average tropical T (see Fig. S11), and 7 % is due to its SM, whereas the contribution of sSM compensates the excess 17 % from the other drivers. UKESM1-0-LL also shows a similar relative contribution of sT and T towards a low land carbon sink mainly at the tropics. At the other end of the spectrum, the two models with the highest average projected NBP (CESM2 and NorESM2-LM) show a dominant contribution of sSM at the tropics mainly due to low values in the Amazon and high values in Indonesia (Figs. S7 and S9), as well as a positive contribution due to high tropical sCO2 (see Fig. S5) and high long-term SM at the tropics and mid latitudes (see Fig. S12). Other noteworthy findings are the strong contribution of sCO2 for CNRM-ESM2-1 (mid and high latitudes) and for CanESM5 (tropics and mid latitudes) to their above average land carbon sink projection; the less unfavorable consequences of hot temperature anomalies on tropical NBP for CMCC-ESM2 and MPI-ESM1-2-LR together with the relatively low long-term average tropical T of MPI-ESM1-2-LR, which result in positive contributions to average NBP; and the very low average NBP of CMCC-ESM2 at high latitudes resulting from steep drops during years with high T and low SM annual anomalies (sT and sSM contributions). These steep drops in annual NBP are associated with high fire emissions at the boreal forests (Fig. S16 in the Supplement), highlighting the importance of adequately representing this process in models given that it can explain much of the differences in average projected NBP. In this study, model differences in fire emissions are partly captured by differences in sT and sSM. Lastly, we note that CMCC-ESM2, GFDL-ESM4, and EC-Earth3-Veg show the largest uncertainties, particularly in the contributions of sT and sSM. This is related to high fire emissions from individual years which can be in or out of the bootstrap samples, as well as to partial shifts between bootstrap samples in the contributions of sT and sSM due to collinearity.
In summary, the contributions of sT to explain the projected differences in NBP are the largest, closely followed by the contributions of sSM and sCO2, whereas those of T and SM are generally smaller and of similar magnitude. The overall intermodel standard deviation of global land projected NBP based on the regression estimates is 3.46 (equivalent to 40.2 Pg C during the period 2015–2100), relative to which the intermodel standard deviations of the contributions from the drivers are 52.4 % for sT, 44.2 % for sSM, 44 % for sCO2, 26.2 % for T, and 21.9 % for SM. These results highlight the importance of sSM and SM as drivers of projected cumulative NBP, in addition to sT and T. Furthermore, the arguably high intermodel standard deviation values for many of the drivers suggest that while constraining individual drivers would help reduce the spread of the projected land carbon sink, a large uncertainty would remain. For example, if we are to assume sT and sSM to be locally equal across all models, by summing the contributions from the other drivers we find that the intermodel standard deviation of NBP would still be 2.23 ; i.e., 64.5 % of the original spread. Assuming sCO2 to be locally equal across models drops the NBP spread to 68.1 % and assuming both T and SM to be locally equal across models drops it to 78.2 %.
Figure 8 presents a compact overview of the factors explaining intermodel differences in cumulative projected NBP. We group sT with sSM to represent the sensitivity of NBP to interannual climate variability, and T with SM to represent general background climate conditions. This reduces any potential compensating effects in the contributions of sT, sSM, T, and SM that could have resulted from the underlying colinearities between these drivers. Differences in the sensitivity of NBP to interannual climate variability play a key role, explaining 54 % and 64 % of the projected anomaly relative to the ensemble mean for the two models with the highest land carbon sink, as well as 34 % and 65 % for the two models with the lowest land carbon sink. We note here that CESM2 and NorESM2-LM (models with the highest sink) share the same land surface model, while ACCESS-ESM1-5 and UKESM1-0-LL (models with the lowest sink) share a similar atmospheric model component (HadGEM family). Furthermore, the intermodel variability in the contributions of the sensitivity of NBP to climate (sT + sSM) corresponds to 48.8 % of the total NBP intermodel variability, whereas for the contributions of sCO2 it corresponds to 44 %, and for the contributions of average climate conditions (T + SM) it is 24.5 %. These insights are obtained based on the multiple linear regression, so it is worth noting again that the regression estimates do not fully match the actual differences between models, with the clearest discrepancies in the underestimation of the sink for NorESM2-LM and the overestimation for UKESM1-0-LL.
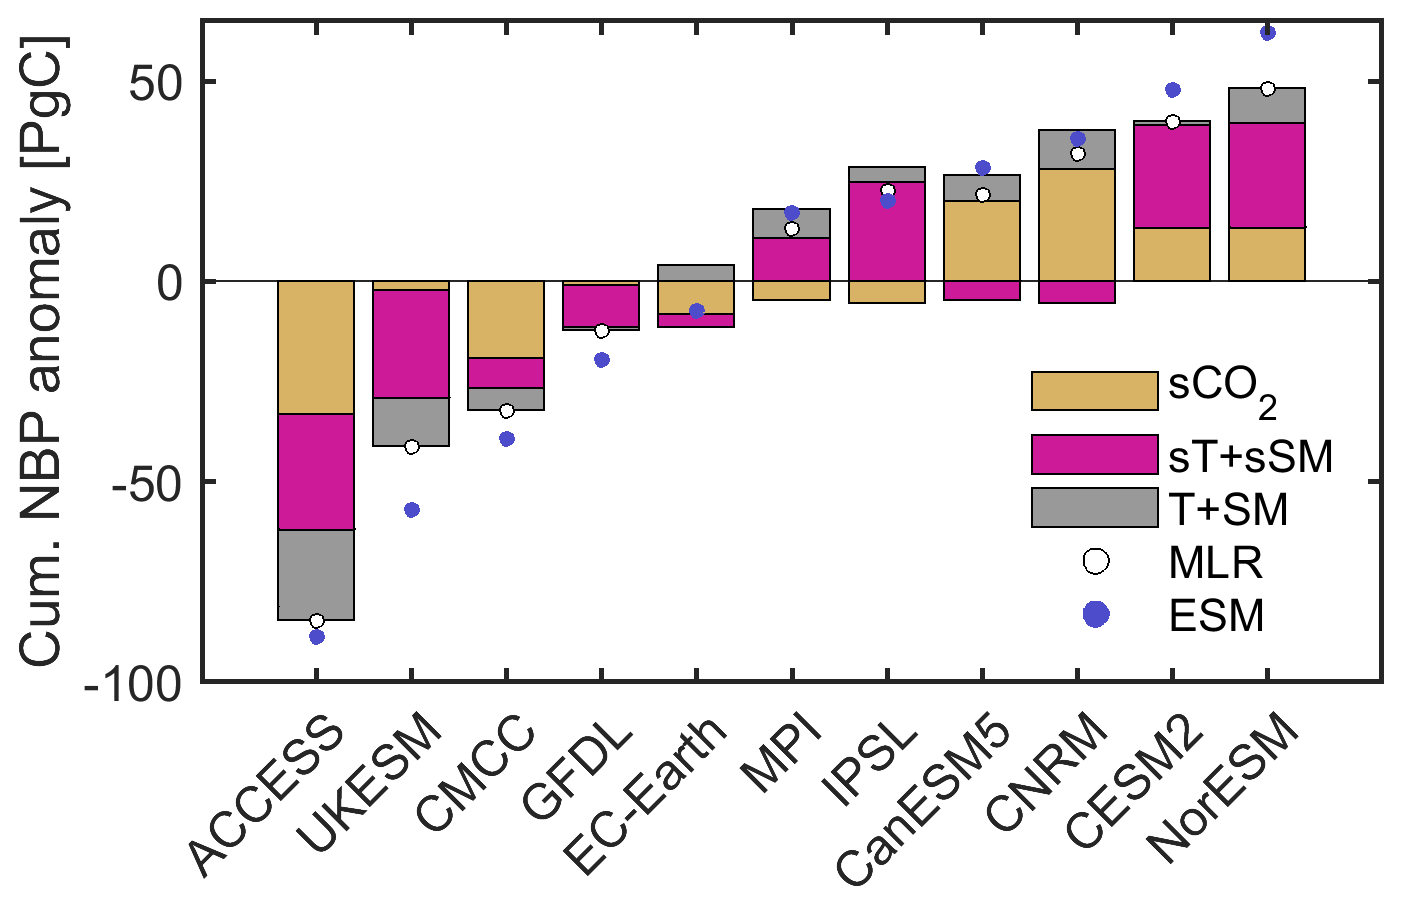
Figure 8Summary of the contributions of the drivers to explaining intermodel differences in projected global land cumulative NBP. Bars indicate the grouped contributions of sCO2, sT plus sSM, and T plus SM to the NBP anomaly estimate from the multiple linear regression. Dots indicate the total NBP anomaly based on the multiple linear regression (MLR) and from the actual model projections (ESMs). All values correspond to averages from the 200 bootstrap samples. Global land estimates are obtained by multiplying the area-weighted averages by the land surface area excluding Antarctica (135.22 × 10⁶ km2). From left to right the models are ordered according to actual increasing projected land carbon sink.
The insights derived from Fig. 8 are generally robust against alternative choices on how the sensitivities (sCO2, sT, and sSM) are defined. First, we replicate the analysis using the sensitivity of GPP (instead of NBP) to CO2 as a driver of intermodel uncertainty in land carbon sink projections (Fig. S17 in the Supplement). In this case, model differences in sCO2 no longer include differences arising from how RA, RH, and DIS are asymmetrically influenced in each model by interannual temperature and soil moisture variability, thus potentially reducing the colinearity of sCO2 with sT + sSM. However, this comes at the cost of neglecting model differences in the effects of rising CO2 on RA, RH, and DIS. Results show that the intermodel variability in the contribution of sCO2 decreases from 44 % to 31.6 % of the total NBP intermodel variability, whereas that of sT + sSM increases to 60.1 % and that of T+SM increases to 28.3 %, while the mean absolute error of the multiple linear regression increases from 6.7 to 10.4 Pg C. Using the sensitivity of GPP (instead of NBP) to CO2 particularly worsens the ability of the multiple linear regression to accurately estimate the projected land carbon sink of CanESM5, CNRM-ESM2-1, and IPSL-CM6A-LR. Second, we replicate the analysis when computing sT and sSM from the 1pctCO2-rad simulations to remove potential alleviating effects of higher CO2 given that these simulations account for the radiative effects of increasing CO2 but keep CO2 at the pre-industrial level from a biogeochemical perspective (Fig. S18 in the Supplement). Results are still consistent with those of Fig. 8 even though this case is less meaningful as sT and sSM are computed under different CO2 and climate conditions than those projected by scenario SSP126. Finally, results hardly change when assuming a latitudinal threshold of 30∘, instead of 22.5∘, beyond which annual mean warm-season temperature and soil moisture are used to compute sT and sSM (Fig. S19 in the Supplement).
In this study we focus on projections of the land carbon sink for a policy-relevant scenario with warming below 2 ∘C by the end of the century (i.e., SSP126). Even under this scenario with a relative low concentration of greenhouse gases, there is an intermodel spread of approximately 150 Pg C in cumulative NBP from 2015 to 2100 – equivalent to 15 years of current anthropogenic emissions – which translates into a 40 % uncertainty in the carbon budget remaining to stabilize global temperature below the chosen threshold. We also show that even when two models project a similar global land carbon sink, there can be large and compensating regional differences. Here we identify regions in which models differ the most and assess which are the underlying model characteristics explaining these differences in the cumulative land carbon sink.
We accurately explain model differences in cumulative NBP as a function of their differences in the sensitivity of NBP to CO2, in the sensitivity of NBP to interannual temperature and soil moisture variability, and in projected long-term temperature and soil moisture during the warm season. We detail differences in these five drivers across the model ensemble and discuss how they influence the land carbon sink projected by each model throughout the globe. In addition, we find that the detrended interannual variability of projected NBP is better explained by soil moisture than temperature in most models and across most regions. A notable exception is the core of the Amazon, where temperature is more important than soil moisture to explain the interannual variability of NBP in the models. Given the relevance of model differences in the sensitivity of NBP to temperature and soil moisture, it is increasingly important to further disentangle their sensitivities to incoming radiation and to vapor pressure deficit. This would bring us a step closer to identify the underlying mechanisms for the divergence across models from a process perspective.
Our quantification of the factors explaining intermodel differences in projected NBP highlights the primary role of the response of the land carbon cycle to interannual temperature and soil moisture variability, followed closely by the sensitivity of NBP to CO2, and to a lesser degree by average climate conditions. This finding provides explicit evidence that improving the representation of the local-scale sensitivity of NBP to interannual climate variability has the potential to reduce uncertainty in long-term projections of the global land carbon sink. A noteworthy aspect of this study is to explicitly consider the role of soil moisture when explaining model differences in projected cumulative NBP, as it provides valuable information in addition to temperature. We highlight substantial contributions mainly from model differences in the sensitivity of NBP to interannual soil moisture variability, but also from differences in long-term average soil moisture.
In the quest to better understand the future evolution of the land carbon cycle, our detailed insights about why each model projects either a relatively high or low cumulative land carbon sink is a valuable starting point to reducing uncertainty. For example, a high regional contribution of sSM and/or sT to a model's land sink anomaly indicates the need to evaluate and improve potentially related processes such as water stress on photosynthesis, the effect of temperature and moisture on soil carbon loss due to microbial activity, and the occurrence and magnitude of fire emissions. Furthermore, our findings emphasize the need for spatially explicit observations of the sensitivity of the land carbon cycle to changes in temperature, soil moisture, and CO2 concentration, among other variables. Fortunately, this is becoming increasingly feasible thanks to progress in estimating carbon fluxes through in situ observational networks, atmospheric inversions, and remote sensing products. The insights from this study together with those from novel observations are set to pave the way towards more confident projections of the evolution of the land carbon sink.
The CMIP6 data used in this study are available at https://esgf-node.llnl.gov/search/cmip6/ (ESGF, 2022). Detailed inputs for the search query are as follows: source ID see Table S1; experiment IDs are ssp126, ssp585, 1pctCO2-bgc, and 1pctCO2-rad; frequency is mon; and variables are nbp, tas, mrsol, gpp, ra, rh, fFire, and co2mass. We also used the variable npp to derive ra = gpp − npp for the ACCESS-ESM1-5 model. Scripts used for the analysis are available at https://doi.org/10.3929/ethz-b-000579451 (Padrón et al., 2022).
The supplement related to this article is available online at: https://doi.org/10.5194/bg-19-5435-2022-supplement.
RSP, LG, and SIS conceived the idea and designed the study. RSP processed the CMIP6 data, performed the analysis and wrote the paper with periodic suggestions from all authors. All authors discussed the results, read, and reviewed the paper.
The contact author has declared that none of the authors has any competing interests.
Publisher's note: Copernicus Publications remains neutral with regard to jurisdictional claims in published maps and institutional affiliations.
We acknowledge partial support from the European Union's Horizon 2020 project “Climate-Carbon Interactions in the Current Century” (4C) under grant agreement no. 821003. Laibao Liu and Sonia I. Seneviratne also acknowledge partial support from the European Union’s HORIZON.2.5 project “Response of the Earth System to overshoot, Climate neUtrality and negative Emissions” (RESCUE) under grant agreement no. 101056939. Vincent Humphrey acknowledges support from the Swiss National Science Foundation (grants no. P400P2_180784 and P4P4P2_194464). We acknowledge the World Climate Research Programme's Working Group on Coupled Modelling, which is responsible for the Coupled Model Intercomparison Project (CMIP), and we thank the climate modeling groups for producing their model output and making it available. For the CMIP, the US Department of Energy's Program for Climate Model Diagnosis and Intercomparison provides coordinating support and led development of the software infrastructure in partnership with the Global Organization for Earth System Science Portals. We thank Urs Beyerle and Lukas Brunner for downloading and preprocessing the CMIP6 data.
This research has been partially supported by Horizon 2020 (grant no. 821003) (4C), HORIZON.2.5 (grant no. 101056939) (RESCUE) and by the Swiss National Science Foundation (grants no. P400P2_180784 and P4P4P2_194464).
This paper was edited by Martin De Kauwe and reviewed by Joe Melton and one anonymous referee.
Arora, V. K., Boer, G. J., Friedlingstein, P., Eby, M., Jones, C. D., Christian, J. R., Bonan, G., Bopp, L., Brovkin, V., Cadule, P., Hajima, T., Ilyina, T., Lindsay, K., Tjiputra, J. F., and Wu, T.: Carbon–Concentration and Carbon–Climate Feedbacks in CMIP5 Earth System Models, J. Climate, 26, 5289–5314, https://doi.org/10.1175/JCLI-D-12-00494.1, 2013.
Arora, V. K., Katavouta, A., Williams, R. G., Jones, C. D., Brovkin, V., Friedlingstein, P., Schwinger, J., Bopp, L., Boucher, O., Cadule, P., Chamberlain, M. A., Christian, J. R., Delire, C., Fisher, R. A., Hajima, T., Ilyina, T., Joetzjer, E., Kawamiya, M., Koven, C. D., Krasting, J. P., Law, R. M., Lawrence, D. M., Lenton, A., Lindsay, K., Pongratz, J., Raddatz, T., Séférian, R., Tachiiri, K., Tjiputra, J. F., Wiltshire, A., Wu, T., and Ziehn, T.: Carbon–concentration and carbon–climate feedbacks in CMIP6 models and their comparison to CMIP5 models, Biogeosciences, 17, 4173–4222, https://doi.org/10.5194/bg-17-4173-2020, 2020.
Bonan, G. B. and Doney, S. C.: Climate, ecosystems, and planetary futures: The challenge to predict life in Earth system models, Science (80-.), 359, https://doi.org/10.1126/SCIENCE.AAM8328, 2018.
Canadell, J. G., Monteiro, P. M. S., Costa, M. H., Cotrim da Cunha, L., Cox, P. M., Eliseev, A. V., Henson, S., Ishii, M., Jaccard, S., Koven, C., Lohila, A., Patra, P. K., Piao, S., Rogelj, J., Syampungani, S., Zaehle, S., and Zickfeld, K.: Global Carbon and other Biogeochemical Cycles and Feedbacks, in: Climate Change 2021: The Physical Science Basis. Contribution of Working Group I to the Sixth Assessment Report of the Intergovernmental Panel on Climate Change, edited by: Masson-Delmotte, V., Zhai, P., Pirani, A., Connors, S. L., Péan, C., Berger, S., Caud, N., Chen, Y., Goldfarb, L., Gomis, M. I., Huang, M., Leitzell, K., Lonnoy, E., Matthews, J. B. R., Maycock, T. K., Waterfield, T., Yelekçi, O., Yu, R., and Zhou, B., Cambridge University Press, Cambridge, United Kingdom and New York, NY, USA, 673–816, 2021.
Cox, P. M., Pearson, D., Booth, B. B., Friedlingstein, P., Huntingford, C., Jones, C. D., and Luke, C. M.: Sensitivity of tropical carbon to climate change constrained by carbon dioxide variability, Nature, 494, 341–344, https://doi.org/10.1038/nature11882, 2013.
Davies-Barnard, T., Meyerholt, J., Zaehle, S., Friedlingstein, P., Brovkin, V., Fan, Y., Fisher, R. A., Jones, C. D., Lee, H., Peano, D., Smith, B., Wårlind, D., and Wiltshire, A. J.: Nitrogen cycling in CMIP6 land surface models: progress and limitations, Biogeosciences, 17, 5129–5148, https://doi.org/10.5194/bg-17-5129-2020, 2020.
De Kauwe, M. G., Sabot, M. E. B., Medlyn, B. E., Pitman, A. J., Meir, P., Cernusak, L. A., Gallagher, R. V., Ukkola, A. M., Rifai, S. W., and Choat, B.: Towards species-level forecasts of drought-induced tree mortality risk, New Phytol., 235, 94–110, https://doi.org/10.1111/nph.18129, 2022.
ESGF: ESGF Node at LLNL, ESGF [data set], https://esgf-node.llnl.gov/search/cmip6/, last access: 30 November 2022.
Friedlingstein, P., Cox, P., Betts, R., Bopp, L., von Bloh, W., Brovkin, V., Cadule, P., Doney, S., Eby, M., Fung, I., Bala, G., John, J., Jones, C., Joos, F., Kato, T., Kawamiya, M., Knorr, W., Lindsay, K., Matthews, H. D., Raddatz, T., Rayner, P., Reick, C., Roeckner, E., Schnitzler, K.-G., Schnur, R., Strassmann, K., Weaver, A. J., Yoshikawa, C., and Zeng, N.: Climate–Carbon Cycle Feedback Analysis: Results from the C4MIP Model Intercomparison, J. Climate, 19, 3337–3353, https://doi.org/10.1175/JCLI3800.1, 2006.
Friedlingstein, P., O'Sullivan, M., Jones, M. W., Andrew, R. M., Hauck, J., Olsen, A., Peters, G. P., Peters, W., Pongratz, J., Sitch, S., Le Quéré, C., Canadell, J. G., Ciais, P., Jackson, R. B., Alin, S., Aragão, L. E. O. C., Arneth, A., Arora, V., Bates, N. R., Becker, M., Benoit-Cattin, A., Bittig, H. C., Bopp, L., Bultan, S., Chandra, N., Chevallier, F., Chini, L. P., Evans, W., Florentie, L., Forster, P. M., Gasser, T., Gehlen, M., Gilfillan, D., Gkritzalis, T., Gregor, L., Gruber, N., Harris, I., Hartung, K., Haverd, V., Houghton, R. A., Ilyina, T., Jain, A. K., Joetzjer, E., Kadono, K., Kato, E., Kitidis, V., Korsbakken, J. I., Landschützer, P., Lefèvre, N., Lenton, A., Lienert, S., Liu, Z., Lombardozzi, D., Marland, G., Metzl, N., Munro, D. R., Nabel, J. E. M. S., Nakaoka, S.-I., Niwa, Y., O'Brien, K., Ono, T., Palmer, P. I., Pierrot, D., Poulter, B., Resplandy, L., Robertson, E., Rödenbeck, C., Schwinger, J., Séférian, R., Skjelvan, I., Smith, A. J. P., Sutton, A. J., Tanhua, T., Tans, P. P., Tian, H., Tilbrook, B., van der Werf, G., Vuichard, N., Walker, A. P., Wanninkhof, R., Watson, A. J., Willis, D., Wiltshire, A. J., Yuan, W., Yue, X., and Zaehle, S.: Global Carbon Budget 2020, Earth Syst. Sci. Data, 12, 3269–3340, https://doi.org/10.5194/essd-12-3269-2020, 2020.
Fu, Z., Ciais, P., Prentice, I. C., Gentine, P., Makowski, D., Bastos, A., Luo, X., Green, J. K., Stoy, P. C., Yang, H., and Hajima, T.: Atmospheric dryness reduces photosynthesis along a large range of soil water deficits, Nat. Commun., 13, 989, https://doi.org/10.1038/s41467-022-28652-7, 2022.
Gao, Q., Wang, G., Xue, K., Yang, Y., Xie, J., Yu, H., Bai, S., Liu, F., He, Z., Ning, D., Hobbie, S. E., Reich, P. B., and Zhou, J.: Stimulation of soil respiration by elevated CO2 is enhanced under nitrogen limitation in a decade-long grassland study, P. Natl. Acad. Sci. USA, 117, 33317–33324, https://doi.org/10.1073/pnas.2002780117, 2020.
Gatti, L. V., Basso, L. S., Miller, J. B., Gloor, M., Gatti Domingues, L., Cassol, H. L. G., Tejada, G., Aragão, L. E. O. C., Nobre, C., Peters, W., Marani, L., Arai, E., Sanches, A. H., Corrêa, S. M., Anderson, L., Von Randow, C., Correia, C. S. C., Crispim, S. P., and Neves, R. A. L.: Amazonia as a carbon source linked to deforestation and climate change, Nature, 595, 388–393, https://doi.org/10.1038/s41586-021-03629-6, 2021.
Gentine, P., Green, J. K., Guérin, M., Humphrey, V., Seneviratne, S. I., Zhang, Y., and Zhou, S.: Coupling between the terrestrial carbon and water cycles-a review, Environ. Res. Lett., 14, 083003, https://doi.org/10.1088/1748-9326/ab22d6, 2019.
Green, J. K., Seneviratne, S. I., Berg, A. M., Findell, K. L., Hagemann, S., Lawrence, D. M., and Gentine, P.: Large influence of soil moisture on long-term terrestrial carbon uptake, Nature, 565, 476–479, https://doi.org/10.1038/s41586-018-0848-x, 2019.
Grossiord, C., Buckley, T. N., Cernusak, L. A., Novick, K. A., Poulter, B., Siegwolf, R. T. W., Sperry, J. S., and McDowell, N. G.: Plant responses to rising vapor pressure deficit, New Phytol., 226, 1550–1566, https://doi.org/10.1111/nph.16485, 2020.
Hantson, S., Kelley, D. I., Arneth, A., Harrison, S. P., Archibald, S., Bachelet, D., Forrest, M., Hickler, T., Lasslop, G., Li, F., Mangeon, S., Melton, J. R., Nieradzik, L., Rabin, S. S., Prentice, I. C., Sheehan, T., Sitch, S., Teckentrup, L., Voulgarakis, A., and Yue, C.: Quantitative assessment of fire and vegetation properties in simulations with fire-enabled vegetation models from the Fire Model Intercomparison Project, Geosci. Model Dev., 13, 3299–3318, https://doi.org/10.5194/gmd-13-3299-2020, 2020.
Huang, L., Chen, K., and Zhou, M.: Climate change and carbon sink: a bibliometric analysis, Environ. Sci. Pollut. R., 27, 8740–8758, https://doi.org/10.1007/s11356-019-07489-6, 2020.
Hubau, W., Lewis, S. L., Phillips, O. L., Affum-Baffoe, K., Beeckman, H., Cuní-Sanchez, A., Daniels, A. K., Ewango, C. E. N., Fauset, S., Mukinzi, J. M., Sheil, D., Sonké, B., Sullivan, M. J. P., Sunderland, T. C. H., Taedoumg, H., Thomas, S. C., White, L. J. T., Abernethy, K. A., Adu-Bredu, S., Amani, C. A., Baker, T. R., Banin, L. F., Baya, F., Begne, S. K., Bennett, A. C., Benedet, F., Bitariho, R., Bocko, Y. E., Boeckx, P., Boundja, P., Brienen, R. J. W., Brncic, T., Chezeaux, E., Chuyong, G. B., Clark, C. J., Collins, M., Comiskey, J. A., Coomes, D. A., Dargie, G. C., de Haulleville, T., Kamdem, M. N. D., Doucet, J.-L., Esquivel-Muelbert, A., Feldpausch, T. R., Fofanah, A., Foli, E. G., Gilpin, M., Gloor, E., Gonmadje, C., Gourlet-Fleury, S., Hall, J. S., Hamilton, A. C., Harris, D. J., Hart, T. B., Hockemba, M. B. N., Hladik, A., Ifo, S. A., Jeffery, K. J., Jucker, T., Yakusu, E. K., Kearsley, E., Kenfack, D., Koch, A., Leal, M. E., Levesley, A., Lindsell, J. A., Lisingo, J., Lopez-Gonzalez, G., Lovett, J. C., Makana, J.-R., Malhi, Y., Marshall, A. R., Martin, J., Martin, E. H., Mbayu, F. M., Medjibe, V. P., Mihindou, V., Mitchard, E. T. A., Moore, S., Munishi, P. K. T., Bengone, N. N., Ojo, L., Ondo, F. E., Peh, K. S.-H., Pickavance, G. C., Poulsen, A. D., Poulsen, J. R., Qie, L., Reitsma, J., Rovero, F., Swaine, M. D., Talbot, J., Taplin, J., Taylor, D. M., Thomas, D. W., Toirambe, B., Mukendi, J. T., Tuagben, D., Umunay, P. M., van der Heijden, G. M. F., Verbeeck, H., Vleminckx, J., Willcock, S., Wöll, H., Woods, J. T., and Zemagho, L.: Asynchronous carbon sink saturation in African and Amazonian tropical forests, Nature, 579, 80–87, https://doi.org/10.1038/s41586-020-2035-0, 2020.
Humphrey, V., Zscheischler, J., Ciais, P., Gudmundsson, L., Sitch, S., and Seneviratne, S. I.: Sensitivity of atmospheric CO2 growth rate to observed changes in terrestrial water storage, Nature, 560, 628–631, https://doi.org/10.1038/s41586-018-0424-4, 2018.
Humphrey, V., Berg, A., Ciais, P., Gentine, P., Jung, M., Reichstein, M., Seneviratne, S. I., and Frankenberg, C.: Soil moisture–atmosphere feedback dominates land carbon uptake variability, Nature, 592, 65–69, https://doi.org/10.1038/s41586-021-03325-5, 2021.
IPCC: Summary for Policymakers, in: Climate Change 2021: The Physical Science Basis. Contribution of Working Group I to the Sixth Assessment Report of the Intergovernmental Panel on Climate Change, edited by: Masson-Delmotte, V., Zhai, P., Pirani, A., Connors, S. L., Peán, C., Berger, S., Caud, N., Chen, Y., Goldfarb, L., Gomis, M. I., Huang, M., Leitzell, K., Lonnoy, E., Matthews, J. B. R., Maycock, T. K., Waterfield, T., Yelekçi, O., Yu, R., and Zhou, B., Cambridge University Press, Cambridge, UK and New York, NY, USA, 3–32, 2021.
Jones, C. D., Arora, V., Friedlingstein, P., Bopp, L., Brovkin, V., Dunne, J., Graven, H., Hoffman, F., Ilyina, T., John, J. G., Jung, M., Kawamiya, M., Koven, C., Pongratz, J., Raddatz, T., Randerson, J. T., and Zaehle, S.: C4MIP – The Coupled Climate–Carbon Cycle Model Intercomparison Project: experimental protocol for CMIP6, Geosci. Model Dev., 9, 2853–2880, https://doi.org/10.5194/gmd-9-2853-2016, 2016.
Koch, A., Hubau, W., and Lewis, S. L.: Earth System Models Are Not Capturing Present-Day Tropical Forest Carbon Dynamics, Earths Future, 9, e2020EF001874, https://doi.org/10.1029/2020EF001874, 2021.
Lawrence, D. M., Fisher, R. A., Koven, C. D., Oleson, K. W., Swenson, S. C., Bonan, G., Collier, N., Ghimire, B., Kampenhout, L., Kennedy, D., Kluzek, E., Lawrence, P. J., Li, F., Li, H., Lombardozzi, D., Riley, W. J., Sacks, W. J., Shi, M., Vertenstein, M., Wieder, W. R., Xu, C., Ali, A. A., Badger, A. M., Bisht, G., Broeke, M., Brunke, M. A., Burns, S. P., Buzan, J., Clark, M., Craig, A., Dahlin, K., Drewniak, B., Fisher, J. B., Flanner, M., Fox, A. M., Gentine, P., Hoffman, F., Keppel-Aleks, G., Knox, R., Kumar, S., Lenaerts, J., Leung, L. R., Lipscomb, W. H., Lu, Y., Pandey, A., Pelletier, J. D., Perket, J., Randerson, J. T., Ricciuto, D. M., Sanderson, B. M., Slater, A., Subin, Z. M., Tang, J., Thomas, R. Q., Val Martin, M., and Zeng, X.: The Community Land Model Version 5: Description of New Features, Benchmarking, and Impact of Forcing Uncertainty, J. Adv. Model. Earth Sy., 11, 4245–4287, https://doi.org/10.1029/2018MS001583, 2019.
Liu, L., Gudmundsson, L., Hauser, M., Qin, D., Li, S., and Seneviratne, S. I.: Soil moisture dominates dryness stress on ecosystem production globally, Nat. Commun., 11, 4892, https://doi.org/10.1038/s41467-020-18631-1, 2020.
Liu, Y., Piao, S., Gasser, T., Ciais, P., Yang, H., Wang, H., Keenan, T. F., Huang, M., Wan, S., Song, J., Wang, K., Janssens, I. A., Peñuelas, J., Huntingford, C., Wang, X., Altaf Arain, M., Fang, Y., Fisher, J. B., Huang, M., Huntzinger, D. N., Ito, A., Jain, A. K., Mao, J., Michalak, A. M., Peng, C., Poulter, B., Schwalm, C., Shi, X., Tian, H., Wei, Y., Zeng, N., Zhu, Q., and Wang, T.: Field-experiment constraints on the enhancement of the terrestrial carbon sink by CO2 fertilization, Nat. Geosci., 12, 809–814, https://doi.org/10.1038/s41561-019-0436-1, 2019.
McDowell, N. G., Sapes, G., Pivovaroff, A., Adams, H. D., Allen, C. D., Anderegg, W. R. L., Arend, M., Breshears, D. D., Brodribb, T., Choat, B., Cochard, H., De Cáceres, M., De Kauwe, M. G., Grossiord, C., Hammond, W. M., Hartmann, H., Hoch, G., Kahmen, A., Klein, T., Mackay, D. S., Mantova, M., Martínez-Vilalta, J., Medlyn, B. E., Mencuccini, M., Nardini, A., Oliveira, R. S., Sala, A., Tissue, D. T., Torres-Ruiz, J. M., Trowbridge, A. M., Trugman, A. T., Wiley, E., and Xu, C.: Mechanisms of woody-plant mortality under rising drought, CO2 and vapour pressure deficit, Nat. Rev. Earth Environ., 3, 294–308, https://doi.org/10.1038/s43017-022-00272-1, 2022.
Meinshausen, M., Nicholls, Z. R. J., Lewis, J., Gidden, M. J., Vogel, E., Freund, M., Beyerle, U., Gessner, C., Nauels, A., Bauer, N., Canadell, J. G., Daniel, J. S., John, A., Krummel, P. B., Luderer, G., Meinshausen, N., Montzka, S. A., Rayner, P. J., Reimann, S., Smith, S. J., van den Berg, M., Velders, G. J. M., Vollmer, M. K., and Wang, R. H. J.: The shared socio-economic pathway (SSP) greenhouse gas concentrations and their extensions to 2500, Geosci. Model Dev., 13, 3571–3605, https://doi.org/10.5194/gmd-13-3571-2020, 2020.
Mystakidis, S., Davin, E. L., Gruber, N., and Seneviratne, S. I.: Constraining future terrestrial carbon cycle projections using observation-based water and carbon flux estimates, Glob. Change Biol., 22, 2198–2215, https://doi.org/10.1111/gcb.13217, 2016.
Mystakidis, S., Seneviratne, S. I., Gruber, N., and Davin, E. L.: Hydrological and biogeochemical constraints on terrestrial carbon cycle feedbacks, Environ. Res. Lett., 12, 014009, https://doi.org/10.1088/1748-9326/12/1/014009, 2017.
Novick, K. A., Ficklin, D. L., Stoy, P. C., Williams, C. A., Bohrer, G., Oishi, A. C., Papuga, S. A., Blanken, P. D., Noormets, A., Sulman, B. N., Scott, R. L., Wang, L., and Phillips, R. P.: The increasing importance of atmospheric demand for ecosystem water and carbon fluxes, Nat. Clim. Change, 6, 1023–1027, https://doi.org/10.1038/nclimate3114, 2016.
Padrón, R. S., Gudmundsson, L., Liu, L., Humphrey, V., and Seneviratne, S. I.: Scripts for the article “Drivers of intermodel uncertainty in land carbon sink projections”, ETH Zürich [code], https://doi.org/10.3929/ethz-b-000579451, 2022.
Peano, D., Hemming, D., Materia, S., Delire, C., Fan, Y., Joetzjer, E., Lee, H., Nabel, J. E. M. S., Park, T., Peylin, P., Wårlind, D., Wiltshire, A., and Zaehle, S.: Plant phenology evaluation of CRESCENDO land surface models – Part 1: Start and end of the growing season, Biogeosciences, 18, 2405–2428, https://doi.org/10.5194/bg-18-2405-2021, 2021.
Peters, W., van der Velde, I. R., van Schaik, E., Miller, J. B., Ciais, P., Duarte, H. F., van der Laan-Luijkx, I. T., van der Molen, M. K., Scholze, M., Schaefer, K., Vidale, P. L., Verhoef, A., Wårlind, D., Zhu, D., Tans, P. P., Vaughn, B., and White, J. W. C.: Increased water-use efficiency and reduced CO2 uptake by plants during droughts at a continental scale, Nat. Geosci., 11, 744–748, https://doi.org/10.1038/s41561-018-0212-7, 2018.
Raupach, M. R., Gloor, M., Sarmiento, J. L., Canadell, J. G., Frölicher, T. L., Gasser, T., Houghton, R. A., Le Quéré, C., and Trudinger, C. M.: The declining uptake rate of atmospheric CO2 by land and ocean sinks, Biogeosciences, 11, 3453–3475, https://doi.org/10.5194/bg-11-3453-2014, 2014.
Riahi, K., van Vuuren, D. P., Kriegler, E., Edmonds, J., O'Neill, B. C., Fujimori, S., Bauer, N., Calvin, K., Dellink, R., Fricko, O., Lutz, W., Popp, A., Cuaresma, J. C., KC, S., Leimbach, M., Jiang, L., Kram, T., Rao, S., Emmerling, J., Ebi, K., Hasegawa, T., Havlik, P., Humpenöder, F., Da Silva, L. A., Smith, S., Stehfest, E., Bosetti, V., Eom, J., Gernaat, D., Masui, T., Rogelj, J., Strefler, J., Drouet, L., Krey, V., Luderer, G., Harmsen, M., Takahashi, K., Baumstark, L., Doelman, J. C., Kainuma, M., Klimont, Z., Marangoni, G., Lotze-Campen, H., Obersteiner, M., Tabeau, A., and Tavoni, M.: The Shared Socioeconomic Pathways and their energy, land use, and greenhouse gas emissions implications: An overview, Global. Environ. Chang., 42, 153–168, https://doi.org/10.1016/J.GLOENVCHA.2016.05.009, 2017.
Schlund, M., Eyring, V., Camps-Valls, G., Friedlingstein, P., Gentine, P., and Reichstein, M.: Constraining Uncertainty in Projected Gross Primary Production With Machine Learning, J. Geophys. Res.-Biogeo., 125, e2019JG005619, https://doi.org/10.1029/2019JG005619, 2020.
Stocker, B. D., Zscheischler, J., Keenan, T. F., Prentice, I. C., Peñuelas, J., and Seneviratne, S. I.: Quantifying soil moisture impacts on light use efficiency across biomes, New Phytol., 218, 1430–1449, https://doi.org/10.1111/nph.15123, 2018.
Tokarska, K. B., Arora, V. K., Gillett, N. P., Lehner, F., Rogelj, J., Schleussner, C.-F., Séférian, R., and Knutti, R.: Uncertainty in carbon budget estimates due to internal climate variability, Environ. Res. Lett., 15, 104064, https://doi.org/10.1088/1748-9326/abaf1b, 2020.
Varney, R. M., Chadburn, S. E., Friedlingstein, P., Burke, E. J., Koven, C. D., Hugelius, G., and Cox, P. M.: A spatial emergent constraint on the sensitivity of soil carbon turnover to global warming, Nat. Commun., 11, 5544, https://doi.org/10.1038/s41467-020-19208-8, 2020.
Winkler, A. J., Myneni, R. B., Hannart, A., Sitch, S., Haverd, V., Lombardozzi, D., Arora, V. K., Pongratz, J., Nabel, J. E. M. S., Goll, D. S., Kato, E., Tian, H., Arneth, A., Friedlingstein, P., Jain, A. K., Zaehle, S., and Brovkin, V.: Slowdown of the greening trend in natural vegetation with further rise in atmospheric CO2, Biogeosciences, 18, 4985–5010, https://doi.org/10.5194/bg-18-4985-2021, 2021.
- Abstract
- Introduction
- Model simulations and characteristics
- Intermodel differences in NBP
- Drivers of intermodel differences in NBP projections
- Explaining intermodel differences in cumulative NBP
- Conclusions
- Code and data availability
- Author contributions
- Competing interests
- Disclaimer
- Acknowledgements
- Financial support
- Review statement
- References
- Supplement