the Creative Commons Attribution 4.0 License.
the Creative Commons Attribution 4.0 License.
 | 15 Dec 2022
Cutting peatland CO2 emissions with water management practices
Mariet M. Hefting
Corine J. A. van Huissteden
Merit van den Berg
Jacobus (Ko) van Huissteden
Gilles Erkens
Roel Melman
Ype van der Velde
Peat decomposition in managed peatlands is responsible for a decrease of 0.52 GtC yr−1 in global carbon stock and is strongly linked to drainage to improve the agricultural bearing capacity, which increases aeration of the soil. Microbial aerobic decomposition is responsible for the bulk of the net CO2 emission from the soil and could be reduced by wetting efforts or minimizing drainage. However, the effects of rewetting efforts on microbial respiration rate are largely unknown. In this study, we aimed to obtain more process-based understanding of these rewetting effects on peat decomposition by integrating high-quality field measurements and literature relationships with an advanced hydrological modelling approach where soil moisture and temperature are centralized as the main drivers for peat decomposition. In 2020 and 2021, two dairy farming peatlands, where subsoil irrigation and drainage (SSI) was tested against a control situation, were continuously monitored for CO2 fluxes, groundwater table, soil moisture and soil temperature. After successfully representing field hydrology and carbon dynamic measurements within our process-based model, we further explored the effects of rewetting under different weather conditions, water management strategies (raising ditchwater levels and SSI) and hydrological seepage settings. To represent peat carbon dynamics we introduced a methodology to estimate potential aerobic microbial respiration rate, based on potential respiration rate curves for soil temperature and water-filled pore space (WFPS). Measurements show that rewetting with SSI resulted in higher summer groundwater levels, soil temperatures and WFPS. SSI reduced the net ecosystem carbon balance (NECB) by 1.58 ± 0.56 kg CO2 m−2 yr−1 (83 ± 25 %) and 0.66 ± 0.62 kg CO2 m−2 yr−1 (28 ± 15 %) for Assendelft and Vlist respectively in 2020. SSI had a negligible effect in 2021 for both research locations, due to more precipitation, lower temperatures and different SSI management (in Assendelft) as compared to 2020. Simulated rewetting effects were in agreement with measured rewetting effects. Model simulations indicate that raising ditchwater levels always reduces peat respiration rates. Furthermore, we found that the application of SSI (i) reduces yearly peat respiration rates in a dry year and/or with downward hydrological fluxes and (ii) increases peat respiration rates in a wet year and/or when upward groundwater seepage is present. Moreover, combining SSI with high ditchwater levels or pressurizing SSI systems will further reduce peat respiration rates. We show that our process-based approach based on temperature and WFPS soil conditions to determine NECB represents observed variance to a greater extent than empirical relationships that involve average groundwater level observations or simulations. Therefore, we recommend using this kind of approach to estimate the effectiveness of rewetting. When this is not possible, we recommend using mean summer groundwater level instead of mean annual groundwater level as a proxy to estimate NECB. Such relations between mean groundwater levels and NECB are prone to underestimating NECB for SSI parcels.
- Article
(3338 KB) - Full-text XML
-
Supplement
(819 KB) - BibTeX
- EndNote


As a result of thousands of years of accumulation of organic material under waterlogged anoxic conditions, peat soils have formed extensively since the Last Glacial Maximum (Yu et al., 2010). Peat soils are an important carbon stock in the global carbon cycle. Despite their relatively small global surface area of 3 % (Yu et al., 2010; Leifeld and Menichetti, 2018; Friedlingstein et al., 2019), peat soils contain 600 GtC of carbon, equivalent to two-thirds of the atmospheric carbon (Leifeld and Menichetti, 2018). Reclamation of the peatlands for forestry and agriculture, as well as mining peatlands for potting soil and fuel, is responsible for a significant contribution to global warming. Currently, 11 % of the global peat surface area is decomposing, which is responsible for an estimated annual decrease of 0.52 GtC in global carbon stock (Leifeld and Menichetti, 2018).
Peat decomposition in managed peatlands is strongly linked to drainage, often for agricultural purposes (e.g. Erkens et al., 2016; Tiemeyer et al., 2020; Evans et al., 2021). Drainage, by both ditching and subsurface drain pipes, is a necessity to create the bearing capacity for cattle and agricultural machines (Erkens et al., 2016). However, lowering groundwater levels increases the oxygen intrusion into the soil. Especially during dry summer periods, groundwater levels often drop to 0.80 m below the surface or more (e.g. Querner et al., 2012). Aerobic soil conditions that arise with increased oxygen intrusion stimulate microbial decomposition of peat, a process which is responsible for the bulk of net emissions of CO2 from the soil and land subsidence (Dolman et al., 2019; Tiemeyer et al., 2020). The obvious approach to reduce microbial peat decomposition is to minimize oxygen intrusion during the summer period. Raising the surface water levels during summer and the application of submerged drain subsurface irrigation systems (SSI; see below) target the decrease in thickness of the unsaturated zone and the active period for aerobic microbial decomposition. At the same time, SSI functions as a drainage system when high groundwater tables occur, which causes dry enough conditions for agricultural practice in early spring (Kechavarzi et al., 2007; Querner et al., 2012; Weideveld et al., 2021).
Field research has shown that peatland groundwater level can be used as a proxy for ecosystem respiration and net CO2 fluxes (Fritz et al., 2017; Tiemeyer et al., 2020; Evans et al., 2021). However, some studies report dissonant results for particular field sites in which groundwater levels do not explain measured CO2 fluxes, possibly due to peat decomposition being moisture limited due to extreme drought (Parmentier et al., 2009; Tiemeyer et al., 2016; Pagenkemper et al., 2021). Within the unsaturated soil, soil temperature and moisture, often defined as the water-filled pore space (WFPS), are the main physical drivers of aerobic microbial respiration rate (Mäkiranta et al., 2009; Kechavarzi et al., 2010; Moyano et al., 2013; Bader et al., 2018). Aerobic microbial respiration rate is enhanced (often exponentially) as the soil temperature increases. When the WFPS decreases, the soil becomes aerated and potential microbial respiration rate increases. However, when the WFPS reduces further, microbial growth decreases due to the lack of water as a solute exchange medium and a higher energy investment to obtain osmotic equilibrium (Moyano et al., 2013). CO2 emission peaks of aerobic microbial respiration rate in peat have been established between 56 %–92 % WFPS (Säurich et al., 2019).
Field measurements in agricultural peat meadows have shown that high surface (ditch)water levels alone will not be able to support high groundwater levels in the centre of the peat meadows during summer (Hooghoudt, 1936; Jansen et al., 2007; Kechavarzi et al., 2007). This is attributed to the high evaporation and infiltration fluxes and the low horizontal conductivity of the peat soil. Therefore, Pagenkemper et al. (2021) argued that increases in ditchwater levels do not necessarily lead to lower CO2 emissions. However, there are also studies that describe a strong dependency of land subsidence (as measure for peat decomposition) on ditchwater level (van den Akker et al., 2008).
Subsoil irrigation and drainage (SSI) has been introduced as a management measure to reduce groundwater table fluctuations and concomitantly reduce peat oxidation rates (Best and Jacobs, 1997; Kechavarzi et al., 2007). However, the effects of SSI on peat decomposition have not thoroughly been researched. Field measurements on the application of SSI systems have shown land subsidence reductions (as measure for peat decomposition reduction) by 50 % (van den Akker et al., 2008), but in some cases no effects in net ecosystem carbon balance (NECB) could be discovered (Weideveld et al., 2021) or effects differed strongly with reductions or increases in CO2 emission from year to year (Pagenkemper et al., 2021). SSI consists of regularly spaced (4–10 m) submerged drain tubes in the soil at 0.4–0.7 m depth connected to a (surface) water system. During dry periods with high evapotranspiration fluxes, the tubes supply water into the soil. During periods with water excess, the drain tubes discharge water out of the soil. SSI thus overcomes the problem of limited control of the surface water system on the meadow groundwater levels and strongly limits yearly groundwater level fluctuations. However, SSI infiltration of warm surface waters can potentially induce adverse effects. SSI could create a zone with constant optimal soil moisture conditions close to the warm surface. In theory, SSI can thus also increase microbial respiration rate. The divergence in observed effectivity estimations of rewetting measures indicates that a better process understanding is needed to assess the effectiveness of different water management strategies to reduce CO2 emissions for various peat types, landscape settings and climate conditions.

Models are important tools to assess nationwide greenhouse gas (GHG) emissions from peat areas (IPCC, 2014). The most elemental GHG model is based on land use and climate-specific emission factors to calculate nationwide GHG emissions, like the tier 1 IPCC approach (IPCC, 2014). Within more complex methods, emission factors are related to long-term average groundwater levels (tier 2) (Bechtold et al., 2014; Arets et al., 2020; Tiemeyer et al., 2020) or are derived from elaborate approaches that involve comprehensive understanding and validated representations of carbon dynamics using field measurements and modelling (tier 3) (IPCC, 2014). The latter approach has not yet been used on the country scale (e.g. Arets et al., 2020; Tiemeyer et al., 2020), and most recent studies advocate to use “water-table-depth–peat decomposition” relationships for nationwide CO2 emissions. However, studies that have assessed such relationships did not involve sites with SSI groundwater table manipulation.
In this study, we aim to improve understanding of peatland water management effects on peat decomposition and CO2 emissions by (1) determining if peat decomposition estimates can be improved with process-based modelling compared to groundwater table based relations, (2) quantifying the effectiveness of SSI in various conditions, and (3) resolving which important physical soil processes are introduced by SSI and how these impact the effectivity of the measure. To achieve this, we integrate literature relationships between aerobic peat respiration rate and soil moisture/temperature with high-quality field measurements into a process-based advanced groundwater flow, soil moisture and soil temperature model. By introducing this novel methodology which is based on soil temperature and moisture, we were able to assess the year-round effects of SSI and ditchwater level elevation on aerobic peat respiration. Hereby, we included five seepage scenarios to represent spatial site variations and two meteorological scenarios that represent temporal variation. To support/examine model outcomes, we compared our model estimations with detailed measurements for almost 2 years of in situ CO2 fluxes, soil temperature, soil moisture and groundwater table height for two pilot sites in the Netherlands, with each site including a meadow with and without SSI.
Here we present the measurement setup belonging to the first two years of measurements of a national monitoring effort to quantify the effects of SSI systems on groundwater level, soil temperature, WFPS and carbon emissions of peat meadows used for dairy farming. Furthermore, a cross-sectional 2D hydrological model and the concept of potential microbial respiration rate are introduced to simulate the field sites and explore the expected effectivity of SSI and raising surface water levels under different meteorology, as well as regional hydrological seepage settings. This model setup was validated on the available measurements (Fig. 1).
2.1 Field data
In 2020 and 2021, measurements of groundwater level, soil temperature and WFPS were done at two locations consisting of managed mesotrophic/eutrophic fen peatlands in the Netherlands: Assendelft and Vlist (Fig. 2). Both research locations are in agricultural use and consist of two parcels: one without (control) and one with SSI.
2.1.1 Site descriptions
Assendelft
The research site in Assendelft (ASD), located in the province North Holland (Noord-Holland), is a managed eutrophic peatland used for dairy farming (Fig. 2a, b). The clayey degraded moor topsoil (0–0.3 m) covers a slightly clayey degraded moor horizon (0.3–0.4 m). Mildly degraded reed/sedge peat is present underneath the degraded peat layers (0.4–2.0 m), followed by marine clay deposits. Reduced hydrogen sulfide in the reduced soil layers suggests that the peatland is exposed to upward seepage, which is confirmed by groundwater observation wells that consist of a higher hydraulic head in the deep (>10 m depth) subsurface as compared to the topsoil (<1.5 m depth) hydraulic head. In 2017, a pressurized SSI system was constructed in the western meadow. In the eastern meadow, no SSI system is present. The SSI systems function the same as SSI discussed earlier but include a pressure container that is used to manipulate the pressure in the drains independently from ditchwater levels. The drains are located 0.5–0.7 m below the surface and spaced at a distance of 4 m. In the summer of 2020, drain pressure varied between +0.05 and −0.4 m from the surface with a mean of −0.17 m. In the summer of 2021, the mean drain pressure was −0.36 m. Summer ditchwater levels are kept at 0.4 m below the surface. The two parcels that are monitored have a total width of 180 m, with trenches of 0.3–0.4 m deep spaced 12 to 19 m. The organic matter (OM) content in the top 1.2 m of the soil profile was 14.8 and 14.4 g OM cm−3 for the control and SSI parcel respectively.
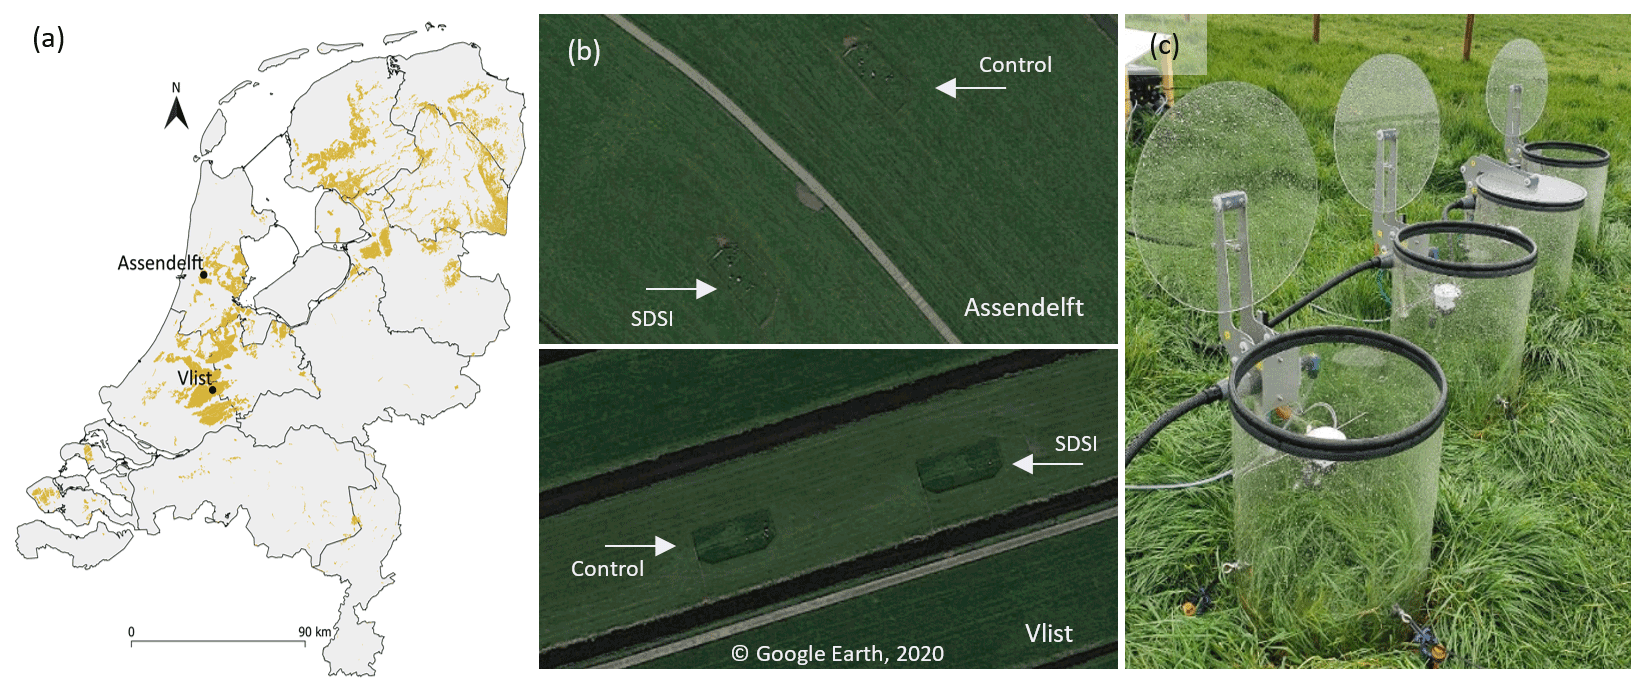
Figure 2(a) Peat soils in the Netherlands (highlighted) with the research locations Assendelft and Vlist on a national scale (Basisregistratie Ondergrond, 2018; Esri Nederland, 2021), (b) the research locations seen from 500 m altitude with satellite imagery (the borders of the measuring plots are recognizable by the fences), and (c) the automated transparent chamber systems in Assendelft.
Vlist
The research location in Vlist (VLI), province South Holland (Zuid-Holland), is managed fen peatland used for dairy farming (Fig. 2a, b). The clay topsoil (0–0.4 m) covers a degraded peat layer (0.4–0.55 m). Mesotrophic/eutrophic woody, sedge and reed peat is present underneath the degraded horizon (0.55–2.90 m). Underneath the peat, a clay layer (1–2 m thick) was found. In 2011, SSI systems were installed at the research location, with a depth of 0.7 m and a drain spacing of 6 m. The SSI systems are oriented perpendicular to and directly connected to the ditch. Ditch summer water levels were at 0.5 m below the surface. The width of the parcel is around 35 m with a trench of 0.2–0.3 m deep in the middle. The OM content in the top 1.2 m of the soil profile was 15.6 and 14.8 g OM cm−3 for the control and SSI parcel respectively.
2.1.2 Groundwater observation wells
To assess the effect of SSI on the groundwater table, observation wells were used. The spacing between the groundwater wells and the ditch was 60 and 12 m for Assendelft and Vlist respectively. The depth of the groundwater observation well filters was 0.3–1.3 m below surface, and the wells were founded in deeper soil layers (>3 m) to prevent influences of vertical soil movement on the measurements. Bottom well pressure was measured and automatically corrected for atmospheric pressure with ElliTrack-D logging equipment (Leiderdorp Instruments, the Netherlands).
2.1.3 Temperature and WFPS
The effect of SSI on soil temperature (0.1–1.2 m depth) and WFPS was measured with two Sentek Drill & Drop (Sentek Sensor Technologies, Australia) probes at a depth interval of 0.1 m up to 1.2 m below surface on each meadow.
At the SSI plots, WFPS was measured from the drains at half and a quarter of the distance between the drains. Raw sensor measurements (scaled frequency) were corrected for soil temperature and converted to soil moisture percentages with a linear calibration curve that was derived for a similar peatland in the Netherlands. The curve had a slope of 0.74 and an intercept of −0.02. WFPS was calculated as the soil moisture relative to maximum soil moisture at that particular depth. Uncertainty in WFPS estimations was likely to be high as the calibration curve was not derived for the specific field locations.
2.1.4 CO2 fluxes, harvesting and carbon budget
Automated transparent chamber systems were deployed on the research sites (Fig. 2c) to measure the ecosystem CO2 fluxes that were used to determine nocturnal ecosystem respiration (Reco) and net ecosystem exchange (NEE). Each system consisted of four chambers that had a height of 0.5 m and a diameter of 0.4 m. Every 15 min, one measuring cycle was executed in which every chamber was closed by a lid independently for 3 min. Air from the closed chamber was drawn into the LI-850 CO2 gas analyser (LI-COR, USA), which determined CO2 and H2O concentrations with a measuring interval of 2 s. By fitting a robust linear model to the first 60 s after lid closing, the CO2 flux during chamber closure was calculated. Fluxes were converted from volume to weight by using chamber temperature, gas-cell pressure and chamber height. Measurements were corrected for water vapour, and chamber cycles were checked for air leaking and fan malfunctioning using R2 values of the fitting process. Chamber systems were relocated every 2 weeks to minimize the effect of the chamber “micro-climate” on the vegetation and soil. Near the end of 2020 and 2021 (during low carbon fluxes) the systems were calibrated.
Crop (Lolium perenne) harvesting was done five times throughout the growing season, simulating the farmer's harvesting practice. Samples inside and around the chambers were taken in quadruple. The dry weight and carbon content of each sample were determined in the lab. Subsequently, carbon yield per area was calculated. The carbon yield per area (C export) was corrected for the difference between inside and outside chamber crop growth for each measuring plot due to the micro-climate effect of the chambers (see below). Standard deviations for each harvesting event were based on the differences between the samples within the same sample group. The total harvested carbon yield consisted of the sum of harvests and was expressed in mass units of CO2 per area. Crop fertilization was done with inorganic fertilizers so that no carbon was added to the soil.
The net ecosystem carbon balance (NECB) of the research sites was calculated by summing NEE and C export determined within the measuring period, similar to the approach presented by Görres et al. (2014), Tiemeyer et al. (2016) or Elsgaard et al. (2012). In contrast to most other research where NEE is determined by using (bi)weekly chamber measurement intervals, we used continuous chamber measurements as was done in the research of Heinemeyer et al. (2013). NEE was calculated by summing daily averages of chamber measurements. Standard deviations of the daily averages were calculated with daily NEE means of each chamber. Missing values were filled by using the Lloyd–Taylor function (Lloyd and Taylor, 1994) for Reco and a rectangular hyperbolic light response curve for gross primary production (GPP) (e.g. in Veenendaal et al., 2007). Daily derived parameters of these functions were linearly interpolated when gaps occur. In the case of harvest, parameters of the light response curve were set to a minimum. The SDs of the gap-filled data were determined on a daily basis by creating artificial gaps of 1, 5 and 15 d. A linear relation was found between SD and gap size, so that for any gap size the SD could be calculated. The total amount of gap-filled chamber data was 14 % for the whole dataset. The total standard deviation of yearly NEE and C export was calculated by taking the square root of the summed squared standard deviations of the averages that were used within the calculation. We assumed that the carbon storage differences between the end and beginning of the measuring year for crop, roots and soil (short carbon cycle) were small compared to the peat carbon losses and the uncertainty estimates.
The effectivity of SSI was determined by comparing annual NECB of the control site with the SSI site for each location. The effectivity was expressed as an absolute number and percentage of the reduction in the NECB. For 2020, the NECB was determined from 1 April 2020 until 31 March 2021. In 2021, the annual NECB was determined from 1 January until the 31 December 2021.
The chamber micro-climate effect implies that radiation, temperature, wind, precipitation, and moisture dynamics are influenced by the chambers and is not completely resolved by moving the chambers every 2 weeks. The micro-climate affects the vegetation dynamics (e.g. Heinemeyer et al., 2013) and might affect soil conditions which in turn affect NECB estimations. This creates uncertainties within our measurements, which are hard to quantify. Nevertheless, the uncertainties introduced by continuous measurements are likely much lower than the uncertainty caused by gap filling a large fraction of the data as is done with non-continuous measurements (Huth et al., 2017). The impact of the micro-climate will affect most probably the magnitude of the NECB and to a lesser extent the treatment effect, since the micro-climate is the same in every chamber.
2.2 Model setup
We simulated a typical dairy farming grassland on sedge peat for the Netherlands exposed to various natural and artificial (boundary) conditions: soil saturated hydraulic conductivity, the presence of upward or downward flow, meteorology, ditchwater level, and the application of SSI systems. The model runs differed in their ditchwater level, seepage flux, hydrological conductivity, simulation year and application of SSI. The goal of this model was not to exactly reproduce the observation sites but to capture the main effects of surface water level and SSI on soil temperature, soil moisture and the NECB. When these dynamics are adequately described, the model can be used to cautiously explore the effects of SSI and water level management on yearly peat respiration rates.
2.2.1 Hydrological model
We used the hydrological 2D finite-element method model HYDRUS (3.02) (Šimunek et al., 2022). The HYDRUS software is proven to reliably simulate the hydrology in the unsaturated zone and the soil temperature dynamics, which are key features in this research, using the Richard's equation and conduction and convection equations.
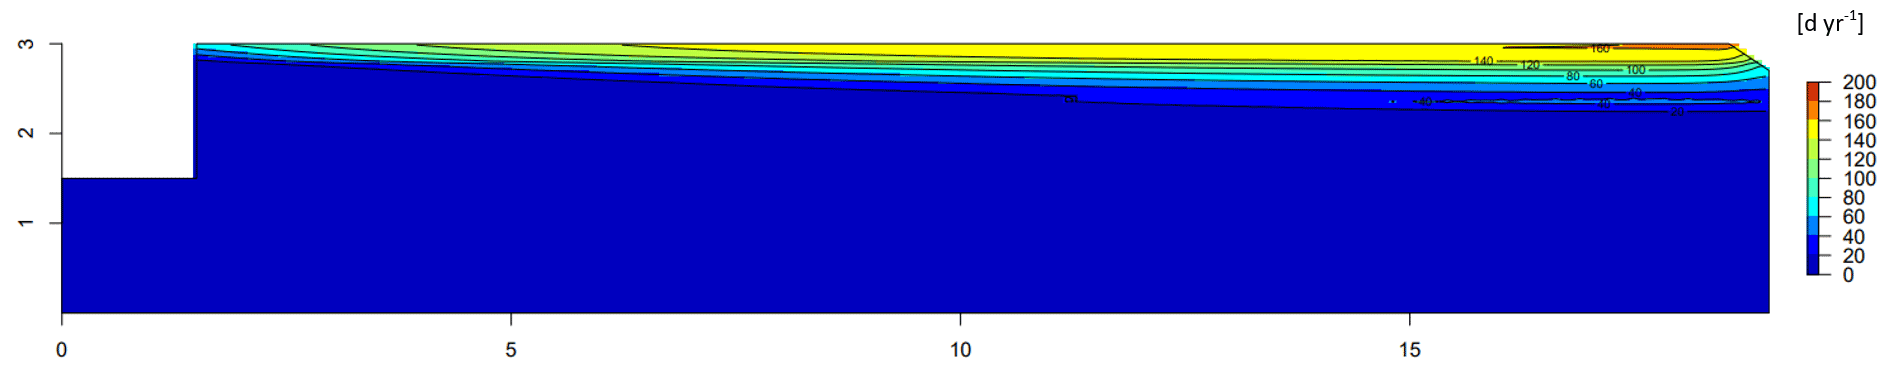
The model domain was designed to represent a typical cross section of a managed peatland in the Netherlands (Fig. 3). In the Netherlands, parcel widths from ditch to ditch vary between 25–100 m. In this research a parcel was used with a standard width of 35 m. We used a soil depth of 3 m and a shallow surface drainage trench in the middle of the parcel with a depth and width of 0.3 and 0.9 m respectively. The infiltration/drainage ditch was 1.5 m deep and had a width of 1.5 m. Additionally, for SSI model runs, drains were introduced in the domain at a typical depth and distance interval of 0.7 and 5.5 m respectively. The drains had a diameter of 0.07 m and were surrounded by 0.05 m coarse sand (instead of plastic or coconut fibre that is typically used in the field). For computation purposes, only half of the cross section has been modelled as it has been assumed that no groundwater would flow across the middle of the parcel.
Element size was smaller at the top of the model (0.05 m) and increased stepwise to 0.3 at 0.8 m depth. The total amount of nodes and 2D elements was around 10 000 and 20 000 respectively. Nodes neighbouring boundary mesh points were refined if the distance ratio was too high (F=1.3).
Soil properties were set up with the single porosity van Genuchten–Mualem hydraulic model (van Genuchten, 1980). Since peat soils vary widely in hydraulic properties, we chose to represent sedge peat soil characteristics with optimized parameters from large dataset analyses (Liu et al., 2016; Heinen et al., 2018). The modelled soil consisted of a clayey peat topsoil (Heinen et al., 2018), a decomposed peat layer of 0.4 m and a sedge peat layer (Liu et al., 2016). Further details and van Genuchten–Mualem parameter values are presented in Table 1. Data availability was insufficient to incorporate the dual-porosity, heterogeneous and anisotropic nature of the peat soils
Table 1Mualem–van Genuchten parameters and saturated hydraulic conductivity for each soil layer.
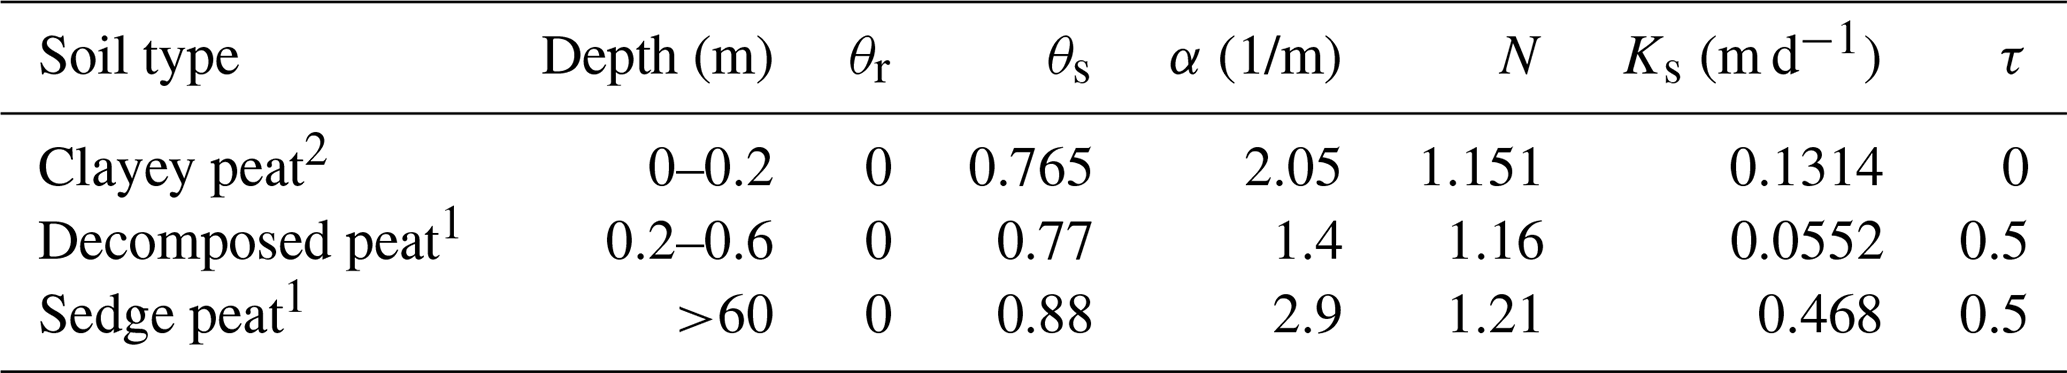
1 Liu et al. (2016). 2 Heinen et al. (2018).
Thermal conductivity parameters for simulating temperature were estimated according to the empirical model of Dissanayaka et al. (2013) and were dependent on solid and water content. The model is presented in Eq. (1), in which σ and θ represent solid and water content respectively. Default heat capacity values were used for water, organic matter and clastic material.
Meteorological input data were acquired from the weather station Schiphol of the Royal Dutch Weather Agency (KNMI, 2020). Runoff was calculated using a 1D-HYDRUS model with a bottom pressure head boundary equal to ditchwater levels plus 0.1 m to account for the forming of a concave phreatic surface. The water that was available for infiltration was reduced for time steps during which the model runs did not converge. For model runs including submerged drain systems, the water that was available for infiltration was equal to precipitation. Throughout the year, 90 % of potential Makkink evaporation was assumed to be represented by transpiration and 10 % by soil evaporation (Allen et al., 1998). On top of the soil profile, we used measured average soil temperatures at 0.05 m depth from Marknesse, Flevoland, the Netherlands (KNMI, 2020). Daily average river water (Hagestein, the Netherlands) temperatures (0.5 m depth) were assigned to ditch and drain water (Rijkswaterstaat, 2020). A constant temperature of 11 ∘C was assumed at the bottom boundary at 3 m depth.
Root water uptake was described using the Feddes (1978) model with parameters for grass. Crop growth and crop solute stress were not included. Rooting depth was set at 0.3 m, with maximum rooting intensity at 0.1 m (root distribution parameter Pz was set at 3).
Initial pressure head conditions were set at −0.2 m from the surface, and temperature initial conditions were set at 11 ∘C. We did not use a warming-up period for the model, as we expected near-surface water tables and consequentially low potential microbial respiration rate during winter.
2.2.2 Peat decomposition model: potential respiration rate
To estimate potential microbial respiration rate of aerobic microbial communities in the unsaturated zone (in this paper referred to as potential respiration rate), we introduce temperature-activity (AT(nt), relative respiration rate during 1 d) and WFPS-activity (AWFPS(nt), relative respiration rate during 1 d) curves for potential respiration rate. These activity curves quantify the potential respiration rate at each temperature and WFPS relative to a reference value of temperature and WFPS.
Soil temperature is assumed to influence potential respiration rate according to the square root equation, as described in Eq. (2), with fitted Tmin and a of −10 ∘C and 0.05 ∘C−1 respectively (Ratkowsky et al., 1983; Lloyd and Taylor, 1994; Bååth, 2018). WFPS additionally determines potential respiration rate. The optimum curve for WFPS was selected during the optimization of our estimation of potential respiration rate as explained in the next section. The number of total days with reference conditions for aerobic activity per year were calculated following Eqs. (3) and (4).
For each soil node (n), potential microbial respiration rate (Au(n), d) was calculated (Fig. 3). By multiplying each node with its surface area (S, m2) and dividing by the domain length (L, m) a field average potential respiration rate per area (Ap, d m yr−1) is obtained. This number can be interpreted as the field average potential respiration rate per square metre of peatland surface area. And Ap of 100 d m yr−1 corresponds to the potential respiration rate of 1 m3 of peat exposed for 100 d to the optimal WFPS and 20 ∘C.
To clarify, the average potential respiration rate is the fraction of the maximum amount of microbial mineralization rate from a particular volume of peat. When studying the effect of water management measures on peat decomposition at a particular location, we assume that the properties of the soil profile (including quality of the organic matter) remain similar. When discussing recently drained or bog (oligotrophic) peatlands (which were not included within our study), this maximum mineralization rate might differ substantially. The yearly potential respiration rate only included respiration from old soil carbon pools and was compared to the estimated NECB that also represents old carbon (peat) respiration. For both the simulations and measurements we assumed that the yearly variety in young carbon pools is negligible relative to changes in old carbon pools.
2.2.3 WFPS potential respiration rate curve and model sensitivity
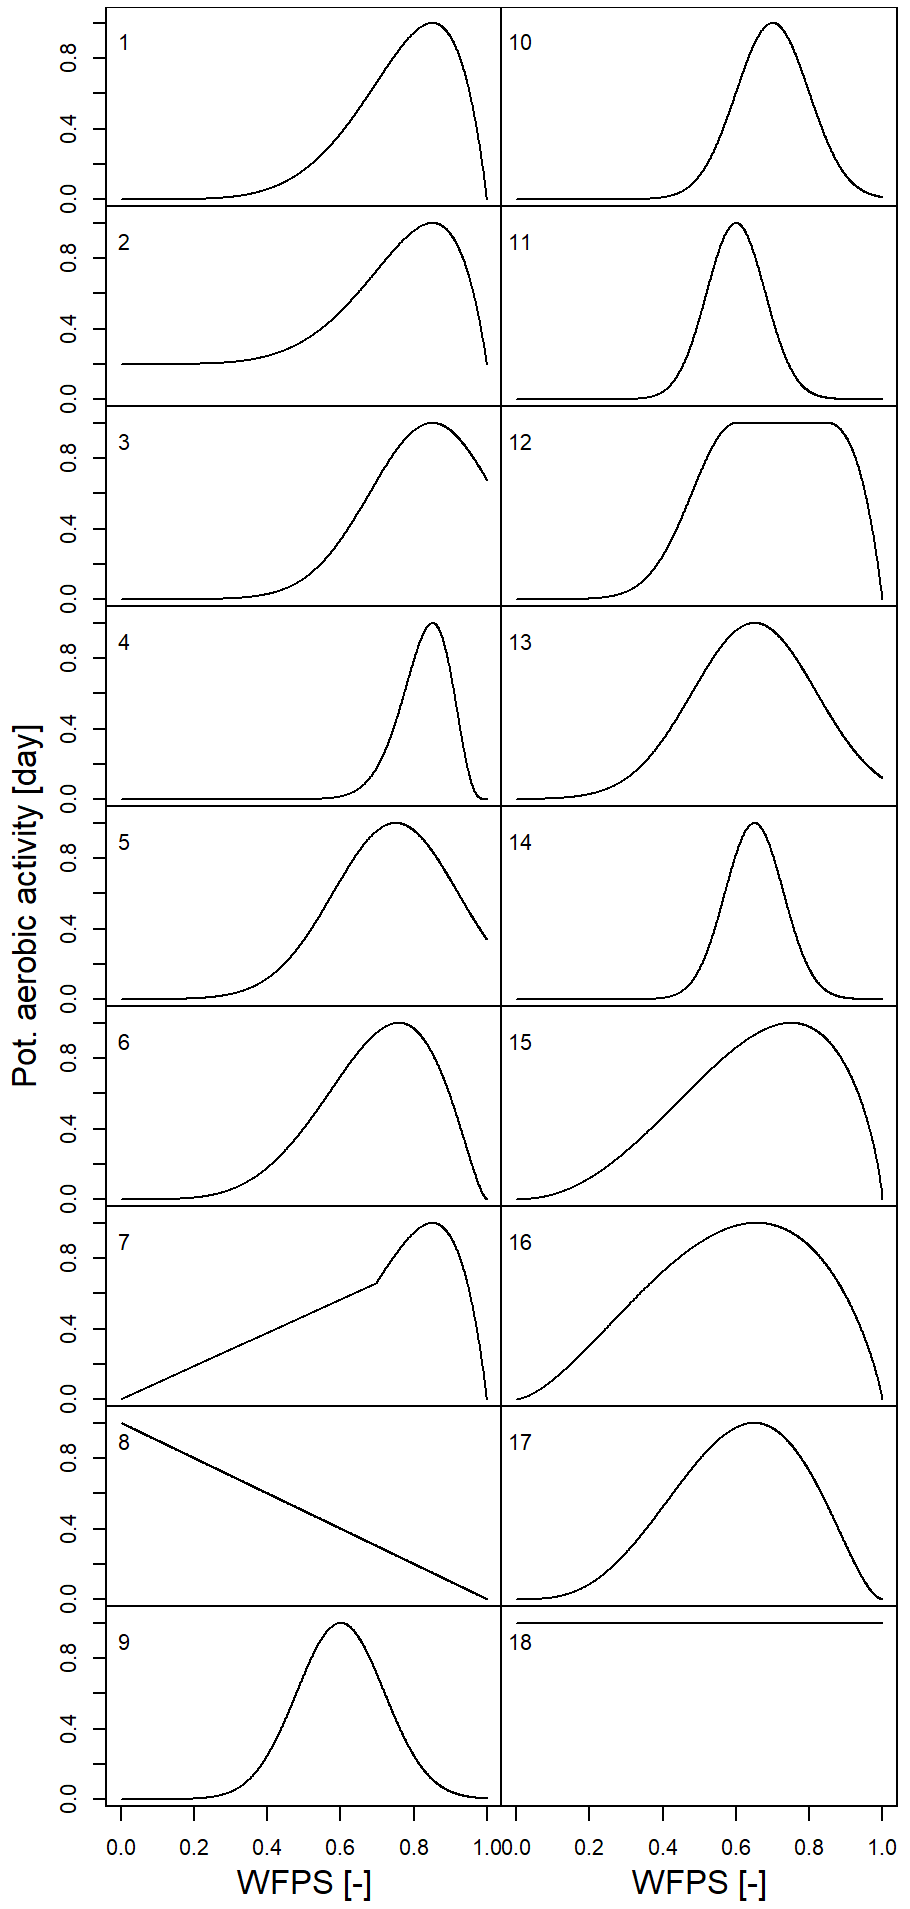
As limited scientific research is available on the relation between potential respiration rate and WFPS, we decided to test the performance of several WFPS-activity curve shapes (Fig. 4) in an ensemble analysis. The tested set of WFPS optimum curves (Fig. 4) was loosely based on the data found by Säurich et al. (2019). The ensemble was developed to test the effect of different curve characteristics on the model output, such as shape, optimum WFPS value or range, curve width, starting values at WFPS 1, and the slope of the curve near saturated conditions WFPS 0.9–1.
We calculated potential respiration rate for the parcels in Assendelft and Vlist during the measuring period with all different WFPS relations, keeping the temperature relation with potential respiration fixed. The Reco that was measured in the field during night-time partly consists of peat respiration driven by WFPS. Therefore, we assumed that the WFPS-activity curves that produced the daily potential respiration rates that correlated best with the Reco over the complete measuring period (with an average R2>0.60 over all study sites) most accurately described the relation between WFPS and potential respiration rate. The effectivity (e.g. the reduction in yearly potential respiration rate) of SSI in Assendelft and Vlist was calculated with these best-performing WFPS curves to determine the uncertainty in effectivity estimation that was introduced by the selection of a WFPS curve. To avoid selecting a WFPS curve that produced extremely high or low effectivities, we selected a WFPS curve that approached the mean effectivity of the best-performing WFPS curves. Furthermore, the sensitivity of the soil temperature potential respiration rate slope was also determined by manipulating soil temperatures by −1.5 and +1.5 ∘C. This sensitivity analysis was meant to assess uncertainty and increase reliability of our process-based method to estimate potential respiration.
The comparison of Reco with potential respiration rate of the peat subsurface may seem peculiar as the measured Reco includes besides peat respiration also plant respiration, respiration of fresh and easily degradable organic matter, and anaerobic respiration. Here, we assume that plant respiration is mostly related to biomass and largely independent of WFPS, while respiration of fresh and easily degradable organic matter does depend on WFPS but follows a similar WFPS dependency as peat respiration. Thus, while potential peat respiration and Reco are different quantities and have different absolute values, by selecting the WFPS curves that yield potential peat respiration rates that describe most of the variability in observed Reco (highest R2), we assume to find the WFPS curve that represents dynamics in respiration the best. Within this comparison, the simulated daily potential respiration rate did not represent measured Reco since the young carbon pools were not simulated – only the dynamics of the two variables were compared. Reco measurements were also included in yearly NECB estimations (Sect. 2.1.4) that were related with yearly potential respiration rate simulations (Sect. 2.2.2). In this case we assume that short-cycle carbon pools do not disturb this comparison as mentioned before.
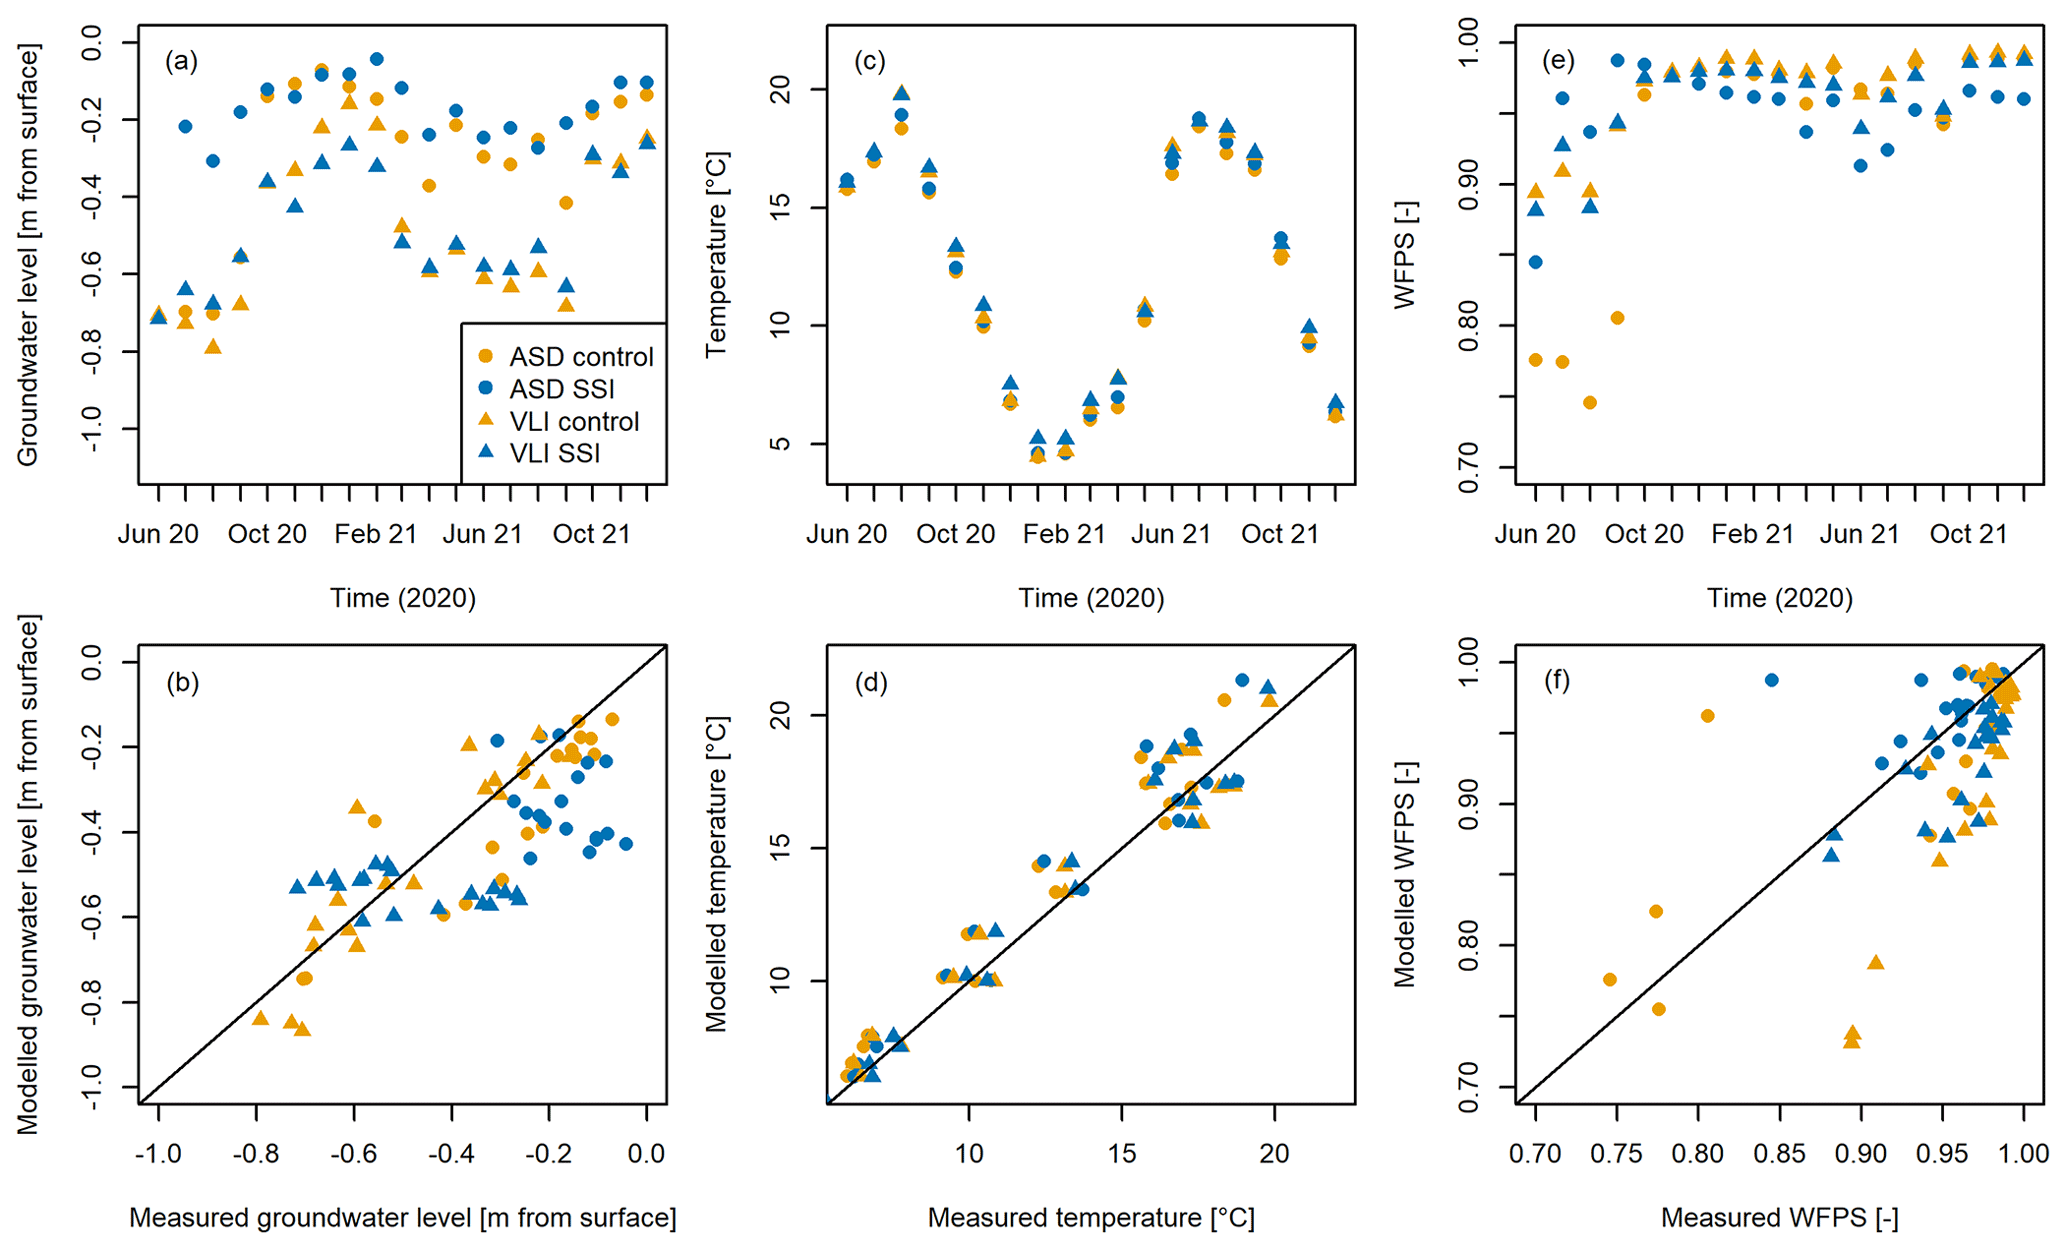
Figure 5Monthly averages of measured (a) groundwater level, (c) soil temperature and (e) WFPS that are compared with monthly modelled averages of (b) groundwater level, (d) temperature and (f) WFPS. Values for temperature and WFPS were averaged over a depth of 0.4 m. The legend in panel (a) applies to all panels.
2.2.4 Model scenarios
We simulated the field sites in Assendelft and Vlist with corresponding surface water levels and seepage fluxes with and without SSI for the measurement years 2020 and 2021. The pressure in the SSI systems was set equal to the ditchwater level; there were no runs that specifically represented pressurized SSI. We made the assumption that pressurized SSI was represented by runs consisting of SSI with higher ditchwater levels as compared to the control situation. Furthermore, the model properties (soil profile, conductivity, width) were not specifically altered for the simulation of the four parcels; instead, simulations that consisted of comparable ditchwater levels, seepage settings and conductivity values were selected. This approach enabled us to test the assumption that we simulate a typical dairy farming grassland on sedge peat for the Netherlands (Sect. 2.2). To assess the performance of our model, we compared monthly means of simulated groundwater level, soil temperature and WFPS with the measured monthly means of these variables. Additionally, we related our measured estimations of NECB with simulated potential respiration rate to be able to compare our results with recent literature.
In order to explore the effects of surface water level and SSI on potential respiration rates, we ran the model for a range of surface water levels (0.2–0.6 m below surface) with and without SSI and seepage conditions (1 mm d−1 downward to 1 mm d−1 upward), during both a climatically wet and a dry year (2012, 2018). The years 2012 and 2018 had a total precipitation balance deficit of 14 (2012) and 296 mm (2018) from April to September, with 2018 belonging to the 5 % most severely dry years since 1910 (KNMI, 2021). Ditchwater levels in winter were varied from −0.3 to −0.7 m, with 0.1 m increased water levels during the growing season from 1 May until 1 October as is common practice in the Netherlands. All model variations were run with a hydraulic conductivity of the intact peat layer of 0.47, 0.23 and 0.12 m d−1 (Liu et al., 2016).
In this section, field measurements and model output are presented successively per theme and data are depicted in Fig. 5. Generally, the year 2020 was characterized by a severely dry spring and summer with a total precipitation deficit of 209 mm. The year 2021 was a normal year with a considerably wet summer and a total precipitation deficit of 70 mm that is in accordance with the median yearly precipitation deficit in the Netherlands (KNMI, 2022). Model water balance errors were sufficiently low (<1 % of precipitation) over the complete year for all the model simulations.
3.1 Groundwater level
Seasonal trends are clearly distinguishable in monthly averages of groundwater levels that were measured in the field (Fig. 5a), with higher levels for SSI research plots compared to control plots in summer. For Vlist, SSI systems were clearly draining the soil during autumn/wintertime in 2020. Generally, SSI established a more equal water table depth throughout the year as intended. The pressurized SSI systems in Assendelft maintained remarkably high groundwater levels during the summer of 2020 (ca. −0.2 m), as opposed to Vlist where the difference between SSI and control groundwater level seem confined to 0.1–0.2 m during the summer. During the summer of 2021, groundwater levels in the SSI parcel in Assendelft were lower (∼0.2 m) as compared to 2020 due to different farmer management choices. Due to the upward seepage that was present in the control plot of Assendelft, we found slightly higher groundwater levels as compared to the control plot of Vlist.
The model captured the monthly dynamics of groundwater level well for the control plots. The model simulated more seasonally stable groundwater levels as compared to the measured groundwater levels in Vlist, which suggests that hydrologic drainage and soil resistance could be underestimated (Fig. 5b). Furthermore, we found that model simulations underestimated the short-term variability during the severely dry summer of 2020 that was observed at the field sites (Fig. S1 in the Supplement), which was not the case for the summer of 2021.
3.2 Temperature
The monthly difference in average measured soil temperatures in the top 0.4 m of the soil profile between Assendelft and Vlist control was small, with a maximum of 1.5 ∘C when maximum soil temperatures were recorded (Fig. 5c). Topsoil warming in the spring of 2021 seems to happen at a faster rate than the cooling in autumn. SSI tends to cause higher mean soil temperature levels (0.43 ∘C) in the top 0.4 m of the soil profile in Assendelft in both summers. Over the complete measuring period, this heating effect was 0.26 ∘C. In Vlist, SSI tends to cause higher temperatures in this soil zone especially in the autumn and winter, with a maximum of 0.75 ∘C in January 2021. The average heating effect of SSI on topsoil temperatures in Vlist is 0.08 ∘C in summer and 0.23 ∘C during the complete measuring period.
Modelled and measured monthly topsoil temperature dynamics match well, but modelled temperatures were on average 0.6 ∘C higher than measured temperatures (Fig. 5d). The measured soil surface temperature data we present here were not yet available at the time of modelling. Hence, we used a surface soil temperature dataset of a different location as the top temperature boundary condition which in hindsight had slightly too high temperatures explaining the model overestimation of the soil temperature. The simulated effect of SSI on topsoil temperatures during summer was 0.37 ∘C for Assendelft and 0.27 ∘C for Vlist. Over the complete simulation period, the SSI heating effect was 0.17 and 0.11 ∘C for Assendelft and Vlist respectively.
3.3 WFPS
The minimum monthly average WFPS in the top 0.4 m of the soil profile (Fig. 5e) was measured at the control site in Assendelft (0.75) during August 2020. WFPS tends to be higher during the dry summer of 2020 when pressurized SSI is applied in Assendelft. In the spring and summer of 2021, we find lower WFPS values for the SSI parcels, especially in Assendelft where the difference between the SSI and control parcel exceeds 5 % in June. Modelled WFPS agrees reasonably well with measured WFPS but overestimates (>10 %) soil moisture for the control plot in Assendelft in September and underestimates moisture values for the control plot in Vlist during summer drought (Fig. 5f). The result of underestimated drainage and/or soil resistance in the SSI parcel in Vlist was also reflected in the difference between observed and simulated WFPS values for Vlist (∼5 % difference in the top 0.4 m of the soil profile), but this was not the case for Assendelft.
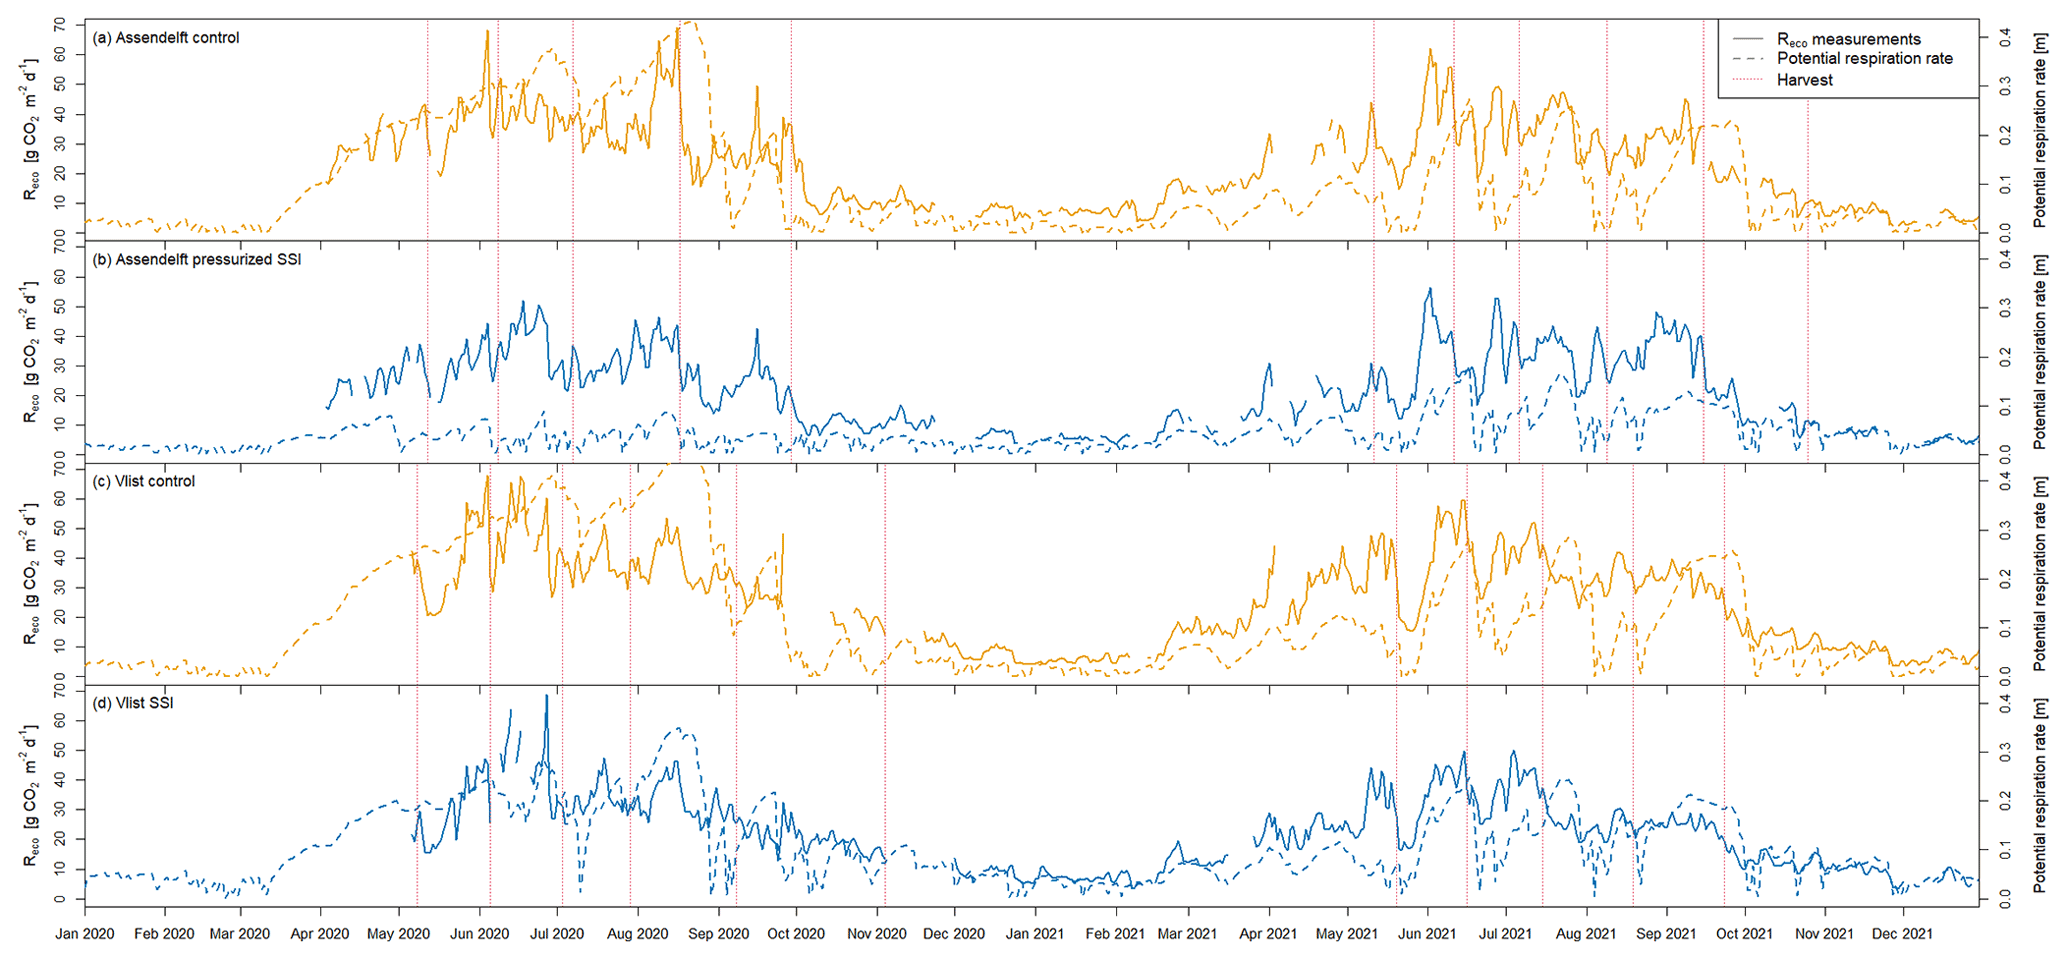
Figure 6Measured nocturnal Reco and simulated respiration rate (secondary axis) over time for (a) Assendelft control, (b) Assendelft pressurized SSI, (c) Vlist control and (d) Vlist SSI.
3.4 Simulating peat decomposition
3.4.1 Measured Reco and modelled potential respiration rate
Nocturnal Reco measurements clearly show seasonal trends with high CO2 emissions in summer and low emissions in winter (Fig. 6a). Maximum Reco values were measured in August 2020 on the control parcel in Assendelft, approximating 70 g CO2 m−2 d−1. In spring and summer, Reco values measured on the control parcel were structurally higher than on the SSI parcel on both research locations (Fig. 6b). In the autumn of 2021, measured Reco was slightly higher in the SSI parcels as compared to the control parcel in Assendelft. During the winter of 2020–2021, Reco on the control parcel was higher than on the SSI parcel in Vlist.
We compared the time series of measured nocturnal Reco with the estimated daily potential respiration rate calculated by applying all the WFPS-activity curves (Fig. 4, Table S1 in the Supplement). We found that eight WFPS curves produced daily potential respiration rate dynamics that correlated reasonably well with Reco (mean R2>0.60 over all sites). Within our sensitivity analysis (Tables S2, S3) we found that the selection process of a WFPS relation introduced a maximum standard deviation of 0.08 on simulated effectivities of SSI for our measuring locations. Also, a curve maximum that is defined at a WFPS closer to 1 generally leads to a lower prediction of SSI effectivity as compared to curves with their maximum at a lower WFPS. Furthermore, we found that relation 16 approached the mean effectivity estimation for our measuring locations and selected this relation for the analysis of our modelling output. The shape of this curve closely matches data presented in Säurich et al. (2019), who found optimal moisture conditions around a value of 0.65 WFPS. The curve is represented by a β distribution scaled to a maximum value of 1, with parameters α and β of 2.59 and 1.84 respectively. Based on correlation between the calculated potential respiration rate and the nocturnal CO2 fluxes, we found that WFPS-activity curves that include zero activity for a WFPS of 1 and include a general decrease in activity between a WFPS of 0.65 and 1 (curves 1,2, 6, 7, 8, 12, 15, 16 and 17) outperformed WFPS-activity curves that have an insensitive region between a WFPS of 0.9–1 (curves 9–11 and 14). Note that both the observed and simulated WFPS rarely dropped below 50 % for all four plots. Hence, effectively only the range of 0.50–1 WFPS of the relationships in Fig. 5 is compared. The effect of changing the slope of the temperature curve on simulated effectivity was marginal (Tables S2, S3).
For the research sites without and with SSI in Assendelft, we found Pearson correlations of 0.70 and 0.55 (respectively) between potential respiration rate (using curve 16) and measured nocturnal Reco (Table S1). For the control and SSI sites in Vlist, these correlations were 0.70 and 0.66 respectively. Both short-term and seasonal trends in measured Reco are represented in the modelled potential respiration rate (Fig. 6). Short-term Reco variations are hardly present within estimations for potential respiration rate in dry circumstances (in control fields in the summer of 2020) but are more evident during normal to wet conditions (Fig. 6). This is because the unsaturated zone during normal to wet conditions is relatively close to saturation, which results in a steep slope of the WFPS respiration curve, as opposed to drier unsaturated zone conditions where the WFPS respiration curve is close to the optimum. Additionally, we find that the decreases in Reco in the control plots at the end of the summers occur ∼1 week earlier than the drop in potential respiration rate. This could be a consequence of the model infiltration capacity that was limited during the precipitation events at the end of both summers. As mentioned before, we have not subdivided Reco into peat, other soil organic matter pools and plant respiration. As respiration of short-term organic carbon in the soil is contributing to the total respiration, Reco differences between the control and SSI field are less evident in field measurements of Reco than simulated peat respiration rates.
3.4.2 NECB and water management strategy effectivity
On both research locations, SSI decreased C export and NEE, leading to reductions in NECB (Table 2). We found the highest (3.47 ± 0.39 kg CO2 m−2 yr−1) and lowest (2.49 ± 0.35 kg CO2 m−2 yr−1) C export in the year 2020 for Assendelft control and Assendelft SSI respectively. The control plot in Vlist emitted a higher amount of CO2 than the control plot in Assendelft in both measuring years, which is likely due to upward seepage that causes higher groundwater levels in Assendelft and is absent in Vlist. Our measurements show that the application of SSI systems reduced CO2 emissions for the dry year 2020 by 1.58 ± 0.56 kg CO2 m−2 yr−1 (83 ± 25 %) in Assendelft (pressurized SSI) and by 0.66 ± 0.62 kg CO2 m−2 yr−1 (28 ± 15 %) in Vlist. In 2021, SSI systems reduced CO2 emissions by 0.11 ± 0.58 kg CO2 m−2 yr−1 (11 ± 29 %) in Assendelft and by 0.10 ± 0.69 kg CO2 m−2 yr−1 (6 ± 23 %) in Vlist. Note that high standard deviations indicate that no significant reductions in 2021 were observed. C-export statistics can be found in Tables S4 and S5. Model calculations of simulated potential respiration rate (PRR) and effectivity of water management strategies agree with the measured NECB and effectivity for both research locations and measuring years (Table 2). Note that if we account for the complete parcel by looking at our model results from ditch to ditch (instead of using the results at the location representative for the measurement location in the middle of the parcel), the modelled effectivity in 2020 reduces to 76 % and 23 % for Assendelft and Vlist respectively in 2020. In 2021, potential respiration rate reductions in the middle of the parcel were low and remain low when considering the complete parcel.
We cautiously determined a relation (R2=0.92) between measured NECB and modelled potential respiration rate (Fig. 7a, Eq. 5) to be able to interpret and compare our model results with literature. When we plot the measured NECB against mean measured summer groundwater table depth (Fig. 7b) or annual groundwater table depth (Fig. 7c), we find weaker relations (R2=0.83, 0.73 respectively).
Table 2Measured carbon balance in the growing season with corresponding effectivity of water management strategies and modelled potential respiration rate for each measurement location with simulated effectivity of water management strategies.
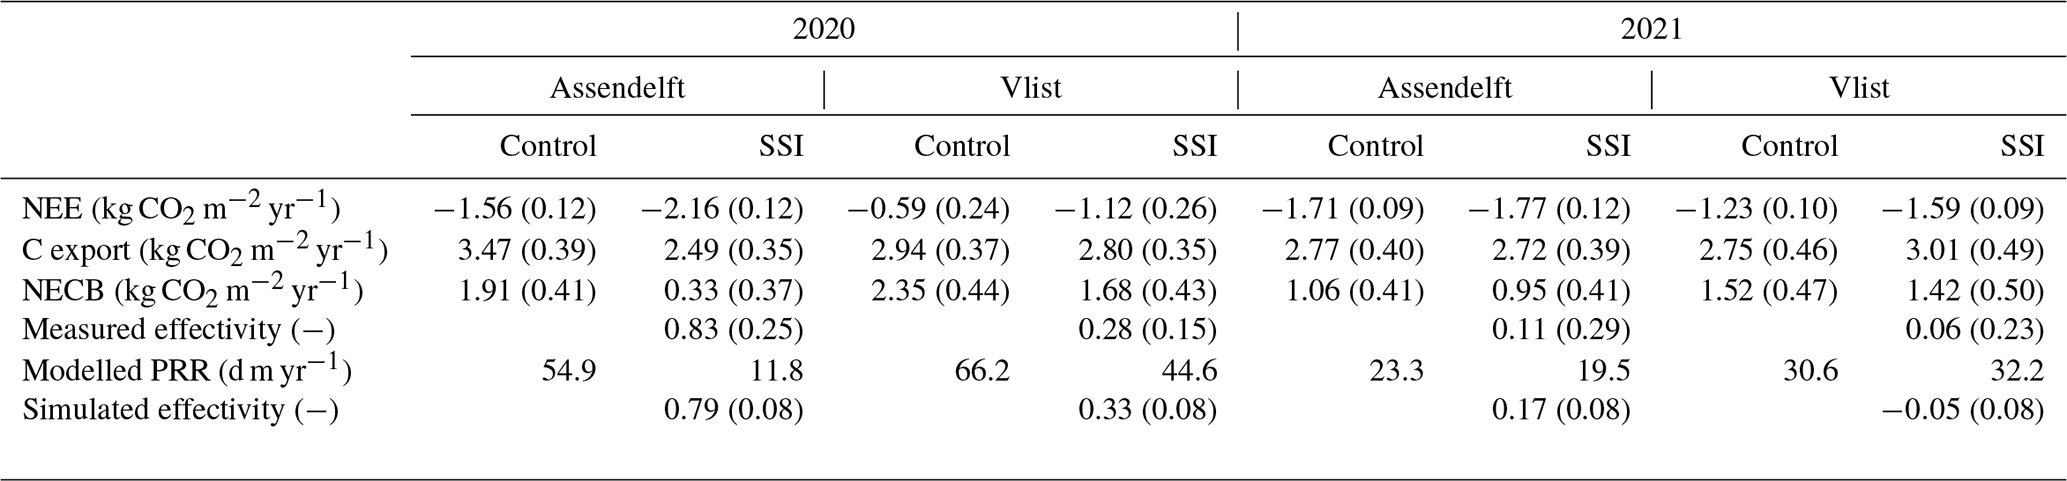
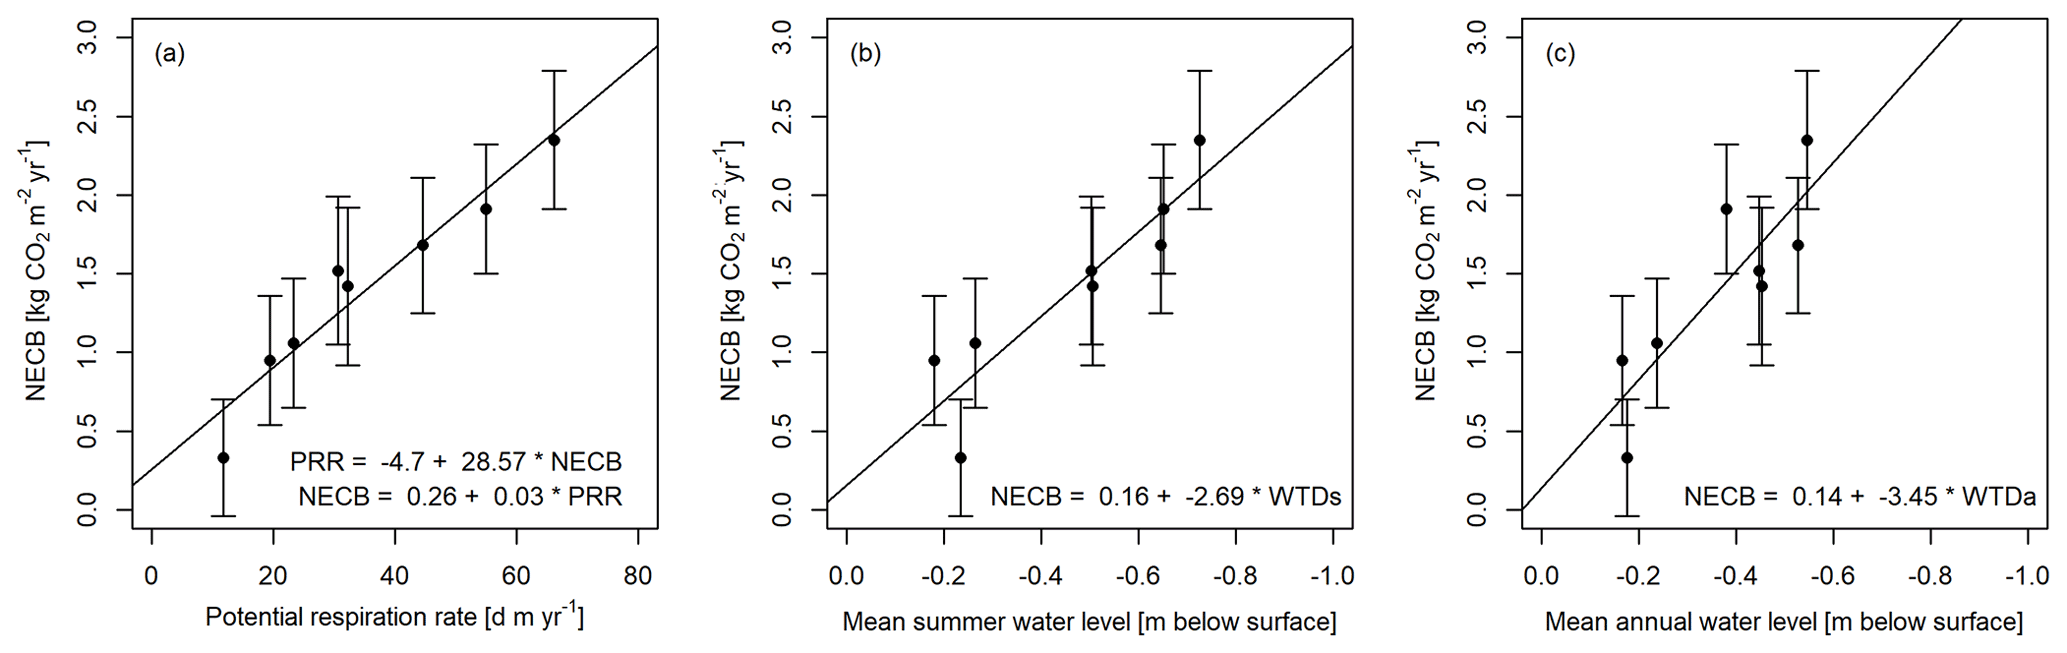
Figure 7The relations between measured NECB (kg CO2 m−2 yr−1) and (a) potential microbial respiration rate (PRR, d m yr−1), (b) mean summer water level (WTDs, metres below surface) and (c) mean annual water level (WTDa, metres below surface).
3.5 Model exploration
Here we present the results of our model exploration study as depicted in Figs. 8, 9 and 10.
3.5.1 Effects of meteorology and regional hydrology
The simulated potential respiration rate ranged between 4 and 85 d m yr−1 (0.4–3.0 kg CO2 m−2 yr−1) for all scenarios (Fig. 8a, Table S6). The highest potential respiration rate was found for the dry model scenario with 1 mm d−1 of downward seepage, a ditch summer water level of −0.6 m and no SSI. The lowest estimated potential respiration rate was found for a wet model scenario with 1 mm d−1 of upward seepage, a ditch summer water level of −0.2 m and no SSI. Generally, a dry year caused the WFPS to drop at increased depths (0.8 m) as compared to a wet year (0.4 m), possibly affecting the pristine peat layer at greater depth (Fig. S2). In both wet and dry years, the topsoil (0.2 m) is most prone to a high potential respiration rate.
Changes in hydraulic conductivity of the intact sedge peat layer did not result in changes in potential respiration rate for SSI model runs and remained mostly confined to 10 d m yr−1 for model runs without SSI (Table S7).
3.5.2 Effects of water management strategies
We determined the effects of water management strategies by comparing the yearly potential respiration rate of model runs. The effect of ditchwater level was calculated by comparing the results of each model run with the results of the base scenario with a summer ditchwater level of 0.5 m below surface (Fig. 8b). The effect of SSI was calculated by comparing SSI model runs with control model runs (Fig. 8b).
We find that elevating ditchwater level consistently decreases potential respiration rate up to 19 d m yr−1 (0.6 kg CO2 m−2 yr−1) (Fig. 8b, Table S6). Depending on the hydrological seepage setting, SSI could increase and decrease potential respiration rate by +71 % (12 m d yr−1, 0.4 kg CO2 m−2 yr−1) and −36 % (26 m d yr−1, 0.8 kg CO2 m−2 yr−1) with a standard ditchwater level of 0.5 m below surface in summer (Table S6). The application of SSI is most effective during a dry year and with downward hydrological seepage fluxes (Fig. 8b, Table S8). In wet years, SSI is more likely to drain pores to field capacity, leading to a decrease in WFPS and increases in potential respiration rate as compared to control model runs. SSI also increases potential respiration rate when upward hydrological flow is present across the bottom boundary. SSI tends to have more positive effects on respiration rate when combined with high ditchwater levels: up to a −75 % (40 m d yr−1, 1.3 kg CO2 m−2 yr−1) decrease in potential respiration rate (without including the decreases caused by ditchwater level increment). This positive effect may be attributed to the SSI drainage of the unsaturated zone in wet periods: the draining becomes less important when the depth of the unsaturated zone is minimized. We find that during dry years SSI enhances water and heat transport to the topsoil, resulting in stable zones with high potential respiration rate close to the surface, although SSI mostly tends to decrease the extent/depth of potential respiration rate in these years (Fig. S2).

Figure 8(a) Dot graph of calculated potential respiration rate over the complete width of the model domain. Model runs are distinguished by (1) application of SSI, (2) ditchwater level from surface, (3) hydrological regime (1 mm d−1 upward to downward flow across the bottom boundary) and (4) meteorology (2018 for dry, 2012 for wet). (b) Effects of SSI (above) and ditchwater level (below) on respiration rate. Green dots represent a decrease in respiration rate. Effects of SSI were determined by comparing similar model runs with and without SSI. Effects of ditchwater level were determined by comparing each scenario in which the water level is 0.5 m below surface, with the other scenarios in the same category on the x axis.
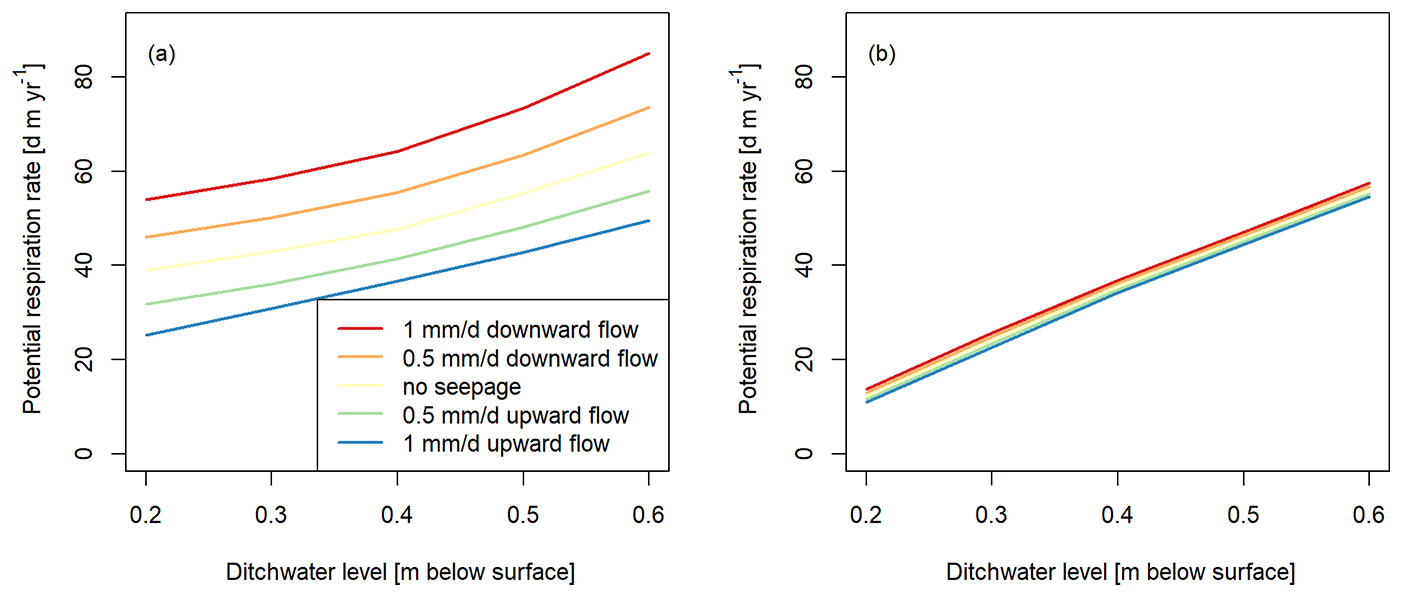
Figure 9(a) The simulated effects of ditchwater level on potential respiration rate for different seepage settings within a control scenario and (b) these effects with SSI in the dry year 2018. The colours of the lines represent the model seepage setting.
SSI reductions of potential respiration rate over the complete parcel compared to the middle of the parcel reduced with factor >1.5 for a dry year (Table S9), which indicates that SSI CO2 emission reductions that were measured at a central position within a parcel can easily be overestimated.
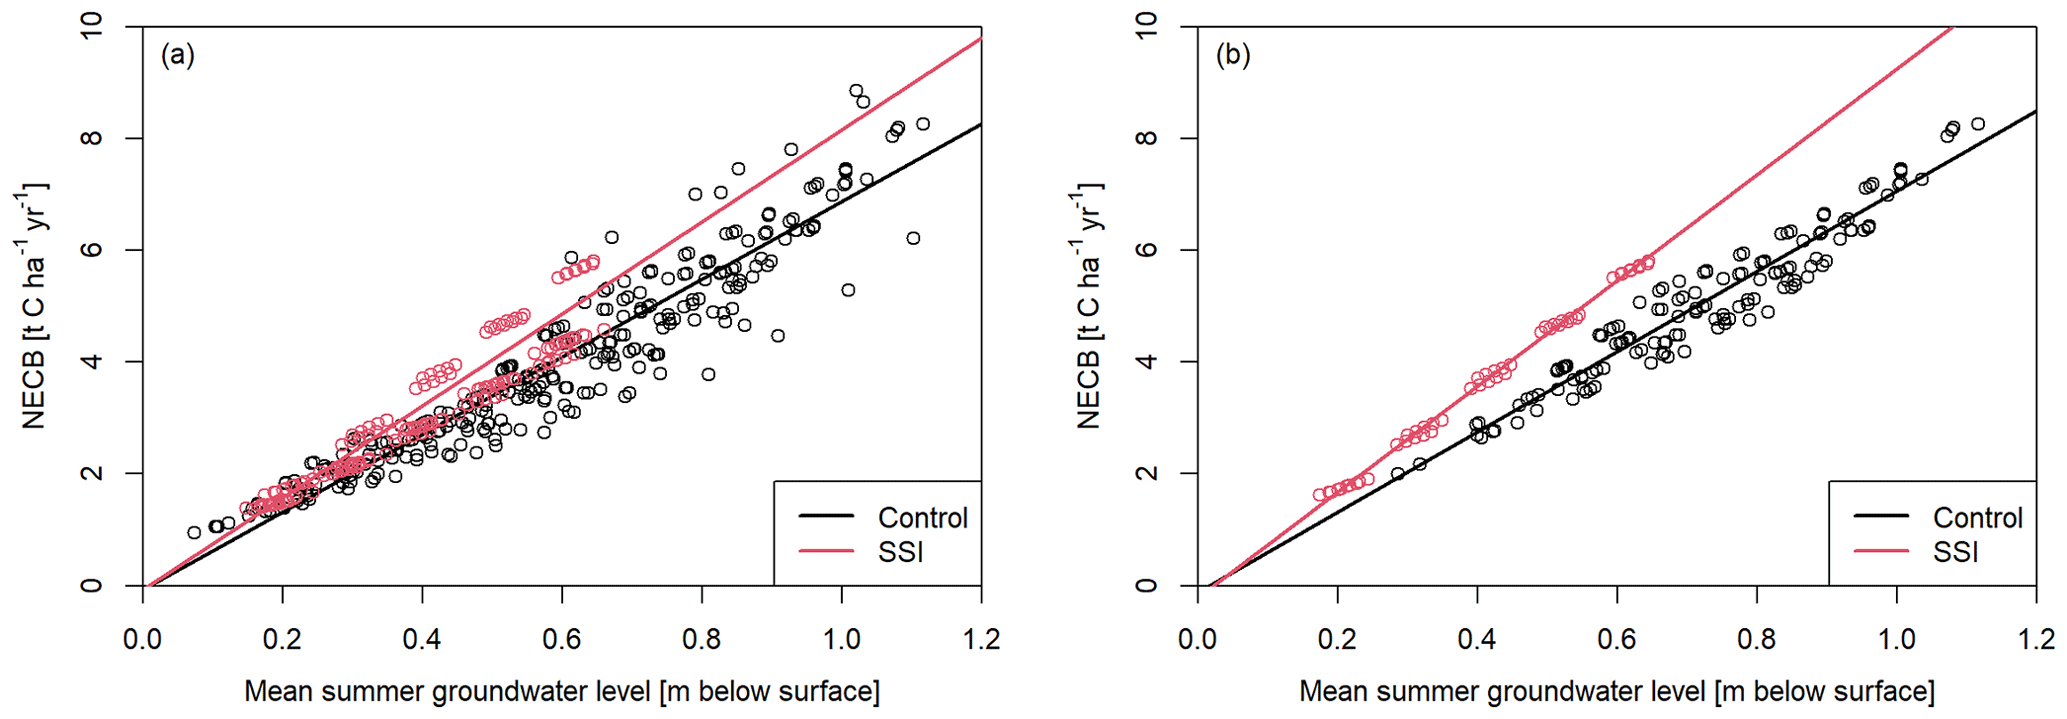
Figure 10Mean modelled summer groundwater level and NECB for simulations with and without SSI, for (a) all simulations and (b) simulations of 2018 and 2020 consisting of severe summer drought. Slope and intercept of plotted linear regression models are shown in Table 3.
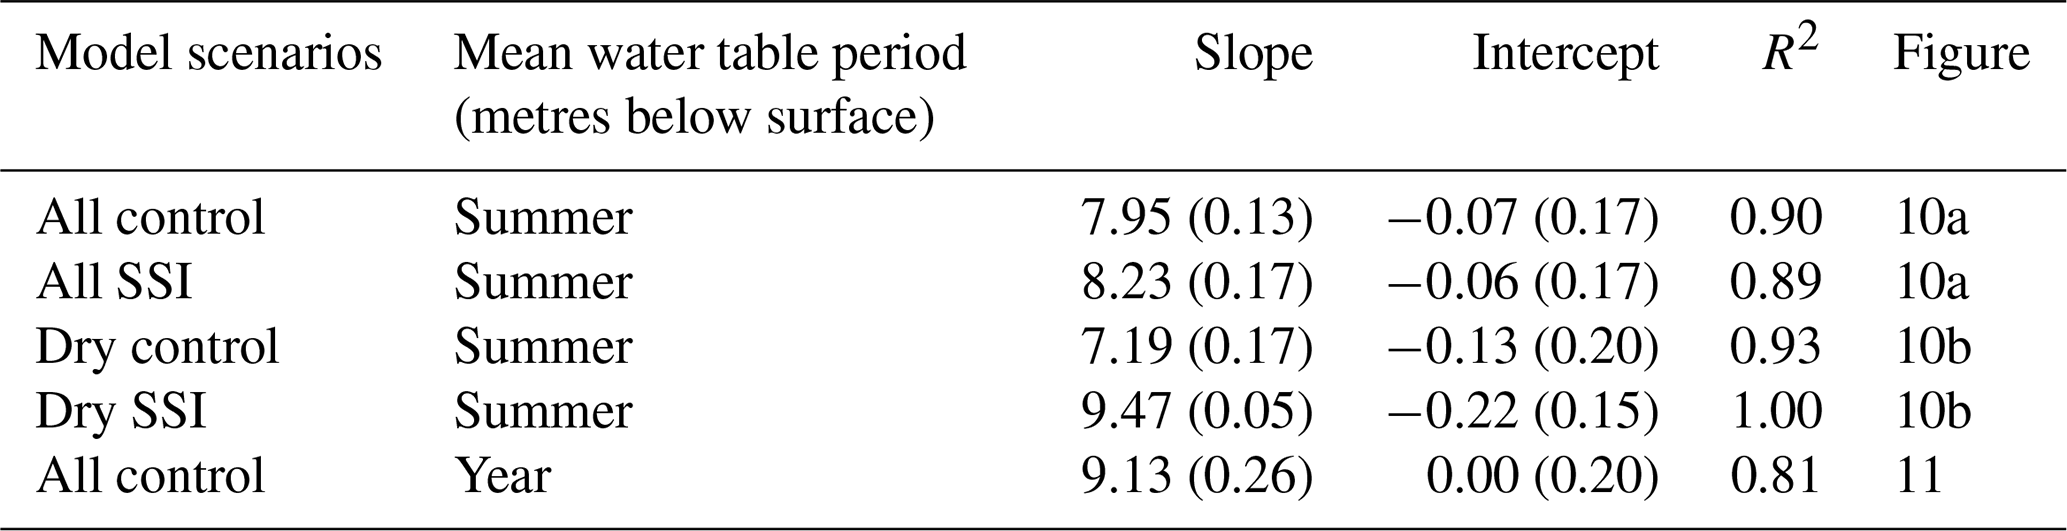
Table 3Estimated linear relation characteristics with standard errors to approximate NECB (t C ha−1 yr−1) by using water table depth relations plotted in Figs. 10 and 11. Standard errors include standard error estimates of Eq. (5).
Sharpest declines in potential respiration rate are accomplished when deeper ditchwater levels (−0.6 m in summer) are raised by 0.2 m and when downward seepage is present (Fig. 9a). Furthermore, we find that the potential respiration rate is more sensitive to changes in ditchwater level for SSI scenarios as compared to control scenarios (Fig. 9). This means that higher reductions in potential respiration rates are found with increasing ditchwater level in combination with SSI than with control scenarios. Also, the spread of potential respiration rate within the different seepage settings is diminished when SSI is applied (Fig. 9b).
3.5.3 Water table depth and estimated respiration rate
A frequently used proxy to estimate peat decomposition is mean groundwater table depth. In this section we present our findings on the relation between simulated mean groundwater table depth and the NECB that was estimated by using the modelled respiration rate and Eq. (5).
We compared the mean modelled groundwater level with our simulated NECB and found a strong correlation between the two variables (Fig. 10a, Table 3), in which summer (May to October) performed better (R2=0.90) than annual (R2=0.81) mean values. The slope of the linear regression models to estimate NECB with mean summer groundwater levels differed significantly (p<0.05) for situations with and without SSI systems (Fig. 10, Table 3). This means that similar water table depths lead to higher potential respiration rate estimations when SSI is applied as compared to control scenarios (Fig. 10). The absolute differences in NECB increase for deeper summer groundwater levels, which is due to the topsoil moisturizing effect of SSI that was described in Sect. 3.5.2. As a consequence, a difference of 0.82 t C ha−1 yr−1 is predicted between control and SSI scenarios for a severely dry year with a mean summer water table of 0.4 m below surface. For wet model simulations (2012 and 2021) the slope and intercept differences for control scenarios show marginal differences. Please note that the NECB values and relations mentioned here (Sect. 3.5) were based on NECB estimations for soils with similar carbon contents. While the implications of the results remain valid, absolute NECB estimations may differ for peat soils with deviating carbon content.
4.1 Observed effects of SSI
Our measurements of water table depth show that SSI maintained higher water tables during the summer drought, as was found by Kechavarsi et al. (2007) and Querner et al. (2012). The effect was more evident for the pressurized SSI system in Assendelft than for the passive SSI in Vlist, where the pressure in the SSI system followed the ditchwater level. In Assendelft we also found that WFPS was 19 % higher in the top 0.4 m of the SSI parcel during July to September 2020 (Fig. 5e) compared to the control site. In spring and summer of 2021 we found slightly lower WFPS values for the Assendelft SSI parcel as compared to the control parcel, probably due to drainage facilitated by SSI. Nevertheless, this was not reflected in the groundwater table data. In Vlist the effects of SSI on WFPS in the topsoil were not significant in both 2020 and 2021. However, we should be careful when interpreting the absolute values for WFPS or comparing WFPS differences between Assendelft and Vlist due to high uncertainty in the relationship between sensor output signal and WFPS.
Our temperature measurements support the hypothesis that SSI causes increased topsoil temperatures (up to 0.4 m depth). In the summer, this effect was stronger in Assendelft than in Vlist, which is likely due to the pressurized SSI in Assendelft. We hypothesize that the temperature increases were caused by the infiltration of warm ditchwater and/or an increase in soil thermal conductivity by wetting the topsoil.
We found lower nocturnal Reco during summertime for both plots with SSI application, suggesting that SSI reduced peat respiration rate and/or crop respiration (Fig. 6b). This is in contradiction with the findings of Parmentier et al. (2009), who did not find a relation between groundwater table depth and Reco, and Weideveld et al. (2021), who could not detect changes in Reco when SSI was applied. However, Parmentier et al. (2009) studied an abandoned meadow on peaty clay lake sediment, where a high forb biomass may have obscured the soil respiration component. In the autumn and/or winter, when the SSI systems switched from net irrigation to drainage, we expected to find higher Reco on the SSI parcels. Measured Reco in Assendelft and Vlist supported this hypothesis, but the effects remained relatively small.
Our measurements show that the application of SSI in 2020 reduced CO2 emissions (NECB) by 83 ± 25 % for Assendelft and 28 ± 15 % for Vlist (Table 2). In 2021, we found low reductions of 11 ± 29 % and 6 ± 23 % for Assendelft and Vlist respectively. The high standard deviations indicate that no significant reduction was observed for 2021 at both locations. In both years, the pressurized SSI of Assendelft resulted in higher emission reductions as compared to the passive SSI in Vlist. Measurements of C export show that crop productivity was 28 % lower when SSI was applied in Assendelft in 2020, suggesting that there is a relation between a near-surface groundwater table and crop production and/or between peat respiration rate and crop production. Except for Assendelft in 2020, differences in C export between control and SSI were smaller than the standard deviation on the C export for each of the parcels. Our results suggest vast benefits of SSI in the dry year 2020 and negligible effects in 2021. These findings suggest that SSI effectivity in reducing peatland CO2 emissions is strongly related to the extent of summer drought.
4.2 Simulated versus observed dynamics and SSI effects
Generally, our model simulated the measured water table depths satisfactory (Fig. 5b). However, the simulated phreatic surface during the summer of 2020 did not show similar short-term dynamics in response to precipitation and drought as was observed on the research sites (Fig. S1). We think that this is a result of the complex characteristics of peat soils, such as the possibility to shrink and swell, preferential flow paths, dual porosity and hysteresis, which were not represented within the general meta-study parameter values that we applied in our model (Liu, Janssen and Lennartz, 2016; Rezanzehad et al., 2016). The hydrological model overestimated the water buffering role of the unsaturated zone during the summertime of 2020. To improve the simulation of groundwater table dynamics, several model experiments were executed, such as incorporation of crack formation, increasing and decreasing residual or saturated water content, including hysteresis, adding anisotropy or dual porosity. These attempts did not improve the simulated groundwater dynamics enough to warrant the extra complexity.
Temperature dynamics were simulated successfully, although simulated topsoil temperatures were on average slightly overestimated due to too high surface boundary temperatures. Our model predicted stronger topsoil warming with SSI for Assendelft than for Vlist, which was also measured. In Assendelft SSI established a wetter topsoil than in Vlist. A wetter topsoil conducts heat better, which results in higher summer temperatures deeper in the profile. Nevertheless, monthly temperature differences between the control and SSI parcels remained mostly confined to 0.5 ∘C.
On average 65 % of the observed variation in Reco could be explained by simulated variations in WFPS and soil temperatures. This confirms our expectation that WFPS and soil temperature are dominant controls on microbial respiration dynamics, as stated by e.g. Mäkiranta et al. (2009) or Moyano et al. (2013). We found that WFPS-activity curves that have a maximum activity between 0.65 and 0.85 WFPS and a general decrease towards zero respiration at 1.0 WFPS clearly outperformed other shapes of activity curves. In the literature, relations that consisted of similar characteristics were suggested (Moyano et al., 2013), but measured relations vary widely and are far from general agreement (Kechavarzi et al., 2010; Moyano et al., 2013; Säurich et al., 2019). The curve that we selected for our analysis produced effectivity estimates that resembled the mean effectivity that was estimated using all eight WFPS curves that produced potential respiration that correlated well with measured Reco. Therefore, this curve is our best estimate on respiration dependency of WFPS. However, relations between WFPS and respiration might vary in space and depth, and we support further research to obtain more insight in this matter.
Our results show that our model captures effects of SSI on water table depth, soil temperature and WFPS, which translate to similar reductions in potential respiration rate and NECB for both measuring years and both research locations (Table 2). Furthermore, we find a strong relation (R2=0.92) between measured NECB and simulated potential respiration rate (Fig. 7, Eq. 5). Therefore, we think that our straightforward approach to estimate water management strategy effectivity forms an alternative approach of intermediate complexity compared to either groundwater-table–CO2 emission relationships (Couwenberg et al., 2011; Fritz et al., 2017; Tiemeyer et al., 2020; Arets et al., 2020; Evans et al., 2021) or models that resolve the entire carbon cycle (van Huissteden et al., 2006; He et al., 2021). The additional complexity of unsaturated zone modelling of water flow and introducing soil temperature and WFPS-activity curves requires a considerably higher modelling effort compared to approaches that rely on relationships between yearly average groundwater table and CO2 emissions, but it allows us to investigate the effect differences between groundwater levels raised by ditchwater level manipulations or by applying SSI. Compared to models that describe the full carbon cycle and consist of many (often unknown) parameters, our approach forms a straightforward alternative to simulate the yearly carbon balance. Nevertheless, we should be careful when comparing potential respiration rate estimations between locations as some location-specific characteristics have not been simulated such as parcel width, organic matter content or ratio.
4.3 Model exploration of rewetting measures
Our simulation results support the statement that there is an enormous potential to reduce CO2 emissions from managed peatlands (Evans et al., 2021), which could be achieved by various water management strategies (Querner et al., 2012). Our results suggest that raising ditchwater levels always results in decreasing potential respiration rates. Of course we can only state this for environments that are comparable with the situations we modelled and observed. Our results also show that SSI is not causing guaranteed decreases in potential respiration rate.
In fact, the complex interplay of the effects of SSI on temperature and WFPS determines the total benefits of the systems. The most important effects that we encountered during the warm summer periods and in simulations without seepage fluxes are the following: (1) soil drainage during wet times increases potential respiration rate, (2) soil warming during dry times increases potential respiration rate, and (3) soil wetting during dry times decreases the depth over which respiration can occur but also (4) in some cases increases respiration rate in the unsaturated topsoil as a result of constant moist conditions close to the warm soil surface (Sect. 3.5.2). Overall, we see that the first and third effects are dominant when studying the final results. The second and fourth effects decrease the overall effectivity of SSI but are less dominant. The specific hydrological seepage setting and meteorology will determine which processes are active over the year and will determine the long-term effectivity of SSI.
Our estimations of potential respiration rate for dry and wet years suggest that the extent of summer drought mainly determines the effectivity of SSI. The SSI systems are likely to induce a higher amount of potential respiration rate during wet years and a lower amount of potential respiration rate during dry years – which is explained by the processes described in the previous paragraph. As a result of climate change, the occurrence of severely dry summers is more likely in the Netherlands (Philip et al., 2020), inferring that SSI leads to a net reduction of potential respiration rate on the longer term. Furthermore, the seepage regime should always be taken into account when considering application of SSI. It is likely that SSI systems drain upward seepage, which would normally support high water tables during drought, resulting in the increase in potential respiration rate when applying SSI under upward seepage conditions. Adversely, SSI systems are likely to sustain groundwater tables in situations with downward flow, resulting in a decrease in potential respiration rate when applying SSI (Fig. 8b). Moreover, in combination with elevated ditchwater levels, potential benefits of SSI increase, which also suggests that the application of pressurized SSI tends to yield stronger decreases in potential respiration rate when drain pressure exceeds ditch pressure.
Other research suggests a decrease in peat decomposition (subsidence) by 45 % when SSI is applied during 2000–2001 (Querner et al., 2012). Our results suggest that the effects of submerged drains would be within the range of these estimated SSI effects for a dry model scenario with conditions that apply for the research location: 0.5 mm d−1 downward flow and a summer ditchwater level of 0.3 m (and when observing the middle of the parcel).
Weideveld et al. (2021) found no clear benefits of SSI in their setting. For model scenarios with low ditchwater levels (0.6 m below surface), we only predicted a slight decrease of 13 % in potential peatland emissions over the full width of the parcel for 2018 when applying SSI. It is likely that moderate differences like these remained undetected in the study of Weideveld et al. (2021) as uncertainty of NECB in almost all study fields exceeded 10 %.
Besides effects of peatland management on aerobic respiration rate, it is important to consider saturated-zone effects, like infiltration of oxygenated and nutrient-rich surface water, which we did not include in this research. As soil temperatures tend to increase with SSI, also saturated respiration rate could be enhanced. Furthermore, SSI enhances groundwater flow and transport, possibly leading to higher nutrient and dissolved organic matter (DOM) leaching leading to adverse effects. Furthermore, often the pH of the infiltrated surface water is higher than soil pH, enhancing respiration rate (Malik et al., 2018). Lastly, anaerobic respiration (forming CH4 and N2O) is likely to increase when groundwater levels approach the soil surface, counteracting on the decreased aerobic soil respiration in terms of GHG emissions (Tiemeyer et al., 2020).
4.4 Comparison with groundwater CO2 emission relations from previous studies
In many previous studies empirical relations have been established between land subsidence or NECB and (long-term) groundwater characteristics like the yearly lowest, yearly mean groundwater levels or mean summer groundwater levels (e.g. van den Akker et al., 2008; Fritz et al., 2017; Tiemeyer et al., 2020; Evans et al., 2021). In this study we fitted a linear model between mean summer groundwater table/mean annual water table and our estimations of potential respiration rate. Our data suggest that peatland CO2 emissions increase linearly with deeper annual groundwater levels, which is mostly in line with findings in literature except for the study Tiemeyer et al. (2020), who found an exponential relationship.
We compared our simulation results of the fitted relation between mean annual groundwater table and NECB with the findings of Couwenberg et al. (2011), Fritz et al. (2017), Tiemeyer et al. (2020) and Evans et al. (2021) (Fig. 11, Table 4). From our modelling results, we derived a relationship that falls in between the relation of Fritz et al. (2017) and Evans et al. (2021), showing that our data and modelling results fit very well within the relations from previous research. However, other studies of Couwenberg et al. (2011) and Tiemeyer et al. (2020) generally suggest a higher NECB, and more research is required to explain these differences.
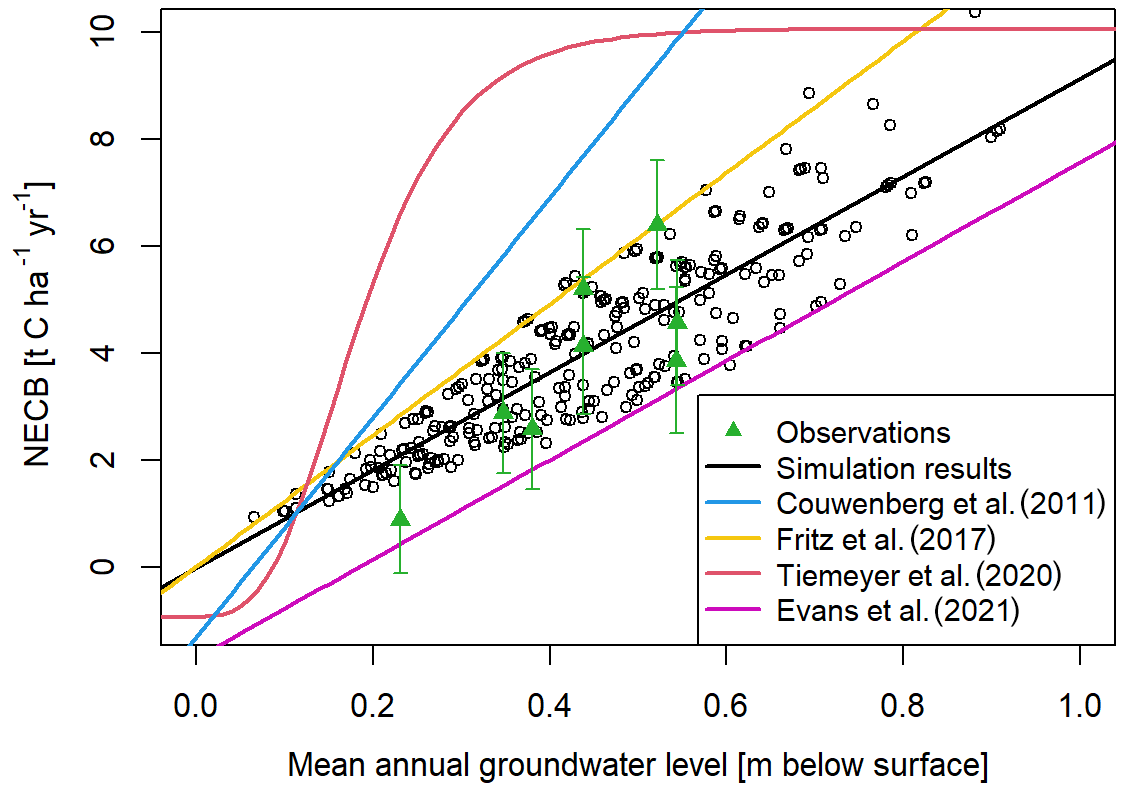
Figure 11The relations between annual mean modelled groundwater level and NECB found in this study in comparison with available fitted empirical relations to estimate NECB based on WTDa are presented in Table 4. Observations from this research are also depicted with standard deviations.
Table 4Overview of available fitted empirical relations to estimate NECB based on mean annual water table depth below surface (WTDa) plotted in Fig. 11.

Mean annual water table depth can function as a predictor of peat decomposition (Tiemeyer et al., 2020; Evans et al., 2021), although mean summer water table depth is found to be a more reliable predictor for predicting potential respiration rate in this research. Annual temperature fluctuations with high temperatures during summer and low during winter are an important driver for peat decomposition or potential respiration rate. Hence, the assumption that winter and summer water table depths are weighted equally to calculate NECB is incorrect. Therefore, we argue that methods that empirically relate groundwater table to peat decomposition can be improved by using summer water table depth when soil temperature and WFPS is not available.
We found that the relation between mean summer groundwater table depth and NECB diverges for simulations with and without SSI, possibly because of the enhanced draining during wet periods and the topsoil wetting and heat transporting effects of SSI. Therefore, established relations on groundwater table depth and (approximations of) peat decomposition may not be applied to situations with SSI (Fig. 10, Table 3), and benefits of SSI could easily be overestimated, especially with a mean summer water table depth that exceeds 0.3 m (Sect. 3.5.3). Hence, the relations determined in other studies should be corrected when calculating the effects or CO2 emissions of regions/parcels consisting of SSI.
Despite the fact that estimating peat respiration with mean groundwater levels is widely accepted, we show that the variance in NECB is incompletely represented by these approaches (Figs. 7, 10, 11) and that this can be improved by our process-based approach.
4.5 Implications for monitoring and rewetting strategies
As we found that our process-based approach estimating potential respiration rate as a measure for peat decomposition successfully captured the effects of rewetting measures on NECB, we would recommend investing in measuring campaigns in managed peatlands that target the assessment of soil temperatures and WFPS. This will be an important addition to measuring groundwater table depth, as the effects of rewetting measures on potential respiration rate can be monitored more precisely. Particularly, the approach facilitates understanding the most important effects of SSI on potential respiration rate. In fact, we think that the concept of potential respiration rate could be used as a first step in determining a new standard for process-based quantification of (indicators of) peat decomposition (tier 3 approach, IPCC, 2014). We find that modelling studies are necessary when implementing this concept and when determining the effects of rewetting strategies, as we found that point measurements on the middle of a parcel are not representative for the total effects over the complete width of the parcel (Sect. 3.4.2, 3.5.2).
Following our results we find that rewetting policies in areas with low ditchwater levels (>0.4 m below surface summer ditchwater level) should be accompanied by ditchwater level increases. Investments in SSI do not guarantee high reductions (>40 %) in CO2 emissions of managed peatlands over longer timescales when ditchwater levels are low, and our results show no CO2 reductions when the region is prone to upward seepage that is higher than 0.5 mm d−1. To assure high CO2 emission reductions with SSI, we advise maintaining high summer ditchwater levels (0.2 m below surface preferably) or pressurized SSI. In the case of downward seepage, our results indicate a guaranteed CO2 emission reduction. When summer groundwater table depth is lower than 0.2 m from the surface methanogenesis and nitrate reduction are induced, this is likely to cause an offset in GHG reductions from the soil in dairy farming peatlands (e.g. Evans et al., 2021; Tiemeyer et al., 2020). Therefore, we suggest keeping summer groundwater levels between 0.2 and 0.3 m for minimal GHG emission. By using pressurized SSI, these specific groundwater table depths could be targeted and maintained (as shown by the measurements in Assendelft). Quantification of the effects of parcel width was beyond the scope of our research as this would involve designing separate model domains and analysis methods, which was not feasible within this project.
Finally, the water management strategies that we discuss are envisioned from a perspective in which agricultural business on managed peatlands could predominantly be maintained while reducing greenhouse gas emissions. However, several other strategies that aim to reduce GHG emissions exist, such as full ecosystem restoration (Nugent et al., 2019) or paludiculture (Geurts et al., 2019). We emphasize the need for long-term thinking and solutions and recommend interdisciplinary research in which the broad goals of society as a whole are centralized while determining the fate of peatlands.
Within our research, we showed that mean annual, or summer, groundwater level height measurements fall short as a proxy for estimating peat decomposition, and we addressed the potency of an alternative process-based approach that converts daily soil temperature and WFPS conditions to a peat decomposition proxy. Furthermore, the outcomes of our model scenarios showed that temporal variation in meteorology, spatial variation in landscape seepage and variation in ditchwater level management decisions can explain the wide range in SSI effectivity that had previously been reported by other researchers. Lastly, we addressed the effects of SSI systems on groundwater, soil temperature and moisture conditions, which lead to understanding individual processes that limit, or contribute to, peat decomposition in SSI scenarios. As these processes are different for control as compared to SSI scenarios, we also detected different dependencies of NECB on mean summer groundwater level. Our findings can contribute to peatland management, to better decide on where and how water management practices would be effective.
All raw data can be provided by the corresponding authors upon request.
The supplement related to this article is available online at: https://doi.org/10.5194/bg-19-5707-2022-supplement.
JB, YvdV, MMH, KvH and GE outlined the research; CvH and JB performed the measurements; JB, YvdV, MvdB and RM analysed the data; JB and YvdV wrote the manuscript draft; MMH, MvdB, KvH, GE and RM reviewed and edited the manuscript.
The contact author has declared that neither of the authors has any competing interests.
Publisher's note: Copernicus Publications remains neutral with regard to jurisdictional claims in published maps and institutional affiliations.
This study was part of the project “Nationaal onderzoeksprogramma broeikasgassen veenweiden” funded by the Dutch government to research greenhouse gas emissions emerging from peatlands. This project is an interdisciplinary collaboration between the following Dutch partners: STOWA, Deltares, Radboud Universiteit, Universiteit Utrecht, Wageningen Environmental Research, Wageningen Universiteit, Technische Universiteit Delft, B-ware, and Vrije Universiteit Amsterdam. We would like to thank all the researchers, technical staff and the farmers involved. In particular, we are grateful for the technical support by Ron Lootens, Arie Bikker and Rob Stoevelaar of the Vrije Universiteit Amsterdam.
This research has been supported by the Dutch Ministry of Agriculture, Nature and Food Quality (LNV).
This paper was edited by Tyler Cyronak and reviewed by Henk van Hardeveld, Juergen Augustin, and one anonymous referee.
Allen, R. G., Pereira, L. S., Raes, D., and Smith, M.: Crop evapotraspiration guidelines for computing crop water requirements, Food and Agriculture Organisation of the United Nations (FAO) Report, 1998.
Arets, E. J. M. M., van der Kolk, J. W. H., Hengeveld, G. M., Lesschen, J. P., Kramer, H., Kuikman, P. J., and Schelhaas, M. J.: Greenhouse gas reporting for the LULUCF sector in the Netherlands: methodological background (update 2020), Wageningen environ. res. Report 168, https://doi.org/10.18174/539898, 2020.
Bååth, E.: Temperature sensitivity of soil microbial activity modeled by the square root equation as a unifying model to differentiate between direct temperature effects and microbial community adaptation, Global Change Biol., 24, 2850–2861, https://doi.org/10.1111/gcb.14285, 2018.
Bader, C., Müller, M., Schulin, R., and Leifeld, J.: Peat decomposability in managed organic soils in relation to land use, organic matter composition and temperature, Biogeosciences, 15, 703–719, https://doi.org/10.5194/bg-15-703-2018, 2018.
Bechtold, M., Tiemeyer, B., Laggner, A., Leppelt, T., Frahm, E., and Belting, S.: Large-scale regionalization of water table depth in peatlands optimized for greenhouse gas emission upscaling, Hydrol. Earth Syst. Sci., 18, 3319–3339, https://doi.org/10.5194/hess-18-3319-2014, 2014.
Best, E. P. H. and Jacobs, F. H. H.: The influence of raised water table levels on carbon dioxide and methane production in ditch-dissected peat grasslands in the Netherlands, Ecol. Eng., 8, 129–144, https://doi.org/10.1016/S0925-8574(97)00260-7, 1997.
Couwenberg, J., Thiele, A., Tanneberger, F., Augustin, J., Bärisch, S., Dubovik, D., Liashchynskaya, N., Michaelis, D., Minke, M., Skuratovich, A., and Joosten, H.: Assessing greenhouse gas emissions from peatlands using vegetation as a proxy, Hydrobiologia, 674, 67–89, https://doi.org/10.1007/s10750-011-0729-x, 2011.
Dissanayaka, S. H., Hamamoto, S., Komatsu, T., and Kawamoto, K.: Thermal Properties for Peaty Soil Under Variable Saturation and Their Correlation to Mass Transport Parameters in Gaseous and Aqueous Phases, Res. Rep. Dep. Civ. Environ. Eng. Saitama Univ., 39, 21–32, 2013.
Dolman, A. J., Freibauer, A., and Valentini, R.: The Continental-Scale Greenhouse Gas Balance of Europe, Springer US, https://doi.org/10.1007/978-0-387-76570-9, 2019.
Elsgaard, L., Görres, C. M., Hoffmann, C. C., Blicher-Mathiesen, G., Schelde, K., and Petersen, S. O.: Net ecosystem exchange of CO2 and carbon balance for eight temperate organic soils under agricultural management, Agric. Ecosyst. Environ., 162, 52–67, https://doi.org/10.1016/j.agee.2012.09.001, 2012.
Erkens, G., Van Der Meulen, M. J., and Middelkoop, H.: Double trouble: Subsidence and CO2 respiration due to 1,000 years of Dutch coastal peatlands cultivation, Hydrogeol. J., 24, 551–568, https://doi.org/10.1007/s10040-016-1380-4, 2016.
Evans, C. D., Peacock, M., Baird, A. J., Artz, R. R. E., Burden, A., Callaghan, N., Chapman, P. J., Cooper, H. M., Coyle, M., Craig, E., Cumming, A., Dixon, S., Gauci, V., Grayson, R. P., Helfter, C., Heppell, C. M., Holden, J., Jones, D. L., Kaduk, J., Levy, P., Matthews, R., Mcnamara, N. P., Misselbrook, T., Oakley, S., Page, S., Rayment, M., Ridley, L. M., Stanley, K. M., Williamson, J. L., Worrall, F., and Morrison, R.: Overriding water table control on managed peatland greenhouse gas emissions, Nature, 593, 548–552, https://doi.org/10.1038/s41586-021-03523-1, 2021.
Friedlingstein, P., Jones, M. W., O'Sullivan, M., Andrew, R. M., Hauck, J., Peters, G. P., Peters, W., Pongratz, J., Sitch, S., Le Quéré, C., Bakker, D. C. E., Canadell, J. G., Ciais, P., Jackson, R. B., Anthoni, P., Barbero, L., Bastos, A., Bastrikov, V., Becker, M., Bopp, L., Buitenhuis, E., Chandra, N., Chevallier, F., Chini, L. P., Currie, K. I., Feely, R. A., Gehlen, M., Gilfillan, D., Gkritzalis, T., Goll, D. S., Gruber, N., Gutekunst, S., Harris, I., Haverd, V., Houghton, R. A., Hurtt, G., Ilyina, T., Jain, A. K., Joetzjer, E., Kaplan, J. O., Kato, E., Klein Goldewijk, K., Korsbakken, J. I., Landschützer, P., Lauvset, S. K., Lefèvre, N., Lenton, A., Lienert, S., Lombardozzi, D., Marland, G., McGuire, P. C., Melton, J. R., Metzl, N., Munro, D. R., Nabel, J. E. M. S., Nakaoka, S.-I., Neill, C., Omar, A. M., Ono, T., Peregon, A., Pierrot, D., Poulter, B., Rehder, G., Resplandy, L., Robertson, E., Rödenbeck, C., Séférian, R., Schwinger, J., Smith, N., Tans, P. P., Tian, H., Tilbrook, B., Tubiello, F. N., van der Werf, G. R., Wiltshire, A. J., and Zaehle, S.: Global Carbon Budget 2019, Earth Syst. Sci. Data, 11, 1783–1838, https://doi.org/10.5194/essd-11-1783-2019, 2019.
Fritz, C., Geurts, J., Weideveld, S., Temmink, R., Bosma, N., Wichern, F., and Lamers, L.: Meten is weten bij bodemdaling-mitigatie. Effect van peilbeheer en teeltkeuze op CO2-emissies en veenoxidatie, Bodem, 20–22, 2017.
Geurts, J., van Duinen, G.-J. A., van Belle, J., Wichmann, S., Wichtmann, W., and Fritz, C.: Recognize the high potential of paludiculture on rewetted peat soils to mitigate climate change, J. Sustain. Org. Agric Syst, 69, 5–8, https://doi.org/10.3220/LBF1576769203000, 2019.
Görres, C. M., Kutzbach, L., and Elsgaard, L.: Comparative modeling of annual CO2 flux of temperate peat soils under permanent grassland management, Agr. Ecosyst. Environ., 186, 64–76, https://doi.org/10.1016/j.agee.2014.01.014, 2014.
He, H., Jansson, P.-E., and Gärdenäs, A. I.: CoupModel (v6.0): an ecosystem model for coupled phosphorus, nitrogen, and carbon dynamics – evaluated against empirical data from a climatic and fertility gradient in Sweden, Geosci. Model Dev., 14, 735–761, https://doi.org/10.5194/gmd-14-735-2021, 2021.
Heinemeyer, A., Gornall, J., Baxter, R., Huntley, B., and Ineson, P.: Evaluating the carbon balance estimate from an automated ground-level flux chamber system in artificial grass mesocosms, Ecol. Evol., 3, 4998–5010, https://doi.org/10.1002/ece3.879, 2013.
Heinen, M., Bakker, G., and Wösten, J. H. M.: Waterretentie- en doorlatendheids- karakteristieken van boven en ondergronden in Nederland: de Staringreeks, https://doi.org/10.18174/512761, 2018.
Hooghoudt, S. B.: Bijdragen tot de kennis van eenige natuurkundige grootheden van den grond, Bodemkundig Instituut te Groningen Report, 1936.
Huth, V., Vaidya, S., Hoffmann, M., Jurisch, N., Günther, A., Gundlach, L., Hagemann, U., Elsgaard, L., and Augustin, J.: Divergent NEE balances from manual-chamber CO2 fluxes linked to different measurement and gap-filling strategies: A source for uncertainty of estimated terrestrial C sources and sinks?, Zeitschrift fur Pflanzenernahrung und Bodenkd., 180, 302–315, https://doi.org/10.1002/jpln.201600493, 2017.
IPCC: Supplement to the 2006 IPCC Guidelines for National Greenhouse Gas Inventories: Wetlands, 1–55, 2014.
Jansen, P. C., Querner, E. P., and Kwakernaak, C.: Effecten van waterpeilstrategieën in veenweidegebieden, Alterra Rep., 1666, ISSN 1566-7197, 2007.
Kechavarzi, C., Dawson, Q., Leeds-Harrison, P. B., Szatyłowicz, J., and Gnatowski, T.: Water-table management in lowland UK peat soils and its potential impact on CO2 emission, Soil Use Manag., 23, 359–367, https://doi.org/10.1111/j.1475-2743.2007.00125.x, 2007.
Kechavarzi, C., Dawson, Q., Bartlett, M., and Leeds-Harrison, P. B.: The role of soil moisture, temperature and nutrient amendment on CO2 efflux from agricultural peat soil microcosms, Geoderma, 154, 203–210, https://doi.org/10.1016/j.geoderma.2009.02.018, 2010.
Leifeld, J. and Menichetti, L.: The underappreciated potential of peatlands in global climate change mitigation strategies /704/47/4113 /704/106/47 article, Nat. Commun., 9, 1071, https://doi.org/10.1038/s41467-018-03406-6, 2018.
Liu, H., Janssen, M., and Lennartz, B.: Changes in flow and transport patterns in fen peat following soil degradation, Eur. J. Soil Sci., 67, 763–772, https://doi.org/10.1111/ejss.12380, 2016.
Lloyd J., and Taylor, J. A.: On the Temperature Dependence of Soil Respiration, Funct. Ecol., 8, 315–323, 1994.
Mäkiranta, P., Laiho, R., Fritze, H., Hytönen, J., Laine, J., and Minkkinen, K.: Indirect regulation of heterotrophic peat soil respiration by water level via microbial community structure and temperature sensitivity, Soil Biol. Biochem., 41, 695–703, https://doi.org/10.1016/j.soilbio.2009.01.004, 2009.
Malik, A. A., Puissant, J., Buckeridge, K. M., Goodall, T., Jehmlich, N., Chowdhury, S., Gweon, H. S., Peyton, J. M., Mason, K. E., van Agtmaal, M., Blaud, A., Clark, I. M., Whitaker, J., Pywell, R. F., Ostle, N., Gleixner, G., and Griffiths, R. I.: Land use driven change in soil pH affects microbial carbon cycling processes, Nat. Commun., 9, 1–10, https://doi.org/10.1038/s41467-018-05980-1, 2018.
Moyano, F. E., Manzoni, S., and Chenu, C.: Responses of soil heterotrophic respiration to moisture availability: An exploration of processes and models, Soil Biol. Biochem., 59, 72–85, https://doi.org/10.1016/j.soilbio.2013.01.002, 2013.
Nugent, K. A., Strachan, I. B., Roulet, N. T., Strack, M., Frolking, S., and Helbig, M.: Prompt active restoration of peatlands substantially reduces climate impact, Environ. Res. Lett., 14, 124030, https://doi.org/10.1088/1748-9326/ab56e6, 2019.
Parmentier, F. J. W., van der Molen, M. K., de Jeu, R. A. M., Hendriks, D. M. D., and Dolman, A. J.: CO2 fluxes and evaporation on a peatland in the Netherlands appear not affected by water table fluctuations, Agric. For. Meteorol., 149, 1201–1208, https://doi.org/10.1016/j.agrformet.2008.11.007, 2009.
Pagenkemper, S., Jansen-Minßen, F., Höper, H., Sieber, A. C., Minke, M., Heller, S., Lange, G., Schröder, U., Gatersleben, P., Giani, L., Landscheidt, S., Buchwald, R., and Kupke, L.: SWAMPS. Zwischenergebnisse der bisherigen Projektlaufzeit (Kernaussagen), Thünen-Institut-Institut für Agrarklimaschutz Report, 2021.
Philip, S. Y., Kew, S. F., Van Der Wiel, K., Wanders, N., Jan Van Oldenborgh, G., and Philip, S. Y.: Regional differentiation in climate change induced drought trends in the Netherlands, Environ. Res. Lett., 15, 094081, https://doi.org/10.1088/1748-9326/ab97ca, 2020.
Querner, E. P., Jansen, P. C., van den Akker, J. J. H., and Kwakernaak, C.: Analysing water level strategies to reduce soil subsidence in Dutch peat meadows, J. Hydrol., 446, 59–69, https://doi.org/10.1016/j.jhydrol.2012.04.029, 2012.
Ratkowsky, D. A., Lowry, R. K., McMeekin, T. A., Stokes, A. N., and Chandler, R. E.: Model for bacterial culture growth rate throughout the entire biokinetic temperature range, J. Bacteriol., 154, 1222–1226, https://doi.org/10.1128/jb.154.3.1222-1226.1983, 1983.
Säurich, A., Tiemeyer, B., Dettmann, U., and Don, A.: How do sand addition, soil moisture and nutrient status influence greenhouse gas fluxes from drained organic soils?, Soil Biol. Biochem., 135, 71–84, https://doi.org/10.1016/j.soilbio.2019.04.013, 2019.
Šimunek, J., Šejna, M., and Van Genuchten, M. T.: The HYDRUS Software Package for Simulating One-, Two-, and Three-Dimensional Movement of Water, Heat, and Multiple Solutes in Variably-Saturated Porous Media, PC Progress Hydrus 2D/3D Technical Manual II, 2022. Šimůnek, J., M. Th. van Genuchten, and M. Šejna, The HYDRUS Software Package for Simulating One-, Two-, and Three-Dimensional Movement of Water, Heat, and Multiple Solutes in Variably-Saturated Porous Media, PC Progress Hydrus 2D/3D Technical Manual II, 2022. No DOI or ISBN available.
Tiemeyer, B., Albiac Borraz, E., Augustin, J., Bechtold, M., Beetz, S., Beyer, C., Drösler, M., Ebli, M., Eickenscheidt, T., Fiedler, S., Förster, C., Freibauer, A., Giebels, M., Glatzel, S., Heinichen, J., Hoffmann, M., Höper, H., Jurasinski, G., Leiber-Sauheitl, K., Peichl-Brak, M., Roßkopf, N., Sommer, M., and Zeitz, J.: High emissions of greenhouse gases from grasslands on peat and other organic soils, Glob. Chang. Biol., 22, 4134–4149, https://doi.org/10.1111/gcb.13303, 2016.
Tiemeyer, B., Freibauer, A., Borraz, E. A., Augustin, J., Bechtold, M., Beetz, S., Beyer, C., Ebli, M., Eickenscheidt, T., Fiedler, S., Förster, C., Gensior, A., Giebels, M., Glatzel, S., Heinichen, J., Hoffmann, M., Höper, H., Jurasinski, G., Laggner, A., Leiber-Sauheitl, K., Peichl-Brak, M., and Drösler, M.: A new methodology for organic soils in national greenhouse gas inventories: Data synthesis, derivation and application, Ecol. Indic., 109, 105838, https://doi.org/10.1016/j.ecolind.2019.105838, 2020.
van den Akker, J. J. H., Kuikman, P. J., de Vries, F., Hoving, I., Pleijter, M., Hendriks, R. F. A., Wolleswinkel, R. J., Simões, R. T. L., and Kwakernaak, C.: Emission of CO2 from agricultural peat soils in the netherlands and ways to limit this emission, Proc. 13th Int. Peat Congr. After Wise Use – Futur. Peatlands, 1, 2–5, 2008.
van Genuchten, M. T.: A Closed-form Equation for Predicting the Hydraulic Conductivity of Unsaturated Soils, Soil Sci. Soc. Am. J., 44, 892–898, https://doi.org/10.2136/sssaj1980.03615995004400050002x, 1980.
van Huissteden, J., van den Bos, R., and Marticorena Alvarez, I.: Modelling the effect of water-table management on CO2 and CH4 fluxes from peat soils, Geol. en Mijnbouw/Netherlands J. Geosci., 85, 3–18, https://doi.org/10.1017/S0016774600021399, 2006.
Veenendaal, E. M., Kolle, O., Leffelaar, P. A., Schrier-Uijl, A. P., Van Huissteden, J., Van Walsem, J., Möller, F., and Berendse, F.: CO2 exchange and carbon balance in two grassland sites on eutrophic drained peat soils, Biogeosciences, 4, 1027–1040, https://doi.org/10.5194/bg-4-1027-2007, 2007.
Weideveld, S. T. J., Liu, W., Van Den Berg, M., Lamers, L. P. M., and Fritz, C.: Conventional subsoil irrigation techniques do not lower carbon emissions from drained peat meadows, 18, 3881–3902, https://doi.org/10.5194/bg-18-3881-2021, 2021.
Yu, Z., Loisel, J., Brosseau, D. P., Beilman, D. W., and Hunt, S. J.: Global peatland dynamics since the Last Glacial Maximum, Geophys. Res. Lett., 37, 3–8, https://doi.org/10.1029/2010GL043584, 2010.