the Creative Commons Attribution 4.0 License.
the Creative Commons Attribution 4.0 License.
 | 15 Feb 2022
The role of cover crops for cropland soil carbon, nitrogen leaching, and agricultural yields – a global simulation study with LPJmL (V. 5.0-tillage-cc)
Susanne Rolinski
Jens Heinke
Werner von Bloh
Sibyll Schaphoff
Christoph Müller
Land management practices can reduce the environmental impact of agricultural land use and production, improve productivity, and transform cropland into carbon sinks. In our study we assessed the biophysical and biogeochemical impacts and the potential contribution of cover crop practices to sustainable land use. We applied the process-based, global dynamic vegetation model LPJmL (Lund–Potsdam–Jena managed Land) V. 5.0-tillage-cc with a modified representation of cover crops to simulate the growth of grasses on cropland in periods between two consecutive main crops' growing seasons for near-past climate and land use conditions. We quantified simulated responses of agroecosystem components to cover crop cultivation in comparison to bare-soil fallowing practices on global cropland for a period of 50 years.
For cover crops with tillage, we obtained annual global median soil carbon sequestration rates of 0.52 and 0.48 t C ha−1 yr−1 for the first and last decades of the entire simulation period, respectively. We found that cover crops with tillage reduced annual nitrogen leaching rates from cropland soils by medians of 39 % and 54 % but also the productivity of the following main crop by an average of 1.6 % and 2 % for the 2 analyzed decades. The largest reductions in productivity were found for rice and modestly lowered ones for maize and wheat, whereas the soybean yield revealed an almost homogenously positive response to cover crop practices replacing bare-soil fallow periods. The obtained simulation results of cover crop with tillage practices exhibit a good ability of the model version to reproduce observed effects reported in other studies. Further, the results suggest that having no tillage is a suitable complementary practice to cover crops, enhancing soil carbon sequestration and the reduction in nitrogen leaching, while reducing potential trade-offs with the main-crop productivity due to their impacts on soil nitrogen and water dynamics.
The spatial heterogeneity of simulated impacts of cover crops on the variables assessed here was related to the time period since the introduction of the management practice as well as to environmental and agronomic conditions of the cropland. This study supports findings of other studies, highlighting the substantial potential contribution of cover crop practices to the sustainable development of arable production.
- Article
(1282 KB) - Full-text XML
-
Supplement
(1112 KB) - BibTeX
- EndNote


The agricultural sector is challenged to provide more food, feed, and fuel to meet an increasing demand due to global human population dynamics as well as changes in diet composition (Alexander et al., 2017; Bodirsky et al., 2015; Godfray et al., 2010). Simultaneously, it is expected to consume fewer resources either by direct savings or by increasing general efficiency of applied inputs (Lal, 2004a; Springmann et al., 2018). Agricultural production accounts for ∼ 10 % (mean of the years 2007 to 2016) of the annual global anthropogenic greenhouse gas emissions, including carbon (C) dioxide, methane from ruminant animals as well as nitrous oxide emissions from crop production (i.e., fertilizer) and livestock rearing activities (Rosenzweig et al., 2020). Additional to the estimated 1.6 ± 0.7 PgC yr−1 emissions from land use change for the decade 2010–2019 (Friedlingstein et al., 2020), about 1 PgC yr−1 of emissions can be attributed to harvest, grazing, and tillage on global cropland in the period since the year 1850 (Pugh et al., 2015). Cropland covers about 12 % of the global ice-free land surface (Ramankutty et al., 2008). A loss of 30 % to 40 % soil organic C was estimated due to the historic cultivation of croplands (Poeplau and Don, 2015). At the same time, agricultural land management practices can be employed to reduce or reverse detrimental environmental impacts of agricultural production as well as facilitate the regeneration of degraded ecosystem services and functions (Rosegrant et al., 2014). Conservation agriculture (CA) practices have been proposed to improve cropland soil fertility and to sustain productivity (Scopel et al., 2013; Thierfelder et al., 2018; Tittonell et al., 2012). CA comprises minimum mechanical soil disturbance, the maintenance of a permanent vegetative soil surface cover, and a diversified crop rotation (Kassam et al., 2019). The latter two aspects can be accomplished by the integration of a secondary crop, which depending on the position and purpose in the rotation, can be referred to as green manure, intercrop, or as intermediate, companion, catch, and cover crop (term further used in this study). For farming systems cultivating annual crop types, cover crops can be grown between two consecutive main-cropping seasons, whereas for perennial woody crops, cover crops are instead found as ground cover between trees (Gonzalez-Sanchez et al., 2019).
Cover crops exhibit several environmental benefits, such as decreasing nitrogen (N) leaching from agricultural systems (Abdalla et al., 2019; Thapa et al., 2018; Tonitto et al., 2006; Valkama et al., 2015). The N recovery rate of excess fertilizer left in the soil after the harvest of a main crop is found to be higher for non-leguminous cover crop species, such as grasses (e.g., ryegrass) and crucifers (e.g., radish) (Florentín et al., 2011) than for leguminous (e.g., peas and beans) cover crop species (Dabney et al., 2010; Valkama et al., 2015). Leguminous cover crop species are able to improve the N balance of the soil (Kaye and Quemada, 2017) through additional N fixation and in this way can reduce fertilizer input requirements in the long term (Nouri et al., 2020; Thierfelder et al., 2018). Last but not least, cover crops constitute a suitable measure for weed control and against soil compaction (SARE, 2019) as well as erosion prevention through extending the vegetative coverage of the soil surface (Kaye and Quemada, 2017). Cover crops are terminated either naturally (e.g., by frost), chemically (e.g., by herbicide application), or mechanically (e.g., by mowing, roller, or tillage) (Kaye and Quemada, 2017). The corresponding biomass of the cover crops can be harvested for off-field uses, grazed by livestock, or, if left on the field, be used to build up the soil's humus layer (Florentín et al., 2011). Cover crops are an important practice to manage soil fertility and weed in organic farming systems (Keestra et al., 2018).
According to the Farm Structure Survey and the Survey on Agricultural Production Methods (SAPM), which are carried out at 10-year intervals as a census in the EU-28 countries, the soil surface of arable land during the winter of the year 2010 was covered as follows: 44 % with normal winter crops, 5 % with cover or intermediate crops, 9 % with plant residues, and 25 % left as bare soil. The remaining 16 % missing reporting share comprises areas under glass (greenhouses) and areas not sown or cultivated during the reference year (e.g., temporary grassland) (EUROSTAT, 2018). Poeplau and Don (2015) report that current shares of cropland with cover crop cultivations range between 1 %–10 % in the US and for countries in Europe. Further, these authors estimate 25 % (∼ 400×106 ha) of cropland suitable for cover crop practices as half of the global winter or off-season fallow cropland, by excluding 50 % of the total area covered with winter cereals and further 25 % of the off-season fallow area due to climatic or agronomic constraints. This area estimate is also used in Kaye and Quemada (2017), who find the mitigation potential of cover crop practices mainly due to the combined effects of soil C sequestration, reduced fertilizer application rates, and changes in surface albedo, corresponding to an off-set of about 10 % of the estimated annual emissions from agriculture. Cover crop practices encompass the potential to contribute to climate change impact mitigation through soil C sequestration (Abdalla et al., 2019; Corsi et al., 2012; Poeplau and Don, 2015). The largest potentials for the realization of C sequestration on global cropland soils were identified for areas with high natural potential soil C stocks and with the strongest C depletion due to the duration and intensity of historical agricultural land use and management (Sommer and Bossio, 2014), resulting in a larger saturation deficit (West and Six, 2007). Further, cover crop practices can serve adaptation and increase the resilience of cropland production to climate change impacts through improving soil nutrient and water dynamics (Kaye and Quemada, 2017; Rosenzweig et al., 2020). Dynamic global vegetation and land surface models can be used to assess the impacts of land management practices on carbon, nitrogen, and water dynamics, across various temporal and spatial scales (Erb et al., 2016; McDermid et al., 2017; Pongratz et al., 2018). Hirsch et al. (2018) find considerable local temperature cooling effects in response to simulated conservation agriculture practices using the spatially explicit CA area dataset for the year 2012 by Prestele et al. (2018). However, assessments of the global carbon and other biogeochemical cycles are hampered by the limited availability of data on cropland management practices at sufficient spatial and temporal resolution as well as the level of detail captured by individual models (Pongratz et al., 2018). As a result, in global C cycle modeling assessments, “cropland” often is represented as an aggregated effect across crop types and associated land management over large areas (Morais et al., 2019). Changes in management often can only be assessed via stylized model scenarios with homogenous assumptions on management intensities or are restricted to point-scale simulations, for which more details on cropland management practices may be available (Lutz et al., 2020). Olin et al. (2015) explored the soil C sequestration potential of having no tillage, retaining main-crop residues on the field, cover crops, and manure application for historical, current, and future climate simulation periods on cropland at the global scale using the process-based dynamic vegetation model LPJ-GUESSS (Lund–Potsdam–Jena General Ecosystem Simulator). These authors found soil carbon sequestration with all alternative management scenarios compared to their standard simulation. Additionally, for the cover crop scenario Olin et al. (2015) found nitrogen (N) leaching rates reduced by 15 % but also main-crop yields lowered by 5 %, revealing a trade-off between agroecosystem services and functions.
Lutz et al. (2019) find a soil C sequestration potential within their simulated idealized no-tillage scenario but only when retaining all main-crop residues on the field. However, findings by Herzfeld et al. (2021) reveal that with future climate change conditions, a switch to having no tillage, independent of the main-crop residue removal rate, is not sufficient to reverse projected soil carbon density declines on global cropland due to biomass extraction, conventional cropland management practices, and associated soil carbon decomposition processes.
The “intercrop” carbon-only version of LPJmL (Lund–Potsdam–Jena managed Land) and 15 other agroecosystem models were included in the study of Kollas et al. (2015). They find only a minor ability of the model ensemble to reproduce the slightly positive main-crop yield effect, which was observed at the experimental site for the rotations with intermediate crops. It is important to understand the effects of cover crop practices on the terrestrial C and N cycles to improve model representation of the practices to be included in agricultural assessments. Therefore, it is the aim of our study to quantify the biophysical and biogeochemical impacts and potential contribution of cover crop cultivation to sustainable arable production at the global scale accounting for differences in environmental and socio-economic conditions. We focus our analysis on effects of herbaceous cover crop species, growing as annual grasses and replacing bare-soil fallows on cropland during main-crop off-season periods. The objectives of this study were to (i) assess the temporal and spatial pattern of cover crop cultivation impacts simulated with LPJml5.0-tillage-cc on global cropland soil C stocks, N leaching rates, and agricultural productivity, (ii) quantify responses to cover crop cultivation with regard to tillage practices and the influence of management duration, and (iii) estimate the impacts of land management for the historical CA area and the potential contribution of cover crop practices to agricultural production impact and greenhouse gas mitigation efforts.
2.1 Model code functions in LPJmL5.0-tillage-cc
For the assessment of cover crop cultivation impacts we applied the dynamic global vegetation model LPJmL5.0-tillage-cc, representing biophysical and biogeochemical processes of the biosphere for the quantification of human-nature interactions as well as of their effects on natural and managed ecosystems. A detailed description of water, soil, and vegetation dynamics of a preceding carbon-only model version 4, including a comprehensive evaluation of model performance, is provided in Schaphoff et al. (2018a, b). The model version used here additionally includes processes associated with global N dynamics in soils and plants (von Bloh et al., 2018) and an explicit representation of tillage and crop residue management (Lutz et al., 2019).
In the model three litter layers and five hydrologically active soil layers of differing thickness to a total depth of 3 m are distinguished. Each soil layer has its specific temperature and moisture levels, affecting the decomposition rates of soil organic matter, represented in the model by fast and slowly decomposing (30- and 1000-year turnover time, respectively) C and N pools (Lutz et al., 2019; Schaphoff et al., 2018a). Carbon and N pools of the represented vegetation, litter, and soil layers are updated daily. Biomass formation is represented by a simplified version of photosynthesis according to Farquhar et al. (1980). The phenology of tree and grass plant functional types (PFTs) of the represented natural vegetation are based on Jolly et al. (2005) with modification of the growing season index as described in Forkel et al. (2014). Crop functional types (CFTs, see Table S1.1 in the Supplement), representing the vegetation on cropland, are parameterized with specific temperature and phenological heat unit requirements for growth (Müller et al., 2017).
Cropland irrigation was mechanistically simulated by either surface flooding, sprinkler, or drip irrigation, here setting one type per country (Jägermeyr et al., 2015; Rohwer et al., 2007). We used the potential irrigation setting to simulate irrigated cropping systems (for cropland within grid cells with areas equipped for irrigation as informed by the input data (see Sect. 2.2)) to account for the missing representation of ground water sourcing, when this model version only considers surface water withdrawal amounts, in the case of alternatively setting the model to limited irrigation.
The C-to-N ratio of manure was set 14.5 to 1. Half of the N contained in the manure was assumed to be ammonium (NH4) and added to the pool of the upper soil layer, whereas the entire C and the remaining N (assumed as organic share) were transferred to the respective litter pools. Generally, mineral N fertilizer and manure were applied to cropland at the sowing date of an individual main crop (CFT) within a grid cell. If the sum of N from the mineral N fertilizer and from the manure exceeded the threshold value of 50 kg N ha−1, the remaining mineral N fertilizer amount was applied at a second event during the growing season, when 40 % of the phenological heat sums to reach maturity were accumulated.
Conventional tillage was assumed as the default historical soil management for all cropland, applied when converting land to cropland as well as at main-crop seeding and harvest events. After the harvest of the main crop, the tillage routine submerges and transfers 95 % of the aboveground biomass remaining on the field from soil surface to the incorporated soil litter pools. In the model, tillage mostly affects processes in the first soil layer up to 20 cm depth (Lutz et al., 2019). In the case of having no tillage, the remaining aboveground biomass of the main crops' residues left on the field after harvest are added to the surface soil litter pools, representing mulching practices. Herzfeld et al. (2021) examine global soil carbon dynamics affected by historical land use, land use change, tillage, and crop residue management, based on simulations with a similar model code version, input data, and cropland management representation but a different simulation setup than the one applied here. For the simulated period 2000–2009, the authors found a global cropland soil carbon stock of 170 PgC in response to historical dynamic climate input data, land use change, cropland use, and management practices, which was in good agreement with estimates reported in the literature.
2.2 Simulating cover crop practices with LPJmL5.0-tillage-cc
We used LPJmL5.0-tillage-cc with a modified code for the representation of cover crop management. It is built on an earlier version of the model accounting for intercrops, as the options of simulating either herbaceous vegetation, or bare-soil fallow dynamics on cropland in periods between two consecutive main crops' growing seasons (Bondeau et al., 2007). The functionalities make use of three “grass” plant functional types (PFTs) already implemented in LPJmL for the natural vegetation, growing on fallow cropland according to their bio-climatic limits as tropical C4, temperate C3, and polar C3 grass (Forkel et al., 2014). In the model, biophysical and biogeochemical dynamics on off-season cropland within a grid cell are accounted for in routines of the “set-aside stand”, preserving the separation of processes in soil columns into rainfed and irrigated shares.
As a first step, we modified the functionalities for the establishment of cover crop (grass), so that it occurs on each crop-specific off-season cropland fraction after the harvest of the main crop (CFT) within a grid cell. The initial biomass of the cover crop grass sapling (0.05–0.07 g C m−2) was changed to be taken from the respective C and N pools of the soil litter layers. We did so to avoid imposing artificial fertilization effects (Olin et al., 2015) from simply adding contained amounts of the sapling's C and N to the simulated system with the default CFT establishment model routines, which assume crop seeds as external inputs.
In this model version, C and N are allocated to the different organs (root and leaf pools) of the cover crop grass plants on a daily basis, using routines of “managed grassland” dynamics described in Rolinski et al. (2018) and von Bloh et al. (2018). Any management of the cover crops on fallow cropland was excluded, so that they were growing as grasses under rainfed conditions. Cover crops are terminated at the beginning of the following main-crop growing season. The corresponding aboveground grass plant biomass is either left at the soil surface, or transferred to the incorporated soil litter pools, depending on the tillage setting. The root biomass of the terminated cover crops is added to the respective belowground litter pools. Soil and vegetation C, N, and water fluxes in the main-crop growing period as well as during vegetated or bare fallow off-season were summarized in model outputs for the entire cropland. More details of the model functionalities and input data used are provided in the Supplement (Sect. S1).
2.3 Model input data
For the simulations of this study, the model was driven with monthly mean temperature input data from the Climate Research Unit (CRU TS version 3.23, Harris et al., 2014, covering the period 1901–2014). Monthly precipitation and number of wet days data were from the Global Precipitation Climatology Centre (GPCC Full Data Reanalysis version 7.0; Becker et al., 2013; years 1901–2013). The monthly radiation data (shortwave and net longwave downward) were taken from the ERA-Interim dataset (Dee et al., 2011) for the years 1901–2011. Annual atmospheric CO2 concentration input data were based on the NOAA/ESRL Mauna Loa station reports (Tans and Keeling, 2015) and natural N deposition data in the ACCMIP database (Lamarque et al., 2013) for the years 1841–2012. Soil texture classes remained static over the simulation period and were based on the Harmonized World Soil Database (Nachtergaele et al., 2009), and soil pH was taken from the WISE dataset (Batjes, 2006).
Model input data on historical land use, distinguishing shares of irrigated and rainfed crop-group-specific physical cropland per grid cell, as well as mineral N fertilizer application rates were based on LUH2v2 data by Hurtt et al. (2020). The original data per crop group were (dis-)aggregated and remapped, using the MADRaT tool (Dietrich et al., 2020) to match the crop functional types (CFTs) representing vegetation dynamics on managed land in LPJmL (Table S1.1) and the here targeted model simulation grid cell resolution of 0.5 arcdeg (∼ 50 × 50 km at the Equator). In the year 2010 there were ∼ 1500×106 ha total global physical cropland (Fig. S1.2 in the Supplement).
Sowing date and phenological heat units were prescribed with a growing season input dataset based on Portmann et al. (2010) and Sacks et al. (2010), described by Elliott et al. (2015). The historical manure input data were based on the time series of N contained in manure applied on cropland by Zhang et al. (2017). The residue management model input dataset prescribed the fraction of residue biomass remaining on the field after the harvest of the main crop. It was generated by setting residue recycling shares to values per CFT group (i.e., cereals, fibrous, non-fibrous, and others) which were obtained from Dietrich et al. (2020) and based on national reported cropland data retrieved from statistics of the Food and Agriculture Organization of the United Nations (https://www.fao.org/faostat/en/#home, last access: 3 February 2022). The data account for historical main-crop residue removal rates associated with land management practices, such as burning on field, as well as with secondary off-field uses, such as household burning and livestock fodder.
2.4 Simulation setup of land management scenarios
As a first step, we conducted a 7000-year spin-up simulation with LPJmL5.0-tillage-cc, in order to get natural vegetation pattern and soil pools into a dynamic equilibrium state, recycling the first 30 years of climate input data following the procedures described in von Bloh et al. (2018). Subsequently, we ran a second spin-up simulation, with fixed cropland distribution pattern and most of the land management as provided by the model input data for the year 2010 (Sect. 2.3). We assumed bare-soil fallow on cropland during the main-crop off-season periods as well as tillage to be the default historical management practices. By keeping land use and management constant during this simulation step, we aimed to establish an equilibrium state between the C and N pools and the fluxes. We assumed that cropland had been already cultivated for a longer time at the beginning of the actual management simulation period so that our results can be more easily compared to literature values, e.g., those obtained from experiments conducted on already established cropland plots. Starting with cropland soil pools from this spin-up procedure, we simulated the control as a reference scenario (REF) for 50 years of the historical period to the present day, maintaining land use patterns and all land management model settings as during the land use spin-up period. By using dynamic climate and CO2 concentration model forcing data during the actual management simulation period (years 1962–2011), we aimed to mimic near-past environmental production conditions. Three alternative cropland management scenario simulations were generated with cover crops replacing bare-soil fallow periods (CC), no tillage (NT) applied as a single as well as a combined cover crop, no-tillage practices (CCNT) on global cropland for the same 50-year simulation period, and all other model settings as used in the reference scenario (REF) (see Supplement Table S1.3 for more details on simulation setup). On the one hand, this 50-year time frame has been chosen for analysis because it is stated as the minimum duration required to re-establish a new steady state in soil C pools after the introduction of a new soil management practice involving altered biomass input levels to soils (Kaye and Quemada, 2017; Poeplau and Don, 2015). On the other hand, the 50 years were chosen for analysis because of spanning the maximum duration found for values reported in the literature and used here for evaluating simulated responses to cover crop practices (Tables 1, S2.6).
Table 1Simulated responses to cover crops (CC) in comparison to the control scenario with bare fallow (REF) on cropland during main-crop off-season periods as annual aggregated area-weighted median and in the parentheses the quartiles (Q1, Q3) for the first and last decades of the 50-year simulation period (see Sect. 2.5 for equations used). In the last two columns values from other studies as well as their considered duration of cover crop management are reported.
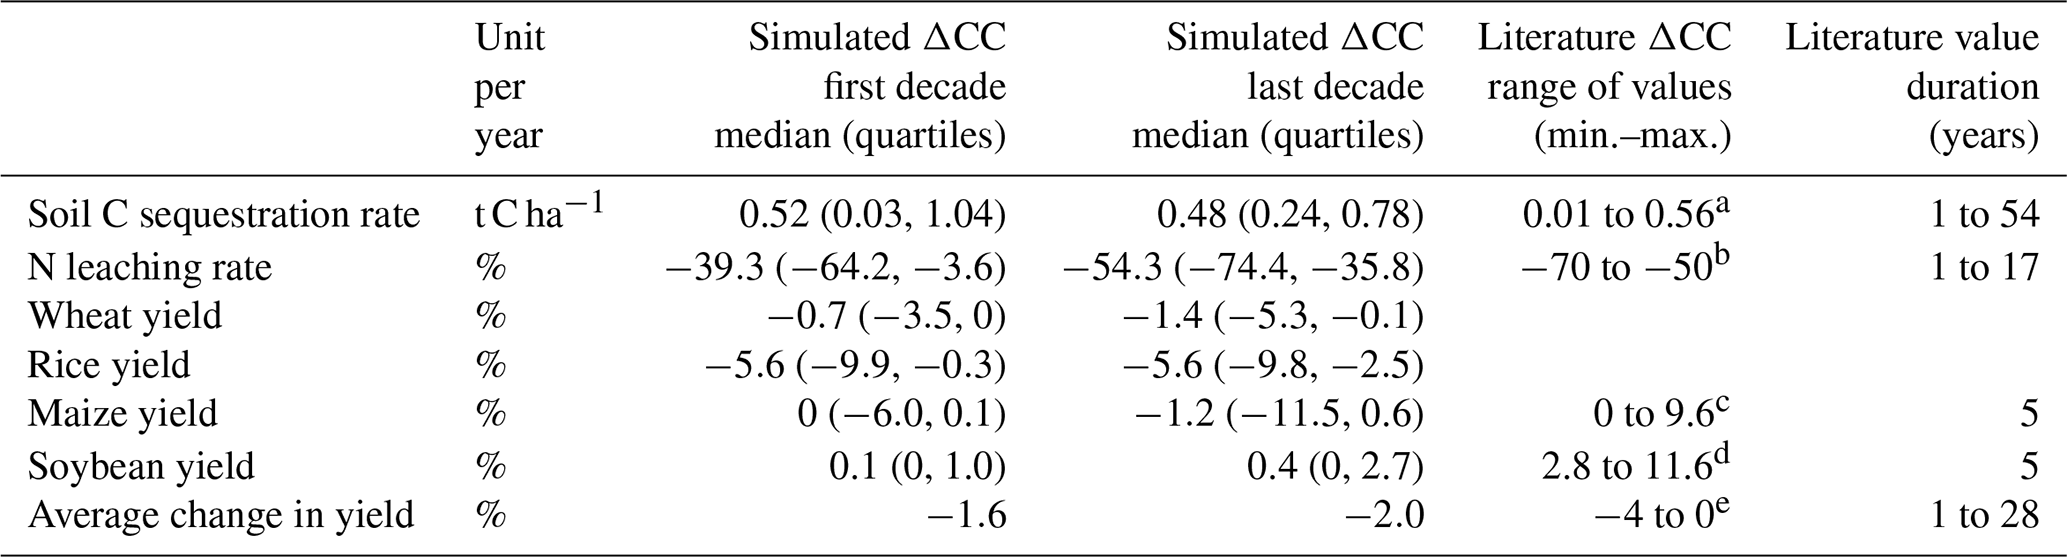
a Jian et al. (2020), Lal (2004b), Paulsen (2020), Poeplau and Don (2015), Sommer and Bossio (2014), and Stockmann et al. (2013). b Thapa et al. (2018), Tonitto et al. (2006), and Valkama et al. (2015). c Marcillo and Miguez (2017) and SARE (2019). d SARE (2019). e Abdalla et al. (2019), Thapa et al. (2018), Tonitto et al. (2006), and Valkama et al. (2015).
2.5 Post-processing model outputs
Model output data were post-processed and analyzed with R version 3.3.2 (R Development Core Team, 2016), applying functions developed by Kowalewski (2016) as well as by using the packages “raster” (Hijmans and van Etten, 2012), “reldist” (Handcock, 2016), and “ncdf4” (Pierce, 2015).
Soil C stock change was quantified up to 30 cm soil depth by adding C pool model outputs for the litter, the first soil layer (0–20 cm soil depth), and one-third of the second soil layer (20–50 cm soil depth). Responses of cropland soil C stock to altered management scenarios (CC, CCNT, and NT) in comparison to the control (REF) were generated, assuming a “paired plot” (West et al., 2004) or “synchronic” approach (Corbeels et al., 2018). The calculations follow the Eq. (3.3.4B) of the guidance from the Intergovernmental Panel on Climate Change (IPCC, 2003) for annual changes in mineral soil C stock on remaining cropland as Eq. (1):
where is the annual soil C sequestration rate in t C ha−1 yr−1 per alternative scenarios s, in grid cell i, and time step t, as the absolute difference between the annual absolute soil C stock in t C ha−1 yr−1 in each of the alternative scenarios and the baseline , divided by management duration T, as the number of years (1 to 50) since the introduction of the alternative practices.
Although all 12 CFTs were modeled (see Sect. S1.1), we focus our analysis of the impacts of cover crop practices replacing bare-soil fallow periods on the productivity of the following main crops of wheat, maize, rice, and soybean because of their global relevance as staple crops and their large spatial cropland coverage. Throughout the study we report main-crop productivity impacts due to changes in management on each of the four main-crop types' separated for irrigated and rainfed cropping systems or as changes in average productivity as the area-weighted mean of simulated irrigated and rainfed yields in kg dry matter (DM) ha−1 yr−1 per crop-specific cropland in grid cell i and time step t. For area-weighting the model output data at the grid cell scale, we employed the crop-specific rainfed and irrigated cropland shares, which were used as land use model input data for the year 2010 (see Sect. 2.3).
Responses to simulated altered management of crop-specific yield in kg DM ha−1 yr−1 and cropland soil N leaching rates in kg N ha−1 yr−1 were computed as Eq. (2):
where is the relative difference in percent (%) between the assessed variable per alternative management scenario s compared to the baseline value , per hectare of cropland area in grid cell i and time step t.
We report global aggregates of simulated values and differences as the area-weighted median (Q2 as q=0.5 as and the first (Q1 as q=0.25) and third quartiles (Q3 as q=0.75) per management scenario s and per time step t. Time step t is annual (yr−1), either reported for the first (years 1 to 10) or last (years 41 to 50) decade of the 50 simulation years, in order to contrast short- with long-term management effects or for any time period otherwise indicated. For area-weighting of global aggregated changes in soil carbon and N leaching rate, we applied the sum of the physical cropland per grid cell using the land use data of the year 2010 (see Sects. 2.3, S1.2).
For evaluating LPJmL5.0-tillage-cc model results, we compare modeled responses to cover crop cultivation on soil carbon, nitrogen, and water dynamics to values reported in the literature, which use bare-soil fallowing practices and conventional tillage in the control treatment (Table 1). Meta-analyses and reviews of cropland management effects summarize experimental studies' findings, covering a variety of temporal scales and crop production conditions regarding climate, soil, and management intensities. Although many studies present averages across experiment sites and years (Nyawira et al., 2016), we computed spatially and temporally aggregated median (and quartile) changes to exclude outliers stronger influence on global spatially aggregated mean values. Further, we report crop productivity impacts of changes in cropland management as the mean across aggregated yield change values obtained for each of the assessed four following main-crop types, when a variety of main-crop types were included in experiments considered for the values found in the literature and used for comparison.
To assess the historical global impact of conservation agriculture on soil C, N leaching rate, and main-crop productivity, we employed a time series dataset of CA area of annual global gridded physical cropland covering the years 1974–2010. During the assessed historical period the global CA area grew from a share of 0.2 % to 10 % of the global cropland (FAO, 2016). This CA dataset was generated by using annual national reported CA cropland data in hectares (FAO, 2016) and by employing downscaling methods described in Porwollik et al. (2019) as well as further in the Supplement (Sect. S1.4). The simulation cover crops combined with having no tillage (CCNT) were assumed to be proxy for the full suite of CA practices, whereas responses to the no-tillage (NT) and cover crop with tillage scenario (CC) comprise only one single land management component of the principles promoted under CA, respectively. Computed changes per variable, grid cell i, and time step t for the CC, CCNT, and NT scenarios compared to the control (REF) were remapped to match the historically evolving spatial and temporal pattern of the CA area time series data. We quantified the impacts of switching to single cover crop (CC), no tillage (NT), and combined alternative cropland management practices (CCNT) on variables as global aggregated totals and as area-weighted median change per hectare of CA cropland for the years 1974 to 2010.
3.1 Soil carbon responses to altered land management and duration
We found increased cropland soil carbon stocks in the three simulated alternative land management scenarios compared to the control (REF), indicated by positive annual area-weighted spatially aggregated median soil carbon sequestration rates (Fig. 1; for the respective spatial patterns, see Fig. S2.1.1). During the first decade of the 50-year simulation period the median soil C sequestration rates in the three alternative management scenario simulations CC, CCNT, and NT were higher (0.52, 0.72, and 0.08 t C ha−1 yr−1) than during the last decade (0.48, 0.54, and 0.01 t C ha−1 yr−1) (Table 1, Table S2.2). The maximum annual median soil C sequestration rates within both cover crop scenarios CC and CCNT (0.79, 1.03 t C ha−1 yr−1) were reached in the sixth year of the analyzed 50-year simulation period, whereas in NT (0.11 t C ha−1 yr−1) they were already reached in the third year since the introduction of altered management. After these peaks within each of the scenarios, the annual soil C accumulation effect persists over the course of the remaining simulation period, but with lower rates.
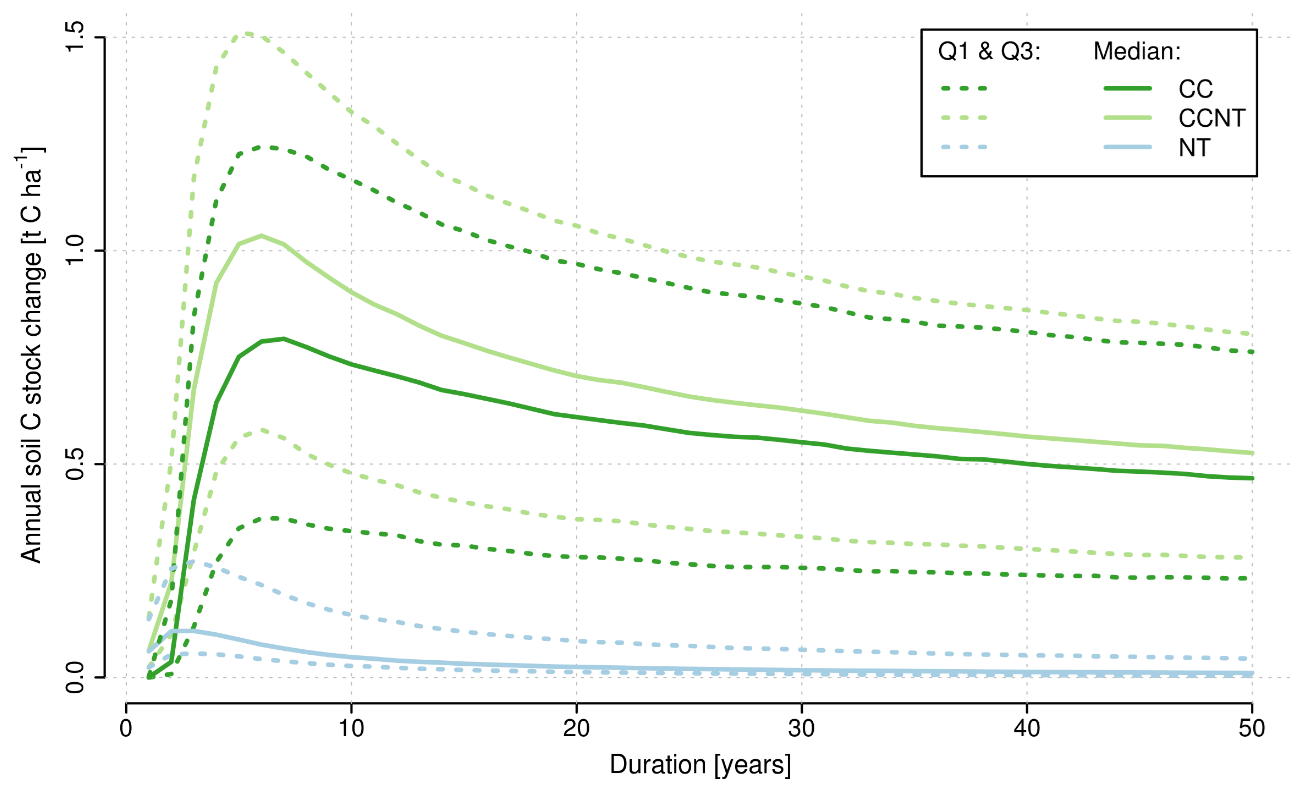
Figure 1Aggregated area-weighted median across global cropland (∼ 1500×106 ha) of average annual soil C sequestration rates (Eq. 1) in t C ha−1 yr−1 as solid lines and the first (Q1) and third (Q3) quartiles as dashed lines per alternative land management scenario (CC: dark green; CCNT: light green; NT: light blue) compared to the baseline (REF) over the 50-year simulation period.
3.2 Simulated impacts of land management on soil N and water dynamics
All three alternative management scenarios exhibited higher transpiration but lower evaporation rates than found in the baseline (Fig. 2a and b). In both cover crop simulations (CC and CCNT) the transpiration rates were higher because of the extended vegetative growth per cropland area unit compared to scenarios with the bare-soil fallow during primary crop off-season periods (REF and NT). With CC, transpiration increased more strongly than evaporation was reduced, so that total evapotranspiration water fluxes were higher than in REF. In CCNT and NT, we found lowered evaporation rates outweighing elevated transpiration rates compared to in REF with tillage. Cover crops in CC and CCNT led to lower but still positive median N net-mineralization rates (as the difference of soil N gross mineralization and immobilization rates) compared to the bare-soil fallowing practices in REF and NT (Fig. 2c). This decline was driven by larger increases in the soil N immobilization than in gross mineralization rates, especially within the first 10 years after the introduction of cover crop practices (Fig. S2.3). In both cover crop scenarios (CC and CCNT) N leaching rate shares of applied mineral N fertilizer were decreased faster and more strongly than in NT compared to in REF over the course of the simulation period (Fig. 2d). After the first 3 initial years the N leaching rate responses were stabilizing for all three alternative scenarios.
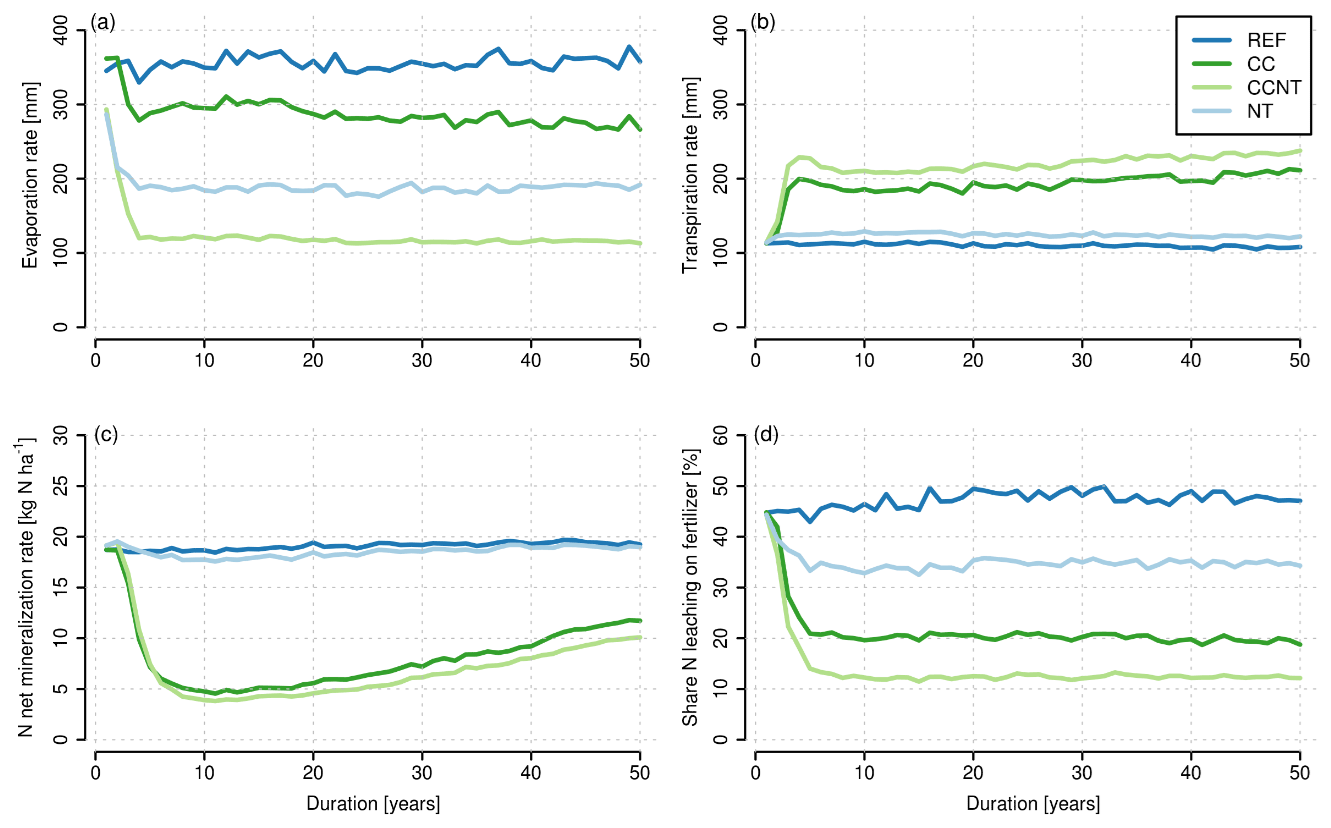
Figure 2Plots in panel display the time series for the 50-year simulation period of the annual global spatially aggregated area-weighted median per hectare cropland (∼ 1500×106 ha) as lines per management scenario (REF: dark blue; CC: dark green; CCNT: light green; NT: light blue) for (a) evaporation rate in millimeters, (b) transpiration rate in millimeters, (c) soil N net-mineralization rate in kg N ha−1 (derived as absolute difference between soil gross N mineralization and immobilization rates), and (d) shares of annual soil N loss through leaching of applied mineral N fertilizer rate in percent (%).
The relative differences in soil N leaching rates compared to the baseline (REF) are illustrated in Fig. 3 and indicate a reduction in the majority of global cropland in all three alternative soil management scenarios (for the respective spatial pattern of changes obtained for the cover crop scenario (CC), see Fig. S2.1.2). Larger reductions and lower spatial variation are generally found during the last decades of the 50-year simulation period compared to during the first decades. Median reductions in N leaching rates in simulations including cover crops (CC and CCNT) were about 2 to 3 times higher than in NT.

Figure 3Boxplots of relative differences (%) per hectare cropland (∼ 1500×106 ha) between annual N leaching rates in each of the simulated alternative management scenarios (CC, CCNT, and NT) compared to the baseline (REF) in the first (left bars, cyan) and last decades (right bars, blue) of the 50-year simulation period. The black mid-lines of boxes indicate the median responses per period, hinges of boxes show the first (Q1) and third (Q3) quartiles, and whiskers extend both to the minimum and maximum values within 1.5 times the interquartile range (IQR) of the distribution (outliers, defined as values outside this range are not shown here).
3.3 Yield change in following main crop due to altered management and duration
The simulated impacts of cover crop cultivation (CC) on the following main-crop yields exhibited large spatial variability and differences of effects between the analyzed crop types. The productivity for maize and rice in northern cold and tropical humid climates was lowered with cover crops (CC), whereas drier temperate regions, e.g., in the western USA and the Mediterranean, reveal prominently enhanced average yield effects for the four assessed crop types (Fig. 4).

Figure 4Maps (a)–(d) showing changes in averaged rainfed and irrigated main-crop productivity in response to cover crops (CC) compared to the scenario with bare fallow on cropland during main-crop off-season periods (REF) as annual median relative differences in percent (%) per hectare of crop-specific cropland and grid cell (pattern of the year 2010, Sect. 2.3) for wheat, rice, maize, and soybean for the 50-year simulation period.
Comparing the changes across the alternative management scenarios, following main-crop average productivity decreased most strongly in CC and increased most in NT relative to the baseline with tillage and bare-soil fallow practices (REF) (Fig. 5a–d). In CC, rice yield declines were the largest, whereas the reduction for this crop type was halved on the majority of global cropland in the CCNT simulation. In contrast to the mostly lowered maize yield in CC, we found positive median responses for this crop type in CCNT but with higher spatial variability of impact magnitude and direction (Fig. 6, Table S2.2). Wheat yield responses to any of the three alternative managements were very low in overall magnitude, being slightly reduced in both cover crop scenarios but improved in NT (Fig. 5, Table S2.2). Soybean yield responded positively to all simulated alternative management practices, although with a median of less than 1 % in CC, and we calculated around 9 % higher medians in CCNT and NT compared to in REF.
Exploring simulated land management impacts on the following main-crop productivity separated by water regimes revealed larger spatial variability of responses for rainfed than for irrigated crop yields (Fig. S2.4). Soybeans in irrigated systems show no response to altered management practices. For the other assessed cereal crop types, median yield responses to cover crop practices (CC, CCNT) were found to be either more negative or changing from a positive to a negative response in irrigated systems compared to rainfed systems.
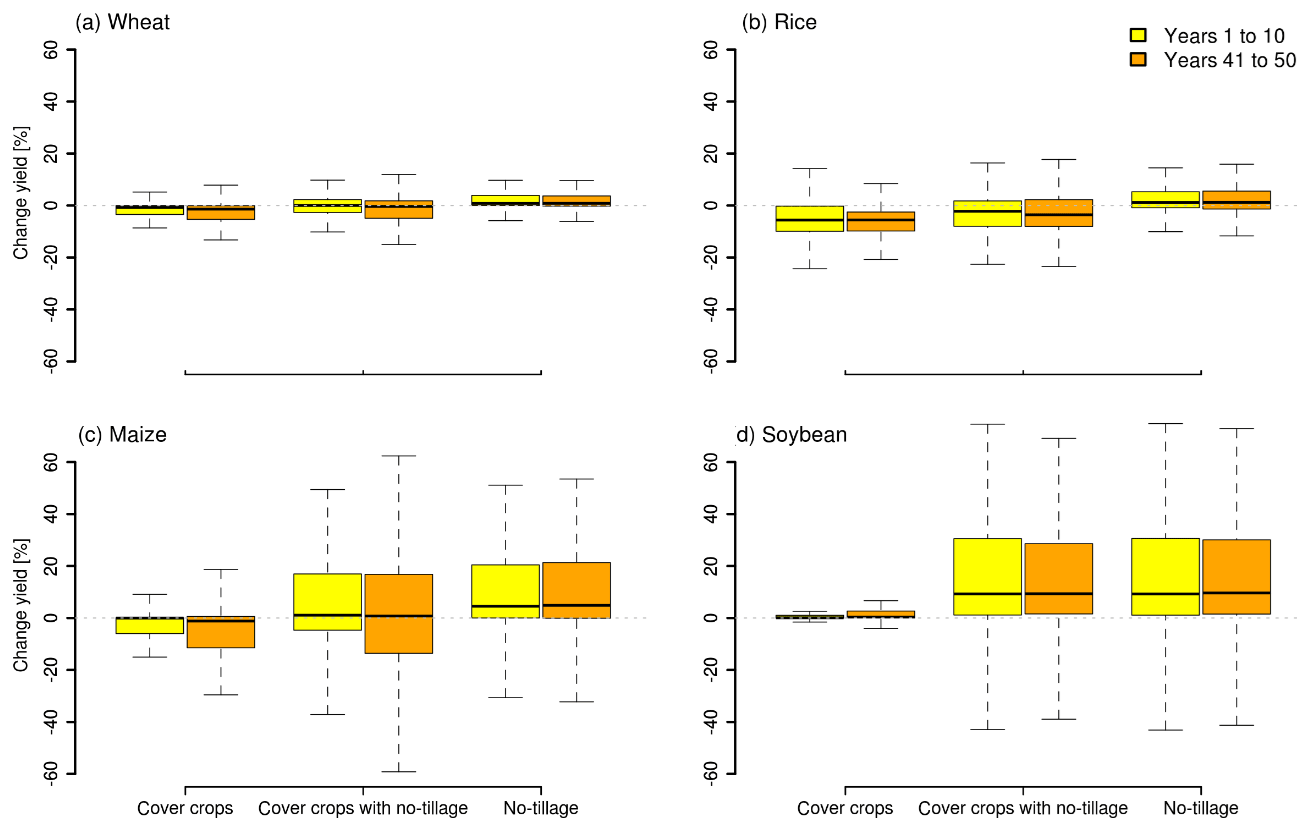
Figure 5Panels (a)–(d) displaying changes in wheat, rice, maize, and soybean average yields as boxplots of relative differences in percent (%) area-weighted by crop-specific physical cropland, due to alternative management practices (CC, CCNT, and NT) compared to the baseline scenario (REF) for the first (left bars, yellow) and last decades (right bars, orange) of the 50-year simulation period. Boxes' black mid-lines indicate the spatial median across the distribution of responses, the lower and upper edges of the boxes the first and third quartiles, and whiskers extending both to the minimum and maximum values within 1.5 times the interquartile range from each Q1 and Q3 (outliers, defined as values outside this range are not shown here). The boxplots show the distribution of calculated responses across total crop-specific irrigated and rainfed physical cropland used for the year 2010 for wheat (∼ 333×106 ha), maize (∼ 369×106 ha), rice (∼ 132×106 ha), and soybean (∼ 94×106 ha). Irrigated shares of total global crop-specific physical cropland were 16 % for wheat, 12 % for maize, 35 % for rice, and 11 % for soybean cropping system area (Sect. 2.3).
3.4 Cover crop and no-tillage impacts on conservation agriculture cropland
Applying the obtained responses to altered land management practices to the temporal and spatial pattern of the mapped CA cropland time series dataset (Sect. S1.4), we found the lowest soil C sequestration rates and reductions in N leaching rates assuming no-tillage practices and the highest ones for combined cover crop and no-tillage practices (Table S2.5). We calculated aggregated median soil C sequestration rates of 0.27 t C ha−1 yr−1 for having no tillage and bare-soil fallowing, 0.47 t C ha−1 yr−1 for cover crops with tillage, and 0.85 t C ha−1 yr−1 for cover crops with no tillage. We estimated the total historical soil C net accumulation by CA practices on the mapped cropland to range between 0.4–1.4 PgC in the period 1974–2010, depending on the management practice. For the annual N leaching rates, we find the reduction by the single or by the combined adoption of having no tillage and cover crop practices ranging between 18.4 %–56.9 % across global CA area compared to cropping systems with conventional tillage and bare-soil fallowing practices.
We found average yields of the four main crops mostly enhanced with having no tillage, whereas for a cover crop with tillage practices the productivity response was neutral or revealed decreases. In response to cover crops applied with no-tillage practices (CCNT), the scenario we used as a proxy for the full set of CA practices, positive yield changes (Fig. 6) dominate in areas mapped with conservation agriculture practices (Fig. S1.4).
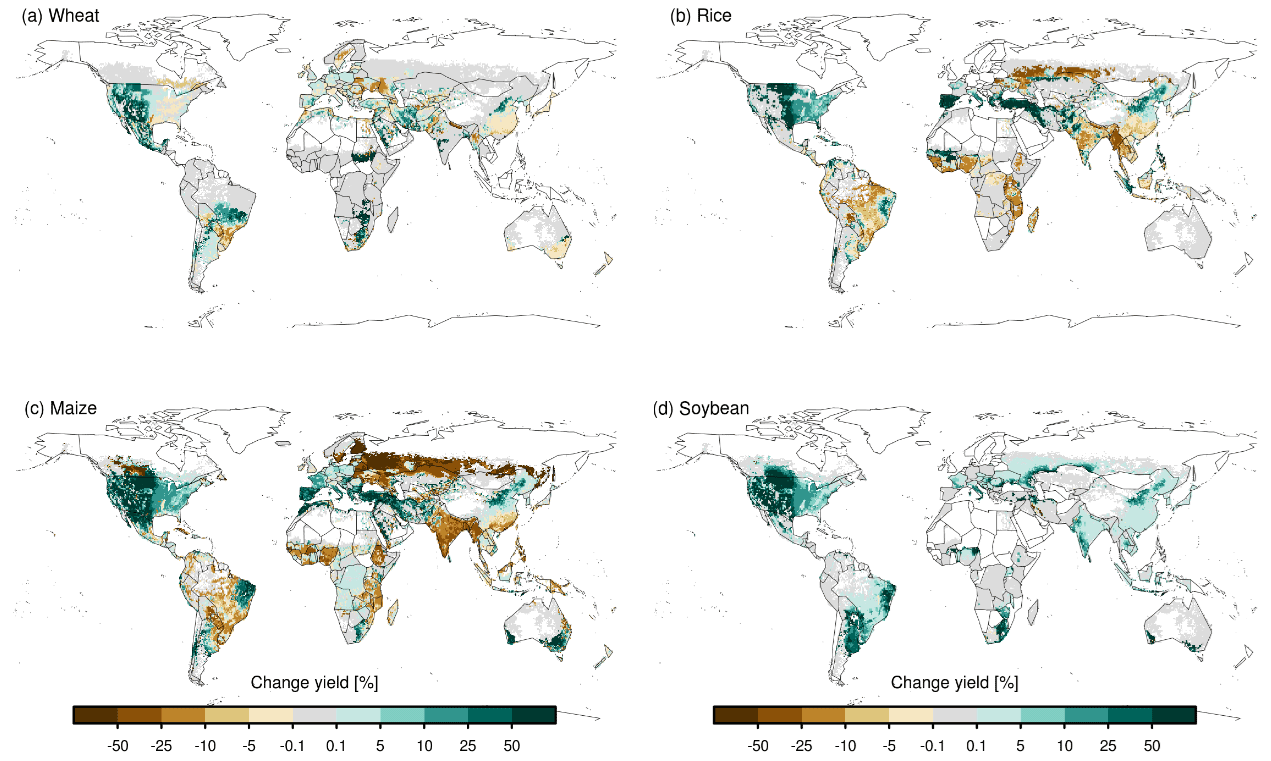
Figure 6Maps (a)–(d) showing changes in main-crop average productivity in response to cover crop practices combined with no-tillage (CCNT) compared to the baseline scenario with conventional tillage and bare fallow on cropland during main-crop off-season periods (REF) as annual area-weighted median relative differences in percent (%) of crop-specific cropland and grid cell (pattern of the year 2010, Sect. 2.3) for wheat, rice, maize, and soybean for the 50-year simulation period.
Calculating median (quartiles) for yield changes in CA areas only, we found that the average productivity (median (quartiles)) of wheat, maize, and soybean was almost exclusively enhanced for cover crop with no tillage (6.4 (0.2, 29.4) %, 23.7 (3.3, 84.1) %, 27.8 (3.1, 79.0) %, respectively). Although rice yield largely increased with the combined practices, it was lowered as well (5.6 (−3.1, 34.8) %).
4.1 Overview of simulated responses to cover crop practices compared to other studies' findings
Simulated cover crop impacts exhibit positive soil carbon sequestration rates and reduced N leaching rates on the majority of global cropland but at the cost of largely lowered average yields of the following main crops in both analyzed decades (Table 1; see Table S2.2 for respective aggregated results per decade for CCNT and NT). The changes estimated here in agroecosystem components due to cover crops (CC) compared to bare-soil fallow (REF) on cropland between two consecutive main-crop growing seasons are consistent with the magnitude and direction of effects reported in other studies (Table 1; see Table S2.6 for an extended comparison to literature values).
4.2 Soil carbon sequestration
The generated median soil C sequestration rates for the simulation with cover crops replacing bare-soil fallow periods were within the upper end of the range of values reported in the literature (Tables 1, S2.6). A few regions in temperate and dry climatic conditions, e.g., in the western USA, Turkey, Iraq, and Iran, reveal a neutral or declining trend in response to cover crop cultivation (Fig. S2.1.1). In line with findings of West and Six (2007), we found the highest soil C sequestration potential in tropical regions (e.g., South-East Asia and central western Brazil), whereas Stockmann et al. (2013) derive the largest potential for temperate humid regions. Abdalla et al. (2019) find both regions profiting from cover crop practices because there, water is a less limiting factor to biomass production and additional inputs to the soil pools provided by cover crops enhance soil C accumulation.
Assuming the median soil C sequestration rate of 0.55 t C ha−1 yr−1 (or mean of 0.61 t C ha−1 yr−1) during a period of 50 years for the estimated 400×106 ha cropland potentially available annually for cover crop practices (Kaye and Quemada, 2017; Poeplau and Don, 2015), we estimated the global potential soil C sequestration of 0.22 or 0.24 PgC yr−1 in the top 30 cm. This equates to about 7 %–12 % of the 2–3 PgC yr−1 annual sequestration on global agricultural soils until the year 2030 targeted by the “4per1000” initiative (Minasny et al., 2017). However, our estimate is higher than the 0.12 ± 0.03 PgC yr−1 (mean and standard deviation) found by Poeplau and Don (2015) simulating cover crops effects with the RothC model for a similar time frame but for 0–22 cm soil depth.
Lower annual median soil C sequestration rates with cover crops (CC) in the first 3 simulation years reveal a time lag of response to altered management (Fig. 1). A similar effect is also apparent for N and water fluxes (Fig. 2). On the one hand, this may be because cover crops are first established at the end of the first main-crop growing season, so that the full effect becomes visible in the second year only. On the other hand, a temporal delay of detectable cover crop impacts on soil organic C concentration within the first years of practice was also found in the review of ecosystem services of cover crop practices by Blanco-Canqui et al. (2015), due to the complexity of biophysical processes affected by changes in biomass inputs to soils due to altered management practices. This suggests that cover crops need to be cultivated for at least 3 years to take effect. Duration, as the number of years a system has been under a management practice, was also identified as one of the most important factors to reap the benefits of altered soil physical properties from soil C storage enhancing management, such as cover crop practices (Laborde et al., 2020; Nouri et al., 2020; West and Six, 2007).
The higher soil C sequestration rates calculated for the first decade of the 50-year simulation period compared to the last decade (Table 1, Fig. 1) are in line with other studies' estimates as well. For example, Sommer and Bossio (2014), assumed that their soil C sequestration rate functions for their simulations of cover crop impacts peaked between the third and seventh year of continuous practice and then leveled off after about 20 to 40 years. Corsi et al. (2012) in their meta-analysis of the effects of CA practices found a decreasing rate of soil C sequestration between the 5th and 20th years. The decreased change rates towards the end of the 50-year simulation period suggest a saturation effect (for cover crops later than for no tillage), when soil C and N pools approach a new equilibrium state, as discussed by Kaye and Quemada (2017), Poeplau and Don (2015), and Smith (2016). However, the new equilibrium of soil C (Corbeels et al., 2018; Poeplau and Don, 2015) were not reached in our simulations for the majority of global cropland for CC or CCNT within the analyzed 50 years. For NT, half of global cropland reached the new equilibrium after 12 years. Our assumption on “equilibrium” as an effect detected in our alternative management simulations on global cropland was based on Poeplau and Don (2015), who define the new steady state as being reached after the annual change in the soil organic C stock falls below 0.01 Mg C ha−1 yr−1 in response to altered management.
The soil carbon sequestration effect of no-tillage practices simulated with LPJml5.0-tillage have been evaluated in Lutz et al. (2019), who used a preceding model code version to the one employed here but used another simulation setup and different main-crop residue management settings. They calculated a median soil C stock increase of 5.3 % (after 10 years) for their stylized no-tillage scenario by retaining all main-crop residues on the field after harvest and −18 % (after 20 years) in their other management no-tillage scenario with 90 % main-crop residue removal rates. However, in our simulation main-crop residue removal rates vary across global gridded cropland (see Sect. 2.3), and therefore the modeled results by Lutz et al. (2019) can only partly be compared to our values (relative differences of 2 % for CCNT to CC and 1.3 % for NT to REF).
The median soil C sequestration rate for both cover crop scenarios (CC and CCNT) were higher than for no tillage (NT) (Fig. 1, Tables 1, S2.6), which is in line with findings of the review by Kaye and Quemada (2017). The effect of combined cover crop and no-tillage practices (CCNT) exhibited the largest soil C sequestration rate with a median of 0.72 t C ha−1 yr−1 in the first decade. Our results were higher than Franzluebbers (2010), finding a soil C sequestration rate of 0.45 ± 0.04 t C ha−1 yr−1 for experiments comparing cover crops combined with tillage and with no tillage in the southeast USA for about 11 years, and they were within the range stated in the meta-analysis of experiments conducted in Brazil (0.4–1.9 t C ha−1 yr−1) and France (0.1–0.4 t C ha−1 yr−1) with a duration of 5–28 years by Scopel et al. (2013). The simulated higher effect of cover crops combined with no tillage (CCNT) on soil C stocks is also supported by Corbeels et al. (2018) finding higher soil C stocks in the case of CA compared to conventionally tilled systems, whereas Abdalla et al. (2019) and Poeplau and Don (2015) find no significant differences due to changed tillage practices with cover crops in their meta-analyses.
4.3 Nitrogen leaching
The derived N leaching rate reduction in CC were at the upper end of the −70 % to −50 % range of effects reported in the literature (Tables 1, S2.6), except during the initial simulation years after the introduction of the alternative management practice. The majority of values found for changes due to cover crops reported in other studies and used here for comparison to our obtained simulation results are for rainfed cropping systems, or detailed management information on irrigation practices was missing (Table S2.6). However, Quemada et al. (2013), explicitly focusing in their meta-analysis on cover crop effects replacing bare fallows in irrigated cropping systems, also state a reduction in N leaching rate by 50 % with non-leguminous cover crop species but no effects in experiments with leguminous cover crop types.
For the spatial effects of cover crops (CC), it can be shown that most cropland can profit from about halved N leaching rates (Figs. 3, S2.1.2). One important driver of the size of the effect of cover crops is the length of the fallow season. In northern regions, main-crop growing seasons are rather short and aligned across crop types, so that a lot of off-season cropland area is available for cover crops for a relatively longer time. The largest N leaching rate reduction with simulated cover crop practices can be found in cold temperate regions (such as in Russia) and in the humid tropics (e.g., large parts of Africa), where external N inputs (i.e., mineral N fertilizer rates; also see Sect. S1.2 for rates used here) are rather low. On the one hand, the variance of simulated cover crop effects across global cropland can be attributed to management intensity (e.g., fertilizer application rates), in this study prominently seen as differences at some national borders (USA and Canada). According to Wittwer et al. (2017) the efficiency of cover crops to reduce N leaching decreases with management intensity (including fertilizer application rates and tillage practices). On the other hand, the spatial variance of cover crop effects within countries suggests differences due to soil and climatic conditions. Only few drier regions reveal either a neutral response or a slight increase in N leaching rates due to cover crops (Fig. S2.1.2). This can be attributed to reduced growth of cover crops, limiting their capacity for N uptake of excess N remaining in the soil column after the harvest of the main crop. Cover crops were also found to increase transpiration while reducing drainage (Meyer et al., 2018), which leads to lower soil water percolation (Abdalla et al., 2019) and restricts the advective export of reactive N from the soil. However, in dry regions, depending on the area share and the type of irrigation system, the additional water applied to fields can result in enhanced drainage. The effect is pronounced for surface irrigation and weaker for drip irrigation. As a result, for irrigated cropping systems in dry areas, N leaching may increase with cover crop practices due to increased biomass inputs to soil which lead to increased N in the soil water solution as a result of decomposition processes of the added plant material.
Because the plant material from cover crops that drives the C sequestration with the practices (Sects. 3.1, 4.2) has a wider C-to-N ratio than the soils, it leads to stronger immobilization of mineral N in the soil column (Fig. S2.3). Increased evapotranspiration and immobilization but also uptake of N by cover crop plants were found to reduce the soil N (Quemada et al., 2013; Thapa et al., 2018; Zhu et al., 2012), which would be susceptible to leaching from cropland soils during primary crop off-season periods (Abdalla et al., 2019; Alonso-Ayuso et al., 2014; Delgado et al., 2007; Tonitto et al., 2006). For their efficiency in N uptake, grass cover crops are also described as “scavengers” (Blanco-Canqui et al., 2015). Therefore, grass cover crops can be regarded as especially suitable for high-input farming systems, where surplus N left in the soil after the harvest of the main crop can be retained in the biomass of the cover crop. After termination, the C and N contained in the cover crop biomass can serve as “green manure” temporally fixed in compounds of the soil organic matter (Zomer et al., 2017).
4.4 Crop yields
The average main-crop yield change computed for the cover crop scenario (CC) was mostly within the range of values found in the literature, but effects vary largely per crop type and location considered (Tables 1, S2.6). Reduced productivity levels of the following main crop are reported mostly in the context of competition with the cover crops for water and nutrients (Abdalla et al., 2019; Tonitto et al., 2006; Valkama et al., 2015). The increased immobilization of soil N after the introduction of cover crops is thought to actually exacerbate N stress (Abdalla et al., 2019; Erenstein, 2003; Kuo and Sainju, 1998; Ranaivoson et al., 2019). Marcillo and Miguez (2017) assume that lower maize yields found with cover crops may also be caused by a temporal asynchrony between periods of soil N mineralization and high N demand of the main crop. Several authors (Marcillo and Miguez, 2017; Thapa et al., 2018; Tonitto et al., 2006) report no significant effects of non-leguminous cover crop species on yields of the subsequent main crop, which may be caused by the mainly intensively fertilized experiments considered, e.g., in Tonitto et al. (2006). This is in line with our findings for soybean, which is an N fixer (not subject to N limitations in LPJmL) and sees hardly any yield penalty from cover crops. Also, the mostly negative responses to cover crops (CC) for the three cereal crop types in irrigated systems (Fig. S2.4.2), where water is not a growth-limiting factor for the main crop, can only be explained by a decrease in N availability for the main crop. In the meta-analysis by Quemada et al. (2013) a reduction in irrigated main-crop yields by 3 % was found due to cover crops, an effect which is slightly higher than the decadal median reductions in the following main-crop yields by 2.5 % and 2.9 % (average across changes in irrigated wheat, rice, maize, and soybean yields for the first and last decade of the 50-year simulation period). The generated results for irrigated soybean productivity reveal no sensitivity to cover crop and changes in tillage practices (Fig. S2.4.2). In our simulations the majority of cropland of wheat maize, rice, and soybean was rainfed (see caption of Fig. 5). Therefore, the neutral or positive responses found of following main-crop average yield to cover crop practices for temperate dry areas in the US and the Mediterranean region may result from the relatively higher mineral N fertilizer application rates there (Fig. S1.2) and larger shares of irrigated cropping system area on cropland per grid cell, wherein the effects of cover crops' competition for water and nutrients with the following main crop are diminished. Cover crops affect soil water in different ways: cover crops tend to increase transpiration (see Fig. 2b) but at the same time reduce soil evaporation (Fig. 2a) and increase infiltration (Dabney et al., 2001). Depending on the relative magnitude of these processes, soil water availability for the main crop can increase or decrease at different locations. This is clearly shown in Fig. S2.4, where yield responses to cover crops in rainfed systems reveal a much larger variability than in irrigated systems. The spatial variability of yield responses to cover crops for different crops (Figs. 4 and 5) is the result of differences in how cover crops impact water availability of the main crop, how water-limited the main crop is, and how strongly the cover crop reduces N availability for the main crop. However, sensitivity to changes in water availability is highest in rainfed systems in water-limited environments, and on soil types of low soil water holding capacity or insufficient recharge, which limits their applicability under such conditions (Marcillo and Miguez, 2017).
In contrast to CC, a mostly enhancing effect on productivity was found with the NT scenario for all four analyzed main-crop types. Also, for wheat, maize, and soybean, Su et al. (2021) find that although no tillage could lead to yield declines in cooler and wetter regions, this loss was more than compensated at the global scale by increased productivity in arid rainfed cropping areas. In our model, the yield increase can mainly be attributed to the water-saving effects simulated with no tillage compared to both the REF and the CC scenarios with conventional tillage (Figs. 2, 5). This is caused by the build-up of a litter layer due to simulated no-tillage practices covering the soil as mulch, which increases infiltration rates as well as reducing evaporation and surface runoff rates, mainly benefitting soil water dynamics and crop productivity in arid regions (Jägermeyr et al., 2016; Lutz et al., 2019). Lutz et al. (2019) estimated the difference between tillage to no tillage for rainfed yields of wheat to have a median of 2.5 % in the simulation with all main-crop residues retained and −5.9 % with 90 % of the residues extracted from the field. For rainfed maize yields they found 1.8 % median increases in their simulation with all main-crop residues retained and −5 % when 90 % of residues were extracted after 10 years since the introduction of no-tillage practices. Our calculated changes in yields due to having no tillage are within these ranges (rainfed wheat: 1.7 % for CCNT to CC and 1.3 % NT to REF; rainfed maize: 4.8 % for CCNT to CC and 6.3 % for NT to REF as aggregated relative differences for the simulated years 9–11).
In CCNT, the simulated effects of cover cops and having no tillage are combined. Cover crops provide vegetative soil cover on cropland during the main-crop off-season, and when terminated serve as additional mulching material during the following main-crop growing periods. This additional mulch layer in combination with no tillage counteracts the higher transpiration from cover crops by improving infiltration and reducing evaporation (Abdalla et al., 2019; Scopel et al., 2013). Enhanced median maize and soybean yields as well as less rice yield reductions found with CCNT than with CC compared to REF (Tables 1, S2.4), reveal co-benefits of both practices (Fig. 5). The assumption of synergetic effects of both practices in CCNT was supported by the even higher median yield responses derived here for cropland with conservation agriculture practices (Sect. 3.4), an area which was mapped with a higher likelihood to arid regions (Porwollik et al., 2019). Laborde et al. (2020) find higher likelihoods of beneficial main-crop yield effects of CA for rainfed cropping systems in areas with higher temperature (above 20 ∘C) and lower precipitation rates (<350 mm), due to water preservation, when the mulching practices reduce evaporation losses compared to experiments with conventional land management practices.
The yield responses presented here to different management settings (NT, CCNT) are only partly in line with findings of Pittelkow et al. (2015), analyzing experiments lasting 1–31 years, which find the largest declines (−9.9 %) when having no tillage was adopted alone and decreased negative effects (−6.2 %) when no tillage was applied with crop rotation. However, cover crops as modeled in our CCNT scenario are only one aspect of crop rotation enhancement considered in the analyses by Pittelkow et al. (2015), which limits the comparability between our and their findings.
4.5 Methodological limitations and implications
A detailed evaluation of the implemented model code functionalities for the representation of cover crop practices remains challenging, due to the limited available statistical data on the practice at the global scale. We mainly focused the comparison of modeled effects on findings of meta-analyses and reviews. The results indicate in the general reliability of the model version LPJml5.0-tillage-cc used here to reproduce ranges of reported temporal and spatial patterns, magnitude, and the sign of direction of simulated cover crop impacts at the global scale (Table 1). However, aggregated changes in agroecosystem variables due to cover crop cultivation (CC) compared to the bare fallowing practices presented here did not always match other studies' findings (Table S2.6). On the one hand, these deviations may result from different soil depths considered or meta-analysis reporting averages across different years, crop types, and experiments (Nyawira et al., 2016). Further uncertainties are related to literature values, which may include experiment results from measurements during the main-crop growing season only instead of covering the entire year (Quemada et al., 2013). Values derived from field experiments or reported at the national scale (Table S2.6) may reflect changes due to local specific and highly controlled crop production conditions rather than covering the variance of environmental and socio-economic conditions captured with the global gridded model setup applied in our analysis. On the other hand, important processes that determine the effect of cover crops in field trials, such as erosion, weeds, pests, or diseases, are not accounted for in this model version.
For the 50-year simulation period we used dynamic historical climate model input data for the years 1962–2011 and all stylized management scenarios were introduced from the year 1962 onwards. Therefore, the first decade after the introduction of the practice is not directly comparable to the last decade in terms of environmental cropping system conditions, but we assume this error to be small, given that we average over larger areas and report differences to values obtained in the baseline scenario that always refers to the same simulated period when reporting our results.
Further, our simulations include changes in atmospheric CO2 concentration levels during the spin-up and historical simulation period, which affect soil C dynamics as well, through biomass growth feedbacks but also temperature and soil moisture effects driving decomposition of the soil organic carbon in cropland soils (Herzfeld et al., 2021). However, some of the field experiments to which we compare our simulated management results have been conducted over comparable time periods (up to 54 years) and are therefore affected by increasing atmospheric CO2 concentration levels during the near-past period, as well.
The high C sequestration rates calculated for CC, e.g., in the humid tropics (Fig. S2.1.1), may be due to an overestimation of the simulated fallow period length for cropland in this climatic region. In the model version used here, only the main representative growing season of a crop is simulated per year, so that multiple cropping practices for areas where several crop harvests per year are common (Siebert et al., 2010; Waha et al., 2020) are not well covered, resulting in distorted cover crop productivity levels and biomass input to the soil pools.
The model setting applied here for the representation of irrigated cropland in the simulations, assuming unlimited water availability for irrigation practices, may cause an overestimation of main-crop productivity as well as resulting main-crop residue input amounts to the soil pools.
The computed initial soil C pools do not represent the conditions on current croplands because our simulations excluded historical land use dynamics, to which responses in soil are usually slow and long-term (Nyawira et al., 2016). Pugh et al. (2015) find, that the soil legacy flux from land use and land cover change may dominate ecosystem carbon losses for a timescale of up to a century. By starting the simulations from soil C pools in equilibrium, we aimed to make sure that the acquired response is due to altered management. The deviations in initial soil C and N pools were accounted for in this study by presenting responses to alternative management scenarios (CC, CCNT, NT) in relation to the baseline scenario (REF).
The simulated crop-specific yield reductions and gains in soil carbon storage obtained at the grid scale for the cover crop management scenarios (CC and CCNT) as a trade-off cannot always be linked directly, due to the missing accounting of emissions associated with the changes in management in our study. Further, modeled responses to cover crop cultivation are determined by the spatial pattern of the crop type, the area share within a grid cell, the crop-specific growing season length, fertilizer application rates (Fig. S1.2b), the water regime (Sect. S2.4), and other crop management modeled at the grid scale.
The potential trade-off between environmental benefits (reduced N leaching, soil C sequestration) and main-crop productivity changes found here for cover crops with conventional tillage practices suggests the requirement for the complementary modification of fertilizer management and of main-crop irrigation or the parallel adoption of soil water preserving practices, such as having no tillage, and mulching practices to maintain current main-crop yield levels.
Our findings on nearly neutral effects on the four analyzed following main-crop yields in irrigated cropping systems with cover crops (CC) may result from the potential irrigation setting used here in the management scenarios providing unlimited water amounts to completely satisfy main-crop plant growth requirements during the entire growing season. The results obtained may underestimate yield declining effects because local specific limitations to irrigation water withdrawal amounts are not accounted for in our analysis. However, it can be assumed that increased irrigation water requirements because of the increased evapotranspiration losses from cover crops may constrain main-crop yield gains obtained with irrigation when adopting the practice with conventional tillage in dry areas.
This study is the first to consider combined cover crop and no-tillage effects as practices recommended under CA employing modeled results and the generated annual gridded CA area time series dataset. However, we assume that the method employed here for mapping CA area led to several uncertainties of estimated effects on agroecosystem components. The downscaling approach of national reported CA area to the grid scale targeted a coarser resolution than used in Porwollik et al. (2019) and also included the entire cropland within a grid cell assumed under this practice, independent of the crop type and water regime of the cropland, whereas in the previous approach only rainfed cropping system area was regarded as suitable. The national CA area statistics reported in the FAO also includes the area of perennial crop types, which in LPJmL are represented as the CFT “others” with annual growth dynamics only, and of grassland, the dynamics of which are not included in our analysis.
Further, our management simulation scenarios do not include a change in main-crop residue removal rates, and the here assumed reside removal rates may lead to deviations from minimum levels of 30 % soil surface cover by biomass remaining on the field after harvest required by CA. Also, secondary usages of cropland products are likely, so that our estimates of cover crop biomass input rates on the mapped historical CA area maybe overestimations, when assuming all cover crop biomass remains on the field in the CC and CCNT scenarios. Nevertheless, the dataset was used as model input data for simulating historical tillage and no-tillage practices in Herzfeld et al. (2021) to assess global soil C dynamics. The “partial adoption” of CA practices, which mostly refers to the adoption of reduced tillage but not necessarily to the diversification of the crop rotation and the soil cover management as suggested under CA was discussed as uncertainty related to reported CA area included in the national FAO statistics (Porwollik et al., 2019; Prestele et al., 2018). Therefore, the uncertainty of the historical ecosystem services provided by historical CA cropping systems due to reporting schemes in the literature and statistics as well as the model used here, mapping, and calculation approaches may be better reflected by the range of values obtained for the three alternative management practices assessed here (Table S2.5). Obtained results exhibit large variations across space, time, and management scenarios, so that upscaling efforts of the practice need to account for differences in environmental and socio-economic conditions of cropping systems.
Further global-scale modeling assessments of sustainable land management practices may include leguminous (N fixing) cover crop species or mixtures of them with the grass type presented here. Production costs associated with additional irrigation water requirement and seed purchase for cover cropping (Alonso-Ayuso et al., 2020) and opportunity costs for field activities of the farmer in otherwise off-season periods (Lee and Thierfelder, 2017) need to be evaluated in integrated assessments against the environmental benefits from cover crop practices (Blanco-Canqui et al., 2015). Further studies are needed for the quantification of cover crop impacts with climate change and to explore options for adaptation of the practice to regionally specific environmental and economic conditions, influencing farming decisions and land management practices.
This study presents the first global temporal and spatially explicit quantification of the impacts of cover crop cultivation in combination with tillage practices. The routines of cover crops implemented into LPJmL5.0-tillage-cc allow for consistent, global-scale assessments of biophysical, biogeochemical, and agronomic effects, such as on mapped CA cropland during the period 1974 to 2010 and for exploring potentials of sustainable cropland management practices.
We found, that cover crops enable soil C sequestration and reduce N losses through leaching on the majority of global cropland, except in few and mostly unproductive arid regions. Cover crops with conventional tillage practices increase evapotranspiration fluxes and decrease soil N net-mineralization rates compared to bare-soil fallowing practices by lowering plant-available soil water and nitrogen, leading to reduced growth and yield of the following main crop. Declining average yield effects due to cover crops were found for rice but also for maize and wheat, most pronounced for cropping areas in northern cold climatic regions. Enhanced productivities with cover crops and tillage for these three staple crops were depicted for temperate regions with high mineral N fertilizer application rates and for almost all soybean production.
The yield responses to altered management generated for all four crop types were rather constant over time, whereas for changes in soil N leaching rate and C sequestration pronounced temporal dynamics were found. For soil C sequestration and N leaching the sign of changes was mostly homogenous across global cropland, whereas for productivity, the direction and magnitude of changes vary considerably among crop types and for different world regions.
For cover crops applied with having no tillage (CCNT), both the soil C sequestration rate and the reduction in N leaching were the largest. The combined practices take advantage of the additional biomass production by cover crops and of the soil water saving effects associated with having no tillage, which results in increasing inputs to the soil, improved nutrient cycling, and substantially reduced rainfed crop yield penalties.
We conclude from the findings that the heterogeneity of cover crop impacts on C, N, and water processes are determined by the primary crop type cultivated, water regime (rainfed or irrigated), tillage and mulching practices, location, and management duration. This study's results demonstrate the potential role of cover crop practices as a nature-based solution (Keestra et al., 2018) to transform croplands to C sinks for climate change mitigation and the reduction in environmental impacts of arable production without compromising food security targets.
The LPJml5.0-tillage-cc model code version, model output data, and R scripts used for post-processing data accompanying this study are available online at the Zenodo data repository: https://doi.org/10.5281/zenodo.5178070 (Porwollik et al., 2021).
The supplement related to this article is available online at: https://doi.org/10.5194/bg-19-957-2022-supplement.
VP, CM, SR, and JH designed the research. VP and CM implemented the cover crop code functionalities with the support of SR, SiS, JH, and WvB. VP generated the CA cropland dataset and conducted the simulations. VP and CM analyzed results. VP prepared the paper, and all co-authors contributed by commenting and editing.
The contact author has declared that neither they nor their co-authors have any competing interests.
Publisher's note: Copernicus Publications remains neutral with regard to jurisdictional claims in published maps and institutional affiliations.
We thank Tobias Herzfeld for support in model code development, Kristine Karstens for constructive discussions on cropland soil carbon, and Jan Kowalewski and Jannes Breier for data processing contributions.
Susanne Rolinski and Vera Porwollik received financial support throughout the MACMIT (grant no. 01LN1317A), Susanne Rolinski also from the CLIMASTEPPE (grant no. 01DJ18012) and Jens Heinke from the EXIMO (grant no. 01LP1903D) projects, all funded through the German Federal Ministry of Education and Research (BMBF).
This paper was edited by Akihiko Ito and reviewed by two anonymous referees.
Abdalla, M., Hastings, A., Cheng, K., Yue, Q., Chadwick, D., Espenberg, M., Truu, J., Rees, R. M., and Smith, P.: A critical review of the impacts of cover crops on nitrogen leaching, net greenhouse gas balance and crop productivity, Glob. Change Biol., 25, 2530–2543, https://doi.org/10.1111/gcb.14644, 2019.
Alexander, P., Brown, C., Arneth, A., Finnigan, J., Moran, D., and Rounsevell, M. D. A.: Losses, inefficiencies and waste in the global food system, Agr. Syst., 153, 190–200, https://doi.org/10.1016/j.agsy.2017.01.014, 2017.
Alonso-Ayuso, M., Gabriel, J. L., and Quemada, M.: The kill date as a management tool for cover cropping success, PLOS ONE, 9, e109587, https://doi.org/10.1371/journal.pone.0109587, 2014.
Alonso-Ayuso, M., Gabriel, J. L., Hontoria, C., Ibáñez, M. Á., and Quemada, M.: The cover crop termination choice to designing sustainable cropping systems, Eur. J. Agron., 114, 126000, https://doi.org/10.1016/j.eja.2020.126000, 2020.
Batjes, N. H.: ISRIC-WISE derived soil properties on a 5 by 5 arc-minutes global grid (version 1.1), Report 2006/02, ISRIC – World Soil Information, Wageningen [with data set], http://www.isric.org (last access: 3 February 2022), 2006.
Becker, A., Finger, P., Meyer-Christoffer, A., Rudolf, B., Schamm, K., Schneider, U., and Ziese, M.: A description of the global land-surface precipitation data products of the Global Precipitation Climatology Centre with sample applications including centennial (trend) analysis from 1901–present, Earth Syst. Sci. Data, 5, 71–99, https://doi.org/10.5194/essd-5-71-2013, 2013.
Blanco-Canqui, H., Shaver, T. M., Lindquist, J. L., Shapiro, C. A., Elmore, R. W., Francis, C. A., and Hergert, G. W.: Cover Crops and Ecosystem Services: Insights from Studies in Temperate Soils, Agron. J., 107, 2449–2474, https://doi.org/10.2134/agronj15.0086, 2015.
Bodirsky, B. L., Rolinski, S., Biewald, A., Weindl, I., Popp, A., and Lotze-Campen, H.: Global Food Demand Scenarios for the 21st Century, PLOS ONE, 10, e0139201, https://doi.org/10.1371/journal.pone.0139201, 2015.
Bondeau, A., Smith, P. C., Zaehle, S., Schaphoff, S., Lucht, W., Cramer, W., Gerten, D., Lotze-Campen, H., Müller, C., Reichstein, M., and Smith, B.: Modelling the role of agriculture for the 20th century global terrestrial carbon balance, Glob. Change Biol., 13, 679–706, https://doi.org/10.1111/j.1365-2486.2006.01305.x, 2007.
Corbeels, M., Cardinael, R., Naudin, K., Guibert, H., and Torquebiau, E.: The 4 per 1000 goal and soil carbon storage under agroforestry and conservation agriculture systems in sub-Saharan Africa, Soil Till. Res., 188, 16–26, https://doi.org/10.1016/j.still.2018.02.015, 2018.
Corsi, S., Friedrich, T., Kassam, A., Pisante, M., and Sà, J. d. M.: Soil organic carbon accumulation and greenhouse gas emission reductions from conservation agriculture: a literature review, Integrated Crop Management Vol. 16, Food and Agriculture Organization of the United Nations (FAO), Rome, 2012.
Dabney, S. M., Delgado, J. A., and Reeves, D. W.: Using winter cover crops to improve soil and water quality, Commun. Soil Sci. Plan., 32, 1221–1250, https://doi.org/10.1081/CSS-100104110, 2001.
Dabney, S. M., Delgado, J. A., Meisinger, J. J., Schomberg, H. H., Liebig, M. A., Kaspar, T., Mitchell, J., and Reeves, W.: Using cover crops and cropping systems for nitrogen management, in: Advances in Nitrogen Management for Water Quality, edited by: Delgado, J. A. and Follett, R. F., 9, USDA Agricultural Research Service, 2010.
Dee, D. P., Uppala, S. M., Simmons, A. J., Berrisford, P., Poli, P., Kobayashi, S., Andrae, U., Balmaseda, M. A., Balsamo, G., Bauer, P., Bechtold, P., Beljaars, A. C. M., van de Berg, L., Bidlot, J., Bormann, N., Delsol, C., Dragani, R., Fuentes, M., Geer, A. J., Haimberger, L., Healy, S. B., Hersbach, H., Hólm, E. V., Isaksen, L., Kållberg, P., Köhler, M., Matricardi, M., McNally, A. P., Monge-Sanz, B. M., Morcrette, J.-J., Park, B.-K., Peubey, C., de Rosnay, P., Tavolato, C., Thépaut, J.-N., and Vitart, F.: The ERA-Interim reanalysis: configuration and performance of the data assimilation system, Q. J. Roy. Meteor. Soc., 137, 553–597, https://doi.org/10.1002/qj.828, 2011.
Delgado, J. A., Dillon, M. A., Sparks, R. T., and Essah, S. Y.: A decade of advances in cover crops, J. Soil Water Conserv., 62, 110A–117A, 2007.
Dietrich, J. P., Baumstark, L., Wirth, S., Giannousakis, A., Rodrigues, R., Bodirsky, B. L., Kreidenweis, U., and Klein, D.: madratat: May All Data be Reproducible and Transparent (MADRaT)* (Version 1.86.0), Zenodo [data set], https://doi.org/10.5281/zenodo.4317856, 2020.
Elliott, J., Müller, C., Deryng, D., Chryssanthacopoulos, J., Boote, K. J., Büchner, M., Foster, I., Glotter, M., Heinke, J., Iizumi, T., Izaurralde, R. C., Mueller, N. D., Ray, D. K., Rosenzweig, C., Ruane, A. C., and Sheffield, J.: The Global Gridded Crop Model Intercomparison: data and modeling protocols for Phase 1 (v1.0), Geosci. Model Dev., 8, 261–277, https://doi.org/10.5194/gmd-8-261-2015, 2015.
Erb, K.-H., Luyssaert, S., Meyfroidt, P., Pongratz, J., Don, A., Kloster, S., Kuemmerle, T., Fetzel, T., Fuchs, R., Herold, M., Haberl, H., Jones, C. D., Marín-Spiotta, E., McCallum, I., Robertson, E., Seufert, V., Fritz, S., Valade, A., Wiltshire, A., and Dolman, A. J.: Land management: Data availability and process understanding for global change studies, Glob. Change Biol., 23, 512–533, https://doi.org/10.1111/gcb.13443, 2016.
Erenstein, O.: Smallholder conservation farming in the tropics and sub-tropics: a guide to the development and dissemination of mulching with crop residues and cover crops, Agr. Ecosyst. Environ., 100, 17–37, https://doi.org/10.1016/S0167-8809(03)00150-6, 2003.
EUROSTAT: Agri-environmental indicator – soil cover, in: Fact sheet, Statistics explained, Statistical office of the European Union, https://ec.europa.eu/eurostat/statistics-explained/index.php?title=Agri-environmental_indicator_-_soil_cover (last access: 3 February 2022), 2018.
FAO: Conservation Agriculture, AQUASTAT Database, Food and Agriculture Organization of the United Nations (FAO), https://www.fao.org/nr/water/aquastat/data/query/index.html?lang=en (last access: 3 February 2022), 2016.
Farquhar, G. D., von Caemmerer, S., and Berry, J. A.: A biochemical model of photosynthetic CO2 assimilation in leaves of C3 species, Planta, 149, 78–90, https://doi.org/10.1007/BF00386231, 1980.
Florentín, M. A., Peñalva, M., Calegari, A., and Derpsch, R.: Greeen manure/cover crops and crop rotation in Conservation Agriculture on small farms, Plant production and protection division, Food and Agriculture Organisation of the United Nation (FAO), Paraguay, 2011.
Forkel, M., Carvalhais, N., Schaphoff, S., v. Bloh, W., Migliavacca, M., Thurner, M., and Thonicke, K.: Identifying environmental controls on vegetation greenness phenology through model–data integration, Biogeosciences, 11, 7025–7050, https://doi.org/10.5194/bg-11-7025-2014, 2014.
Franzluebbers, A. J.: Achieving Soil Organic Carbon Sequestration with Conservation Agricultural Systems in the Southeastern United States, Soil Sci. Soc. Am. J., 74, 347–357, https://doi.org/10.2136/sssaj2009.0079, 2010.
Friedlingstein, P., O'Sullivan, M., Jones, M. W., Andrew, R. M., Hauck, J., Olsen, A., Peters, G. P., Peters, W., Pongratz, J., Sitch, S., Le Quéré, C., Canadell, J. G., Ciais, P., Jackson, R. B., Alin, S., Aragão, L. E. O. C., Arneth, A., Arora, V., Bates, N. R., Becker, M., Benoit-Cattin, A., Bittig, H. C., Bopp, L., Bultan, S., Chandra, N., Chevallier, F., Chini, L. P., Evans, W., Florentie, L., Forster, P. M., Gasser, T., Gehlen, M., Gilfillan, D., Gkritzalis, T., Gregor, L., Gruber, N., Harris, I., Hartung, K., Haverd, V., Houghton, R. A., Ilyina, T., Jain, A. K., Joetzjer, E., Kadono, K., Kato, E., Kitidis, V., Korsbakken, J. I., Landschützer, P., Lefèvre, N., Lenton, A., Lienert, S., Liu, Z., Lombardozzi, D., Marland, G., Metzl, N., Munro, D. R., Nabel, J. E. M. S., Nakaoka, S.-I., Niwa, Y., O'Brien, K., Ono, T., Palmer, P. I., Pierrot, D., Poulter, B., Resplandy, L., Robertson, E., Rödenbeck, C., Schwinger, J., Séférian, R., Skjelvan, I., Smith, A. J. P., Sutton, A. J., Tanhua, T., Tans, P. P., Tian, H., Tilbrook, B., van der Werf, G., Vuichard, N., Walker, A. P., Wanninkhof, R., Watson, A. J., Willis, D., Wiltshire, A. J., Yuan, W., Yue, X., and Zaehle, S.: Global Carbon Budget 2020, Earth Syst. Sci. Data, 12, 3269–3340, https://doi.org/10.5194/essd-12-3269-2020, 2020.
Godfray, H. C. J., Beddington, J. R., Crute, I. R., Haddad, L., Lawrence, D., Muir, J. F., Pretty, J., Robinson, S., Thomas, S. M., and Toulmin, C.: Food Security: The Challenge of Feeding 9 Billion People, Science, 327, 812–818, https://doi.org/10.1126/science.1185383, 2010.
Gonzalez-Sanchez, E. J., Veroz-Gonzalez, O., Conway, G., Moreno-Garcia, M., Kassam, A., Mkomwa, S., Ordoñez-Fernandez, R., Triviño-Tarradas, P., and Carbonell-Bojollo, R.: Meta-analysis on carbon sequestration through Conservation Agriculture in Africa, Soil Till. Res., 190, 22–30, https://doi.org/10.1016/j.still.2019.02.020, 2019.
Handcock, M. S.: Relative Distribution Methods, Version 1.6-6, https://CRAN.R-project.org/package=reldist (last access: 1 August 2021), 2016.
Harris, I., Jones, P. D., Osborn, T. J., and Lister, D. H.: Updated high-resolution grids of monthly climatic observations – the CRU TS3.10 Dataset, Int. J. Climatol. [data set], 34, 623–642, https://doi.org/10.1002/joc.3711, 2014.
Herzfeld, T., Heinke, J., Rolinski, S., and Müller, C.: Soil organic carbon dynamics from agricultural management practices under climate change, Earth Syst. Dynam., 12, 1037–1055, https://doi.org/10.5194/esd-12-1037-2021, 2021.
Hijmans, R. J. and van Etten, J.: Raster: Geographic analysis and modeling with raster data, R package version 2.0-12, http://CRAN.R-project.org/package=raster (last access: 3 February 2022), 2012.
Hirsch, A. L., Prestele, R., Davin, E. L., Seneviratne, S. I., Thiery, W., and Verburg, P. H.: Modelled biophysical impacts of conservation agriculture on local climates, Glob. Change Biol., 24, 4758–4774, https://doi.org/10.1111/gcb.14362, 2018.
Hurtt, G. C., Chini, L., Sahajpal, R., Frolking, S., Bodirsky, B. L., Calvin, K., Doelman, J. C., Fisk, J., Fujimori, S., Klein Goldewijk, K., Hasegawa, T., Havlik, P., Heinimann, A., Humpenöder, F., Jungclaus, J., Kaplan, J. O., Kennedy, J., Krisztin, T., Lawrence, D., Lawrence, P., Ma, L., Mertz, O., Pongratz, J., Popp, A., Poulter, B., Riahi, K., Shevliakova, E., Stehfest, E., Thornton, P., Tubiello, F. N., van Vuuren, D. P., and Zhang, X.: Harmonization of global land use change and management for the period 850–2100 (LUH2) for CMIP6, Geosci. Model Dev., 13, 5425–5464, https://doi.org/10.5194/gmd-13-5425-2020, 2020.
IPCC: Cropland, in: Good Practice Guidance for Land Use, Land-Use Change and Forestry (LULUCF), Chapter 3.3, edited by: Penman, J., Gytarsky, M., Hiraishi, T., Krug, T., Kruger, D., Pipatti, R., Buendia, L., Miwa, K., Ngara, T., Tanabe, K., and Wagner, F., IPCC National Greenhouse Gas Inventories Programme. Institute for Global Environmental Strategies (IGES), Intergovernmental Panel on Climate Change (IPCC) Japan, 2003.
Jägermeyr, J., Gerten, D., Heinke, J., Schaphoff, S., Kummu, M., and Lucht, W.: Water savings potentials of irrigation systems: global simulation of processes and linkages, Hydrol. Earth Syst. Sci., 19, 3073–3091, https://doi.org/10.5194/hess-19-3073-2015, 2015.
Jägermeyr, J., Gerten, D., Schaphoff, S., Heinke, J., Lucht, W., and Rockström, J.: Integrated crop water management might sustainably halve the global food gap, Environ. Res. Lett., 11, 025002, https://doi.org/10.1088/1748-9326/11/2/025002, 2016.
Jian, J., Du, X., Reiter, M. S., and Stewart, R. D.: A meta-analysis of global cropland soil carbon changes due to cover cropping, Soil Biol. Biochem., 143, 107735, https://doi.org/10.1016/j.soilbio.2020.107735, 2020.
Jolly, W. M., Nemani, R., and Running, S. W.: A generalized, bioclimatic index to predict foliar phenology in response to climate, Glob. Change Biol., 11, 619–632, https://doi.org/10.1111/j.1365-2486.2005.00930.x, 2005.
Kassam, A., Friedrich, T., and Derpsch, R.: Global spread of Conservation Agriculture, Int. J. Environ. Stud., 76, 29–51, https://doi.org/10.1080/00207233.2018.1494927, 2019.
Kaye, J. P. and Quemada, M.: Using cover crops to mitigate and adapt to climate change. A review, Agron. Sustain. Dev., 37, 4, https://doi.org/10.1007/s13593-016-0410-x, 2017.
Keestra, S., Nunes, J., Novara, A., Finger, D., and Avelar, D.: The superior effect of nature based solutions in land management for enhancing ecosystem services, Sci. Total Environ., 610, 997–1009, https://doi.org/10.1016/j.scitotenv.2017.08.077, 2018.
Kollas, C., Kersebaum, K. C., Nendel, C., Manevski, K., Müller, C., Palosuo, T., Armas-Herrera, C. M., Beaudoin, N., Bindi, M., Charfeddine, M., Conradt, T., Constantin, J., Eitzinger, J., Ewert, F., Ferrise, R., Gaiser, T., Cortazar-Atauri, I. G. d., Giglio, L., Hlavinka, P., Hoffmann, H., Hoffmann, M. P., Launay, M., Manderscheid, R., Mary, B., Mirschel, W., Moriondo, M., Olesen, J. E., Öztürk, I., Pacholski, A., Ripoche-Wachter, D., Roggero, P. P., Roncossek, S., Rötter, R. P., Ruget, F., Sharif, B., Trnka, M., Ventrella, D., Waha, K., Wegehenkel, M., Weigel, H.-J., and Wu, L.: Crop rotation modelling – A European model intercomparison, Eur. J. Agron., 70, 98–111, https://doi.org/10.1016/j.eja.2015.06.007, 2015.
Kowalewski, J.: The performance assessment of vegetation models – Demonstration of a benchmarking system application Master of Science (Geographical Information Science & Systems), Master Thesis, Interfakultärer Fachbereich für GeoInformatik (Z_GIS), Paris Lodron-Universität Salzburg, http://unigis.sbg.ac.at/files/Mastertheses/Full/103250.pdf (last access: 3 February 2022), 2016.
Kuo, S. and Sainju, U. M.: Nitrogen mineralization and availability of mixed leguminous and non-leguminous cover crop residues in soil, Biol. Fert. Soils, 26, 346–353, 1998.
Laborde, J. P., Wortmann, C. S., Blanco-Canqui, H., Baigorria, G. A., and Lindquist, J. L.: Identifying the drivers and predicting the outcome of conservation agriculture globally, Agr. Syst., 177, 102692, https://doi.org/10.1016/j.agsy.2019.102692, 2020.
Lal, R.: Carbon emission from farm operations, Environ. Int., 30, 981–990, https://doi.org/10.1016/j.envint.2004.03.005, 2004a.
Lal, R.: Soil Carbon Sequestration Impacts on Global Climate Change and Food Security, Science, 304, 1623–1627, https://doi.org/10.1126/science.1097396, 2004b.
Lamarque, J.-F., Dentener, F., McConnell, J., Ro, C.-U., Shaw, M., Vet, R., Bergmann, D., Cameron-Smith, P., Dalsoren, S., Doherty, R., Faluvegi, G., Ghan, S. J., Josse, B., Lee, Y. H., MacKenzie, I. A., Plummer, D., Shindell, D. T., Skeie, R. B., Stevenson, D. S., Strode, S., Zeng, G., Curran, M., Dahl-Jensen, D., Das, S., Fritzsche, D., and Nolan, M.: Multi-model mean nitrogen and sulfur deposition from the Atmospheric Chemistry and Climate Model Intercomparison Project (ACCMIP): evaluation of historical and projected future changes, Atmos. Chem. Phys., 13, 7997–8018, https://doi.org/10.5194/acp-13-7997-2013, 2013.
Lee, N. and Thierfelder, C.: Weed control under conservation agriculture in dryland smallholder farming systems of southern Africa. A review, Agron. Sustain. Dev., 37, 48, https://doi.org/10.1007/s13593-017-0453-7, 2017.
Lutz, F., Herzfeld, T., Heinke, J., Rolinski, S., Schaphoff, S., von Bloh, W., Stoorvogel, J. J., and Müller, C.: Simulating the effect of tillage practices with the global ecosystem model LPJmL (version 5.0-tillage), Geosci. Model Dev., 12, 2419–2440, https://doi.org/10.5194/gmd-12-2419-2019, 2019.
Lutz, F., Del Grosso, S., Ogle, S., Williams, S., Minoli, S., Rolinski, S., Heinke, J., Stoorvogel, J. J., and Müller, C.: The importance of management information and soil moisture representation for simulating tillage effects on N2O emissions in LPJmL5.0-tillage, Geosci. Model Dev., 13, 3905–3923, https://doi.org/10.5194/gmd-13-3905-2020, 2020.
Marcillo, G. S. and Miguez, F.: Corn yield response to winter cover crops: An updated meta-analysis, J. Soil Water Conserv., 72, 226–239, https://doi.org/10.2489/jswc.72.3.226 2017.
McDermid, S. S., Mearns, L. O., and Ruane, A. C.: Representing agriculture in Earth System Models: Approaches and priorities for development, J. Adv. Model. Earth Sy., 9, 2230–2265, https://doi.org/10.1002/2016MS000749, 2017.
Meyer, N., Bergez, J.-E., Constantin, J., and Justes, E.: Cover crops reduce water drainage in temperate climates: A meta-analysis, Agron. Sustain. Dev., 39, 3, https://doi.org/10.1007/s13593-018-0546-y, 2018.
Minasny, B., Malone, B. P., McBratney, A. B., Angers, D. A., Arrouays, D., Chambers, A., Chaplot, V., Chen, Z.-S., Cheng, K., Das, B. S., Field, D. J., Gimona, A., Hedley, C. B., Hong, S. Y., Mandal, B., Marchant, B. P., Martin, M., McConkey, B. G., Mulder, V. L., O'Rourke, S., Richer-de-Forges, A. C., Odeh, I., Padarian, J., Paustian, K., Pan, G., Poggio, L., Savin, I., Stolbovoy, V., Stockmann, U., Sulaeman, Y., Tsui, C.-C., Vågen, T.-G., van Wesemael, B., and Winowiecki, L.: Soil carbon 4 per mille, Geoderma, 292, 59–86, https://doi.org/10.1016/j.geoderma.2017.01.002, 2017.
Morais, T. G., Teixeira, R. F. M., and Domingos, T.: Detailed global modelling of soil organic carbon in cropland, grassland and forest soils, PLOS ONE, 14, e0222604, https://doi.org/10.1371/journal.pone.0222604, 2019.
Müller, C., Elliott, J., Chryssanthacopoulos, J., Arneth, A., Balkovic, J., Ciais, P., Deryng, D., Folberth, C., Glotter, M., Hoek, S., Iizumi, T., Izaurralde, R. C., Jones, C., Khabarov, N., Lawrence, P., Liu, W., Olin, S., Pugh, T. A. M., Ray, D. K., Reddy, A., Rosenzweig, C., Ruane, A. C., Sakurai, G., Schmid, E., Skalsky, R., Song, C. X., Wang, X., de Wit, A., and Yang, H.: Global gridded crop model evaluation: benchmarking, skills, deficiencies and implications, Geosci. Model Dev., 10, 1403–1422, https://doi.org/10.5194/gmd-10-1403-2017, 2017.
Nachtergaele, F., Van Velthuizen, H., Verelst, L., Batjes, N., Dijkshoorn, K., van Engelen, V., Fischer, G., Jones, A., Montanarella, L., and Petri, M.: Harmonized World Soil Database (version 1.1), Food and Agriculture Organization of the United Nations (FAO) [data set], Rome, and IIASA, Laxenburg, 2009.
Nouri, A., Lee, J., Yoder, D. C., Jagadamma, S., Walker, F. R., Yin, X., and Arelli, P.: Management duration controls the synergistic effect of tillage, cover crop, and nitrogen rate on cotton yield and yield stability, Agr. Ecosyst. Environ., 301, 107007, https://doi.org/10.1016/j.agee.2020.107007, 2020.
Nyawira, S. S., Nabel, J. E. M. S., Don, A., Brovkin, V., and Pongratz, J.: Soil carbon response to land-use change: evaluation of a global vegetation model using observational meta-analyses, Biogeosciences, 13, 5661–5675, https://doi.org/10.5194/bg-13-5661-2016, 2016.
Olin, S., Lindeskog, M., Pugh, T. A. M., Schurgers, G., Wårlind, D., Mishurov, M., Zaehle, S., Stocker, B. D., Smith, B., and Arneth, A.: Soil carbon management in large-scale Earth system modelling: implications for crop yields and nitrogen leaching, Earth Syst. Dynam., 6, 745–768, https://doi.org/10.5194/esd-6-745-2015, 2015.
Paulsen, H. M. (Ed.): Integrating cover crops, in: Inventory of techniques for carbon sequestration in agricultural soils, Interreg. North Sea Region, Thünen-Institute of Organic Farming, Germany, https://northsearegion.eu/carbon-farming/ (last access: 3 February 2022), 2020.
Pierce, D.: Interface to Unidata netCDF (version 4 or earlier), Format Data Files, R package version 1.15, https://cran.r-project.org/package=ncdf4 (last access: 3 February 2022), 2015.
Pittelkow, C. M., Liang, X., Linquist, B. A., van Groenigen, K. J., Lee, J., Lundy, M. E., van Gestel, N., Six, J., Venterea, R. T., and van Kessel, C.: Productivity limits and potentials of the principles of conservation agriculture, Nature, 517, 365–368, https://doi.org/10.1038/nature13809, 2015.
Poeplau, C. and Don, A.: Carbon sequestration in agricultural soils via cultivation of cover crops – A meta-analysis, Agr. Ecosyst. Environ., 200, 33–41, https://doi.org/10.1016/j.agee.2014.10.024, 2015.
Pongratz, J., Dolman, H., Don, A., Erb, K.-H., Fuchs, R., Herold, M., Jones, C., Kuemmerle, T., Luyssaert, S., Meyfroidt, P., and Naudts, K.: Models meet data: Challenges and opportunities in implementing land management in Earth system models, Glob. Change Biol., 24, 1470–1487, https://doi.org/10.1111/gcb.13988, 2018.
Portmann, F. T., Siebert, S., and Döll, P.: MIRCA2000 – Global monthly irrigated and rainfed crop areas around the year 2000: A new high-resolution data set for agricultural and hydrological modeling, Global Biogeochem. Cy., 24, GB1011, https://doi.org/10.1029/2008GB003435, 2010.
Porwollik, V., Rolinski, S., Heinke, J., and Müller, C.: Generating a rule-based global gridded tillage dataset, Earth Syst. Sci. Data, 11, 823–843, https://doi.org/10.5194/essd-11-823-2019, 2019.
Porwollik, V., Rolinski, S., Heinke, J., von Bloh, W., Schaphoff, S., Herzfeld, T., and Müller, C.: LPJmL5.0-tillage-cc model source code, management simulation outputs, and R script for post-processing data (1.0.1), Zenodo [code, data set], https://doi.org/10.5281/zenodo.5178070, 2021.
Prestele, R., Hirsch, A. L., Davin, E. L., Seneviratne, S. I., and Verburg, P. H.: A spatially explicit representation of conservation agriculture for application in global change studies, Glob. Change Biol., 24, 4038–4053, https://doi.org/10.1111/gcb.14307, 2018.
Pugh, T. A. M., Arneth, A., Olin, S., Ahlström, A., Bayer, A. D., Klein Goldewijk, K., Lindeskog, M., and Schurgers, G.: Simulated carbon emissions from land-use change are substantially enhanced by accounting for agricultural management, Environ. Res. Lett., 10, 124008, https://doi.org/10.1088/1748-9326/10/12/124008, 2015.
Quemada, M., Baranski, M., Nobel-de Lange, M. N. J., Vallejo, A., and Cooper, J. M.: Meta-analysis of strategies to control nitrate leaching in irrigated agricultural systems and their effects on crop yield, Agr. Ecosyst. Environ., 174, 1–10, https://doi.org/10.1016/j.agee.2013.04.018, 2013.
Ramankutty, N., Evan, A. T., Monfreda, C., and Foley, J. A.: Farming the planet: 1. Geographic distribution of global agricultural lands in the year 2000, Global Biogeochem. Cy., 22, GB1003, https://doi.org/10.1029/2007GB002952, 2008.
Ranaivoson, L., Naudin, K., Ripoche, A., Rabeharisoa, L., and Corbeels, M.: Effectiveness of conservation agriculture in increasing crop productivity in low-input rainfed rice cropping systems under humid subtropical climate, Field Crop. Res., 239, 104–113, https://doi.org/10.1016/j.fcr.2019.05.002, 2019.
R Development Core Team: R: A language and environment for statistical computing, R Foundation for Statistical Computing, Vienna, Austria, https://www.R-project.org/ (last access: 3 February 2022), 2016.
Rohwer, J., Gerten, D., and Lucht, W.: Development of functional irrigation types for improved global crop modelling, edited by: Gerstengarbe, F. W., PIK Report, 104, Potsdam Institute for Climate Impact Research (PIK), Potsdam, 2007.
Rolinski, S., Müller, C., Heinke, J., Weindl, I., Biewald, A., Bodirsky, B. L., Bondeau, A., Boons-Prins, E. R., Bouwman, A. F., Leffelaar, P. A., te Roller, J. A., Schaphoff, S., and Thonicke, K.: Modeling vegetation and carbon dynamics of managed grasslands at the global scale with LPJmL 3.6, Geosci. Model Dev., 11, 429–451, https://doi.org/10.5194/gmd-11-429-2018, 2018.
Rosegrant, M. W., Koo, J., Cenacchi, N., Ringler, C., Robertson, R. D., Fisher, M., Cox, C. M., Garrett, K., Perez, N. D., and Sabbagh, P.: Food security in a world of natural resource scarcity: The role of agricultural technologies, International Food Policy Research Institute (IFPRI), Washington, D.C., https://doi.org/10.2499/9780896298477, 2014.
Rosenzweig, C., Mbow, C., Barioni, L. G., Benton, T. G., Herrero, M., Krishnapillai, M., Liwenga, E. T., Pradhan, P., Rivera-Ferre, M. G., Sapkota, T., Tubiello, F. N., Xu, Y., Mencos Contreras, E., and Portugal-Pereira, J.: Climate change responses benefit from a global food system approach, Nature Food, 1, 94–97, https://doi.org/10.1038/s43016-020-0031-z, 2020.
Sacks, W. J., Deryng, D., Foley, J. A., and Ramankutty, N.: Crop planting dates: an analysis of global patterns, Global Ecol. Biogeogr., 19, 607–620, https://doi.org/10.1111/j.1466-8238.2010.00551.x, 2010.
SARE: Cover Crop Economics-Opportunities to Improve Your Bottom Line in Row Crops, Agriculture Innovation, Technical Bulletin, Sustainable Agriculture Research and Education (SARE), USA, 2019.
Schaphoff, S., Forkel, M., Müller, C., Knauer, J., von Bloh, W., Gerten, D., Jägermeyr, J., Lucht, W., Rammig, A., Thonicke, K., and Waha, K.: LPJmL4 – a dynamic global vegetation model with managed land – Part 2: Model evaluation, Geosci. Model Dev., 11, 1377–1403, https://doi.org/10.5194/gmd-11-1377-2018, 2018a.
Schaphoff, S., von Bloh, W., Rammig, A., Thonicke, K., Biemans, H., Forkel, M., Gerten, D., Heinke, J., Jägermeyr, J., Knauer, J., Langerwisch, F., Lucht, W., Müller, C., Rolinski, S., and Waha, K.: LPJmL4 – a dynamic global vegetation model with managed land – Part 1: Model description, Geosci. Model Dev., 11, 1343–1375, https://doi.org/10.5194/gmd-11-1343-2018, 2018b.
Scopel, E., Triomphe, B., Affholder, F., Da Silva, F. A. M., Corbeels, M., Xavier, J. H. V., Lahmar, R., Recous, S., Bernoux, M., Blanchart, E., de Carvalho Mendes, I., and De Tourdonnet, S.: Conservation agriculture cropping systems in temperate and tropical conditions, performances and impacts. A review, Agron. Sustain. Dev., 33, 113–130, https://doi.org/10.1007/s13593-012-0106-9, 2013.
Siebert, S., Portmann, F. T., and Döll, P.: Global Patterns of Cropland Use Intensity, Remote Sensing, 2, 1625–1643, https://doi.org/10.3390/rs2071625, 2010.
Smith, P.: Soil carbon sequestration and biochar as negative emission technologies, Glob. Change Biol., 22, 1315–1324, https://doi.org/10.1111/gcb.13178, 2016.
Sommer, R. and Bossio, D.: Dynamics and climate change mitigation potential of soil organic carbon sequestration, J. Environ. Manage., 144, 83–87, https://doi.org/10.1016/j.jenvman.2014.05.017, 2014.
Springmann, M., Clark, M., Mason-D'Croz, D., Wiebe, K., Bodirsky, B. L., Lassaletta, L., de Vries, W., Vermeulen, S. J., Herrero, M., Carlson, K. M., Jonell, M., Troell, M., DeClerck, F., Gordon, L. J., Zurayk, R., Scarborough, P., Rayner, M., Loken, B., Fanzo, J., Godfray, H. C. J., Tilman, D., Rockström, J., and Willett, W.: Options for keeping the food system within environmental limits, Nature, 562, 519–525, https://doi.org/10.1038/s41586-018-0594-0, 2018.
Stockmann, U., Adams, M. A., Crawford, J. W., Field, D. J., Henakaarchchi, N., Jenkins, M., Minasny, B., McBratney, A. B., Courcelles, V. d. R. d., Singh, K., Wheeler, I., Abbott, L., Angers, D. A., Baldock, J., Bird, M., Brookes, P. C., Chenu, C., Jastrow, J. D., Lal, R., Lehmann, J., O'Donnell, A. G., Parton, W. J., Whitehead, D., and Zimmermann, M.: The knowns, known unknowns and unknowns of sequestration of soil organic carbon, Agr. Ecosyst. Environ., 164, 80–99, https://doi.org/10.1016/j.agee.2012.10.001, 2013.
Su, Y., Gabrielle, B., and Makowski, D.: A global dataset for crop production under conventional tillage and no tillage systems, Scientific Data, 8, 33, https://doi.org/10.1038/s41597-021-00817-x, 2021.
Tans, P. and Keeling, R.: Trends in Atmospheric Carbon Dioxide National Oceanic & Atmospheric Administration and Earth System Research Laboratory (NOAA/ESRL), U.S. Department of Commerce [data set], US, 2015.
Thapa, R., Mirsky, S. B., and Tully, K. L.: Cover Crops Reduce Nitrate Leaching in Agroecosystems: A Global Meta-Analysis, J. Environ. Qual., 47, 1400–1411, https://doi.org/10.2134/jeq2018.03.0107, 2018.
Thierfelder, C., Baudron, F., Setimela, P., Nyagumbo, I., Mupangwa, W., Mhlanga, B., Lee, N., and Gérard, B.: Complementary practices supporting conservation agriculture in southern Africa. A review, Agron. Sustain. Dev., 38, 16, https://doi.org/10.1007/s13593-018-0492-8, 2018.
Tittonell, P., Scopel, E., Andrieu, N., Posthumus, H., Mapfumo, P., Corbeels, M., van Halsema, G. E., Lahmar, R., Lugandu, S., Rakotoarisoa, J., Mtambanengwe, F., Pound, B., Chikowo, R., Naudin, K., Triomphe, B., and Mkomwa, S.: Agroecology-based aggradation-conservation agriculture (ABACO): Targeting innovations to combat soil degradation and food insecurity in semi-arid Africa, Field Crop. Res., 132, 168–174, https://doi.org/10.1016/j.fcr.2011.12.011, 2012.
Tonitto, C., David, M. B., and Drinkwater, L.: Replacing Bare Fallows with Cover Crops in Fertilizer-Intensive Cropping Systems: A Meta-Analysis of Crop Yield and N Dynamics, Agr. Ecosyst. Environ., 112, 58–72, https://doi.org/10.1016/j.agee.2005.07.003, 2006.
Valkama, E., Lemola, R., Känkänen, H., and Turtola, E.: Meta-analysis of the effects of undersown catch crops on nitrogen leaching loss and grain yields in the Nordic countries, Agr. Ecosyst. Environ., 203, 93–101, https://doi.org/10.1016/j.agee.2015.01.023, 2015.
von Bloh, W., Schaphoff, S., Müller, C., Rolinski, S., Waha, K., and Zaehle, S.: Implementing the nitrogen cycle into the dynamic global vegetation, hydrology, and crop growth model LPJmL (version 5.0), Geosci. Model Dev., 11, 2789–2812, https://doi.org/10.5194/gmd-11-2789-2018, 2018.
Waha, K., Dietrich, J. P., Portmann, F. T., Siebert, S., Thornton, P. K., Bondeau, A., and Herrero, M.: Multiple cropping systems of the world and the potential for increasing cropping intensity, Global Environ. Chang., 64, 102131, https://doi.org/10.1016/j.gloenvcha.2020.102131, 2020.
West, T. O. and Six, J.: Considering the influence of sequestration duration and carbon saturation on estimates of soil carbon capacity, Climatic Change, 80, 25–41, https://doi.org/10.1007/s10584-006-9173-8, 2007.
West, T. O., Marland, G., King, A. W., Post, W. M., Jain, A. K., and Andrasko, K.: Carbon Management Response Curves: Estimates of Temporal Soil Carbon Dynamics, Environ. Manage., 33, 507–518, https://doi.org/10.1007/s00267-003-9108-3, 2004.
Wittwer, R. A., Dorn, B., Jossi, W., and van der Heijden, M. G. A.: Cover crops support ecological intensification of arable cropping systems, Sci. Rep.-UK, 7, 41911, https://doi.org/10.1038/srep41911, 2017.
Zhang, B., Tian, H., Lu, C., Dangal, S. R. S., Yang, J., and Pan, S.: Global manure nitrogen production and application in cropland during 1860–2014: a 5 arcmin gridded global dataset for Earth system modeling, Earth Syst. Sci. Data, 9, 667–678, https://doi.org/10.5194/essd-9-667-2017, 2017.
Zhu, B., Yi, L., Guo, L., Chen, G., Hu, Y., Tang, H., Xiao, C., Xiao, X., Yang, G., Acharya, S. N., and Zeng, Z.: Performance of two winter cover crops and their impacts on soil properties and two subsequent rice crops in Dongting Lake Plain, Hunan, China, Soil Till. Res., 124, 95–101, https://doi.org/10.1016/j.still.2012.05.007, 2012.
Zomer, R. J., Bossio, D. A., Sommer, R., and Verchot, L. V.: Global Sequestration Potential of Increased Organic Carbon in Cropland Soils, Sci. Rep.-UK, 7, 15554, https://doi.org/10.1038/s41598-017-15794-8, 2017.