the Creative Commons Attribution 4.0 License.
the Creative Commons Attribution 4.0 License.
 | 14 Apr 2023
Synergy between TROPOMI sun-induced chlorophyll fluorescence and MODIS spectral reflectance for understanding the dynamics of gross primary productivity at Integrated Carbon Observatory System (ICOS) ecosystem flux sites
Hamadou Balde
Gabriel Hmimina
Yves Goulas
Gwendal Latouche
Kamel Soudani
An accurate estimation of vegetation gross primary productivity (GPP), which is the amount of carbon taken up by vegetation through photosynthesis for a given time and area, is critical for understanding terrestrial–atmosphere CO2 exchange processes and ecosystem functioning, as well as ecosystem responses and adaptations to climate change. Prior studies, based on ground, airborne, and satellite sun-induced chlorophyll fluorescence (SIF) observations, have recently revealed close relationships with GPP at different spatial and temporal scales and across different plant functional types (PFTs). However, questions remain regarding whether there is a unique relationship between SIF and GPP across different sites and PFTs and how we can improve GPP estimates using solely remotely sensed data. Using concurrent measurements of daily TROPOspheric Monitoring Instrument (TROPOMI) SIF (daily SIFd); daily MODIS Terra and Aqua spectral reflectance; vegetation indices (VIs, notably normalized difference vegetation index (NDVI), near-infrared reflectance of vegetation (NIRv), and photochemical reflectance index (PRI)); and daily tower-based GPP across eight major different PFTs, including mixed forests, deciduous broadleaf forests, croplands, evergreen broadleaf forests, evergreen needleleaf forests, grasslands, open shrubland, and wetlands, the strength of the relationships between tower-based GPP and SIFd at 40 Integrated Carbon Observation System (ICOS) flux sites was investigated. The synergy between SIFd and MODIS-based reflectance (R) and VIs to improve GPP estimates using a data-driven modeling approach was also evaluated. The results revealed that the strength of the hyperbolic relationship between GPP and SIFd was strongly site-specific and PFT-dependent. Furthermore, the generalized linear model (GLM), fitted between SIFd, GPP, and site and vegetation type as categorical variables, further supported this site- and PFT-dependent relationship between GPP and SIFd. Using random forest (RF) regression models with GPP as output and the aforementioned variables as predictors (R, SIFd, and VIs), this study also showed that the spectral reflectance bands (RF-R) and SIFd plus spectral reflectance (RF-SIF-R) models explained over 80 % of the seasonal and interannual variations in GPP, whereas the SIFd plus VI (RF-SIF-VI) model reproduced only 75 % of the tower-based GPP variance. In addition, the relative variable importance of predictors of GPP demonstrated that the spectral reflectance bands in the near-infrared, red, and SIFd appeared as the most influential and dominant factors determining GPP predictions, indicating the importance of canopy structure, biochemical properties, and vegetation functioning on GPP estimates. Overall, this study provides insights into understanding the strength of the relationships between GPP and SIF and the use of spectral reflectance and SIFd to improve estimates of GPP across sites and PFTs.
- Article
(5425 KB) - Full-text XML
-
Supplement
(17260 KB) - BibTeX
- EndNote


In the context of climate change, understanding the role of terrestrial ecosystems in terms of exchanges of carbon, water, and energy is crucial in order to fill in the knowledge gap on climatic interactions between the biosphere and the atmosphere. Terrestrial ecosystems are one of the main components of the carbon cycle and are highly sensitive to abiotic stresses. Therefore, an accurate estimation of vegetation gross primary productivity (GPP), which is the carbon flux taken up by vegetation through photosynthesis, is critical for understanding terrestrial–atmosphere CO2 exchange processes and ecosystem functioning, as well as ecosystem responses and adaptations to climate change (Gamon et al., 2019). Eddy covariance (EC) techniques allow for the estimation of GPP locally (Falge et al., 2002; Moureaux et al., 2008; Chu et al., 2021). However, they have limitations when it comes to upscaling carbon flux estimates at larger scales due to their restricted spatial coverage, temporal dynamics of flux footprints, and limited distribution across different vegetation types, notably in key areas such as Africa and South America (Xiao, 2004; Gamon, 2015; Xiao et al., 2019). GPP can also be estimated based on physical and ecophysiological modeling approaches. However, for estimating GPP at larger scales, those methods are hampered by the lack of understanding of the underlying physiological processes (Jiang and Ryu, 2016; Zhang et al., 2017; Madani et al., 2020).
Remote sensing is widely used to upscale daily GPP to landscape, regional, and global scales using reflected sunlight measured by satellite sensors (Running et al., 2004; Baldocchi et al., 2020; Wu et al., 2020; Kong et al., 2022; Wang et al., 2022). These approaches are mainly based on reflectance-based vegetation indices (VIs) such as the normalized difference vegetation index (NDVI), enhanced vegetation index (EVI), and more recently near-infrared reflectance of vegetation (NIRv) (Badgley et al., 2017; Baldocchi et al., 2020). VIs are mostly sensitive to spatial and temporal variability in structural leaf area index (LAI) and biochemical canopy attributes (Dechant et al., 2020; Pabon-Moreno et al., 2022), but they suffer from saturation in canopy-dense ecosystems and are less sensitive to diurnal and daily variations in photosynthetic status resulting from physiological responses induced by rapid changes in abiotic stresses (Daumard et al., 2012; Guanter et al., 2014; Wieneke et al., 2016; Zhang et al., 2021a). Remote sensing also provides access to variables which are related to canopy functioning such as the photochemical reflectance index (PRI) (Gamon et al., 1992; Wang et al., 2020) and sun-induced chlorophyll fluorescence (SIF) (Porcar-Castell et al., 2014; Goulas et al., 2017; Magney et al., 2019; Yang et al., 2021; Zhang et al., 2022; Li and Xiao, 2022).
PRI is a reflectance-based vegetation index that has been shown to detect vegetation functioning activities under abiotic stress conditions that the abovementioned VIs cannot capture (Meroni et al., 2008). It is due to changes in the absorptance of leaves of around 510 nm or reflectance at 531 nm that are related to the interconversion of the xanthophyll pigment cycles, which represents an important photoprotection mechanism (Gamon et al., 1992; Meroni et al., 2008). Moreover, previous studies have pointed out that PRI can be used to improve canopy GPP estimates at the ecosystem level at daily timescales (Wang et al., 2020; Hmimina et al., 2015; Soudani et al., 2014), but how variations in PRI at long timescales with spatial variations in vegetation types affect the relationship between PRI and GPP remains unresolved and is an area of active research (Porcar-Castell et al., 2014; Chou et al., 2017; Gitelson et al., 2017).
In recent years, SIF has emerged as a promising remotely sensed tool for monitoring canopy GPP, which is functionally and fundamentally different from the aforementioned VIs (Damm et al., 2010; Yang et al., 2015; Köhler et al., 2018; Wang et al., 2021; Guanter et al., 2021). In fact, SIF does not rely on vegetation reflectance; instead it is a faint signal directly emitted by chlorophyll from the absorbed sunlight just before the occurrence of a photochemical reaction (Porcar-Castell et al., 2014; Gu et al., 2019a; Zhang et al., 2021a, b). SIF has a physical and physiological meaning, and hence SIF offers new opportunities for the global assessment of canopy GPP (Mohammed et al., 2019; Wieneke et al., 2018; Zhang et al., 2020; Kimm et al., 2021; Dechant et al., 2022). Earlier studies relying on ground-, airborne-, and satellite-based SIF data measurements at different temporal and spatial scales have indicated a strong linear site-specific and vegetation-type-dependent relationship between GPP and SIF (Frankenberg et al., 2011; Guanter et al., 2014; Yang et al., 2017; Wood et al., 2017; Li et al., 2018b; Paul-Limoges et al., 2018; Zhang et al., 2021b, 2022). In contrast, at finer temporal scales, such as diurnal and hourly, the relationship between GPP and SIF is not as strong as at longer timescales. Instead, it appears to be non-linear due to rapid changes in instantaneous variations in photosynthetically active radiation (PAR) and environmental conditions (Damm et al., 2015; Marrs et al., 2020; Kim et al., 2021). How and to what extent driving factors such as canopy structure, spatial heterogeneity, and abiotic stress conditions mediate the GPP and SIF relationship remains a challenge and needs to be investigated (Smith et al., 2018; Wang et al., 2021; Li and Xiao, 2022). The main drawback, which relates to the use of SIF to predict GPP at regional and global scales, lies in the weak SIF signal retrieval that requires averaging over large timescales and spatial scales and thus hampers detecting fine-scale dynamics needed to explain underlying processes (Gamon et al., 2019; Köhler et al., 2021). Yet, the TROPOspheric Monitoring Instrument (TROPOMI) sensor, which is on board the Sentinel-5 Precursor (S-5P), represents a novel tool for understanding SIF variations as well as an opportunity to fully evaluate the potential of SIF to improve GPP estimates at the ecosystem scale, as it provides a high temporal resolution at a daily scale (Köhler et al., 2018). In addition, the future satellite mission Fluorescence Explorer (FLEX) will provide on a single platform SIF at an unprecedented spatial resolution (300 m) together with visible reflectance in the green, red, and far-red spectral windows (Drusch et al., 2017).
The surface spectral reflectance (R), VIs, and SIF can be used altogether to better characterize highly spatiotemporal dynamics in vegetation canopy structure, canopy biochemical properties, and vegetation functioning as a response to frequent changes in abiotic conditions at site and ecosystem scales. However, to the best of our knowledge, an attempt to study the synergy between those variables has not been comprehensively addressed due to the fact that the relationships between structural and functional components are not linear and have complex interactions over time and space (Hilker et al., 2007; Sippel et al., 2018; Yazbeck et al., 2021; Pabon-Moreno et al., 2022; Kong et al., 2022). Therefore, a series of observations of SIF, R, and VIs at site and ecosystem scales could give insights into how SIF is related to GPP and whether SIF, R, and VIs could provide additional information on understanding the dynamics of GPP at the ecosystem scale and beyond.
The overarching objective of this work is to study the potential of SIF, R, and VIs (namely NDVI, NIRv, and PRI) to estimate canopy GPP and the synergy between these predictive variables. Specifically, this study primarily intends to evaluate at a daily timescale the strength of the relationships between SIF and GPP at 40 Integrated Carbon Observation System (ICOS) flux sites, including several vegetation functional types (mixed forests (MFs), deciduous broadleaf forests (DBFs), croplands (CROs), evergreen broadleaf forests (EBFs), evergreen needleleaf forests (ENFs), grasslands (GRAs), open shrubland (OSH), and wetlands (WETs)), and ultimately to examine the synergy between SIF, R, and VIs to improve canopy GPP estimates based on a data-driven modeling approach.
In this current section, the site characteristics and eddy covariance (EC) flux data are presented. Then, the remote sensing data (TROPOMI, MODIS Aqua and Terra, and Copernicus Land Cover classification) used in the study are described. Lastly, data analysis methods used in this study are presented. Study sites and flux tower in situ EC flux data were obtained through the ICOS Data Portal release in 2018 and 2021 (https://www.icos-cp.eu/data-services, last access: 21 December 2021). We screened over 70 ecosystem ICOS sites, relying on the availability of GPP data for each site with simultaneous TROPOMI SIF observations in the period from February 2018 to December 2020, and maintained 40 sites for analyses. The study sites encompass a latitude from 5.27∘ N to 67.75∘ N, including a diversity of plant functional types (PFTs) based on the IGBP vegetation-type classification given by ICOS PI sites: mixed forests (MFs, 2 sites), croplands (CROs, 9 sites), deciduous broadleaf forests (DBFs, 6 sites), evergreen broadleaf forests (EBFs, 2 sites), evergreen needleleaf forests (ENFs, 13 sites), grasslands (GRAs, 3 sites), open shrubland (OSH, 1 site, which is actually a young vineyard plantation), and wetlands (WETs, 4 sites). The PFT at each site was confirmed by photointerpretation of pictures found in the ICOS Data Portal database and Google Earth. Detailed information and references of these sites are provided in Table S1 in the Supplement. Figure 1 presents the location of these study sites, except for the GF-Guy site, located in French Guiana. In the analyses, we used daily GPP values computed as the sum of the half-hourly values estimated from each site. GPP data previously gap-filled by ICOS PI, representing for a full year, which was the case for instance at CH-Dav, FR-Bil, IT-SR2, and SE-Deg, were filtered out and were not used in the analyses.
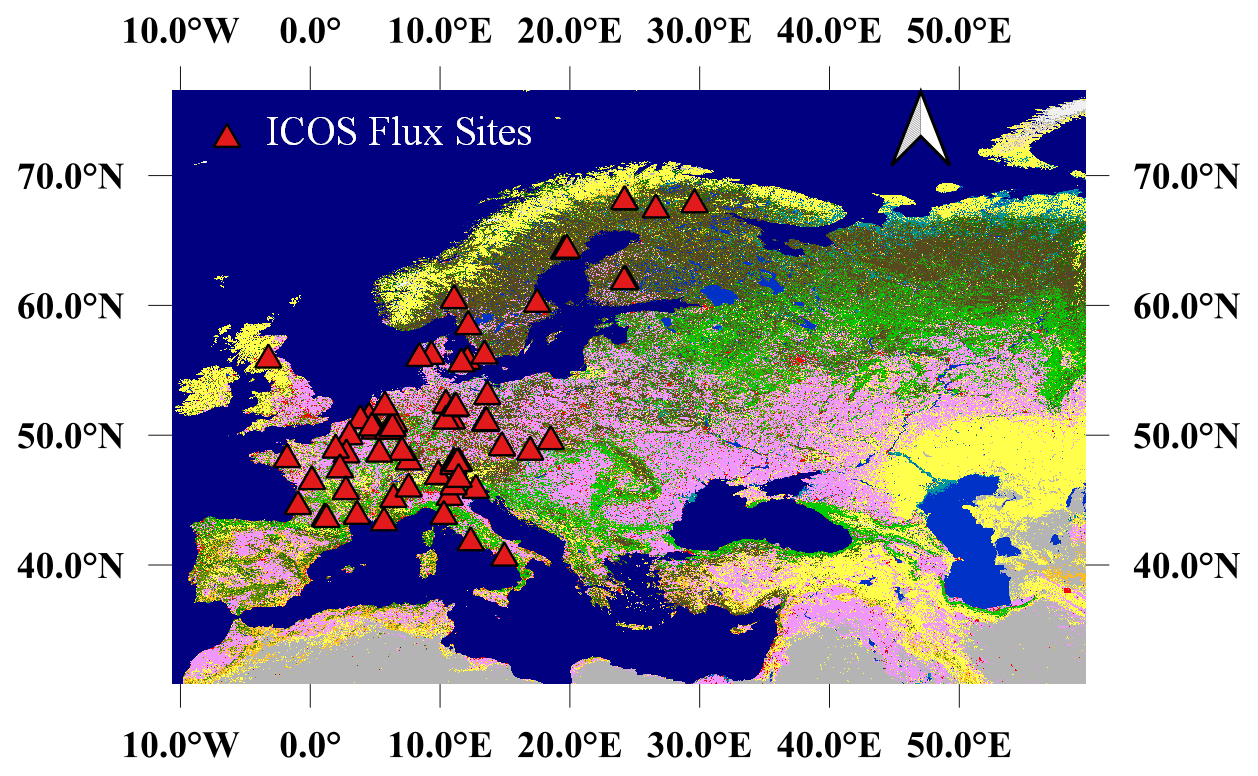
Figure 1The study area and location of the EC ICOS flux sites, except for the GF-Guy site, located in French Guiana. The base map is the 100 m spatial resolution of the Copernicus Global Land Cover classification map. The triangles represent the locations of the flux sites used for investigating the relationships between tower-based GPP and TROPOMI SIF.
2.1 Remote sensing data
2.1.1 MODIS Terra and Aqua data
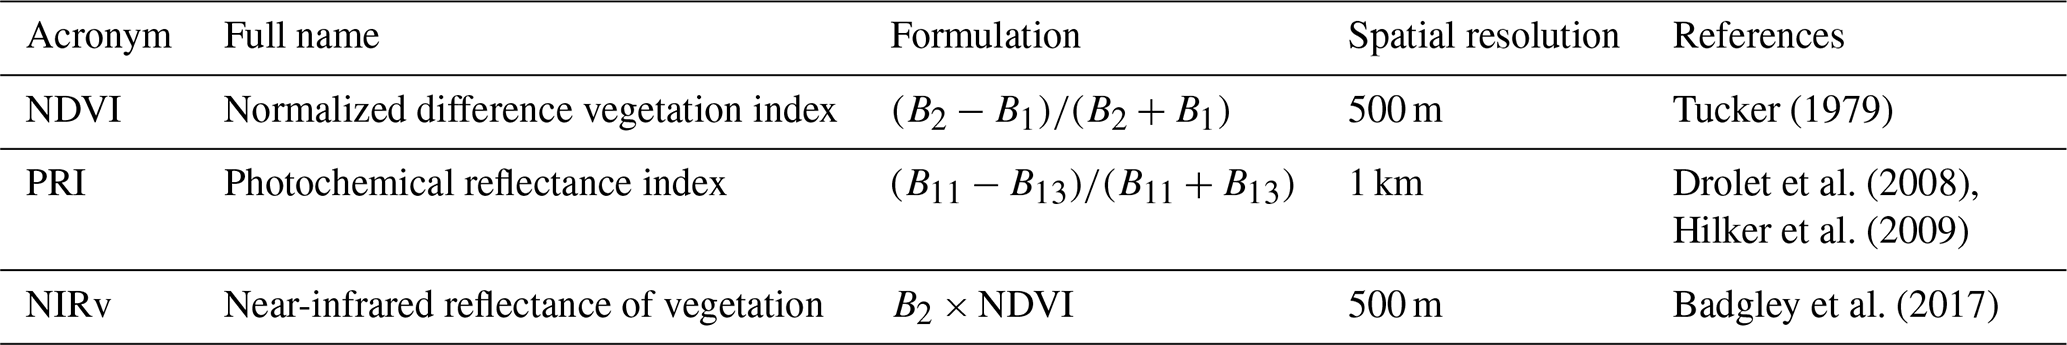
Time series of daily MODIS Terra and Aqua surface reflectance products (MOD09GA, MODOCGA, MYD09GA, and MYDOCGA), centered at the location of each site, were downloaded from the Google Earth Engine database. The quality assurance (QA) flag (ideal quality, QA = 0) and the cloud mask (clear state) criteria were used. Both MODIS Terra and Aqua, used in this study, contain 16 spectral bands of which the spatial resolution from band 1 to band 7 is 500 m and 1 km for the remaining bands (8–16) (Vermote et al., 2015). Detailed information about the MODIS data products is given in Table S2. We used daily MODIS surface reflectance, NDVI, NIRv, and PRI. These VIs are computed according to the equation given in Table 1. For the PRI computation, we used B13 as a reference band following Hilker et al. (2009).
Table 1MODIS Terra and Aqua vegetation index computations. B2 (841–876 nm) denotes the surface spectral reflectance at band 2, B1 (620–670 nm) denotes the surface spectral reflectance at band 1, B11 (526–536 nm) represents the surface spectral reflectance at band 11, and B13 (662–672 nm) represents the surface spectral reflectance at band 13.
2.1.2 TROPOMI SIF and Copernicus Global Land Cover data
TROPOMI, as a single payload of the Sentinel-5 Precursor (S-5P) satellite, was launched on 13 October 2017. TROPOMI has a near-sun-synchronous orbit with a repeat cycle of 16 d and an equatorial crossing time at around 13:30 local time (Köhler et al., 2018), which is comparable to those of Orbiting Carbon Observatory-2 (OCO-2) and the Greenhouse Gases Observing Satellite (GOSAT). However, the wide swath of TROPOMI (2600 km) is larger than that of OCO-2 (10 km), which enables TROPOMI to provide almost daily spatially continuous global coverage (Köhler et al., 2018). TROPOMI has a spatial resolution of 7 km along track (5 km since August 2019 owing to diminished integration time) and 3.5 to 14 km across track (based on the viewing angle) and covers the spectral range between 675–775 nm in the near-infrared with a spectral resolution of 0.5 nm, which allows for the retrieval of far-red SIF (Köhler et al., 2018). To decouple SIF emissions from the reflected incident sunlight, a statistical and data-driven approach is used; see Köhler et al. (2018) for more details. We used instantaneous and daily ungridded soundings of TROPOMI far-red SIF at 740 nm obtained from the Caltech dataset between February 2018 and December 2020 (https://data.caltech.edu/records/1347, last access: 14 June 2021). Instantaneous SIF data were reported in mW m−2 sr−1 nm−1. Daily SIF (hereafter referred to as SIFd) is computed by timing instantaneous SIF with a day-length correction factor included in the dataset.
The TROPOMI SIF observations corresponding to each site were determined by relying on the following criteria. Firstly, we extracted all pixels whose center locations are less than 5 km away from the flux tower sites for analyses. The latter choice was motivated by the fact that the relationship between TROPOMI SIF and tower-based GPP gradually weakened as the distance from site to the center of pixel increased (data not shown). Secondly, to reduce the cloud effects on SIF data, SIFd observations with a cloud fraction over 15 % were excluded, even though some findings reveal that TROPOMI SIF is less sensitive to cloud than surface reflectance values (Guanter et al., 2012; Doughty et al., 2021). The 100 m spatial resolution of the Copernicus Global Land Cover classification map for the year 2019 (Buchhorn et al., 2020) was used as a base map of the study sites. This land cover classification map was obtained from the Copernicus Global Land Service website (https://lcviewer.vito.be/download, last access: 25 May 2021).
In this study, the GPP and SIFd relationship was evaluated at a daily timescale at different spatial scales. Before investigating the link between GPP and SIFd, it was necessary to figure out a way to process outliers which were mostly associated with negative SIFd values. It has been shown that excluding directly negative SIF values could have effects on studying the relationships between satellite SIF data and GPP (Köhler et al., 2018, 2021). Thus, to handle the outliers, an exponential model was used to account for the structural relationship between the instantaneous SIF and the SIF error included in the dataset. A threshold of ±0.15 mW m−2 sr−1 nm−1 was then applied to the residual random error of the exponential model.
We used a hyperbolic model to relate GPP to SIFd following (Damm et al., 2015; Kim et al., 2021) , where a and b are fitted parameters. It is worth noting that a linear model between GPP and SIFd was also investigated, and the results are provided in the Supplement. Before relating GPP to SIFd using this hyperbolic model at each site, SIF values equal to or less than zero were discarded. Afterward, the same model was fitted on a PFT scale by pooling all data across all sites for the same PFT. To explore the generalizability of the relationship between GPP and SIFd, first the hyperbolic model was adjusted on data pooled across all sites. Second, to further test how the year, site, and PFT, as categorical variables, and their interactions (year ⋅ GPP, site ⋅ GPP, and PFT ⋅ GPP) influence the GPP and SIFd relationship, a generalized linear model (GLM) was used. Within the GLM, SIFd is considered a response variable, whereas site, PFT, year, and GPP are the explanatory variables. These aforementioned variables and their interaction effects may affect the changes or variations either in SIFd or GPP and may consequently influence the slope and intercept of their relationships.
In order to study the synergy between SIFd, R, and VIs to improve GPP estimates, a random forest (RF) regression model was used (Breiman, 2001). Briefly, an RF is a machine learning algorithm which combines the results of several random ensemble decision trees to reach a final accurate output. Before setting up the RF model, the correlation matrix between all variables was computed. It has been shown that important features can be affected by the high correlation between feature predictors (Toloşi and Lengauer, 2011), suggesting that a decrease in importance values is observed when the level of correlation and the number of correlated variables increase. In practice, a strongly predictive variable belonging to a group of correlated variables can be considered less important than an independent and less informative variable. Based on remotely sensed data inputs and one categorical explanatory variable (PFT), the variables that are the most relevant for estimating GPP on daily data pooled altogether across all sites were evaluated. Four RF models were established by relying on the combination of the predictive variables to estimate GPP: (1) only surface spectral reflectance (RF-R), (2) surface spectral reflectance plus SIFd (RF-SIF-R), (3) surface spectral reflectance plus SIFd and the PFT as a categorical variable (RF-SIF-R-PFT), and (4) SIFd plus VIs (RF-SIF-VI) (namely NDVI, NIRv, and PRI). A total of 80 % of the data were used for training and the remaining for testing the model. It is worth mentioning that a RandomizedSearchCV technique was used (scikit-learn library for Python) to tune the model, and it took the best parameters for each model to predict GPP and applied a 10-fold cross-validation and 20 iterations on the training set to avoid splitting the dataset into training, validating, and testing sets, which could affect the number of data allocated to the training and could easily lead to model overfitting. The ensemble of decision tree models includes 200 trees for all models, but the number of splits per tree and the maximum depth varied. The relative importance of each variable, based on the mean decrease in the impurity method, was used to evaluate the part of the contribution of each input variable in predicting the canopy GPP variability. For TROPOMI data extraction, MATLAB R2021a (MathWorks, Inc., USA) was used, and Python version 3.9.1 was used for data analysis and visualization (sklearn, SciPy, seaborn, matplotlib, pandas, and NumPy libraries for Python).
Ultimately, the strength of the relationships between SIFd and GPP was compared based on the coefficient of determination (R2), root mean square error (RMSE), and the p-value metrics. The random forest models were evaluated and compared based on out-of-bag adjusted R2 and RMSE. Last but not least, a paired t test was used to compare the performance of the RF models based on the method proposed by Nadeau and Bengio (2003). A 5 % significance level was used for all statistical inferences.
4.1 GPP vs. SIFd relationships
Site-specific relationships
The first aim was to evaluate the strength of the relationships between tower-based GPP and SIFd encompassing different vegetation types at site level. To do so, a hyperbolic model was used to relate GPP to SIFd at each site. Figure 2 shows the relationships between GPP and SIFd at each site. Overall, the results revealed a hyperbolic relationship with relatively saturating GPP in the presence of moderate to high SIFd. However, the relationships between GPP and SIFd are site-dependent, suggesting that the difference in plant functional types and spatial heterogeneity across sites may significantly affect the relationships between GPP and SIFd. The strongest relationships were found at DK-Sor, FR-Fon, DE-Tha, SE-Nor, and BE-Bra, which are the DBF, ENF, and MF vegetation-type sites, with R2 values being between 0.64 and 0.87 (p<0.0001). The weakest relationships were recorded at the FI-Var, FR-EM2, and DE-RuW sites, and no significant relationship was found at GF-Guy, IT-Cp2, and FR-Mej. For each fit, the number of data points was between 160 and 1510, depending on the data availability at each site. Detailed information and statistics on the relationships between GPP and SIFd at each site are given in Table S3. Note that the independent assessment considering the linear model to relate SIFd to GPP at each site and each PFT and data pooled across all sites revealed a relatively consistent lower goodness of fit, justifying the use of a hyperbolic model (see Tables S4 and S5 and Figs. S1, S2, and S3 in the Supplement).
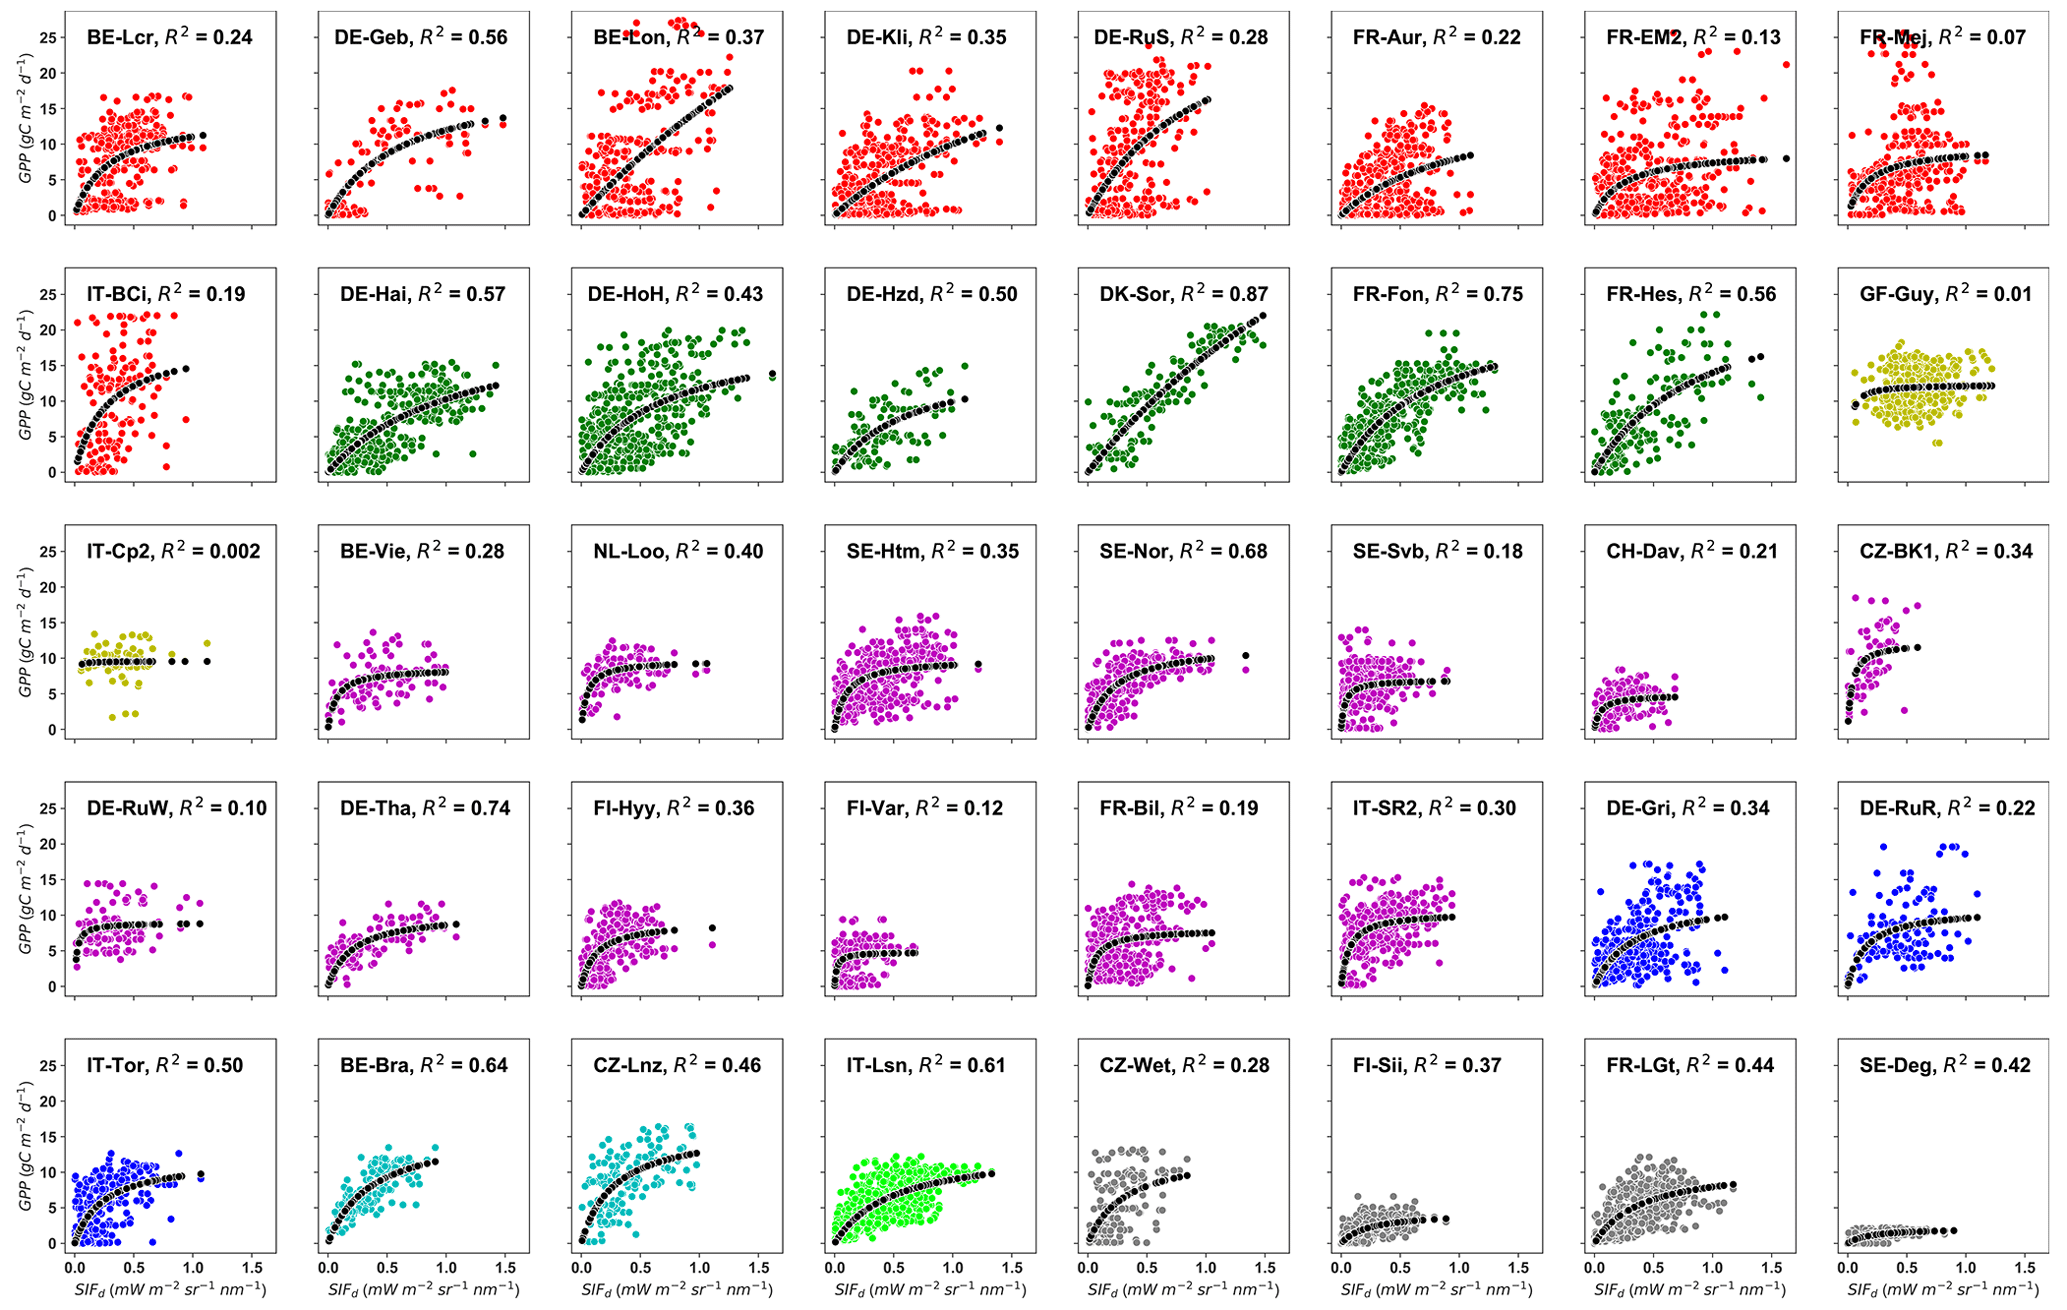
Figure 2Site-specific tower-based GPP and SIFd relationships at daily timescales. R2 represents the coefficient of determination of the relationship between GPP and SIFd for each site. The color code represents the eight different plant functional types encountered at the study sites: red stands for croplands (CROs), green for deciduous broadleaf forests (DBFs), yellow for evergreen broadleaf forests (EBFs), magenta for evergreen needleleaf forests (ENFs), blue for grasslands (GRAs), cyan for mixed forests (MFs), lime for open shrubland (OSH), and dim-grey for wetland (WET). The dotted black line represents the hyperbolic fit between GPP and SIFd. Plant-functional-type-specific and overall site relationships.
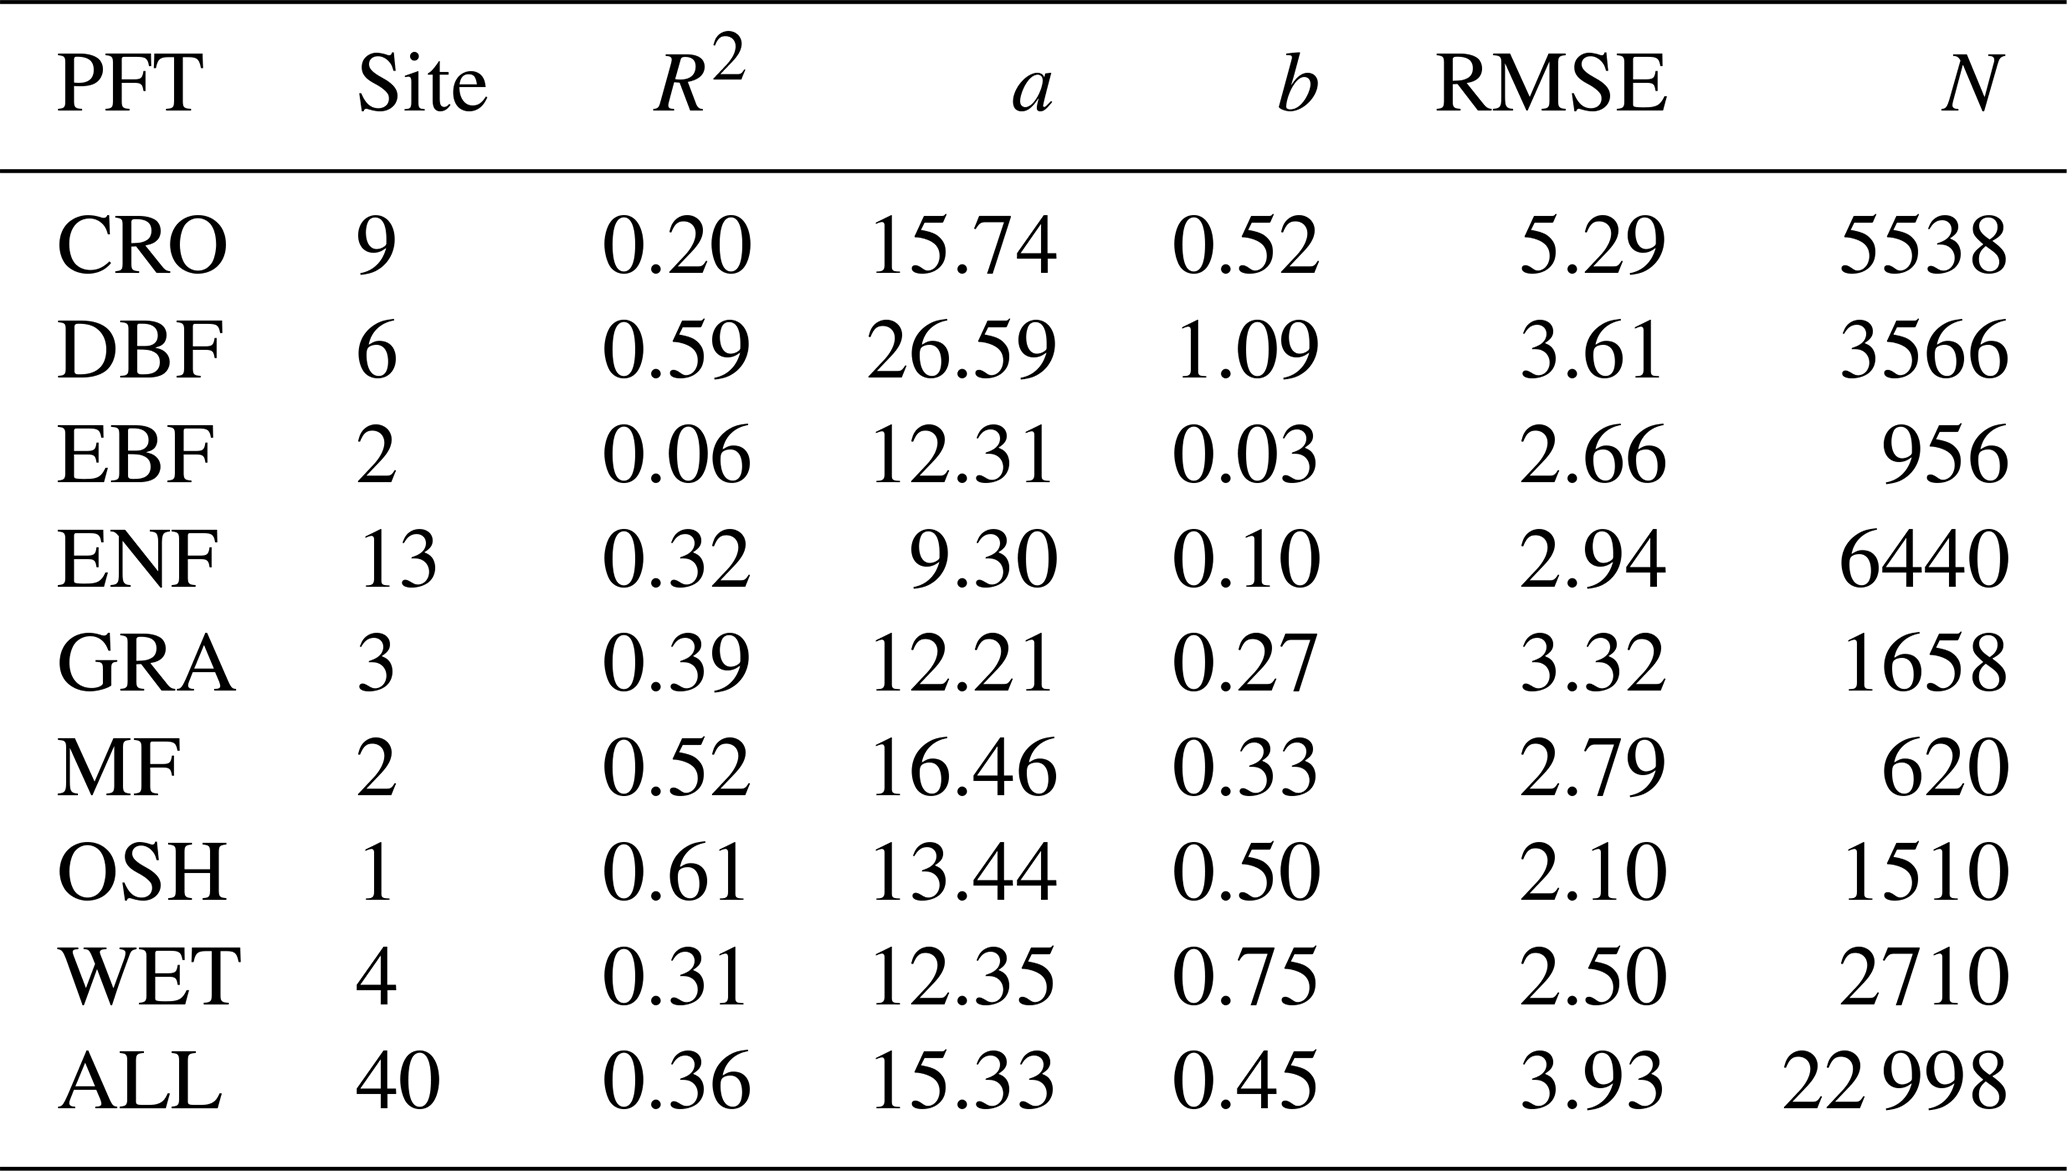
To test the effects of the PFT on the relationship between GPP and SIFd at the daily timescale, data were pooled across sites of the same PFT (MF, CRO, ENF, DBF, EBF, GRA, OSH, and WET), and the hyperbolic model was applied on each PFT. Figure 3 depicts the scatterplots of the relationships between GPP and SIFd. The relationship between GPP and SIFd was statistically significant for all PFTs (R2 = 0.06–0.61, p<0.0001), taken individually. Furthermore, the hyperbolic relationship between GPP and SIFd was the strongest for OSH, DBF, and MF, with an R2 of 0.61, 0.59, and 0.52, respectively, and the lowest for EBF with an R2 of 0.06. This result suggests that the relationships between GPP and SIFd were clearly PFT-specific, as shown in Table 2.
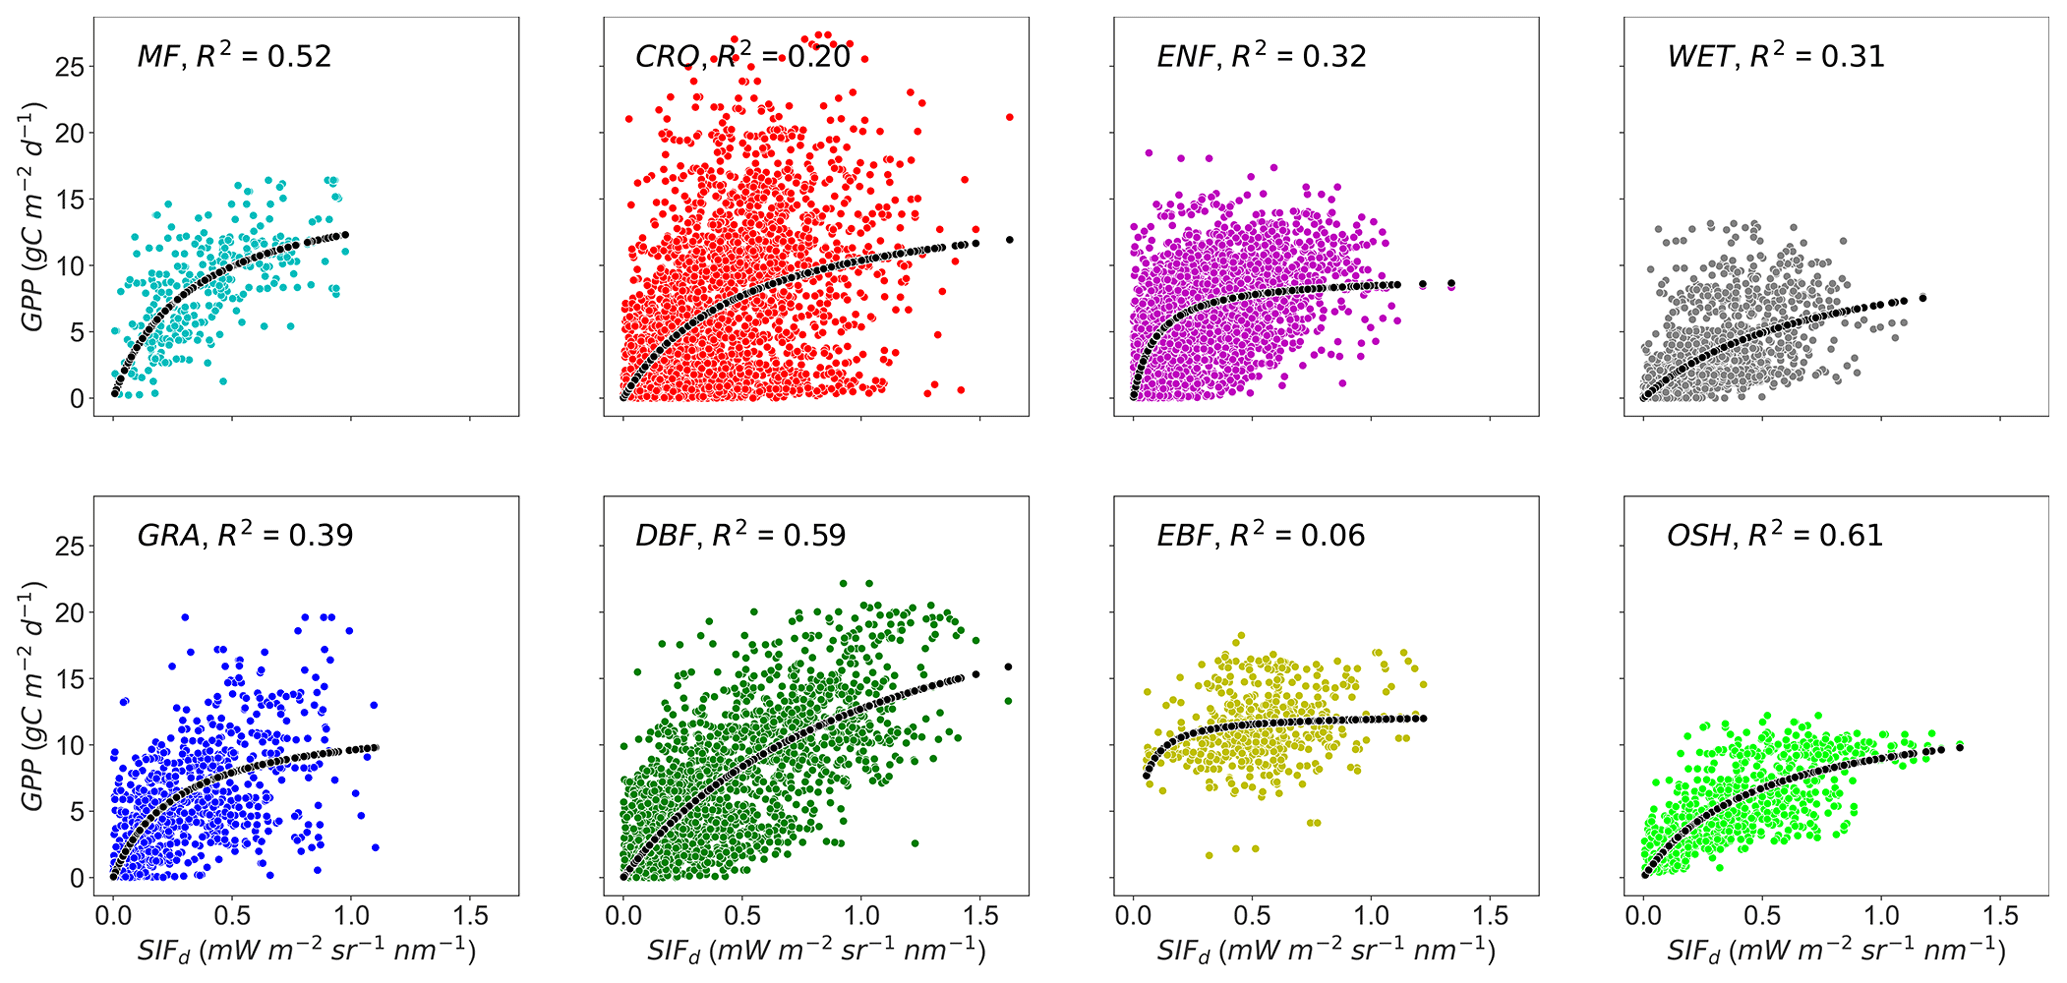
Figure 3Relationships between tower-based GPP and SIFd in eight plant functional types: MF, CRO, ENF, DBF, EBF, GRA, OSH, and WET at daily timescales. R2 represents the coefficient of determination of the relationship between GPP and SIFd. All pairwise relationships between GPP vs. SIFd were statistically significant with p<0.0001. The dotted black line represents the hyperbolic fit between GPP and SIFd.
Table 2Summary statistics of the plant-functional-type-specific GPP and SIFd relationship in eight major PFTs. All pairwise relationships between GPP and SIFd were statistically significant with p<0.0001. a and b denote the fitted parameters from the hyperbolic model. The unit of RMSE is in gC m−2 d−1.
Moreover, the generalizability of the relationship between GPP and SIFd was first tested on data pooled together across all sites (Fig. 4). A significant but weak relationship between GPP and SIFd was found across all sites with an R2 of 0.36 (p<0.0001) and RMSE of 3.93 gC m−2 d−1. However, when the variations between the year, site, and PFT as input variables were included in a GLM, along with GPP, the results showed a strong significant relationship between SIFd, year, site, PFT, and GPP (p<0.001). Furthermore, the interactions between the year and GPP and PFT and GPP were found to have a statistically substantial effect on the SIFd and GPP relationship, while the interaction between the site and GPP was not significant (see Table S5). These findings support that the GPP and SIFd relationship is considerably influenced by the site PFT and the interannual variations in SIFd.
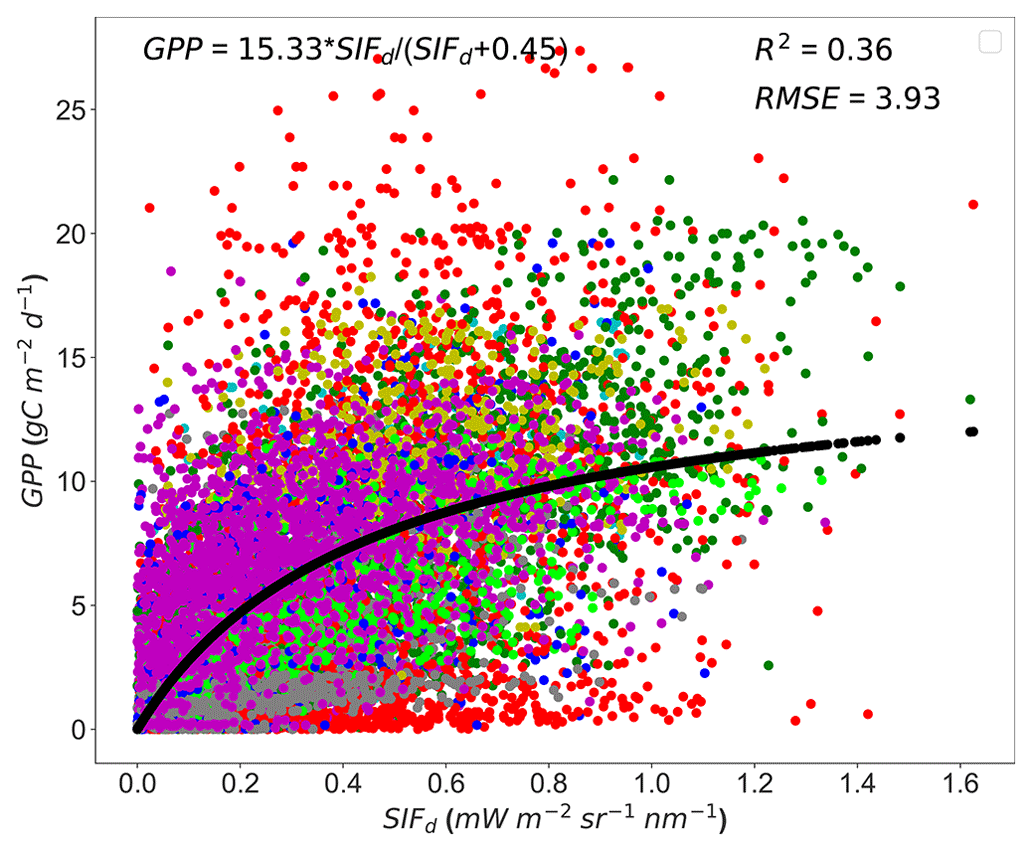
Figure 4Scatterplots of the relationships between tower-based GPP and SIFd in eight PFTs pooled together across all sites. The dotted black line represents the hyperbolic fit between the GPP and SIFd. The color code represents the plant functional types encountered in the study sites: red stands for croplands (CROs), green for deciduous broadleaf forests (DBFs), yellow for evergreen broadleaf forests (EBFs), magenta for evergreen needleleaf forests (ENFs), blue for grasslands (GRAs), cyan for mixed forests (MFs), lime for open shrubland (OSH), and dim-grey for wetland (WET).
4.2 Synergy between SIFd, R, and VIs to quantify GPP
In order to optimize the inputs for the random forest (RF) regression and to avoid the effects of high correlated explanatory variables on the model performance, the correlation matrix was computed. The correlation matrix (supplied in Fig. S4) revealed a strong dependency between predictive variables (notably B9 vs. B10, B11 vs. B12, and B13 vs. B14), indicating that using an RF model built in these variables could be affected by those high correlations. Based on these observations, the R of B10, B12, and B14 was excluded from the explanatory variables of RF regression models.
4.2.1 Performance of GPP estimates using random forest regression
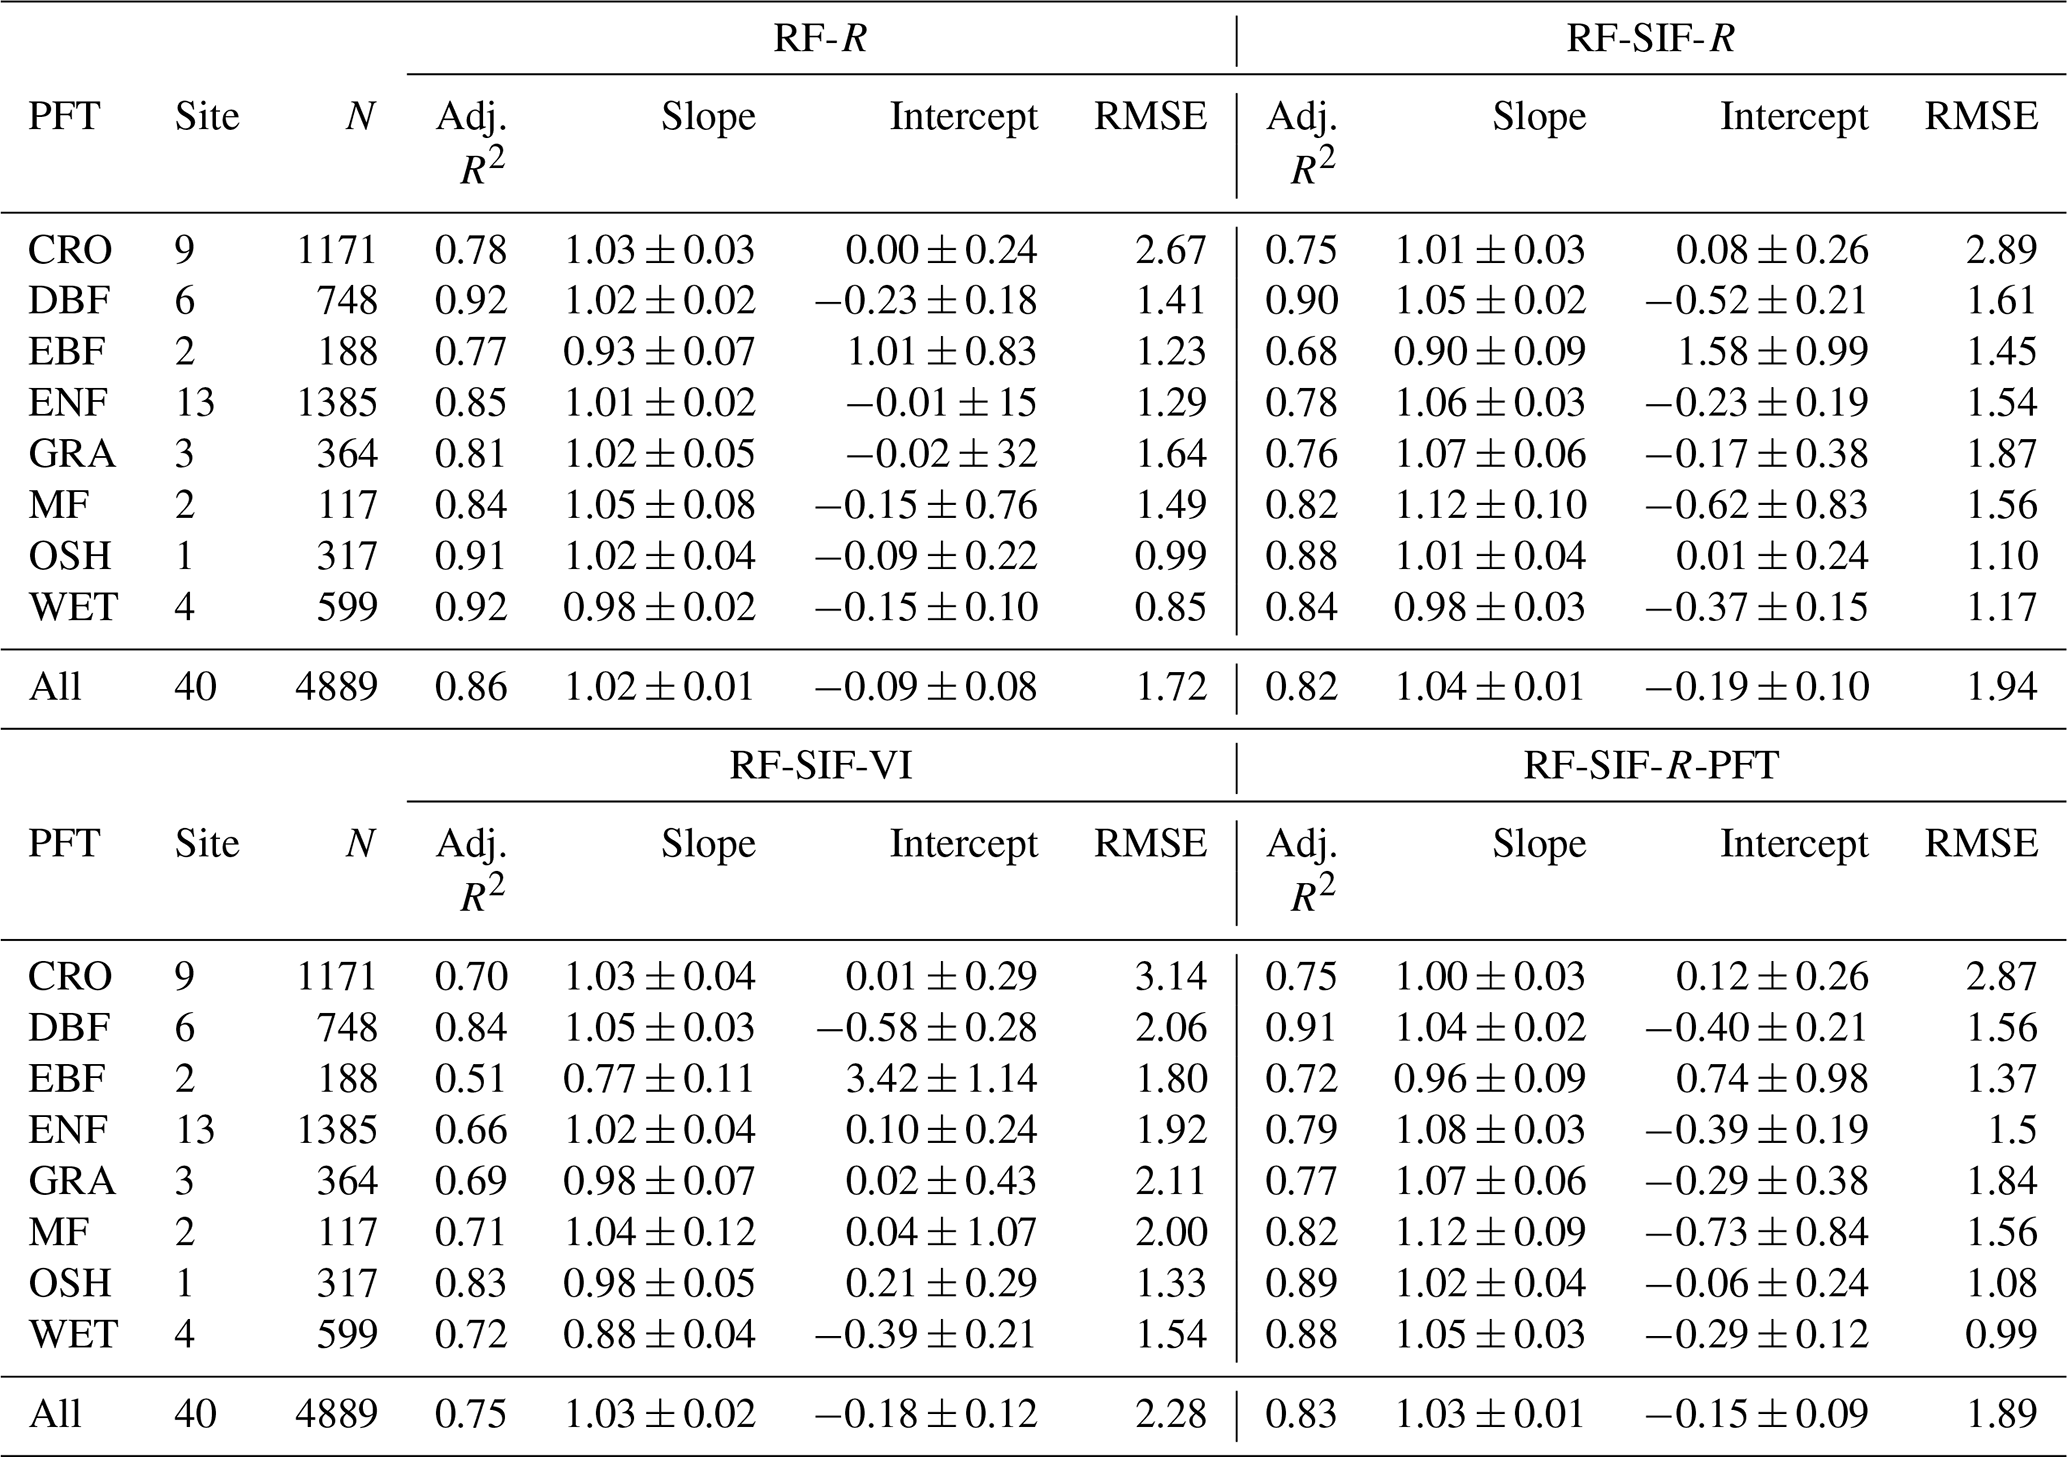
In Fig. 5, tower-based GPP is represented against the four RF GPP models across all sites. Overall, all the RF-model-predicted GPP shows a high agreement with tower-based GPP. Yet, the RF-R model has the strongest relationship with tower-based GPP with an adjusted R2 of 0.86 and RMSE of 1.72 gC m−2 d−1, while the RF-SIF-VI model presents the lowest predictions of GPP, as the adjusted R2 and RMSE were 0.75 and 2.29 gC m−2 d−1, respectively. Furthermore, the RF-SIF-R and RF-SIF-R-PFT model performed similarly well at estimating GPP, as they could explain 82 % and 83 % of the variations in GPP across all sites, respectively. A paired t test realized between the four models based on the adjusted R2 performance revealed that the difference in adjusted R2 between RF-R and RF-SIF-R, RF-R and RF-SIF-R-PFT, and RF-SIF-R and RF-SIF-R-PFT models was not statistically significant. In other words, these three RF models have statistically the same performance.
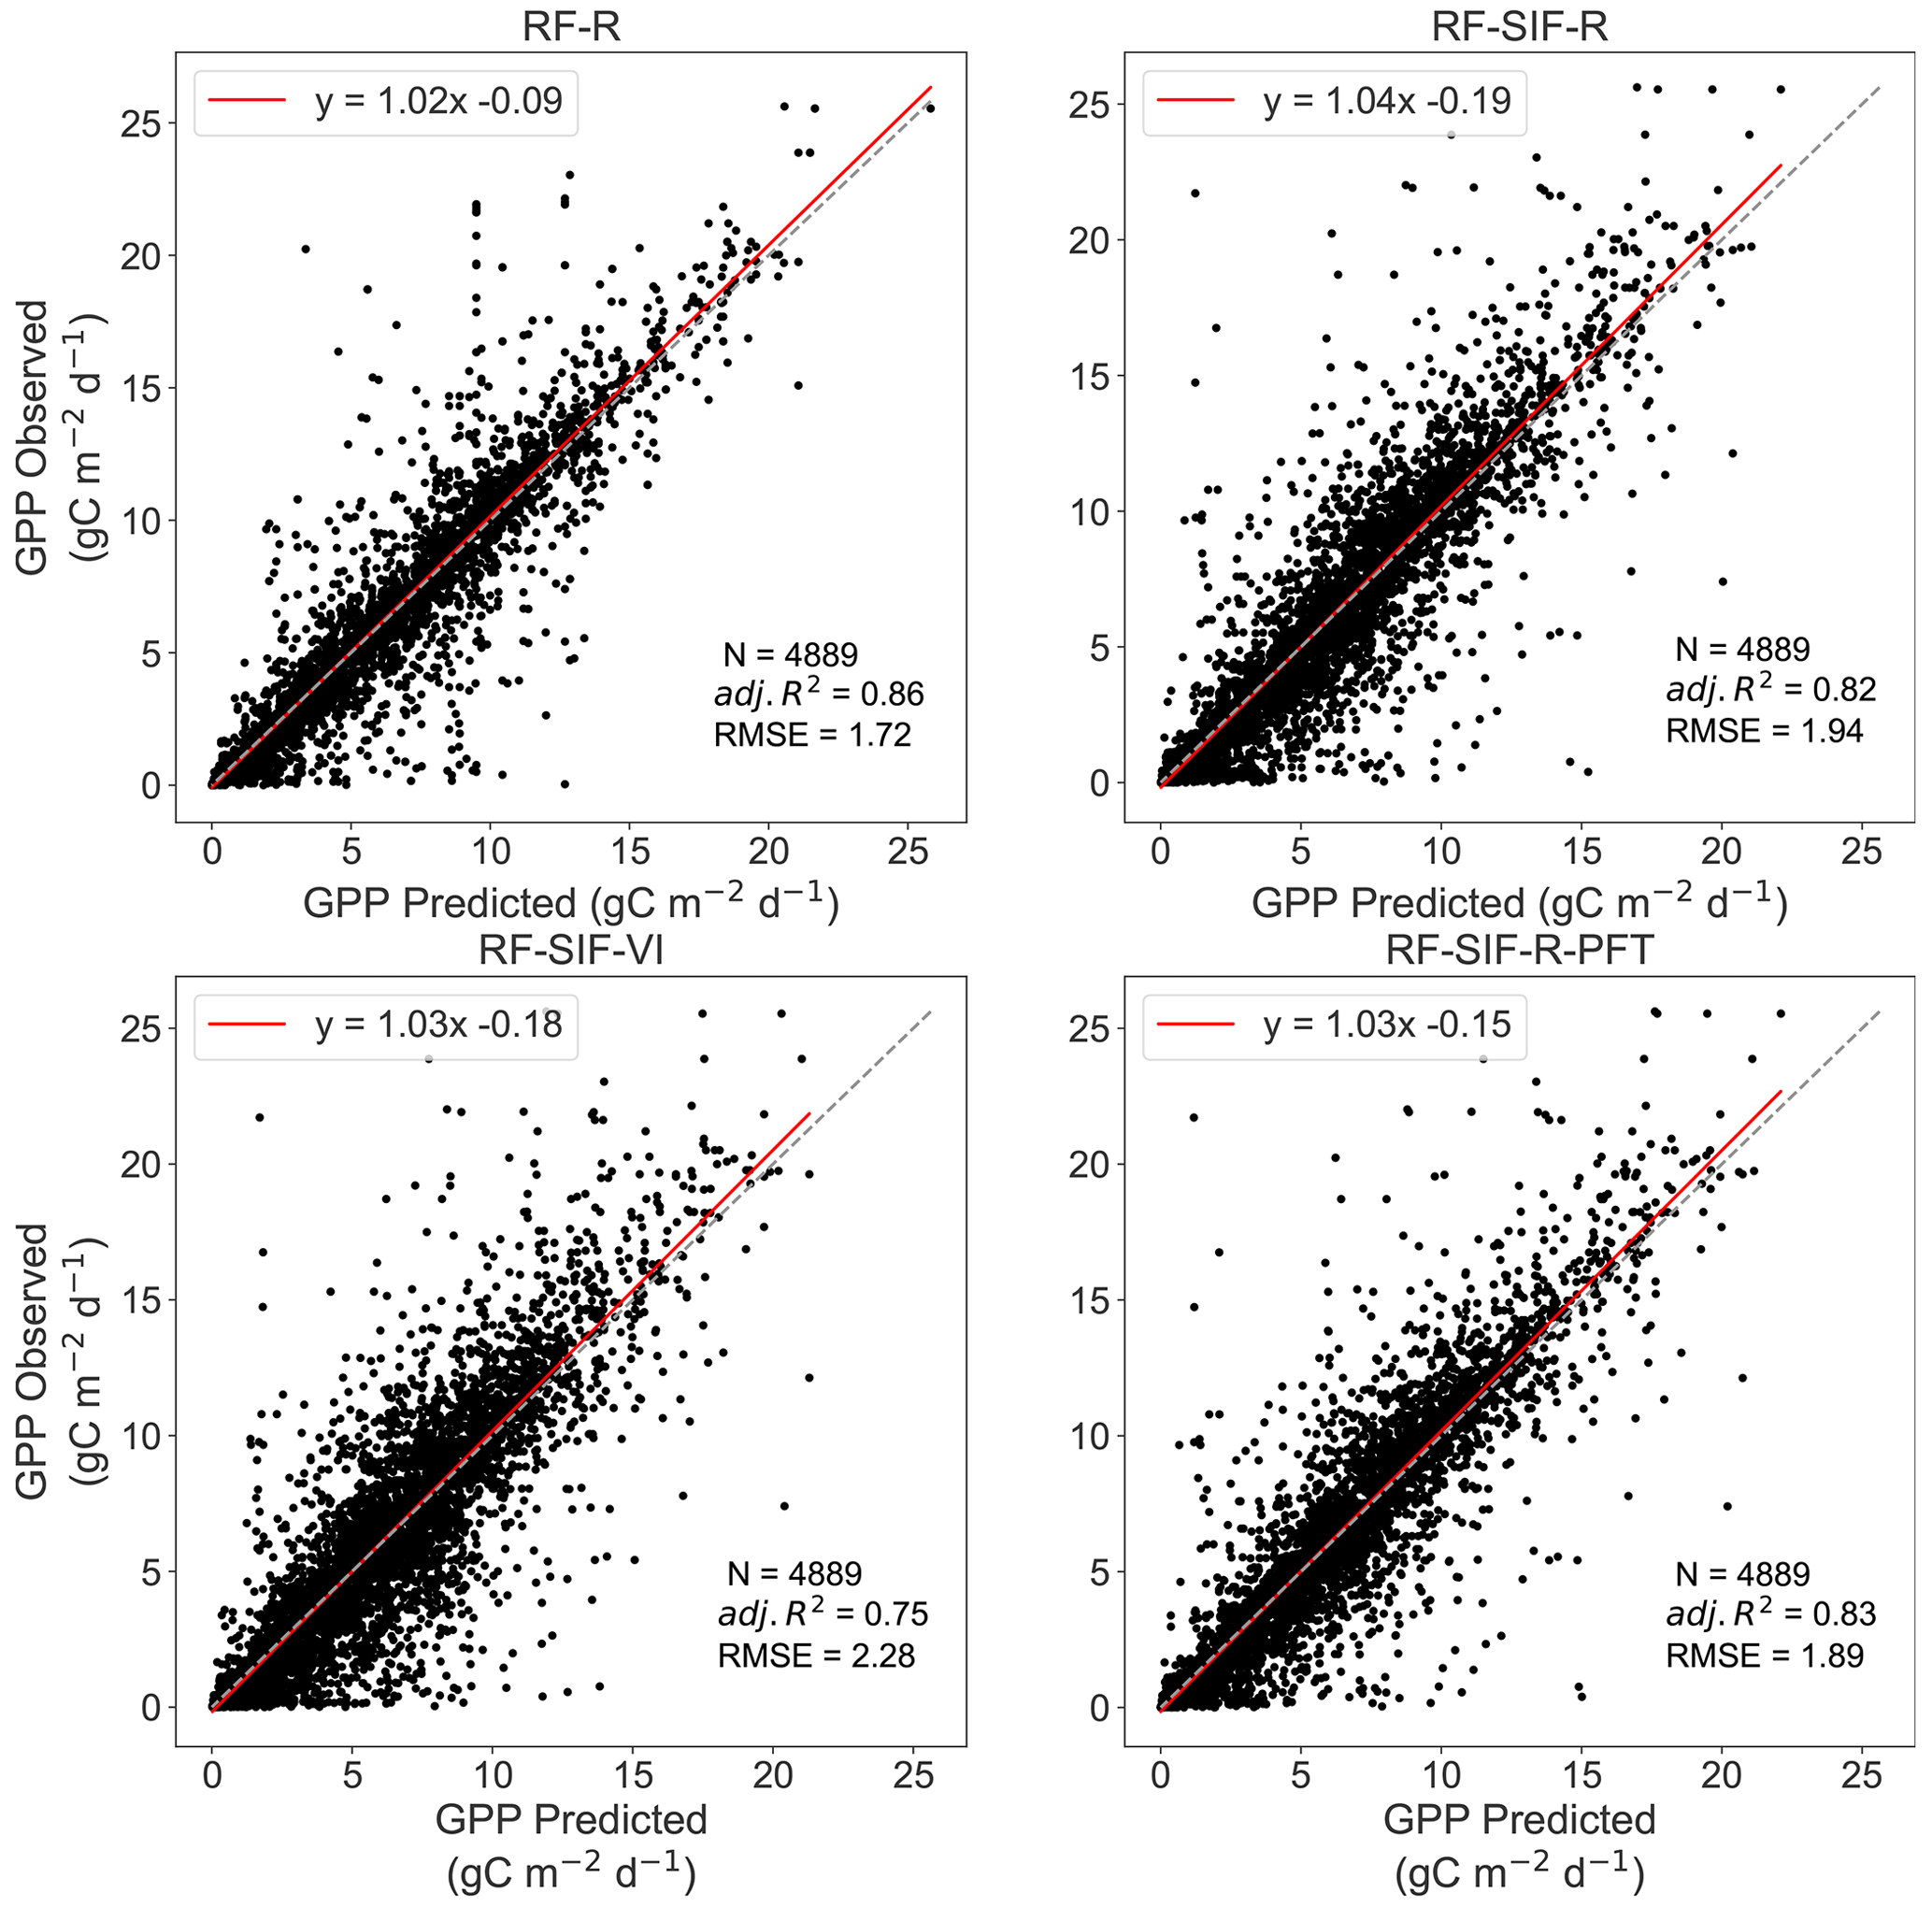
Figure 5Scatterplots of the observed GPP against the RF-predicted GPP across all sites. N denotes the number of data points used for the RF model's testing, adj. R2 represents the adjusted coefficient of determination of the relationship between observed GPP and predicted GPP, and the RMSE is the root mean square error between the observed GPP and RF-model-predicted GPP. The dashed diagonal line depicts the 1 : 1 line. RF-R denotes GPP prediction using only surface spectral reflectance; RF-SIF-R includes R and SIFd as inputs to predict GPP; RF-SIF-VI integrates SIFd and VIs to estimate GPP; and RF-SIF-R-PFT includes R, SIFd, and plant functional type as categorical variables to predict GPP.
The RF regression model's GPP estimates and the observed GPP representing different vegetation types at the site level are depicted in Figs. 6 and 7 for the RF-SIF-R model predictions as an example. The estimates for each site from the other models are presented in the supplementary materials (Fig. S6a RF-R, Fig. S6b RF-R; Fig. S7a RF-SIF-VI, Fig. S7b RF-SIF-VI; and Fig. S8a RF-SIF-R-PFT, Fig. S8b RF-SIF-R-PFT) and the summary statistic results in Table S7 for all RF models. At the site level, the RF-SIF-R model predicted tower-based GPP with high accuracy (adj. R2 = 0.54–0.95), except for three sites such as IT-BCi (adj. R2=0.21), IT-Cp2 (adj. R2=0.25), and SE-Deg (adj. R2=0.41), where the RF-SIF-R model had difficulties in reproducing GPP, even if R2 remains statistically significant at a 5 % probability level. It is worth noting that all other RF models have poor GPP predictions for these aforementioned sites. However, on data pooled across all sites of the same PFT, the RF-SIF-R model shows high performance in estimating GPP for all eight major PFTs with an adj. R2 being between 0.68 and 0.90. The lowest predictions are encountered in the CRO and EBF sites, whereas the best tower-based GPP estimates were found in the DBF and OSH sites.
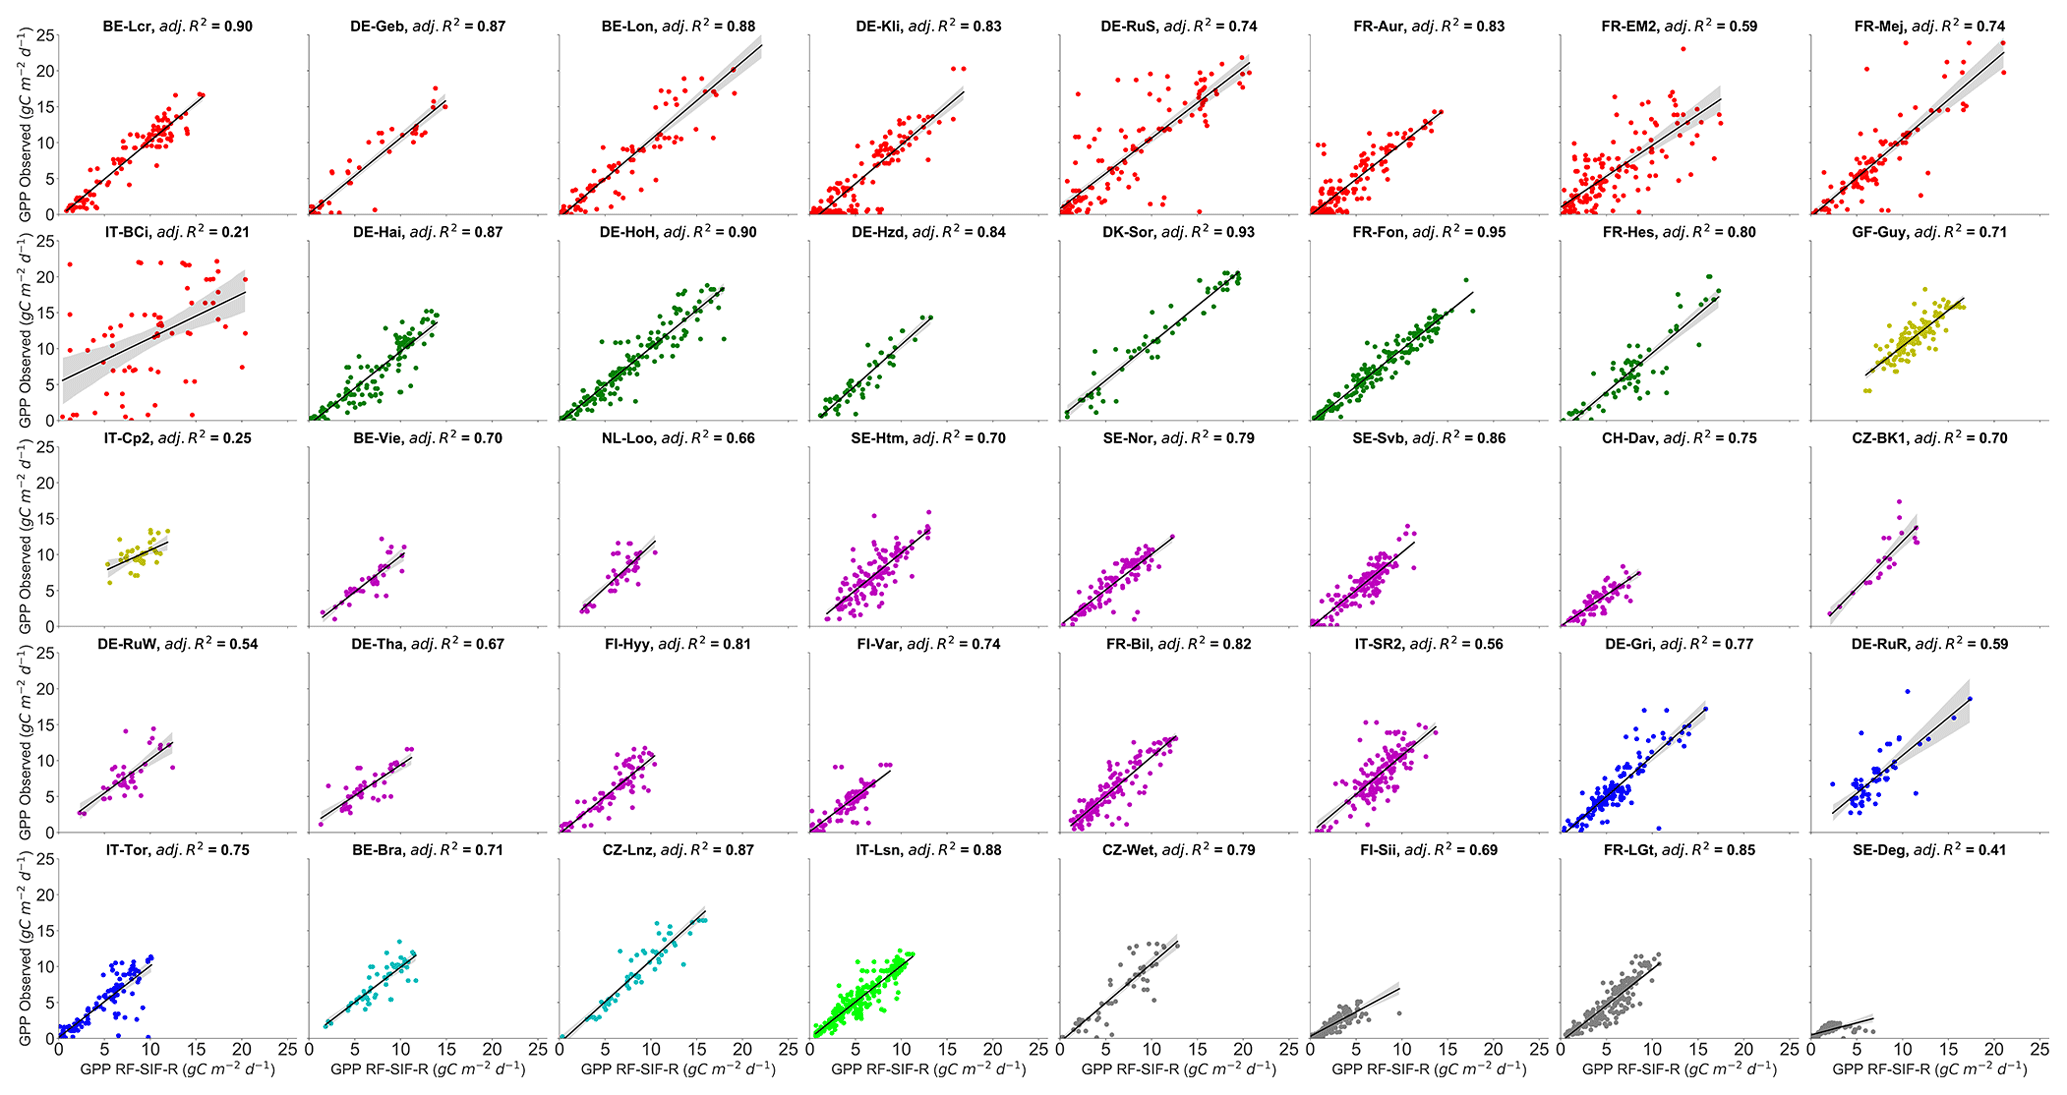
Figure 6Site-specific scatterplots between observed GPP and RF-SIF-R-predicted GPP at daily timescales. The adj. R2 represents the adjusted coefficient of determination of the relationships between observed GPP and predicted GPP. All pairwise relationships between observed GPP vs. predicted GPP were statistically significant at all sites (with p<0.0001). The color code represents the eight different vegetation types encountered in the study sites: red stands for CRO, green for DBF, yellow for EBF, magenta for ENF, blue for GRA, can for MF, lime for OSH, and dim-grey for WET.
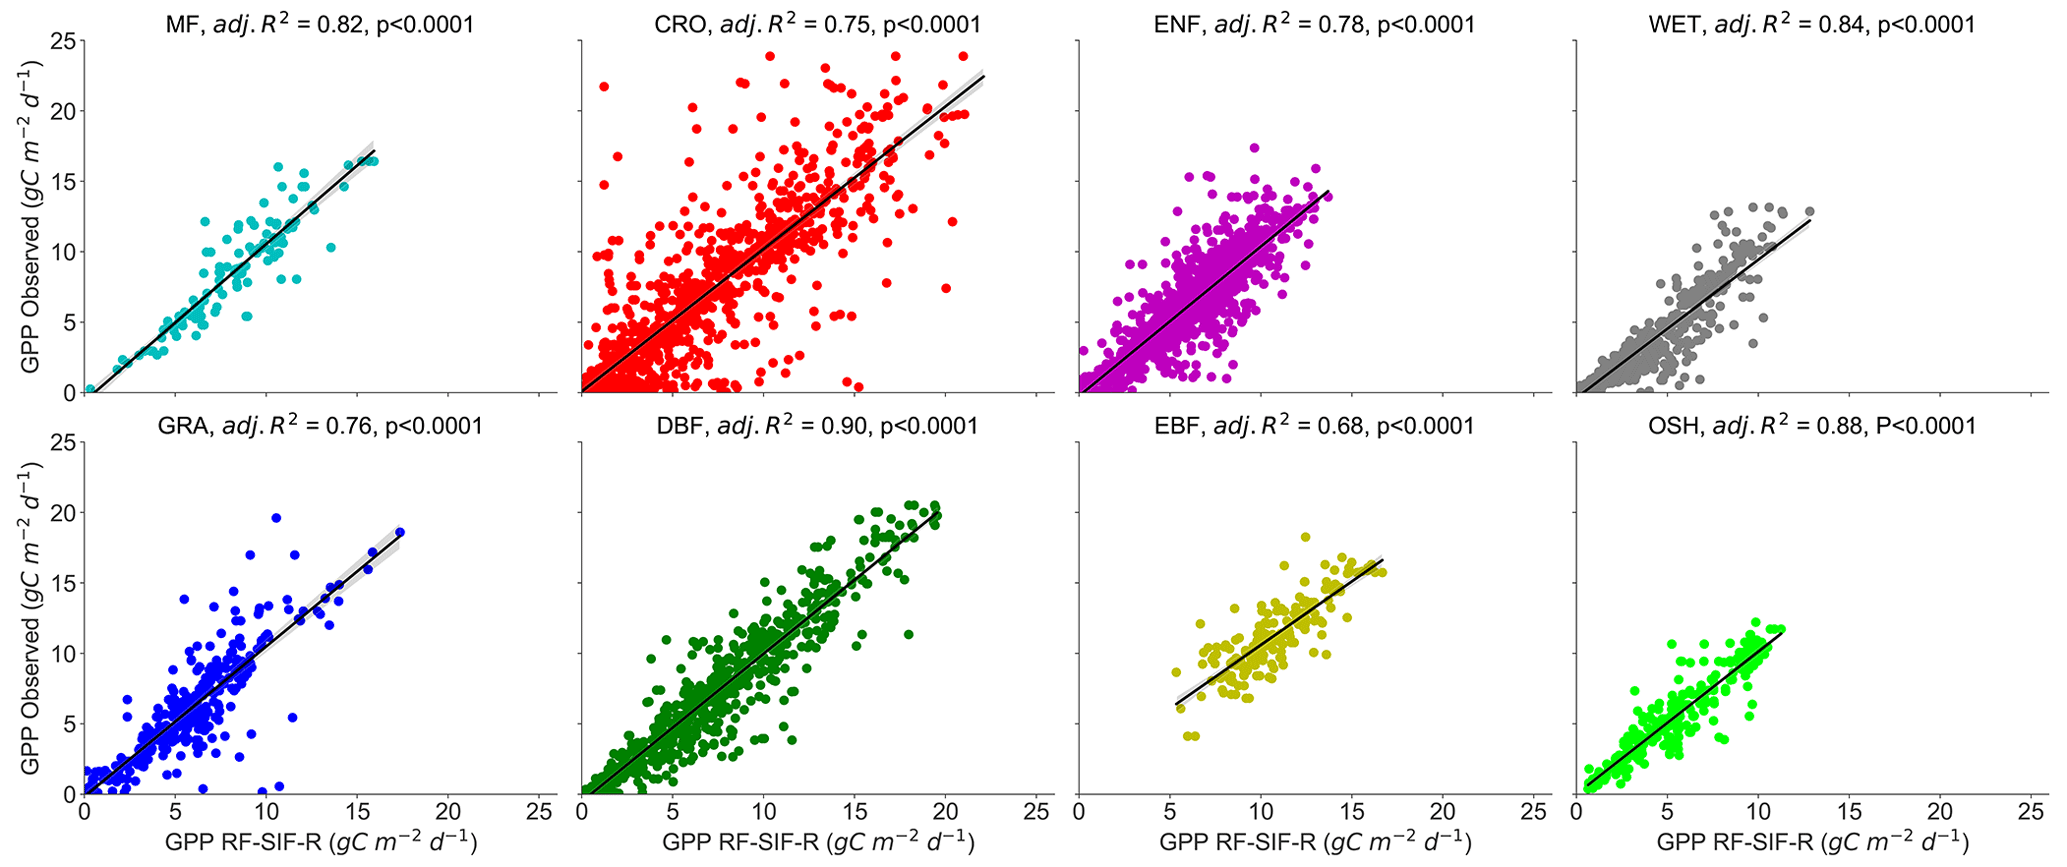
Figure 7Scatterplots of observed GPP against RF-SIF-R-predicted GPP in eight PFTs at daily timescales. The adj. R2 represents the adjusted coefficient of determination of the relationship between observed GPP and predicted GPP. p denotes the probability value of the relationships.
In Fig. 8 and Table 3, the observed and estimated GPP representing different PFTs for all four RF models is depicted. The estimation for each site is given in Fig. S5. Overall, all RF models' GPP predictions capture the seasonal and interannual dynamics of the tower-based GPP very well. However, there are sites, years, and vegetation types where observed GPP cannot be estimated with high accuracy. For instance, the RF models tend to underestimate GPP maxima in GRA, WET, and EBF vegetation types. These underestimates are mostly marked by the slope of the relationships between the observed GPP and predicted GPP in Table 3.
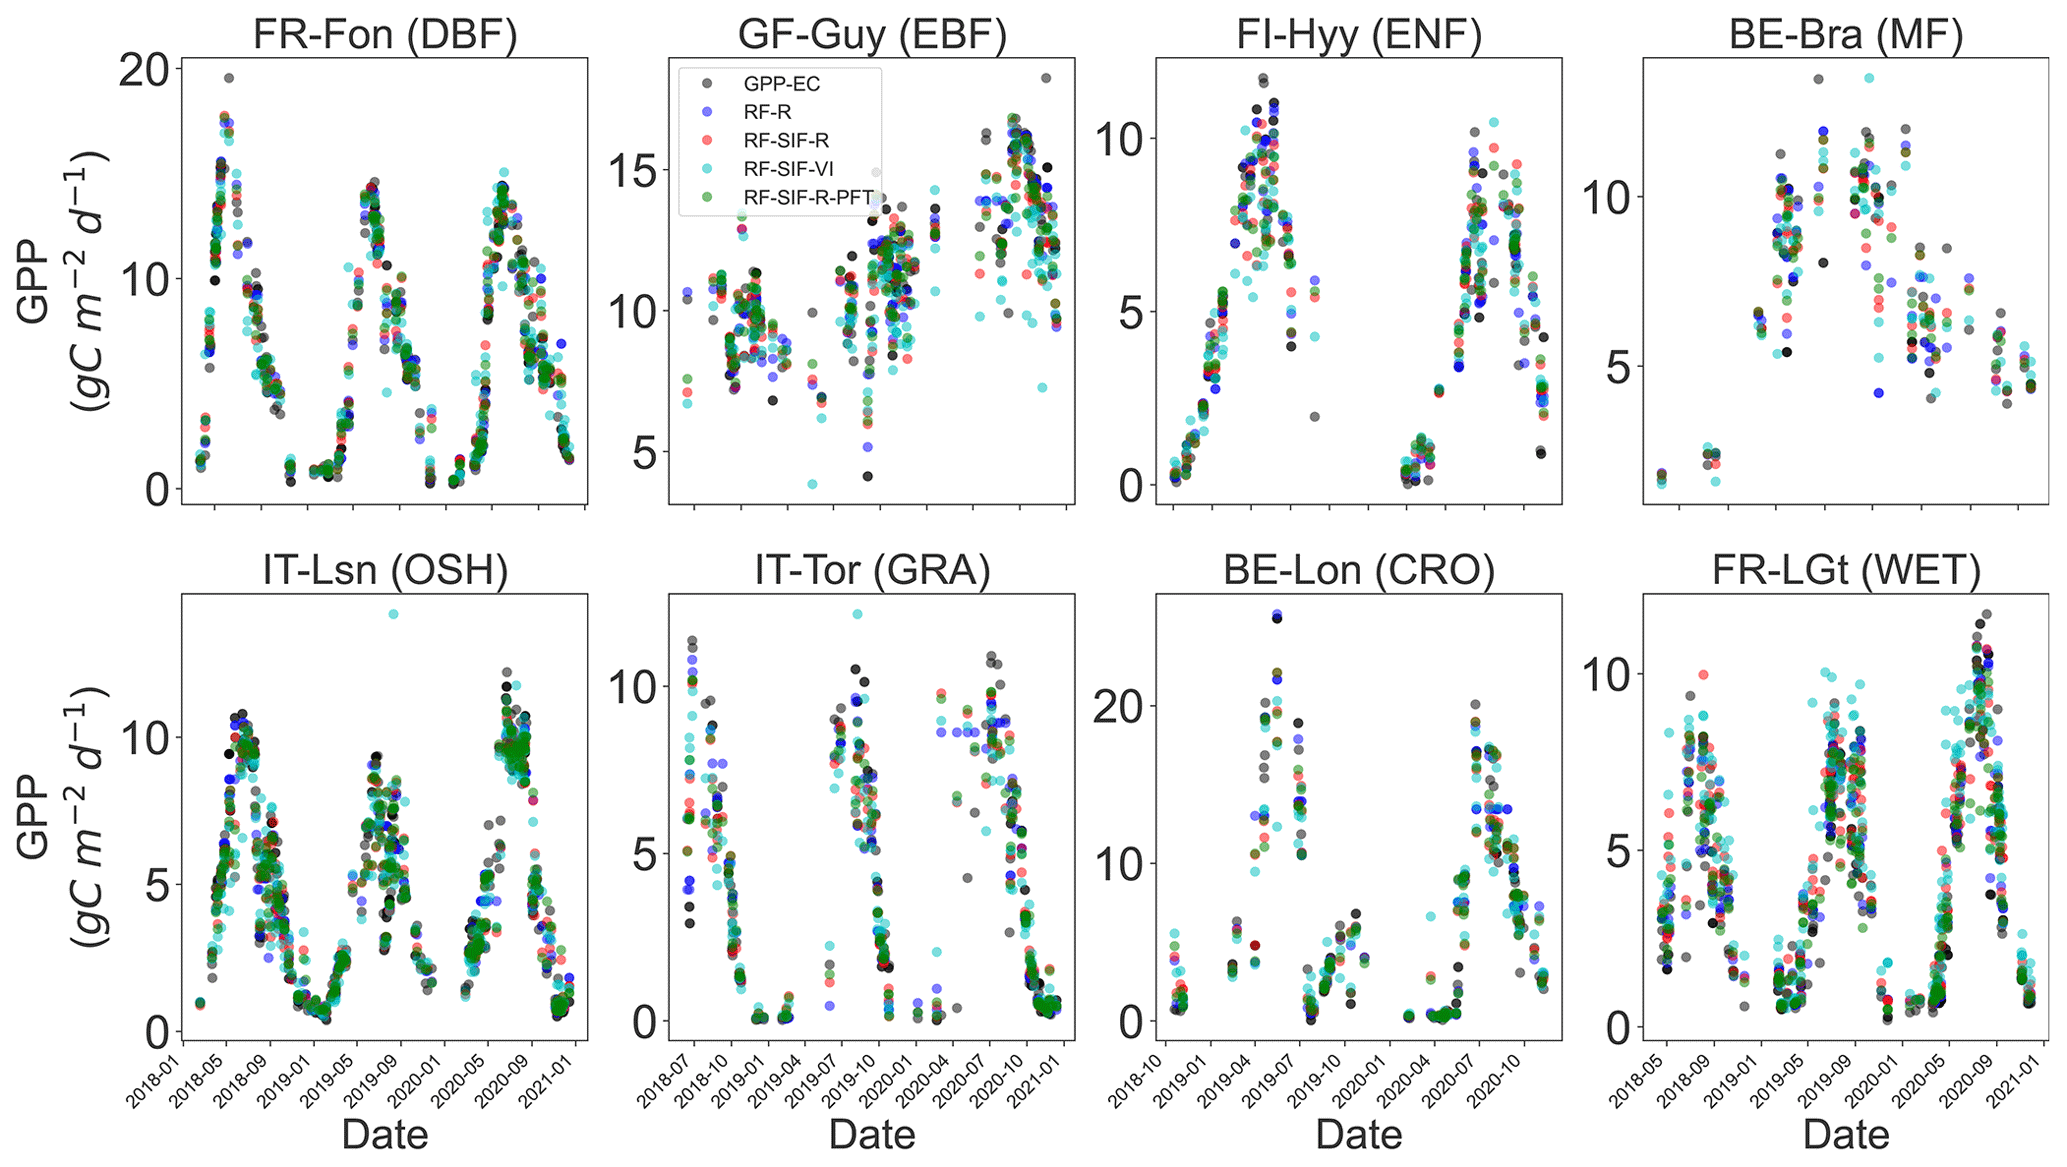
Figure 8Comparison between observed GPP and RF-regression-model-estimated GPP at selected ICOS flux sites representing different PFTs: DBF, EBF, ENF, MF, CRO, GRA, OSH, and WET. The color code represents the different RF GPP predictions and the observed GPP: red stands for RF-SIF-R, green for RF-SIF-R-PFT, blue for RF-R, cyan for RF-SIF-VI, and black for observed GPP.
Table 3Summary statistics of plant-functional-type-specific observed GPP against RF-model-predicted GPP relationships in eight major PFTs: MF, CRO, ENF, DBF, EBF, GRA, OSH, and WET. All pairwise relationships between observed GPP and predicted GPP were statistically significant with p<0.0001. The sign ± denotes the 95 % confidence interval on the slope and intercept of the relationships between observed GPP and predicted GPP.
4.2.2 Relative importance of the predictive variables for predicting GPP
Figure 9 shows the relative importance (or mean decrease in impurity) of the predictive variables of the RF models for predicting GPP across all sites pooled together. Fig. 9 indicates that for the RF-R model, R in the near-infrared (NIR) band (B2: 841–876 nm) and R in the red band (B1: 620–670 nm) were found as the most important input variables for GPP estimates. Moreover, it can be seen that the contribution of the far-red R (B13) in predicting GPP is also important, whereas the contribution of the other R bands was on a similar level. For the RF-SIF-R model, SIFd (>23 %), R in the NIR (B2=17 %), and R in the red band (B1=9 %) are by far the most relevant variables for GPP prediction, while the other variables contribute less to GPP estimates. The RF-SIF-R-PFT model differs from the previous model (RF-SIF-R) only on the plant functional type categorical variable, and its results underline that the plant functional type variable is still important for predicting GPP. Ultimately, reflectance-based vegetation indices are widely used for predicting GPP at larger scales. Hence, it is worthwhile investigating what the contributions of these interesting variables jointly with SIFd in predicting canopy GPP are. The relative importance derived from the RF-SIF-VI model reveals that SIFd (36 %) is substantially the most relevant variable for predicting GPP. The contributions of NIRv and NDVI to the model are comparable, whereas PRI has a lower contribution in estimating GPP.
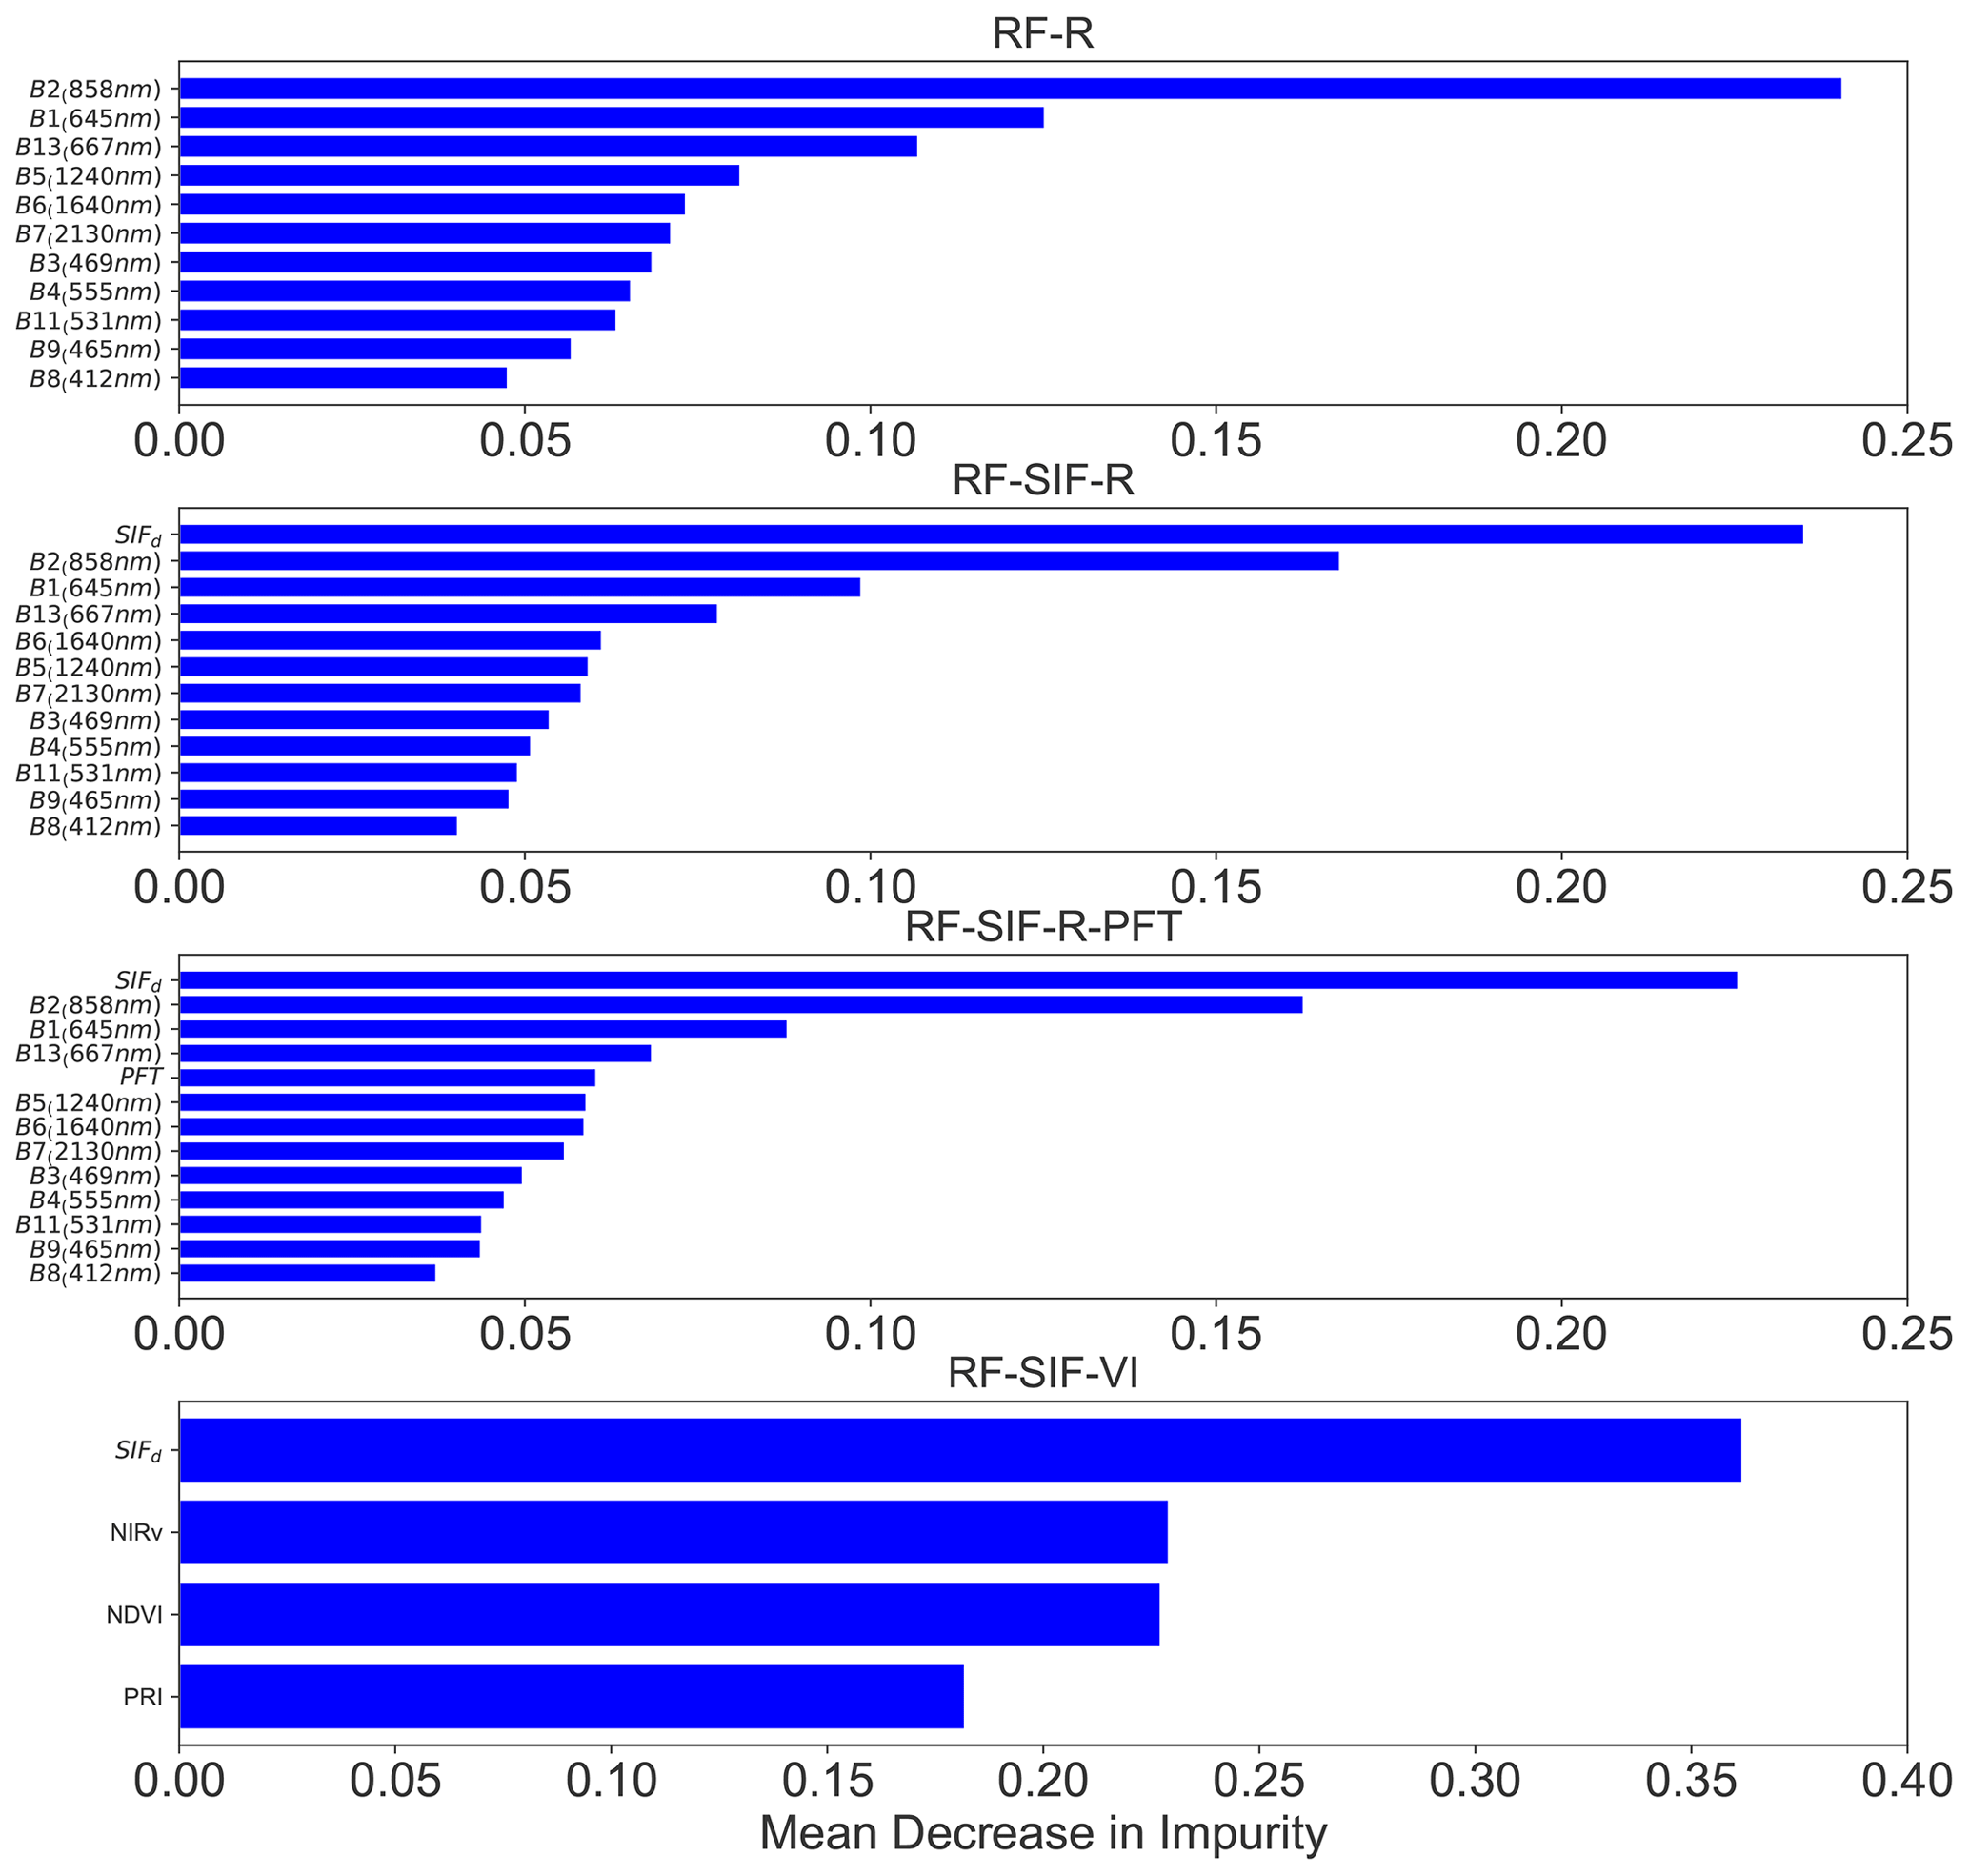
Figure 9Relative importance of predictive variables of the RF models based only on remote sensing data for estimating GPP, except for the RF-SIF-R-PFT model. The RF-R model is based only on MODIS surface spectral reflectance; the RF-SIF-R model uses SIFd and surface reflectance as input variables; the RF-SIF-R-PFT model integrates SIFd, surface reflectance, and PFT as explanatory variables; and the RF-SIF-VI model combines SIFd and reflectance-based indices, notably NDVI, NIRv, and PRI, as input variables for predicting GPP across all sites. The wavelengths depicted on the spectral bands denote the central wavelength.
5.1 Strength of the relationship between GPP and SIFd at site and PFT levels
In this study, the first aim was to evaluate the strength of the relationship between tower-based GPP and SIFd at daily timescales and at different spatial scales (at site and plant functional type levels).
At the site level, the results demonstrate that there were strong and statistically significant relationships between GPP and SIFd. However, the hyperbolic fit between tower-based GPP and SIFd varies significantly across sites, which suggests a site-specific relationship. In other words, at these scales the differential variations in plant physiology and vegetation structure across sites and years and the spatiotemporal dynamics of the flux tower footprints (depending mainly on the height of the tower and wind direction), along with spatial heterogeneity and environmental conditions across sites, may strongly affect first of all the SIF emissions, scattering, and reabsorption across sites and consequently the relationship between GPP and SIFd (Fournier et al., 2012; Paul-Limoges et al., 2018; Tagliabue et al., 2019; Li et al., 2020; Chu et al., 2021; Zhang, et al., 2021b). These results are consistent with previous studies based on ground-based and satellite measurements which found evidence that canopy structure, as well as PFT, has substantial effects on the relationships between GPP and SIF across multiple sites (Dechant et al., 2020; Lu et al., 2020; Li et al., 2018b; Sun et al., 2018; Wang et al., 2020; Hao et al., 2021; Wang et al., 2022). For instance, Wang et al. (2020) found that the relationship between OCO-2 SIF observed at 757 and 771 nm and at tower-based GPP across eight vegetation types at 61 flux sites all over the world relies on canopy structure, and Lu et al. (2020) reported a better relationship between canopy GPP and SIF corrected from reabsorption and scattering effects than top-of-canopy SIF based on ground-based measurements, underlying the importance of canopy structure on SIF and GPP relationships.
Furthermore, these results are also in good agreement with several studies carried out with instantaneous ground-based measurements at different vegetation types and locations (Kim et al., 2021; Damm et al., 2015; He et al., 2020; Gu et al., 2019b). For instance, Kim et al. (2021) pointed out that a hyperbolic model could better explain the relationships between GPP and SIF in an evergreen needle forest, and Damm et al. (2015) showed similar results in cropland, mixed temperate forest, and grassland vegetation types. One of the most plausible explanations is that GPP might reach saturation at a high radiation level, while SIF tends to keep increasing with PAR. It is also paramount to mention that the saturation of optical signal is a common issue in remote sensing, which can explain part of the weaker relationships found in the EBF sites.
The relationship between tower-based GPP and SIFd considering the PFT was also examined. The results revealed a significant PFT-specific GPP and SIFd relationships across all eight major vegetation type. Yet, the hyperbolic relationships between GPP and SIFd vary considerably across PFTs, suggesting a PFT-specific relationship. The relationship between GPP and SIFd is driven by the ratio between canopy photosynthesis light use efficiency and fluorescence yield, and the canopy escape probability fraction (Porcar-Castell et al., 2014; Zhang et al., 2018; Zeng et al., 2019). The major drivers affecting the canopy photosynthesis and SIF yield include among others leaf morphology and orientation, plant physiology, canopy structure (leaf area index, chlorophyll contents, etc.), rapid changes in incident radiation and illuminated canopy surface, different contributions from photosystem I and II, as well as rapid abiotic responses (Porcar-Castell et al., 2014; Mohammed et al., 2019; Gamon et al., 2019; Yang et al., 2021; Chu et al., 2021; Wang et al., 2022). These explanations altogether sustained the PFT-specific GPP vs. SIF relationship, as those factors can differ considerably across PFTs. Additionally, the results showed that the MF, DBF, and OSH sites have the strongest GPP and SIFd relationship, which indicates that SIF may easily capture the seasonal, interannual, and phenological variations in GPP within this vegetation type. In other words, in the MF, DBF, and OSH (one sample of vineyard plantation) biomes, there are explicitly marked seasonal and phenological changes compared to EBFs or ENFs where there is greenness all the time. Thus, in the DBF, MF, and OSH biomes the SIF signal may easily capture the variations in LAI and absorbed PAR and consequently display a high correlation between GPP and SIFd. On the other hand, the lower observed relations between GPP and SIFd in the EBF (GF-Guy and IT-Cp2) sites could be partly explained by a lower spatiotemporal variability in SIF emissions, as well as the contribution effects of the understory vegetation to SIF emissions and uncertainties related to GPP estimates in tropical forests, while in CRO (FR-Mej) the difference in photosynthetic pathways (C3, C4, or a mix of both) and different management practices may be the reasons why SIFd could not capture the variations in GPP, as reported in earlier studies (Li et al., 2018a; Hayek et al., 2018; Mengistu et al., 2020; He et al., 2020; Hornero et al., 2021; Li and Xiao, 2022). Previous studies have also reported weak relationships between GPP and SIF in EBF vegetation-type biomes (Li et al., 2018b; Wang et al., 2020). Moreover, it is worth mentioning that the biases related to cloudless and cloudy skies in space-based SIF retrieval complicate the use of SIF to estimate GPP at the PFT scale because cloudless-sky SIF and cloudless-sky GPP are completely different from cloudy-sky SIF and cloudy-sky GPP, and consequently their relationship may also differ (Miao et al., 2018). Investigating GPP and SIF relationships based only on clear-sky data and cloudy-sky data, without the mix of both, is justified to better understand their links. Ultimately, the PFT-dependent relationships between GPP and SIFd in this study was confirmed by the weak and statistically significant relationship reported for all biomes on data pooled together across all sites. This hypothesis was further supported by the significant effects of the year, site, and PFT on the relationship between SIFd and GPP reported in the GLM. Exploring the newly launched satellite instruments such as OCO-3 and ECOSTRESS and the upcoming FLEX and GeoCarb satellite missions, which are planned to have diurnal sampling or fine spatial resolution (for instance 300 m for FLEX), along with ongoing ground-based and airborne-based SIF and GPP data altogether will improve the ability not only to better understand the GPP and SIF relationship but also to completely decouple the effects of driving factors such as vegetation physiology, canopy structure, and abiotic stress conditions that mediate their relationships at the ecosystem scale.
5.2 Synergy between SIFd, R, and VIs for estimating GPP using random forest
The second goal in this paper was to explore the synergy between SIFd from the TROPOMI instrument and MODIS R and VIs namely NDVI, NIRv, and PRI for predicting GPP on data pooled across all sites. To achieve this purpose, four RF regression models were established: RF-R, RF-SIF-R, RF-SIF-R-PFT, and RF-SIF-VI. Except for the RF-SIF-R-PFT model, the main advantage of using solely remotely sensed data for estimating GPP is that we do not need to rely on land cover type, land cover change, and meteorological data (Xiao et al., 2019).
The current results show that the RF-R (surface spectral reflectance alone), RF-SIF-R (SIFd plus surface spectral reflectance), and RF-SIF-R-PFT (SIFd plus surface spectral reflectance plus PFT) models statistically explain the same variance of GPP at the daily timescale (82 %–86%), whereas the RF-SIF-VI (SIFd plus reflectance-based indices) explains the lowest part, about 75 % of GPP across all sites. It is well known that at the seasonal scale spectral reflectance captures the variations in canopy structure. The seasonal variations in canopy structure, especially LAI, are strongly correlated with variations in GPP (Dechant et al., 2022). This could justify the strong relationship found between tower-based GPP and the predicted GPP by the RF-R model. On the other hand, SIF is an integrative variable at the seasonal and interannual scales as shown in Fig. 9 and the correlation matrix results (a strong contribution of SIF to GPP estimates and a high correlation between GPP and SIFd compared to each R band taken alone). However, SIF, while exhibiting the highest relative importance, fails to improve the GPP estimate. Hence, while being limited by its spatial resolution (7 km × 3.5 km), at which SIF may lose its physiological information and most likely may reflect phenological, structural, and illumination information (Jonard et al., 2020; Kimm et al., 2021), SIF remains a better predictor of GPP than each reflectance band individually. These results also revealed that the RF-SIF-VI has the poorest performance in predicting GPP. This lower performance could be partly due to the well-known saturation of VIs over dense canopies. In addition, the paired t test did not show any statistically significant difference between RF-R and RF-SIF-R models, which confirms the above hypothesis, which suggests that SIF represents the variations in absorbed PAR at these scales. Recently, Pabon-Moreno et al. (2022) used solely Sentinel-2 satellite-derived red-edge-based and near-infrared-based vegetation indices and all spectral bands to predict GPP at daily timescales across 54 EC flux sites using a data-driven approach (random forest). The authors reported that spectral bands jointly with VIs can inform only 66 % of the variance in GPP, which is far less than the here worse-performing model (i.e., RF-SIF-VI) in predicting GPP. The daily scale and solely remotely-sensed-driven RF-R and RF-SIF-R models outperform previous GPP products derived based on data-driven methods (Wolanin et al., 2019; Tramontana et al., 2016; Jung et al., 2019) and process-based models (Jiang and Ryu, 2016; Zhang et al., 2017; Lin et al., 2019), which included even more inputs as predictive variables such as meteorological data, land-cover-type data, and land-cover-change data and were conducted mostly at longer timescales (8 d or monthly timescale) compared to this study. Furthermore, these results are in strong agreement to two recent studies (Cho et al., 2021; Li et al., 2021). More specifically, Cho et al. (2021) found that remotely sensed data alone can explain 81 % of GPP variability across four vegetation types, including ENF, EBF, DBF, and MF, in South Korea at 8 d timescales, and Li et al. (2021) pointed out that instantaneous GPP estimates across 56 flux tower sites could be achieved with an R2 of 0.88 and RMSE of 2.42 µmol CO2 m−2 s−1 using ECOSTRESS land surface temperature, daily MODIS satellite data, and meteorological data from ERA5 reanalysis. This study also revealed that GPP prediction can be achieved with high accuracy based on solely remotely sensed data that are widely and publicly available for all.
The RF models could clearly capture the GPP variations at each site, encompassing different vegetation types as shown in Figs. 6 and 8. Indeed, there are sites, years, and vegetation types where tower-based GPP was underestimated, which were the cases for WET and EBF vegetation types. Furthermore, all RF models struggle to accurately estimate tower GPP at the IT-BCi, IT-Cp2, and SE-Deg sites, owing most likely to SIF pixel heterogeneities and lower GPP values observed in these sites, along with previously explained issues associated with estimating GPP in crops and tropical stands. Similar results were reported recently in Pabon-Moreno et al. (2022), including eight vegetation types (ENF, CRO, DBF, GRA, WET, MF, savannah (SAV), and OSH). The reason behind these poor performances may also be related to difficulties in detecting abiotic stress conditions (Bodesheim et al., 2018), underscoring the need for more research on predicting GPP during extreme abiotic conditions.
Furthermore, in this study it is determined what the main variables contributing to GPP prediction are using the four RF models based on the relative importance metric of each model. Yet, it is found that SIFd, the R in the NIR band (B2), the red band (B1), and the far-red band (B13), as well as the vegetation type, NDVI, and NIRv, seem to provide useful information for the predictions of GPP as shown in Fig. 9. B2 and B1 are well-known spectral bands for characterizing vegetation canopy structure, seasonal phenology, canopy scattering, and reabsorption due to chlorophyll content within leaves and consequently have a dominant role in estimating GPP across all sites. The high contribution of SIFd is presumably due to its integrative role at the seasonal and interannual scales, as explained previously (Maguire et al., 2020; Dechant et al., 2022). PRI is known to be implied in the xanthophyll cycle, which is an important photoprotection mechanism and a driver of GPP (Wang et al., 2020; Hmimina et al., 2015; Soudani et al., 2014). However, in this study, the findings evidenced that the contribution of PRI in predicting GPP was weak, which could be explained by the spatial and temporal aggregation of the rapid responses in plant physiological and functional activities, observable at the finer scales (diurnal). Ultimately, the findings in this study suggest that using R bands and SIF for estimating GPP is an important approach for improving GPP predictions compared to GPP products that include meteorological and land-cover-type information.
In this study, the strength of the relationships between tower-based GPP and SIFd encompassing eight major plant functional types (PFTs) at site and interannual scales was evaluated, and the synergy between SIFd, surface spectral reflectance, and reflectance-based indices, namely NDVI, NIRv, and PRI, to improve GPP estimates using a data-driven modeling approach was examined.
At the site scale, the results showed a strong and statistically significant hyperbolic relationship between GPP and SIFd (p<0.0001). However, these relationships were site-dependent, indicating that canopy structure and environmental conditions affect the relationship between GPP and SIFd. The GPP and SIFd relationships across all sites of the same PFT were considerably significant and were PFT-specific. Furthermore, it was also found that the relationships between GPP and SIFd on data pooled across all sites were moderately weak but statistically significant, confirming the PFT dependence of the relationship between GPP and SIFd. The GLM results supported this PFT-dependent relationship between GPP and SIFd, as the site, year, and PFT have meaningful effects on the slope of the relationship between GPP and SIFd.
This study also demonstrated that the spectral reflectance bands and SIFd plus reflectance explained over 80 % of the tower-based GPP variance. The RF models were able to represent the GPP seasonal and interannual variabilities across all sites. In addition, from the mean decrease in impurity results obtained from the RF models, it is inferred that the spectral reflectance bands in the near-infrared, red, and SIFd appeared as the most influential and dominant factors determining GPP predictions. In summary, this study provides insights into understanding the strength of the relationships between GPP and SIF across different ICOS flux sites and the use of daily MODIS R and SIFd TROPOMI in predicting GPP across different vegetation types.
The computer codes (MATLAB and Python) used in this study are available upon request to the corresponding author. Observations of carbon fluxes are available through the ICOS Data Portal services (https://doi.org/10.18160/PAD9-HQHU, ICOS RI, 2022; https://doi.org/10.18160/YVR0-4898, Drought 2018 Team and ICOS Ecosystem Thematic Centre, 2020). SIF data from the TROPOMI instrument satellite are available through (https://doi.org/10.22002/D1.1347, Koehler and Frankenberg, 2021). Daily MODIS Aqua and Terra spectral reflectance data are available through Google Earth Engine (https://earthengine.google.com/, last access: 18 October 2021; https://doi.org/10.5067/MODIS/MOD09GA.006, Vermote and Wolfe, 2015a; https://doi.org/10.5067/MODIS/MYD09GQ.006, Vermote and Wolfe, 2015b). Merged datasets are available upon request to the corresponding author.
The supplement related to this article is available online at: https://doi.org/10.5194/bg-20-1473-2023-supplement.
All authors contributed to the manuscript conceptualization. HB performed the data collection and preparation. HB and GH performed the data pre-processing and analyses and prepared the figures. HB led the writing of the manuscript with contributions from all authors. KS, YG, GH, and GL supervised the project.
The contact author has declared that none of the authors has any competing interests.
Publisher's note: Copernicus Publications remains neutral with regard to jurisdictional claims in published maps and institutional affiliations.
We thank Philip Köehler and Christian Frankenberg at Caltech for making the TROPOMI SIF data available. We would also like to thank all Integrated Carbon Observatory System (ICOS) PIs for providing the site-level tower-based GPP data through the ICOS Data Portal services. Site ID and names and locations are listed in Table S1 in the Supplement, Sect. S1.
This ongoing PhD work is jointly funded by the Centre National d'Études Spatiales (CNES) and ACRI-ST (Toulouse, France) (contract CNES-ACRI-ST-Ecole polytechnique-CNRS no. 3425). This work was also supported by CNES through the VELIF project focused on the FLEX mission (contracts 4500073234 and 4500073501), the Programme National de Télédétection Spatiales (PNTS) across the C-FLEX project and EIT Climate-KIC project via the Agriculture Resilience, Inclusive, and Sustainable Enterprise (ARISE) project (EIT 190733).
This paper was edited by Eyal Rotenberg and reviewed by Mukund Palat Rao and one anonymous referee.
Badgley, G., Field, C. B., and Berry, J. A.: Canopy near-infrared reflectance and terrestrial photosynthesis, Sci. Adv., 3, e1602244, https://doi.org/10.1126/sciadv.1602244, 2017.
Baldocchi, D. D., Ryu, Y., Dechant, B., Eichelmann, E., Hemes, K., Ma, S., Sanchez, C. R., Shortt, R., Szutu, D., Valach, A., Verfaillie, J., Badgley, G., Zeng, Y., and Berry, J. A.: Outgoing Near-Infrared Radiation From Vegetation Scales With Canopy Photosynthesis Across a Spectrum of Function, Structure, Physiological Capacity, and Weather, J. Geophys. Res.-Biogeo., 125, e2019JG005534, https://doi.org/10.1029/2019JG005534, 2020.
Bodesheim, P., Jung, M., Gans, F., Mahecha, M. D., and Reichstein, M.: Upscaled diurnal cycles of land–atmosphere fluxes: a new global half-hourly data product, Earth Syst. Sci. Data, 10, 1327–1365, https://doi.org/10.5194/essd-10-1327-2018, 2018.
Breiman, L.: Random Forests, Mach. Learn., 45, 5–32, https://doi.org/10.1023/A:1010933404324, 2001.
Buchhorn, M., Smets, B., Bertels, L., Roo, B. D., Lesiv, M., Tsendbazar, N.-E., Li, L., and Tarko, A.: Copernicus Global Land Service: Land Cover 100 m: version 3 Globe 2015–2019: Product User Manual, Zenodo [data set], https://doi.org/10.5281/ZENODO.3938963, 2020.
Cho, S., Kang, M., Ichii, K., Kim, J., Lim, J.-H., Chun, J.-H., Park, C.-W., Kim, H. S., Choi, S.-W., Lee, S.-H., Indrawati, Y. M., and Kim, J.: Evaluation of forest carbon uptake in South Korea using the national flux tower network, remote sensing, and data-driven technology, Agr. Forest Meteorol., 311, 108653, https://doi.org/10.1016/j.agrformet.2021.108653, 2021.
Chou, S., Chen, J., Yu, H., Chen, B., Zhang, X., Croft, H., Khalid, S., Li, M., and Shi, Q.: Canopy-Level Photochemical Reflectance Index from Hyperspectral Remote Sensing and Leaf-Level Non-Photochemical Quenching as Early Indicators of Water Stress in Maize, Remote Sens., 9, 794, https://doi.org/10.3390/rs9080794, 2017.
Chu, H., Luo, X., Ouyang, Z., Chan, W. S., Dengel, S., Biraud, S. C., Torn, M. S., Metzger, S., Kumar, J., Arain, M. A., Arkebauer, T. J., Baldocchi, D., Bernacchi, C., Billesbach, D., Black, T. A., Blanken, P. D., Bohrer, G., Bracho, R., Brown, S., Brunsell, N. A., Chen, J., Chen, X., Clark, K., Desai, A. R., Duman, T., Durden, D., Fares, S., Forbrich, I., Gamon, J. A., Gough, C. M., Griffis, T., Helbig, M., Hollinger, D., Humphreys, E., Ikawa, H., Iwata, H., Ju, Y., Knowles, J. F., Knox, S. H., Kobayashi, H., Kolb, T., Law, B., Lee, X., Litvak, M., Liu, H., Munger, J. W., Noormets, A., Novick, K., Oberbauer, S. F., Oechel, W., Oikawa, P., Papuga, S. A., Pendall, E., Prajapati, P., Prueger, J., Quinton, W. L., Richardson, A. D., Russell, E. S., Scott, R. L., Starr, G., Staebler, R., Stoy, P. C., Stuart-Haëntjens, E., Sonnentag, O., Sullivan, R. C., Suyker, A., Ueyama, M., Vargas, R., Wood, J. D., and Zona, D.: Representativeness of Eddy-Covariance flux footprints for areas surrounding AmeriFlux sites, Agr. Forest Meteorol., 301–302, 108350, https://doi.org/10.1016/j.agrformet.2021.108350, 2021.
Damm, A., Elbers, J., Erler, A., Gioli, B., Hamdi, K., Hutjes, R., Kosvancova, M., Meroni, M., Miglietta, F., Moersch, A., Moreno, J., Schickling, A., Sonnenschein, R., Udelhoven, T., Van Der LINDEN, S., Hostert, P., and Rascher, U.: Remote sensing of sun-induced fluorescence to improve modeling of diurnal courses of gross primary production (GPP): RS OF SUN-INDUCED FLUORESCENCE TO IMPROVE MODELING OF GPP, Glob. Change Biol., 16, 171–186, https://doi.org/10.1111/j.1365-2486.2009.01908.x, 2010.
Damm, A., Guanter, L., Paul-Limoges, E., van der Tol, C., Hueni, A., Buchmann, N., Eugster, W., Ammann, C., and Schaepman, M. E.: Far-red sun-induced chlorophyll fluorescence shows ecosystem-specific relationships to gross primary production: An assessment based on observational and modeling approaches, Remote Sens. Environ., 166, 91–105, https://doi.org/10.1016/j.rse.2015.06.004, 2015.
Daumard, F., Goulas, Y., Champagne, S., Fournier, A., Ounis, A., Olioso, A., and Moya, I.: Continuous Monitoring of Canopy Level Sun-Induced Chlorophyll Fluorescence During the Growth of a Sorghum Field, IEEE T. Geosci. Remote Sens., 50, 4292–4300, https://doi.org/10.1109/TGRS.2012.2193131, 2012.
Dechant, B., Ryu, Y., Badgley, G., Zeng, Y., Berry, J. A., Zhang, Y., Goulas, Y., Li, Z., Zhang, Q., Kang, M., Li, J., and Moya, I.: Canopy structure explains the relationship between photosynthesis and sun-induced chlorophyll fluorescence in crops, Remote Sens. Environ., 241, 111733, https://doi.org/10.1016/j.rse.2020.111733, 2020.
Dechant, B., Ryu, Y., Badgley, G., Köhler, P., Rascher, U., Migliavacca, M., Zhang, Y., Tagliabue, G., Guan, K., Rossini, M., Goulas, Y., Zeng, Y., Frankenberg, C., and Berry, J. A.: NIRVP: A robust structural proxy for sun-induced chlorophyll fluorescence and photosynthesis across scales, Remote Sens. Environ., 268, 112763, https://doi.org/10.1016/j.rse.2021.112763, 2022.
Doughty, R., Xiao, X., Köhler, P., Frankenberg, C., Qin, Y., Wu, X., Ma, S., and Moore, B.: Global-scale consistency of spaceborne vegetation indices, chlorophyll fluorescence, and photosynthesis, J. Geophys. Res.-Biogeo., 126, e2020JG006136, https://doi.org/10.1029/2020JG006136, 2021.
Drolet, G. G., Middleton, E. M., Huemmrich, K. F., Hall, F. G., Amiro, B. D., Barr, A. G., Black, T. A., McCaughey, J. H., and Margolis, H. A.: Regional mapping of gross light-use efficiency using MODIS spectral indices, Remote Sens. Environ., 112, 3064–3078, 2008.
Drought 2018 Team and ICOS Ecosystem Thematic Centre: Drought-2018 ecosystem eddy covariance flux product for 52 stations in FLUXNET-Archive format, ICOS [data set], https://doi.org/10.18160/YVR0-4898, 2020.
Drusch, M., Moreno, J., Del Bello, U., Franco, R., Goulas, Y., Huth, A., Kraft, S., Middleton, E. M., Miglietta, F., Mohammed, G., Nedbal, L., Rascher, U., Schuttemeyer, D., and Verhoef, W.: The FLuorescence EXplorer Mission Concept—ESA's Earth Explorer 8, IEEE T. Geosci. Remote Sens., 55, 1273–1284, https://doi.org/10.1109/TGRS.2016.2621820, 2017.
Falge, E., Baldocchi, D., Tenhunen, J., Aubinet, M., Bakwin, P., Berbigier, P., Bernhofer, C., Burba, G., Clement, R., Davis, K. J., Elbers, J. A., Goldstein, A. H., Grelle, A., Granier, A., Guðmundsson, J., Hollinger, D., Kowalski, A. S., Katul, G., Law, B. E., Malhi, Y., Meyers, T., Monson, R. K., Munger, J. W., Oechel, W., Paw U, K. T., Pilegaard, K., Rannik, Ü., Rebmann, C., Suyker, A., Valentini, R., Wilson, K., and Wofsy, S.: Seasonality of ecosystem respiration and gross primary production as derived from FLUXNET measurements, Agr. Forest Meteorol., 113, 53–74, https://doi.org/10.1016/S0168-1923(02)00102-8, 2002.
Fournier, A., Daumard, F., Champagne, S., Ounis, A., Goulas, Y., and Moya, I.: Effect of canopy structure on sun-induced chlorophyll fluorescence, ISPRS J. Photogram., 68, 112–120, https://doi.org/10.1016/j.isprsjprs.2012.01.003, 2012.
Frankenberg, C., Fisher, J. B., Worden, J., Badgley, G., Saatchi, S. S., Lee, J.-E., Toon, G. C., Butz, A., Jung, M., Kuze, A., and Yokota, T.: New global observations of the terrestrial carbon cycle from GOSAT: Patterns of plant fluorescence with gross primary productivity: CHLOROPHYLL FLUORESCENCE FROM SPACE, Geophys. Res. Lett., 38, L17706, https://doi.org/10.1029/2011GL048738, 2011.
Gamon, J. A.: Reviews and Syntheses: optical sampling of the flux tower footprint, Biogeosciences, 12, 4509–4523, https://doi.org/10.5194/bg-12-4509-2015, 2015.
Gamon, J. A., Peñuelas, J., and Field, C. B.: A narrow-waveband spectral index that tracks diurnal changes in photosynthetic efficiency, Remote Sens. Environ., 41, 35–44, https://doi.org/10.1016/0034-4257(92)90059-S, 1992.
Gamon, J. A., Somers, B., Malenovský, Z., Middleton, E. M., Rascher, U., and Schaepman, M. E.: Assessing Vegetation Function with Imaging Spectroscopy, Surv. Geophys., 40, 489–513, https://doi.org/10.1007/s10712-019-09511-5, 2019.
Gitelson, A. A., Gamon, J. A., and Solovchenko, A.: Multiple drivers of seasonal change in PRI: Implications for photosynthesis 2. Stand level, Remote Sens. Environ., 190, 198–206, https://doi.org/10.1016/j.rse.2016.12.015, 2017.
Goulas, Y., Fournier, A., Daumard, F., Champagne, S., Ounis, A., Marloie, O., and Moya, I.: Gross Primary Production of a Wheat Canopy Relates Stronger to Far Red Than to Red Solar-Induced Chlorophyll Fluorescence, Remote Sens., 9, 97, https://doi.org/10.3390/rs9010097, 2017.
Gu, L., Wood, J. D., Chang, C. Y.-Y., Sun, Y., and Riggs, J. S.: Advancing Terrestrial Ecosystem Science With a Novel Automated Measurement System for Sun-Induced Chlorophyll Fluorescence for Integration With Eddy Covariance Flux Networks, J. Geophys. Res.-Biogeo., 124, 127–146, https://doi.org/10.1029/2018JG004742, 2019a.
Gu, L., Han, J., Wood, J. D., Chang, C. Y., and Sun, Y.: Sun-induced Chl fluorescence and its importance for biophysical modeling of photosynthesis based on light reactions, New Phytol., 223, 1179–1191, https://doi.org/10.1111/nph.15796, 2019b.
Guanter, L., Frankenberg, C., Dudhia, A., Lewis, P. E., Gómez-Dans, J., Kuze, A., Suto, H., and Grainger, R. G.: Retrieval and global assessment of terrestrial chlorophyll fluorescence from GOSAT space measurements, Remote Sens. Environ., 121, 236–251, https://doi.org/10.1016/j.rse.2012.02.006, 2012.
Guanter, L., Zhang, Y., Jung, M., Joiner, J., Voigt, M., Berry, J. A., Frankenberg, C., Huete, A. R., Zarco-Tejada, P., Lee, J.-E., Moran, M. S., Ponce-Campos, G., Beer, C., Camps-Valls, G., Buchmann, N., Gianelle, D., Klumpp, K., Cescatti, A., Baker, J. M., and Griffis, T. J.: Global and time-resolved monitoring of crop photosynthesis with chlorophyll fluorescence, P. Natl. Acad. Sci. USA, 111, E1327–E1333, https://doi.org/10.1073/pnas.1320008111, 2014.
Guanter, L., Bacour, C., Schneider, A., Aben, I., van Kempen, T. A., Maignan, F., Retscher, C., Köhler, P., Frankenberg, C., Joiner, J., and Zhang, Y.: The TROPOSIF global sun-induced fluorescence dataset from the Sentinel-5P TROPOMI mission, Earth Syst. Sci. Data, 13, 5423–5440, https://doi.org/10.5194/essd-13-5423-2021, 2021.
Hao, D., Asrar, G. R., Zeng, Y., Yang, X., Li, X., Xiao, J., Guan, K., Wen, J., Xiao, Q., Berry, J. A., and Chen, M.: Potential of hotspot solar-induced chlorophyll fluorescence for better tracking terrestrial photosynthesis, Glob. Change Biol., 27, 2144–2158, https://doi.org/10.1111/gcb.15554, 2021.
Hayek, M. N., Longo, M., Wu, J., Smith, M. N., Restrepo-Coupe, N., Tapajós, R., da Silva, R., Fitzjarrald, D. R., Camargo, P. B., Hutyra, L. R., Alves, L. F., Daube, B., Munger, J. W., Wiedemann, K. T., Saleska, S. R., and Wofsy, S. C.: Carbon exchange in an Amazon forest: from hours to years, Biogeosciences, 15, 4833–4848, https://doi.org/10.5194/bg-15-4833-2018, 2018.
He, L., Magney, T., Dutta, D., Yin, Y., Köhler, P., Grossmann, K., Stutz, J., Dold, C., Hatfield, J., Guan, K., Peng, B., and Frankenberg, C.: From the Ground to Space: Using Solar-Induced Chlorophyll Fluorescence to Estimate Crop Productivity, Geophys. Res. Lett., 47, e2020GL087474, https://doi.org/10.1029/2020GL087474, 2020.
Hilker, T., Coops, N. C., Nesic, Z., Wulder, M. A., and Black, A. T.: Instrumentation and approach for unattended year round tower based measurements of spectral reflectance, Computers and Electronics in Agriculture, 56, 72–84, https://doi.org/10.1016/j.compag.2007.01.003, 2007.
Hilker, T., Lyapustin, A., Hall, F. G., Wang, Y., Coops, N. C., Drolet, G., and Black, T. A.: An assessment of photosynthetic light use efficiency from space: Modeling the atmospheric and directional impacts on PRI reflectance, Remote Sens. Environ., 13, 24632475, https://doi.org/10.1016/j.rse.2009.07.012, 2009.
Hmimina, G., Merlier, E., Dufrêne, E., and Soudani, K.: Deconvolution of pigment and physiologically related photochemical reflectance index variability at the canopy scale over an entire growing season: Towards an understanding of canopy PRI variability, Plant Cell Environ, 38, 1578–1590, https://doi.org/10.1111/pce.12509, 2015.
Hornero, A., North, P. R. J., Zarco-Tejada, P. J., Rascher, U., Martín, M. P., Migliavacca, M., and Hernandez-Clemente, R.: Assessing the contribution of understory sun-induced chlorophyll fluorescence through 3-D radiative transfer modelling and field data, Remote Sens. Environ., 253, 112195, https://doi.org/10.1016/j.rse.2020.112195, 2021.
ICOS RI: Ecosystem final quality (L2) product in ETC-Archive format – release 2022-1, ICOS [data set], https://doi.org/10.18160/PAD9-HQHU, 2022.
Jiang, C. and Ryu, Y.: Multi-scale evaluation of global gross primary productivity and evapotranspiration products derived from Breathing Earth System Simulator (BESS), Remote Sens. Environ., 186, 528–547, https://doi.org/10.1016/j.rse.2016.08.030, 2016.
Jonard, F., De Cannière, S., Brüggemann, N., Gentine, P., Short Gianotti, D. J., Lobet, G., Miralles, D. G., Montzka, C., Pagán, B. R., Rascher, U., and Vereecken, H.: Value of sun-induced chlorophyll fluorescence for quantifying hydrological states and fluxes: Current status and challenges, Agr. Forest Meteorol., 291, 108088, https://doi.org/10.1016/j.agrformet.2020.108088, 2020.
Jung, M., Koirala, S., Weber, U., Ichii, K., Gans, F., Camps-Valls, G., Papale, D., Schwalm, C., Tramontana, G., and Reichstein, M.: The FLUXCOM ensemble of global land-atmosphere energy fluxes, Sci. Data, 6, 74, https://doi.org/10.1038/s41597-019-0076-8, 2019.
Kim, J., Ryu, Y., Dechant, B., Lee, H., Kim, H. S., Kornfeld, A., and Berry, J. A.: Solar-induced chlorophyll fluorescence is non-linearly related to canopy photosynthesis in a temperate evergreen needleleaf forest during the fall transition, Remote Sens. Environ., 258, 112362, https://doi.org/10.1016/j.rse.2021.112362, 2021.
Kimm, H., Guan, K., Jiang, C., Miao, G., Wu, G., Suyker, A. E., Ainsworth, E. A., Bernacchi, C. J., Montes, C. M., Berry, J. A., Yang, X., Frankenberg, C., Chen, M., and Köhler, P.: A physiological signal derived from sun-induced chlorophyll fluorescence quantifies crop physiological response to environmental stresses in the U.S. Corn Belt, Environ. Res. Lett., 16, 124051, https://doi.org/10.1088/1748-9326/ac3b16, 2021.
Koehler, P. and Frankenberg, C.: Ungridded TROPOMI SIF (at 740 nm) (1.0), CaltechDATA [data set], https://doi.org/10.22002/D1.1347, 2020.
Köhler, P., Frankenberg, C., Magney, T. S., Guanter, L., Joiner, J., and Landgraf, J.: Global Retrievals of Solar-Induced Chlorophyll Fluorescence With TROPOMI: First Results and Intersensor Comparison to OCO-2, Geophys. Res. Lett., 45, 10456–10463, https://doi.org/10.1029/2018GL079031, 2018.
Köhler, P., Fischer, W. W., Rossman, G. R., Grotzinger, J. P., Doughty, R., Wang, Y., Yin, Y., and Frankenberg, C.: Mineral Luminescence Observed From Space, Geophys. Res. Lett., 48, e2021GL095227, https://doi.org/10.1029/2021GL095227, 2021.
Kong, J., Ryu, Y., Liu, J., Dechant, B., Rey-Sanchez, C., Shortt, R., Szutu, D., Verfaillie, J., Houborg, R., and Baldocchi, D. D.: Matching high resolution satellite data and flux tower footprints improves their agreement in photosynthesis estimates, Agr. Forest Meteorol., 316, 108878, https://doi.org/10.1016/j.agrformet.2022.108878, 2022.
Li, J., Zhang, Y., Gu, L., Li, Z., Li, J., Zhang, Q., Zhang, Z., and Song, L.: Seasonal variations in the relationship between sun-induced chlorophyll fluorescence and photosynthetic capacity from the leaf to canopy level in a rice crop, J. Exp. Bot., 71, 7179–7197, https://doi.org/10.1093/jxb/eraa408, 2020.
Li, X. and Xiao, J.: TROPOMI observations allow for robust exploration of the relationship between solar-induced chlorophyll fluorescence and terrestrial gross primary production, Remote Sens. Environ., 268, 112748, https://doi.org/10.1016/j.rse.2021.112748, 2022.
Li, X., Xiao, J., and He, B.: Chlorophyll fluorescence observed by OCO-2 is strongly related to gross primary productivity estimated from flux towers in temperate forests, Remote Sens. Environ., 204, 659–671, https://doi.org/10.1016/j.rse.2017.09.034, 2018a.
Li, X., Xiao, J., He, B., Altaf Arain, M., Beringer, J., Desai, A. R., Emmel, C., Hollinger, D. Y., Krasnova, A., Mammarella, I., Noe, S. M., Ortiz, P. S., Rey-Sanchez, A. C., Rocha, A. V., and Varlagin, A.: Solar-induced chlorophyll fluorescence is strongly correlated with terrestrial photosynthesis for a wide variety of biomes: First global analysis based on OCO-2 and flux tower observations, Glob. Change Biol., 24, 3990–4008, https://doi.org/10.1111/gcb.14297, 2018b.
Li, X., Xiao, J., Fisher, J. B., and Baldocchi, D. D.: ECOSTRESS estimates gross primary production with fine spatial resolution for different times of day from the International Space Station, Remote Sens. Environ., 258, 112360, https://doi.org/10.1016/j.rse.2021.112360, 2021.
Lin, S., Li, J., Liu, Q., Li, L., Zhao, J., and Yu, W.: Evaluating the Effectiveness of Using Vegetation Indices Based on Red-Edge Reflectance from Sentinel-2 to Estimate Gross Primary Productivity, Remote Sens., 11, 1303, https://doi.org/10.3390/rs11111303, 2019.
Lu, X., Liu, Z., Zhao, F., and Tang, J.: Comparison of total emitted solar-induced chlorophyll fluorescence (SIF) and top-of-canopy (TOC) SIF in estimating photosynthesis, Remote Sens. Environ., 251, 112083, https://doi.org/10.1016/j.rse.2020.112083, 2020.
Madani, N., Parazoo, N. C., Kimball, J. S., Ballantyne, A. P., Reichle, R. H., Maneta, M., Saatchi, S., Palmer, P. I., Liu, Z., and Tagesson, T.: Recent Amplified Global Gross Primary Productivity Due to Temperature Increase Is Offset by Reduced Productivity Due to Water Constraints, AGU Advances, 1, e2020AV000180, https://doi.org/10.1029/2020AV000180, 2020.
Magney, T. S., Bowling, D. R., Logan, B. A., Grossmann, K., Stutz, J., Blanken, P. D., Burns, S. P., Cheng, R., Garcia, M. A., K?hler, P., Lopez, S., Parazoo, N. C., Raczka, B., Schimel, D., and Frankenberg, C.: Mechanistic evidence for tracking the seasonality of photosynthesis with solar-induced fluorescence, P. Natl. Acad. Sci. USA, 201900278, https://doi.org/10.1073/pnas.1900278116, 2019.
Maguire, A. J., Eitel, J. U. H., Griffin, K. L., Magney, T. S., Long, R. A., Vierling, L. A., Schmiege, S. C., Jennewein, J. S., Weygint, W. A., Boelman, N. T., and Bruner, S. G.: On the Functional Relationship Between Fluorescence and Photochemical Yields in Complex Evergreen Needleleaf Canopies, Geophys. Res. Lett., 47, e2020GL087858, https://doi.org/10.1029/2020GL087858, 2020.
Marrs, J. K., Reblin, J. S., Logan, B. A., Allen, D. W., Reinmann, A. B., Bombard, D. M., Tabachnik, D., and Hutyra, L. R.: Solar-Induced Fluorescence Does Not Track Photosynthetic Carbon Assimilation Following Induced Stomatal Closure, Geophys. Res. Lett., 47, e2020GL087956, https://doi.org/10.1029/2020GL087956, 2020.
Mengistu, A. G., Mengistu Tsidu, G., Koren, G., Kooreman, M. L., Boersma, K. F., Tagesson, T., Ardö, J., Nouvellon, Y., and Peters, W.: Sun-induced fluorescence and near-infrared reflectance of vegetation track the seasonal dynamics of gross primary production over Africa, Biogeosciences, 18, 2843–2857, https://doi.org/10.5194/bg-18-2843-2021, 2021.
Meroni, M., Picchi, V., Rossini, M., Cogliati, S., Panigada, C., Nali, C., Lorenzini, G., and Colombo, R.: Leaf level early assessment of ozone injuries by passive fluorescence and photochemical reflectance index, Int. J. Remote Sens., 29, 5409–5422, https://doi.org/10.1080/01431160802036292, 2008.
Miao, G., Guan, K., Yang, X., Bernacchi, C. J., Berry, J. A., DeLucia, E. H., Wu, J., Moore, C. E., Meacham, K., Cai, Y., Peng, B., Kimm, H., and Masters, M. D.: Sun-Induced Chlorophyll Fluorescence, Photosynthesis, and Light Use Efficiency of a Soybean Field from Seasonally Continuous Measurements, J. Geophys. Res.-Biogeo., 123, 610–623, https://doi.org/10.1002/2017JG004180, 2018.
Mohammed, G. H., Colombo, R., Middleton, E. M., Rascher, U., van der Tol, C., Nedbal, L., Goulas, Y., Pérez-Priego, O., Damm, A., Meroni, M., Joiner, J., Cogliati, S., Verhoef, W., Malenovský, Z., Gastellu-Etchegorry, J.-P., Miller, J. R., Guanter, L., Moreno, J., Moya, I., Berry, J. A., Frankenberg, C., and Zarco-Tejada, P. J.: Remote sensing of solar-induced chlorophyll fluorescence (SIF) in vegetation: 50 years of progress, Remote Sens. Environ., 231, 111177, https://doi.org/10.1016/j.rse.2019.04.030, 2019.
Moureaux, C., Bodson, B., and Aubinet, M.: Mesure des flux de CO2 et bilan carboné de grandes cultures: état de la question et méthodologie, Biotechnol. Agron. Soc. Environ., 12, 303–315, 2008.
Nadeau, C. and Bengio, Y.: Inference for the Generalization Error, Mach. Learn., 52, 239–281, https://doi.org/10.1023/A:1024068626366, 2003.
Pabon-Moreno, D. E., Migliavacca, M., Reichstein, M., and Mahecha, M. D.: On the potential of Sentinel-2 for estimating Gross Primary Production, IEEE T. Geosci. Remote Sens., 60, 4409412, https://doi.org/10.1109/TGRS.2022.3152272, 2022.
Paul-Limoges, E., Damm, A., Hueni, A., Liebisch, F., Eugster, W., Schaepman, M. E., and Buchmann, N.: Effect of environmental conditions on sun-induced fluorescence in a mixed forest and a cropland, Remote Sens. Environ., 219, 310–323, https://doi.org/10.1016/j.rse.2018.10.018, 2018.
Porcar-Castell, A., Tyystjärvi, E., Atherton, J., van der Tol, C., Flexas, J., Pfündel, E. E., Moreno, J., Frankenberg, C., and Berry, J. A.: Linking chlorophyll a fluorescence to photosynthesis for remote sensing applications: mechanisms and challenges, J. Exp. Bot., 65, 4065–4095, https://doi.org/10.1093/jxb/eru191, 2014.
Running, S. W., Nemani, R. R., Heinsch, F. A., Zhao, M., Reeves, M., and Hashimoto, H.: A Continuous Satellite-Derived Measure of Global Terrestrial Primary Production, BioScience, 54, 547, https://doi.org/10.1641/0006-3568(2004)054[0547:ACSMOG]2.0.CO;2, 2004.
Sippel, S., Reichstein, M., Ma, X., Mahecha, M. D., Lange, H., Flach, M., and Frank, D.: Drought, Heat, and the Carbon Cycle: a Review, Curr. Clim. Change Rep., 4, 266–286, https://doi.org/10.1007/s40641-018-0103-4, 2018.
Smith, W. K., Biederman, J. A., Scott, R. L., Moore, D. J. P., He, M., Kimball, J. S., Yan, D., Hudson, A., Barnes, M. L., MacBean, N., Fox, A. M., and Litvak, M. E.: Chlorophyll Fluorescence Better Captures Seasonal and Interannual Gross Primary Productivity Dynamics Across Dryland Ecosystems of Southwestern North America, Geophys. Res. Lett., 45, 748–757, https://doi.org/10.1002/2017GL075922, 2018.
Soudani, K., Hmimina, G., Dufrêne, E., Berveiller, D., Delpierre, N., Ourcival, J.-M., Rambal, S., and Joffre, R.: Relationships between photochemical reflectance index and light-use efficiency in deciduous and evergreen broadleaf forests, Remote Sens. Environ., 144, 73–84, https://doi.org/10.1016/j.rse.2014.01.017, 2014.
Sun, Y., Frankenberg, C., Jung, M., Joiner, J., Guanter, L., Köhler, P., and Magney, T.: Overview of Solar-Induced chlorophyll Fluorescence (SIF) from the Orbiting Carbon Observatory-2: Retrieval, cross-mission comparison, and global monitoring for GPP, Remote Sens. Environ., 209, 808–823, https://doi.org/10.1016/j.rse.2018.02.016, 2018.
Tagliabue, G., Panigada, C., Dechant, B., Baret, F., Cogliati, S., Colombo, R., Migliavacca, M., Rademske, P., Schickling, A., Schüttemeyer, D., Verrelst, J., Rascher, U., Ryu, Y., and Rossini, M.: Exploring the spatial relationship between airborne-derived red and far-red sun-induced fluorescence and process-based GPP estimates in a forest ecosystem, Remote Sens. Environ., 231, 111272, https://doi.org/10.1016/j.rse.2019.111272, 2019.
Toloşi, L. and Lengauer, T.: Classification with correlated features: unreliability of feature ranking and solutions, Bioinformatics, 27, 1986–1994, https://doi.org/10.1093/bioinformatics/btr300, 2011.
Tramontana, G., Jung, M., Schwalm, C. R., Ichii, K., Camps-Valls, G., Ráduly, B., Reichstein, M., Arain, M. A., Cescatti, A., Kiely, G., Merbold, L., Serrano-Ortiz, P., Sickert, S., Wolf, S., and Papale, D.: Predicting carbon dioxide and energy fluxes across global FLUXNET sites with regression algorithms, Biogeosciences, 13, 4291–4313, https://doi.org/10.5194/bg-13-4291-2016, 2016.
Tucker, C. J.: Red and photographic infrared linear combinations for monitoring vegetation, Remote Sens. Environ., 8, 127–150, 1979.
Vermote, E. and Wolfe, R.: MOD09GA MODIS/Terra Surface Reflectance Daily L2G Global 1 km and 500 m SIN Grid V006, NASA EOSDIS Land Processes DAAC [data set], https://doi.org/10.5067/MODIS/MOD09GA.006, 2015a.
Vermote, E. and Wolfe, R.: MYD09GQ MODIS/Aqua Surface Reflectance Daily L2G Global 250 m SIN Grid V006, NASA EOSDIS Land Processes DAAC [data set], https://doi.org/10.5067/MODIS/MYD09GQ.006, 2015b.
Vermote, P. E. F., Roger, J. C., and Ray, J. P.: MODIS Land Surface Reflectance Science Computing Facility Principal Investigator: Dr. Eric F. Vermote, http://modis-sr.ltdri.org (last access: 18 October 2021), 2015.
Wang, N., Suomalainen, J., Bartholomeus, H., Kooistra, L., Masiliûnas, D., and Clevers, J. G. P. W.: Diurnal variation of sun-induced chlorophyll fluorescence of agricultural crops observed from a point-based spectrometer on a UAV, Int. J. Appl. Earth Obs., 96, 102276, https://doi.org/10.1016/j.jag.2020.102276, 2021.
Wang, X., Chen, J. M., and Ju, W.: Photochemical reflectance index (PRI) can be used to improve the relationship between gross primary productivity (GPP) and sun-induced chlorophyll fluorescence (SIF), Remote Sens. Environ., 246, 111888, https://doi.org/10.1016/j.rse.2020.111888, 2020.
Wang, X., Biederman, J. A., Knowles, J. F., Scott, R. L., Turner, A. J., Dannenberg, M. P., Köhler, P., Frankenberg, C., Litvak, M. E., Flerchinger, G. N., Law, B. E., Kwon, H., Reed, S. C., Parton, W. J., Barron-Gafford, G. A., and Smith, W. K.: Satellite solar-induced chlorophyll fluorescence and near-infrared reflectance capture complementary aspects of dryland vegetation productivity dynamics, Remote Sens. Environ., 270, 112858, https://doi.org/10.1016/j.rse.2021.112858, 2022.
Wieneke, S., Ahrends, H., Damm, A., Pinto, F., Stadler, A., Rossini, M., and Rascher, U.: Airborne based spectroscopy of red and far-red sun-induced chlorophyll fluorescence: Implications for improved estimates of gross primary productivity, Remote Sens. Environ., 184, 654–667, https://doi.org/10.1016/j.rse.2016.07.025, 2016.
Wieneke, S., Burkart, A., Cendrero-Mateo, M. P., Julitta, T., Rossini, M., Schickling, A., Schmidt, M., and Rascher, U.: Linking photosynthesis and sun-induced fluorescence at sub-daily to seasonal scales, Remote Sens. Environ., 219, 247–258, https://doi.org/10.1016/j.rse.2018.10.019, 2018.
Wolanin, A., Camps-Valls, G., Gómez-Chova, L., Mateo-García, G., van der Tol, C., Zhang, Y., and Guanter, L.: Estimating crop primary productivity with Sentinel-2 and Landsat 8 using machine learning methods trained with radiative transfer simulations, Remote Sens. Environ., 225, 441–457, https://doi.org/10.1016/j.rse.2019.03.002, 2019.
Wood, J. D., Griffis, T. J., Baker, J. M., Frankenberg, C., Verma, M., and Yuen, K.: Multiscale analyses of solar-induced florescence and gross primary production: Multiscale GPP-SIF RELATIONS, Geophys. Res. Lett., 44, 533–541, https://doi.org/10.1002/2016GL070775, 2017.
Wu, G., Guan, K., Jiang, C., Peng, B., Kimm, H., Chen, M., Yang, X., Wang, S., Suyker, A. E., Bernacchi, C. J., Moore, C. E., Zeng, Y., Berry, J. A., and Cendrero-Mateo, M. P.: Radiance-based NIRv as a proxy for GPP of corn and soybean, Environ. Res. Lett., 15, 034009, https://doi.org/10.1088/1748-9326/ab65cc, 2020.
Xiao, J., Chevallier, F., Gomez, C., Guanter, L., Hicke, J. A., Huete, A. R., Ichii, K., Ni, W., Pang, Y., Rahman, A. F., Sun, G., Yuan, W., Zhang, L., and Zhang, X.: Remote sensing of the terrestrial carbon cycle: A review of advances over 50 years, Remote Sens. Environ., 233, 111383, https://doi.org/10.1016/j.rse.2019.111383, 2019.
Xiao, X.: Modeling gross primary production of temperate deciduous broadleaf forest using satellite images and climate data, Remote Sens. Environ., 91, 256–270, https://doi.org/10.1016/j.rse.2004.03.010, 2004.
Yang, H., Yang, X., Zhang, Y., Heskel, M. A., Lu, X., Munger, J. W., Sun, S., and Tang, J.: Chlorophyll fluorescence tracks seasonal variations of photosynthesis from leaf to canopy in a temperate forest, Glob. Change Biol., 23, 2874–2886, https://doi.org/10.1111/gcb.13590, 2017.
Yang, P., van der Tol, C., Campbell, P. K. E., and Middleton, E. M.: Unraveling the physical and physiological basis for the solar- induced chlorophyll fluorescence and photosynthesis relationship using continuous leaf and canopy measurements of a corn crop, Biogeosciences, 18, 441–465, https://doi.org/10.5194/bg-18-441-2021, 2021.
Yang, X., Tang, J., Mustard, J. F., Lee, J.-E., Rossini, M., Joiner, J., Munger, J. W., Kornfeld, A., and Richardson, A. D.: Solar-induced chlorophyll fluorescence that correlates with canopy photosynthesis on diurnal and seasonal scales in a temperate deciduous forest: Fluorescence and photosynthesis, Geophys. Res. Lett., 42, 2977–2987, https://doi.org/10.1002/2015GL063201, 2015.
Yazbeck, T., Bohrer, G., Gentine, P., Ye, L., Arriga, N., Bernhofer, C., Blanken, P. D., Desai, A. R., Durden, D., Knohl, A., Kowalska, N., Metzger, S., Mölder, M., Noormets, A., Novick, K., Scott, R. L., Šigut, L., Soudani, K., Ueyama, M., and Varlagin, A.: Site Characteristics Mediate the Relationship Between Forest Productivity and Satellite Measured Solar Induced Fluorescence, Front. For. Glob. Change, 4, 695269, https://doi.org/10.3389/ffgc.2021.695269, 2021.
Zeng, Y., Badgley, G., Dechant, B., Ryu, Y., Chen, M., and Berry, J. A.: A practical approach for estimating the escape ratio of near-infrared solar-induced chlorophyll fluorescence, Remote Sens. Environ., 232, 111209, https://doi.org/10.1016/j.rse.2019.05.028, 2019.
Zhang, J., Xiao, J., Tong, X., Zhang, J., Meng, P., Li, J., Liu, P., and Yu, P.: NIRv and SIF better estimate phenology than NDVI and EVI: Effects of spring and autumn phenology on ecosystem production of planted forests, Agr. Forest Meteorol., 315, 108819, https://doi.org/10.1016/j.agrformet.2022.108819, 2022.
Zhang, Y., Xiao, X., Wu, X., Zhou, S., Zhang, G., Qin, Y., and Dong, J.: A global moderate resolution dataset of gross primary production of vegetation for 2000–2016, Sci. Data, 4, 170165, https://doi.org/10.1038/sdata.2017.165, 2017.
Zhang, Y., Xiao, X., Zhang, Y., Wolf, S., Zhou, S., Joiner, J., Guanter, L., Verma, M., Sun, Y., Yang, X., Paul-Limoges, E., Gough, C. M., Wohlfahrt, G., Gioli, B., van der Tol, C., Yann, N., Lund, M., and de Grandcourt, A.: On the relationship between sub-daily instantaneous and daily total gross primary production: Implications for interpreting satellite-based SIF retrievals, Remote Sens. Environ., 205, 276–289, https://doi.org/10.1016/j.rse.2017.12.009, 2018.
Zhang, Y., Migliavacca, M., Penuelas, J., and Ju, W.: Advances in hyperspectral remote sensing of vegetation traits and functions, Remote Sens. Environ., 252, 112121, https://doi.org/10.1016/j.rse.2020.112121, 2021a.
Zhang, Y., Zhang, Q., Liu, L., Zhang, Y., Wang, S., Ju, W., Zhou, G., Zhou, L., Tang, J., Zhu, X., Wang, F., Huang, Y., Zhang, Z., Qiu, B., Zhang, X., Wang, S., Huang, C., Tang, X., and Zhang, J.: ChinaSpec: a Network for Long-term Ground-based Measurements of Solar-induced Fluorescence in China, J. Geophys. Res.-Biogeo., 126, e2020JG006042, https://doi.org/10.1029/2020JG006042, 2021b.
Zhang, Z., Zhang, Y., Porcar-Castell, A., Joiner, J., Guanter, L., Yang, X., Migliavacca, M., Ju, W., Sun, Z., Chen, S., Martini, D., Zhang, Q., Li, Z., Cleverly, J., Wang, H., and Goulas, Y.: Reduction of structural impacts and distinction of photosynthetic pathways in a global estimation of GPP from space-borne solar-induced chlorophyll fluorescence, Remote Sens. Environ., 240, 111722, https://doi.org/10.1016/j.rse.2020.111722, 2020.