the Creative Commons Attribution 4.0 License.
the Creative Commons Attribution 4.0 License.
 | 27 Apr 2023
Local environmental context drives heterogeneity of early succession dynamics in alpine glacier forefields
Bradley Z. Carlson
Anaïs Zimmer
Sophie Vallée
Antoine Rabatel
Edoardo Cremonese
Gianluca Filippa
Cédric Dentant
Christophe Randin
Andrea Mainetti
Erwan Roussel
Simon Gascoin
Dov Corenblit
Philippe Choler
Glacier forefields have long provided ecologists with a model to study patterns of plant succession following glacier retreat. While plant-survey-based approaches applied along chronosequences provide invaluable information on plant communities, the “space-for-time” approach assumes environmental uniformity and equal ecological potential across sites and does not account for spatial variability in initial site conditions. Remote sensing provides a promising avenue for assessing plant colonization dynamics using a so-called “real-time” approach. Here, we combined 36 years of Landsat imagery with extensive field sampling along chronosequences of deglaciation for eight glacier forefields in the southwestern European Alps to investigate the heterogeneity of early plant succession dynamics. Based on the two complementary and independent approaches, we found strong variability in the time lag between deglaciation and colonization by plants and in subsequent growth rates and in the composition of early plant succession. All three parameters were highly dependent on the local environmental context, i.e., neighboring vegetation cover and energy availability linked to temperature and snowmelt gradients. Potential geomorphological disturbance did not emerge as a strong predictor of succession parameters, which is perhaps due to insufficient spatial resolution of predictor variables. Notably, the identity of pioneer plant species was highly variable, and initial plant community composition had a much stronger influence on plant assemblages than elapsed time since deglaciation. Overall, both approaches converged towards the conclusion that early plant succession is not stochastic as previous authors have suggested but rather determined by local ecological context. We discuss the importance of scale in deciphering the complexity of plant succession in glacier forefields and provide recommendations for improving botanical field surveys and using Landsat time series in glacier forefield systems. Our work demonstrates complementarity between remote sensing and field-based approaches for both understanding and predicting future patterns of plant succession in glacier forefields.
- Article
(6034 KB) - Full-text XML
-
Supplement
(2653 KB) - BibTeX
- EndNote


Glaciers in the European Alps began to retreat around the mid-19th century in response to changes in climate conditions driven first by shifts in precipitation (Vincent et al., 2005) and then by human-induced changes in aerosol concentrations in the atmosphere combined with warming (Painter et al., 2013; Sigl et al., 2018). Pronounced glacier retreat marked the end of the Little Ice Age (LIA), a multi-century period during which glacier terminal moraines were up to a few kilometers down valley from their current location (Matthews and Briffa, 2005; Gardent et al., 2014). As glaciers retreat, the surface area of the glacier forefields (i.e., the area extending between the glacier snout and the moraine deposited during the LIA maximum extent) increases (Marta et al., 2021). Over the 20th century, the pace of glacier retreat in the Alps was variable and punctuated by a few brief glacier advances. However, this variability has given way to consistent and accelerating melting since the 1990s (Vincent et al., 2014) in response to warming air temperatures and associated reductions in snowpack depth and duration (Gobiet et al., 2014). In this context, recently deglaciated areas constitute particularly dynamic ecosystems that are reshaping high mountain landscapes (Haeberli et al., 2017) and associated biodiversity and ecosystem services (Cauvy-Fraunie and Dangles, 2019; Ficetola et al., 2021). These emerging ecosystems have been identified as hotspots of the widespread greening observed throughout the European Alps during recent decades (Bayle, 2020; Choler et al., 2021; Carlson et al., 2017), calling for the need to better understand plant colonization dynamics in glacier forefields to predict future trajectories of alpine ecosystems (Huss et al., 2017).
Glacier forefields have long provided ecologists with a model to study patterns of plant succession along chronosequences of glacier retreat (Chapin et al., 1994), most often using a “space-for-time” approach (Pickett, 1989; Zimmer et al., 2018). This method relies on the assumption that within a glacier forefield initial environmental conditions are consistent and that pioneer species benefit from equal opportunity for establishment and growth over space and time (Johnson and Miyanishi, 2008). However, field observations accompanied by a growing body of literature indicate that this approach is overly simplistic given the environmental heterogeneity of glacier forefields and the complexity of biological processes involved. Indeed, we now know that plant succession rates and trajectories are controlled by both abiotic and biotic processes, which in turn depend on regional landscape and local environmental factors, such as micro-climate (Joly and Brossard, 2007), substrate and disturbance regimes (Anthelme et al., 2021; Eichel et al., 2016), water and nutrient availability (Górniak et al., 2017), micro-topography (Raffl et al., 2006; Scherrer and Körner, 2011), and broadscale gradients such as elevation and continentality (Garibotti et al., 2011; Rydgren et al., 2014; Robbins and Matthews, 2010, 2014). All of these factors can lead to strong heterogeneity in vegetation dynamics within and between glacier forefields.
Plant succession dynamics in glacier forefields, as elsewhere, can be broken down into three fundamental steps (Bradshaw, 1993): (i) diaspores reaching areas of bare ground, i.e., dispersal; (ii) successful and persistent establishment; and (iii) plant succession, as community composition matures and develops over time. Wojcik et al. (2021) recently proposed a novel conceptual model aimed at better understanding and predicting contrasting trajectories of plant succession dynamics in glacier forefields based on the complex interplay between autogenic factors, i.e., time-dependent biological succession, and allogenic factors, i.e., external environmental factors such as climate or geomorphological disturbances. The authors suggest that the importance of autogenic and allogenic components varies over time, with an initial stochastic phase (i.e., dispersal) followed by a more deterministic phase defined by environmental factors, biological interactions, and biogeomorphic feedbacks (Eichel et al., 2016). Contrasting succession trajectories within glacier forefields are presented as the result of variations in (i) time since glacier retreat, (ii) initial site conditions (heterogeneous micro-climate, substrate properties and resource availability), and (iii) geomorphological disturbances (hillslope, torrential, periglacial, aeolian disturbances). In addition to time, autogenic biological properties also shape plant succession dynamics: regional species pool composition determines propagule pressure, while plant functional traits (wind dispersal and low seed mass) facilitate the arrival and establishment of pioneer species (Franzén et al., 2019; Rosero et al., 2021; Schumann et al., 2016). At broader scales, variability in plant succession rates between glacier forefields has been linked to elevation and continentality, which in turn influence more direct environmental parameters such as temperature and snow cover duration (Robbins and Matthews, 2010).
In addition to assuming environmental uniformity and equal ecological potential over space, plant-survey-based approaches applied along chronosequences yield only a snapshot of plant community properties and fail to provide insights into the temporal dynamics of succession. To address questions linking auto- and allogenic factors to time lags, i.e., time between a surface deglaciation and its initial plant establishment, it appears necessary to adopt a “real-time” approach based on annually resolved information on plant succession dynamics. While some studies have successfully implemented repeat surveys of permanent plots in the context of glacier forefields (Fickert and Grüninger, 2018), repeat field surveys of plant communities in often remote and hard-to-access mountain environments present major challenges in terms of cost and effort.
As a complementary approach to traditional plot-based surveys, which remain essential to understand biogeomorphic processes on the ground, remote sensing provides a promising avenue for assessing plant colonization dynamics within and between glacier forefields using a so-called “real-time” approach. Beginning in 1984 with the Landsat 5 TM (followed by Landsat 7 ETM+ and Landsat 8 OLI sensors), Landsat satellites currently provide a 36-year archive of 30 m resolution images acquired at 16 d intervals over the globe's terrestrial areas. Availability of Landsat imagery since the mid-1980s allows for investigating plant succession dynamics since the most recent observed advance of alpine glaciers and in response to accelerating glacier retreat during recent decades. Vegetation indices such as the normalized difference vegetation index (NDVI) provide a proxy of plant biomass (Tucker and Sellers, 1986), photosynthetic activity, and vegetation cover and have the potential to reliably quantify plant succession in rocky areas with low plant cover. As NDVI is a nonphysical and unidimensional quantity based on remotely measured reflectance, variations in quantities over time can be disconnected from changes in plant cover on the ground, particularly in the context of heterogeneous topography (Bayle et al., 2021). In addition to systematic errors caused by sensor limitations, variation in NDVI over time can be due to atmospheric and cloud contamination (Masek et al., 2006), angular effects due to variation in sun surface sensor geometry or topography (Nagol et al., 2015; Martín-Ortega et al., 2020), sensor degradation, and calibration changes (Markham and Helder, 2012) or between sensor spectral band passes (Steven et al., 2003). Overall, it has been shown that NDVI increases nearly linearly with fractional vegetation cover (horizontal density) until values reach between 80 % and 90 %, at which point it tends to saturate and increases slowly with increasing leaf area index (vertical density). Remote sensing approaches have already been used efficiently in the context of glacier forefields (Klaar et al., 2015; Fischer et al., 2019; Bayle, 2020; Knoflach et al., 2021), and the high sensitivity of Landsat-based NDVI to low plant cover has been demonstrated in glacier forefields (Bayle et al., 2021) and in Antarctica (Fretwell et al., 2011).
Here, we investigated early plant succession dynamics (0–35 years since glacier retreat) in the context of eight glaciers distributed across the southwestern European Alps. Specifically, we sought to answer the following ecological questions. First, is observed heterogeneity in early plant succession dynamics (time between deglaciation and plant colonization, and plant growth rate following colonization) indeed purely stochastic or can this variability be linked to environmental factors? Second, is early plant community composition consistent across sites and shaped by time availability or heterogeneous and driven by local environmental context? To address these questions, we utilized two independent data sources: 36 years of Landsat imagery and 297 floristic field plots. First, we derived two indicators of vegetation dynamics from Landsat time series, which are (i) time lag between ice melting and detection of plant colonization and (ii) plant growth rate following colonization. We then investigated the spatial heterogeneity of these indicators and their respective drivers using proxies of the local environmental and geomorphological context (allogenic factors). Second, we assessed turnover in plant community composition between and within the eight glacier forefields using a “space-for-time” approach and with regard to local environmental and geomorphological context (allogenic factors) and time since deglaciation (autogenic factor). Finally, we questioned the capacity of field sampling to capture heterogeneity in vegetation dynamics with respect to spatially exhaustive remote sensing approach, and we provide some recommendations to improve field sampling methodology for future studies. In addition to testing theoretical expectations in glacier forefields across a broad spectrum of environmental and ecological contexts, our study provides for the first time a clear roadmap for applying widely available remote sensing data to quantify and improve our understanding of trajectories of plant colonization and succession in glacier forefields.
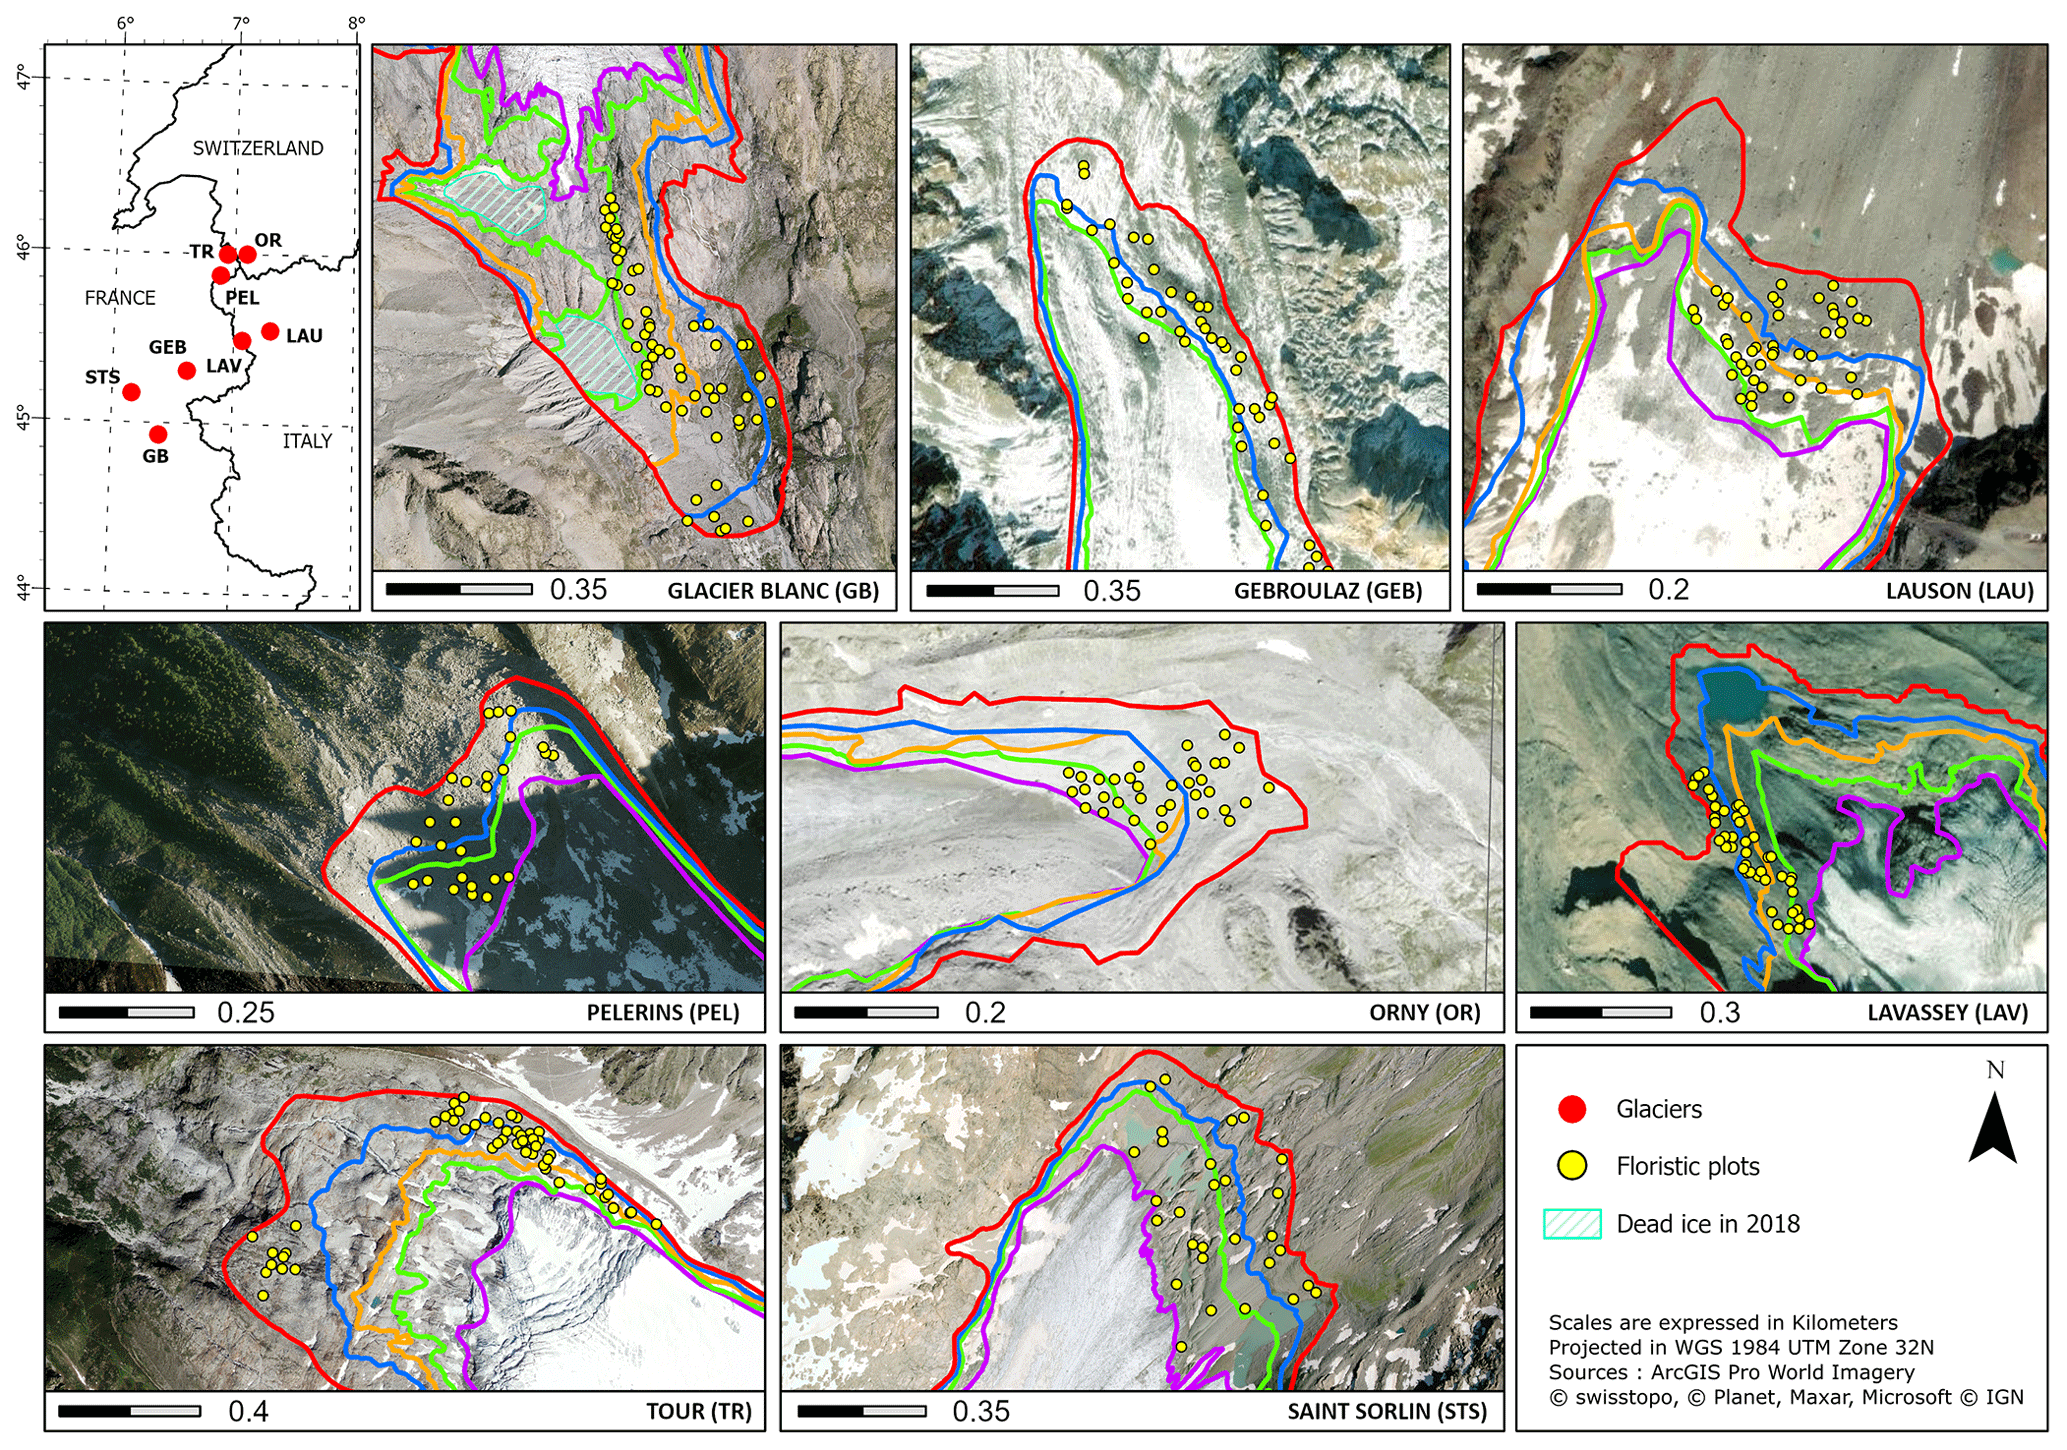
Figure 1Distribution of the eight glacier margins in France, Switzerland, and Italy with corresponding abbreviations. Floristic plots are indicated as yellow points, while glacier outlines are shown as thick colored lines. Colors do not indicate similar outline dates but chronosequences of deglaciation. Corresponding years of deglaciation is to be found in Table S1. Projection and source details are indicated in the legend.
2.1 Study site
Our study investigates eight glacier forefields distributed throughout the southwestern European Alps (Fig. 1) in France (Glacier Blanc, Saint-Sorlin, Gébroulaz, Tour, and Pélerins), Switzerland (Orny) and Italy (Lavassey and Lauson). Sites are distributed from 45 to 46∘ N and from 6 to 7∘ E across a variety of slopes, aspects, and elevations. Substrates are highly variable both within and between forefields, including exposed bedrock, chaotic blocks of various sizes, gravel, and sand. Stream networks are often intricate, with strong seasonal and daily variability.
2.2 Age of deglaciation
Chronosequences of glacier outlines for the eight glaciers were initially obtained from various sources depending on the country. For France (GB, STS, GEB, TR, PEL; see previous paragraph for full names), glacier outlines were extracted from the GLIMS database (Gardent et al., 2014), which contains outlines dating from 1985/86 based on Landsat 5 TM (30 m); from 2003 based on Landsat 5 TM and 7 ETM+ (30 m); from 2006, 2008, or 2009 (depending on the glacier) based on sub-meter resolution images from BD ORTHO IGN,; and finally from 2014, 2016, and 2018 (depending on the glacier) Spot 6/7 images (1.5 m). For Italy (LAV, LAU; see previous paragraph for full names), glacier outlines for 1975 were obtained based on photo interpretation of Regional Technical Maps from 1999, 2005, 2012, and 2019 based on orthophotos (50 cm) and Sentinel-2 (10 m). For Switzerland (OR; see previous paragraph for full name), glacier outlines were extracted from the GLAMOS database (Linsbauer et al., 2021). Overall, we were able to obtain chronosequences for the eight glaciers that approximately corresponded to the Landsat time series historical depth. As our glacier contour database mixed automatic and manual methods with sources at medium to high resolutions, important quality differences were observed within and between glacier chronosequence as older contours were mostly based on coarse-resolution images through automatic approaches that tend to perform poorly for debris-covered glaciers. To improve the consistency of our database and the reliability of further analysis, we carried out manual photo interpretation of sub-meter historical images for all glacier contours. For STS, TR, OR, and LAV, small corrections were applied due only to the improvement of source resolutions, while for GEB, PEL, and LAU, which are totally or partly covered by debris, we substantially improved the delimitation by accounting for emissary streams, crevasses, and lateral screes reoriented by glacier movement. For GB, we also identified a large section of dead ice that detached from the main glacier in 2014 and which remains in 2021 (Bayle, 2020). We removed this area from further analysis. Image sources are presented in Table S2, while detailed procedures to obtain our sub-meter glacier contours database are presented for each glacier in Figs. S1 to S6 in the Supplement. Glacier outlines were manually delineated using ArcGIS software (Esri, 10.4.1). A detailed description of the sources used to improve the glacier outlines data set can be found in Table S1 in the Supplement.
We estimated continuous years of deglaciation (YOD) from glacier outlines using an interpolation method initially designed for the creation of hydrologically corrected digital elevation models (DEMs). We used the topo-to-raster function in ArcGIS based on the ANUDEM program (Hutchinson et al., 2011), which is specifically designed to work with line features as input, to obtain a raster indicating the YOD. Linear interpolation assumes that glaciers retreated at a constant rate between two dated glacier extents. To evaluate this assumption, interpolated surfaces from Glacier Blanc were compared to a denser chronosequence of deglaciation from Bayle (2020) that were not used in this work. The linear model between the results from interpolation and ground truth observation obtained an R2 of 0.945 with a mean error of ± 2 years (Fig. S7).
2.3 Vegetation field surveys
Glacier forefields of GB, GEB, STS, PEL, TR, LAV, LAU, and OR were surveyed in the months of July and August in 2019 and 2020. For each forefield and chronosequence band (e.g., the zone deglaciated between 1983 to 2003), we generated a set of 15 random sampling points, while ensuring a minimum distance of five meters between sampling points. In the field we went as close as possible to these points using a GPS and excluded sites that were too dangerous to access walking or that were under water or snow. For each plot, within a 2 m × 2 m quadrat we surveyed the percent cover of vascular plants, mosses, and lichens; biological soil crust (Khedim et al., 2021; Breen and Lévesque, 2008); and bare ground (which was further subdivided into percent bedrock, sand, gravel < 2 cm, rocks between 2 and 20 cm in diameter, and blocks larger than 20 cm in diameter). We also recorded all vascular plant species and their relative cover and average vegetative height within the quadrat. We had a total of 297 plots with 59, 37, 36, 38, 27, 20, 28, and 52 plots for GB, GEB, LAU, LAV, OR, PEL, STS, and TR, respectively.
2.4 Remote sensing data
Landsat 5 TM, Landsat 7 ETM+, and Landsat 8 OLI standard level 1 terrain-corrected (L1T) orthorectified images from collection 1 (geolocation error < 12 m) between 1984 and 2019 for four paths per row(tiles) were downloaded from the Landsat Earth Explorer data portal (http://earthexplorer.usgs.gov, last access: 24 April 2023) at surface reflectance level of correction. Only images with average cloud cover < 80 % were selected as high cloud cover to reduce the number of available ground control points and therefore increase the geolocation accuracy because cloud masking relies on clear-sky pixels to identify clouds. As a result, a total of 2846 scenes were selected, 60 % of which were from Landsat 5. To improve the robustness of our remote sensing analysis, we applied state-of-the-art methods to correct for inter-sensor spectral variation and errors related to the bidirectional reflectance distribution function (BRDF) and illumination and to mask cloud and cloud shadow cover in mountainous contexts.
We applied the L7 to L8 correction method described by Roy et al. (2016a) to our data to align L8 reflectance to L7. No correction was applied on L5 or L7 as it was shown that the surface reflectance products from the Landsat Ecosystem Disturbance Adaptive Processing System (LEDAPS) are consistent through time, with no difference before and after the 2003 ETM+ scan line corrector (SLC) failure. The BRDF effects due to changes in solar and viewing zenith angle were corrected using the C-factor approach (Roy et al., 2016b) based on the RossThick–LiSparse BRDF model (Schaaf et al., 2002) and using an optimal normalized solar zenith angle defined by Zhang et al. (2016). We applied the sun canopy sensor + C model (Soenen et al., 2005) on the recommendation of Sola et al. (2016) to correct for illumination condition variations due to slope and aspect. Finally, clouds were masked for each scene using the MFmask 4.0 algorithm (https://github.com/gersl/fmask, last access: 24 April 2023) with the default DEM and a cloud probability threshold of 40 %. This version has improved clouds and cloud shadows detection by integrating auxiliary data, new cloud probabilities, and novel spectral contextual features, which are all crucial in mountainous areas where integration of a global DEM to normalize thermal and cirrus bands is necessary (Qiu et al., 2017, 2019a, b; Zhu and Woodcock, 2014, 2012). Masks were computed for cloud probability thresholds of 10 %, 40 %, and 70 % for a Landsat 7 ETM+ scene (195-029, captured on 16 July 2019) and visually compared to Fmask 3.3 (Fig. S8). The probability of 40 % offered a good compromise between omission and commission errors and was thus selected. A detailed correction workflow is available in the Supplement.
To assess vegetation changes at pixel scale over the eight glacier forefields, we computed the NDVI as follows:
where RNIR and RRed are the normalized BRDF-adjusted and topographically corrected reflectance in the near-infrared (NIR) and infrared bands, respectively. We then computed the NDVI annual maximum (NDVImax) available from 1 June to 31 August (day of year ∼ 152 to 243) from 1984 to 2019 to obtain a time series of an indicator of vegetation state at 30 m scale. As shown by Berner et al. (2020), it is challenging to reliably estimate annual NDVImax using Landsat since these estimates are sensitive to the number of cloud- and snow-free observations acquired each summer. The annual number of usable summer observations increased from 1984 to 2019, with there typically being few usable summer observations during the 1980s and 1990s (Zhang et al., 2022). This bias results in a systematic underestimation of NDVImax when few observations are available (Fig. S9). To prevent related errors in NDVI trend estimation, a year is discarded from the pixel time series if the mean day of year is superior or inferior to ± 2σ in relation to the entire time series as described in Bayle et al. (2022) (Fig. S10).
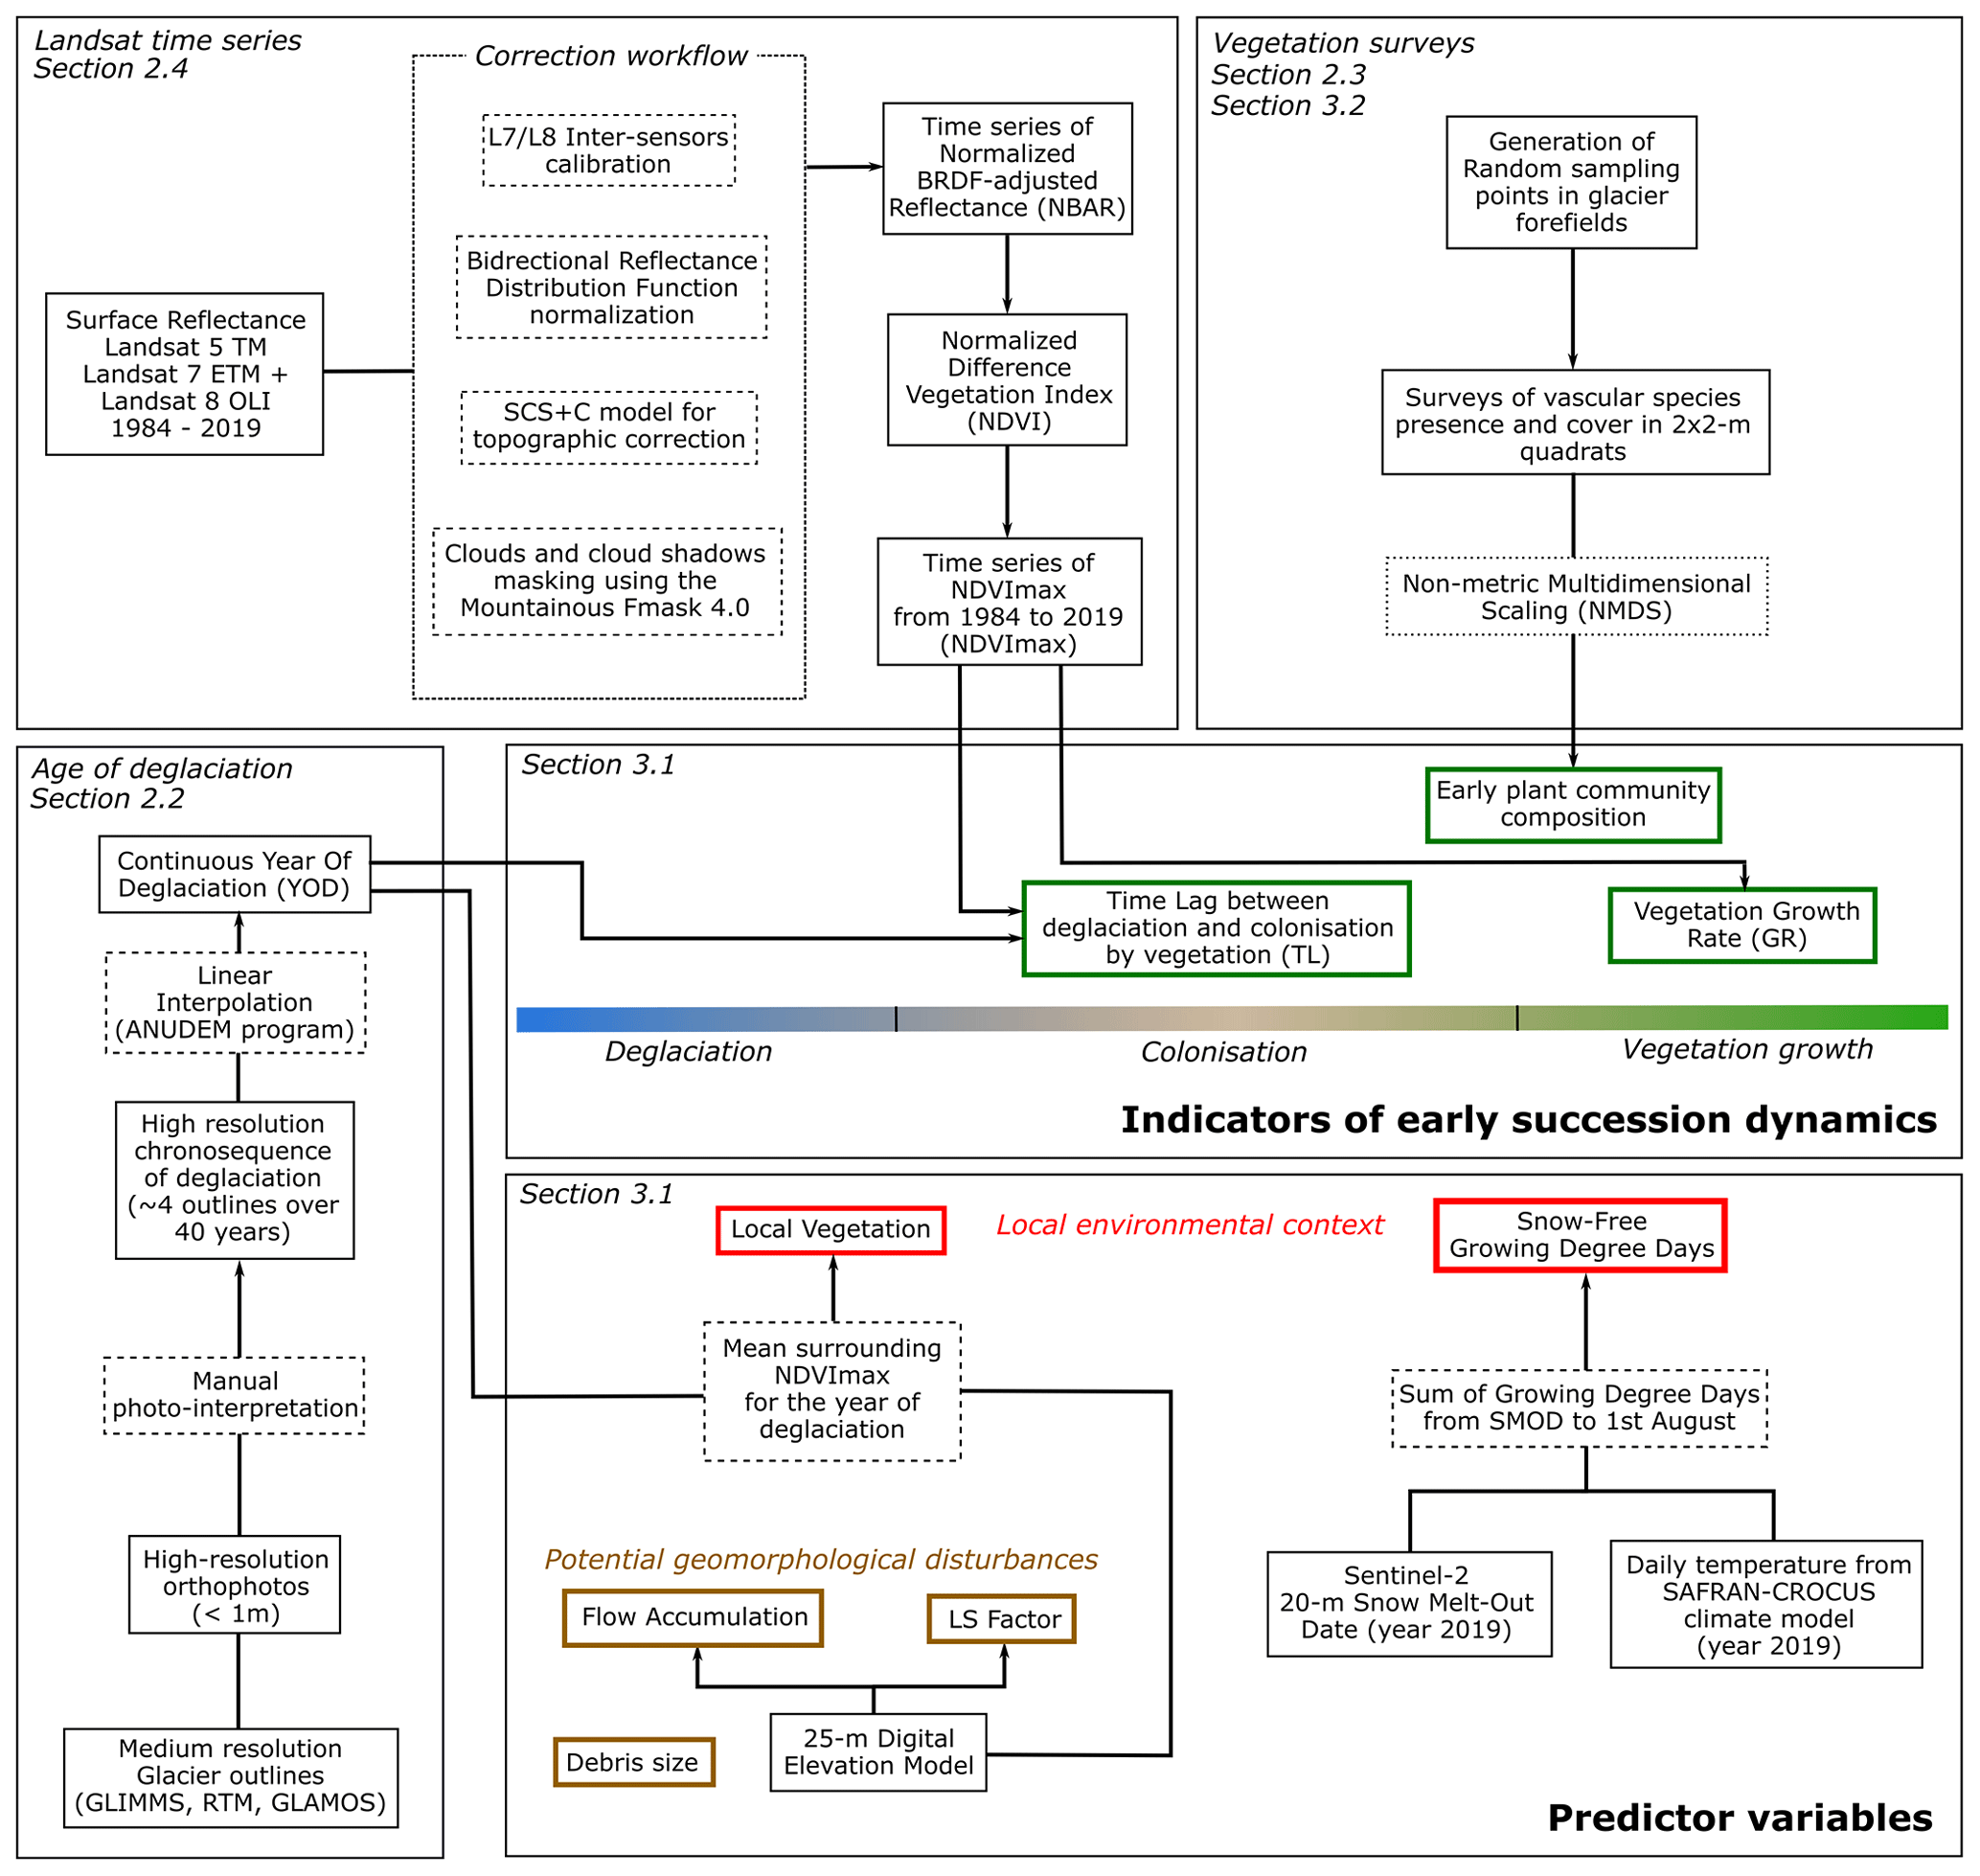
Figure 2Complete analysis workflow shown by methodological sections. Indicators of early succession dynamics are shown in green, while predictor variables are shown in red and brown.
Our data analysis workflow is based on using very high-resolution chronosequences of deglaciation, Landsat time series, and vegetation surveys to derive three “early succession dynamics indicators”. The heterogeneity of these indicators will be explored based on “predictor variables” divided into two categories: the local environmental context and potential geomorphological disturbances. These analyses intend to better understand the deterministic vs. stochastic nature of early succession dynamics in the theoretical framework proposed by Wojcik et al. (2020). The complete workflow is presented in Fig. 2.
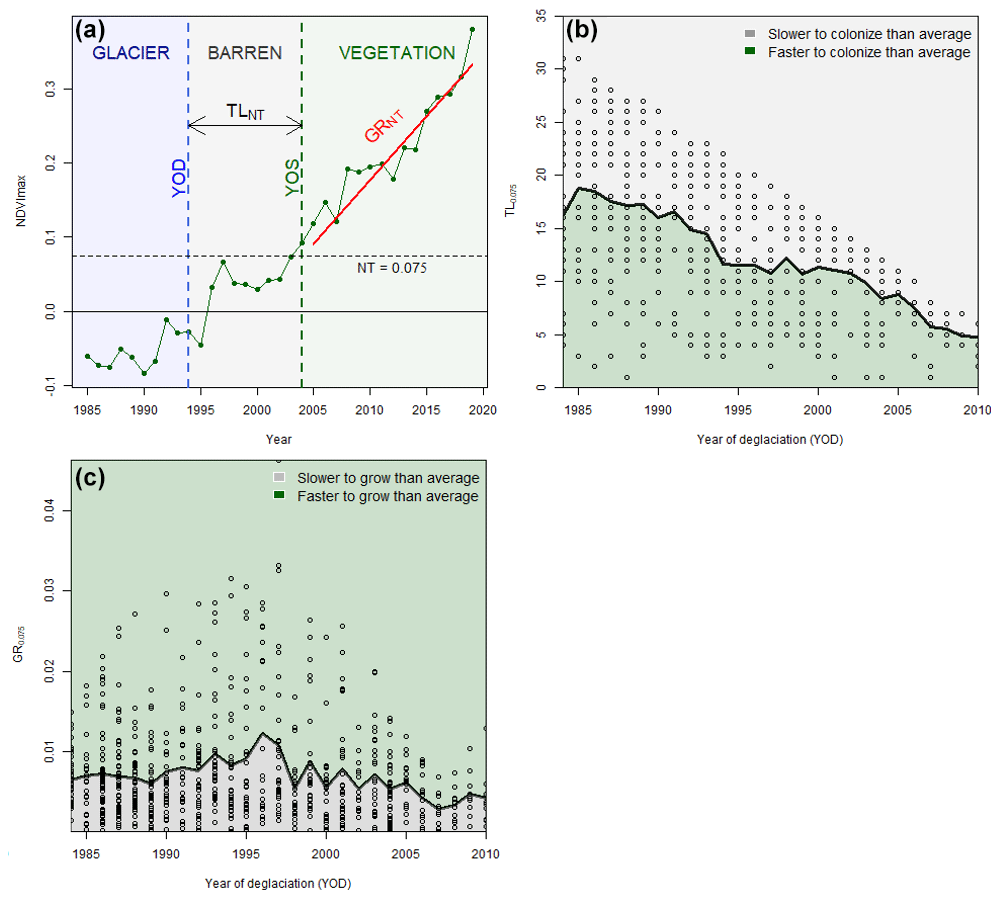
Figure 3(a) Example of indicators derived from the Landsat-based NDVImax time series and deglaciation data for a single pixel located in the Glacier Blanc forefield (44∘55′58.5768′′ N, 6∘24′34.8516′′ E). (b) Time lag (TL) and (c) growth rate (GR) for an NDVI threshold of 0.75 for the eight margins according to year of deglaciation. Thick black lines represent the median value for each year of deglaciation used to compute anomalies. Green-shaded areas represent faster colonization and growth rate than average, while slower than average growth rates are indicated by gray-shaded areas.
3.1 Remote-sensing-based indicators of succession dynamics
Based on the NDVImax time series, we characterized the proglacial vegetation dynamics at Landsat pixel scale using two indicators. The (i) time lag (TLNT), i.e., the number of years between the year of deglaciation (YOD) and the year where the NDVI threshold (NT) is exceeded (YOENT), and the (ii) growth rate (GRNT), i.e., the NDVImax trends computed from the YOENT to the last year of the Landsat time series. Ideally, we would compute both indicators for an NT that could identify the year of colonization by vegetation, but as NDVI tends to show noise unrelated to vegetation and that plant establishment is a progressive phenomenon occurring at small scale compared to pixel scale, such a threshold does not exist. Thus, we selected a NT based on Bayle et al. (2021). By comparing Landsat NDVI values to intra-pixel vegetation cover derived from uncrewed aerial vehicle (UAV) image, they showed, for example, that a value of 0.071 efficiently discriminates pixels with around 5 % vegetation cover (F score > 0.75) and that the best efficiency is achieved with a value of 0.1 to discriminate those with both more and less than 13 % vegetation cover (F score > 0.85). Based on this work, we used an NT of 0.075 as it was a good compromise between specificity and sensitivity regarding plant cover.
Thus, we used TL0.075 and GR0.075 to quantify heterogeneity of intra- and inter-glacier forefield succession dynamics. To consider a year as one where the NT is exceeded, the NDVI of the 2 previous years must be lower, and the 2 following years must be higher. A Theil–Sen trend estimator was applied for GR0.075 estimation as it is resistant to outliers in short or noisy series (Eastman et al., 2009). An example of an NDVI time series (and all associated data) is shown in Fig. 3a. We evaluated our method by comparing plant cover (%) obtained from field sampling between plots identified as vegetated or unvegetated. Finally, as the Landsat time series is limited to the last 40 years, there is a bias in the TL0.075 value as it is directly constrained by the YOD. For example, a pixel deglaciated in 2010 could only be colonized in the 9 following years, thus limiting the absolute value of TL0.075 between 1 and 9 years. To bypass this bias, we computed the anomalies of TL0.075 and GR0.075 as a function of YOD, which is a more relevant measure of heterogeneity in succession dynamics across the eight glacier forefields (Figs. 3b and 2c).
Finally, we implemented two random forest classification analyses to assess relationships between anomalies of TL0.075 and GR0.075 and predictors (Breiman, 2001). We classified the two indicators into three categories: positive anomalies (anomalies of TL0.075 | GR0.075 > 0), negative anomalies (anomalies of TL0.075 | GR0.075 < 0), and no vegetation detected. For TL, it resulted in 337, 374, and 1977 samples for positive, negative, and no detection, respectively, and for GR, it resulted in 441, 288, and 1959 samples for positive, negative, and no detection, respectively. Only 337 and 288 samples were conserved for TL and GR, respectively, to equalize the sample size of each class.
Predictor variables included (i) elevation, (ii) local vegetation, and (iii) snow-free growing degree days (SF-GDD) to represent the environmental context (allogenic factors) of the glacier forefields. Elevation was obtained from the 25 m resolution European Digital Elevation Model (EU-DEM, version 1.1; https://land.copernicus.eu/imagery-in-situ/eu-dem/, last access: 24 April 2023). SF-GDD maps were calculated through the combined use of the snow melt-out date (SMOD) product at 20 m resolution, derived from the Sentinel-2 time series analysis (Gascoin et al., 2019; Barrou Dumont et al., 2021), and the SAFRAN-CROCUS climatological model from Météo-France (Vernay et al., 2022), which provides the average daily temperature for each French massif and for 300 m elevation bands (for Swiss and Italian sites, we applied data from the French Mont Blanc and Vanoise massifs, respectively). To obtain the SF-GDD for each plot, we computed the cumulative sum of daily average air temperature above 0 ∘C between snow melt-out date and 1 August for the year 2019. SF-GDD is representative of the heat accumulated by vegetation during the growing season and is known to be a key variable for habitat distribution and alpine plant community properties (Choler, 2005, 2015, 2018; Carlson et al., 2015). We defined local vegetation surrounding the glacier forefield as the expected local vegetation productivity (NDVImax) for a given elevation outside of the glacier forefield, which we considered to be a proxy of the vegetation proximity and type. To compute this indicator for each plot, we averaged the NDVImax of the year of deglaciation for the 100 m elevational bands of the plot within a radius of 500 m and by excluding pixels within the glacier forefield.
We also calculated (i) flow accumulation and (ii) LS factor (slope length and steepness factor) to represent potential geomorphological disturbances (allogenic factors). The LS factor was derived from the EU-DEM and computed using the original equation proposed by Desmet and Govers (1996). It combined the S factor, which accounts for slope angle, and the L factor that defines slope length. The combined LS factor describes the effect of topography on soil erosion and thus is a proxy of “potential” instability due to gravity-related processes. Flow accumulation was also derived from the EU-DEM and computed using a multiple flow direction algorithm. Both the LS factor and flow accumulation were computed in SAGA (Conrad et al., 2015).
We screened highly correlated variables (r2 > | 0.7 |) by computing pairwise correlations. We then removed elevation as it was highly correlated to SF-GDD (r2 = −0.73) and local vegetation (r2 = −0.84). Next, we randomly partitioned the data set into sets for model training (two-thirds) and evaluation (one-third) and then fit random forest models to optimize out-of-bag classification accuracy. We reassessed the classification accuracy using the data withheld for model evaluation. We repeated this operation 100 times. Lastly, we computed predictor importance using the mean decrease in accuracy metric. Predictor importance was calculated using a permutation-based importance measure where one measures the effect of reshuffling each predictor on model accuracy. Finally, we generated partial dependence plots for the first variable in terms of importance as defined above to assess how class-specific classification probabilities varied across the range of the predictor while holding all other predictors at their average value. The distribution of predictors was constrained to regions with enough data given that partial dependence plots tend to overinterpret regions with few observations. We used the random forest, caret, and pdp R packages to implement random forest models and to evaluate their performance (Liaw and Wiener, 2002; Greenwell, 2017).
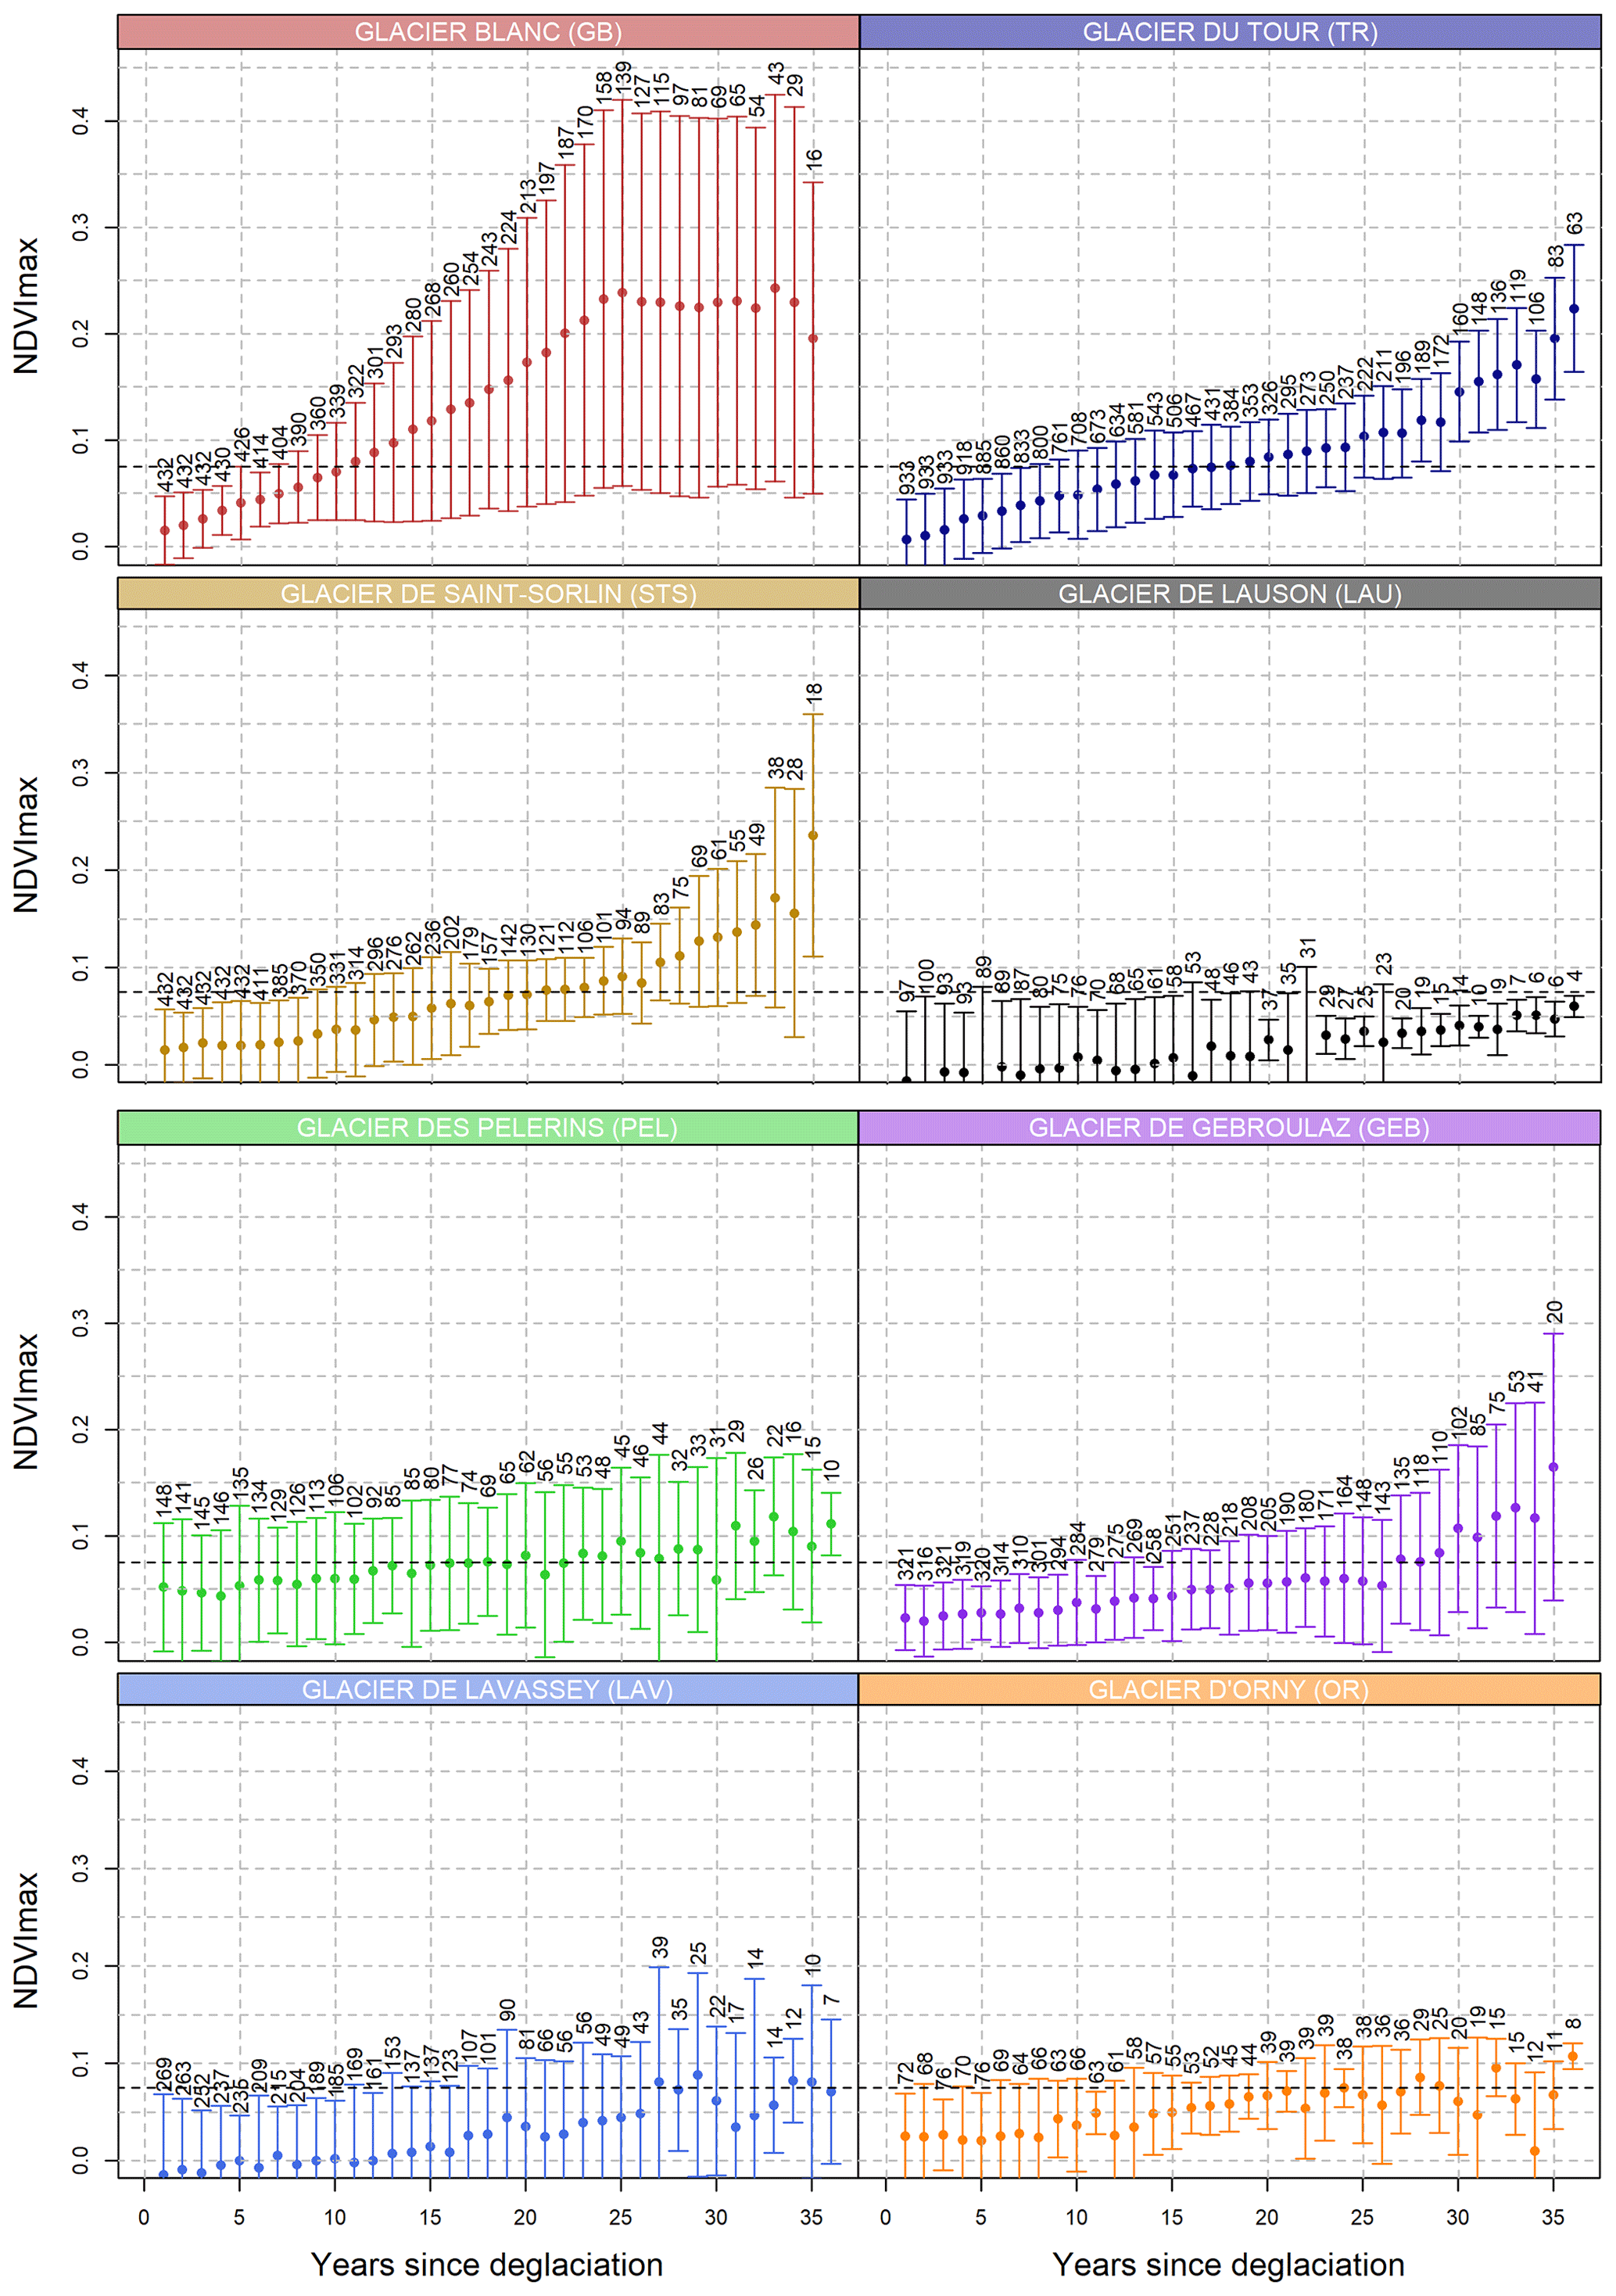
Figure 4Distribution of NDVImax values according to the number of years since deglaciation for the eight glacier forefields. Error bars indicate standard deviation and numbers indicate the numbers of pixels for a given number of years since deglaciation. Horizontal dashed lines show an NDVI of 0.075. Numbers of pixels for each year since deglaciation are indicated above each error bar.
3.2 Heterogeneity of succession dynamics and drivers
To model succession dynamics from the floristic data, we used non-metric multidimensional scaling (NMDS) to perform an unconstrained ordination of the plot by species table. NMDS is a rank-order-based multivariate technique that is particularly robust to identify a few important axes of floristic variations in community composition data (Minchin, 1987). We first discarded species with less than five occurrences to limit the proportion of sites with no shared species, as this may complicate the ordination. The resulting table included a total of 297 plots and 119 species. Absolute cover of plant species was transformed into relative species cover using the Wisconsin standardization, where first species covers and then site covers are standardized by maxima. Finally, we calculated the square root of relative plant cover for each species and for each plot. These transformations are commonly found to improve the results of the NMDS (Legendre and Gallagher, 2001). We then computed a distance matrix using the Bray–Curtis dissimilarity index on transformed species cover with two dimensions and 20 minimum random starts iterated two times. To avoid local minima, we performed several NMDS with random starts and selected the solution with the minimum stress, i.e., the extent to which the distance between sites in the specified number of dimensions differs from original distances. We used a vector fitting approach to test for linear relationships between NMDS site scores and two sets of variables corresponding to allogenic factors (neighboring vegetation cover, SFGDD, elevation) and geomorphological context (LS factor, flow accumulation, and coarse debris). To account for spatial autocorrelation, we implemented two generalized least-squares (GLS) regression models for each variable: one including an autocorrelated error structure and one without. We used the spherical spatial correlation structure estimated by the function corSphere in the nlme package (Pinheiro and Bates, 2022). The best-fitting model was selected using the Akaike information criterion corrected for small sample size (AICc). For each competing model, we estimated a pseudo-R square based on the regression of the variable on the fitted values. NMDS was performed using the metaMDS function of the vegan R package (Oksanen et al., 2020). GLS regression was fitted using the gls function of the nlme R package. Model evaluation was performed with the R package MuMIn (Barton, 2023). In addition to environmental context and potential disturbance regime variables (allogenic factors) presented in Sect. 3.1, we also considered sediment granulometry as measured in the field with floristic data. Using visual estimates of substrate type and cover carried out for each floristic plot, we calculated a cumulative weighted mean for each plot of grain size (sand < 0.5 cm, gravel < 2 cm, cobbles between 2 and 20 cm in diameter, and boulders between 20 cm and 1 m in diameter) by assigning the median value for each class and calculating a cumulative weighted mean.
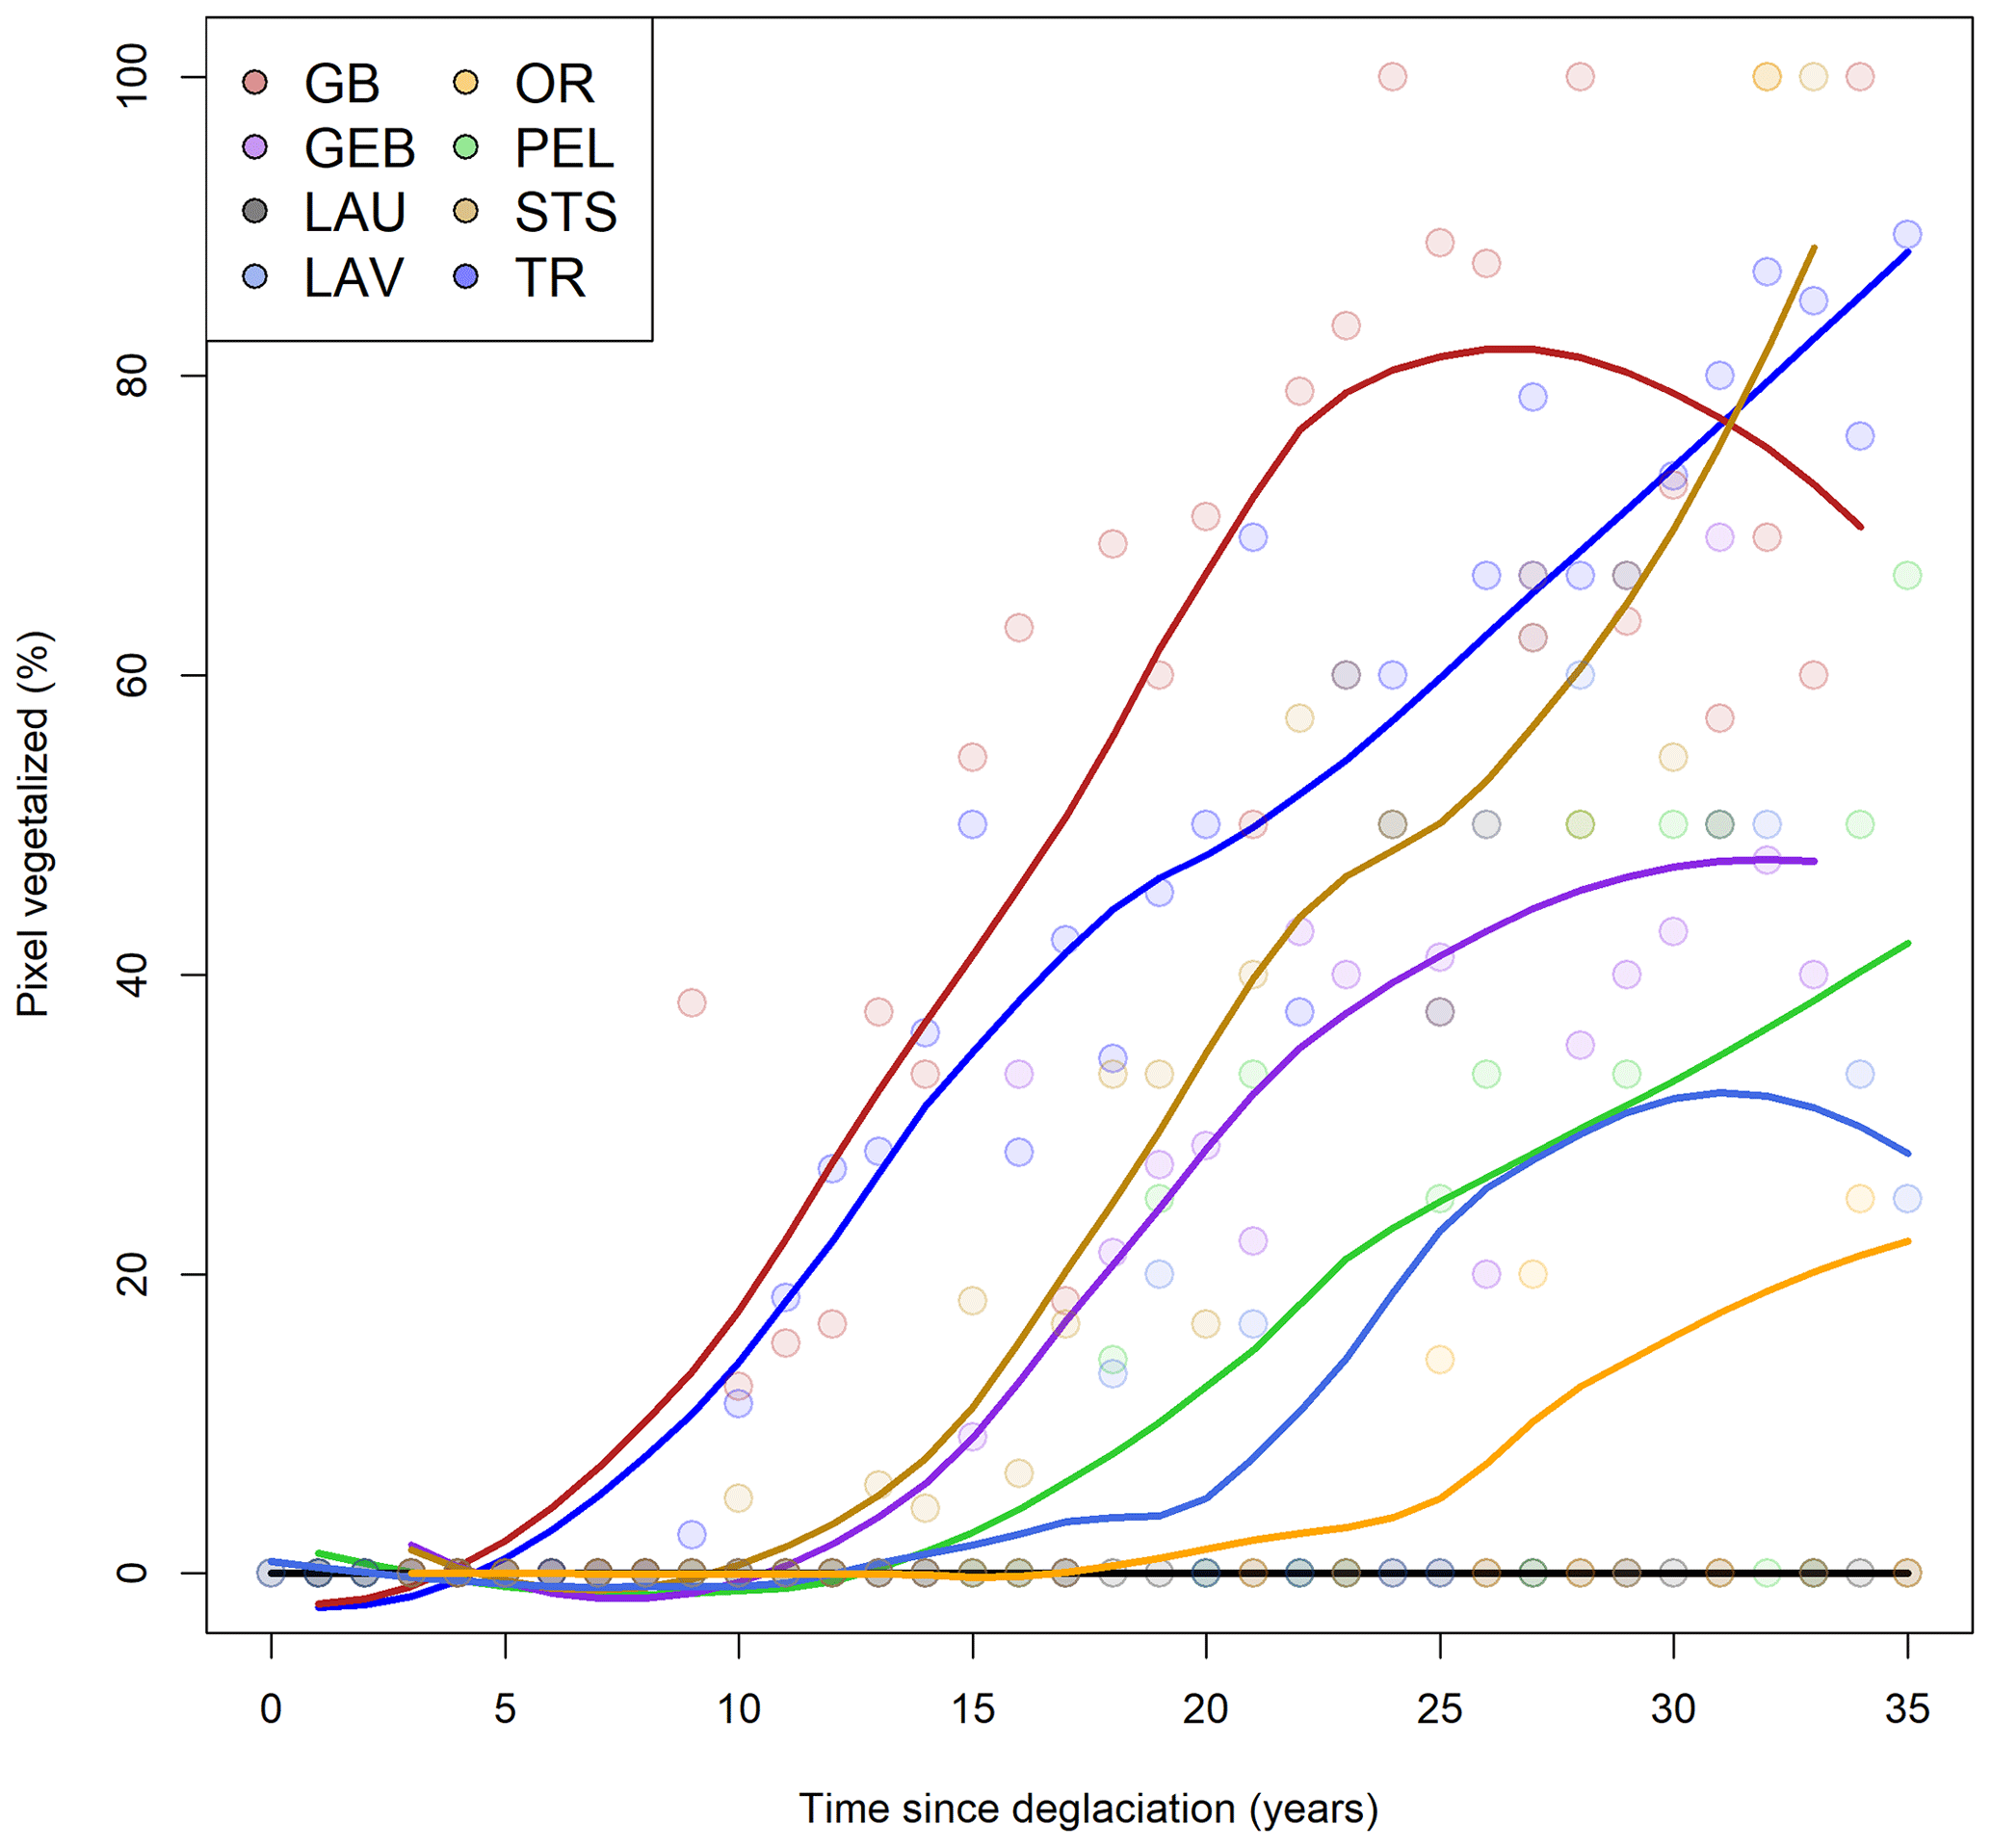
Figure 5Proportion of pixels identified as vegetated according to time since deglaciation for all pixels within the eight glacier forefields. Trend lines are computed from a LOESS function with a span of 0.7.
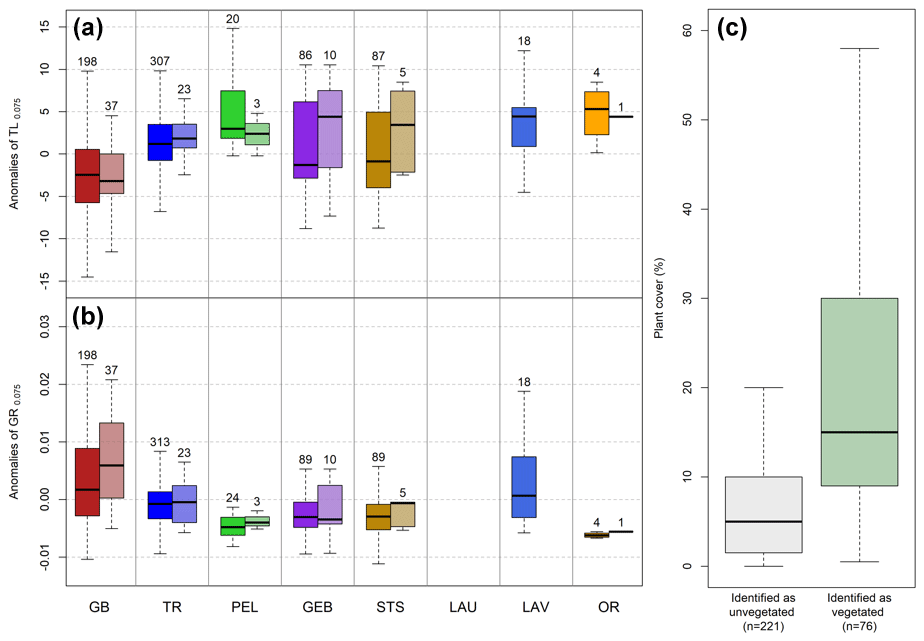
Figure 6Distribution of (a) time lag and (b) growth rate anomalies for the eight glacier margins for an NDVI threshold of 0.075. For each glacier, the left boxplots with solid colors correspond to all pixels, while the right boxplots with more transparent colors correspond only to pixels overlapping floristic plots. (c) Distribution of plant cover (%) for floristic plots that have been identified as vegetated or unvegetated based on the remote sensing approach.
4.1 Vegetation dynamics heterogeneity assessed through remote sensing
Using 36 years of NDVImax obtained from the Landsat time series, we found strong heterogeneity within and between glacier forefields. It took on average 10 years following deglaciation to reach an average NDVI value of 0.075 for GB in comparison with, for example, 27 years for GEB, 17 for TR, 25 for STS, or even no vegetation detected for LAU over the entire period (Fig. 4). Within glacier forefields, plant colonization rates varied depending on the glacier, with GB depicting the highest heterogeneity in NDVI dynamics following deglaciation, while TR is a more homogenous example with almost no pixel with an NDVI value under 0.075 after 30 years (Fig. 4). Also, we did not find vegetated pixels for LAU over the study period, which was corroborated by low plant cover recorded in the 2019 field survey (on average 4 %). By simply considering pixels as colonized by plants or not, we found that after 30 years since deglaciation 80 % of GB, TR, and STS forefields were colonized, while only 30 % were colonized for PEL and LAV (Fig. 5). Overall, considering anomalies of TL0.075, we found similar results, with GB being the most dynamic forefield with pixels that tended to become colonized by vegetation 3 years faster and with higher growth rates than average (Fig. 6a).
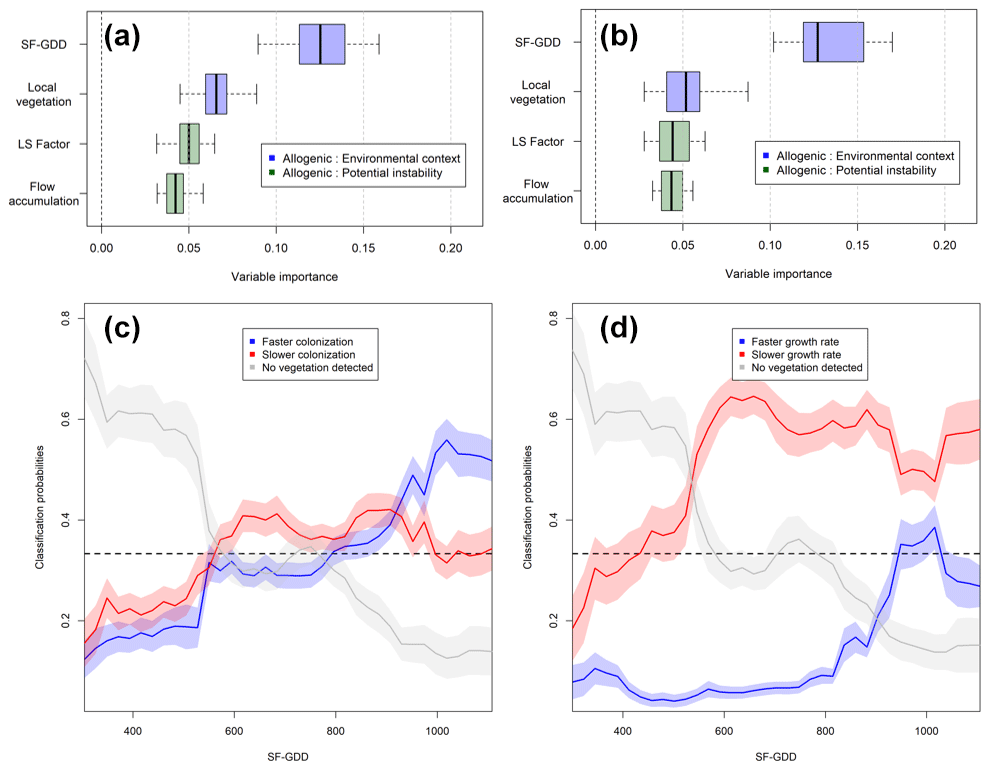
Figure 7Variable importance from the random forest model considering the three classes of (a) TL and (b) GR. Partial dependency plots illustrating how SF-GDD affects class probability for the three classes of (c) TL and (d) GR.
The two random forest models achieved an overall accuracy of 75 % and 72 % for TL and GR, respectively, which translates to a good capacity of the four predictors to classify time lag and growth rate anomalies as positive, negative, or absent. Mean decrease in accuracy (MDA) was used to order the four predictors according to their importance of overall classification accuracy (Fig. 7). SF-GDD was overall the most important predictor for both models (MDA = 0.128 (0.127) for TL (GR)) compared to local vegetation, LS factor, and flow accumulation (0.062 (0.052), 0.051 (0.041), and 0.044 (0.04), respectively, for TL (GR)). Overall, allogenic factors describing environmental context were more important than potential geomorphological disturbance variables (Fig. 7a and b). Classification probabilities showed that faster colonization occurred with SF-GDD > 900 (prob > 0.5), while slower colonization occurred mostly between 500 and 900 SF-GDD. Slower growth rates occurred with SF-GDD > 500, while faster growth rates occurred sporadically above 900 SF-GDD (Fig. 7d). The class of undetected vegetation occurs mostly under 500 SF-GDD for both TL and GR (Fig. 7c and d).
4.2 Agreement between field and Landsat observations of plant cover
By comparing plant cover of the 297 floristic plots to the detection of vegetation as detected by Landsat NDVI, we found that the 221 floristic plots identified as unvegetated had an average plant cover of 5 % (Fig. 6c). These results matched the initial sensitivity targeted considering the scale difference between Landsat pixels and floristic plots. Similarly, we found anomalies of TL0.075 and GR0.075 to be representative of the overall vegetation dynamics of glacier forefields as values tended to be similar when we compared only pixels that overlapped floristic plots to the entire forefield (Fig. 6a and b).
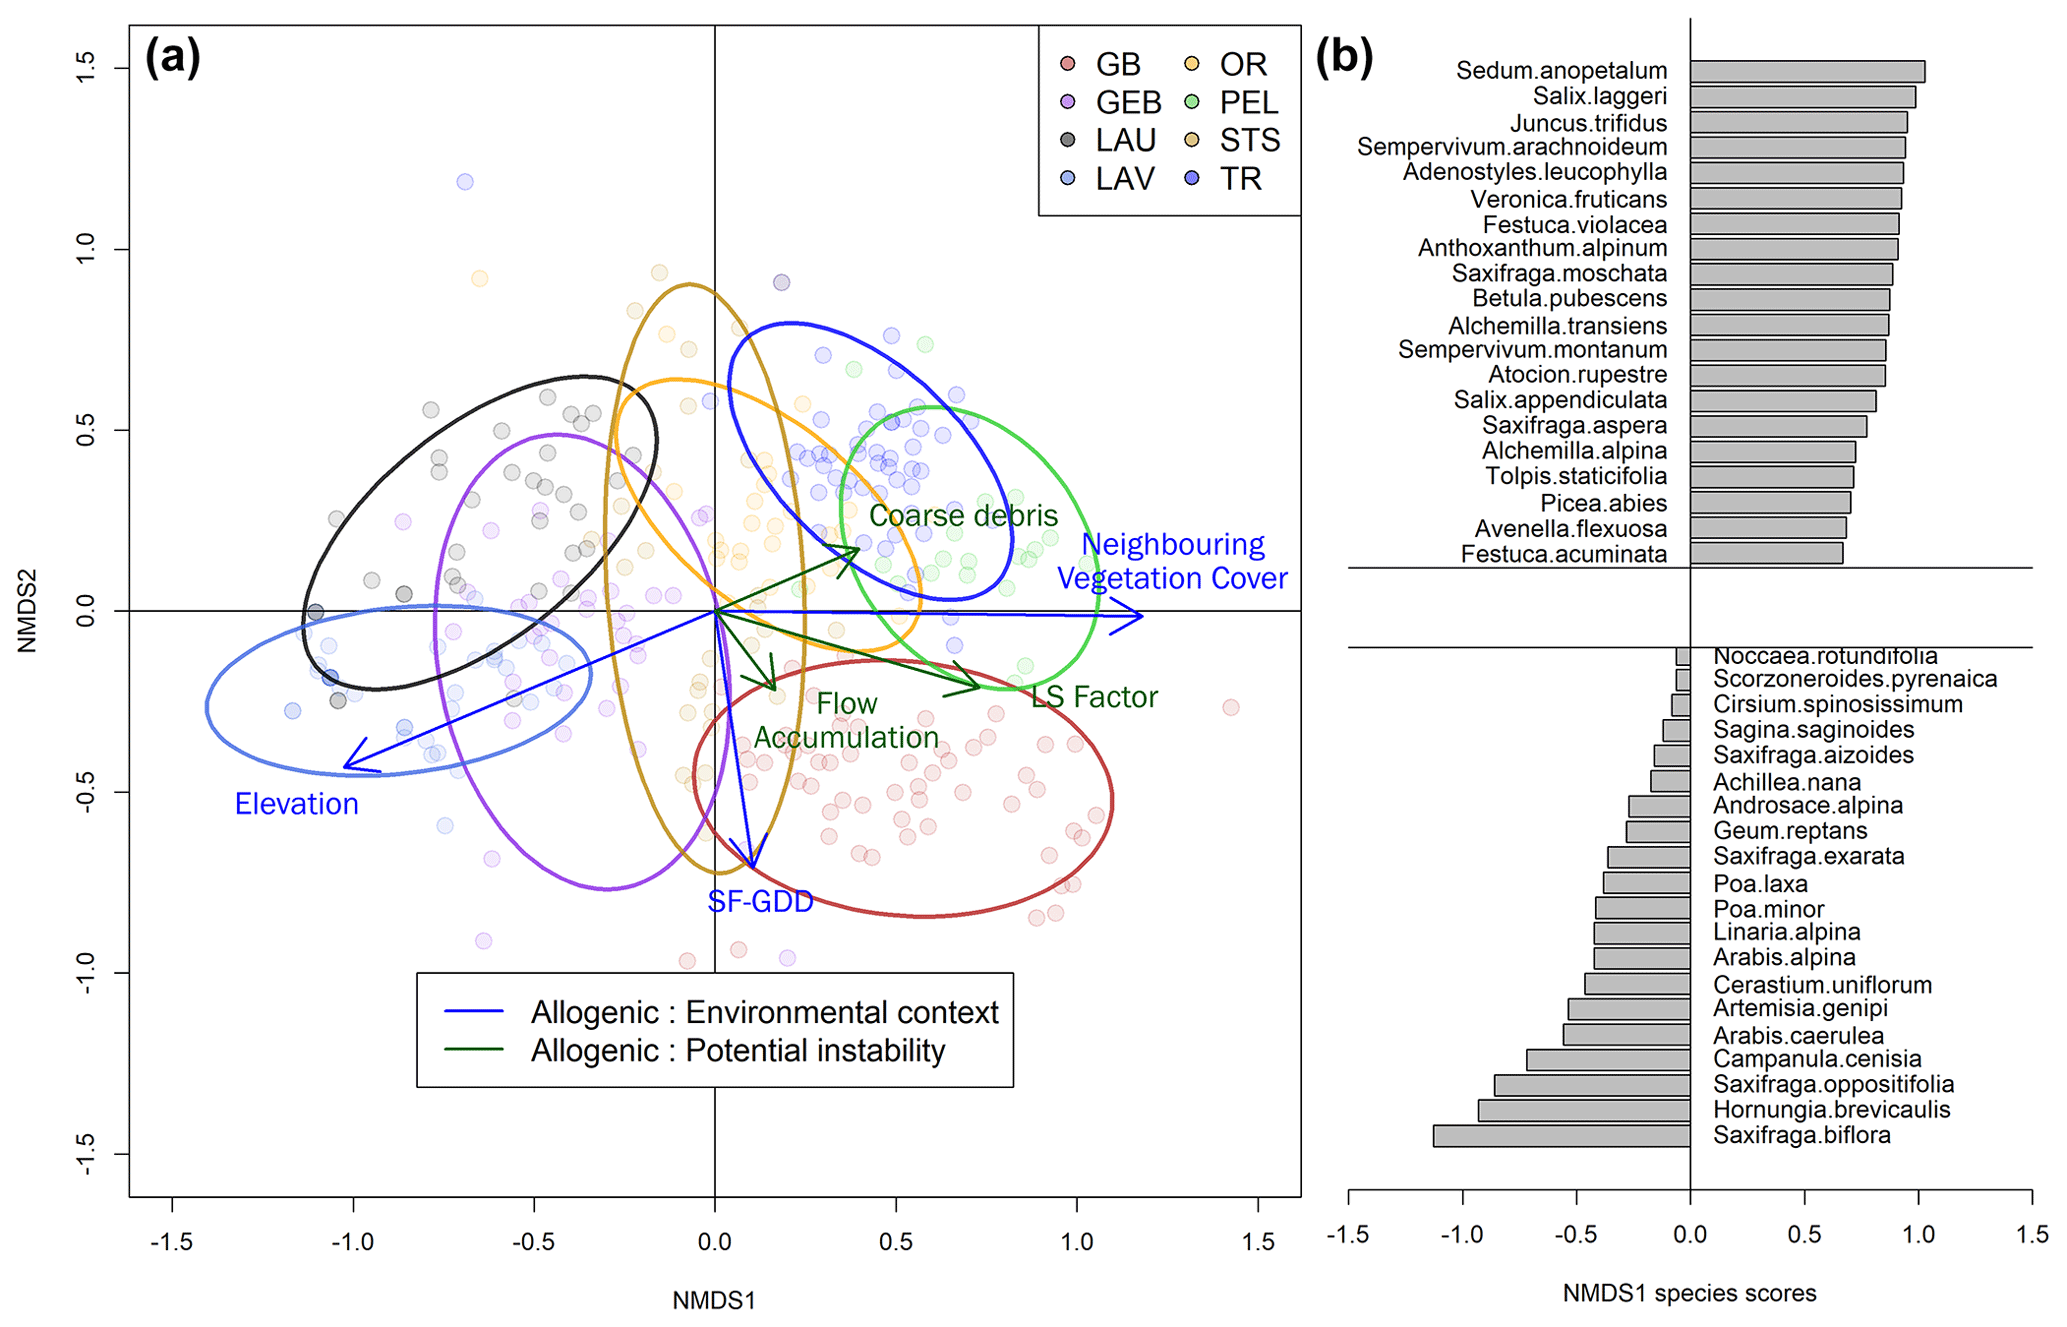
Figure 8(a) Non-metric multidimensional scaling (NMDS) of floristic plots by species with vector fitting of explanatory variables implemented using generalized least-squares (GLS) regression corrected for autocorrelated error structure. Ellipsoids correspond to an interval of 0.8 the standard deviation. The analysis includes 297 plots from the eight glacier forefields. (b) Species distribution along the NMDS first axis, with the 20 species depicting the highest and lowest scores.
4.3 Environmental context drives plant species assemblages and succession dynamics
The first axis of the NMDS showed a floristic gradient representative of species turnover along an elevation gradient throughout the southwestern European Alps (Fig. 8a and b). Cold-adapted high-alpine specialist species include low-stature, pioneer hemicryptophytes of sparsely vegetated screes, talus, and rock debris such as Linaria alpina, Cerastium uniflorum, and Saxifraga spp. Species typically found at lower elevations included phanerophytes (Picea abies) and chamaephytes (Vaccinium uliginosum). Notably, early successional species in the context of the Glacier Blanc, Pèlerins, and Tour glaciers included trees and shrubs such as Larix decidua and Salix laggeri.
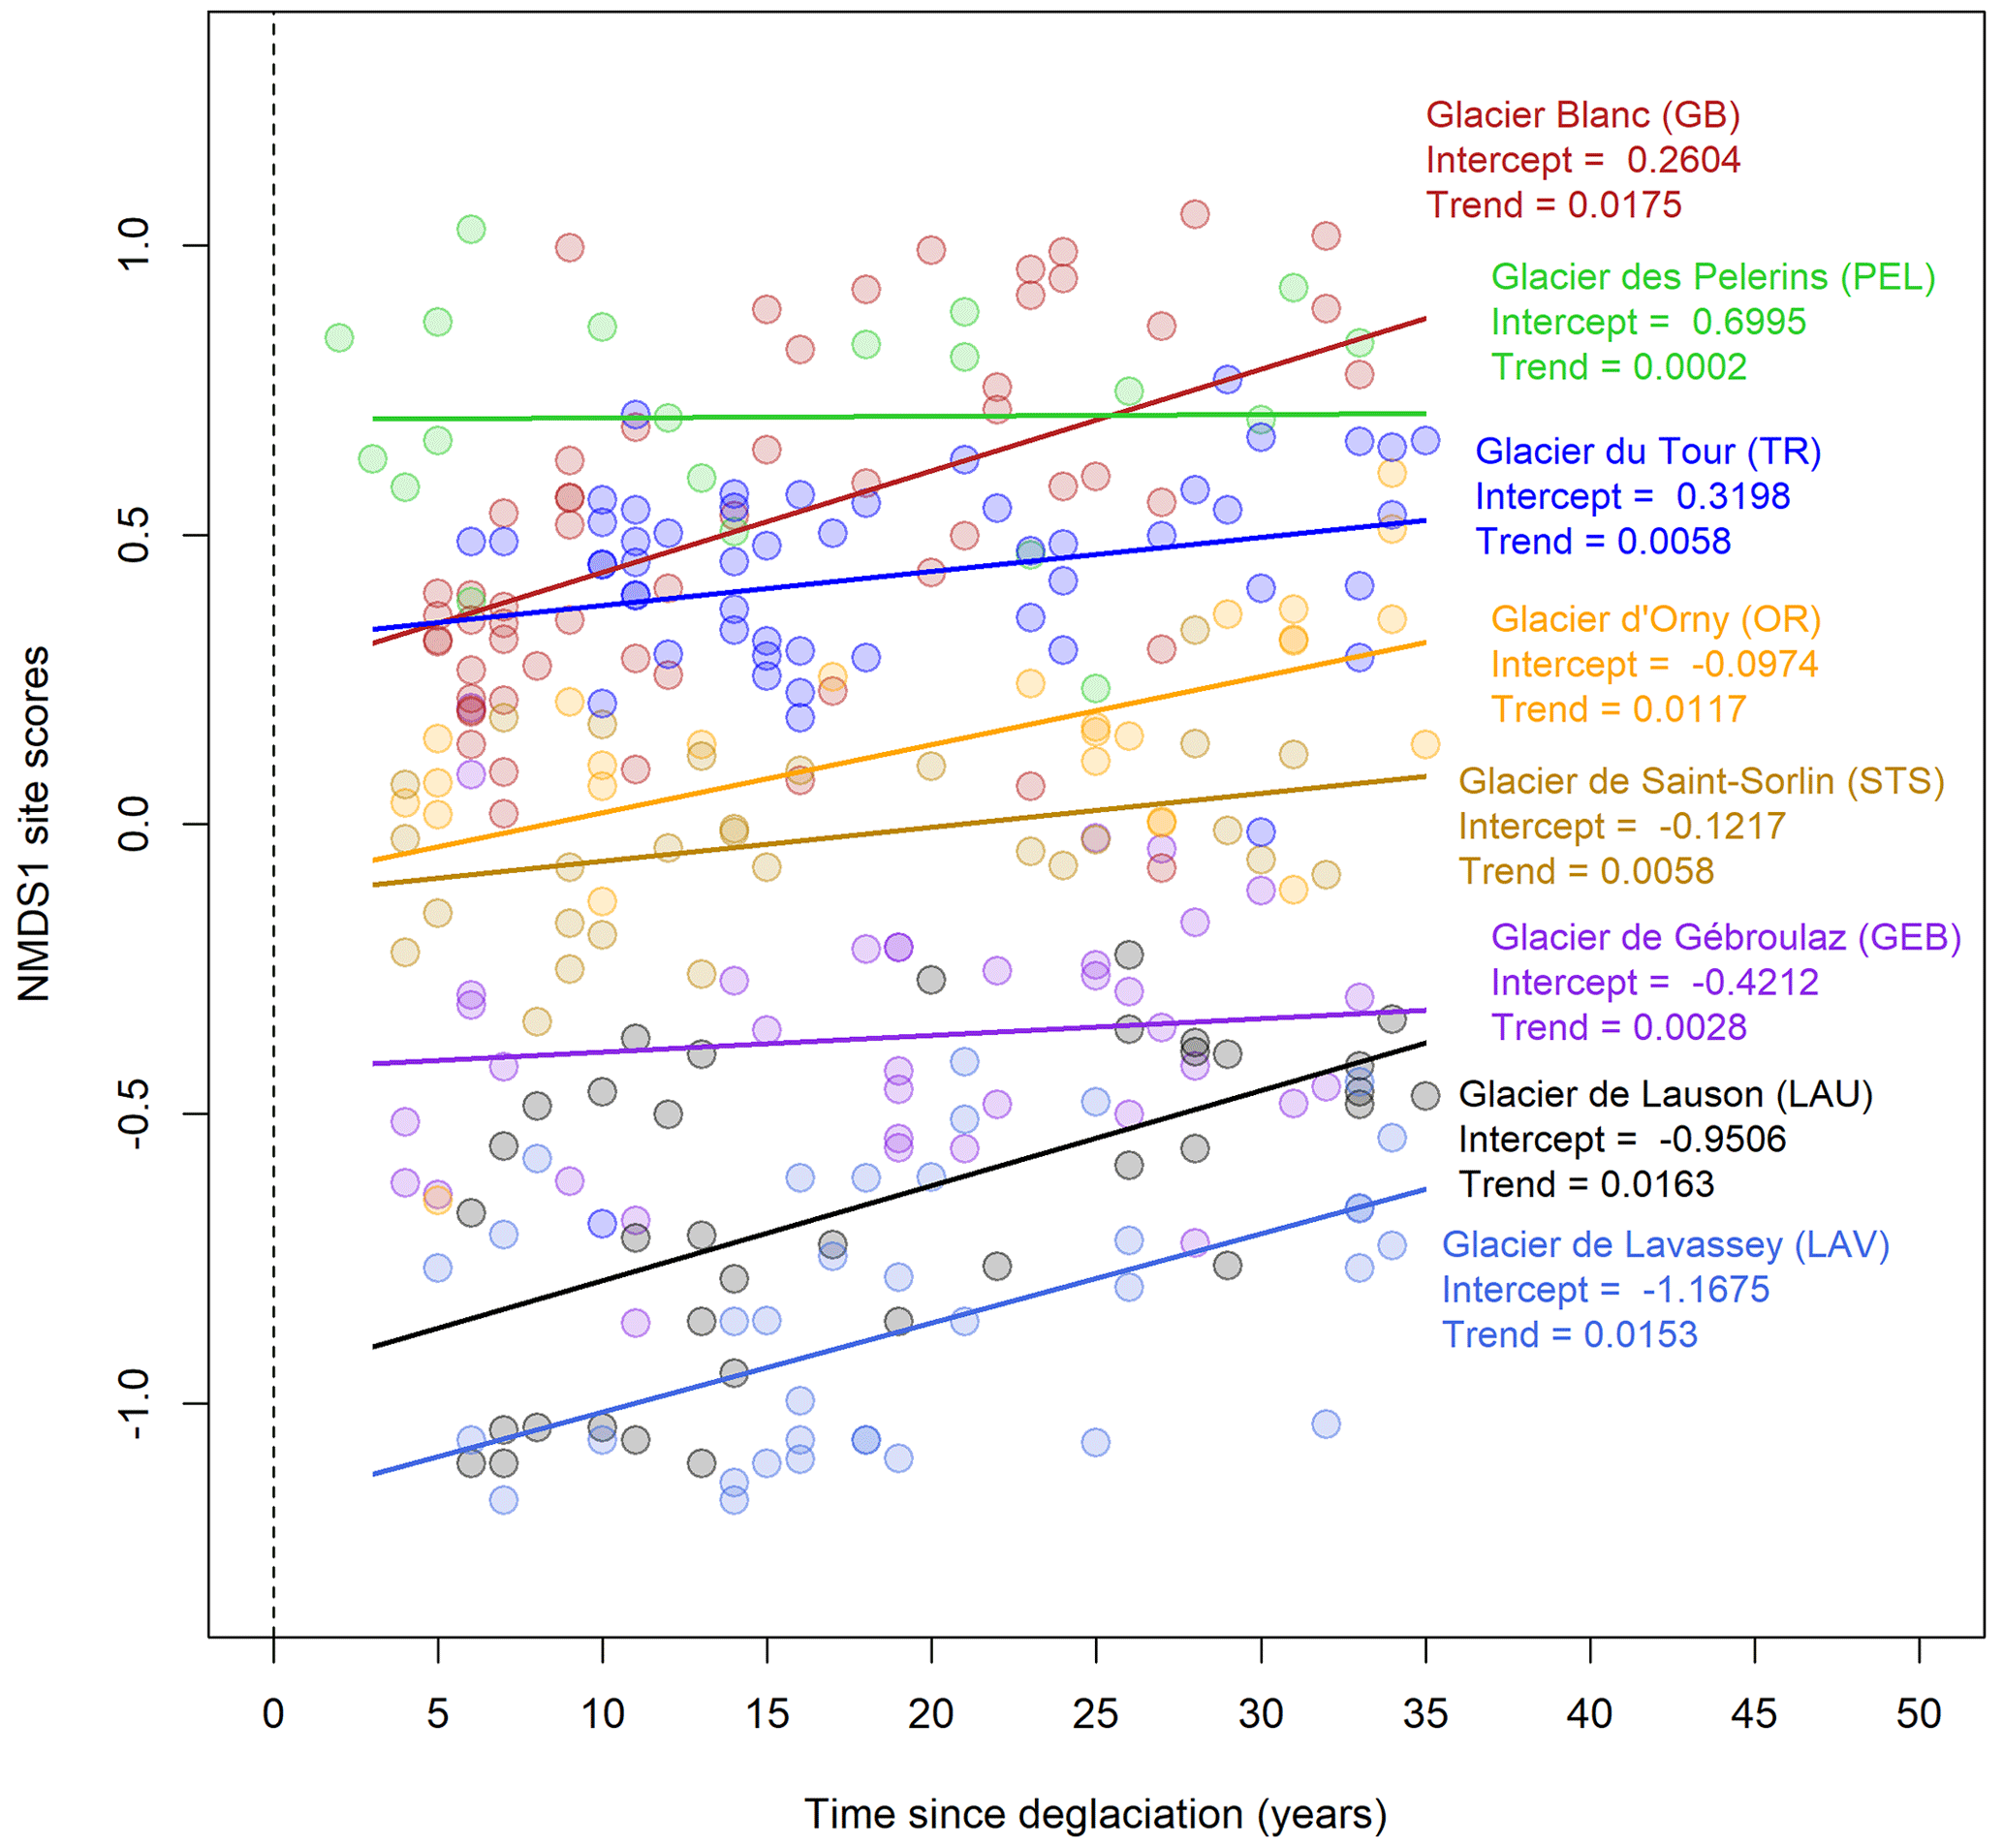
Figure 9First axis scores of the NMDS according to time since deglaciation for the eight glacier forefields. Intercept and slope parameters are based on linear models for each glacier forefield.

Figure 10First axis scores of the NMDS according to the three classes of anomalies of (a) time lag and (b) growth rate for an NDVI threshold of 0.075. The letters i, ii, and iii indicate significant differences based on the Wilcoxon test (p values < 0.05).
The GLS model including a spatial correlation error structure had a better fit (lower AICc) for the three allogenic variables and for flow accumulation. The importance of the spatial structure was particularly strong for elevation with a pseudo-R2 of 0.74 without spatial autocorrelation to be compared to 0.23 with spatial autocorrelation. This indicated that the relationship between elevation and the floristic composition was mainly driven by the elevational differences between glacier forefields. For all other variables, we found no major changes in the relationships between NMDS axes and variables. NMDS1 was positively correlated to neighboring vegetation cover (pseudo-R2 = 0.629) and SF-GDD (pseudo-R2 = 0.559) in the best fit models. NMDS1 was poorly correlated to other factors such as the LS factor (r2 = 0.25), debris size (r2 = 0.0836), flow accumulation (r2 = 0.037), and time since deglaciation (r2 = 0.0046). By comparing NMDS1 scores to time since deglaciation, we found that elapsed time following deglaciation led to more late successional species for all glacier forefields (except at PEL) but at a rate insufficient to surpass the effect of initial plant community composition (Fig. 9). We found the initial starting point of the succession to be mostly driven by allogenic factors describing the environmental context (average r2 = 0.68) and not potential geomorphological disturbances (average r2 = 0.1288) or time available (r2 = 0.0046) (Table 1). Finally, we found that the heterogeneity of vegetation dynamics described through the anomalies of TL0.075 and GR0.075 were linked to the NMDS1 scores with slower colonization (positive TL0.075 anomalies) and growth (negative GR0.075 anomalies) rate corresponding to lower NMDS1 site scores (Fig. 10).
Table 1Corrected Akaike information criterion and pseudo-R2 values for two generalized least-squares (GLS) regression models including or not including the autocorrelated error structure.

Our comparative study of vegetation dynamics in glacier forefields based on two complementary and independent approaches provides insight into the heterogeneity of early plant succession dynamics after glacier retreat at the regional scale. First, using the Landsat time series, we found strong variability in the time lag between deglaciation and colonization by plants and plant growth rate within and between glacier forefields (Figs. 4–6). We showed that this heterogeneity was mostly explained by the local environmental context, i.e., local vegetation surrounding the forefields and energy availability linked to temperature and snowmelt gradients, rather than potential geomorphological context (Fig. 7). Furthermore, we found that the composition of early plant succession communities (0–35 years since deglaciation), i.e., the initial starting point of plant succession, was highly variable from one glacier to another and depended strongly on the topoclimatic context of the glacier forefield (Fig. 8 and Table 1). Interestingly, elapsed time since deglaciation was insufficient to overstep the determinism of the initial starting point, highlighting the importance of the local environmental context to understand early plant succession in glacier forefields (Fig. 9). Overall, both approaches converged towards this conclusion (Fig. 10), suggesting that early plant succession is not stochastic as previous authors have suggested (Wojcik et al., 2021) but rather deterministic in relation to environmental conditions.
5.1 Succession dynamics in glacier forefields are shaped by local environmental context
In our analysis, early vegetation dynamics in glacier forefields can be divided into two phases: (i) the lag between deglaciation and plant colonization (as detected by satellite) and (ii) the succession dynamics following initial plant colonization (Fig. 3). We analyzed the heterogeneity of the first phase through two approaches based on remote sensing. First, as we distinguished vegetated from non-vegetated pixels, we were able to estimate the proportion of glacier forefields to become colonized by vegetation with respect to time since deglaciation. We found strong heterogeneity between glacier forefields, with 80 % of the forefield colonized by plants after 30 years for GB, TR, and STS, while the five other forefields did not reach 50 % of vegetation cover over the same period, with no vegetation identified for LAU (Fig. 5). The second approach directly quantifies the time lag between deglaciation and plant colonization. Nonetheless, as the range of absolute time lag is constrained by the length of the period between the year of deglaciation and the end of the time series, time lag could only be compared as anomalies regarding the median time lag for each year of deglaciation (Fig. 7a).
Time lag between deglaciation and plant establishment has been shown to be dependent on the proximity and availability of seed sources (Erschbamer et al., 2001; Stöcklin and Bäumler, 1996; Tackenberg and Stöcklin, 2008; Garbarino et al., 2010) and species ability to disperse (Fickert and Grüninger, 2018), findings which are consistent with our results. Indeed, using partial dependency analysis, we showed that the time lag anomalies (including the absence of vegetation detected) are distributed along the SF-GDD gradient, which in turn is highly correlated to both elevation and neighboring vegetation cover. These results confirm that high-elevation forefields surrounded by sparsely vegetated scree slopes tend to be colonized more slowly than forefields at lower elevation with dense patches of vegetation nearby. This conclusion is supported if we consider the most and least dynamic forefields (in terms of vegetation colonization rate), respectively, GB and LAU, which match these characteristics. In terms of spatial distribution, the GB forefield is also located at lower latitude and is the only south-facing glacier forefield among the eight glaciers studied (Fig. 1), both of which contribute to earlier snow melt out and greater accumulation of growing degree days for an equivalent elevation located on a north-facing glacier situated at a higher latitude. Indeed, the left bank of the GB forefield has been described by Bayle (2020) as highly dynamic, which is confirmed here with colonization occurring within 1 to 5 years after deglaciation, as reported elsewhere in the European Alps (Burga et al., 2010; Cannone et al., 2007; Fickert and Grüninger, 2018). This specificity is known to be due to the proximity of a dense vegetation patch which was located at less than 100 m to the glacier tongue in 1984 and at low elevation (2400 ). Conversely, the LAU forefield deglaciated at the same period is located at 3100 , further to the north in the Grand Paradiso National Park with only sparse vegetation nearby (Mainetti et al., 2021).
While previous studies have reported consistent pioneer plant species and functional groups giving way to later successional species in the context of glacier forefields (e.g., Schumann et al., 2016), our study of multiple glacier forefields indicates that the identity of pioneer species varies highly from one site to another and depends strongly on local environmental context. Figure 9 shows that practically all of the plant communities encountered across the floristic gradient of the eight forefields have the potential to be pioneer species, given the wide range of initial starting points for initial community composition shown across NMDS scores. We emphasize that tree species such as Picea abies or Betula pubescens or shrubs such as Salix laggeri are just as capable of establishing quickly in the wake of glacier retreat as smaller stature forbs including Saxifraga or Poa spp. (Figs. 8 and 9). Accordingly, we argue that the identity of pioneer species and the structure of community composition, as well as the subsequent rate of growth following establishment (Fig. 10), are strongly influenced during the first decades of succession by energy availability and nearby vegetation.
5.2 The importance of geomorphological drivers of plant succession dynamics
While we did not observe high explanatory power of geomorphic variables in explaining the heterogeneity of succession dynamics in glacier forefields, a large number of studies have shown otherwise (Gurnell et al., 2001; Moreau et al., 2008; Burga et al., 2010; Eichel et al., 2013, 2018; Temme and Lange, 2014; Klaar et al., 2015; Heckmann et al., 2016; Eichel, 2019; Miller and Lane, 2018; Wojcik et al., 2020, 2021). Biogeomorphological studies emphasize that landscape dynamics within glacier forefields depend on the balance between stabilizing and destructive forces (Eichel et al., 2018). Indeed, proglacial plant succession in the wake of deglaciation alters site conditions and decreases the magnitude and/or the spatial extent of geomorphological disturbances (Gurnell et al., 2000; Moreau et al., 2008; Eichel, 2019; Miller and Lane, 2018). More specifically, the biogeomorphic phase, characterized by feedbacks between abiotic and biotic processes, is a key stage of landscape stabilization in glacier forefields. However, exacerbated fluvioglacial and hillslopes processes within the deglaciated area during the first stage of the so-called paraglacial period may also delay the succession rate through rejuvenation of proglacial deposits (Wojcik et al., 2020).
Through the remote sensing and floristic approaches used here, GB displayed exceptionally fast colonization in certain areas but also high heterogeneity within the forefield, with up to 30 years of difference in time lag for the same year of deglaciation (Fig. 6a). We attribute this heterogeneity to spatial variability in the intensity of potential geomorphological disturbance (Lardeux et al., 2015). Specifically, a gullying area on the right bank of the forefield remains active and thus prevents vegetation establishment, as described by Bayle (2020) and Lardeux et al. (2015). This geomorphic activity is known to be the result of an active eroding slope supported by a slowly melting ice-cored moraine, which is a phenomenon too fine and complex to be captured by our low-resolution variables of potential instability. This example shows that, although the sum of degree days during the growing season (SF-GDD) and local vegetation explained most of the observed heterogeneity in observed vegetation dynamics (lag and growth rate), finer variables estimating direct instability and geomorphic activities based on a high-resolution imagery or field measures would locally change the balance of importance and improve the predictive capacity of models (Fig. 7). The PEL glacier provides a further example, where we observed long lag times and slow growth rates despite relatively low elevation and accordingly high SF-GDD, which we attribute to the extremely chaotic and blocky substrate observed in the field. Although we did attempt to capture potential geomorphological disturbances through substrate heterogeneity by calculating the weighted mean estimate of block size for floristic plots, we found similar results in this case compared to coarser DEM-based variables. Thus, we lacked a spatially continuous and ecologically relevant estimate of substrate properties. Estimating block size and geomorphological properties using a remote sensing approach has been explored (Westoby et al., 2017; Vázquez-Tarrío et al., 2017; Langhammer et al., 2019; Eichel et al., 2020; Lang et al., 2021) and constitutes an important perspective for enhancing the analysis conducted in the present study, perhaps especially in regard to later plant succession dynamics known to be particularly linked to biogeomorphic feedbacks (Eichel et al., 2016; Miller and Lane, 2018; Lane et al., 2016).
We argue that the poor predictive capabilities of our geomorphological variables can be in part explained by the fact that those measure potential and not realized instability. Furthermore, the poor predictive capacity of our potential geomorphological disturbance variables could be explained by scale differences. Most studies highlighting the importance of geomorphic activities in explaining succession dynamics heterogeneity have been conducted at the glacier forefield scale at sub-meter spatial resolution. Our regional-scale approach showed that the local environmental context drives an initial starting point and that other local factors are insufficiently determinant to overrule it (Fig. 9). We hypothesize that for our analysis, the importance of geomorphological variables and processes were overshadowed by broader-scale and more contextual drivers such as energy availability. Finally, because of the low sensitivity of our remote sensing approach (discriminating vegetation cover around 10 % only), it is possible that we only detect vegetation that develops on stable surfaces unaffected by geomorphological activities. In other words, we might only detect vegetation after the battle between substrate instability and colonization by plants (Eichel et al., 2016), resulting in large underestimation of the importance of geomorphological activities.
5.3 The Landsat time series effectively captures vegetation dynamics in a real-time approach
The Landsat time series offers the possibility to study vegetation dynamics using a real-time approach, given its temporal resolution and depth (Wulder et al., 2019; Bayle et al., 2021). For the first time, we used the Landsat archive since the mid-1980s to quantify real-time plant colonization dynamics at the scale of glacier forefields, based on ecologically relevant indicators of time lag and growth rate following establishment. In the context of the observed generalized greening of the European Alps (Choler et al., 2021), these parameters provide further insight into trajectories of plant colonization in the context of peri-glacial greening hotspots. Nonetheless, this approach inevitably comes with some uncertainty and bias that merit discussion.
Relationships between NDVI and certain biophysical properties of vegetation canopies, such as leaf area index (LAI), vegetation cover, and biomass have been widely studied (Ormsby et al., 1987; Wittich and Hansing, 1995), including in the context of glacier forefields (Bayle et al., 2021; Knoflach et al., 2021) and in sparsely vegetated sites in the Antarctic (Fretwell et al., 2011). Further testing of relationships between NDVI and plant canopy properties in the context of glacier forefields remains necessary, however, to better understand the effects of specific conditions unrelated to vegetation that can alter reflectance, such as low organic content in soil (Todd et al., 1998), coarse granulometry, and complex angular effects due to micro-topography (Bayle et al., 2021). Despite the difference in area between field plots (2 m × 2 m) and Landsat pixels (30 m × 30 m), we found similar sensitivity between ground truth vegetation cover and NDVI values to that of Bayle et al. (2021) and thus validate that within this study region an NDVI value of 0.075 efficiently identifies pixels with more or less than 5 %–10 % vegetation cover (Fig. S10). Nonetheless, because of coarse resolution and noises inherent to NDVI time series, our approach is unable to detect reverse trends with vegetated pixels changing to unvegetated pixels. For example, after several years of vegetation detection, a sudden drop in NDVI resulting in the pixel being identified as unvegetated could be interpreted as the result of disturbance or due to spectral-related noises, with no possibilities to decipher one from another. Improvement of our approach could be done by using proper ground control information regarding abrupt disturbances in glacier forefields. Also, systematic UAV flight on each glacier forefield could drastically improve the calibration of satellite remote sensing methods while providing relevant information on vegetation distribution and geomorphic activities at one time (Woellner and Wagner, 2019; Healy and Khan, 2022; Lang et al., 2021; Westoby et al., 2017).
Finally, we found that to take full advantage of the time series, the presence of clouds was problematic as the actual cloud mask applied in the data distributed by the USGS (Fmask 3.3) is inefficient in high-elevation areas as soil temperature is too low and is often confused with clouds (Qiu et al., 2017, 2019b). Thus, we recommend using the modified MFmask 4.0 to improve the number of images available (Fig. S8). Despite these challenges, our study thus confirms that the Landsat time series can be efficiently used to monitor vegetation cover changes over time in the context of glacier forefields.
5.4 Field sampling recommendations
Several studies have shown that the initial site conditions defined by substrate material, topography, micro-climate, landscape surroundings, and varying frequencies and/or magnitudes of natural disturbances between sites are of high importance in determining plant succession dynamics in glacier forefields (Joly and Brossard, 2007; Walker and Wardle, 2014; Wojcik et al., 2020; Eichel et al., 2016). Repeated visits of permanent plots represent an alternative to the regular space-for-time approach as they provide a more informative and reliable measure of succession. This approach is costly in terms of effort, however, and furthermore it can be difficult to mark permanent plots in unstable terrain often found in glacier forefields (but see Bakker et al., 1996). An intermediate and less costly approach consists of measuring variations in initial site conditions and geomorphological disturbances along the chronosequence, as proposed by Wojcik et al. (2021). In our field campaign, the eight glacier forefields were surveyed based on a random sampling approach along the chronosequence of deglaciation; however, vegetation plots captured overall heterogeneity within forefields with varying degrees of success (Fig. 6). In accessible glacier forefields of small size and limited geomorphic activities (TR, PEL, GEB, STS, and OR), our approach worked as floristic plots were found to be representative of the vegetation dynamics as assessed from the spatially exhaustive remote sensing approach (Fig. 6). The representativity was less evident for LAV, which can be explained by the large size of the forefield and the presence of cliffs and a lake that drastically constrained accessibility. Also, surfaces known to be affected by geomorphological activities might have been undersampled; for example, the field sampling on GB forefield was mostly limited to the left bank as the right bank was too dangerous due to gullies and ice-cored moraines (Lardeux et al., 2015; Bayle, 2020). Noticeably, our results show that the within forefield variability in vegetation dynamics can be equivalent to the variability observed at regional scale, thus leading to massive bias in our capacity to extrapolate results when studies rely solely on a space-for-time approach applied to a single glacier forefield.
Our study provides lessons that could contribute toward improving future studies carried out in glacier forefields. Although explaining the absence of vegetation was not our question here, to understand where plants will establish, we recommend sampling points characterized by an absence of vegetation in addition to vegetated areas. Indeed, the first step in the primary succession dynamics is whether vegetation can colonize a surface. Thus, the absence of vegetation on deglaciated surfaces should be considered as an extreme case of equal ecological relevance as vegetated plots, especially in the context of biogeomorphic feedbacks and regular disturbances minimizing the probability of establishment and germination. Thus, in the perspective of an exhaustive and representative sampling of the glacier forefield, collecting information on the absence of vegetation appears to be crucial for future field campaigns. Overall, we recommend the following procedure for future field campaigns.
-
Randomly select a predefined number of points using GIS software within targeted glacier forefields.
-
Collect information unrelated to vegetation on plots whether there is vegetation or not and keep track of unreachable random points due to dangerous access as it is a marker of high geomorphic activity, and select plot size and location to facilitate alignment with satellite imagery.
-
Measure plant community structure and composition, including functional traits, both within and outside of the glacier forefields to capture the local environmental context through field sampling.
We quantified heterogeneity in plant succession dynamics based on 36 years of optical satellite imagery and 297 floristic plots distributed among eight glacier forefields in the southwestern European Alps. The projection of autogenic and allogenic factors according to the definition presented in Wojcik et al. (2021) shows that the pioneer plant community composition is strongly correlated with environmental context rather than time since deglaciation. Time since deglaciation is typically identified as the main driver of succession dynamics, as it is fundamentally intrinsic to the idea of succession. Nonetheless, whether time since deglaciation is identified as the main driver of succession is a matter of scale. We showed that if we consider each forefield independently, a clear successional gradient indeed emerges as time since deglaciation increases. But when considering all eight glacier forefields together, energy availability and initial species composition emerged as the key parameters shaping successional dynamics. In the case of both remotely sensed vegetation indices and plant field surveys, we found that this initial starting point was strongly correlated to the local environmental context, rather than the geomorphological context, suggesting that the notion of a “pioneer” species is actually quite flexible (Table 1). Overall, our findings suggest that early stages of plant succession in glacier forefields in the European Alps are highly dependent on the local environmental context and less stochastic than previous studies have suggested.
In the conceptual framework of Wojcik et al. (2021), our findings suggest a reinterpretation of the importance of local environmental context in the initial stages of primary succession, which is considered to be highly stochastic (Chase and Myers, 2011; Dini-Andreote et al., 2015; del Moral, 2009; Mong and Vetaas, 2006; Marteinsdóttir et al., 2010). In contrast, we found that this initial phase was driven by plant opportunism originating from neighboring vegetation, which is a function of environmental context and other biogeographic factors. We highlighted that for the first 30 years of succession, initial plant community composition was far more important than time since deglaciation in shaping plant assemblages and rates of colonization, thus pointing to the importance of quantifying more direct drivers of succession dynamics including both environmental and biological factors. Our work highlights the ongoing need for process-based studies combining remote sensing and field techniques to improve our understanding of local heterogeneity in plant colonization trajectories, and furthermore provides a promising basis for predicting future trajectories of plant succession in the wake of ongoing glacier retreat during the coming decades using widely available remotely sensed predictors.
Research data can be accessed upon request to the corresponding author and at https://doi.org/10.5281/zenodo.7698378 (Bayle et al., 2023). Part of the data used in this paper remain under exclusivity as they were obtained through multiple programs and partnerships.
The supplement related to this article is available online at: https://doi.org/10.5194/bg-20-1649-2023-supplement.
Conceptualization: AB and BZC. Data curation: All authors contributed. Formal analysis: AB and BZC. Writing – Original draft and preparation: AB and BZC. Writing – review and editing: All authors contributed.
The contact author has declared that none of the authors has any competing interests.
Publisher's note: Copernicus Publications remains neutral with regard to jurisdictional claims in published maps and institutional affiliations.
This research was conducted within the Long-Term Socio-Ecological Research (LTSER) Zone Atelier Alpes, a member of the eLTER-Europe network. LECA is part of Labex OSUG@2020 (ANR10 LABX56).
This paper was edited by Anja Rammig and reviewed by Jana Eichel and Thomas Wagner.
Anthelme, F., Cauvy-Fraunié, S., Francou, B., Cáceres, B., and Dangles, O.: Living at the Edge: Increasing Stress for Plants 2–13 Years After the Retreat of a Tropical Glacier, Frontiers in Ecology and Evolution, 9, 584872, https://doi.org/10.3389/fevo.2021.584872, 2021.
Bakker, J. P., Poschlod, P., Strykstra, R. J., Bekker, R. M., and Thompson, K.: Seed banks and seed dispersal: important topics in restoration ecology, Acta Bot. Neerl., 45, 461–490, 1996.
Barrou Dumont, Z., Gascoin, S., Hagolle, O., Ablain, M., Jugier, R., Salgues, G., Marti, F., Dupuis, A., Dumont, M., and Morin, S.: Brief communication: Evaluation of the snow cover detection in the Copernicus High Resolution Snow; Ice Monitoring Service, The Cryosphere, 15, 4975–4980, 2021.
Bayle, A.: A recent history of deglaciation and vegetation establishment in a contrasted geomorphological context, Glacier Blanc, French Alps, J. Maps, 16, 766–775, 2020.
Bayle, A., Roussel, E., Carlson, B. Z., Vautier, F., Brossard, C., Fovet, E., De Bouchard D'Aubeterre, G., and Corenblit, D.: Sensitivity of Landsat NDVI to subpixel vegetation and topographic components in glacier forefields: assessment from high-resolution multispectral UAV imagery, J. Appl. Remote Sens., 15, 044508, https://doi.org/10.1117/1.JRS.15.044508, 2021.
Bayle, A., Roy, A., Dedieu, J.-P., Boudreau, S., Choler, P., and Lévesque, E.: Two distinct waves of greening in northeastern Canada: summer warming does not tell the whole story, Environ. Res. Lett., 17, 064051, https://doi.org/10.1088/1748-9326/ac74d6, 2022.
Bayle, A., Carlson, B. Z., Zimmer, A., Vallée, S., Rabatel, A., Cremonese, E., Filippa, G., Dentant, C., Randin, C., Mainetti, A., Roussel, E., Gascoin, S., Corenblit, D., and Choler, P.: Vegetation table in 8 glacier forefields, Zenodo [data set], https://doi.org/10.5281/zenodo.7698378, 2023.
Barton, K.: MuMIn: Multi-Model Inference, R package version 1.47.2/r505, https://R-Forge.R-project.org/projects/mumin/, last access: 24 April 2023.
Berner, L. T., Massey, R., Jantz, P., Forbes, B. C., Macias-Fauria, M., Myers-Smith, I., Kumpula, T., Gauthier, G., Andreu-Hayles, L., Gaglioti, B. V., Burns, P., Zetterberg, P., D'Arrigo, R., and Goetz, S. J.: Summer warming explains widespread but not uniform greening in the Arctic tundra biome, Nat. Commun., 11, 4621, https://doi.org/10.1038/s41467-020-18479-5, 2020.
Bradshaw, A. D.: Restoration Ecology as a Science, Restor. Ecol., 1, 71–73, 1993.
Breen, K. and Lévesque, E.: The Influence of Biological Soil Crusts on Soil Characteristics along a High Arctic Glacier Foreland, Nunavut, Canada, Arct. Antarct. Alp. Res., 40, 287–297, 2008.
Breiman, L.: Random Forests, Mach. Learn., 45, 5–32, 2001.
Burga, C. A., Krüsi, B., Egli, M., Wernli, M., Elsener, S., Ziefle, M., Fischer, T., and Mavris, C.: Plant succession and soil development on the foreland of the Morteratsch glacier (Pontresina, Switzerland): Straight forward or chaotic? Flora – Morphology, Distribution, Functional Ecology of Plants, 205, 561–576, 2010.
Cannone, N., Sgorbati, S., and Guglielmin, M.: Unexpected impacts of climate change on alpine vegetation, Front. Ecol. Environ., 5, 360–364, 2007.
Carlson, B. Z., Choler, P., Renaud, J., Dedieu, J. P., and Thuiller, W.: Modelling snow cover duration improves predictions of functional and taxonomic diversity for alpine plant communities, Ann. Bot-Londom, 116, 1023–1034, 2015.
Carlson, B. Z., Corona, M. C., Dentant, C., Bonet, R., Thuiller, W., and Choler, P.: Observed long-term greening of alpine vegetation – a case study in the French Alps, Environ. Res. Lett., 12, 114006, https://doi.org/10.1088/1748-9326/aa84bd, 2017.
Cauvy-Fraunie, S. and Dangles, O.: A global synthesis of biodiversity responses to glacier retreat, Nature Ecology and Evolution, 3, 1675–1685, 2019.
Chapin, F. S., Walker, L. R., Fastie, C. L., and Sharman, L. C.: Mechanisms of Primary Succession Following Deglaciation at Glacier Bay, Alaska, Ecol. Monogr., 64, 149–175, 1994.
Chase, J. M. and Myers, J. A.: Disentangling the importance of ecological niches from stochastic processes across scales, Philos. T. Roy. Soc. B, 366, 2351–63, 2011.
Choler, P.: Consistent Shifts in Alpine Plant Traits along a Mesotopographical Gradient, Arct. Antarct. Alp. Res., 37, 444–453, 2005.
Choler, P.: Growth response of temperate mountain grasslands to inter-annual variations in snow cover duration, Biogeosciences, 12, 3885–3897, https://doi.org/10.5194/bg-12-3885-2015, 2015.
Choler, P.: Winter soil temperature dependence of alpine plant distribution: Implications for anticipating vegetation changes under a warming climate, Perspect. Plant Ecol., 30, 6–15, 2018.
Choler, P., Bayle, A., Carlson, B. Z., Randin, C., Filippa, G., and Cremonese, E.: The tempo of greening in the European Alps: Spatial variations on a common theme, Glob. Change Biol., 27, 5614–5628, 2021.
Conrad, O., Bechtel, B., Bock, M., Dietrich, H., Fischer, E., Gerlitz, L., Wehberg, J., Wichmann, V., and Böhner, J.: System for Automated Geoscientific Analyses (SAGA) v. 2.1.4, Geosci. Model Dev., 8, 1991–2007, https://doi.org/10.5194/gmd-8-1991-2015, 2015.
Del Moral, R.: Increasing deterministic control of primary succession on Mount St. Helens, Washington, J. Veg. Sci., 20, 1145–1154, 2009.
Desmet, P. J. J. and Govers, G.: A GIS procedure for automatically calculating the USLE LS factor on topographically complex landscape units, J. Soil Water Conserv., 51, 427–433, 1996.
Dini-Andreote, F., Stegen, J. C., Van Elsas, J. D., and Salles, J. F.: Disentangling mechanisms that mediate the balance between stochastic and deterministic processes in microbial succession, P. Natl. Acad. Sci. USA, 112, E1326–E1332, 2015.
Eastman, J., Sangermano, F., Ghimire, B., Zhu, H., Chen, H., Neeti, N., Cai, Y., Machado, E. A., and Crema, S. C.: Seasonal trend analysis of image time series, Int. J. Remote Sens., 30, 2721–2726, 2009.
Eichel, J.: Vegetation Succession and Biogeomorphic Interactions in Glacier Forelands, Springer, Cham, 327–349, https://doi.org/10.1007/978-3-319-94184-4_19, 2019.
Eichel, J., Krautblatter, M., Schmidtlein, S., and Dikau, R.: Biogeomorphic interactions in the Turtmann glacier forefield, Switzerland, Geomorphology, 201, 98–110, 2013.
Eichel, J., Corenblit, D., and Dikau, R.: Conditions for feedbacks between geomorphic and vegetation dynamics on lateral moraine slopes: a biogeomorphic feedback window, Earth Surf. Proc. Land., 41, 406–419, 2016.
Eichel, J., Draebing, D., and Meyer, N.: From active to stable: Paraglacial transition of Alpine lateral moraine slopes, Land Degrad. Dev., 29, 4158–4172, 2018.
Eichel, J., Draebing, D., Kattenborn, T., Senn, J. A., Klingbeil, L., Wieland, M., and Heinz, E.: Unmanned aerial vehicle-based mapping of turf-banked solifluction lobe movement and its relation to material, geomorphometric, thermal and vegetation properties, Permafrost Periglac., 31, 97–109, 2020.
Erschbamer, B., Kneringer, E., and Schlag, R. N.: Seed rain, soil seed bank, seedling recruitment, and survival of seedlings on a glacier foreland in the Central Alps, Flora, 196, 304–312, 2001.
Ficetola, G. F., Marta, S., Guerrieri, A., Gobbi, M., Ambrosini, R., Fontaneto, D., Zerboni, A., Poulenard, J., Caccianiga, M., and Thuiller, W.: Dynamics of Ecological Communities Following Current Retreat of Glaciers, Annu. Rev. Ecol. Evol. S., 52, 405–426, 2021.
Fickert, T. and Grüninger, F.: High-speed colonization of bare ground-Permanent plot studies on primary succession of plants in recently deglaciated glacier forelands, Land Degrad. Dev., 29, 2668–2680, 2018.
Fischer, A., Fickert, T., Schwaizer, G., Patzelt, G., and Gross, G.: Vegetation dynamics in Alpine glacier forelands tackled from space, Sci. Rep.-UK, 9, 13918, https://doi.org/10.1038/s41598-019-50273-2, 2019.
Franzén, M., Dieker, P., Schrader, J., and Helm, A.: Rapid plant colonization of the forelands of a vanishing glacier is strongly associated with species traits, Arct. Antarct. Alp. Res., 51, 366–378, 2019.
Fretwell, P. T., Convey, P., Fleming, A. H., Peat, H. J., and Hughes, K. A.: Detecting and mapping vegetation distribution on the Antarctic Peninsula from remote sensing data, Polar Biol., 34, 273–281, 2011.
Garbarino, M., Lingua, E., Nagel, T. A., Godone, D., Motta, R.: Patterns of larch establishment following deglaciation of Ventina glacier, central Italian Alps, Forest Ecol Manag., 259, 583–590, 2010.
Gardent, M., Rabatel, A., Dedieu, J.-P., and Deline, P.: Multitemporal glacier inventory of the French Alps from the late 1960s to the late 2000s, Global Planet. Change, 120, 24–37, 2014.
Garibotti, I. A., Pissolito, C. I., and Villalba, R.: Spatiotemporal Pattern of Primary Succession in Relation to Meso-topographic Gradients on Recently Deglaciated Terrains in the Patagonian Andes, Arct. Antarct. Alp. Res., 43, 555–567, 2011.
Gascoin, S., Grizonnet, M., Bouchet, M., Salgues, G., and Hagolle, O.: Theia Snow collection: high-resolution operational snow cover maps from Sentinel-2 and Landsat-8 data, Earth Syst. Sci. Data, 11, 493–514, https://doi.org/10.5194/essd-11-493-2019, 2019.
Gobiet, A., Kotlarski, S., Beniston, M., Heinrich, G., Rajczak, J., and Stoffel, M.: 21st century climate change in the European Alps–a review, Sci. Total Environ., 493, 1138–1151, 2014.
Górniak, D., Marszałek, H., Kwaśniak-Kominek, M., Rzepa, G., and Manecki, M.: Soil formation and initial microbiological activity on a foreland of an Arctic glacier (SW Svalbard), Appl. Soil Ecol., 114, 34–44, 2017.
Greenwell, B. M.: pdp: An R Package for Constructing Partial Dependence Plots, R J., 9, 421–436, https://doi.org/10.32614/RJ-2017-016, 2017.
Gurnell, A. M., Edwards, P. J., Petts, G. E., and Ward, J. V.: A conceptual model for alpine proglacial river channel evolution under changing climatic conditions, Catena, 38, 223–242, 2000.
Gurnell, A. M., Petts, G. E., Hannah, D. M., Smith, B. P. G., Edwards, P. J., Kollmann, J., Ward, J. V., and Tockner, K.: Riparian vegetation and island formation along the gravel-bed Fiume Tagliamento, Italy, Earth Surf. Proc. Land., 26, 31–62, 2001.
Haeberli, W., Schaub, Y., and Huggel, C.: Increasing risks related to landslides from degrading permafrost into new lakes in de-glaciating mountain ranges, Geomorphology, 293, 405–417, 2017.
Healy, S. M. and Khan, A. L.: Mapping glacier ablation with a UAV in the North Cascades: A structure-from-motion approach, Frontiers in Remote Sensing, 57, 764765, https://doi.org/10.3389/frsen.2021.764765, 2022.
Heckmann, T., Mccoll, S., and Morche, D.: Retreating ice: research in pro-glacial areas matters, Earth Surf. Proc. Land., 41, 271–276, 2016.
Huss, M., Bookhagen, B., Huggel, C., Jacobsen, D., Bradley, R. S., Clague, J. J., Vuille, M., Buytaert, W., Cayan, D. R., Greenwood, G., Mark, B. G., Milner, A. M., Weingartner, R., and Winder, M.: Toward mountains without permanent snow and ice, Earths Future, 5, 418–435, 2017.
Hutchinson, M. F., Xu, T., and Stein, J. A.: Recent progress in the ANUDEM elevation gridding procedure, Geomorphometry, 2011.
Johnson, E. A. and Miyanishi, K.: Testing the assumptions of chronosequences in succession, Ecol. Lett., 11, 419–431, 2008.
Joly, D. and Brossard, T.: Contribution of environmental factors to temperature distribution at different resolution levels on the forefield of the Loven Glaciers, Svalbard, Polar Rec., 43, 353–359, 2007.
Khedim, N., Cecillon, L., Poulenard, J., Barre, P., Baudin, F., Marta, S., Rabatel, A., Dentant, C., Cauvy-Fraunie, S., Anthelme, F., Gielly, L., Ambrosini, R., Franzetti, A., Azzoni, R. S., Caccianiga, M. S., Compostella, C., Clague, J., Tielidze, L., Messager, E., Choler, P., and Ficetola, G. F.: Topsoil organic matter build-up in glacier forelands around the world, Glob. Change Biol., 27, 1662–1677, 2021.
Klaar, M. J., Kidd, C., Malone, E., Bartlett, R., Pinay, G., Chapin, F. S., and Milner, A.: Vegetation succession in deglaciated landscapes: implications for sediment and landscape stability, Earth Surf. Proc. Land., 40, 1088–1100, 2015.
Knoflach, B., Ramskogler, K., Talluto, M., Hofmeister, F., Haas, F., Heckmann, T., Pfeiffer, M., Piermattei, L., Ressl, C., Wimmer, M. H., Geitner, C., Erschbamer, B., and Stötter, J.: Modelling of Vegetation Dynamics from Satellite Time Series to Determine Proglacial Primary Succession in the Course of Global Warming – A Case Study in the Upper Martell Valley (Eastern Italian Alps), Remote Sens.-Basel, 13, 4450, https://doi.org/10.3390/rs13214450, 2021.
Lane, S. N., Borgeaud, L., and Vittoz, P.: Emergent geomorphic-vegetation interactions on a subalpine alluvial fan, Earth Surf. Proc. Land., 41, 72–86, 2016.
Lang, N., Irniger, A., Rozniak, A., Hunziker, R., Wegner, J. D., and Schindler, K.: GRAINet: mapping grain size distributions in river beds from UAV images with convolutional neural networks, Hydrol. Earth Syst. Sci., 25, 2567–2597, https://doi.org/10.5194/hess-25-2567-2021, 2021.
Langhammer, L., Grab, M., Bauder, A., and Maurer, H.: Glacier thickness estimations of alpine glaciers using data and modeling constraints, The Cryosphere, 13, 2189–2202, https://doi.org/10.5194/tc-13-2189-2019, 2019.
Lardeux, P., Glasser, N., Holt, T., and Hubbard, B.: Glaciological and geomorphological map of Glacier Noir and Glacier Blanc, French Alps, J. Maps, 12, 582–596, 2015.
Legendre, P. and Gallagher, E. D.: Ecologically meaningful transformations for ordination of species data, Oecologia, 129, 271–280, 2001.
Liaw, A. and Wiener, M.: Classification and regression by randomForest, R News, 2, 2002.
Linsbauer, A., Huss, M., Hodel, E., Bauder, A., Fischer, M., Weidmann, Y., Bärtschi, H., and Schmassmann, E.: The New Swiss Glacier Inventory SGI2016: From a Topographical to a Glaciological Dataset, Front. Earth Sci., 9, 704189, https://doi.org/10.3389/feart.2021.704189, 2021.
Mainetti, A., D'amico, M., Probo, M., Quaglia, E., Ravetto Enri, S., Celi, L., and Lonati, M.: Successional Herbaceous Species Affect Soil Processes in a High-Elevation Alpine Proglacial Chronosequence, Frontiers in Environmental Science, 8, 615499, https://doi.org/10.3389/fenvs.2020.615499, 2021.
Markham, B. L. and Helder, D. L.: Forty-year calibrated record of earth-reflected radiance from Landsat: A review, Remote Sens. Environ., 122, 30–40, 2012.
Marta, S., Azzoni, R. S., Fugazza, D., Tielidze, L., Chand, P., Sieron, K., Almond, P., Ambrosini, R., Anthelme, F., Alviz Gazitúa, P., Bhambri, R., Bonin, A., Caccianiga, M., Cauvy-Fraunié, S., Ceballos Lievano, J. L., Clague, J., Cochachín Rapre, J. A., Dangles, O., Deline, P., Eger, A., Cruz Encarnación, R., Erokhin, S., Franzetti, A., Gielly, L., Gili, F., Gobbi, M., Guerrieri, A., Hågvar, S., Khedim, N., Kinyanjui, R., Messager, E., Morales-Martínez, M. A., Peyre, G., Pittino, F., Poulenard, J., Seppi, R., Chand Sharma, M., Urseitova, N., Weissling, B., Yang, Y., Zaginaev, V., Zimmer, A., Diolaiuti, G. A., Rabatel, A., and Ficetola, G. F.: The Retreat of Mountain Glaciers since the Little Ice Age: A Spatially Explicit Database, Data, 6, 107, https://doi.org/10.3390/data6100107, 2021.
Marteinsdóttir, B., Svavarsdóttir, K., and Thórhallsdóttir, T. E.: Development of vegetation patterns in early primary succession, J. Veg. Sci., 21, 531–540, 2010.
Martín-Ortega, P., García-Montero, L. G., and Sibelet, N.: Temporal Patterns in Illumination Conditions and Its Effect on Vegetation Indices Using Landsat on Google Earth Engine, Remote Sens.-Basel, 12, 211, https://doi.org/10.3390/rs12020211, 2020.
Masek, J. G., Vermote, E. F., Saleous, N. E., Wolfe, R., Hall, F. G., Huemmrich, K. F., Gao, F., Kutler, J., and Lim, T. K.: A Landsat Surface Reflectance Dataset for North America, 1990–2000, IEEE Geosci. Remote S., 3, 68–72, 2006.
Matthews, J. A. and Briffa, K. R.: The “little ice age”: re-evaluation of an evolving concept, Geogr. Ann. A, 87, 17–36, 2005.
Miller, H. R. and Lane, S. N.: Biogeomorphic feedbacks and the ecosystem engineering of recently deglaciated terrain, Progress in Physical Geography: Earth and Environment, 43, 24–45, 2018.
Minchin, P. R.: An evaluation of the relative robustness of techniques for ecological ordination, Vegetatio, 69, 89–107, 1987.
Mong, C. E. and Vetaas, O. R.: Establishment of Pinus Wallichiana on a Himalayan Glacier Foreland: Stochastic Distribution or Safe Sites?, Arct. Antarct. Alp. Res., 38, 584–592, 2006.
Moreau, M., Mercier, D., Laffly, D., and Roussel, E.: Impacts of recent paraglacial dynamics on plant colonization: A case study on Midtre Lovénbreen foreland, Spitsbergen (79∘ N), Geomorphology, 95, 48–60, 2008.
Nagol, J. R., Sexton, J. O., Kim, D.-H., Anand, A., Morton, D., Vermote, E., and Townshend, J. R.: Bidirectional effects in Landsat reflectance estimates: Is there a problem to solve?, ISPRS J. Photogramm., 103, 129–135, 2015.
Oksanen, J., Blanchet, F. G., Friendly, M., Kindt, R., Legendre, P., Mcglinn, D., Minchin, P. R., O'hara, R. B., Simpson, G. L., Solymos, P., Henry, M., H. Stevens, Szoecs, E., and Wagner, H.: vegan: Community Ecology Package, http://CRAN.R-project.org/package=vegan (last access: 24 April 2023), 2020.
Ormsby, J. P., Choudhury, B. J., and Owe, M.: Vegetation spatial variability and its effect on vegetation indices, Int. J. Remote Sens., 8, 1301–1306, 1987.
Painter, T. H., Flanner, M. G., Kaser, G., Marzeion, B., Vancuren, R. A., and Abdalati, W.: End of the Little Ice Age in the Alps forced by industrial black carbon, P. Natl. Acad. Sci. USA, 110, 15216–21, 2013.
Pickett, S. T. A.: Space-for-Time Substitution as an Alternative to Long-Term Studies, in: Long-Term Studies in Ecology, edited by: Likens, G. E., Springer, New York, NY, https://doi.org/10.1007/978-1-4615-7358-6_5, 1989.
Pinheiro, J., Bates, D., and R Core Team: R Core Team: Nlme: Linear and Nonlinear Mixed Effects Models R package version 3.1-160, https://CRAN.R-project.org/package=nlme (last access: 24 April 2023), 2022.
Qiu, S., He, B., Zhu, Z., Liao, Z., and Quan, X.: Improving Fmask cloud and cloud shadow detection in mountainous area for Landsats 4–8 images, Remote Sens. Environ., 199, 107–119, 2017.
Qiu, S., Lin, Y., Shang, R., Zhang, J., Ma, L., and Zhu, Z.: Making Landsat Time Series Consistent: Evaluating and Improving Landsat Analysis Ready Data, Remote Sens.-Basel, 11, 51, https://doi.org/10.3390/rs11010051, 2019a.
Qiu, S., Zhu, Z., and He, B.: Fmask 4.0: Improved cloud and cloud shadow detection in Landsats 4–8 and Sentinel-2 imagery, Remote Sens. Environ., 231, 111205, https://doi.org/10.1016/j.rse.2019.05.024, 2019b.
Raffl, C., Mallaun, M., Mayer, R., and Erschbamer, B.: Vegetation Succession Pattern and Diversity Changes in a Glacier Valley, Central Alps, Austria, Arct. Antarct. Alp. Res., 38, 421–428, 2006.
Robbins, J. A. and Matthews, J. A.: Regional Variation in Successional Trajectories and Rates of Vegetation Change on Glacier Forelands in South-Central Norway, Arct. Antarct. Alp. Res., 42, 351–361, 2010.
Robbins, J. A. and Matthews, J. A.: Use of ecological indicator values to investigate successional change in boreal to high-alpine glacier-foreland chronosequences, southern Norway, Holocene, 24, 1453–1464, 2014.
Rosero, P., Crespo-Pérez, V., Espinosa, R., Andino, P., Barragán, Á., Moret, P., Gobbi, M., Ficetola, G. F., Jaramillo, R., Muriel, P., Anthelme, F., Jacobsen, D., Dangles, O., Condom, T., Gielly, L., Poulenard, J., Rabatel, A., Basantes, R., Cáceres Correa, B., and Cauvy-Fraunié, S.: Multi-taxa colonisation along the foreland of a vanishing equatorial glacier, Ecography, 44, 1010–1021, 2021.
Roy, D. P., Kovalskyy, V., Zhang, H. K., Vermote, E. F., Yan, L., Kumar, S. S., and Egorov, A.: Characterization of Landsat-7 to Landsat-8 reflective wavelength and normalized difference vegetation index continuity, Remote Sens. Environ., 185, 57–70, 2016a.
Roy, D. P., Zhang, H. K., Ju, J., Gomez-Dans, J. L., Lewis, P. E., Schaaf, C. B., Sun, Q., Li, J., Huang, H., and Kovalskyy, V.: A general method to normalize Landsat reflectance data to nadir BRDF adjusted reflectance, Remote Sens. Environ., 176, 255–271, 2016b.
Rydgren, K., Halvorsen, R., Töpper, J. P., Njøs, J. M., and Del Moral, R.: Glacier foreland succession and the fading effect of terrain age, J. Veg. Sci., 25, 1367–1380, 2014.
Schaaf, C. B., Gao, F., Strahler, A. H., Lucht, W., Li, X., Tsang, T., Strugnell, N. C., Zhang, X., Jin, Y., Muller, J.-P., Lewis, P., Barnsley, M., Hobson, P., Disney, M., Roberts, G., Dunderdale, M., Doll, C., D'entremont, R. P., Hu, B., Liang, S., Privette, J. L., and Roy, D.: First operational BRDF, albedo nadir reflectance products from MODIS, Remote Sens. Environ., 83, 135–148, 2002.
Scherrer, D. and Körner, C.: Topographically controlled thermal-habitat differentiation buffers alpine plant diversity against climate warming, J. Biogeogr., 38, 406–416, 2011.
Schumann, K., Gewolf, S., and Tackenberg, O.: Factors affecting primary succession of glacier foreland vegetation in the European Alps, Alpine Bot., 126, 105–117, 2016.
Sigl, M., Abram, N. J., Gabrieli, J., Jenk, T. M., Osmont, D., and Schwikowski, M.: 19th century glacier retreat in the Alps preceded the emergence of industrial black carbon deposition on high-alpine glaciers, The Cryosphere, 12, 3311–3331, https://doi.org/10.5194/tc-12-3311-2018, 2018.
Soenen, S. A., Peddle, D. R., and Coburn, C. A.: SCS + C: a modified Sun-canopy-sensor topographic correction in forested terrain, IEEE T. Geosci. S., 43, 2148–2159, 2005.
Sola, I., González-Audícana, M., and Álvarez-Mozos, J.: Multi-criteria evaluation of topographic correction methods, Remote Sens. Environ., 184, 247–262, 2016.
Steven, M. D., Malthus, T. J., Baret, F., Xu, H., and Chopping, M. J.: Intercalibration of vegetation indices from different sensor systems, Remote Sens. Environ., 88, 412–422, 2003.
Stöcklin, J. and Bäumler, E.: Seed rain, seedling establishment and clonal growth strategies on a glacier foreland, J. Veg. Sci., 7, 45–56, 1996.
Tackenberg, O. and Stöcklin, J.: Wind dispersal of alpine plant species: A comparison with lowland species, J. Veg. Sci., 19, 109–118, 2008.
Temme, A. J. A. M. and Lange, K.: Pro-glacial soil variability and geomorphic activity – the case of three Swiss valleys, Earth Surf. Proc. Land., 39, 1492–1499, https://doi.org/10.1002/esp.3553, 2014.
Todd, S. W., Hoffer, R. M., and Milchunas, D. G.: Biomass estimation on grazed and ungrazed rangelands using spectral indices, Int. J. Remote Sens., 19, 427–438, 1998.
Tucker, C. J. and Sellers, P. J.: Satellite remote sensing of primary production, Int. J. Remote Sens., 7, 1395–1416, 1986.
Vázquez-Tarrío, D., Borgniet, L., Liébault, F., and Recking, A.: Using UAS optical imagery and SfM photogrammetry to characterize the surface grain size of gravel bars in a braided river (Vénéon River, French Alps), Geomorphology, 285, 94–105, 2017.
Vernay, M., Lafaysse, M., Monteiro, D., Hagenmuller, P., Nheili, R., Samacoïts, R., Verfaillie, D., and Morin, S.: The S2M meteorological and snow cover reanalysis over the French mountainous areas: description and evaluation (1958–2021), Earth Syst. Sci. Data, 14, 1707–1733, https://doi.org/10.5194/essd-14-1707-2022, 2022.
Vincent, C., Le Meur, E., Six, D., and Funk, M.: Solving the paradox of the end of the Little Ice Age in the Alps, Geophys. Res. Lett., 32, L09706, https://doi.org/10.1029/2005GL022552, 2005.
Vincent, C., Harter, M., Gilbert, A., Berthier, E., and Six, D.: Future fluctuations of Mer de Glace, French Alps, assessed using a parameterized model calibrated with past thickness changes, Ann. Glaciol., 55, 15–24, 2014.
Walker, L. R. and Wardle, D. A.: Plant succession as an integrator of contrasting ecological time scales, Trends in Ecology and Evolution, 29, 504–10, 2014.
Westoby, M. J., Dunning, S. A., Woodward, J., Hein, A. S., Marrero, S. M., Winter, K., and Sugden, D. E.: Sedimentological characterization of Antarctic moraines using UAVs and Structure-from-Motion photogrammetry, J. Glaciol, 61, 1088–1102, 2017.
Wittich, K.-P. and Hansing, O.: Area-averaged vegetative cover fraction estimated from satellite data, Int. J. Biometeorol., 38, 209–215, 1995.
Woellner, R. and Wagner, T. C.: Saving species, time and money: Application of unmanned aerial vehicles (UAVs) for monitoring of an endangered alpine river specialist in a small nature reserve, Biol. Conserv., 233, 162–175, 2019.
Wojcik, R., Donhauser, J., Frey, B., and Benning, L. G.: Time since deglaciation and geomorphological disturbances determine the patterns of geochemical, mineralogical and microbial successions in an Icelandic foreland, Geoderma, 379, 114578, https://doi.org/10.1016/j.geoderma.2020.114578, 2020.
Wojcik, R., Eichel, J., Bradley, J. A., and Benning, L. G.: How allogenic factors affect succession in glacier forefields, Earth-Sci. Rev., 218, 103642, https://doi.org/10.1016/j.earscirev.2021.103642, 2021.
Wulder, M. A., Loveland, T. R., Roy, D. P., Crawford, C. J., Masek, J. G., Woodcock, C. E., Allen, R. G., Anderson, M. C., Belward, A. S., Cohen, W. B., Dwyer, J., Erb, A., Gao, F., Griffiths, P., Helder, D., Hermosilla, T., Hipple, J. D., Hostert, P., Hughes, M. J., Huntington, J., Johnson, D. M., Kennedy, R., Kilic, A., Li, Z., Lymburner, L., Mccorkel, J., Pahlevan, N., Scambos, T. A., Schaaf, C., Schott, J. R., Sheng, Y., Storey, J., Vermote, E., Vogelmann, J., White, J. C., Wynne, R. H., and Zhu, Z.: Current status of Landsat program, science, and applications, Remote Sens. Environ., 225, 127–147, 2019.
Zhang, H. K., Roy, D. P., and Kovalskyy, V.: Optimal Solar Geometry Definition for Global Long-Term Landsat Time-Series Bidirectional Reflectance Normalization, IEEE T. Geosci. S., 54, 1410–1418, 2016.
Zhang, Y., Woodcock, C. E., Arévalo, P., Olofsson, P., Tang, X., Stanimirova, R., Bullock, E., Tarrio, K. R., Zhu, Z., and Friedl, M. A.: A Global Analysis of the Spatial and Temporal Variability of Usable Landsat Observations at the Pixel Scale, Front. Remote Sens., 3, 894618, https://doi.org/10.3389/frsen.2022.894618, 2022.
Zhu, Z. and Woodcock, C. E.: Object-based cloud and cloud shadow detection in Landsat imagery, Remote Sens. Environ., 118, 83–94, 2012.
Zhu, Z. and Woodcock, C. E.: Automated cloud, cloud shadow, and snow detection in multitemporal Landsat data: An algorithm designed specifically for monitoring land cover change, Remote Sens. Environ., 152, 217–234, 2014.
Zimmer, A., Meneses, R. I., Rabatel, A., Soruco, A., Dangles, O., and Anthelme, F.: Time lag between glacial retreat and upward migration alters tropical alpine communities, Perspect. Plant Ecol., 30, 89–102, 2018.