the Creative Commons Attribution 4.0 License.
the Creative Commons Attribution 4.0 License.
 | 16 May 2023
Sea–air methane flux estimates derived from marine surface observations and instantaneous atmospheric measurements in the northern Labrador Sea and Baffin Bay
David Risk
Evelise Bourlon
Kumiko Azetsu-Scott
Evan N. Edinger
Owen A. Sherwood
Vast amounts of methane (CH4) stored in submarine sediments are susceptible to release in a warming Arctic, further exacerbating climate change in a positive feedback. It is therefore critical to monitor CH4 over pan-regional scales to detect early signs of CH4 release. However, our ability to monitor CH4 is hampered in remote northern regions by sampling and logistical constraints, and few good baseline data exist in many areas. From high-resolution atmospheric CH4 measurements and discrete surface water samples, we estimated instantaneous sea–air CH4 fluxes at various locations. We also created a baseline study of current background levels of CH4 in North Atlantic waters based on the atmospheric CH4 data over 22 d in summer 2021 on a roughly 5100 km voyage in the northern Labrador Sea and Baffin Bay between 55 and 72∘ N. In addition, we measured CH4 concentrations across the water column at various stations. Measured atmospheric mixing ratios of CH4 ranged from 1944 to 2012 ppbv, with a mean of 1966 ± 8 ppbv and a baseline of 1954–1981 ppbv. Dissolved CH4 concentrations in the near-surface water peaked at 5.3 nmol L−1 within 1 km down-current of a known cold seep at Scott Inlet and were consistently oversaturated throughout the water column in Southwind Fjord, which is an area that has been recently affected by submarine landslides. Local sea–air CH4 fluxes ranged from 0.003–0.119 µmol m−2 d−1, indicating that the ocean released only small amounts of CH4 to the atmosphere at all stations. Atmospheric CH4 levels were also driven by meteorological, spatial, and temporal variations, and both onshore and ocean-based contributions to atmospheric CH4 mixing ratios are likely. Coupled high-resolution measurements of marine and atmospheric CH4 data have the potential to provide ongoing monitoring in a region susceptible to CH4 releases, as well as critical validation data for global-scale measurements and modelling.
- Article
(9078 KB) - Full-text XML
- BibTeX
- EndNote


Global atmospheric methane (CH4) levels have substantially increased in recent years, with the largest recorded yearly increase from 2020 to 2021 (Dlugokencky, 2016; Nisbet et al., 2019). Due to the high radiative forcing of the greenhouse gas CH4, close observations of atmospheric levels are needed to immediately detect trends and impacts on the future climate. While Arctic regions are subject to rapid warming (Meredith et al., 2019), measurements of atmospheric CH4 levels in these regions are scarce, especially over the ocean. The Arctic Ocean contains large amounts of CH4 in sediments along the continental margins (Kvenvolden, 1988; Shakhova et al., 2010; Mau et al., 2017). With ongoing climate change, permafrost thaw, destabilization of CH4 hydrates, and reduction of sea ice cover may make the Arctic Ocean susceptible to substantial CH4 release, further exacerbating global warming (James et al., 2016). Seafloor gas seeps releasing CH4-rich bubbles into the water column are often found along continental margins. However, the contribution of seafloor gas seeps to atmospheric CH4 entails large uncertainties (Saunois et al., 2016), mostly due to significant temporal and spatial differences in emissions (Boles et al., 2001; Leifer and Boles, 2005; Shakhova et al., 2014; Cramm et al., 2021; Dølven et al., 2022). Water depth and the abundance of methanotrophic bacteria influence the oxidation of CH4, and the speed and strength of currents affect the distribution of the gas in surface waters and in the water column (McGinnis et al., 2006; Reeburgh, 2007; Leonte et al., 2017; Silyakova et al., 2020). Among others, these factors determine how much of the gas escapes to the atmosphere.
While the East Siberian Arctic Shelf overall releases up to 4.5 Tg CH4 yr−1 of mostly thermogenic, but also biogenic, origin (Berchet et al., 2020) with large temporal and spatial variability (Shakhova et al., 2010, 2014; Thornton et al., 2016, 2020), prevailing thought suggests that the North American Arctic Ocean contributes relatively little CH4 to the atmosphere (Manning et al., 2022). Increasing atmospheric concentrations of CH4 have however been reported over the European Arctic Ocean and have been mostly attributed to land-based sources and also to marine point sources from active underwater seeps (Platt et al., 2018). While a few studies have focused on dissolved CH4 levels in northeastern Canadian Arctic waters (Punshon et al., 2014, 2019) where seep locations were suggested (Jauer and Budkewitsch, 2010; Punshon et al., 2019) or confirmed (Cramm et al., 2021), continuous measurements of atmospheric CH4 levels in this region are lacking and more measurements in this area are needed. To investigate how the identified seep areas have affected atmospheric CH4 levels, we conducted CH4 monitoring on board the icebreaker Canadian Coast Guard Ship (CCGS) Amundsen. We collected measurements of CH4 dissolved in the water column at various locations between the northern Labrador Sea and Baffin Bay, adding to a small but growing body of data on water column CH4 concentrations in the Arctic and sub-Arctic seas. We also tracked atmospheric CH4 levels continuously along a north–south transect to establish a baseline study for above-ocean CH4 mixing ratios in the area that can be used as a benchmark for further monitoring of CH4 levels in Arctic regions.
2.1 Study area
Data for this study were collected during an expedition of the Canadian research icebreaker CCGS Amundsen starting on 15 July 2021, in St. John's, Newfoundland, Canada, and ending on 12 August 2021, in Iqaluit, Nunavut, Canada. The expedition transited the western Labrador Sea, the Davis Strait, and Baffin Bay along the northeastern Canadian continental shelf (Fig. 1). Along the shelf margins, seafloor gas seepage was previously localized at Scott Inlet, Baffin Bay (71∘22′41.2′′ N, 70∘04′28.3′′ W) (Loncarevic and Falconer, 1977; Levy and MacIean, 1981; Cramm et al., 2021), while further locations were suggested in the Saglek Basin in northern Labrador (60∘21′03.6′′ N, 61∘51′50.4′′ W) (Jauer and Budkewitsch, 2010; Punshon et al., 2019) and off the coast of Cape Dyer, Baffin Island (67∘26′56.4′′ N, 61∘55′08.4′′ W) (Punshon et al., 2019), also indicated in Fig. 1. The studied region lies within the seasonal sea ice zone, and partial sea ice cover was observed in the northernmost regions between 30 July and 3 August 2021. Hydrography in the studied area is dominated by the Baffin Island Current (BIC), the integrated Arctic outflow through the Canadian Arctic Archipelago. The BIC flows southward along the Baffin Island coast and slope and becomes a component of the Labrador Current (Fig. 1), being modified by the Hudson Strait overflow, and continues flowing southward, mainly confined to the shelf and upper slope (Azetsu-Scott et al., 2012). The West Greenland Current bifurcates at the Davis Strait, with part of the flow entering Baffin Bay on the eastern side of the Davis Strait and contributing to the cyclonic circulation in the bay and partly continuing westward as the Labrador Sea cyclonic circulation (Melling et al., 2001; Tang et al., 2004; Wu et al., 2013). The eastern coast of Baffin Island is characterized by the Baffin Mountains, with elevations up to 2147 m. With its location north of the treeline, the land is dominantly barren and sparsely vegetated or covered with smaller waterbodies and wetland areas.
2.2 Atmospheric measurements
Instruments were mounted on the meteorological tower at the bow of the ship: a 2D heated anemometer (model 86004, RM Young, USA) at a height of 8.1 m above deck and about 14.1 m above sea level (considering a constant height of the deck), a temperature probe (model 107B, Campbell Scientific, USA) 7.6 m above the deck, a 1 Hz GPS puck (GPS 18x LVC, Garmin, USA), and an air inlet for gas sampling at 7.3 m (Appendix A, Fig. A1). Roughly 30 m long Synflex tubing connected the air inlet with the greenhouse gas analyser (Ultraportable Greenhouse Gas Analyzer, Los Gatos Research, USA), making high-resolution monitoring of atmospheric carbon dioxide (CO2), methane (CH4), and water vapour (H2O) mixing ratios possible. In this study, all CH4 and CO2 measurements reflect dry mixing ratios. The analyser is equipped with a built-in pump drawing the air from the inlet on the tower to the analyser stored securely inside a laboratory on deck. By repeatedly breathing on the air inlet, we determined an average delay time of 90 s for the air samples to reach the analyser and accounted for this delay time during data processing.
The greenhouse gas analyser was calibrated in the lab on 10 July 2021 before deployment on the ship with certified calibration gas (calibrated by the AmeriFlux QA/QC team at the Lawrence Berkeley National Laboratory, Berkeley, CA, USA, at 385.18 ± 0.01 ppmv CO2, 1810.6 ± 0.1 ppbv CH4, and 4.08 ± 1.58 ppmv H2O), and it was benchmarked daily during the cruise (only starting on 23 July 2021, due to logistical issues) to assure proper functioning of the analyser, determine precision, and detect potential drift. The benchmarking gas was a standard gas mixture (from Praxair) balanced with air and certified for 450 ppmv CO2 (mixing ratios for CH4 were not specified by the supplier). Once the analyser was connected to the benchmarking gas, it was left to stabilize for a few minutes, and we used a 100 s window after stabilization for analysis of the daily benchmarking data. Mixing ratios measured by the gas analyser during these 100 s windows amounted to 451 ± 1 ppmv CO2 and 5056 ± 9 ppbv CH4 (mean ± standard deviation) throughout the cruise, which was well within the analyser's measurement range (200–20 000 ppmv for CO2 and 100–100 000 ppbv for CH4). Based on the benchmarking data, we determined a standard error of 2 ppbv for CH4 and 0.13 ppmv for CO2, which can be considered the uncertainty in our measurements. Even though day-to-day differences between averaged benchmarks reached up to 34 ppbv for CH4 and 2 ppmv for CO2 under field conditions, we did not correct the measured mixing ratios, since a post-expedition in-lab benchmark on 30 August 2021, revealed no significant drift from the initial calibration (1814.8 ppbv CH4 and 384.81 ppmv CO2) with the certified gas used prior to the expedition.
Once the setup was mounted and leakproof, we recorded atmospheric measurements between 20 July 2021 and 10 August 2021 on a data logger (CR1000, Campbell Scientific, USA) at a frequency of 1 Hz.
We processed wind measurement time series to exclude occasional erroneous values of direction and speed, and we linearly interpolated across gaps before resampling onto the data logger's timestamp. Wind parameters were corrected for lateral ship motion when the ship was not in transit or not headed forward, using speed, track, and heading from the ship's own navigation system (Amundsen Science Data Collection, 2021a).
To exclude data potentially contaminated by the ship's exhaust, we removed all measurements of CH4 and CO2 whenever the wind direction was 80–280∘ relative to the bow of the ship and when CO2 levels were larger than 420 ppmv. As a result, 26 % of all 1 Hz CH4 and CO2 measurements were excluded on account of potential contamination (see also Fig. A2). To determine CH4 baseline levels for the studied region, we applied a Savitzky–Golay filter (Savitzky and Golay, 1964) of second polynomial order with a 24 h window size to the mixing ratios.
Maxima in atmospheric CH4 measurements were further investigated using the online Real-time Environmental Applications and Display System (READY) for the HYSPLIT Atmospheric Transport and Dispersion Modeling System (Stein et al., 2015; Rolph et al., 2017). Ensemble back trajectories of air masses from the time and location where CH4 maxima were measured (referred to as source) to the point of possible origin within the previous 12 h were modelled. Two gridded meteorological data archives were used: the Global Data Assimilation System (GDAS) model (1∘ horizontal resolution) and the Global Forecast System (GFS) model (0.25∘ horizontal resolution). For the ensemble, the data points of the meteorological input model were offset by a fixed grid factor, resulting in an output of 27 possible trajectories (Rolph et al., 2017).
Atmospheric pressure and dew point temperature measurements were recorded every 2 min with a digital barometer (PTB210, Vaisala, Finland) and a humidity–temperature sensor (MP101A-T7, Rotronic, USA) located on the bridge of the ship (Amundsen Science Data Collection, 2021b). For statistical analyses, we examined CH4 measurements for linear Spearman rank correlations with available data and also fitted a simple generalized additive model (GAM; used previously in air quality studies, e.g. Pearce et al., 2011; Hou and Xu, 2022) to hourly averaged CH4 data in order to identify trends of inter-dependencies. The GAM was well suited due to its ability to describe the non-linear effects of non-normally distributed data using non-parametric smoothing functions. The respective analysis was performed in R (package: “mgcv”, function: “gam”; Wood, 2011).
2.3 Water column measurements
Seawater was collected at 15 stations for measurements of dissolved CH4: Makkovik on the Labrador Shelf, northeastern Labrador (“Kelp”), two locations at Saglek Bank (Fig. A2), Hatton Sill, the Davis Strait, Southwind Fjord, Disko Fan, six locations at Scott Inlet, and Clark Fiord (Fig. 1). While exclusively surface samples were taken at Clark Fiord and at four co-located stations close to the Scott Inlet seep (SI1, SE-1K, NE-1K, NE-5K; Fig. A2), we gathered water column profiles at the remaining 10 locations. Collection and measurement protocols followed those of Punshon et al. (2014, 2019). Briefly, seawater samples were collected from 12 L Niskin bottles mounted on a conductivity–temperature–depth (CTD) rosette system to 60 mL glass serum bottles (after triple rinsing with the sample water) and overfilled by 1.5 times the bottle volume, immediately fixed with mercuric chloride, capped with metal crimp seals and rubber septa, and stored at 4 ∘C. Replicates were not taken. Samples were analysed for CH4 at the Bedford Institute of Oceanography (Department of Fisheries and Oceans, Canada) using a single-phase batch headspace equilibration method with gas chromatography (similar to that in Neill et al., 1997). Marine CH4 concentrations are given in nmol L−1, abbreviated as nM hereinafter. Multiple measurements of standard gases show an analytical uncertainty of ± 0.5 %–0.8 % or better for dissolved CH4, which is similar to previous studies (Punshon et al., 2014, 2019). Data from previous studies conducted in 2011, 2012, and 2016 (Punshon et al., 2014, 2019) were included here to examine regional patterns and temporal variations in dissolved CH4 concentrations in Baffin Bay. Potential temperature (θ) and potential density of seawater at atmospheric pressure (σθ) were calculated based on water temperature, pressure, and salinity measured on the ship (SBE 911 CTD, Sea-Bird Scientific, Canada) (Amundsen Science Data Collection, 2021c) using the package “seawater” in Python (calculations based on Bryden, 1973; Fofonoff and Millard, 1983; Millero and Poisson, 1981). Water masses were defined following previous studies (Table 1 in Sherwood et al., 2021; Stramma et al., 2004; Fratantoni and Pickart, 2007; Azetsu-Scott et al., 2012). These water masses comprise Halocline Water (σθ≤27.30 kg m−3, θ≤0 ∘C), Baffin Bay Water (27.50 < σθ≤27.80 kg m−3, θ≤2 ∘C), Labrador Shelf Water (σθ≤27.40 kg m−3, θ≤2 ∘C), Irminger Water ( kg m−3, θ>2 ∘C), Labrador Sea Water ( kg m−3, θ>2 ∘C), and to a lesser extent Northeast Atlantic Deep Water ( kg m−3) and Denmark Strait Overflow Water (σθ>27.88 kg m−3). It should be noted that surface waters (∼2 m) did not necessarily match operational definitions of water masses as outlined in Sherwood et al. (2021) and were interpreted separately. We also used seawater density and oxygen data (not shown) from the CTD casts (Amundsen Science Data Collection, 2021c) and determined the mixed-layer depth where the density change was higher than 0.125 kg m−3 compared to the density at 5 m depth. Continuous water temperature and salinity measurements in surface waters from the underway thermosalinograph (Amundsen Science Data Collection, 2021d) were used to determine correlations with atmospheric measurements. Daily sea ice concentration data with 10 km resolution (AMSR2, identifier OSI-408) by the Norwegian and Danish meteorological institutes were extracted from the Ocean and Sea Ice Satellite Application Facility EUMETSAT catalogue (https://thredds.met.no/thredds/osisaf/osisaf_seaiceconc.html, last access: 13 November 2022).
2.4 Sea–air methane flux
The instantaneous sea–air CH4 flux (F) was determined with the bulk flux equation (Wanninkhof, 2014),
combining measured dissolved CH4 concentrations (Cw) and air-equilibrated seawater CH4 concentrations (Ca) (Eq. 7, Wiesenburg and Guinasso, 1979) calculated with our atmospheric CH4 measurements averaged between 5 min before and 5 min after the time of sampling, as well as water temperature and salinity measurements from the CTD (Amundsen Science Data Collection, 2021c). The gas transfer velocity (k) was determined after Ho et al. (2006) with
making use of the Schmidt number (Sc) with a correction for salinity (average 4.9 % diffusivity decrease for dihydrogen and helium in a seawater-like solution) based on Jähne et al. (1987), following the example of Manning et al. (2022), and the respective code (Manning and Nicholson, 2022) was used as a reference (see Appendix A2). Wind speeds were corrected to 10 m height via the wind profile power law (Hsu et al., 1994) and averaged between 5 min before and 5 min after the time of sampling (). Positive sea–air fluxes indicated CH4 flux from the ocean to the atmosphere. No flux was calculated for the Makkovik station, since these samples were taken before atmospheric measurements had started.
Seawater samples showed wide ranges of dissolved CH4 concentrations at the different sample locations and water depths from undersaturated (25 %, 0.9 nM) to highly oversaturated (11 324 %, 445.3 nM, Fig. 2). The by far highest water column concentrations were measured at the known cold seep at Scott Inlet (station Stn0, Fig. A3) close to the bottom of the ocean (about 250 m depth), decreasing to 133 % (4.6 nM) at the surface. The high concentrations close to the seafloor were not surprising given documented ebullition in the area (Cramm et al., 2021). The second depth profile taken in proximity to the seep, about 8 km northeast of its location (station SI2, Fig. A3), showed a maximum of 25.4 nM (639 %, Fig. 2) at around 200 m depth and just slightly oversaturated surface water (113 %, 3.9 nM). Measurements from the year 2012 revealed CH4 maxima of 65.8 nM at 200 m depth decreasing to 3.7 nM at the surface roughly 40 km northwest of the seep location (Punshon et al., 2019). Large temporal fluctuations of dissolved CH4 levels between 9 and 609 nM within 24 h were found close to the seafloor (∼ 250 m) at the seep in 2018 (Cramm et al., 2021). Similarly, other studies have manifested the temporal variability in seafloor seep degassing (Boles et al., 2001; Leifer and Boles, 2005; Shakhova et al., 2014; Cramm et al., 2021; Dølven et al., 2022). Concentrations at the water surface of the seep were in the single digits previously (Cramm et al., 2021), which was confirmed in this study (from 3.9 nM at station SI2 to 5.3 nM at station SE-1K, Fig. 3). Considering the findings from Punshon et al. (2019), Cramm et al. (2021), and the present study, depths of 200–250 m around the Scott Inlet seep location seemed most prominent for CH4 maxima. Furthermore, water columns supersaturated with CH4 in proximity to this location over several years show the persistence of the seep activity. Surface concentrations close to the atmospheric equilibrium in 2012, 2018, and 2021 in this area may indicate significant oxidation of CH4 within the upper water column. The Scott Inlet stations should not be considered representative of Baffin Bay as a whole but rather specific to the seep location.
Seawater oversaturated with CH4 (338 %, 12.9 nM) was also found at 250 m depth at Makkovik (Fig. 2), the southernmost station in this study. The Makkovik station was characterized by a strong gradient of water masses, with warm (6.3 ∘C) surface water, cold (∼ 0 ∘C) sub-surface water featuring its CH4 maximum, and again warmer (3.8 ∘C) water at the seafloor.
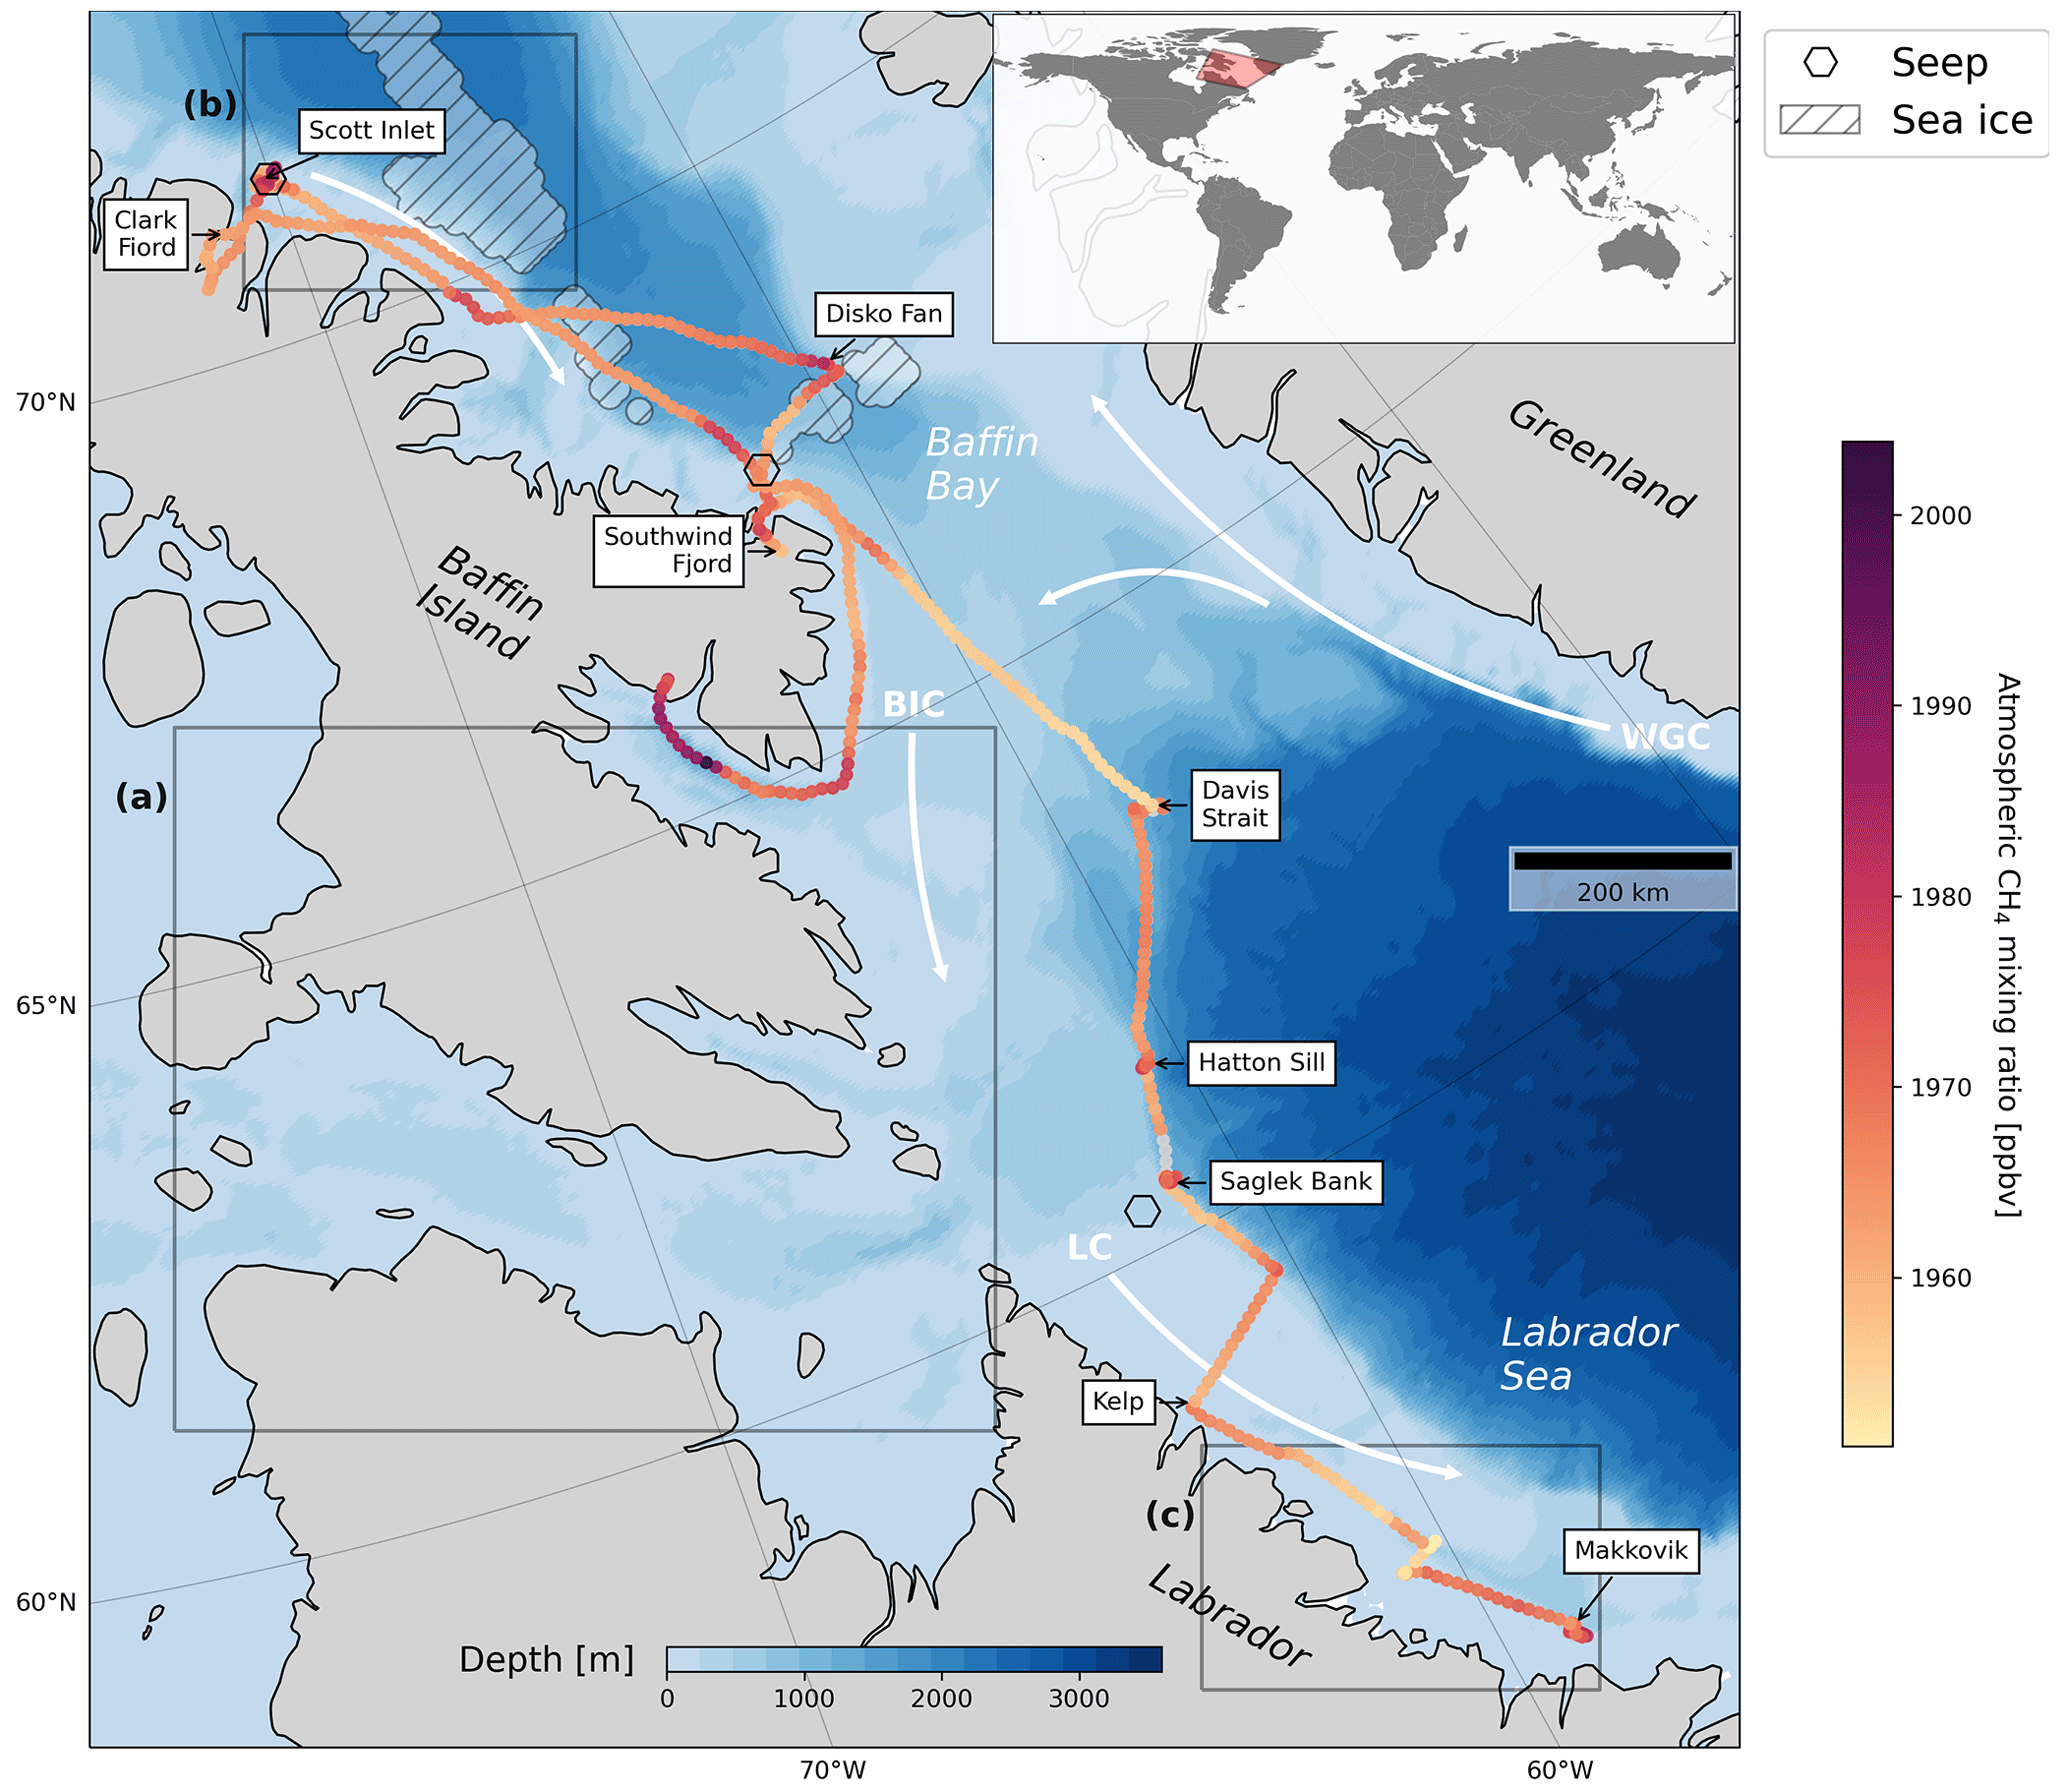
Figure 1The ship's trajectory and atmospheric CH4 levels as averages over consecutive 10 km sections. The black arrows point to the locations where water measurements were taken. The three black hexagons indicate confirmed or suspected locations of gas seepage (Punshon et al., 2014, 2019; Cramm et al., 2021). White arrows represent the West Greenland Current (WGC), Baffin Island Current (BIC), and Labrador Current (LC). Water depth was retrieved from the NOAA server (Amante and Eakins, 2009; NOAA National Geophysical Data Center, 2009). Areas labelled (a), (b), and (c) indicate the extents for each panel in Fig. A4. Shaded areas represent sea ice cover above 10 % (© EUMETSAT 2021).
Dissolved CH4 levels of a similar range were measured at Southwind Fjord with a maximum of 227 % oversaturation (8.8 nM) at about 30 m depth, 148 % (5.2 nM) at the surface, and 114 % (4.5 nM) at the bottom (100 m). Occurrences of highly supersaturated waters in Arctic and sub-Arctic fjords have been documented previously: up to 33.5 nM and 974 % supersaturation in Isfjorden, Svalbard, Norway (Damm et al., 2021), up to 72.3 nM and ∼ 2000 % supersaturation in Storfjorden, Svalbard, Norway (Mau et al., 2013), and up to 459.2 nM at the head of the Canadian sub-Arctic Saguenay Fjord (Li et al., 2021). Most likely, the recent disturbance from iceberg groundings and subsequent landslides at Southwind Fjord (Normandeau et al., 2021) led to CH4 release into the water column from a fresh supply of organic matter and lowered oxygen levels (Bonaglia et al., 2022). Other possible sources of enhanced dissolved CH4 concentrations at this location could be terrestrial runoff (Castro-Morales et al., 2022), although Manning et al. (2022) found that rivers did not discharge significant amounts of CH4 to the North American Arctic Ocean in the summers of 2017–2019. Advection of CH4-rich water from other sources within Baffin Bay could play an important role given the evidence of oil slicks off Cape Dyer for example (Budkewitsch et al., 2013). Otherwise, gas hydrates or CH4-bearing pore water in the seafloor sediment disturbed by the turbulence of local landslides (Paull et al., 2002) could have resulted in CH4 release into the water column. Overall, we recommend follow-up sampling to assess the persistence of the CH4 oversaturation and its source at Southwind Fjord.
CH4 saturations at the remaining stations ranged between 25 %–178 % (0.9–6.9 nM) at varying depths. Compared to measurements at nearby locations in 2012 and 2016 (Punshon et al., 2014, 2019), dissolved CH4 concentrations in 2021 at the stations Hatton Sill, HiBio-C, and Disko Fan were very similar, ranging between 0.9–5.6 nM (Fig. 2). While concentrations at HiBio-A in all years showed similar ranges, a CH4 peak of 6.8 nM (181 % saturation) in relatively shallow water at 50 m depth was observed in 2021, suggesting advection of CH4 within subsurface water masses from elsewhere. Similar, relatively shallow CH4-rich water masses brought along by the Labrador Current may have provoked the CH4 maxima at Kelp and Makkovik. Methane concentrations in the general Davis Strait area measured 1 decade before (Punshon et al., 2014) were in good agreement with our findings for the respective station (1.8–5.4 nM).
In 2021, surface water concentrations were above saturation at all stations including further locations around the Scott Inlet seep and at Clark Fiord where only surface samples were taken (3.6–5.3 nM, 115 %–153 %, Fig. 3). Even though some sea ice was observed during the cruise, none of the water sample locations were in proximity to any significant sea ice cover (>10 %), so local accumulation of CH4-rich water below a surface ice layer as found previously (Damm et al., 2015) did not play a role here. A significant positive correlation of mixed-layer mean dissolved CH4 and oxygen levels at those stations where depth profiles were taken was found in this study (Spearman R2=0.63, p<0.01), which may suggest aerobic CH4 production (Karl et al., 2008). Or else, sea ice melt may have discharged other precursors used by microbes to form CH4 despite increasing oxygen levels towards the surface (Damm et al., 2015).
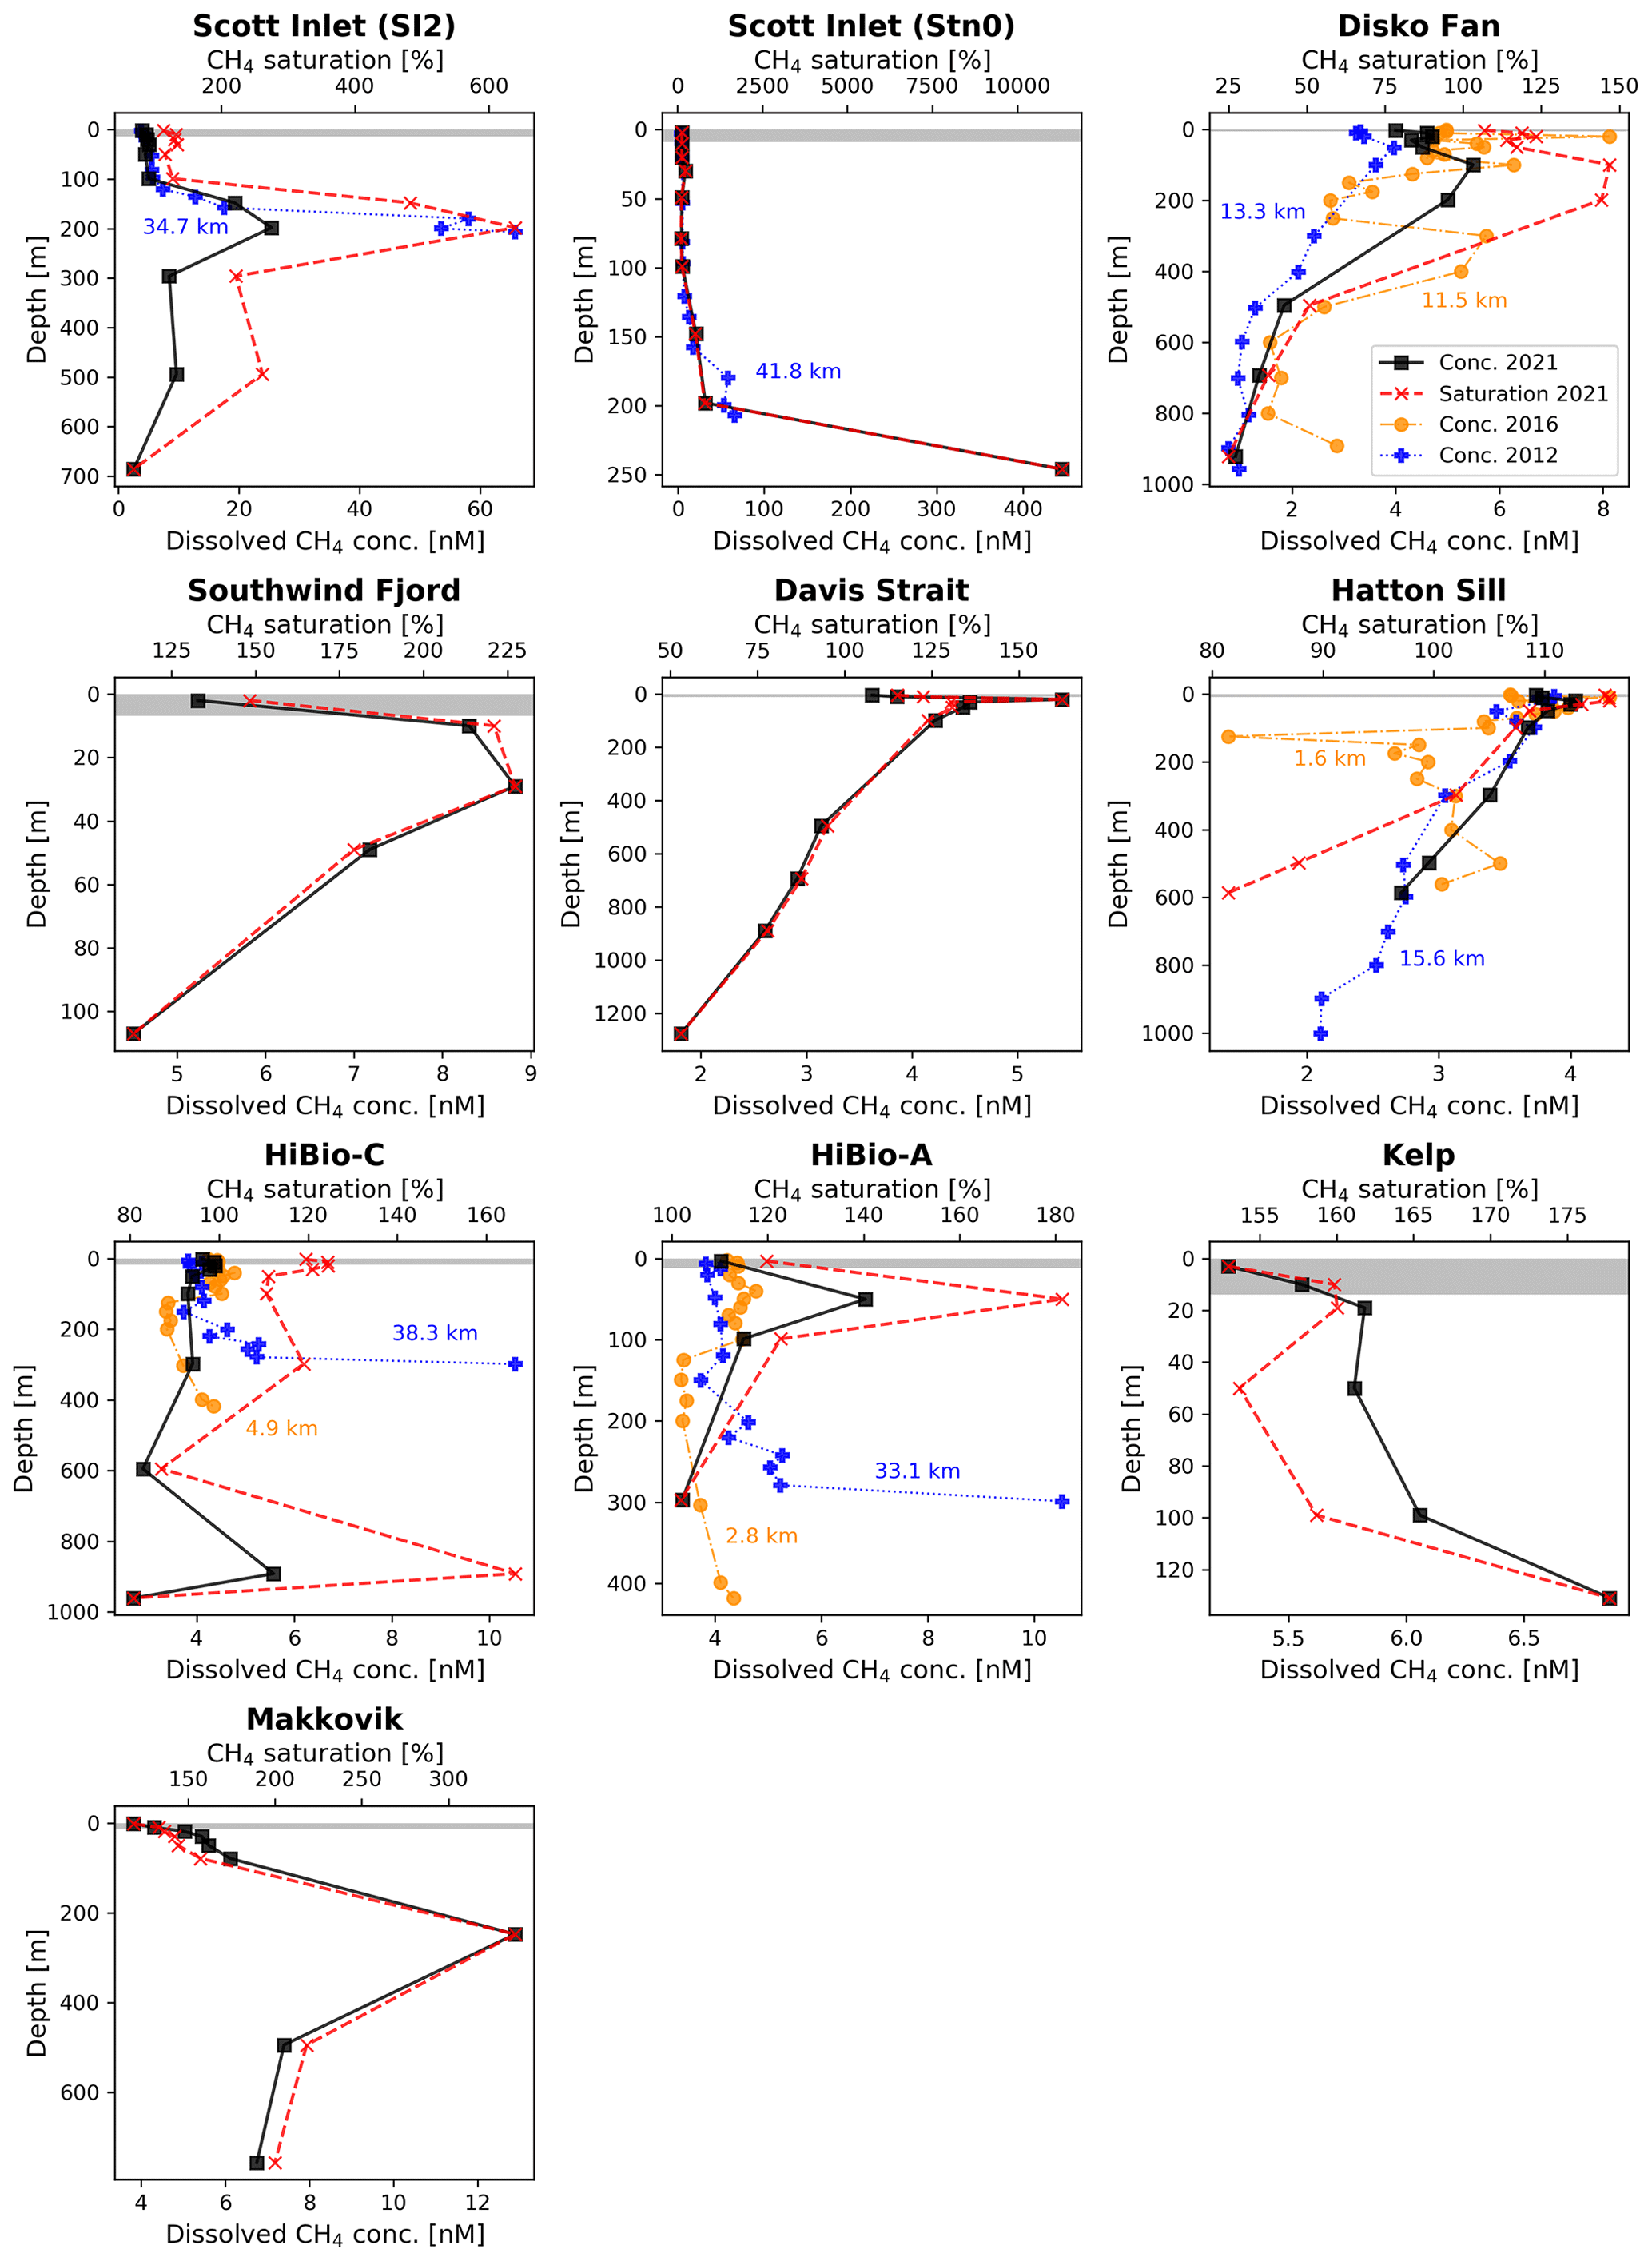
Figure 2Depth profiles of dissolved CH4 concentrations (black) and saturations (red, dashed line) throughout the water column. Station names are given and can be located in Figs. 1 and A3. Profiles from Punshon et al. (2014, 2019) conducted in 2012 and 2016 were included for each year's closest stations within 50 km of the ones from 2021 and are shown in blue (2012) and orange (2016). Distances between respective nearby stations are given in kilometres. The mixed-layer depths are indicated by grey areas.
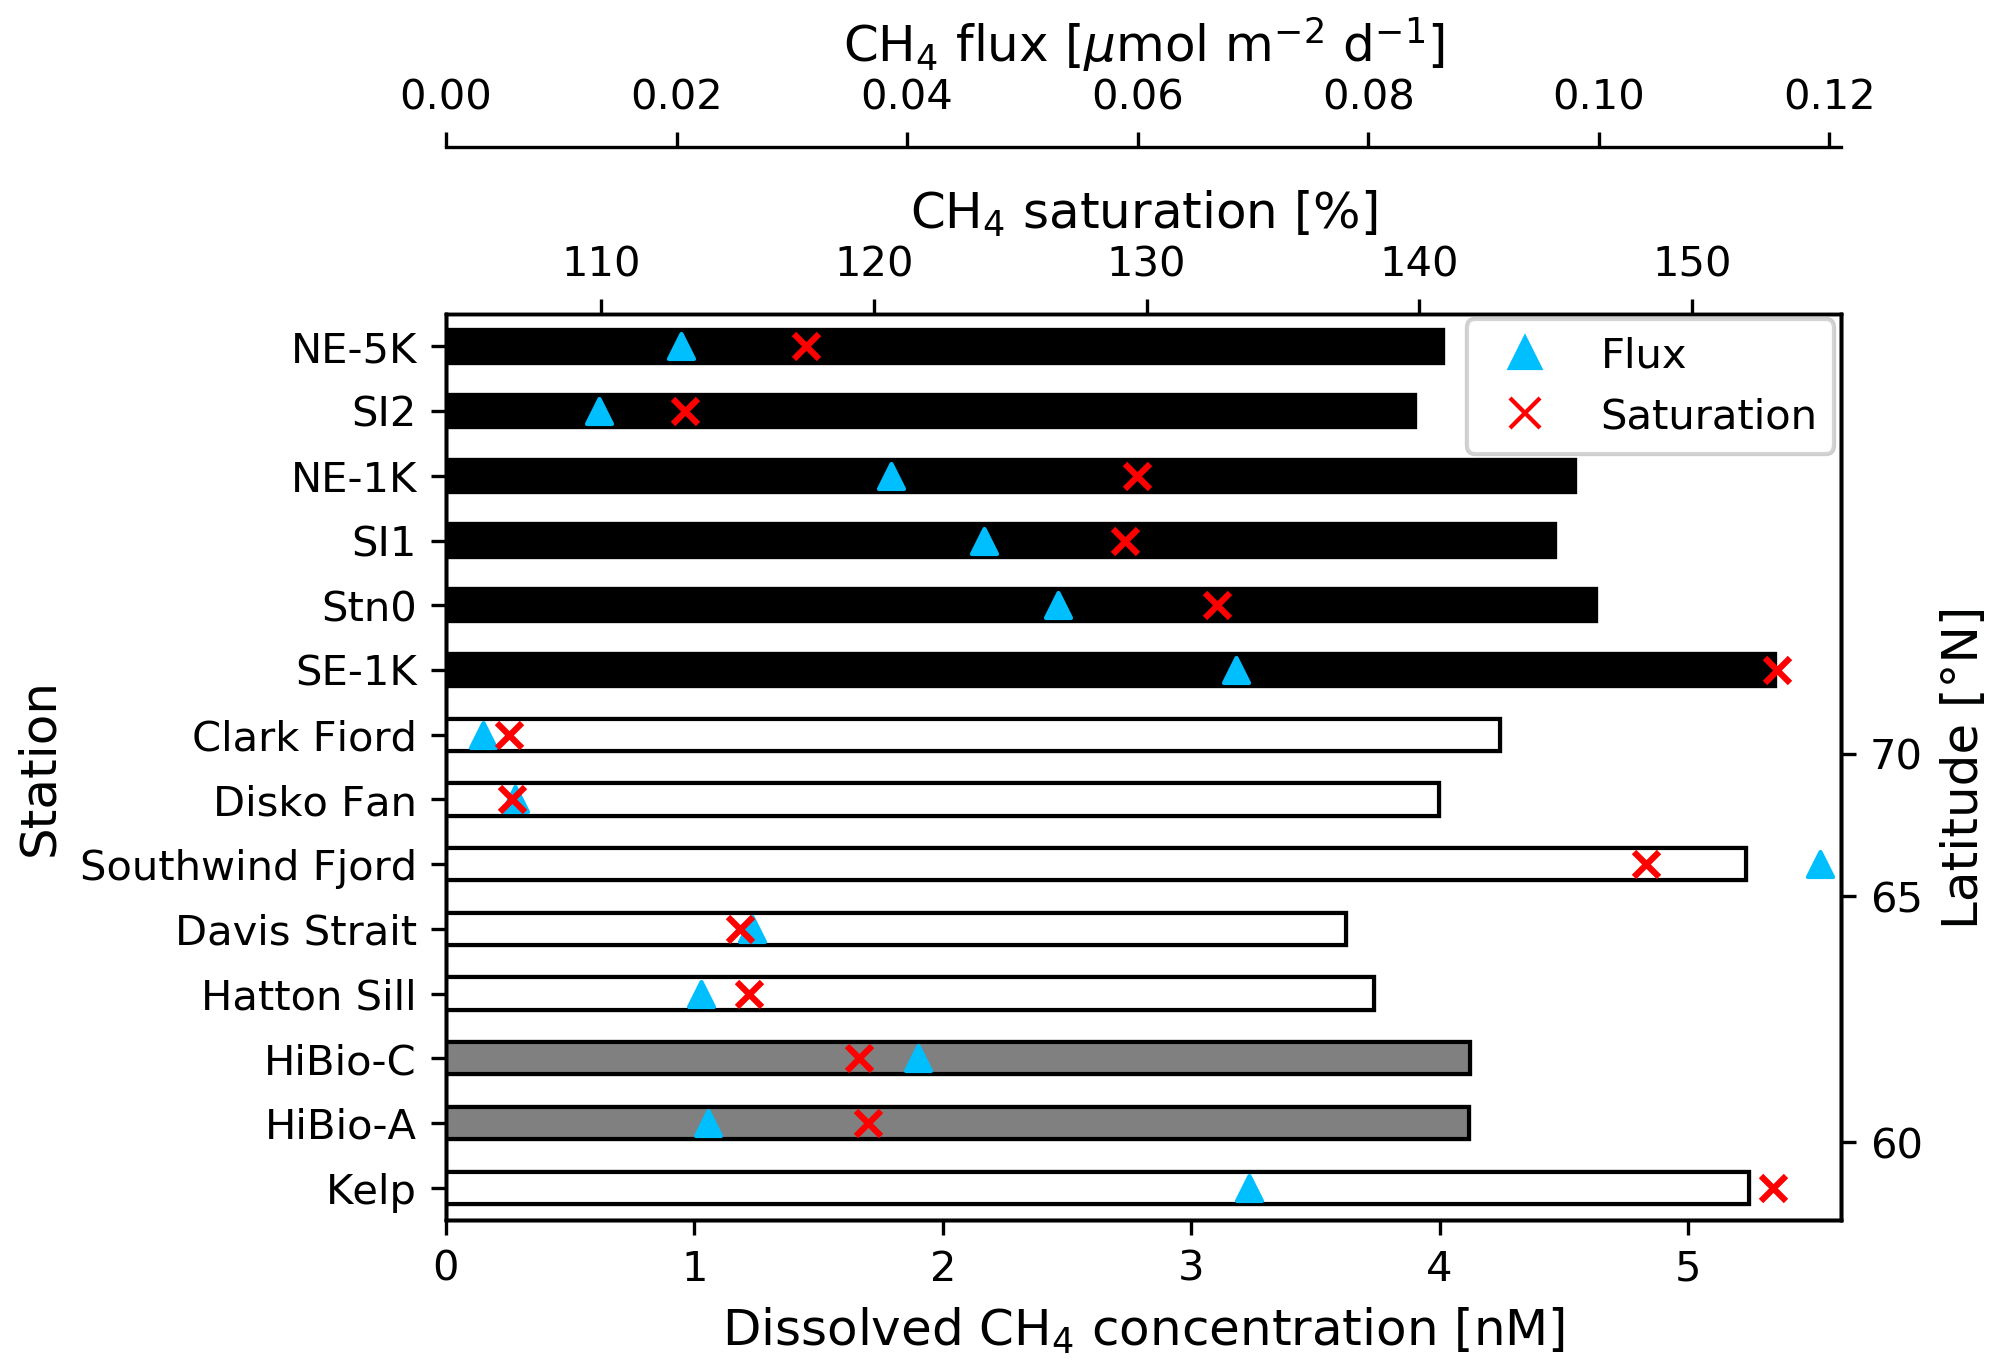
Figure 3Dissolved CH4 concentrations at the water surface (bars) for all stations where CTD rosette samples and atmospheric measurements were collected. Grey bars represent two sample locations in the Saglek Bank area, and black bars reflect samples in the Scott Inlet area, both close to seafloor seep locations (station names correspond to those in Fig. A2). CH4 saturations (red crosses) and estimated sea–air fluxes (blue triangles) are shown as well. Latitudes are not to scale.
The distribution of CH4 with respect to water masses accounting for data from Punshon et al. (2014, 2019) and this study is visualized in a temperature–salinity diagram (Fig. 4). Samples span the known upper and intermediate depth of water masses of the region, mainly Halocline Water (HW), followed by Irminger Water (IW), Labrador Shelf Water (LShW), and Baffin Bay Water (BBW). The highest concentrations were found in Arctic HW (mean: 10.3 nM, range: 2.4–445.3 nM), which was largely forced by the presence of the Scott Inlet seep (Fig. 4). This seep, and possibly others, could enrich the HW with CH4 as HW travels southward in the form of the Baffin Island Current. The overall shallowest water mass, the LShW, held the second-highest CH4 concentrations (mean: 4.3 nM, range: 1.1–21.1 nM), partially due to direct seep impacts and possibly due to the influence of the Baffin Island Current transporting CH4-rich water southward or of the West Greenland Current carrying elevated CH4 levels westward, which may have provoked elevated CH4 concentrations in LShW for example at Southwind Fjord, HiBio-A, and possibly even at the Makkovik station. Warmer IW masses had the third-highest concentrations (mean: 3.2 nM, range: 1.0–10.5 nM). Increased oxygen availability was found in the Irminger Sea in 2015 (Fröb et al., 2016), but dissolved oxygen levels during our rosette casts showed lower oxygen concentrations on average in the IW than in the shallower HW and LShW. The colder and deeper BBW mass showed lower CH4 concentrations (mean: 1.7 nM, range: 0.2–17.0 nM) than the mostly oversaturated HW, LShW, and IW, whereas measurements in proximity to the Scott Inlet seep in 2021 and roughly 45 km north of the suggested seep at Cape Dyer in 2011 contributed to the high end (> 9 nM) of the concentration range for BBW. Most likely, both CH4 production and consumption co-occurred in the BBW (Fenwick et al., 2017).
Atmospheric CH4 mixing ratios during the expedition ranged between 1944 ppbv off the coast of northern Labrador and 2012 ppbv in the Cumberland Sound in Nunavut (Fig. 1), with an overall mean (± standard deviation) of 1966 ± 8 ppbv. Wind speeds did not exceed 15 m s−1. After applying the Savitzky–Golay filter to the measured data, baseline mixing ratios ranged between 1954 and 1981 ppbv (Fig. 5). These concentrations were higher than global monthly mean CH4 mixing ratios in July (1886 ppbv) and August (1892 ppbv) of the sampling year 2021 (Dlugokencky, 2022), but they were within the range of values from surface flask-air measurements from the year 2020 from northern stations of the NOAA Global Greenhouse Gas Reference Network, e.g. Summit, Greenland (July: 1939 ppbv; August: 1947 ppbv), and Alert, Nunavut (July: 1933 ppbv; August: 1946 ppbv) (Dlugokencky et al., 2021). The mixing ratios measured in this study are higher than those determined from flask samples possibly due to the influence of a generally large number of CH4 seeps in our study area. Our measured CH4 values were consistent with the known latitudinal gradient and recent increase in atmospheric CH4 (Lan et al., 2021). The baseline estimates suggest a local background CH4 fluctuation of roughly 27 ppbv in the studied area. A recent study found a contribution of 42.5 ± 25.2 ppbv to total CH4 mixing ratios measured during a cruise in the eastern Arctic Ocean, suggesting that atmospheric CH4 levels over the ocean can be affected by distant wetland CH4 sources (Berchet et al., 2020).
Persistent enhancements of CH4 mixing ratios above the baseline lasting over more than 4 h were detected repeatedly over the length of the expedition (Fig. 5). We investigated potential atmospheric origins of CH4 maxima at three locations, the Cumberland Sound, Scott Inlet, and the Labrador Trough, using ensemble back trajectories (Fig. A4). At the Cumberland Sound, the maximum of 2012 ppbv coincided with prevailing westerly winds based on our measurements. Therefore, we assumed that those ensemble trajectories indicating air transport from or across the inland on the western side best reflected the observed meteorological conditions (Fig. A4a). Since no water samples were taken in the Cumberland Sound, where the highest atmospheric CH4 levels were observed, we could not rule out an ocean-related atmospheric input of CH4 at this location. Instead, the back-trajectory analysis suggests that the elevated CH4 mixing ratios could have originated from along the trajectories leading onshore, where potential sources such as waterbodies or wetlands could be located (Fisher et al., 2011; Thonat et al., 2017; Berchet et al., 2020). The second-highest CH4 peak of 1994 ppbv was detected roughly 13 km northeast of the Scott Inlet seep with dominating easterly winds (Fig. A4b). Given the distance of roughly 500 km from Greenland, the origin of this CH4 enhancement could be ocean-based, with origins from further seeps along the continental shelf east of Scott Inlet (Gregersen and Bidstrup, 2008; Gautier et al., 2011; Nielsen et al., 2014). Trajectories for the third-highest CH4 levels of 1990 ppbv measured in the Labrador Trough coupled with west–southwest wind directions may suggest onshore sources from northern Labrador (Fig. A4c).
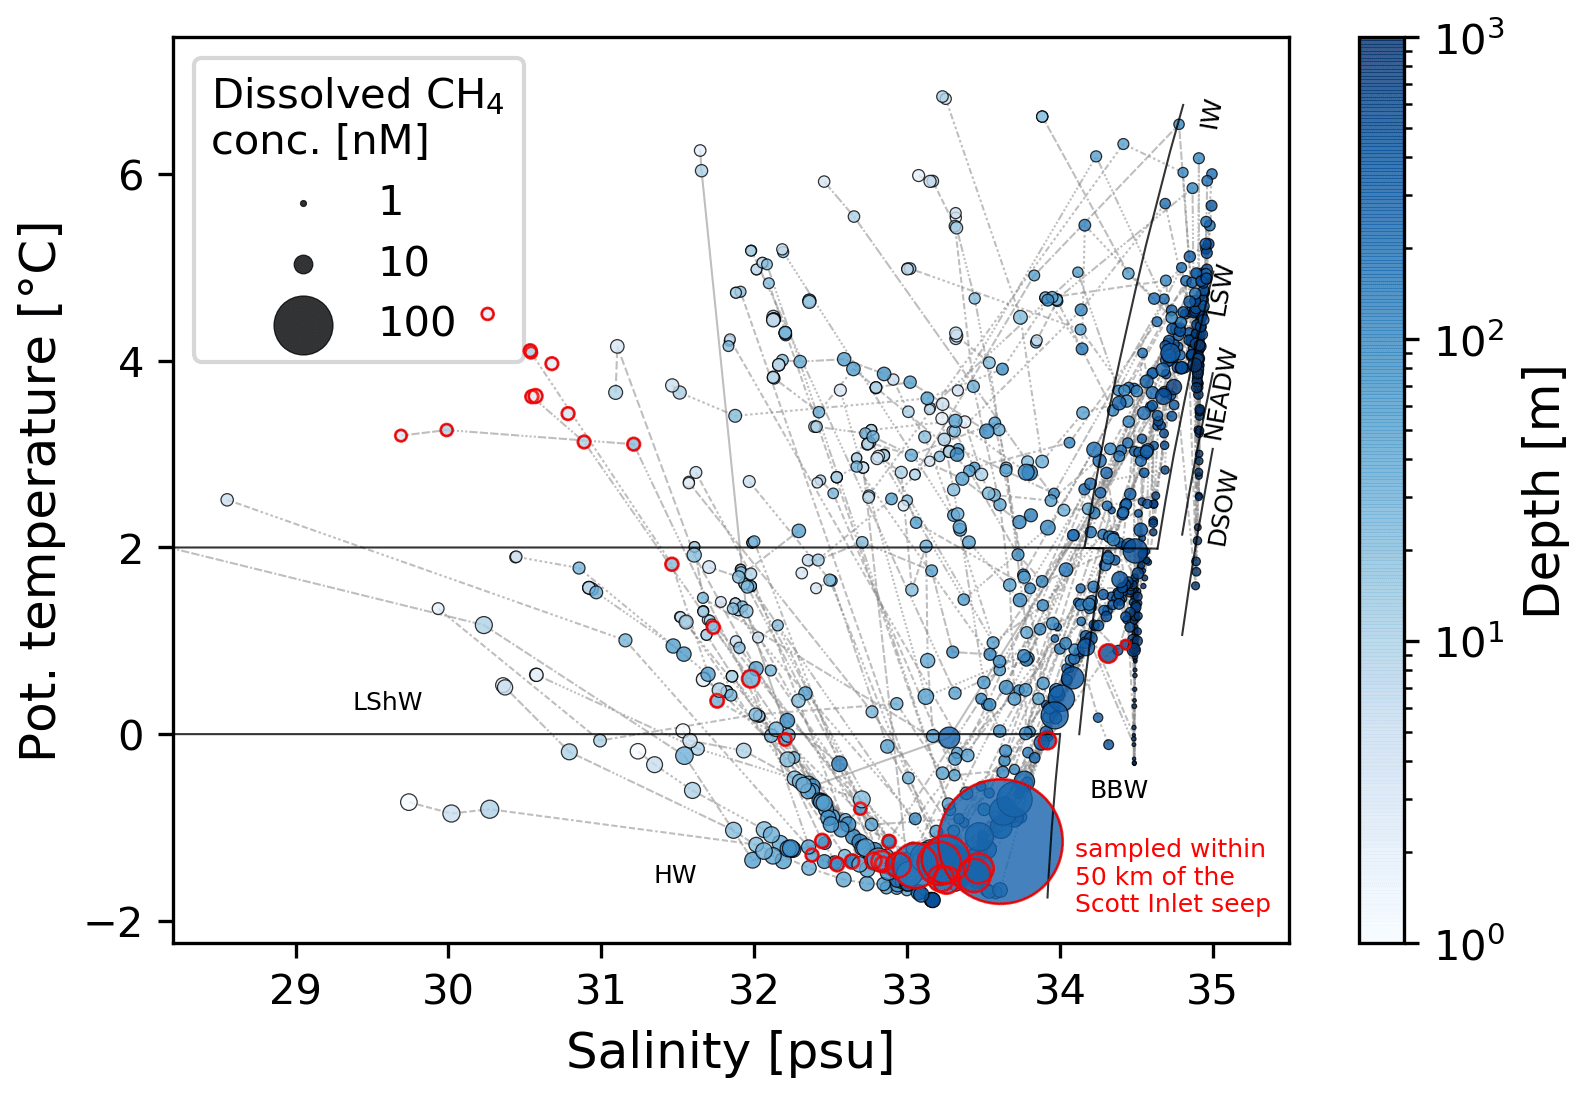
Figure 4Temperature–salinity diagram of all measurements from 2021 and from the studies by Punshon et al. (2014, 2019) for the Baffin Bay and Davis Strait area. Dissolved CH4 concentrations are shown with different marker sizes; colours indicate the water depth. Black lines distinguish between water masses: Halocline Water (HW), Labrador Shelf Water (LShW), Irminger Water (IW), Labrador Sea Water (LSW), Northeast Atlantic Deep Water (NEADW), and Denmark Strait Overflow Water (DSOW). Grey lines connect measurements from the same CTD rosette cast. For better visualization, salinities below 28 psu measured at the surface of the two fjords in 2021 are not shown. Red circles highlight the sample locations within 50 km of the seep in Scott Inlet.
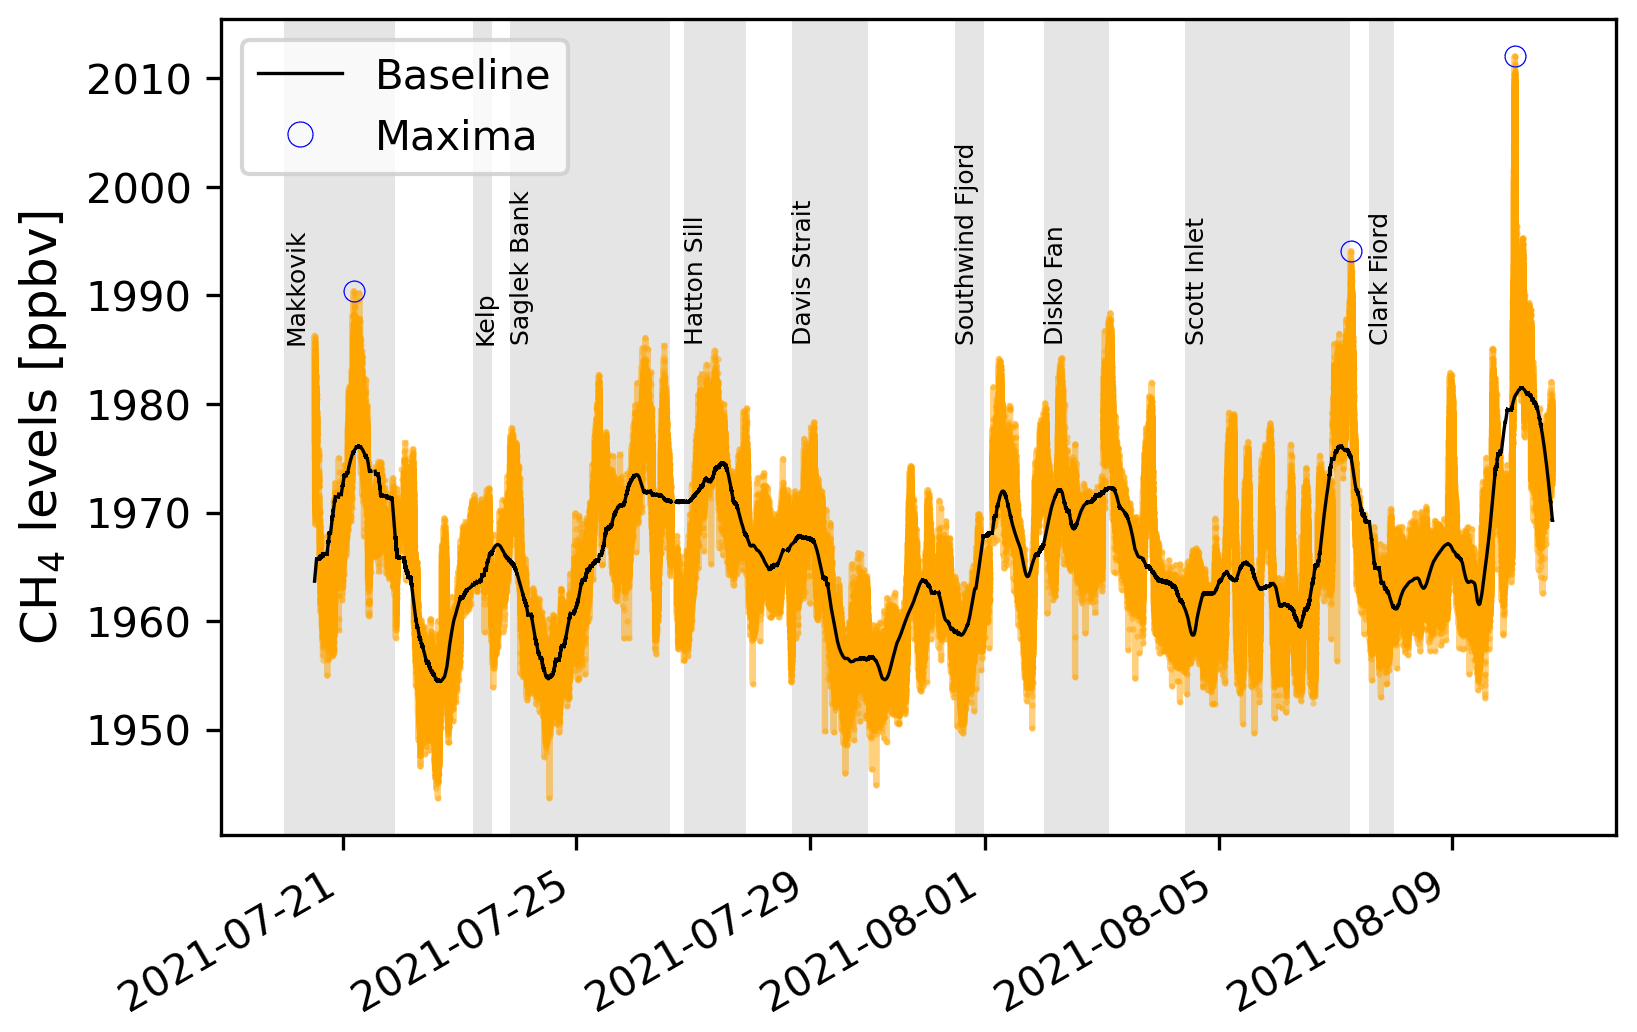
Figure 5Time series of atmospheric CH4 levels (orange points) and the derived baseline (black line) over the entire measurement period. Grey parts show the approximate duration at the stations (Amundsen Science Data Collection, 2021e) where seawater samples were collected. Blue circles reflect the three maxima of atmospheric CH4. The date format on the x axis is year–month–day.
Linear correlations between atmospheric and dissolved CH4 levels based on our dataset were not found. Due to the atmosphere–sea surface barrier and complexities added by wind conditions, ocean currents, bacterial activity within the water column, and other processes, the atmosphere–ocean system essentially describes a decoupled system locally, so increased CH4 concentrations are not necessarily found alongside rising atmospheric CH4 levels (Law et al., 2010; Punshon et al., 2019; Cramm et al., 2021; Zhao et al., 2022). Accordingly, simple linear correlations of CH4 mixing ratios with available auxiliary data (latitude, longitude, speed, wind speed and direction, air temperature, humidity, dew point temperature, atmospheric pressure, water temperature, salinity, hour of day) were not found, suggesting more complex relationships. Instead, results of a generalized additive model proposed spatial (latitude, longitude), temporal (hour of day), and meteorological (atmospheric pressure, dew point temperature) influences on hourly averaged atmospheric CH4 mixing ratios with a good fit (n=171, R2=0.84, 88 % explained deviance) for the parts of the cruise when these data were available. Therefore, we suggest that atmospheric CH4 levels were influenced by a number of processes including, but not limited to, seafloor seeps, upwind distant land-based sources like wetlands and other waterbodies, weather conditions, and ultimately temporal and spatial differences.
Based on our measurements, we determined a near-zero net flux of CH4 from the ocean to the atmosphere, which amounted to a mean of 0.039 ± 0.031 µmol m−2 d−1 along Baffin Island and Labrador in 2021, compared to 1.6 µmol m−2 d−1 in the Davis Strait in 2011 (Punshon et al., 2014). Overall, sea–air fluxes in this study peaked at 0.119 µmol m−2 d−1 in the Southwind Fjord, exceeding the flux rates at the Scott Inlet seep (Fig. 5). As a result, fluxes in the northern Labrador Sea and Baffin Bay were negligible in summer 2021 in comparison to mean estimates of 8.7 µmol m−2 d−1 for the Chukchi Sea (Thornton et al., 2020), of 1.3 µmol m−2 d−1 for the Bering Sea to Baffin Bay (Fenwick et al., 2017), or of 0.4 µmol m−2 d−1 for Baffin Bay and the Davis Strait from measurements between 2015–2019 (Manning et al., 2022).
Continuous measurements of atmospheric CH4 levels in the northern Labrador Sea and Baffin Bay were above the global marine average with small instantaneous input from the ocean. Differences in dissolved CH4 concentrations were mainly affected by ocean currents and seafloor sources, while atmospheric CH4 levels showed interrelations with environmental conditions, location, and time with small temporal fluctuations. Both ocean-based CH4 sources and onshore waterbodies and wetlands likely contributed to atmospheric CH4 levels. Further investigation is necessary to confirm potential CH4 sources, for example through analyses of carbon isotopic ratios and more extensive back-trajectory modelling. We suggested baseline CH4 mixing ratios between 1954 and 1981 ppbv for the studied area, which can be used to validate global-scale measurements and modelling. Depth profiles and their comparison with measurements from previous years in the studied area revealed little interannual variation and ongoing CH4 release to the hydrosphere from the Scott Inlet cold seep. More extensive investigation of the chemical composition of sediments, bacterial activity, and riverine input could help explain elevated CH4 levels within the shallow-water column at Southwind Fjord, where recent landslides triggered by an iceberg were observed. Even though the Arctic Ocean does not currently contribute significantly to the global CH4 budget as found by other studies, monitoring and investigation of CH4 levels in and over the sea remain relevant to assess potential impacts of climate change in regions susceptible to permafrost thaw, destabilization of CH4 hydrates, and reduced sea ice cover.
A1 Additional figures
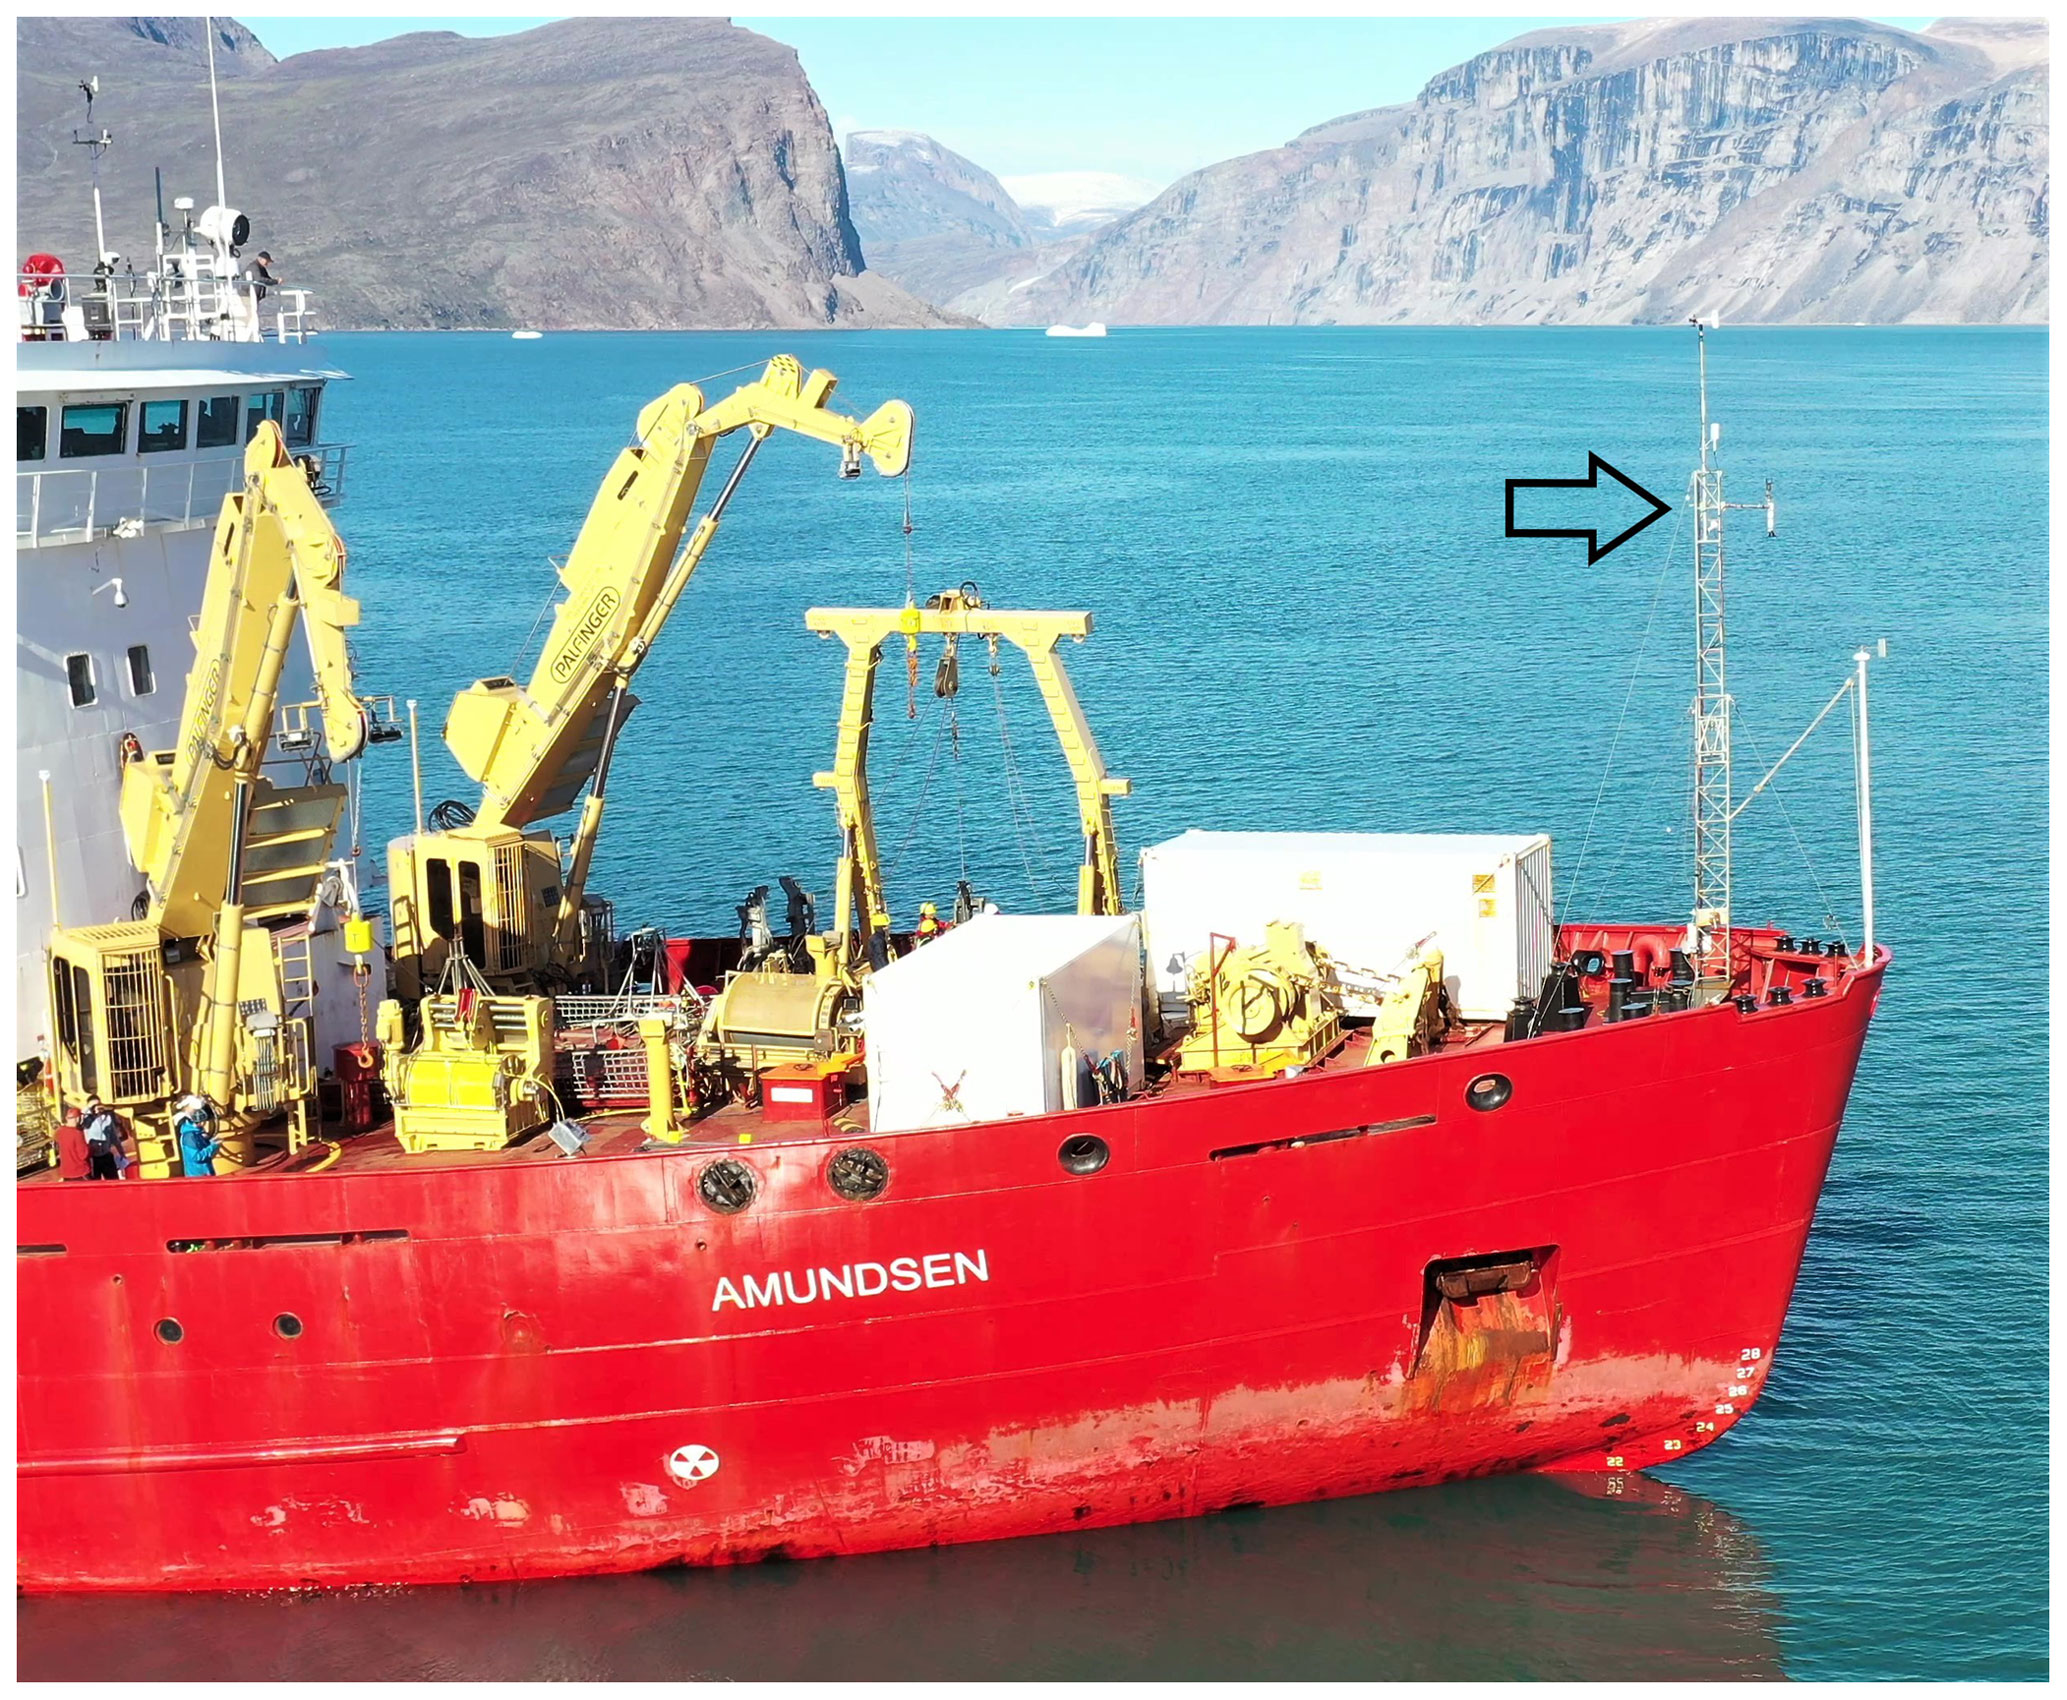
Figure A1The measurement tower at the bow of the ship with anemometer, temperature sensor, and air inlet mounted on the truss approximately where the arrow is pointing. The GPS was fixed at the lower end of the truss. Photo credit to David Cote (DFO – Fisheries and Oceans Canada).
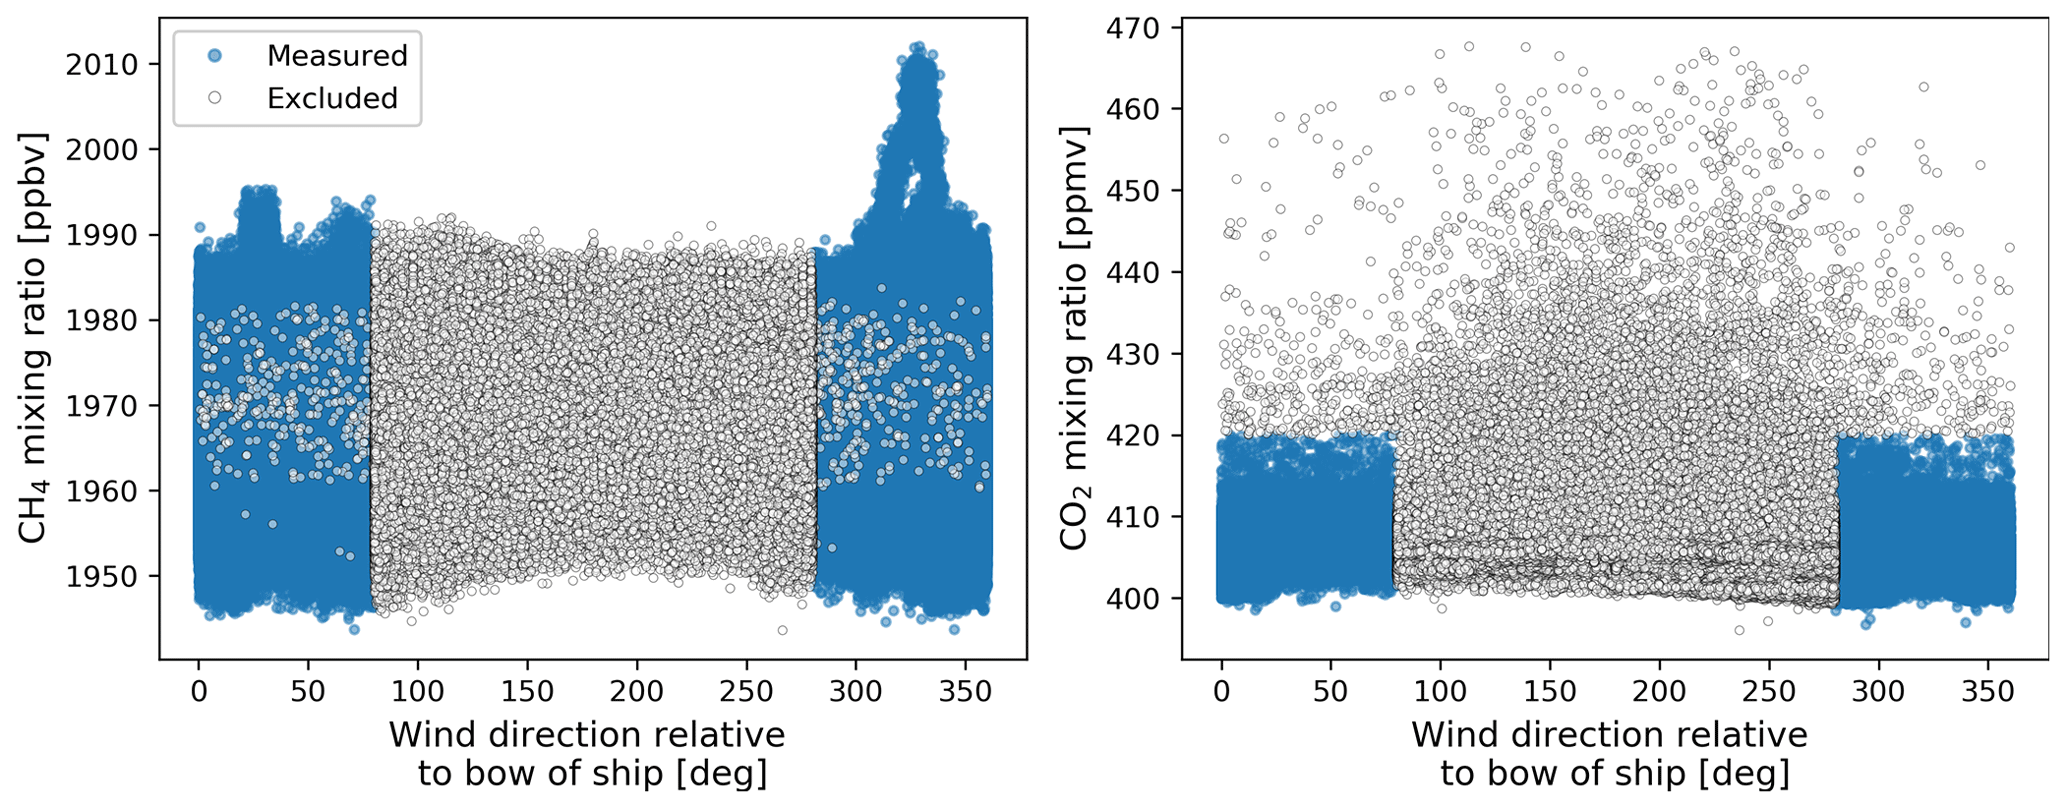
Figure A2Gas mixing ratios throughout the cruise for wind directions relative to the bow of the ship are shown. All data represented by open circles fulfil the criterion for measurements potentially contaminated by the ship's exhaust (wind directions between 80–280∘ or CO2 mixing ratios <420 ppm), amounting to 26 % of all measured 1 Hz data.
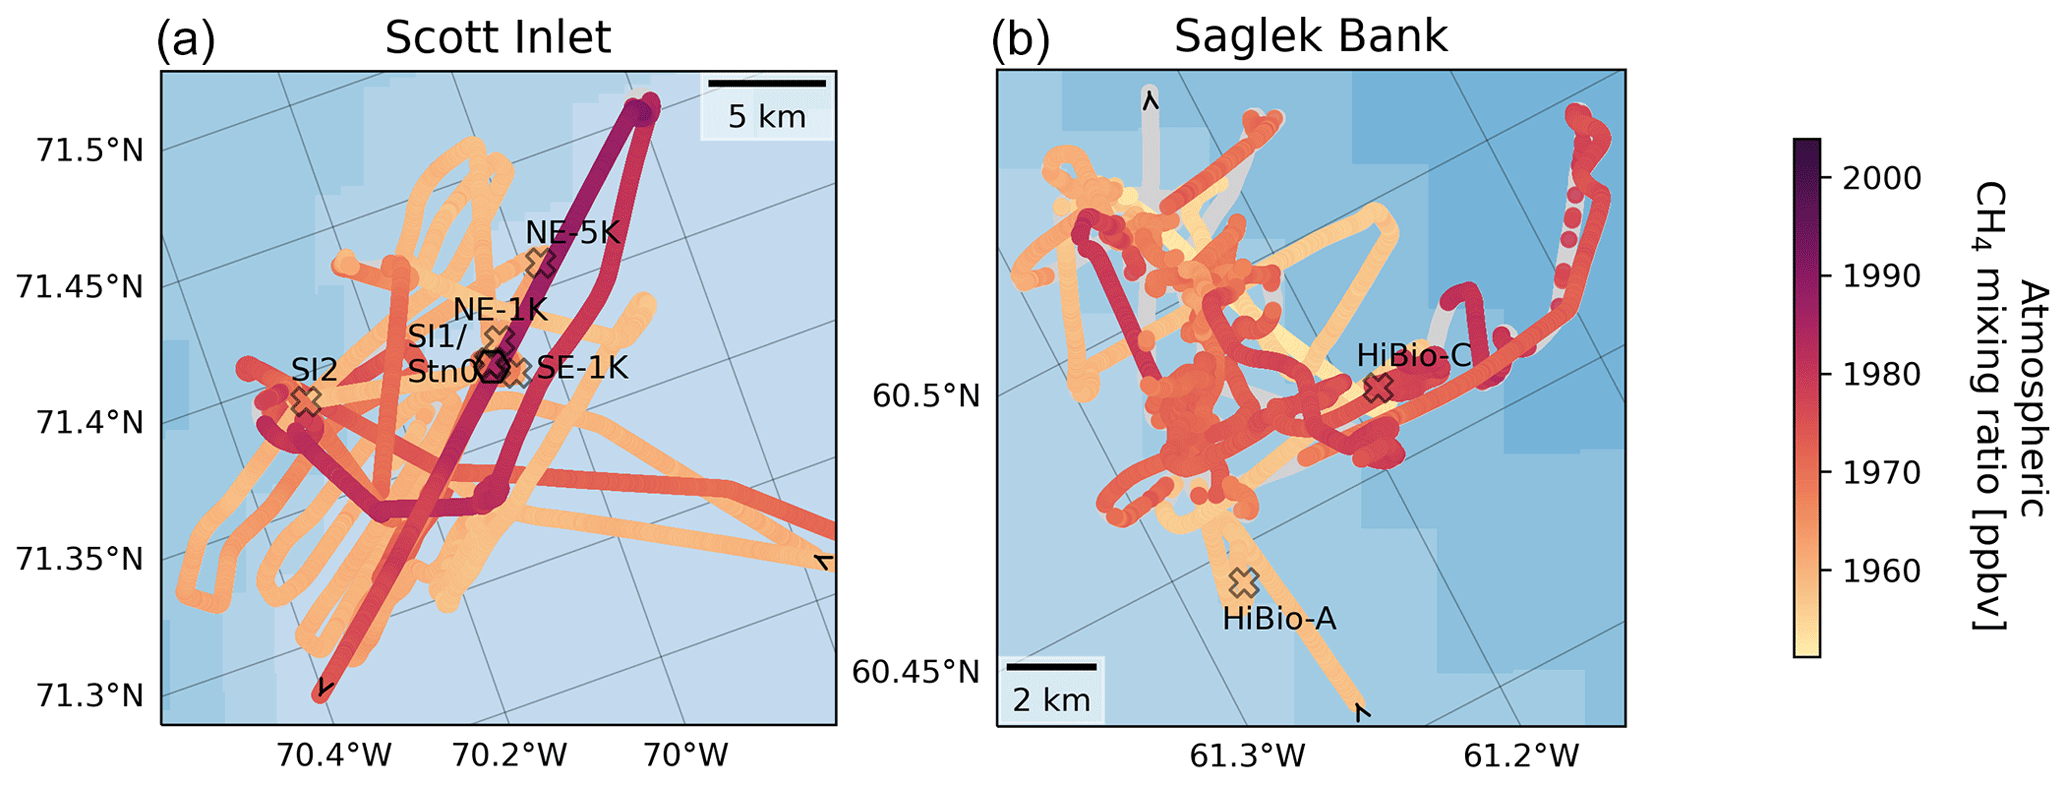
Figure A3Close-up of Scott Inlet (a) and Saglek Bank (b), where multiple water measurements were taken. The locations of CTD rosette sampling are indicated together with the respective names of stations. The arrows indicate the direction where the ship was heading. Stations SI1 and Stn0 were co-located at the Scott Inlet seep (black hexagon, a). Grey circles indicate measurements excluded due to the ship's contamination.
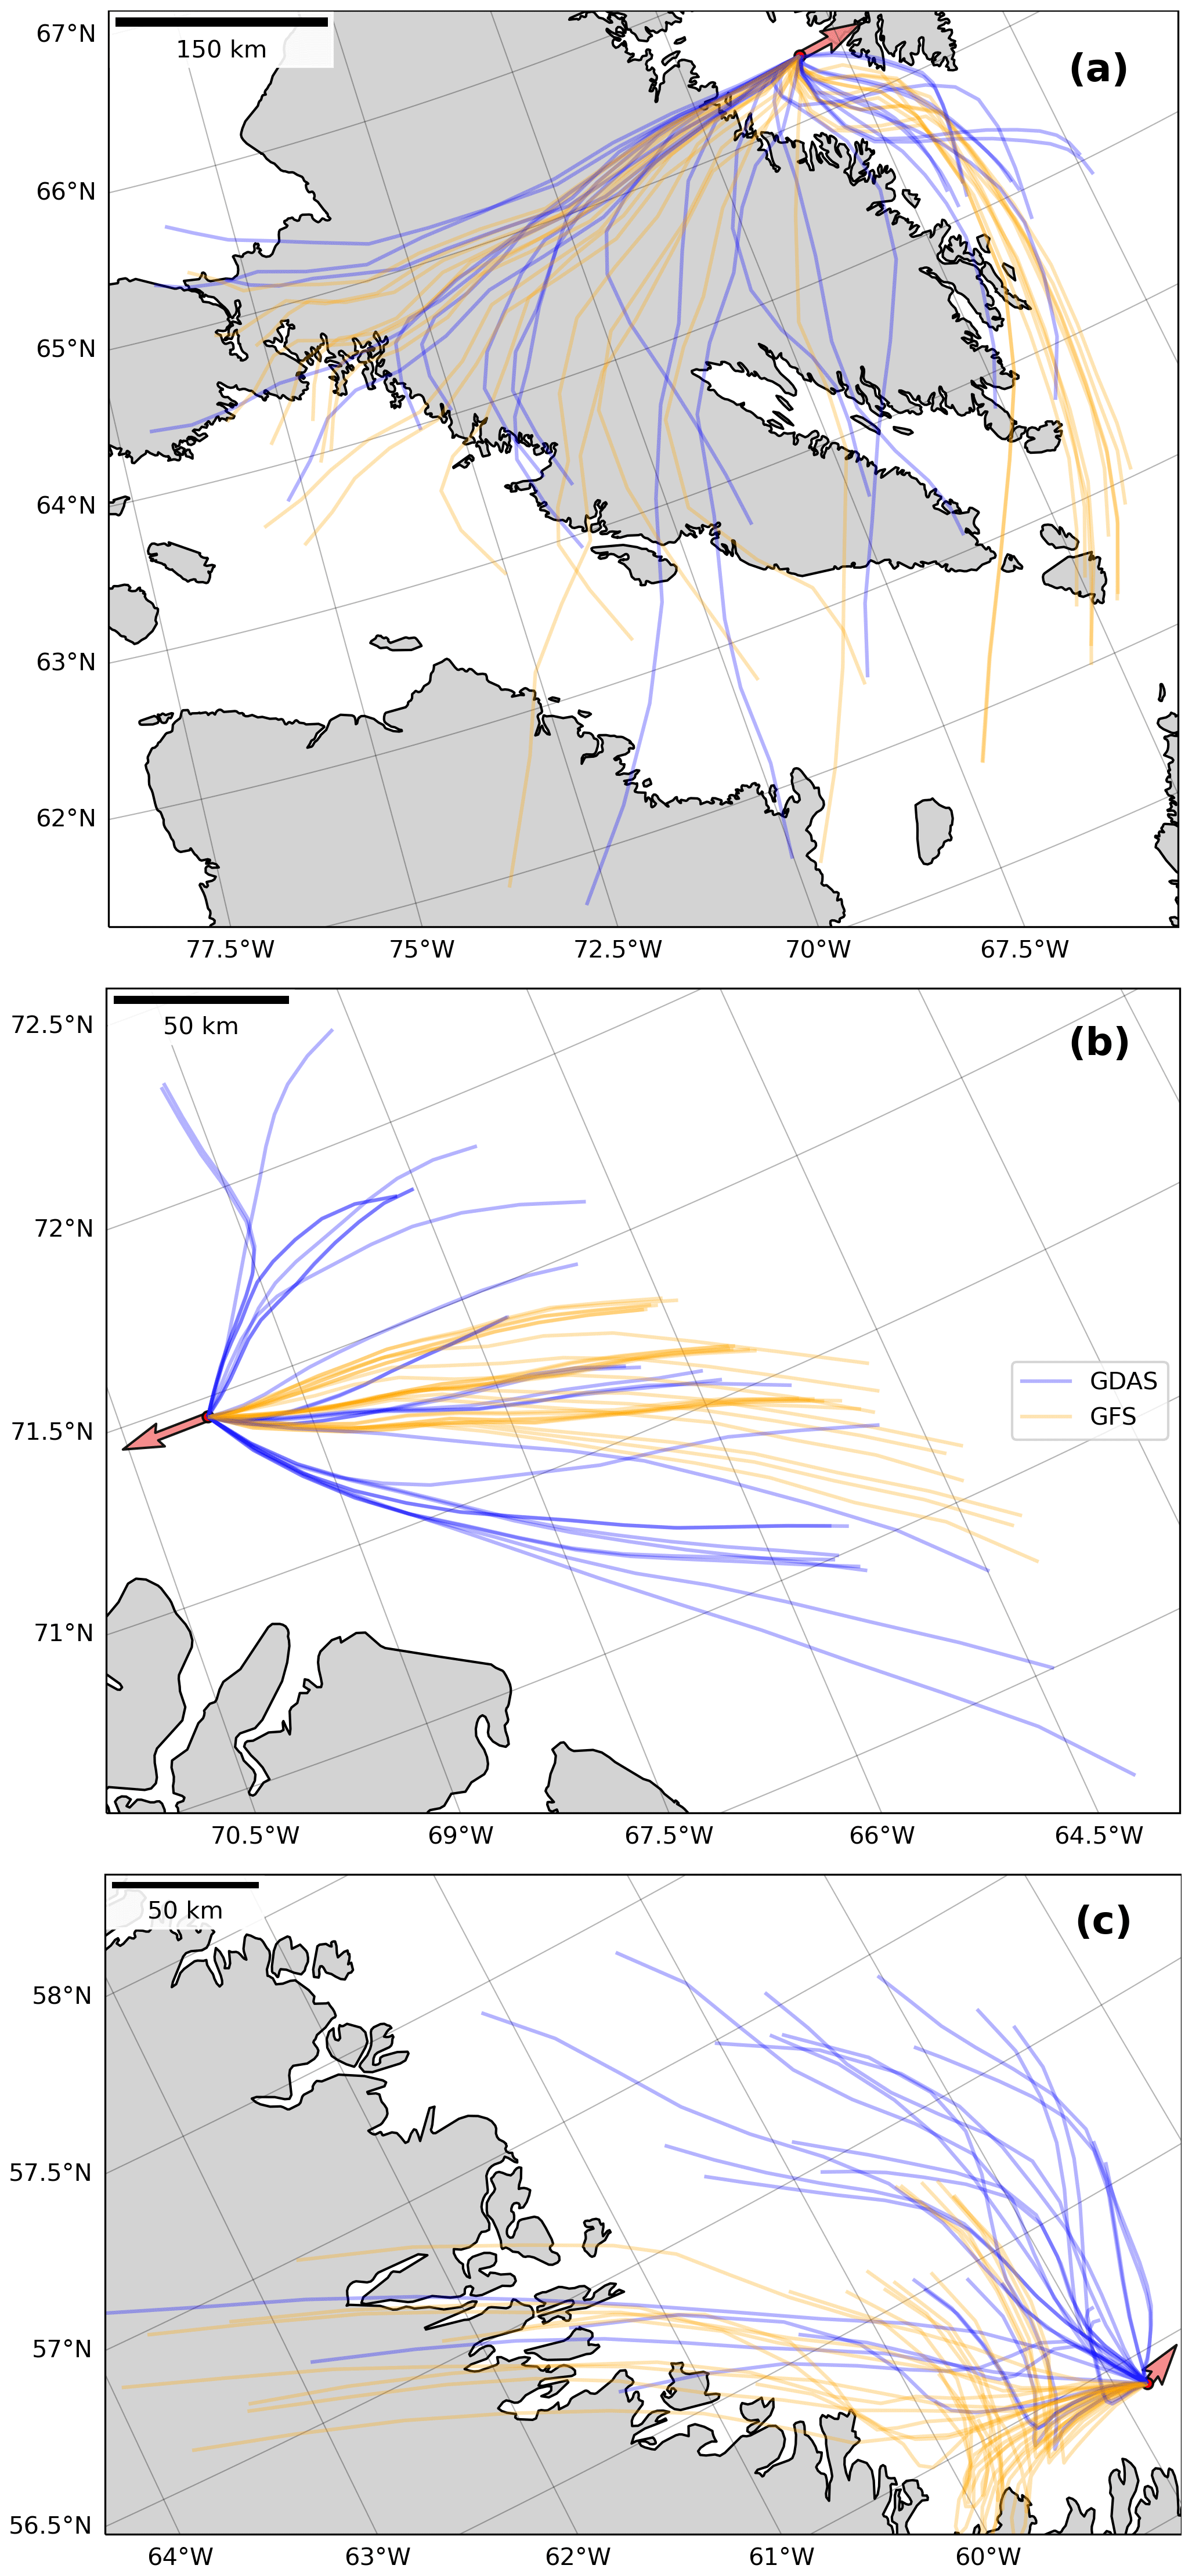
Figure A4Back trajectories of air masses approaching the locations where the highest atmospheric CH4 levels were measured in the Cumberland Sound (a), at Scott Inlet (b), and in the Labrador Sea (c). Orange lines represent trajectories using the GFS archive, and blue lines show trajectories with the GDAS meteorological model. Red arrows indicate the direction of air movement averaged over 5 min before and 5 min after the time of sampling, pointing in the direction the wind is blowing.
A2 Flux estimates
To determine the sea–air fluxes, the wind profile power law following Hsu et al. (1994) was used to correct wind speeds in m s−1 from the anemometer at 14.1 m height above sea level to 10 m height:
Furthermore, the Schmidt number for CH4 in seawater following the example of Manning and Nicholson (2022) based on Jähne et al. (1987) was incorporated:
with the kinematic viscosity of seawater (Manning and Nicholson, 2022)
the water temperature (Tw) in degrees Celsius (∘C), salinity (Sw) in practical salinity units (psu) as measured by the CTD, and density at atmospheric pressure (ρw) in kg m−3 (Fofonoff and Millard, 1983; Millero and Poisson, 1981).
The diffusion coefficient (Dw) in m2 s−1 was determined following Manning and Nicholson (2022) and based on Jähne et al. (1987):
using the ideal gas constant R=8.314510 (kg m2) (s2 K mol)−1.
Data have been made publicly available: https://doi.org/10.5683/SP3/6IUECA (Vogt et al., 2022).
JV, DR, and OAS designed and conceptualized the study, and JV collected the data. EB processed the raw atmospheric data. KAS provided the resources for seawater analysis, and ENE mentored. JV prepared the manuscript with contributions from all co-authors.
The contact author has declared that none of the authors has any competing interests.
Publisher’s note: Copernicus Publications remains neutral with regard to jurisdictional claims in published maps and institutional affiliations.
We would like to thank the teams from Amundsen Science and the Canadian Coast Guard for their incredible work in preparation of and during leg 2 of the 2021 expedition. Some of the data presented herein were collected by the Canadian research icebreaker CCGS Amundsen and made available by the Amundsen Science programme, which is supported through Université Laval by the Canada Foundation for Innovation. We also thank FluxLab members for their support during equipment preparation, especially Isaac Ketchum and Daniel Wesley. We thank Carrie-Ellen Gabriel and Darlene Childs for analysing the seawater samples and Simone Booker, Shaomin Chen, and other cruise participants who assisted in the sample collection. We thank the reviewers for their thorough comments and suggestions to improve this paper.
Funding was provided by an NSERC ship time grant to Owen Sherwood and others (RGPST-544990-2020) and an NSERC Discovery Grant awarded to Owen Sherwood (RGPIN-2018-05590). Seawater analysis was funded through the Aquatic Climate Change Adaptation Services Program (ACCASP) of Fisheries and Oceans Canada.
This paper was edited by Paul Stoy and reviewed by Charel Wohl and one anonymous referee.
Amante, C. and Eakins, B. W.: ETOPO1 1 Arc-Minute Global Relief Model: Procedures, Data Sources and Analysis. NOAA Tech. Memo NESDIS NGDC-24. National Geophysical Data Center, NOAA [data set], https://doi.org/10.7289/V5C8276M, 2009.
Amundsen Science Data Collection: CCGS Amundsen Navigation (NAV) data recorded during the annual science expeditions in the Canadian Arctic., Can. Cryospheric Inf. Netw. CCIN Waterloo Can., Complete data Version 1, PolarData [data set], https://doi.org/10.5884/12447, 2021a.
Amundsen Science Data Collection: AVOS Meteorological Data collected by the CCGS Amundsen in the Canadian Arctic, Can. Cryospheric Inf. Netw. CCIN Waterloo Can., Processed data, PolarData [data set], https://doi.org/10.5884/12518, 2021b.
Amundsen Science Data Collection: CTD-Rosette data collected by the CCGS Amundsen in the Canadian Arctic, Can. Cryospheric Inf. Netw. CCIN Waterloo Can., Processed data Version 1, PolarData [data set], https://doi.org/10.5884/12713, 2021c.
Amundsen Science Data Collection: TSG data collected by the CCGS Amundsen in the Canadian Arctic, Can. Cryospheric Inf. Netw. CCIN Waterloo Can., Processed data Version 3, PolarData [data set], https://doi.org/10.5884/12715, 2021d.
Amundsen Science Data Collection: Amundsen Science field station lists, Can. Cryospheric Inf. Netw. CCIN Waterloo Can., PolarData [data set], https://doi.org/10.5884/13248, 2021e.
Azetsu-Scott, K., Petrie, B., Yeats, P., and Lee, C.: Composition and fluxes of freshwater through Davis Strait using multiple chemical tracers, J. Geophys. Res.-Oceans, 117, C12011, https://doi.org/10.1029/2012JC008172, 2012.
Berchet, A., Pison, I., Crill, P. M., Thornton, B., Bousquet, P., Thonat, T., Hocking, T., Thanwerdas, J., Paris, J.-D., and Saunois, M.: Using ship-borne observations of methane isotopic ratio in the Arctic Ocean to understand methane sources in the Arctic, Atmos. Chem. Phys., 20, 3987–3998, https://doi.org/10.5194/acp-20-3987-2020, 2020.
Boles, J. R., Clark, J. F., Leifer, I., and Washburn, L.: Temporal variation in natural methane seep rate due to tides, Coal Oil Point area, California, J. Geophys. Res.-Oceans, 106, 27077–27086, https://doi.org/10.1029/2000JC000774, 2001.
Bonaglia, S., Rütting, T., Kononets, M., Stigebrandt, A., Santos, I. R., and Hall, P. O. J.: High methane emissions from an anoxic fjord driven by mixing and oxygenation, Limnol. Oceanogr. Lett., 7, 392–400, https://doi.org/10.1002/lol2.10259, 2022.
Bryden, H. L.: New polynomials for thermal expansion, adiabatic temperature gradient and potential temperature of sea water, Deep-Sea Res. Oceanogr. Abstr., 20, 401–408, https://doi.org/10.1016/0011-7471(73)90063-6, 1973.
Budkewitsch, P., Pavlic, G., Oakey, G., Jauer, C., and Decker, V.: Reconnaissance mapping of suspect oil seep occurrences in Baffin Bay and Davis Strait using satellite radar: preliminary results, Geol. Surv. Can., 7068, https://doi.org/10.4095/292280, 2013.
Castro-Morales, K., Canning, A., Arzberger, S., Overholt, W. A., Küsel, K., Kolle, O., Göckede, M., Zimov, N., and Körtzinger, A.: Highest methane concentrations in an Arctic river linked to local terrestrial inputs, Biogeosciences, 19, 5059–5077, https://doi.org/10.5194/bg-19-5059-2022, 2022.
Cramm, M. A., Neves, B. de M., Manning, C. C. M., Oldenburg, T. B. P., Archambault, P., Chakraborty, A., Cyr-Parent, A., Edinger, E. N., Jaggi, A., Mort, A., Tortell, P., and Hubert, C. R. J.: Characterization of marine microbial communities around an Arctic seabed hydrocarbon seep at Scott Inlet, Baffin Bay, Sci. Total Environ., 762, 143961, https://doi.org/10.1016/j.scitotenv.2020.143961, 2021.
Damm, E., Rudels, B., Schauer, U., Mau, S., and Dieckmann, G.: Methane excess in Arctic surface water- triggered by sea ice formation and melting, Sci. Rep., 5, 16179, https://doi.org/10.1038/srep16179, 2015.
Damm, E., Ericson, Y., and Falck, E.: Waterside convection and stratification control methane spreading in supersaturated Arctic fjords (Spitsbergen), Cont. Shelf Res., 224, 104473, https://doi.org/10.1016/j.csr.2021.104473, 2021.
Dlugokencky, E. J.: Atmospheric Methane Dry Air Mole Fractions (1983–2015) and Atmospheric Carbon Dioxide Dry Air Mole Fractions (1968–2015) from the NOAA ESRL Carbon Cycle Cooperative Global Air Sampling Network, original data files, NOAA Bremerhav. [data set], http://hdl.handle.net/10013/epic.51033.d001, 2016.
Dlugokencky, E. J.: Trends in Atmospheric Methane, NOAA/GML, https://gml.noaa.gov/ccgg/trends_ch4/ (last access: 25 November 2022), 2022.
Dlugokencky, E. J., Crotwell, A. M., Mund, J. W., Crotwell, M. J., and Thoning, K. W.: Atmospheric Methane Dry Air Mole Fractions from the NOAA GML Carbon Cycle Cooperative Global Air Sampling Network, 1983–2020, Version 2021-07-30, NOAA [data set], https://doi.org/10.15138/VNCZ-M766, 2021.
Dølven, K. O., Ferré, B., Silyakova, A., Jansson, P., Linke, P., and Moser, M.: Autonomous methane seep site monitoring offshore western Svalbard: hourly to seasonal variability and associated oceanographic parameters, Ocean Sci., 18, 233–254, https://doi.org/10.5194/os-18-233-2022, 2022.
Fenwick, L., Capelle, D., Damm, E., Zimmermann, S., Williams, W. J., Vagle, S., and Tortell, P. D.: Methane and nitrous oxide distributions across the North American Arctic Ocean during summer, 2015, J. Geophys. Res.-Oceans, 122, 390–412, https://doi.org/10.1002/2016JC012493, 2017.
Fisher, R. E., Sriskantharajah, S., Lowry, D., Lanoisellé, M., Fowler, C. M. R., James, R. H., Hermansen, O., Lund Myhre, C., Stohl, A., Greinert, J., Nisbet-Jones, P. B. R., Mienert, J., and Nisbet, E. G.: Arctic methane sources: Isotopic evidence for atmospheric inputs, Geophys. Res. Lett., 38, https://doi.org/10.1029/2011GL049319, 2011.
Fofonoff, N. P. and Millard Jr, R. C.: Algorithms for the computation of fundamental properties of seawater, Paris, France, UNESCO, 53 pp. (UNESCO Technical Papers in Marine Sciences; 44), https://doi.org/10.25607/OBP-1450, 1983.
Fratantoni, P. S. and Pickart, R. S.: The Western North Atlantic Shelfbreak Current System in Summer, J. Phys. Oceanogr., 37, 2509–2533, https://doi.org/10.1175/JPO3123.1, 2007.
Fröb, F., Olsen, A., Våge, K., Moore, G. W. K., Yashayaev, I., Jeansson, E., and Rajasakaren, B.: Irminger Sea deep convection injects oxygen and anthropogenic carbon to the ocean interior, Nat. Commun., 7, 13244, https://doi.org/10.1038/ncomms13244, 2016.
Gautier, D. L., Bird, K. J., Charpentier, R. R., Grantz, A., Houseknecht, D. W., Klett, T. R., Moore, T. E., Pitman, J. K., Schenk, C. J., Schuenemeyer, J. H., Sørensen, K., Tennyson, M. E., Valin, Z. C., and Wandrey, C. J.: Oil and gas resource potential north of the Arctic Circle, Arct. Petr. Geol., 35, 151, https://doi.org/10.1144/M35.9, 2011.
Gregersen, U. and Bidstrup, T.: Structures and hydrocarbon prospectivity in the northern Davis Strait area, offshore West Greenland, Petrol. Geosci., 14, 151–166, https://doi.org/10.1144/1354-079308-752, 2008.
Ho, D. T., Law, C. S., Smith, M. J., Schlosser, P., Harvey, M., and Hill, P.: Measurements of air-sea gas exchange at high wind speeds in the Southern Ocean: Implications for global parameterizations, Geophys. Res. Lett., 33, L16611, https://doi.org/10.1029/2006GL026817, 2006.
Hou, K. and Xu, X.: Evaluation of the Influence between Local Meteorology and Air Quality in Beijing Using Generalized Additive Models, Atmosphere, 13, 24, https://doi.org/10.3390/atmos13010024, 2022.
Hsu, S. A., Meindl, E. A., and Gilhousen, D. B.: Determining the Power-Law Wind-Profile Exponent under Near-Neutral Stability Conditions at Sea, J. Appl. Meteorol. Clim., 33, 757–765, https://doi.org/10.1175/1520-0450(1994)033<0757:DTPLWP>2.0.CO;2, 1994.
Jähne, B., Heinz, G., and Dietrich, W.: Measurement of the diffusion coefficients of sparingly soluble gases in water, J. Geophys. Res.-Oceans, 92, 10767–10776, https://doi.org/10.1029/JC092iC10p10767, 1987.
James, R. H., Bousquet, P., Bussmann, I., Haeckel, M., Kipfer, R., Leifer, I., Niemann, H., Ostrovsky, I., Piskozub, J., Rehder, G., Treude, T., Vielstädte, L., and Greinert, J.: Effects of climate change on methane emissions from seafloor sediments in the Arctic Ocean: A review, Limnol. Oceanogr., 61, S283–S299, https://doi.org/10.1002/lno.10307, 2016.
Jauer, C. D. and Budkewitsch, P.: Old marine seismic and new satellite radar data: Petroleum exploration of north west Labrador Sea, Canada, Mar. Petrol. Geol., 27, 1379–1394, https://doi.org/10.1016/j.marpetgeo.2010.03.003, 2010.
Karl, D. M., Beversdorf, L., Björkman, K. M., Church, M. J., Martinez, A., and Delong, E. F.: Aerobic production of methane in the sea, Nat. Geosci., 1, 473–478, https://doi.org/10.1038/ngeo234, 2008.
Kvenvolden, K. A.: Methane hydrate – A major reservoir of carbon in the shallow geosphere?, Chem. Geol., 71, 41–51, https://doi.org/10.1016/0009-2541(88)90104-0, 1988.
Lan, X., Basu, S., Schwietzke, S., Bruhwiler, L. M. P., Dlugokencky, E. J., Michel, S. E., Sherwood, O. A., Tans, P. P., Thoning, K., Etiope, G., Zhuang, Q., Liu, L., Oh, Y., Miller, J. B., Pétron, G., Vaughn, B. H., and Crippa, M.: Improved Constraints on Global Methane Emissions and Sinks Using δ13C-CH4, Global Biogeochem. Cy., 35, e2021GB007000, https://doi.org/10.1029/2021GB007000, 2021.
Law, C. S., Nodder, S. D., Mountjoy, J. J., Marriner, A., Orpin, A., Pilditch, C. A., Franz, P., and Thompson, K.: Geological, hydrodynamic and biogeochemical variability of a New Zealand deep-water methane cold seep during an integrated three-year time-series study, Mar. Geol., 272, 189–208, https://doi.org/10.1016/j.margeo.2009.06.018, 2010.
Leifer, I. and Boles, J.: Measurement of marine hydrocarbon seep flow through fractured rock and unconsolidated sediment, Mar. Petrol. Geol., 22, 551–568, https://doi.org/10.1016/j.marpetgeo.2004.10.026, 2005.
Leonte, M., Kessler, J. D., Kellermann, M. Y., Arrington, E. C., Valentine, D. L., and Sylva, S. P.: Rapid rates of aerobic methane oxidation at the feather edge of gas hydrate stability in the waters of Hudson Canyon, US Atlantic Margin, Geochim. Cosmochim. Ac., 204, 375–387, https://doi.org/10.1016/j.gca.2017.01.009, 2017.
Levy, E. M. and MacIean, B.: Natural Hydrocarbon Seepage At Scott Inlet and Buchan Gulf, Baffin Island Shelf: 1980 Update, Geol. Surv. Can., 81-1A, 401–403, https://doi.org/10.4095/109550, 1981.
Li, Y., Xie, H., Scarratt, M., Damm, E., Bourgault, D., Galbraith, P. S., and Wallace, D. W. R.: Dissolved methane in the water column of the Saguenay Fjord, Mar. Chem., 230, 103926, https://doi.org/10.1016/j.marchem.2021.103926, 2021.
Loncarevic, B. D. and Falconer, R. K. H.: An oil slick occurrence off Baffin Island, Rep. Act. Part Geol. Surv. Can. Pap., 523–524, 77-1A, https://doi.org/10.4095/102743, 1977.
Manning, C. C. M. and Nicholson, D. P.: dnicholson/gas_toolbox: MATLAB code for calculating gas fluxes, Zenodo [code], https://doi.org/10.5281/zenodo.6126685, 2022.
Manning, C. C. M., Zheng, Z., Fenwick, L., McCulloch, R. D., Damm, E., Izett, R. W., Williams, W. J., Zimmermann, S., Vagle, S., and Tortell, P. D.: Interannual Variability in Methane and Nitrous Oxide Concentrations and Sea-Air Fluxes Across the North American Arctic Ocean (2015–2019), Global Biogeochem. Cy., 36, e2021GB007185, https://doi.org/10.1029/2021GB007185, 2022.
Mau, S., Blees, J., Helmke, E., Niemann, H., and Damm, E.: Vertical distribution of methane oxidation and methanotrophic response to elevated methane concentrations in stratified waters of the Arctic fjord Storfjorden (Svalbard, Norway), Biogeosciences, 10, 6267–6278, https://doi.org/10.5194/bg-10-6267-2013, 2013.
Mau, S., Römer, M., Torres, M. E., Bussmann, I., Pape, T., Damm, E., Geprägs, P., Wintersteller, P., Hsu, C.-W., Loher, M., and Bohrmann, G.: Widespread methane seepage along the continental margin off Svalbard – from Bjørnøya to Kongsfjorden, Sci. Rep., 7, 42997, https://doi.org/10.1038/srep42997, 2017.
McGinnis, D. F., Greinert, J., Artemov, Y., Beaubien, S. E., and Wüest, A.: Fate of rising methane bubbles in stratified waters: How much methane reaches the atmosphere?, J. Geophys. Res.-Oceans, 111, C09007, https://doi.org/10.1029/2005JC003183, 2006.
Melling, H., Gratton, Y., and Ingram, G.: Ocean circulation within the North Water polynya of Baffin Bay, Atmos. Ocean, 39, 301–325, https://doi.org/10.1080/07055900.2001.9649683, 2001.
Meredith, M., Sommerkorn, M., Cassotta, S., Derksen, C., Ekaykin, A., Hollowed, A., Kofinas, G., Mackintosh, A., Melbourne-Thomas, J., Muelbert, M. M. C., Ottersen, G., Pritchard, H., and Schuur, E. A. G.: Chapter 3: Polar regions, in: IPCC Special Report on the Ocean and Cryosphere in a Changing Climate, edited by: Pörtner, H.-O., Roberts, D. C., Masson-Delmotte, V., Zhai, P., Tignor, M., Poloczanska, E., Mintenbeck, K., Alegría, A., Nicolai, M., Okem, A., Petzold, J., Rama, B., and Weyer, N. M., Cambridge University Press, Cambridge, UK and New York, USA, 203–320, https://doi.org/10.1017/9781009157964.005, 2019.
Millero, F. J. and Poisson, A.: International one-atmosphere equation of state of seawater, Deep-Sea Res. Pt. Oceanogr. Res. Pap., 28, 625–629, https://doi.org/10.1016/0198-0149(81)90122-9, 1981.
Neill, C., Johnson, K. M., Lewis, E., and Wallace, D. W. R.: Accurate headspace analysis of fCO2 in discrete water samples using batch equilibration, Limnol. Oceanogr., 42, 1774–1783, https://doi.org/10.4319/lo.1997.42.8.1774, 1997.
Nielsen, T., Laier, T., Kuijpers, A., Rasmussen, T. L., Mikkelsen, N. E., and Nørgård-Pedersen, N.: Fluid flow and methane occurrences in the Disko Bugt area offshore West Greenland: indications for gas hydrates?, Geo-Mar. Lett., 34, 511–523, https://doi.org/10.1007/s00367-014-0382-2, 2014.
Nisbet, E. G., Manning, M. R., Dlugokencky, E. J., Fisher, R. E., Lowry, D., Michel, S. E., Myhre, C. L., Platt, S. M., Allen, G., Bousquet, P., Brownlow, R., Cain, M., France, J. L., Hermansen, O., Hossaini, R., Jones, A. E., Levin, I., Manning, A. C., Myhre, G., Pyle, J. A., Vaughn, B. H., Warwick, N. J., and White, J. W. C.: Very Strong Atmospheric Methane Growth in the 4 Years 2014–2017: Implications for the Paris Agreement, Global Biogeochem. Cy., 33, 318–342, https://doi.org/10.1029/2018GB006009, 2019.
NOAA National Geophysical Data Center: ETOPO1 1 Arc-Minute Global Relief Model, NOAA National Centers for Environmental Information, 2009.
Normandeau, A., MacKillop, K., Macquarrie, M., Richards, C., Bourgault, D., Campbell, D. C., Maselli, V., Philibert, G., and Clarke, J. H.: Submarine landslides triggered by iceberg collision with the seafloor, Nat. Geosci., 14, 599–605, https://doi.org/10.1038/s41561-021-00767-4, 2021.
Paull, C. K., Brewer, P. G., Ussler, W., Peltzer, E. T., Rehder, G., and Clague, D.: An experiment demonstrating that marine slumping is a mechanism to transfer methane from seafloor gas-hydrate deposits into the upper ocean and atmosphere, Geo-Mar. Lett., 22, 198–203, https://doi.org/10.1007/s00367-002-0113-y, 2002.
Pearce, J. L., Beringer, J., Nicholls, N., Hyndman, R. J., and Tapper, N. J.: Quantifying the influence of local meteorology on air quality using generalized additive models, Atmos. Environ., 45, 1328–1336, https://doi.org/10.1016/j.atmosenv.2010.11.051, 2011.
Platt, S. M., Eckhardt, S., Ferré, B., Fisher, R. E., Hermansen, O., Jansson, P., Lowry, D., Nisbet, E. G., Pisso, I., Schmidbauer, N., Silyakova, A., Stohl, A., Svendby, T. M., Vadakkepuliyambatta, S., Mienert, J., and Lund Myhre, C.: Methane at Svalbard and over the European Arctic Ocean, Atmos. Chem. Phys., 18, 17207–17224, https://doi.org/10.5194/acp-18-17207-2018, 2018.
Punshon, S., Azetsu-Scott, K., and Lee, C. M.: On the distribution of dissolved methane in Davis Strait, North Atlantic Ocean, Mar. Chem., 161, 20–25, https://doi.org/10.1016/j.marchem.2014.02.004, 2014.
Punshon, S., Azetsu-Scott, K., Sherwood, O., and Edinger, E. N.: Bottom water methane sources along the high latitude eastern Canadian continental shelf and their effects on the marine carbonate system, Mar. Chem., 212, 83–95, https://doi.org/10.1016/j.marchem.2019.04.004, 2019.
Reeburgh, W. S.: Oceanic Methane Biogeochemistry, Chem. Rev., 107, 486–513, https://doi.org/10.1021/cr050362v, 2007.
Rolph, G., Stein, A., and Stunder, B.: Real-time Environmental Applications and Display sYstem: READY, Environ. Model. Softw., 95, 210–228, https://doi.org/10.1016/j.envsoft.2017.06.025, 2017.
Saunois, M., Jackson, R. B., Bousquet, P., Poulter, B., and Canadell, J. G.: The growing role of methane in anthropogenic climate change, Environ. Res. Lett., 11, 120207, https://doi.org/10.1088/1748-9326/11/12/120207, 2016.
Savitzky, A. and Golay, M. J. E.: Smoothing and Differentiation of Data by Simplified Least Squares Procedures, Anal. Chem., 36, 1627–1639, https://doi.org/10.1021/ac60214a047, 1964.
Shakhova, N., Semiletov, I., Salyuk, A., Yusupov, V., Kosmach, D., and Gustafsson, Ö.: Extensive Methane Venting to the Atmosphere from Sediments of the East Siberian Arctic Shelf, Science, 327, 1246–1250, https://doi.org/10.1126/science.1182221, 2010.
Shakhova, N., Semiletov, I., Leifer, I., Sergienko, V., Salyuk, A., Kosmach, D., Chernykh, D., Stubbs, C., Nicolsky, D., Tumskoy, V., and Gustafsson, Ö.: Ebullition and storm-induced methane release from the East Siberian Arctic Shelf, Nat. Geosci., 7, 64–70, https://doi.org/10.1038/ngeo2007, 2014.
Sherwood, O. A., Davin, S. H., Lehmann, N., Buchwald, C., Edinger, E. N., Lehmann, M. F., and Kienast, M.: Stable isotope ratios in seawater nitrate reflect the influence of Pacific water along the northwest Atlantic margin, Biogeosciences, 18, 4491–4510, https://doi.org/10.5194/bg-18-4491-2021, 2021.
Silyakova, A., Jansson, P., Serov, P., Ferré, B., Pavlov, A. K., Hattermann, T., Graves, C. A., Platt, S. M., Myhre, C. L., Gründger, F., and Niemann, H.: Physical controls of dynamics of methane venting from a shallow seep area west of Svalbard, Cont. Shelf Res., 194, 104030, https://doi.org/10.1016/j.csr.2019.104030, 2020.
Stein, A. F., Draxler, R. R., Rolph, G. D., Stunder, B. J. B., Cohen, M. D., and Ngan, F.: NOAA's HYSPLIT Atmospheric Transport and Dispersion Modeling System, B. Am. Meteorol. Soc., 96, 2059–2077, https://doi.org/10.1175/BAMS-D-14-00110.1, 2015.
Stramma, L., Kieke, D., Rhein, M., Schott, F., Yashayaev, I., and Koltermann, K. P.: Deep water changes at the western boundary of the subpolar North Atlantic during 1996 to 2001, Deep-Sea Res. Pt. Oceanogr. Res. Pap., 51, 1033–1056, https://doi.org/10.1016/j.dsr.2004.04.001, 2004.
Tang, C. C. L., Ross, C. K., Yao, T., Petrie, B., DeTracey, B. M., and Dunlap, E.: The circulation, water masses and sea-ice of Baffin Bay, Prog. Oceanogr., 63, 183–228, https://doi.org/10.1016/j.pocean.2004.09.005, 2004.
Thonat, T., Saunois, M., Bousquet, P., Pison, I., Tan, Z., Zhuang, Q., Crill, P. M., Thornton, B. F., Bastviken, D., Dlugokencky, E. J., Zimov, N., Laurila, T., Hatakka, J., Hermansen, O., and Worthy, D. E. J.: Detectability of Arctic methane sources at six sites performing continuous atmospheric measurements, Atmos. Chem. Phys., 17, 8371–8394, https://doi.org/10.5194/acp-17-8371-2017, 2017.
Thornton, B. F., Geibel, M. C., Crill, P. M., Humborg, C., and Mörth, C.-M.: Methane fluxes from the sea to the atmosphere across the Siberian shelf seas, Geophys. Res. Lett., 43, 5869–5877, https://doi.org/10.1002/2016GL068977, 2016.
Thornton, B. F., Prytherch, J., Andersson, K., Brooks, I. M., Salisbury, D., Tjernström, M., and Crill, P. M.: Shipborne eddy covariance observations of methane fluxes constrain Arctic sea emissions, Sci. Adv., 6, eaay7934, https://doi.org/10.1126/sciadv.aay7934, 2020.
Vogt, J., Risk, D., Azetsu-Scott, K., Edinger, E. N., and Sherwood, O. A.: Methane flux estimates from continuous atmospheric measurements and surface-water observations in the northern Labrador Sea and Baffin Bay, V6, Borealis [data set], https://doi.org/10.5683/SP3/6IUECA, 2022.
Wanninkhof, R.: Relationship between wind speed and gas exchange over the ocean revisited, Limnol. Oceanogr.-Meth., 12, 351–362, https://doi.org/10.4319/lom.2014.12.351, 2014.
Wiesenburg, D. A. and Guinasso Jr., N. L.: Equilibrium Solubilities of Methane, Carbon Monoxide, and Hydrogen in Water and Sea Water, J. Chem. Eng. Data, 24, 356–360, https://doi.org/10.1021/je60083a006, 1979.
Wood, S. N.: Fast stable restricted maximum likelihood and marginal likelihood estimation of semiparametric generalized linear models, J. R. Stat. Soc., 73, 3–36, 2011.
Wu, Y. S., Hannah, C. G., Petrie, B., Pettipas, R., Peterson, I., Prinsenberg, S., Lee, C., and Moritz, R.: Ocean current and sea ice statistics for Davis Strait, Fisheries and Oceans Canada, https://publications.gc.ca/site/eng/9.620515/publication.html (last access: 9 May 2023), 2013.
Zhao, Y., Booge, D., Marandino, C. A., Schlundt, C., Bracher, A., Atlas, E. L., Williams, J., and Bange, H. W.: Dimethylated sulfur compounds in the Peruvian upwelling system, Biogeosciences, 19, 701–714, https://doi.org/10.5194/bg-19-701-2022, 2022.