the Creative Commons Attribution 4.0 License.
the Creative Commons Attribution 4.0 License.
 | 12 Jul 2023
Assessing carbon storage capacity and saturation across six central US grasslands using data–model integration
Kevin R. Wilcox
Scott L. Collins
Alan K. Knapp
William Pockman
Zheng Shi
Melinda D. Smith
Future global changes will impact carbon (C) fluxes and pools in most terrestrial ecosystems and the feedback of terrestrial carbon cycling to atmospheric CO2. Determining the vulnerability of C in ecosystems to future environmental change is thus vital for targeted land management and policy. The C capacity of an ecosystem is a function of its C inputs (e.g., net primary productivity – NPP) and how long C remains in the system before being respired back to the atmosphere. The proportion of C capacity currently stored by an ecosystem (i.e., its C saturation) provides information about the potential for long-term C pools to be altered by environmental and land management regimes. We estimated C capacity, C saturation, NPP, and ecosystem C residence time in six US grasslands spanning temperature and precipitation gradients by integrating high temporal resolution C pool and flux data with a process-based C model. As expected, NPP across grasslands was strongly correlated with mean annual precipitation (MAP), yet C residence time was not related to MAP or mean annual temperature (MAT). We link soil temperature, soil moisture, and inherent C turnover rates (potentially due to microbial function and tissue quality) as determinants of carbon residence time. Overall, we found that intermediates between extremes in moisture and temperature had low C saturation, indicating that C in these grasslands may trend upwards and be buffered against global change impacts. Hot and dry grasslands had greatest C saturation due to both small C inputs through NPP and high C turnover rates during soil moisture conditions favorable for microbial activity. Additionally, leaching of soil C during monsoon events may lead to C loss. C saturation was also high in tallgrass prairie due to frequent fire that reduced inputs of aboveground plant material. Accordingly, we suggest that both hot, dry ecosystems and those frequently disturbed should be subject to careful land management and policy decisions to prevent losses of C stored in these systems.
- Article
(2442 KB) - Full-text XML
-
Supplement
(2117 KB) - BibTeX
- EndNote


In the coming decades, most terrestrial ecosystems will experience changes in environmental drivers, including increased air temperatures and atmospheric CO2 concentrations, altered precipitation amounts and patterns, changes in fire frequency, and various anthropogenic impacts (e.g., agriculture) (IPCC, 2022). These changes are likely to have strong impacts on ecosystem functioning, such as C assimilation via plant growth or C losses via respiration (Hungate et al., 1997; Wang et al., 2016; Naylor et al., 2020). These will in turn affect critical ecosystem services, such as C sequestration (Lal, 2004; Wiesmeier et al., 2019). These effects are particularly important in grassland ecosystems due to their global extent (White et al., 2000) and their ability to be sinks for soil C (Conant et al., 2017; Bai and Cotrufo, 2022). Information about grasslands that may experience substantial changes in C storage when subjected to future environmental change is important for targeted land management (Rees et al., 2005) and policy decisions (Daily et al., 2009; Chambers et al., 2016). Experimental studies offer a way to assess how global changes are likely to impact ecosystem processes. Yet, experiments often have difficulty tracking effects on C storage, since changes in soil C pools can take decades (Balesdent et al., 1988; Chapin et al., 2002), and most experiments are conducted for relatively short time periods. Process-based models offer another method to assess alterations in soil C under future conditions and have been shown to be useful tools to assess soil C across grasslands (Parton et al., 1993; Bonan et al., 2013). Yet, variation of ecosystem properties and processes controlling C cycling across ecosystems, such as microbial community composition, is not well represented in many current models. Additionally, uncertainty surrounding ecosystem C is currently very large (Todd-Brown et al., 2014; Friend et al., 2014; Luo et al., 2015; Sulman et al., 2018). This highlights the need for better understanding of how C processes vary across ecosystems.
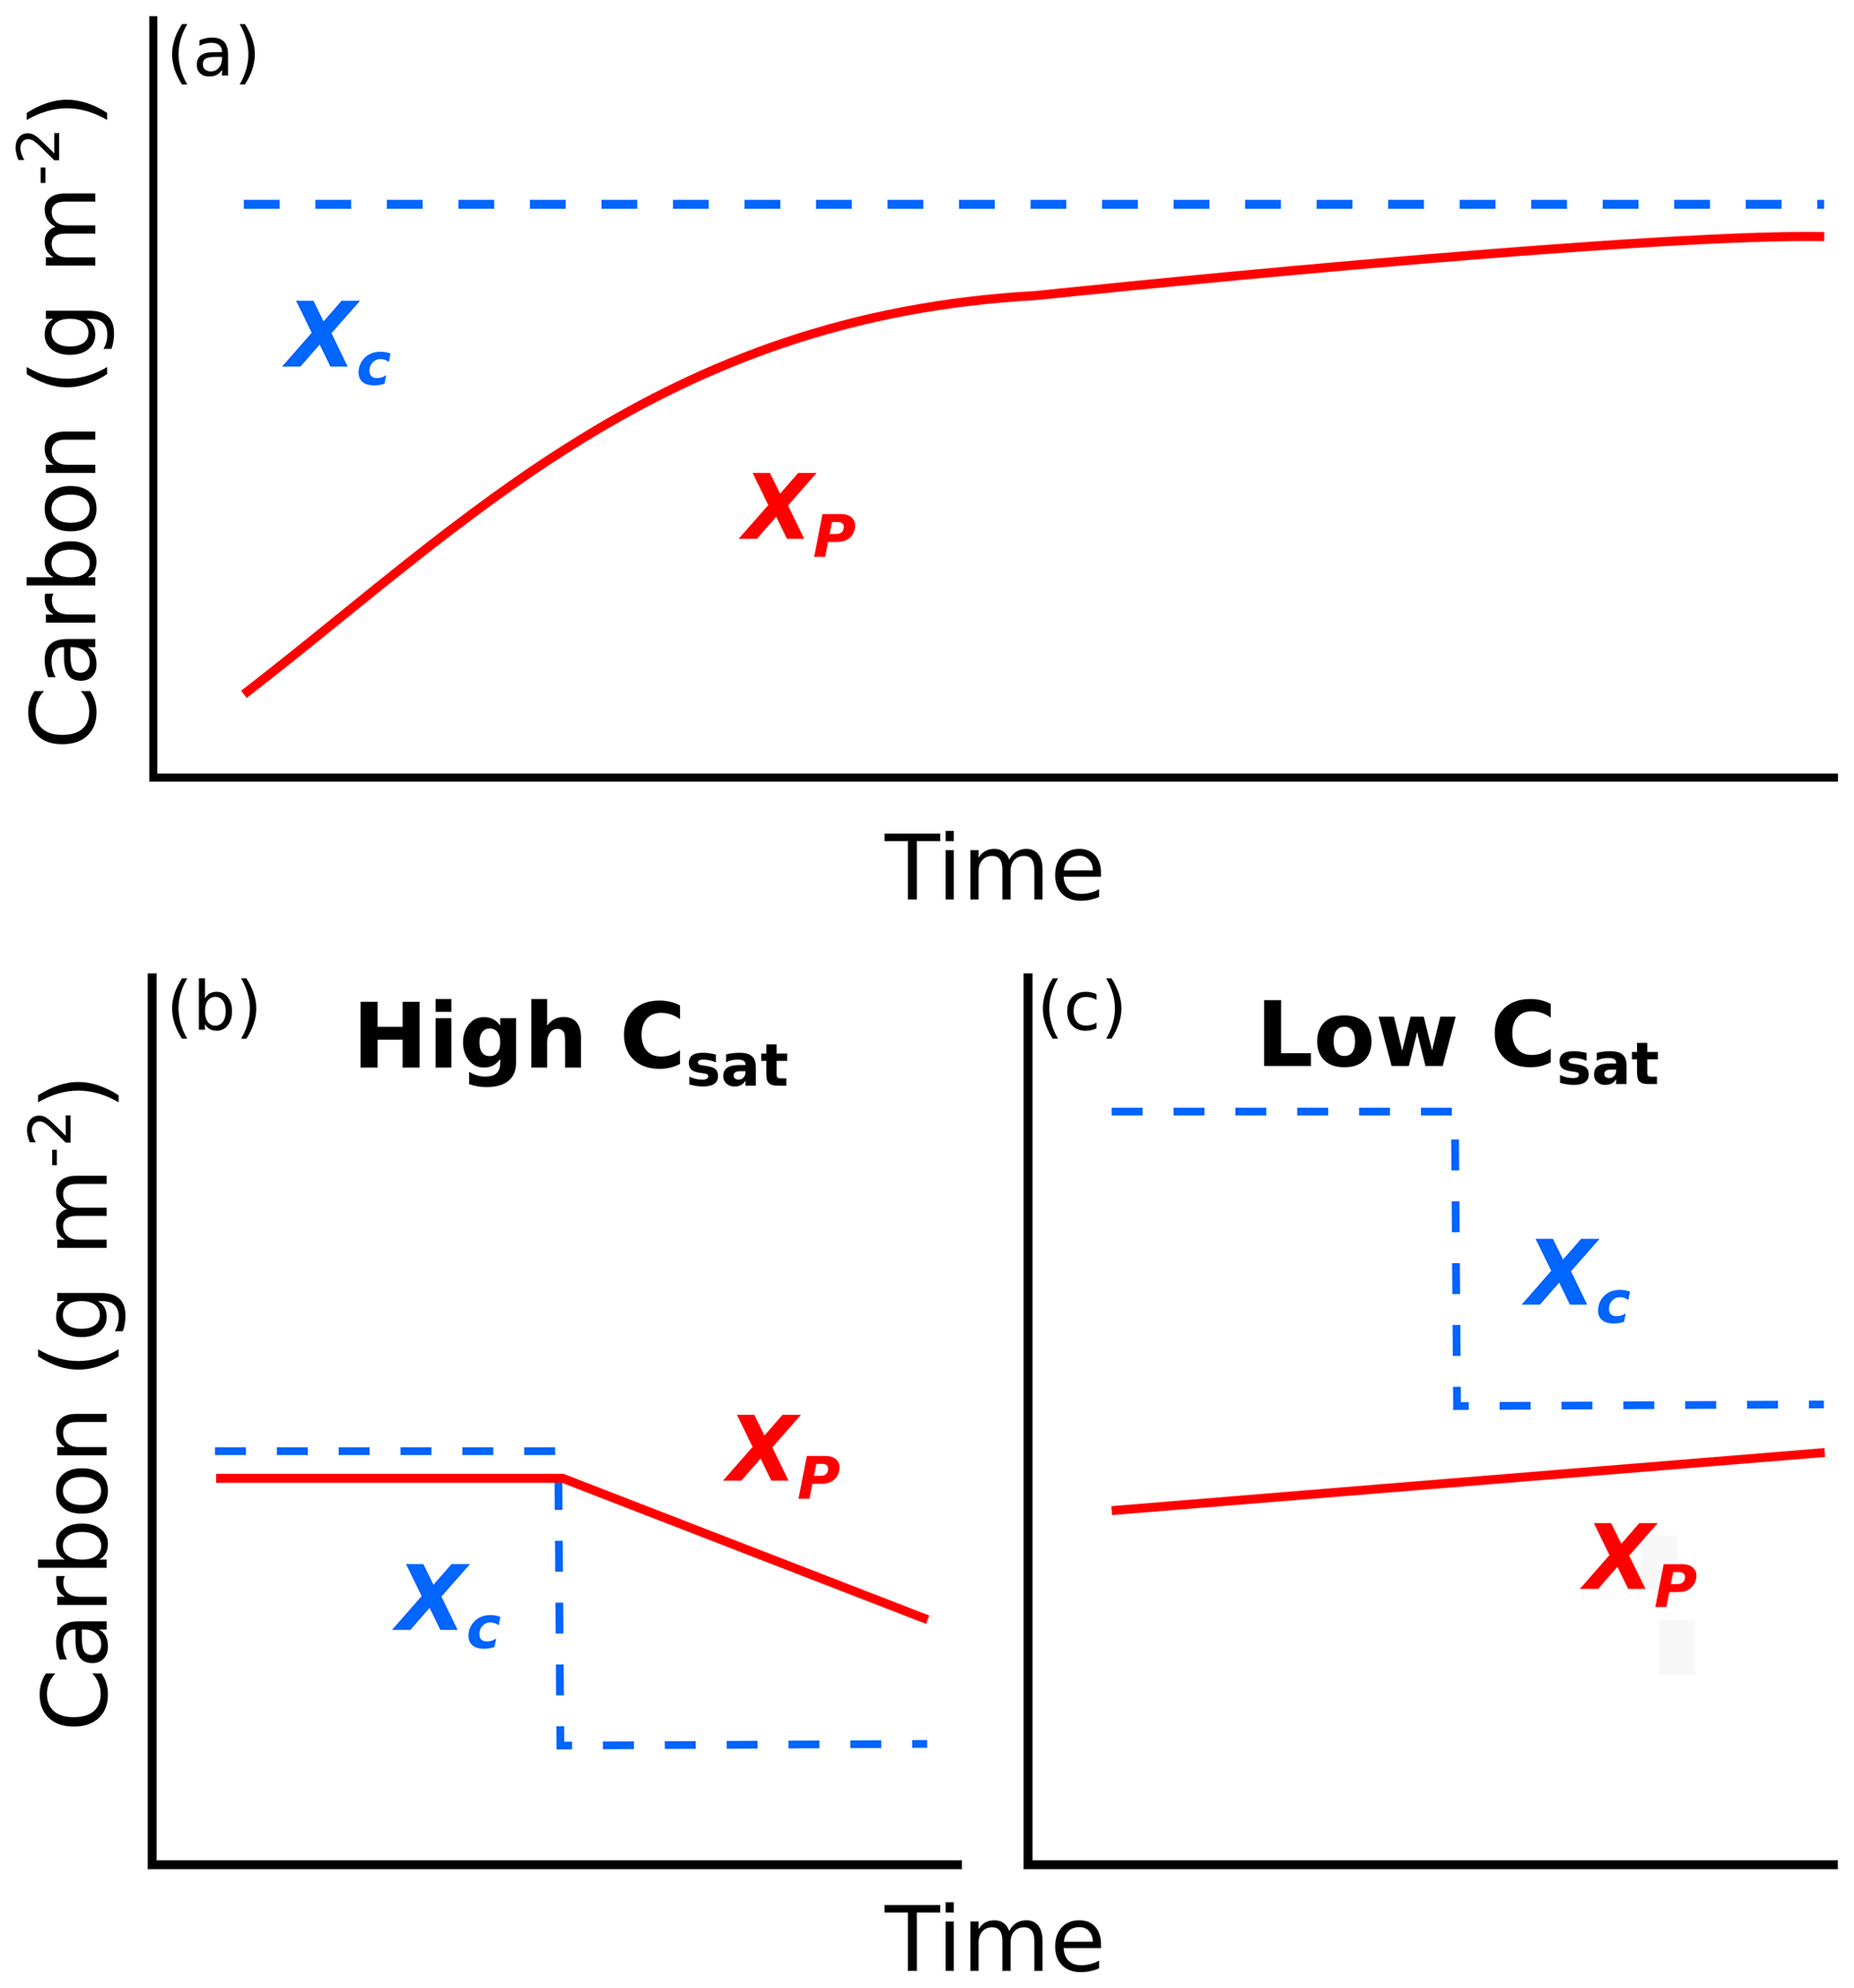
Figure 1(a) Conceptual figure showing how carbon (C) changes through time to approach C storage capacity as a function of the difference between C storage at present (XP) and C storage capacity (XC). Changes in C capacity (CSAT; dashed blue lines in (b)–(c)) can be caused by alterations in net primary productivity or ecosystem C residence time. (b) Ecosystems that have present C close to capacity are susceptible to C loss if environmental conditions cause reductions in C capacity, while (c) ecosystems that have present C far below capacity may be buffered against C losses, at least in the short term.
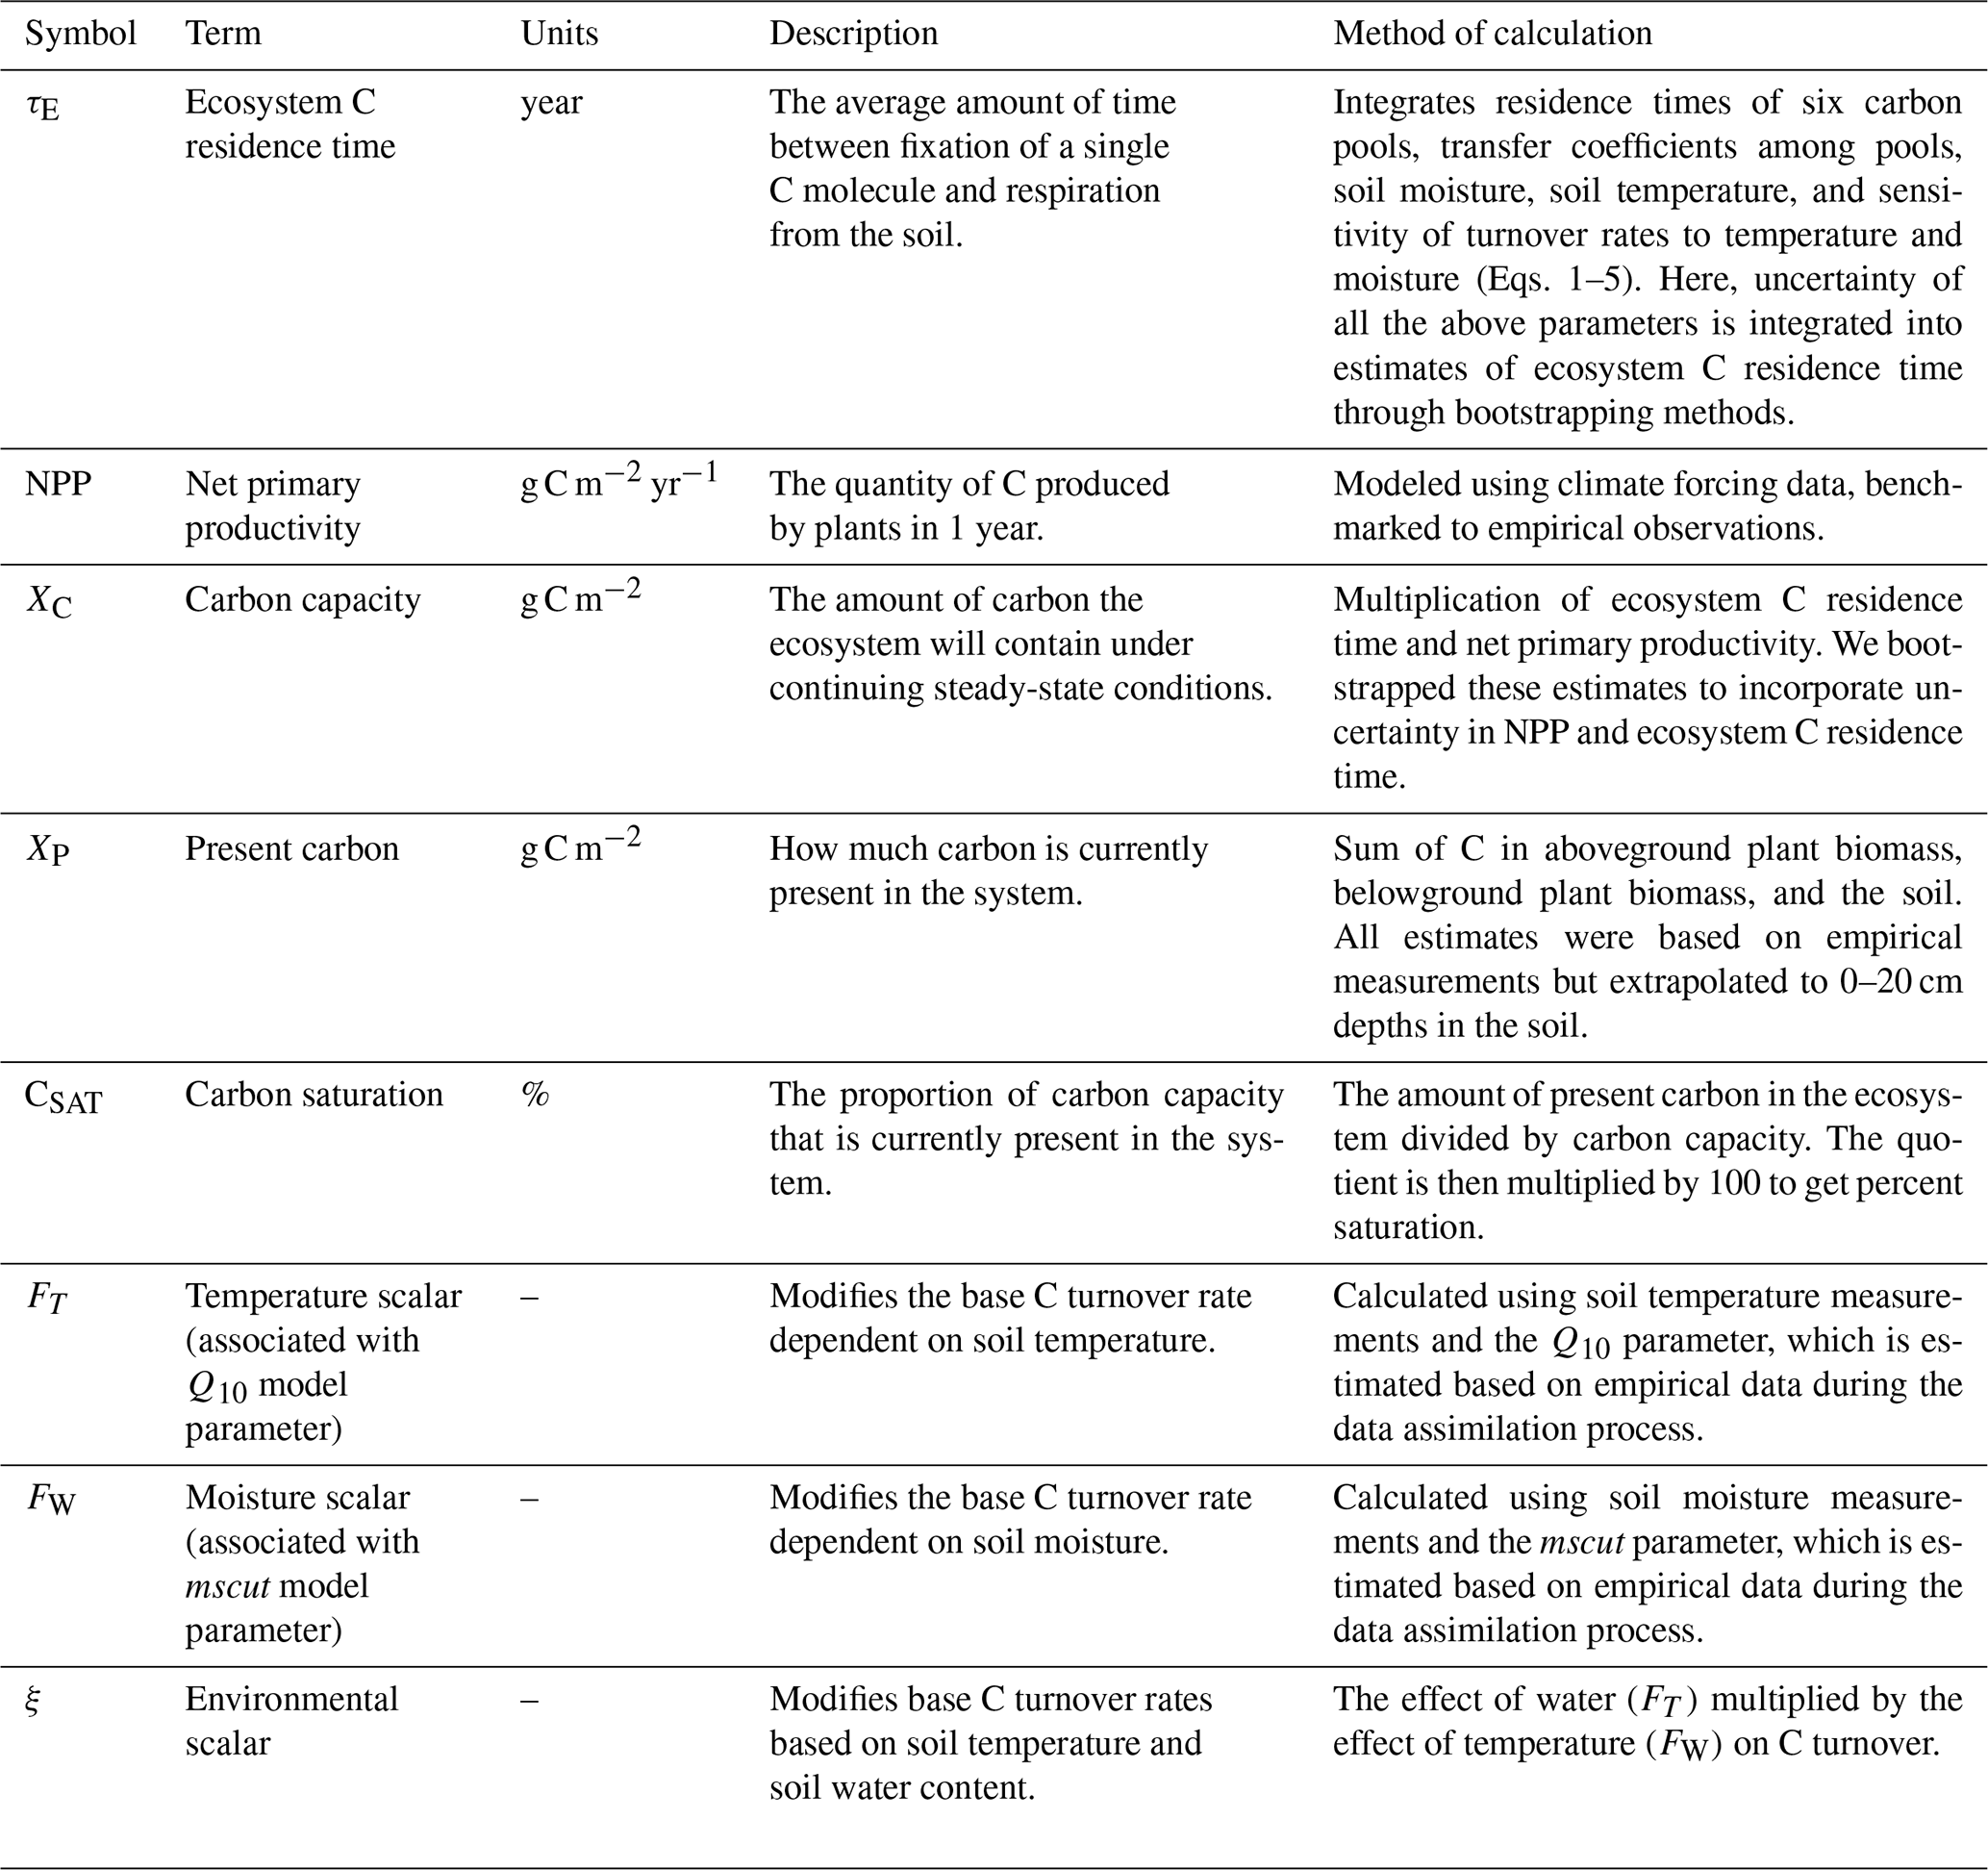
Many estimates of C sequestration rates use two or more time points of C pool measurements to infer annual rates of C accumulation or loss in ecosystems (e.g., Sperow et al., 2016; Smith et al., 2005). While informative, these estimates of C flux rates will not extend indefinitely (Smith, 2004), likely due to the non-linear nature of C accumulation or loss through time. Luo et al. (2017) introduced C capacity (XC; Table 1) as the amount of C that would be stored in soil and vegetation in an ecosystem if given enough time to reach equilibrium under current environmental conditions. Comparisons of C capacity and the amount of C currently stored by that system allows for predictions of long-term trends of ecosystem C and identification of ecosystems that are vulnerable to C loss under global change. In most terrestrial ecosystems, C capacity is primarily a function of C inputs (NPP) and the amount of time that carbon remains in a system before being respired back to the atmosphere (ecosystem C residence time – τE; Luo et al., 2017). There are often mismatches between the amount of C currently present within ecosystems and a system's C capacity because recovery from previous disturbances and/or altered environmental conditions can take decades or centuries (e.g., tillage; Smith, 2014). This may underlie observations of grasslands acting as strong C sinks (Soussana et al., 2007). The long-term trajectory (e.g., gains or losses) of C in an ecosystem can be inferred through a comparison of its current C storage at present (XP) with its C capacity (Fig. 1a). It is important to note that the factors influencing C capacity – NPP and C residence time – are constantly changing, and if these changes cause mismatches between present C and C capacity, this will likely alter long-term C trajectories (Fig. 1b). Alternately, C trajectories where present C is far below capacity may be less vulnerable to global change scenarios if present C remains below future capacity (Fig. 1c). Therefore, we suggest that the proportion of C capacity that is currently present in ecosystems (hereafter termed C saturation – CSAT) may be used as an indicator of how vulnerable C pools are to future changes in environmental drivers.
Table 1Focal terms, descriptions, and calculation methods used in this study.
Geographic patterns of C capacity depend on how its components (NPP and C residence time) vary across ecosystems and environmental gradients. There is robust evidence showing patterns of aboveground net primary productivity (ANPP) along gradients of mean annual precipitation (MAP; Sala et al., 1988, 2012; Burke et al., 1997; Huxman et al., 2004; Maurer et al., 2020). Yet, root : shoot ratios may be greater in drier ecosystems (Schenk and Jackson, 2002; Zhou et al., 2009; Mokany et al., 2006; Wilcox et al., 2016; Hu et al., 2022), which may result in shallower relationships between MAP and total NPP. Biomass turnover is associated with C residence time and has been shown to be an important part of biogeochemical responses to changes in environmental conditions (De Kauwe et al., 2014). Patterns of turnover of plant biomass have been linked with numerous drivers in grasslands, including average temperature (Gill and Jackson 2000), precipitation (Yahdjian et al., 2006), tissue quality (Adair et al., 2008), microbial and fungal decomposer communities (Williams and Rice, 2007; García-Palacios et al., 2016), disturbance (Lorenz and Lal, 2018), and often with interactive effects (Bontti et al., 2009). Yet, our understanding is often clouded by abundant contingencies associated with these patterns, effectively limiting our ability to predict which ecosystems will continue to sequester or release C.
Here, we endeavor to generate process-based understanding about how and why C inputs (e.g., NPP) and losses (C turnover) differ among grassland ecosystems and then use this understanding to identify grasslands where C losses may occur in the future. Integration of data and models (i.e., data–model fusion) is a powerful approach that allows for improved model performance and better estimations of difficult-to-measure ecological processes and properties (Chen et al., 2010; Fer et al., 2021). Here, we use data–model fusion to (a) assimilate C pool and flux data from six US grassland sites with a process-based ecosystem model (see methods for in-depth description of the model) to estimate primary C inputs (NPP), C residence time, and C saturation; and (b) compare present C – the sum of soil and vegetative C – with C capacity to quantify what proportion of C capacity was currently present in each of these ecosystems. With this approach, we address the following questions and predictions:
-
How do NPP, C residence time, and present C vary across gradients of MAP and MAT? We predict that NPP should be primarily related to precipitation, since much previous work has shown strong water limitation in grasslands (Sala et al., 1988; Huxman et al., 2004; Maurer et al., 2020), and C residence time will be related to both temperature and precipitation due to strong limitation of these factors on microbial activity.
-
How sensitive is C capacity to turnover rates of different C pools? We predict that changes in turnover rates within slower C pools will have larger effects than faster C pools.
-
Is the amount of C present in any of these systems close to their C capacity? We predict that cooler and drier ecosystems will be further from their C capacity. Ecosystems with low moisture and colder temperature have lower productivity and slower turnover of C pools, both of which can slow the rate that present C approaches C capacity.
Addressing these questions and predictions will provide an initial perspective on how much these key C attributes vary spatially, as well as identify regions and ecosystems that are vulnerable to C loss and land areas that should be high priority for future research and management efforts.
2.1 Site descriptions
We conducted this study at six US grassland sites spanning climatic gradients of mean annual precipitation (MAP) and mean annual temperature (MAT; Table 2). Data collection sites were set up and maintained as part of the Extreme Drought in Grasslands Experiment (EDGE) and represent the major grassland types within the central United States: desert grassland (SBK), shortgrass prairie (SBL, CPER), northern mixed-grass prairie (HPG), southern mixed-grass prairie (HAR), and tallgrass prairie (KNZ). All sites were ungrazed for at least 10 years before the start of data collection, yet the sites did vary in the length of time between the first year of our measurement and when they were last grazed (SBL and SBK: 39 years, CPER: 15 years, HPG: 10 years, HAR: 9 years, KNZ: at least 30 years). All sites except KNZ were not frequently burned, but KNZ was burned annually to reflect common management in this region (Knapp et al., 1998; Freckleton et al., 2004). See Table 2 and Supplement S5 for more information about these sites.
Table 2Site characteristics of each of the six grassland sites in this study.
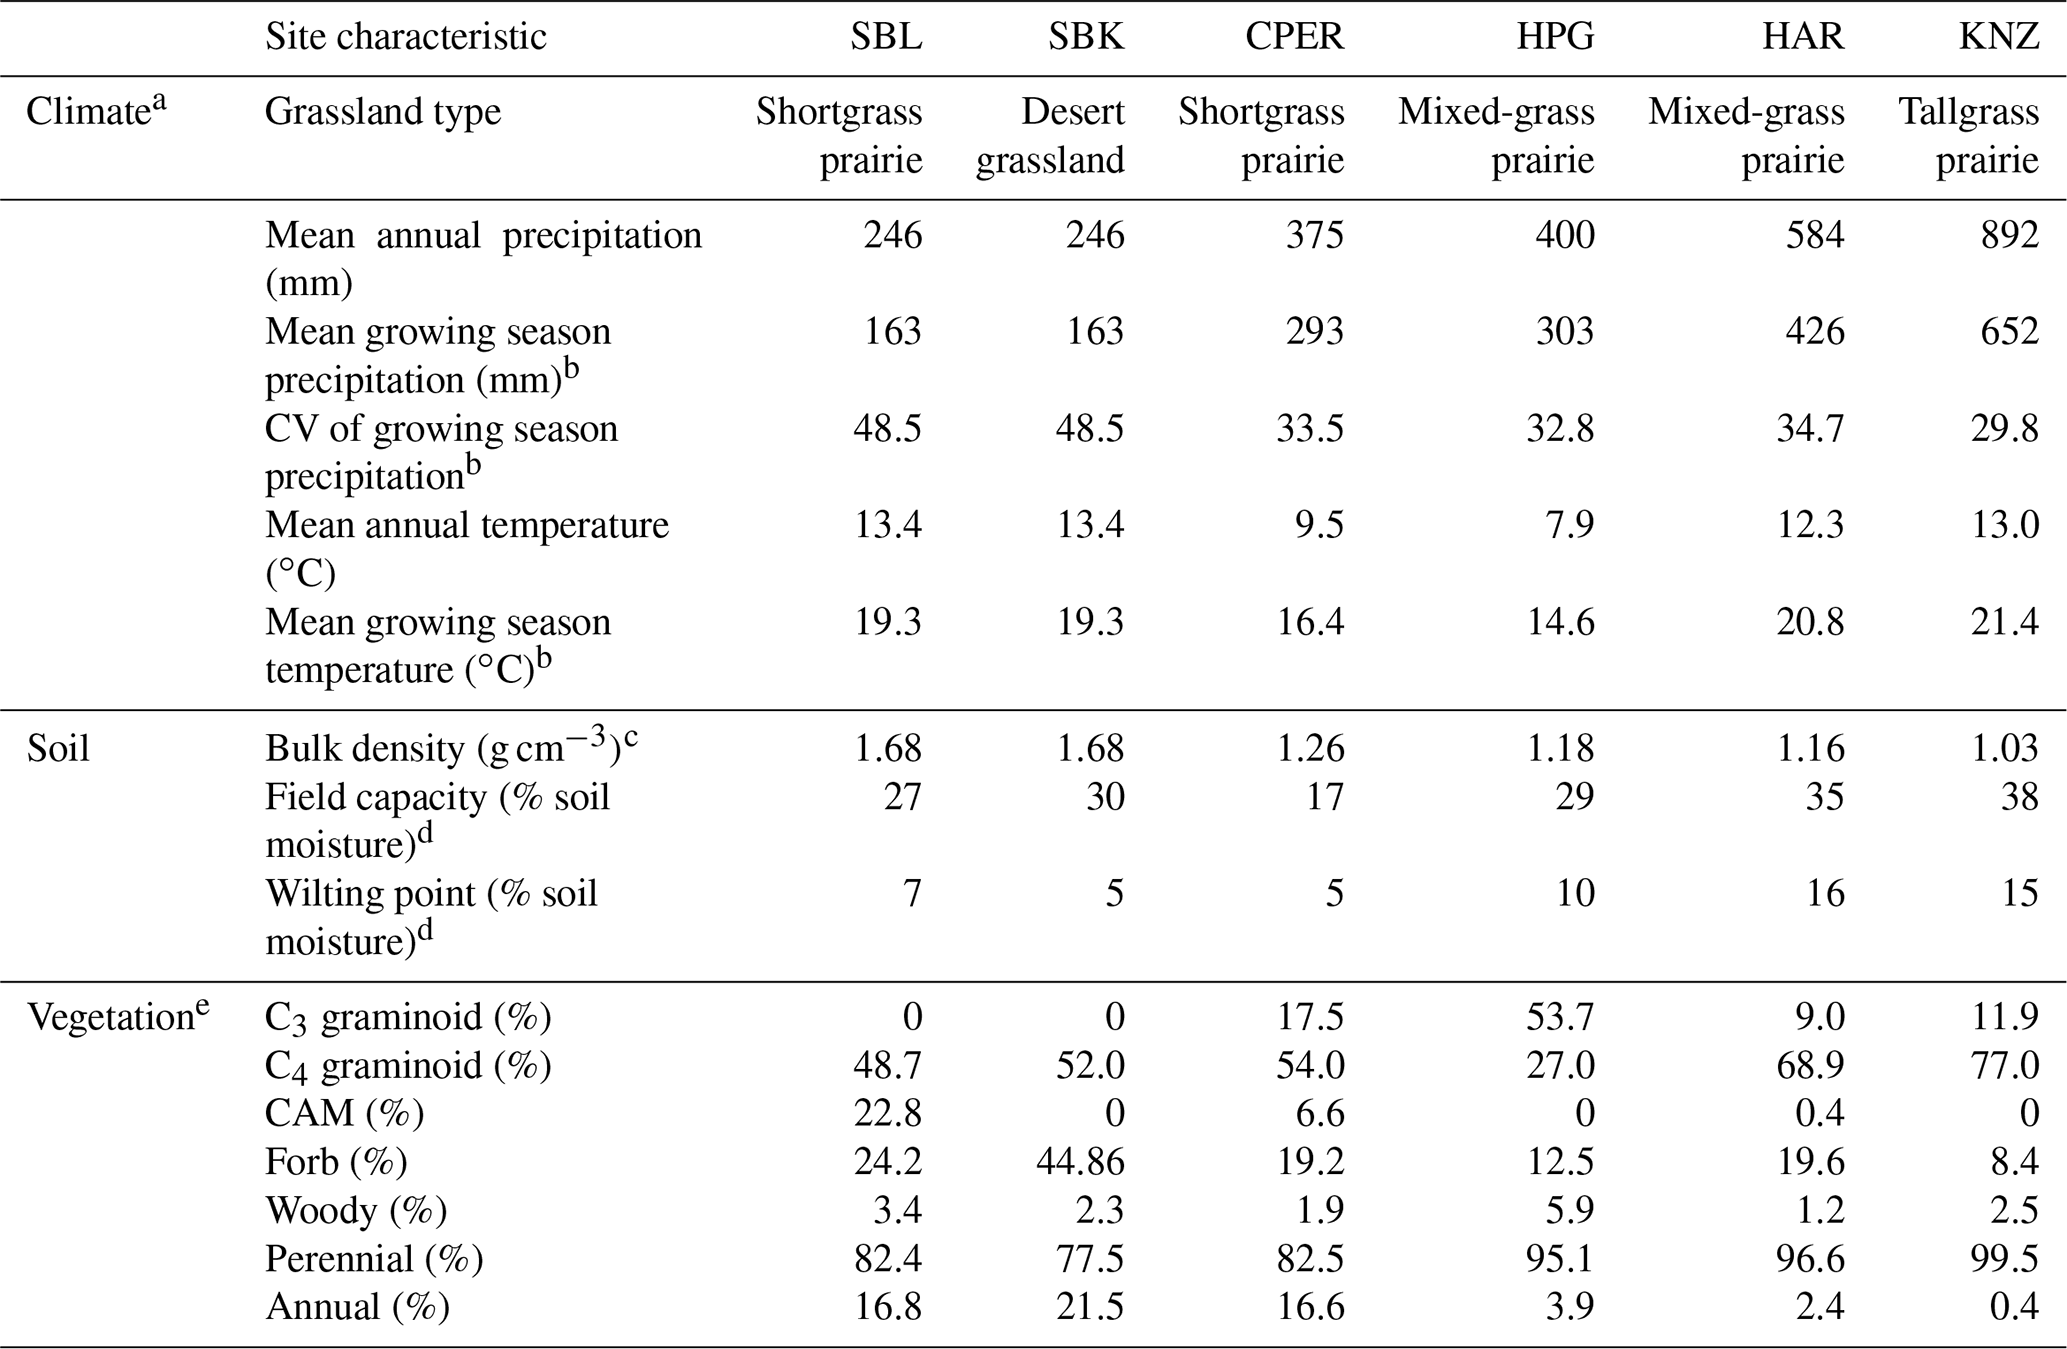
a Climate characteristics are from 1982–2012 weather data, obtained from Knapp et al. (2015). b Growing season was defined as April–September for CPER, HPG, HAR, and KNZ and as April–October for SBL and SBK. c Bulk density data obtained from measurements taken at each site in 2015. d Estimated using hourly soil moisture data from 2012–2013 in SBL and SBK and from 2013–2015 in CPER, HPG, HAR, and KNZ. e Estimated from plant species composition measurements taken during the 2012–2013 growing seasons at SBL and SBK and during the 2014 growing season at CPER, HPG, HAR, and KNZ.
2.2 Sampling design
For this study, we used measurements of aboveground net primary productivity (ANPP), belowground net primary productivity (BNPP), root standing crop biomass, vegetative litter biomass, soil C, volumetric soil moisture, soil temperature, soil CO2 efflux, plant species abundance, soil bulk density, and hourly meteorological data. Most of these data were collected from control plots within experimental infrastructure, which is a randomized block design having 10 blocks each containing three treatments: one control and two drought treatments. For the purposes of this study, we only use control data from the ten 6 m2 control plots at each site. See Supplement Sect. S3 for additional details about sampling regimes.
2.3 Estimating GPP and NPP
To generate gross primary productivity (GPP) and net primary productivity (NPP) estimates, we operated the grassland version of the Terrestrial Ecosystem Model (TECO; Weng and Luo, 2008; Shi et al., 2015), which has been shown to produce C flux estimates that match observations well in US grassland ecosystems (Shi et al., 2014). TECO is a process-based ecosystem model that has four major sub-models to simulate canopy photosynthesis, plant growth (allocation and phenology), soil water dynamics, and soil carbon turnover based on weather data and site-level soil characteristics (Fig. S1 in the Supplement). To run the model, we used hourly air temperature, relative humidity, vapor pressure deficit, precipitation, and incident photosynthetically active radiation data from nearby weather stations (see Supplement S3 for additional details about collecting and cleaning meteorological data). GPP and NPP were generated for the main analyses in this paper using TECO for 2012–2014 at SBL and SBK and for 2013–2015 at the other four sites. Daily GPP estimates were subsequently used to drive the C sub-model (Sect. 2.4), and annual NPP estimates were used to calculate C capacity (Sect. 2.5). The mismatch in time frame among sites was due to data availability.
Formal validation of the vegetation components of the model was conducted at each of the six sites. This was done by calibrating the model for each site based on measured aboveground and belowground plant growth, soil texture, site-level field capacity, and wilting point. Then, model spin-up of 500 years (all pools stabilized at each site between 200 and 400 years) was conducted, and output from 2014–2017 was compared with observations at each site. Overall, cross-site mean primary production estimates from the model matched empirical observations very well (aboveground biomass: R2=0.99, RMSE 18.0; belowground NPP: R2=0.94, RMSE = 23.5). Interannual variability in production from the model was less well correlated with empirical observations, although model predictions most often fell within 1 standard deviation of empirical observations. (See Supplement Sect. S4 for additional model validation discussion, figures, and tables.)
2.4 Optimizing C sub-model parameters
Within the C turnover sub-model in TECO (Fig. S1), parameters for C turnover rates, C transfer rates, and environmental scalars (Table S1 in the Supplement) were estimated for each site using data assimilation techniques (Xu et al., 2006; Shi et al., 2015). Compared with benchmarking, this is a more powerful approach for improving model parameterization, but it often requires sufficient temporal resolution and richness of data describing multiple components of modeled variables to be successful. We used estimated daily GPP, soil moisture, and soil temperature to operate the C sub-model within the data assimilation procedure to optimize the following sets of parameters: (1) six C turnover parameters associated with leaf, fine root, litter, fast SOM, slow SOM, and passive SOM carbon pools; (2) seven C transfer coefficients controlling the proportion of C turnover transferred to other C pools; and (3) two environmental scalars that control C turnover rates based on soil moisture and soil temperature (Table S1). We used a Markov chain Monte Carlo method with Metropolis–Hastings algorithm to optimize these parameters. Starting parameter values were obtained from previous studies (Xu et al., 2006; Shi et al., 2015; Zhou et al., 2012) and were allowed to vary uniformly between biologically reasonable bounds (Table S1). Within each iteration, the current set of parameters was tested against a new set of parameters, generated based on the current set of parameters using a step size of 15 with the Metropolis–Hastings algorithm. Both the current and new set of parameters were used to run the C sub-model with daily GPP estimates (Sect. 2.3), daily measured soil moisture, and daily measured soil temperature from each site. Model output from each of these two runs was then compared with the observations of aboveground vegetation biomass (annually), root standing crop (annually), plant litter (annually), soil C (single measurement), and surface CO2 efflux (daily). Model performance using the new set of parameters was assessed against Metropolis criterion to determine whether the new set of parameters should be kept or discarded. This was done for 360,000 iterations for each of four chains within each site to ensure convergence of parameter estimates. Gelman–Rubin (GR) values were mostly <1.1, with the exception of a few parameters having 1.2 or 1.3 GR values at HPG and HAR (Table S2). All parameters where GR values were high did not converge and drifted slowly over iterations. This resulted in estimates of these parameters close to the midpoint of the parameter bounds and large uncertainty. To account for this, uncertainty in parameter estimates was incorporated into C residence time estimates via bootstrapping methods (see below). Cross-correlations were calculated for all parameters at each site (Table S3). Maximum likelihood estimates (MLEs) and uncertainty (95 % confidence intervals) were calculated for each parameter at each site by assessing normal, log normal, or Weibull distributions depending on the magnitude and direction of skew (Figs. S2–S4, Table S2).
2.5 Estimating C residence time, C capacity, and C saturation
We calculated ecosystem C residence time (τE) following Luo et al. (2017):
where ξ(t) represents the environmental scalar determined by soil moisture and soil temperature at time step t, A is a matrix of C transfer coefficients, K is a 6×6 diagonal matrix representing rates of C loss per day from each of the six C pools, B is a 1×6 matrix representing the allocation fractions of GPP to each of the six C pools:
In Eq. (2), FT is the effect of soil temperature on microbial decomposition rates at time t: , where Q10 is a constant parameter and T is soil temperature. FW is the potential effect of soil water content on microbial decomposition rates at time t: (mscut-W(t)), where mscut is a constant parameter representing the soil water content (W) below which microbial decomposition becomes limited. If W is greater than mscut, FW=1. The impact of FT and FW scalars on ξ are dependent on one another (i.e., FW will limit ξ in dry conditions even if soil temperatures lead to a large FT). In Eq. (3), fi←j represents the fractions of C turnover entering pool i from pool j. In Eq. (4), c1−6 represents the amount of carbon lost from pools 1–6 per day, where pool 1 is aboveground plant biomass, 2 is belowground plant biomass, 3 is fine litter biomass, 4 is active (fast) soil organic matter (SOM), 5 is slow SOM, and 6 is passive SOM. In Eq. (5), XANPP and XBNPP are the fractions of GPP allocated to aboveground and belowground vegetative pools, respectively. For each site, XANPP and XBNPP were estimated from observed ANPP : BNPP ratios, and data assimilation was used to estimate c1−6, fi←j, Q10, and mscut parameters. To generate uncertainty surrounding τE, we bootstrapped 1000 parameter sets from the Markov chain Monte Carlo (MCMC) and obtained the MLE and 95 % confidence intervals from the resulting distribution of τE estimates.
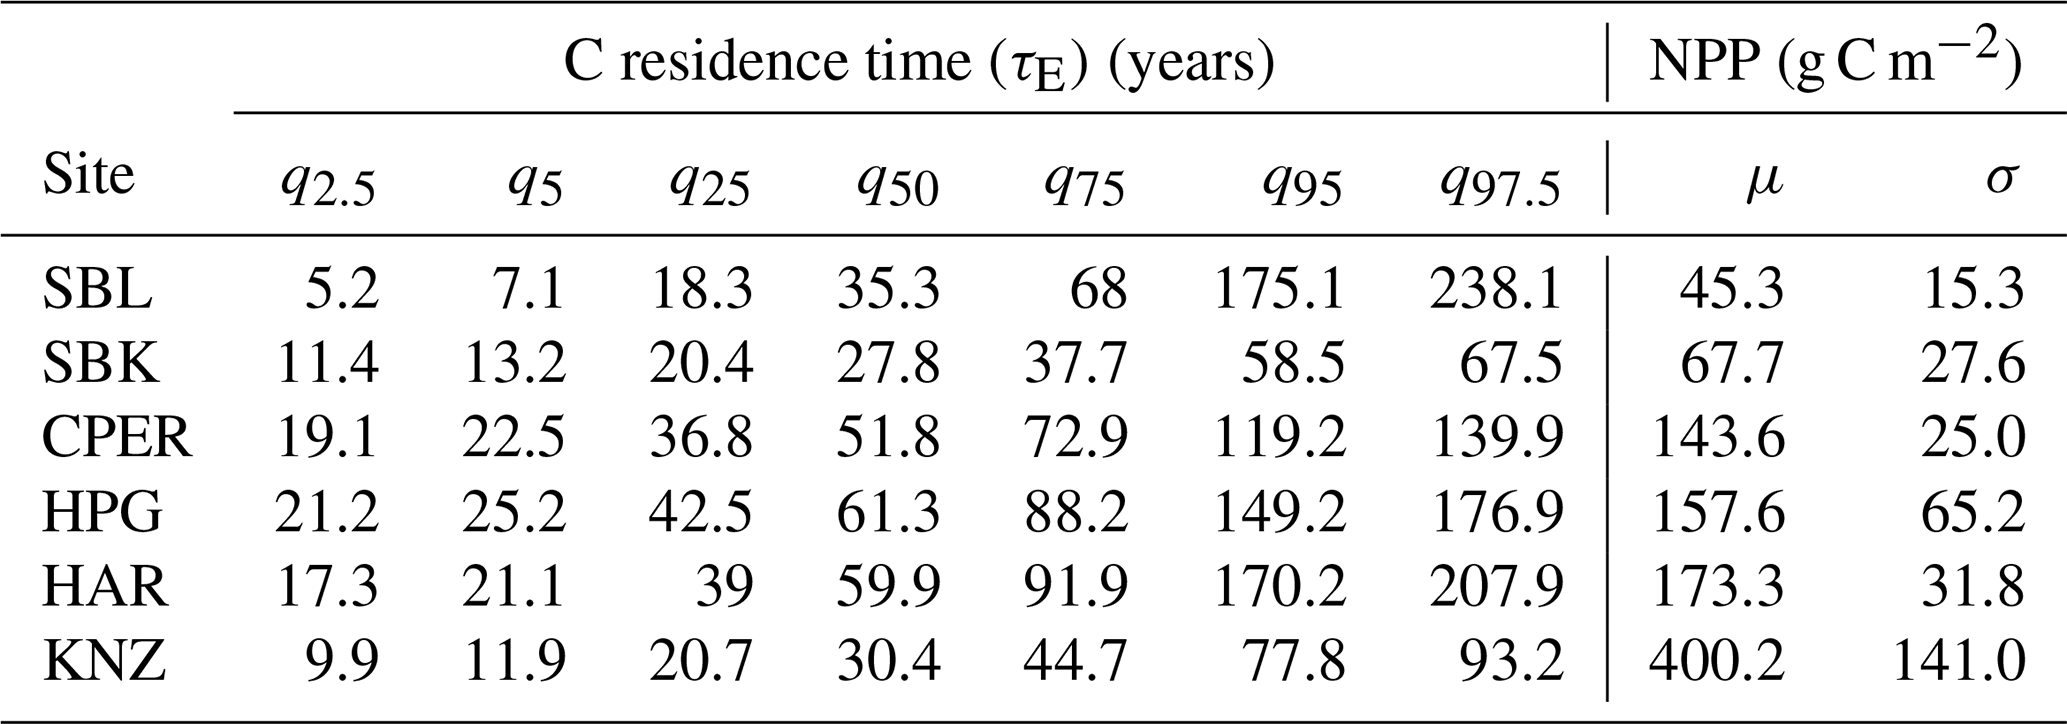
Table 3Estimates (mean (μ) and median (q50)) and uncertainty (standard deviation (σ) and other quantiles) of NPP and ecosystem carbon residence time at all six sites.
C capacity (XC) was calculated following Luo et al. (2017) as
where NPP is net primary productivity of a site, obtained via TECO simulations, and τE is the MLE of the distribution of bootstrapped τE values. C capacity estimates were obtained by combining the bootstrapped iteration of C residence estimates with 1000 randomly sampled values of NPP using the mean and standard deviation of NPP across years. This allowed us to propagate the uncertainty present in both NPP and C residence time to C capacity estimates. The 1000 bootstrapped iterations were then used below in the calculation of C saturation.
At KNZ, NPP in Eq. (6) consisted only of the belowground component because annual fire removes all aboveground plant material each spring. We recognize the limitation of using 3 years of NPP data to estimate XC, yet we believe it is important that NPP and τE estimates are derived from the same time periods, and the data necessary to estimate τE were only available for 3 years. Weather within the 3 focal years was comparable to long-term averages at most of the sites (Fig. S5), although precipitation was greater than the long-term average at HPG, lower than the long-term average at HAR, and air temperatures were warmer at SBK and SBL in 2012–2014. Standard deviation of C residence time (CSD) was calculated as the standard deviation of the 1000 bootstrap iterations.
The level of C saturation (CSAT) represents the percentage of C capacity that is represented by present C, calculated as
where CS is the mass of C in the soil standardized by area, CA is the observed aboveground biomass × 0.45, and CB is the observed root biomass,× 0.45, also standardized by area. Combined, CS, CA, and CB make up present C from 0–10 cm in the soil. Soil C measurements from 0–10 cm in the soil were then extrapolated to 0–20 cm to match up with the depth of BNPP observed and used to calibrate the model. This was done by extracting soil C data along a depth profile (0 to >1 m depth) from the international soil carbon network (ISCN; Nave et al., 2017) in nearby areas having similar cover types and land management regimes (Table S4). These depth profiles were used to calculate the proportion of soil C across depths using a beta distribution described by Jobággy and Jackson (2000) (Fig. S7). Then, each soil C measurement from 0–10 cm was extrapolated along this curve to estimate the amount of soil C from 0–20 cm (Fig. S7). The mean and standard deviation of present C among replicates within a site were used to generate 1000 random draws from a normal distribution. We then combined these random draws with the bootstrap iterations from Eq. (6) to propagate the uncertainty of C capacity (XC) into the estimate of C saturation. This means that all levels of uncertainty, from individual parameter estimates (Figs. S2–S4) all the way through to present C, are incorporated into our estimates of C saturation.
We conducted variance partitioning to determine the amount of cross-site variance in C capacity that was driven by variation in NPP versus C residence time. Since only BNPP was incorporated into the XC calculation for KNZ, we performed this analysis both with and without KNZ (Fig. S6).
2.6 Sensitivity analyses
For each parameter used to calculate C residence time, we varied the parameter while keeping all other parameters constant at their MLE and recorded the resulting C residence time. We did this for 20 intervals ranging from the minimum to maximum parameter values shown in Table S1. We also wished to determine the impact of each parameter value at each site as estimated via data assimilation. To this end, we shifted each parameter from its default value (Table S1) to the MLE value obtained from data assimilation (Table S2) – holding all other parameters at their default values – and observed the resulting effect on C residence time (Fig. 3g–l).
2.7 Statistical analyses
For regression analysis comparing NPP, C residence time, and present C across gradients of MAP and MAT, all variables were centered by their mean and scaled by their standard deviation, allowing for comparable slope values. Additional site-level characteristics (bulk density, grass : forb, C3 : C4, annual species abundance) were combined with climate data using partial regression, and adjusted R2 values were assessed to test whether climate–NPP or climate–C residence time relationships were being driven by other site characteristics (vegan package; Oksanen et al., 2016). Bayesian data assimilation and bootstrapping analyses were run using custom scripts; linear regression models were run with the lm() function. All analyses were conducted in R (R core team, 2022).
3.1 Net primary productivity (NPP) and present C (XP)
Estimates of NPP varied across sites from 45.3 g C m−2 yr−1 at SBL to 400.2 g C m−2 yr−1 at KNZ (Table 3). The standardized full NPP model (NPP ∼ MAP + MAT) was significant (, P<0.01) and explained 96 % of the cross-site variation in NPP estimates (adjusted R2=0.96). Within the model, MAP was strongly correlated with NPP across sites (, P<0.01), while the relationship with MAT was not significant (, P=0.50) (Fig. 2). The non-standardized relationship between MAP and NPP was of the form NPP = 0.53 × MAP − 51.4. We looked for collinearity of MAP with soil bulk density, grass : forb, C3 : C4, and annual species abundance using partial regression analysis. We found that MAP was still a significant and strong predictor of NPP when these other variables were accounted for (Table S5). Similarly, we found a weak positive relationship between present C and MAP (, P=0.08, adjusted R2=0.54) and no relationship between MAT and present C (Fig. 2). The non-standardized relationship between MAP and present C was of the form × MAP.
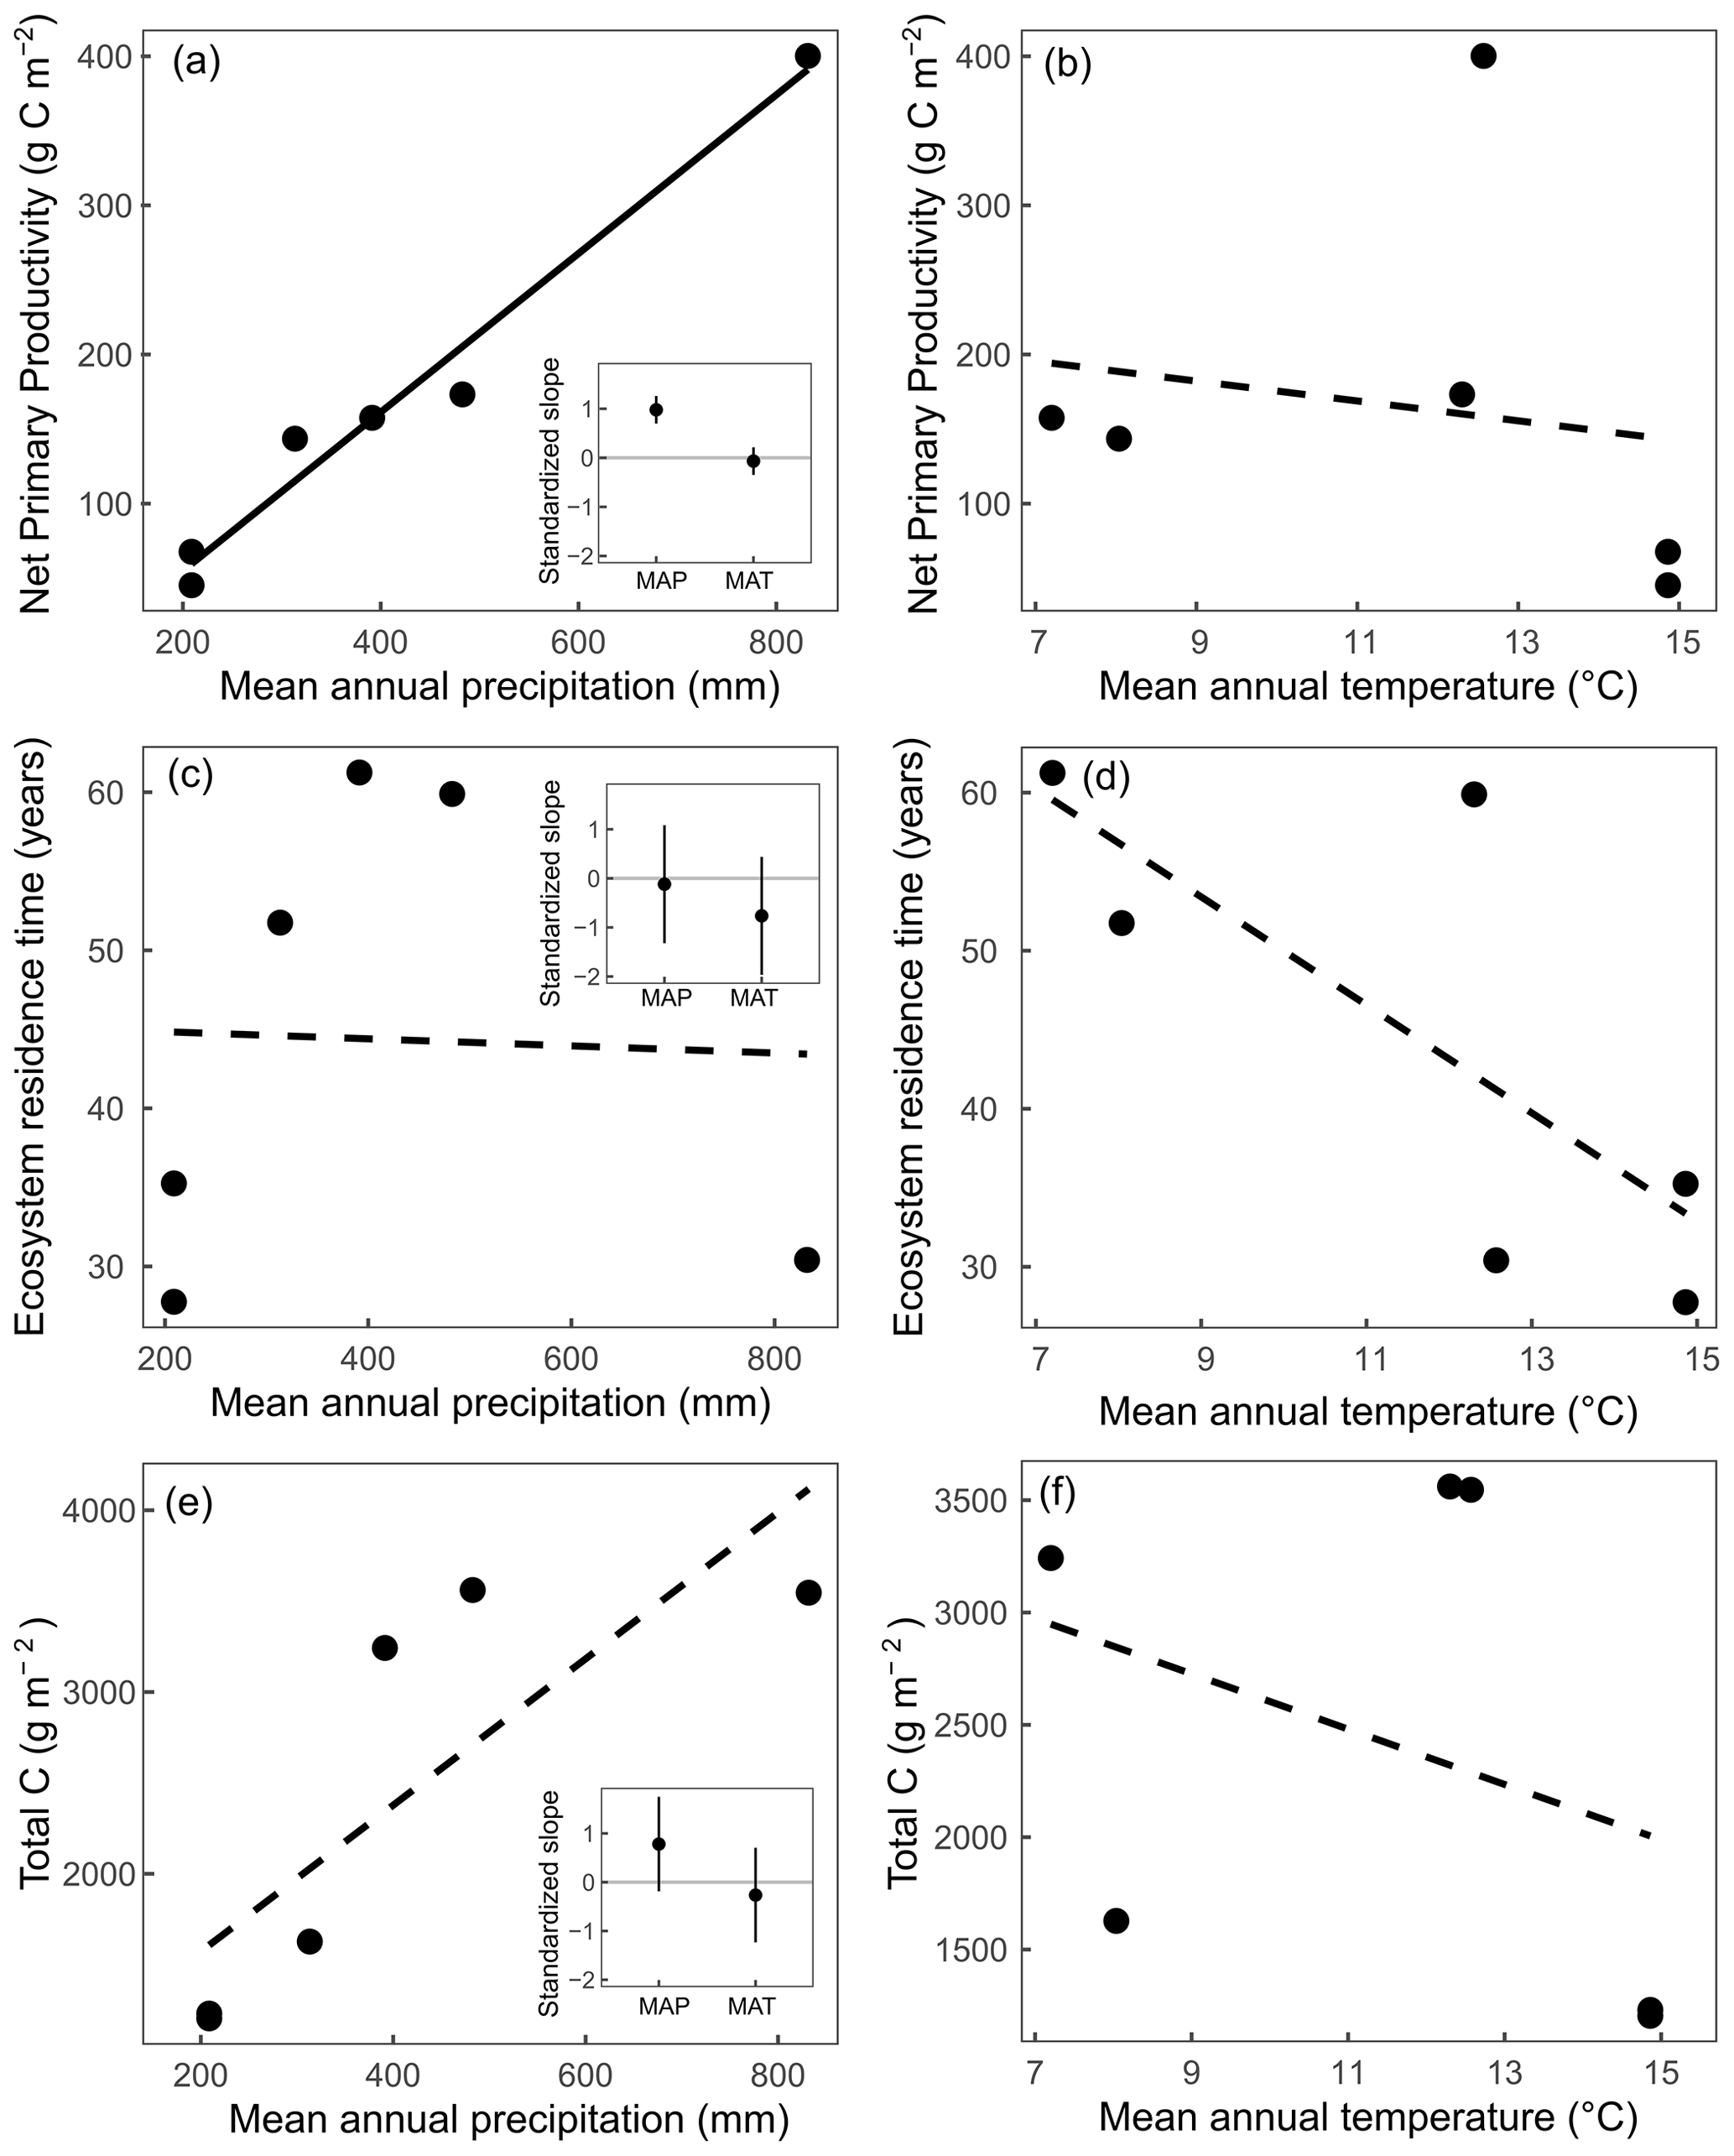
Figure 2Relationships between mean annual precipitation (MAP) and mean annual temperature (MAT) at a site with net primary productivity (a, b), ecosystem C residence time (c, d), and total C in vegetation and the top 20 cm of soil (e, f). Insets represent the standardized slopes with MAP and MAT with error bars representing 95 % confidence intervals, and solid regression lines represent slopes significant at α=0.05. Linear relationships were compared with log-linear relationships in all cases, and linear relationships represented the best fit in all scenarios.
3.2 Ecosystem carbon residence time (τE)
Estimates of C residence time were obtained by calculating the 50th percentile of the log-normal distribution of bootstrapped C residence time values. These estimates ranged across sites from 27.8 years at SBK to 61.3 years at HPG (Table 3). The standardized full C residence time model () was not significant (, P=0.27). Within the full model, neither MAP (, P=0.77) nor MAT (, P=0.14) were correlated with C residence time across sites (Fig. 2b).
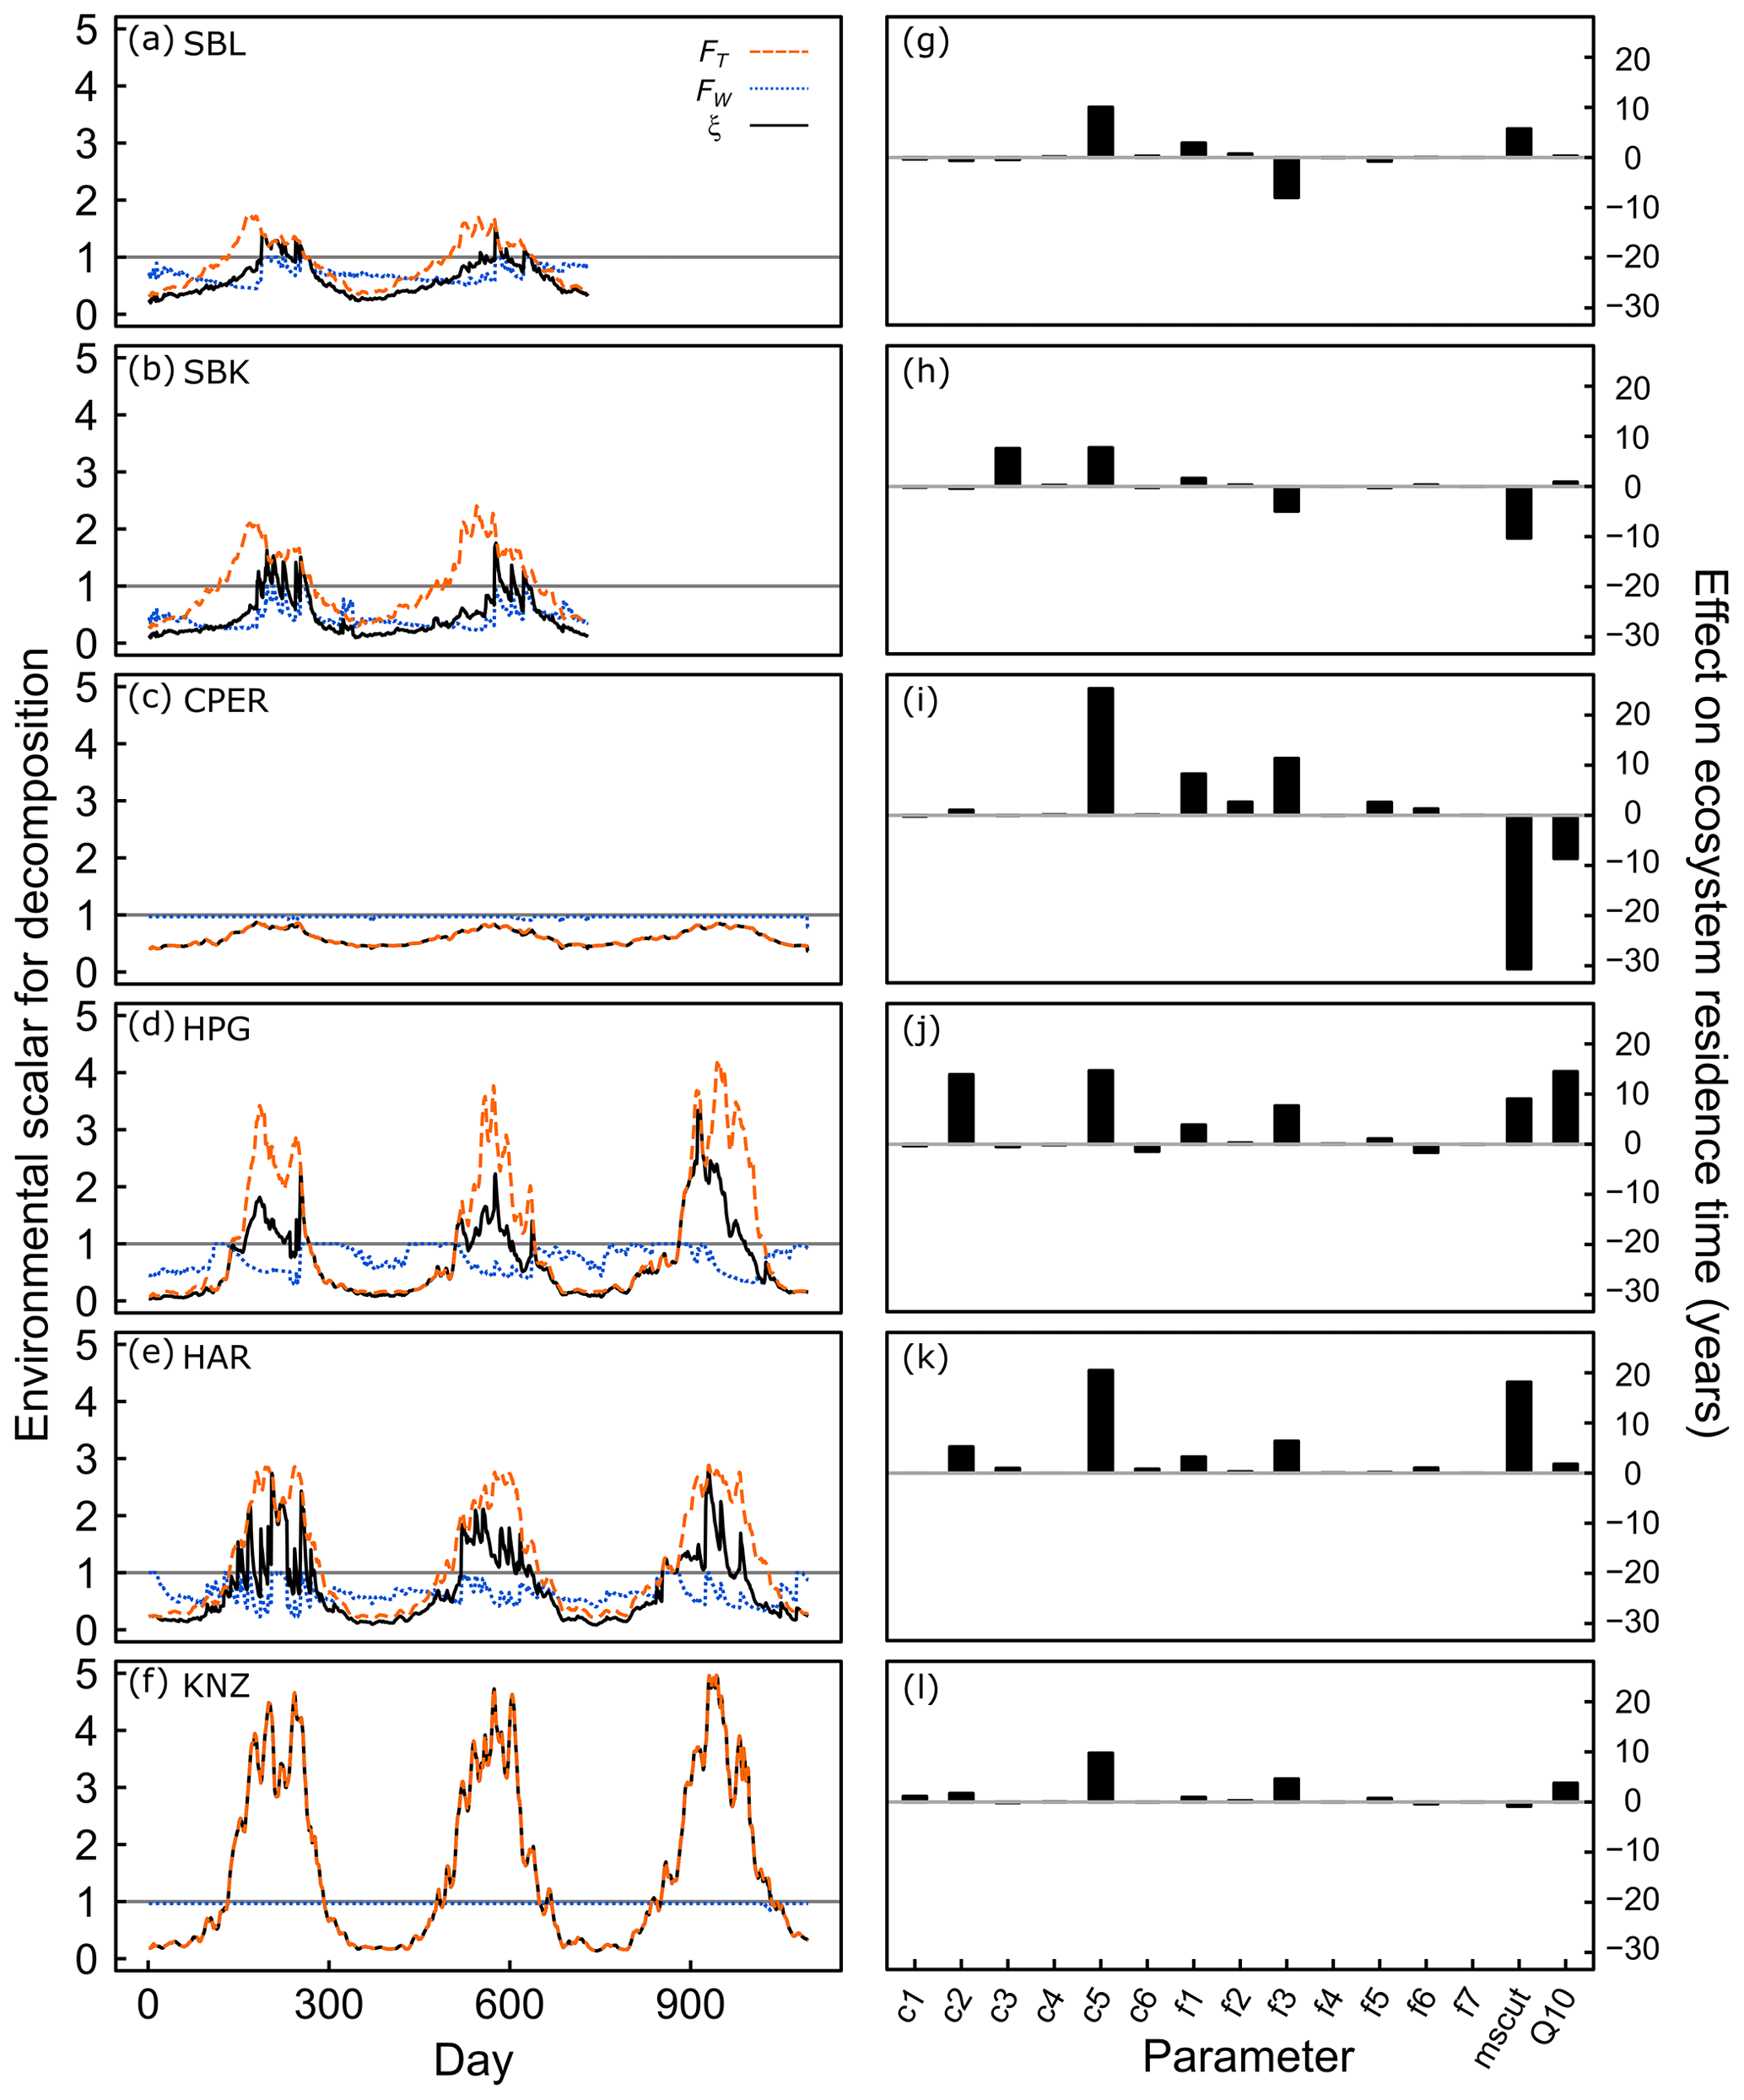
Figure 3Environmental scalars for decomposition rates at six grassland sites (a)–(f), and impact of individual parameter estimates on ecosystem carbon residence time (g)–(l). In (a)–(f), values less than 1 represent soil conditions limiting decomposition, while values greater than 1 represent acceleration of decomposition due to soil conditions. Dashed orange lines represent the temperature scaling effect (FT), which is based on the site-estimated value of the Q10 parameter and daily soil temperature data. Dotted blue lines represent the moisture scaling effect (FW), which is based on the site-estimated value of the mscut parameter and daily soil moisture data. Solid black lines represent the product of the temperature and moisture scalars (ξ), which is the overall environmental scalar that controls decomposition rates in the model. In (g)–(l), parameters were shifted one at a time from their mean parameter space (baseline parameter) to the parameter estimates obtained from data assimilation, and the resulting effect on ecosystem carbon residence time is shown. This represents the inherent effect of each model parameter on τE independent from soil moisture or temperature. Panels correspond to different sites: (a), (g) is the Sevilleta National Wildlife Refuge blue grama grassland; (b), (h) is the Sevilleta National Wildlife Refuge black grama grassland; (c), (i) is the Central Plains Experimental Range; (d), (j) is the High Plains Grasslands Research Station; (e), (k) is the Hays Agricultural Research Center; and (f), (l) is the Konza Prairie Biological Station. Transfer parameters (fx←y) dictate the proportion of C turnover in pool y transferring to pool x: , , , , , , and .
3.3 Soil moisture and temperature effects on C residence time
All sites exhibited a cyclical pattern of soil moisture and temperature effects on C turnover rates (denoted ξ), with higher ξ during the growing season due to warmer temperatures (Fig. 3, black lines). ξ during the growing season was >1 for all sites except CPER, meaning that C turnover rates were increased in the data-driven model, rather than limited by soil conditions. At SBL and SBK (Fig. 3a, b), temperature constraints (FT; Fig. 3, dashed orange lines) on ξ were >1 for much of the growing season, yet ξ was limited by soil moisture constraints (FW; Fig. 3, dotted blue lines) outside of the monsoon season. Only when monsoon rains removed soil moisture limitations did ξ generally persist above one. At CPER (Fig. 3c), ξ was not limited by FW. Yet, FT was <1 throughout the year due to the low Q10 value estimated for CPER (Table S2). FT was much greater than one during the growing season at both the mixed-grass and tallgrass prairie sites (Fig. d–f), but FW limited ξ at both mixed grass prairies. ξ was high at KNZ due to a lack of FW effect at the site, which was a result of both high soil moisture content throughout the growing season and a relatively low estimated mscut parameter value (Table S2).
3.4 Sensitivity of C residence time to model parameters
We performed two sensitivity analyses to (1) identify variables in the model with potential to contribute the most to τE (Figs. 4, S10), and to (2) quantify the realized effect of model parameter estimates, obtained through the data assimilation process, on C residence time at each site (Fig. 3). These sensitivity analyses simulated C residence time under a range of parameter values while incorporating daily soil temperature and moisture measurements from each site. We found that C turnover rates of the slow and passive SOM pools (c5 and c6 model parameters) had the potential to have the greatest impacts on C residence time, highlighting the importance of C sequestration in these pools for maintaining C stocks (Figs. 4, S10). C residence time was also sensitive to the mscut parameter, with the effect increasing exponentially until reaching ca. field capacity at each site. In the drier sites (SBL, SBK, and CPER), the effect of the mscut parameter (i.e., the soil moisture percentage at which C turnover begins to be limited) started to increase rapidly around parameter values of 10–15. The steep increase began at greater parameter values (20–25) at the more mesic sites (HPG, HAR, KNZ). The Q10 parameter describes the sensitivity of C turnover to soil temperature, with greater values indicating faster turnover rates at higher temperatures. At the warmer sites (SBL, SBK, KNZ), C residence time was less sensitive to Q10, unless Q10 was very low (ca. 1). Interestingly, higher Q10 values had the potential to increase C residence time at the cooler sites (CPER, HPG). Although Q10 is generally negatively related to C residence time, the form of the Q10 relationship is such that although lower Q10 values result in slower turnover rates at high soil temperatures, they also result in higher turnover rates under cooler temperatures due to their shallower slope. As such, this can lead to a positive relationship between Q10 values and C residence time at cooler sites.
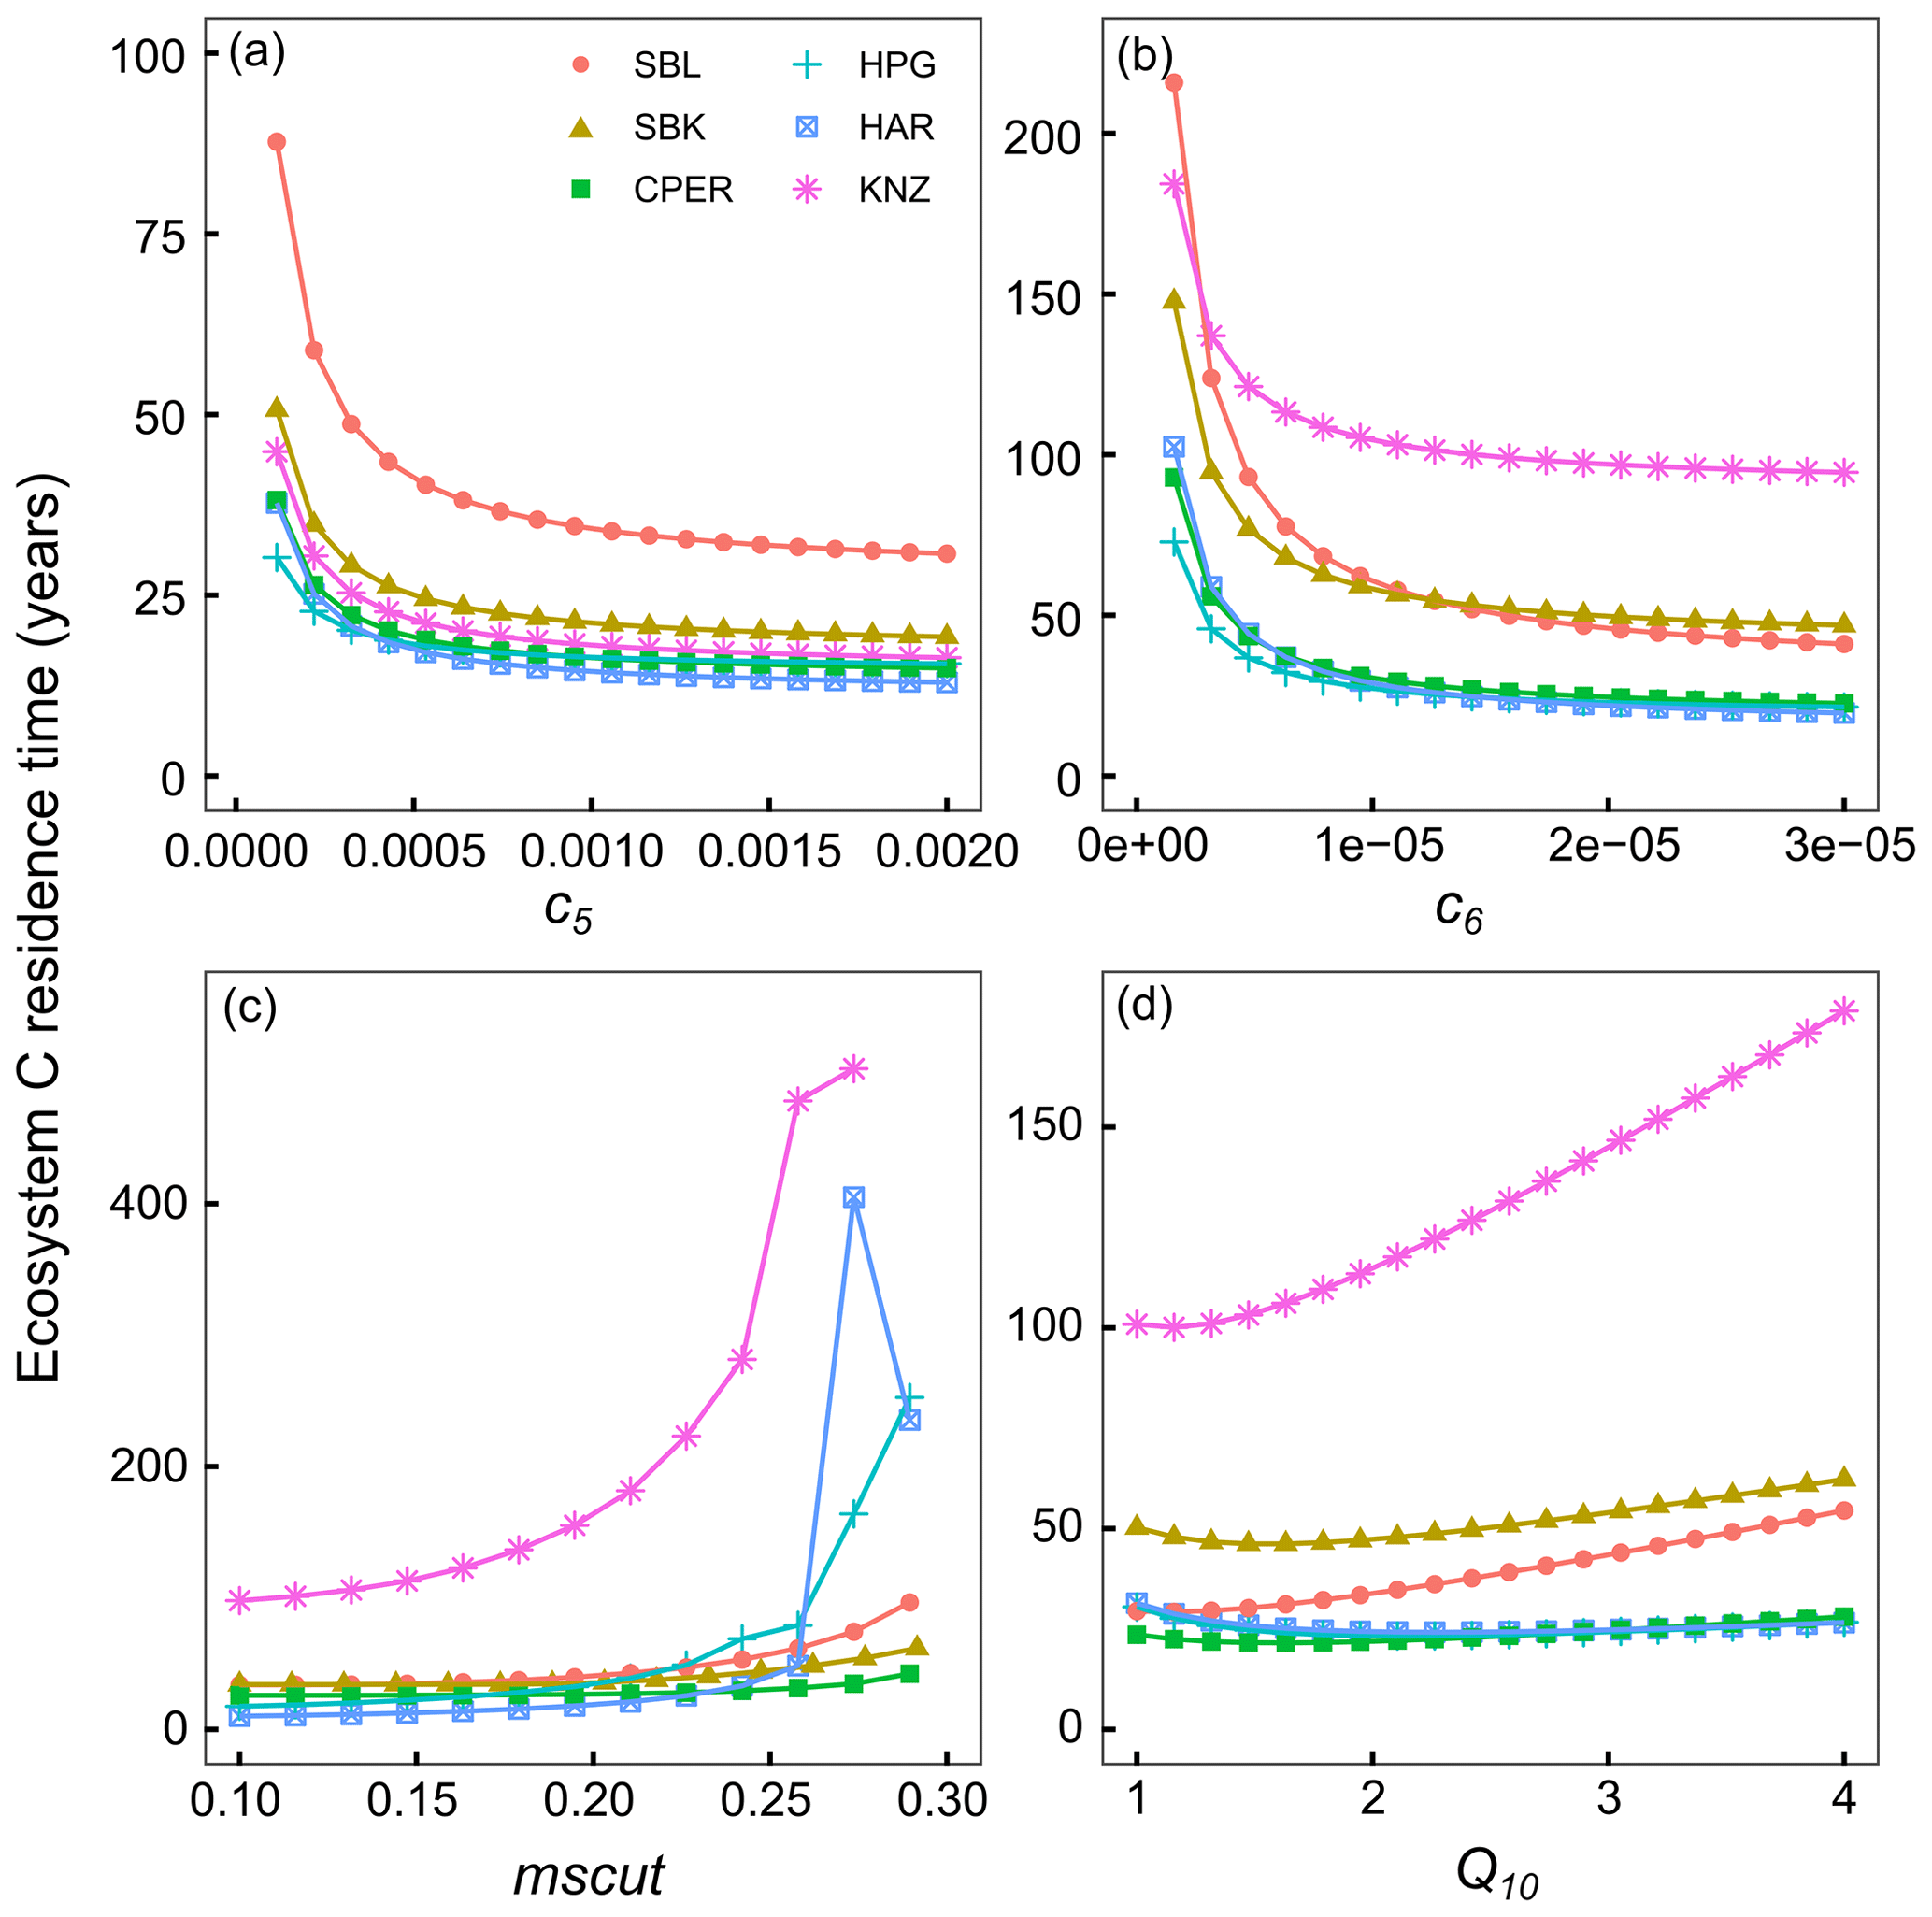
Figure 4Results from sensitivity analysis where ecosystem C residence time was calculated when altering one parameter value at a time. Parameters shown here are the turnover rate of the slow C pool (c5) (a), turnover rate of passive C pool (c6) (b), a parameter-controlling sensitivity of C turnover to soil moisture (mscut) (c), and a parameter-controlling sensitivity of C turnover to temperature (Q10) (d). Colors correspond to different sites: SBL is the blue grama-dominated site at the Sevilleta National Wildlife Refuge, SBK is the black grama-dominated site at the Sevilleta National Wildlife Refuge, CPER is Central Plains Experimental Range, HPG is High Plains Grassland Research Station, HAR is Hays Agricultural Research Station, KNZ is Konza Prairie Biological Station. Ecosystem carbon residence time was often very high at very extreme parameter values, so the y axis was set for clarity.
When we applied the estimated parameters to these sensitivity curves to estimate the actual effect of individual parameters on the C residence time estimates (Fig. 3, right panels), we found that turnover rates of the slow SOM pool increased C residence time greatly compared with starting parameters across all sites (+8 to +25 years). Root turnover had a substantial effect on C residence time at HPG (+14 years) and HAR (+5 years). The transfer proportion from fast SOM to slow SOM had a positive effect on C residence time at CPER, HPG, HAR, and KNZ (+5 to +11 years) and a negative effect on C residence time at SBL and SBK (−5 to −8 years). mscut had opposite effects on C residence time for SBL (+6 years) than SBK (−10 years), while Q10 had minimal effects at both sites. mscut and Q10 had strong negative effects on C residence time at CPER (−31 years and −9 years, respectively), likely due to particularly low mscut and Q10 estimated for that site (Fig. S4) and strong potential for impact of these parameters at CPER (Fig. 4). At the other cool site, HPG, both mscut and Q10 increased C residence time (+9 and +14 years, respectively). At HAR, a high mscut estimate increased C residence time (+18 years), suggesting that C turnover at this site may be particularly sensitive to soil moisture. Q10 estimated at HAR had minimal impact. mscut and Q10 estimates at KNZ had small impacts on C residence time (−1 and +4 years, respectively; Fig. 3).
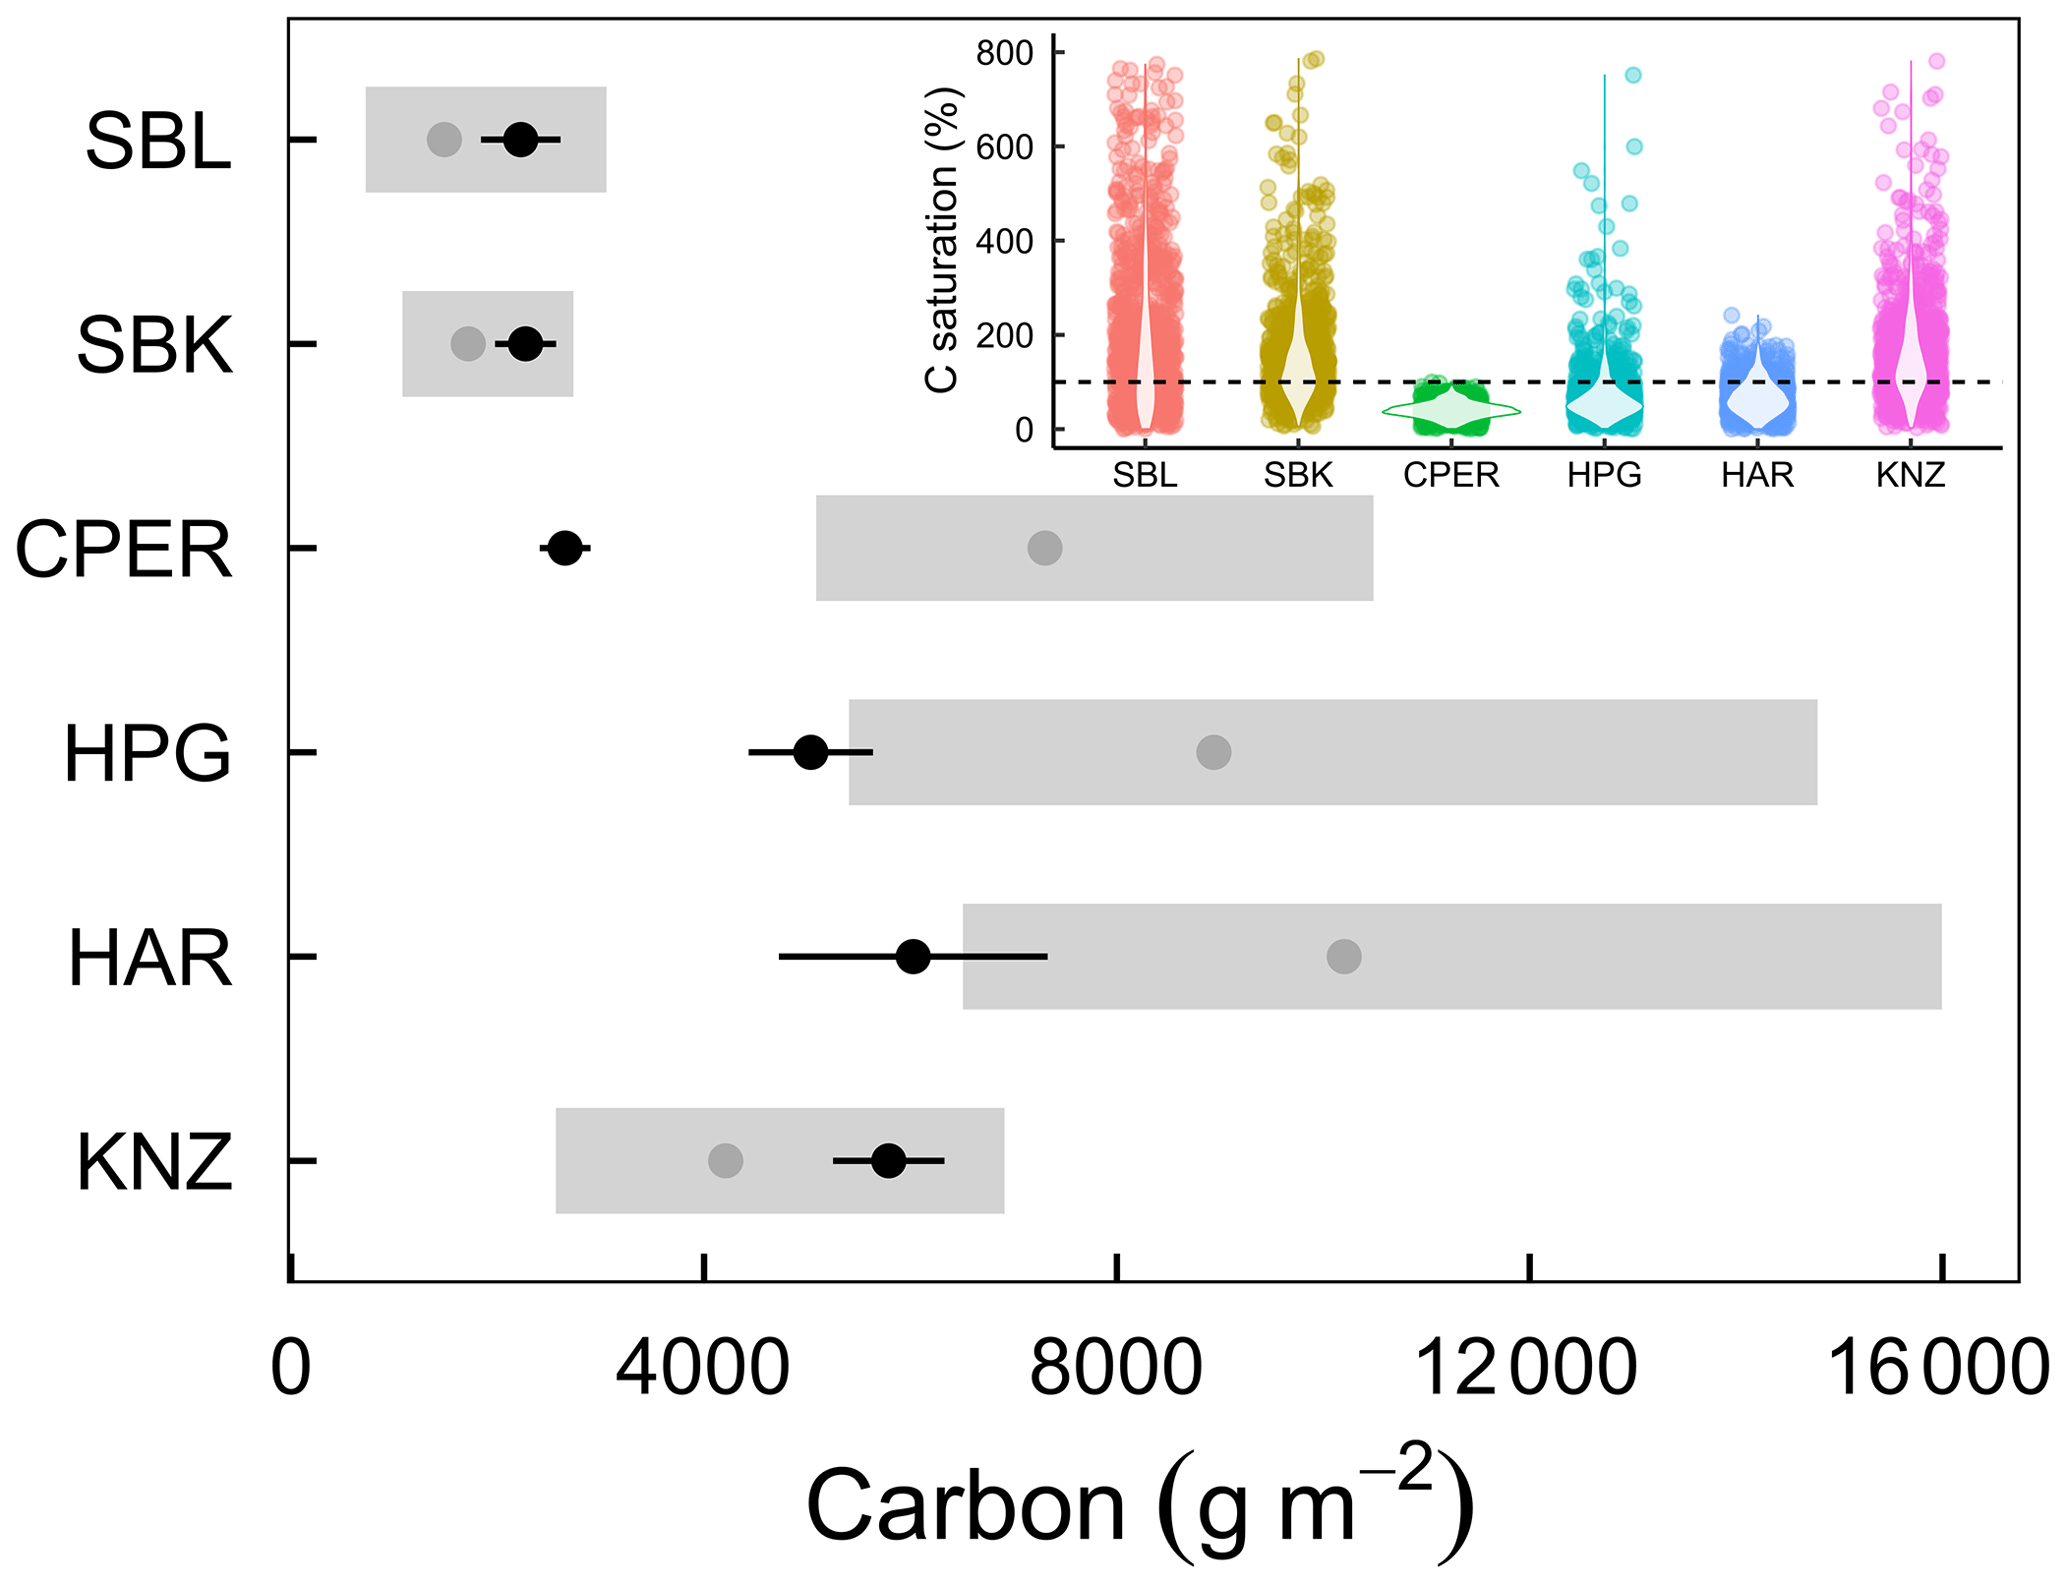
Figure 5Ecosystem C capacity (XC; gray points) and present C (XP; black points) in six grassland ecosystems. Present C was calculated using estimates of soil C from 0–20 cm plus aboveground and belowground vegetative C. Black error bars represent 1 standard deviation around the mean, and gray rectangles represent the 25th and 75th percentiles of the lognormal distribution of C capacity, surrounding the 50th percentile (gray points). Inset: violin plots and bootstrap estimates of C saturation, calculated as present C divided by the product of NPP and ecosystem C residence time. The dashed line shows where present C is equal to C potential.
3.5 Carbon capacity and carbon saturation
Finally, we used NPP and C residence time estimates to calculate C capacity. Cross-site variation of NPP and C residence time were both important for determining C capacity across the six grassland sites (Fig. S6). Median C capacity varied from as little as 1485 g m−2 in SBL to as much as 10 203 g m−2 in HAR (Fig. 5). We estimated C saturation as the percentage of C capacity made up by present C. In the two hot and dry sites (SBL and SBK), we found that C capacity was relatively small and less than present C (Fig. 5), resulting in greater C saturation values (50th percentiles of C saturation lognormal distribution: SBL 148 %, SBK 130 %; Fig. 5, inset). The cooler and/or wetter sites all had greater C capacity values and present C below capacity (Fig. 5), resulting in smaller C saturation values (50th percentiles: CPER 36 %, HPG 56 %, HAR 58 %; Fig. 5, inset). The exception to this was KNZ, the most mesic but frequently burned site with a C saturation value of 137 % (50th percentile; Fig. 5, inset).
Our findings provide insights for the three questions we posed at the start of this study: (1) “how do NPP, C residence time, and present C vary across gradients of MAP and MAT”, (2) “is present C in any of these systems close to C capacity”, and (3) “how does the level of C saturation vary across these grasslands”? Related to our first question, we found general support for the prediction that NPP and present C exhibited positive relationships with MAP, yet found no relationship between ecosystem C residence time and climate or other site-level characteristics. Instead, the cross-site pattern of C residence time was driven by differences in local edaphic environments (soil moisture and soil temperature) as well as inherent differences in turnover rates, which may be indicative of biological or physical differences across sites (Baisden et al., 2013; Mathieu et al., 2015; Doetterl et al., 2015; Zhao et al., 2021). Related to our second and third questions, we found that three of these grasslands had particularly high C saturation values, indicating vulnerability of C to future climate change and a limited ability of these systems to be long-term C sinks. Two of these three grasslands were in hot, dry climates where C turnover rates were high and C inputs through NPP were low. The third grassland (KNZ) was the most mesic and had the highest levels of productivity, yet annual burning at KNZ increased C saturation substantially. Below, we discuss these findings in more detail.
4.1 Relationships of NPP, C residence time, and present C with climate
Abundant research exists showing spatial relationships between ANPP and climate. Sala et al. (1988) was able to explain 90 % of the cross-site variation in averaged ANPP with mean annual precipitation across the Great Plains. Yet, total NPP (ANPP + BNPP) is a better determinant of C processes due to large contributions of root C to soil pools (Sulzman et al., 2005; Guzman and Al-Kaisi, 2010; Leppälammi-Kujansuu et al., 2014). A potential reason why BNPP and total NPP relationships with climate may be less clear than ANPP relationships is that, in wetter ecosystems, plants tend to allocate fewer carbohydrates to roots and more to aboveground material (Schenk and Jackson, 2002; Mokany et al., 2006; Zhou et al., 2009, Wilcox et al., 2016; Hu et al., 2022). This pattern results in a weaker relationship between MAP and NPP than predicted by ANPP–MAP relationships, since BNPP is proportionally greater in drier ecosystems. Indeed, we found some evidence for this from our model simulations – the slope of the BNPP–MAP regression (0.24 ± 0.03, slope estimate ± standard error) was shallower than the slope of the ANPP–MAP regression (0.29±0.02; Fig. S8). Also, differences in functional composition of vegetation may drive site differences in root : shoot ratios (e.g., annual versus perennial species). Despite the additional uncertainty associated with total NPP, we found that MAP was a strong predictor of total NPP across the six grassland sites (Fig. 2a).
We predicted that C residence time should be greater in (1) cooler systems due to lower soil temperatures and shorter growing seasons and (2) drier systems due to moisture limitations on microbial activity. Previous studies examining patterns of C residence time have found relationships of varying strengths with climate or latitude (Bird et al., 1996; Chen et al., 2013; Carvalhais et al., 2014; Moore et al., 2018), biome type (Zhou and Luo, 2008), soil properties (Telles et al., 2003), vegetation tissue quality (Adair et al., 2008; Bontti et al., 2009), and land use change (Sperow et al., 2016; Wu et al., 2020). Yet, there is still much uncertainty associated with trends in C residence time (Friend et al., 2014). We did not find relationships between MAP or MAT and C residence time across the six grasslands we examined (Fig. 2b). Instead, it is likely that more nuanced characteristics of sites drove patterns of C residence time. For example, SBL and SBK both had particularly short C residence times, likely due to strong C limitation of microbes at these sites and high abundances of fungal decomposers that efficiently break down recalcitrant C (Collins et al., 2008; Sinsabaugh et al., 2008). Additionally, intense wet–dry cycles (Fierer and Schimel, 2002), soil burial (Brandt et al., 2010), and photo-degradation (Austin and Vivanco, 2006; Parton et al., 2007) have all been shown to be important accelerators of decomposition rates in arid systems and may be contributing to the low C residence times in these grasslands. As soil C is a function of both NPP and C residence time, it makes sense that the stronger relationship of the two is the one that is best related to present C. We found that the best variable related to present C was MAP (Fig. 2), so soil C may be more sensitive to changes in precipitation versus temperature in US grassland systems. This corresponds with observational studies (Saiz et al., 2012) as well as meta-analysis findings of stronger moisture than temperature effects on net ecosystem exchange (Wu et al., 2011).
4.2 Effects of soil environment versus inherent site differences on C turnover rates
C residence time is directly related to various C turnover rates within an ecosystem (Luo et al., 2017). These turnover rates can be driven by favorability of soil environments for microbial activity (Bird et al., 1996; Carvalhais et al., 2014; Stielstra et al., 2015), by differences in soil types and microbial communities (Williams and Rice, 2007; Collins et al., 2008; Garcia-Palacios et al., 2016; Bhattacharyya et al., 2022), or by differences in litter quality (Melillo et al., 1982; Brovkin et al., 2012). With our approach, we were able to model the direct effect of temperature and moisture on turnover rates while accounting for site-level differences (e.g., microbial or plant communities) in how sensitive turnover is to soil moisture and temperature. This was done through data assimilation estimation of Q10 (temperature sensitivity of C turnover) and mscut (soil moisture sensitivity of C turnover) parameters (Fig. S5). At four of the six grasslands, both moisture and temperature had strong effects on C turnover during the growing season (Fig. 3a, b, d, e), which corresponds to well-known moisture and temperature controls on microbial activity (Bell et al., 2008). However, in the mesic tallgrass prairie (KNZ) and the cooler shortgrass prairie (CPER), we found moisture limitation on C turnover was minimal (Fig. 3c, f). At KNZ, this was likely due to relatively high soil moisture levels throughout the growing season (Table S6). In conjunction with soil temperatures optimal for microbial activity, this resulted in high C turnover rates throughout the growing season at KNZ (Fig. 3f) and low overall ecosystem C residence times.
Alternately, soils at CPER are coarse (Table S1) and become very dry during later months of the growing season, yet C turnover was not limited within the model by soil moisture. The lack of sensitivity of C turnover to soil moisture may be due to microbial communities adjusted to low soil moisture conditions at the site. The mscut parameter in TECO represents the soil moisture level at which C turnover – and by inference, soil microbial activity – in the system becomes limited. Because we were able to use daily soil CO2 fluxes that were directly linked with soil temperature and soil moisture data for at least 2 years at each site, our estimates of mscut (and Q10) parameters were remarkably well constrained (Fig. S4; Table S2). The estimate of the mscut parameter at CPER was 7 %, the lowest of all six sites. This means that when volumetric soil moisture is above 7 %, microbial activity is not restricted by soil moisture in the model. Soils at CPER during the growing season (June–September) were the driest of all the sites, having an average soil volumetric water content (VWC) of 11 % (Table S6). Additionally, the site having the second driest soils (12 % VWC – SBK) also had a low mscut estimate (Fig. S4). This raises the interesting possibility that ecosystems with drier soils have microbial communities adapted to low water conditions, which would result in C turnover rates persisting even in relatively xeric conditions. If it is the case that C turnover is less responsive to altered soil moisture, this could result in mismatches between responses of C inputs versus outputs under altered precipitation regimes, since NPP has been shown to be highly sensitive to precipitation in more arid ecosystems (Huxman et al., 2004; Sala et al., 2012; Maurer et al., 2020).
Lignin and cellulose contents of litter have been shown to be important drivers of turnover rates (Adair et al., 2008), which can lead to differences in turnover rates of C3 versus C4 vegetation (Brovkin et al., 2012). As such, we would expect that grassland sites dominated by C3 grasses would have shorter ecosystem C residence times compared with grasslands dominated by C4 vegetation. Indeed, within the HPG and CPER sites where C3 abundance is greatest among the six sites, turnover rates for leaf (c1) and fast soil organic matter (c3) were estimated to be relatively fast (Fig. S2; Table S2). This likely reflects the high nitrogen content in aboveground plant material of C3 species at these sites (Blumenthal et al., 2020). However, estimates of ecosystem C residence time at HPG and CPER were not particularly low (Table 3). At HPG, this was largely due to a slow estimated root turnover rate, which resulted in an increased estimate of ecosystem C residence time (positive c2 bar in Fig. 3j). At CPER, the temperature scalar strongly limited turnover rates (Fig. 3c). The cause of this may be a combination of the colder temperatures and a low Q10 estimate at CPER. Only the HPG is cooler, yet the Q10 estimate at HPG is much greater than at CPER (Fig. S5, Table S2). This raises the interesting possibility that the activity of decomposer communities at the shortgrass site may be less sensitive to temperature than other microbial communities, although additional inquiries are necessary to assess potential mechanisms. It could also be that C in CPER is older and thus less susceptible to losses via decomposition (Conant et al., 2011). This idea fits with findings from Liski et al. (1999) showing that decomposition rates of old soil C are relatively temperature insensitive, which aligns with the low Q10 value estimated for CPER. Ultimately, we did not find strong effects of the abundance of vegetation functional groups on C turnover rates in this study (Table S5). This does not preclude the importance of functional composition on C cycling, we feel it simply suggests that there are other factors that are outweighing these effects on C dynamics.
Turnover rates of more recalcitrant pools of soil carbon have the potential to have strong influences on ecosystem C residence times, as has been shown using a long-term cross-site decomposition experiment (Harmon et al., 2009). Turnover rates of more recalcitrant pools are represented in this study using the c5 and c6 parameters, which represent the amount of C lost from the slow and passive C pools each day. It is important to note that these turnover estimates represent the inherent turnover rates without the effects of moisture and temperature. The estimates for the c5 parameter were well constrained across all sites by the data assimilation process (Fig. S2), and turnover rate estimates were relatively slow, ranging from 8.7 years at HPG to 21.4 years at CPER. Indeed, the turnover rate of the slow pool at CPER caused ecosystem C residence time to be substantially greater at that site (Fig. 3i).
The potential distribution of the c6 parameter resulting from the data assimilation process was quite broad for each site (Fig. S2), which is likely a big part of the uncertainty present within our estimated ecosystem C residence times and the resultant uncertainty around the estimate of C capacity (gray bars in Fig. 5). For example, the MLE of the c6 parameter for the black grama grassland was g C g C−1 d−1 (Table S2), which translates to a baseline turnover rate of 177 years for the passive C pool. Yet, the lower bound of the 95 % confidence interval for the c6 parameter at the same site results in a baseline turnover rate of 1940 years. Differences in passive C turnover rates can have substantial effects on ecosystem C residence times, as shown in our sensitivity analysis (Fig. 4). In terms of our example above, going from passive C turnover rates of 177 to 1940 years causes ecosystem C residence time to go from 27 to 62 years. In this example, the magnitude of change of the ecosystem C residence time is less than that of the passive C turnover rates because ecosystem C residence time incorporates turnover of many other C pools, and not all C molecules end up in recalcitrant C pools. The overall effect on C saturation is substantial and important. We would like to note that variation in the passive and slow C turnover rates was a major component of the uncertainty in C capacity and saturation estimates (Fig. 5). This observation highlights the importance of these recalcitrant C pools for limiting losses of C from ecosystems.
4.3 Patterns of C saturation
Three of the grasslands we assessed had large gaps between present C and C capacity (CPER, HPG, and HAR; Fig. 5). Similar to forests acting as long-term C sinks during recovery from clear-cutting regimes (Pan et al., 2011), it is possible that these cooler and/or wetter grassland ecosystems will act as C sinks due to long-term agricultural or other land-management legacies (Smith, 2014). These systems may be buffered against C losses if environmental changes occur, at least in the short term. Alternately, the two hot and dry ecosystems showed high C saturation levels (Fig. 5), which corresponds with previous work at the SBK site showing this system is often a C source (Petrie et al., 2015), although long-term soil organic C data from this site indicate no net change in total soil C over time (Hou et al., 2021). High C saturation in these systems may also lead to C losses in the future, especially if global changes chronically reduce either NPP or C residence times. Short-term effects on NPP or C residence times, such as those imposed by drought, may not have as strong effects on soil C because they do not permanently modify the capacity to store C of these systems, which may explain a lack of response of soil C in drought experiments (Holguin et al., 2022).
KNZ had short C residence time, but it also had the highest NPP estimate (Table 2), which should have resulted in a high C capacity. Yet, this system is burned annually in the spring, reflecting common management practices in this region (Knapp et al., 1998; Freckleton, 2004). Burning minimizes the amount of aboveground tissue that is incorporated into the soil due to volatilization of C to the atmosphere (Seastedt, 1988), although some C is deposited as pyrogenic C (Soong and Cotrufo, 2015). Despite these annual losses, C capacity is still relatively close to present C, perhaps due to increased root production under frequent fire regimes (Johnson and Matchett, 2001). This may be one reason that research in this ecosystem has found that soil C is resistant to altered environmental conditions despite frequent fire (Wilcox et al., 2016), which has been predicted to reduce soil C through time due to losses through volatilization and reduced plant production (Ojima et al., 1994).
Our estimates of soil C extended from 0–20 cm in the soil, which presents two potential limitations in this study. First, since our measurements of soil C were from 0–10 cm in the soil, it was necessary to extrapolate this C to 20 cm using depth–soil C relationships from each site. This was important to match depths with all the other measurements used in this study, but the extrapolation process introduces additional sources of error. Also, our estimates of both C capacity and present C did not include measurements of C below 20 cm in the soil. Deeper C represents an additional store of C in many ecosystems and may stabilize C in ecosystems where C inputs by roots at depth are frequent, such as savanna and shrubland ecosystems. Additionally, soil microbial communities differ markedly in deeper soil layers than shallow layers (Fierer et al., 2003), so turnover rates across these systems may be quite different for deeper soils. Yet in many grasslands, C fluxes above ground and in shallow soil layers are more likely to respond under global change scenarios than deeper soils because: (1) the proportion of root production of soil organic C and microbial activity are typically greatest within shallow soil layers (Jackson et al., 1996; Jobággy and Jackson, 2000; Blume et al., 2002; Taylor et al., 2002), and (2) altered air temperature is more likely to impact soil temperatures in surface soils versus deeper soils. Another potential limitation of our study here is that we did not incorporate uncertainty among plot-level measurements of CO2 surface flux (Fig. S9). As such, our estimates apply to the site level, since we performed data–model fusion using cross-plot averages of our measurements. However, it would be interesting to examine how these ecological processes and properties varied at smaller spatial scales (i.e., across plots).
Here we used a recently developed metric, carbon capacity, to assess potential future trajectories of ecosystem C across six grasslands in the US Great Plains and to identify grasslands that may be vulnerable to C loss under future global change scenarios. We showed that hot and dry grasslands had C contents greater than their C capacity, suggesting future C loss in these systems, especially if environmental conditions continue to change. As arid ecosystems have been shown to be key components of the global C cycle due to their broad spatial extent (Poulter et al., 2014), understanding how NPP and ecosystem carbon residence times respond to alterations in environmental conditions in these ecosystems is vital for assessing future global C budgets. Additionally, the effect of frequent burning on C saturation suggests that land management practices that remove aboveground biomass may result in reduced capacity for these systems to be C sinks into the future. However, the effects of disturbances such as fire are complex and often are critical to maintaining ecosystem structure, so holistic consideration of all effects is important for management decisions. Because anthropogenic and climate effects on ecosystems are global and ubiquitous, considerations of how land management and environmental impacts interact to control ecosystem functioning are critical for land management and policy decisions related to C sequestration.
R scripts to conduct data assimilation and to calculate all metrics presented in the paper as well as statistical analyses are publicly available at https://github.com/wilcoxkr/AssessingCarbonCapacity (wilcoxkr, 2022). TECO model code was accessed from the ECOLAB website in 2016. Current location of model code is https://ecolab.cals.cornell.edu/download/teco.php (CornellCALS, 2023).
MCMC chains and raw empirical data are available upon request to the corresponding author.
The supplement related to this article is available online at: https://doi.org/10.5194/bg-20-2707-2023-supplement.
KRW, YL, MDS, SC, WP, and AKK designed the research project and participated in idea generation; KRW and ZS conducted analyses and model simulations; KRW led the writing process; all authors contributed to the writing and the editing process.
The contact author has declared that none of the authors has any competing interests.
Publisher's note: Copernicus Publications remains neutral with regard to jurisdictional claims in published maps and institutional affiliations.
This article is part of the special issue “Ecosystem experiments as a window to future carbon, water, and nutrient cycling in terrestrial ecosystems”. It is not associated with a conference.
We would like to thank the many technicians and scientists at the Konza Prairie and Sevilleta LTER sites as well as the Central Plains Experimental Research station, High Plains Grassland Research Station, and Hays Agricultural Research Center for helping collect much of the data that went into this work. Additionally, we thank the technicians and research assistants from the Knapp, Smith, and Collins labs at Colorado State University and University of New Mexico who spent many hours processing ecological samples used in this study.
This research has been supported by the National Science Foundation (grant nos. DEB-1354732, DEB-1655499, EF-1239559, and EF-1137378) and the Office of Science (grant no. DE-SC0019037).
This paper was edited by Richard Nair and reviewed by Vasileios Myrgiotis and two anonymous referees.
Adair, E. C., Parton, W. J., Del Grosso, S. J., Silver, W. L., Harmon, M. E., Hall, S. A., Burke, I. C., and Hart, S. C.: Simple threepool model accurately describes patterns of longterm litter decomposition in diverse climates, Global Change Biol., 14, 2636–2660, 2008.
Austin, A. T. and Vivanco, L.: Plant litter decomposition in a semi-arid ecosystem controlled by photodegradation, Nature, 442, 555–558, https://doi.org/10.1038/nature05038, 2006.
Bai, Y. and Cotrufo, M. F.: Grassland soil carbon sequestration: Current understanding, challenges, and solutions, Science, 377, 603–608, https://doi.org/10.1126/science.abo2380, 2022.
Baisden, W. T., Parfitt, R. L., Ross, C., Schipper, L. A., and Canessa, S.: Evaluating 50 years of time-series soil radiocarbon data: towards routine calculation of robust C residence times, Biogeochemistry, 112, 129–137, https://doi.org/10.1007/s10533-011-9675-y, 2013.
Balesdent, J., Wagner, G. H., and Mariotti, A.: Soil organic matter turnover in long-term field experiments as revealed by carbon-13 natural abundance, Soil Sci. Soc. Am. J., 52, 118–124, 1988.
Bell, C., McIntyre, N., Cox, S., Tissue, D., and Zak, J.: Soil Microbial Responses to Temporal Variations of Moisture and Temperature in a Chihuahuan Desert Grassland, Microb. Ecol., 56, 153–167, https://doi.org/10.1007/s00248-007-9333-z, 2008.
Bhattacharyya, S. S., Ros, G. H., Furtak, K., Iqbal, H. M. N., and Parra-Saldívar, R.: Soil carbon sequestration – An interplay between soil microbial community and soil organic matter dynamics, Sci. Total Environ., 815, 152928, https://doi.org/10.1016/j.scitotenv.2022.152928, 2022.
Bird, M. I., Chivas, A. R., and Head, J.: A latitudinal gradient in carbon turnover times in forest soils, Nature, 381, 143–146, 1996.
Blume, E., Bischoff, M., Reichert, J. M., Moorman, T., Konopka, A., and Turco, R. F.: Surface and subsurface microbial biomass, community structure and metabolic activity as a function of soil depth and season, Appl. Soil Ecol., 20, 171–181, https://doi.org/10.1016/S0929-1393(02)00025-2, 2002.
Blumenthal, D., Kray, J., Mueller, K., and Ocheltree, T.: Shortgrass steppe and northern mixedgrass prairie plant species traits, Dryad, [data set], https://doi.org/10.5061/dryad.8sf7m0cjr, 2020.
Bonan, G. B., Hartman, M. D., Parton, W. J., and Wieder, W. R.: Evaluating litter decomposition in earth system models with longterm litterbag experiments: an example using the Community Land Model version 4 (CLM 4), Global Change Biol., 19, 957–974, 2013.
Bontti, E. E., Decant, J. P., Munson, S. M., Gathany, M. A., Przeszlowska, A., Haddix, M. L., Owens, S., Burke, I. C., Parton, W. J., and Harmon, M. E.: Litter decomposition in grasslands of central North America (US Great Plains). Global Change Biol., 15, 1356–1363, 2009.
Brandt, L. A., King, J. Y., Hobbie, S. E., Milchunas, D. G., and Sinsabaugh, R. L.: The Role of Photodegradation in Surface Litter Decomposition Across a Grassland Ecosystem Precipitation Gradient, Ecosystems, 13, 765–781, https://doi.org/10.1007/s10021-010-9353-2, 2010.
Brovkin, V., van Bodegom, P. M., Kleinen, T., Wirth, C., Cornwell, W. K., Cornelissen, J. H. C., and Kattge, J.: Plant-driven variation in decomposition rates improves projections of global litter stock distribution, Biogeosciences, 9, 565–576, https://doi.org/10.5194/bg-9-565-2012, 2012.
Burke, I. C., Lauenroth, W. K., and Parton, W. J.: Regional and temporal variation in net primary production and nitrogen mineralization in grasslands, Ecology, 78, 1330–1340, 1997.
Carvalhais, N., Forkel, M., Khomik, M., Bellarby, J., Jung, M., Migliavacca, M., Mu, M., Saatchi, S., Santoro, M., Thurner, M., Weber, U., Ahrens, B., Beer, C., Cescatti, A., Randerson, J. T., and Reichstein, M.: Global covariation of carbon turnover times with climate in terrestrial ecosystems, Nature, 514, 213–217, https://doi.org/10.1038/nature13731, 2014.
Chambers, A., Lal, R., and Paustian, K.: Soil carbon sequestration potential of US croplands and grasslands: Implementing the 4 per Thousand Initiative, J. Soil Water Conserv., 71, 68–74, 2016.
Chapin III, F. S., Matson, P. A., and Mooney, H. A.: Principles of Terrestrial Ecosystem Ecology, Springer-Verlag New York, Inc, New York, NY, https://doi.org/10.1007/978-1-4419-9504-9, 2002.
Chen, B., Ge, Q., Fu, D., Yu, G., Sun, X., Wang, S., and Wang, H.: A data-model fusion approach for upscaling gross ecosystem productivity to the landscape scale based on remote sensing and flux footprint modelling, Biogeosciences, 7, 2943–2958, https://doi.org/10.5194/bg-7-2943-2010, 2010.
Chen, S., Huang, Y., Zou, J., and Shi, Y.: Mean residence time of global topsoil organic carbon depends on temperature, precipitation and soil nitrogen, Global Planet. Change, 100, 99–108, https://doi.org/10.1016/j.gloplacha.2012.10.006, 2013.
Collins, S. L., Sinsabaugh, R. L., Crenshaw, C., Green, L., Porras-Alfaro, A., Stursova, M., and Zeglin, L. H.: Pulse dynamics and microbial processes in aridland ecosystems: Pulse dynamics in aridland soils, J. Ecol., 96, 413–420, https://doi.org/10.1111/j.1365-2745.2008.01362.x, 2008.
Conant, R. T., Cerri, C. E., Osborne, B. B., and Paustian, K.: Grassland management impacts on soil carbon stocks: a new synthesis, Ecol. Appl. Ma., 27, 662–668, 2017.
Conant, R. T., Ryan, M. G., Ågren, G. I., Birge, H. E., Davidson, E. A., Eliasson, P. E., Evans, S. E., Frey, S. D., Giardina, C. P., Hopkins, F. M. and Hyvönen, R.: Temperature and soil organic matter decomposition rates–synthesis of current knowledge and a way forward, Global Change Biol., 17, 3392–3404, 2011.
CornellCALS: The Terrestrial ECOsystem (TECO) model, CornellCALS [code], https://ecolab.cals.cornell.edu/download/teco.php, last access: 21 June 2023.
Daily, G. C., Polasky, S., Goldstein, J., Kareiva, P. M., Mooney, H. A., Pejchar, L., Ricketts, T. H., Salzman, J., and Shallenberger, R.: Ecosystem services in decision making: time to deliver, Front. Ecol. Environ., 7, 21–28, https://doi.org/10.1890/080025, 2009.
De Kauwe, M. G., Medlyn, B. E., Zaehle, S., Walker, A. P., Dietze, M. C., Wang, Y., Luo, Y., Jain, A. K., El-Masri, B., Hickler, T., Wårlind, D., Weng, E., Parton, W. J., Thornton, P. E., Wang, S., Prentice, I. C., Asao, S., Smith, B., McCarthy, H. R., Iversen, C. M., Hanson, P. J., Warren, J. M., Oren, R., and Norby, R. J.: Where does the carbon go?, A model–data intercomparison of vegetation carbon allocation and turnover processes at two temperate forest free-air CO2 enrichment sites, New Phytol., 203, 883–899, https://doi.org/10.1111/nph.12847, 2014.
Doetterl, S., Stevens, A., Six, J., Merckx, R., Van Oost, K., Casanova Pinto, M., Casanova-Katny, A., Muñoz, C., Boudin, M., Zagal Venegas, E., and Boeckx, P.: Soil carbon storage controlled by interactions between geochemistry and climate, Nat. Geosci., 8, 780–783, https://doi.org/10.1038/ngeo2516, 2015.
Feng, J., Wang, J., Song, Y., and Zhu, B.: Patterns of soil respiration and its temperature sensitivity in grassland ecosystems across China, Biogeosciences, 15, 5329–5341, https://doi.org/10.5194/bg-15-5329-2018, 2018.
Fer, I., Gardella, A. K., Shiklomanov, A. N., Campbell, E. E., Cowdery, E. M., De Kauwe, M. G., Desai, A., Duveneck, M. J., Fisher, J. B., Haynes, K. D., and Hoffman, F. M.: Beyond ecosystem modeling: A roadmap to community cyberinfrastructure for ecological datamodel integration, Global Change Biol., 27, 13–26, 2021.
Fierer, N. and Schimel, J. P.: Effects of drying–rewetting frequency on soil carbon and nitrogen transformations, Soil Biol. Biochem., 34, 777–787, https://doi.org/10.1016/S0038-0717(02)00007-X, 2002.
Fierer, N., Schimel, J. P., and Holden, P. A.: Variations in microbial community composition through two soil depth profiles, Soil Biol. Biochem., 35, 167–176, https://doi.org/10.1016/S0038-0717(02)00251-1, 2003.
Freckleton, R. P.: The problems of prediction and scale in applied ecology: the example of fire as a management tool: Editorial, J. Appl. Ecol., 41, 599–603, https://doi.org/10.1111/j.0021-8901.2004.00941.x, 2004.
Friend, A. D., Lucht, W., Rademacher, T. T., Keribin, R., Betts, R., Cadule, P., Ciais, P., Clark, D. B., Dankers, R., Falloon, P. D., Ito, A., Kahana, R., Kleidon, A., Lomas, M. R., Nishina, K., Ostberg, S., Pavlick, R., Peylin, P., Schaphoff, S., Vuichard, N., Warszawski, L., Wiltshire, A., and Woodward, F. I.: Carbon residence time dominates uncertainty in terrestrial vegetation responses to future climate and atmospheric CO2, P. Natl. Acad. Sci. USA, 111, 3280–3285, https://doi.org/10.1073/pnas.1222477110, 2014.
García-Palacios, P., Shaw, E. A., Wall, D. H., and Hättenschwiler, S.: Temporal dynamics of biotic and abiotic drivers of litter decomposition, Ecol. Lett., 19, 554–563, https://doi.org/10.1111/ele.12590, 2016.
Guzman, J. G. and Al-Kaisi, M. M.: Soil Carbon Dynamics and Carbon Budget of Newly Reconstructed Tall-grass Prairies in South Central Iowa, J. Environ. Qual., 39, 136–146, https://doi.org/10.2134/jeq2009.0063, 2010.
Harmon, M. E., Silver, W.L., Fasth, B., Chen, H.U.A., Burke, I.C., Parton, W. J., Hart, S. C., Currie, W. S., and Lidet: Longterm patterns of mass loss during the decomposition of leaf and fine root litter: an intersite comparison, Global Change Biol., 15, 1320–1338, 2009.
Holguin, J., Collins, S. L., and McLaren, J. R.: Belowground responses to altered precipitation regimes in two semi-arid grasslands, Soil Biol. Biochem., 171, 108725, https://doi.org/10.1016/j.soilbio.2022.108725, 2022.
Hou, E., Rudgers, J. A., Collins, S. L., Litvak, M. E., White, C. S., Moore, D. I., and Luo, Y.: Sensitivity of soil organic matter to climate and fire in a desert grassland, Biogeochemistry, 156, 59–74, 2021.
Hu, Z., Song, X., Wang, M., Ma, J., Zhang, Y., Xu, H.-J., Hu, Z., Zhu, X., Liu, H., Ma, J., Yu, Q., Ostle, N. J., Li, Y., and Yue, C.: Aridity influences root versus shoot contributions to steppe grassland soil carbon stock and its stability, Geoderma, 413, 115744, https://doi.org/10.1016/j.geoderma.2022.115744, 2022.
Hungate, B. A., Holland, E. A., Jackson, R. B., Chapin, F. S., Mooney, H. A., and Field, C. B.: The fate of carbon in grasslands under carbon dioxide enrichment, Nature, 388, 576–579, https://doi.org/10.1038/41550, 1997.
Huxman, T. E., Smith, M. D., Fay, P. A., Knapp, A. K., Shaw, M. R., Loik, M. E., Smith, S. D., Tissue, D. T., Zak, J. C., Weltzin, J. F., Pockman, W. T., Sala, O. E., Haddad, B. M., Harte, J., Koch, G. W., Schwinning, S., Small, E. E., and Williams, D. G.: Convergence across biomes to a common rain-use efficiency, Nature, 429, 651–654, https://doi.org/10.1038/nature02561, 2004.
IPCC, 2022: Summary for Policymakers, in: Climate Change 2022: Impacts, Adaptation and Vulnerability, edited by: Pörtner, H.-O., Roberts, D. C., Poloczanska, E. S., Mintenbeck, K., Tignor, M., Alegría, A., Craig, M., Langsdorf, S., Löschke, S., Möller, V., and Okem, A., Contribution of Working Group II to the Sixth Assessment Report of the Intergovernmental Panel on Climate Change, Cambridge University Press, Cambridge, UK and New York, NY, USA, 3–33, https://doi.org/10.1017/9781009325844.001, 2022.
Jackson, R. B., Canadell, J., Ehleringer, J. R., Mooney, H. A., Sala, O. E., and Schulze, E. D.: A global analysis of root distributions for terrestrial biomes, Oecologia, 108, 389–411, https://doi.org/10.1007/BF00333714, 1996.
Jobbágy, E. G. and Jackson, R. B.: The vertical distribution of soil organic carbon and its relation to climate and vegetation, Ecol. Appl., 10, 423–436, https://doi.org/10.1890/1051-0761(2000)010[0423:TVDOSO]2.0.CO;2, 2000.
Johnson, L. C. and Matchett, J. R.: Fire and grazing regulate belowground processes in tallgrass prairie, Ecology, 82, 3377–3389, https://doi.org/10.1890/0012-9658(2001)082[3377:FAGRBP]2.0.CO;2, 2001.
Knapp, A. K., Briggs, J. M., Hartnett, D. C., and Collins, S. L.: Grassland dynamics: Long-term ecological research in tallgrass prairie, Oxford University Press, Inc., New York, NY, 1998.
Knapp, A. K., Carroll, C. J. W., Denton, E. M., La Pierre, K. J., Collins, S. L., and Smith, M. D.: Differential sensitivity to regional-scale drought in six central US grasslands, Oecologia, 177, 949–957, https://doi.org/10.1007/s00442-015-3233-6, 2015.
Lal, R.: Soil Carbon Sequestration Impacts on Global Climate Change and Food Security, Science, 304, 1623–1627, https://doi.org/10.1126/science.1097396, 2004.
Leppälammi-Kujansuu, J., Aro, L., Salemaa, M., Hansson, K., Kleja, D. B., and Helmisaari, H.-S.: Fine root longevity and carbon input into soil from below- and aboveground litter in climatically contrasting forests, Forest Ecol. Manage., 326, 79–90, https://doi.org/10.1016/j.foreco.2014.03.039, 2014.
Liski, J., Ilvesniemi, H., Mäkelä, A., and Westman, C. J., CO2 emissions from soil in response to climatic warming are overestimated: the decomposition of old soil organic matter is tolerant of temperature, Ambio, 171–174, 1999.
Lorenz, K. and Lal, R.: Carbon sequestration in grassland soils, in: Carbon sequestration in agricultural ecosystems, edited by: Lorenz, K., Lal, R. Springer Cham, New York, NY, USA, 175–209, https://doi.org/10.1007/978-3-319-92318-5, 2018.
Luo, Y., Keenan, T. F., and Smith, M.: Predictability of the terrestrial carbon cycle, Glob Change Biol, 21, 1737–1751, https://doi.org/10.1111/gcb.12766, 2015.
Luo, Y., Shi, Z., Lu, X., Xia, J., Liang, J., Jiang, J., Wang, Y., Smith, M. J., Jiang, L., Ahlström, A., Chen, B., Hararuk, O., Hastings, A., Hoffman, F., Medlyn, B., Niu, S., Rasmussen, M., Todd-Brown, K., and Wang, Y.-P.: Transient dynamics of terrestrial carbon storage: mathematical foundation and its applications, Biogeosciences, 14, 145–161, https://doi.org/10.5194/bg-14-145-2017, 2017.
Mathieu, J. A., Hatté, C., Balesdent, J., and Parent, É.: Deep soil carbon dynamics are driven more by soil type than by climate: a worldwide meta-analysis of radiocarbon profiles, Glob Change Biol, 21, 4278–4292, https://doi.org/10.1111/gcb.13012, 2015.
Maurer, G. E., Hallmark, A. J., Brown, R. F., Sala, O. E., and Collins, S. L.: Sensitivity of primary production to precipitation across the United States, Ecol. Lett., 23, 527–536, https://doi.org/10.1111/ele.13455, 2020.
Melillo, J. M., Aber, J. D., and Muratore, J. F.: Nitrogen and lignin control of hardwood leaf litter decomposition dynamics, Ecology, 63, 621–626, 1982.
Mokany, K., Raison, R. J., and Prokushkin, A. S.: Critical analysis of root: shoot ratios in terrestrial biomes: Root: shoot ratios in terrestrial biomes, Global Change Biol., 12, 84–96, https://doi.org/10.1111/j.1365-2486.2005.001043.x, 2006.
Moore, S., Adu-Bredu, S., Duah-Gyamfi, A., Addo-Danso, S. D., Ibrahim, F., Mbou, A. T., Grandcourt, A., Valentini, R., Nicolini, G., Djagbletey, G., Owusu-Afriyie, K., Gvozdevaite, A., Oliveras, I., Ruiz-Jaen, M. C., and Malhi, Y.: Forest biomass, productivity and carbon cycling along a rainfall gradient in West Africa, Glob Change Biol, 24, 496–510, https://doi.org/10.1111/gcb.13907, 2018.
Nave, L., Johnson, K., van Ingen, C., Agarwal, D., Humphrey, M., and Beekwilder, N.: International Soil Carbon Network (ISCN) Database V3-1, https://doi.org/10.17040/ISCN/1305039, 2017.
Naylor, D., Sadler, N., Bhattacharjee, A., Graham, E. B., Anderton, C. R., McClure, R., Lipton, M., Hofmockel, K. S., and Jansson, J. K.: Soil Microbiomes Under Climate Change and Implications for Carbon Cycling, Annu. Rev. Environ. Resour., 45, 29–59, https://doi.org/10.1146/annurev-environ-012320-082720, 2020.
Ojima, D. S., Schimel, D. S., Parton, W. J., and Owensby, C. E.: Long-and short-term effects of fire on nitrogen cycling in tallgrass prairie, Biogeochemistry, 24, 67–84, 1994.
Oksanen, J., Simpson, G. L., Blanchet, F. G., Kindt, R., Legendre, P., Minchin, P. R., O’Hara, R. B., Solymos, P., Stevens, M. H. H., Szoecs, E., Wagner, H., Barbour, M., Bedward, M., Bolker, B., Borcard, D., Carvalho, G., Chirico, M., Caceres, M. D., Durand, S., Evangelista, H. B. A., FitzJohn, R., Friendly, M., Furneaux, B., Hannigan, G., Hill, M. O., Lahti, L., McGlinn, D., Ouellette, M.-H., Cunha, E. R., Smith, T., Stier, A., Braak, C. J. F. T., and Weedon, J.: vegan: Community Ecology Package, R package version 2.6-2. https://CRAN.R-project.org/package=vegan (last access 4 August 2022), 2022.
Pan, Y., Birdsey, R. A., Fang, J., Houghton, R., Kauppi, P. E., Kurz, W. A., Phillips, O. L., Shvidenko, A., Lewis, S. L., Canadell, J. G., Ciais, P., Jackson, R. B., Pacala, S. W., McGuire, A. D., Piao, S., Rautiainen, A., Sitch, S., and Hayes, D.: A Large and Persistent Carbon Sink in the World's Forests, Science, 333, 988–993, https://doi.org/10.1126/science.1201609, 2011.
Parton, W. J., Scurlock, J. M. O., Ojima, D. S., Gilmanov, T. G., Scholes, R.J., Schimel, D.S., Kirchner, T., Menaut, J. C., Seastedt, T., Garcia Moya, E., and Kamnalrut, A., Observations and modeling of biomass and soil organic matter dynamics for the grassland biome worldwide, Global Biogeochem. Cy., 7, 785–809, 1993.
Parton, W., Silver, W. L., Burke, I. C., Grassens, L., Harmon, M. E., Currie, W. S., King, J. Y., Adair, E. C., Brandt, L. A., Hart, S. C., and Fasth, B.: Global-Scale Similarities in Nitrogen Release Patterns During Long-Term Decomposition, Science, 315, 361–364, https://doi.org/10.1126/science.1134853, 2007.
Petrie, M. D., Collins, S. L., Swann, A. M., Ford, P. L., and Litvak, M. E.: Grassland to shrubland state transitions enhance carbon sequestration in the northern Chihuahuan Desert, Global Change Biol., 21, 1226–1235, https://doi.org/10.1111/gcb.12743, 2015.
Poulter, B., Frank, D., Ciais, P., Myneni, R. B., Andela, N., Bi, J., Broquet, G., Canadell, J. G., Chevallier, F., Liu, Y. Y., Running, S. W., Sitch, S., and van der Werf, G. R.: Contribution of semi-arid ecosystems to interannual variability of the global carbon cycle, Nature, 509, 600–603, https://doi.org/10.1038/nature13376, 2014.
R Core Team R: A language and environment for statistical computing, R Foundation for Statistical Computing, Vienna, Austria, https://www.R-project.org/ (last access: 4 August 2022), 2022.
Rees, R. M., Bingham, I. J., Baddeley, J. A., and Watson, C. A.: The role of plants and land management in sequestering soil carbon in temperate arable and grassland ecosystems, Geoderma, 128, 130–154, https://doi.org/10.1016/j.geoderma.2004.12.020, 2005.
Rudgers, J. A., Hallmark, A., Baker, S. R., Baur, L., Hall, K. M., Litvak, M. E., Muldavin, E. H., Pockman, W. T., and Whitney, K. D.: Sensitivity of dryland plant allometry to climate, Funct. Ecol., 33, 2290–2303, 2019.
Saiz, G., Bird, M. I., Domingues, T., Schrodt, F., Schwarz, M., Feldpausch, T. R., Veenendaal, E., Djagbletey, G., Hien, F., Compaore, H., Diallo, A., and Lloyd, J.: Variation in soil carbon stocks and their determinants across a precipitation gradient in West Africa, Glob Change Biol, 18, 1670–1683, https://doi.org/10.1111/j.1365-2486.2012.02657.x, 2012.
Sala, O. E., Parton, W. J., Joyce, L. A., and Lauenroth, W. K.: Primary Production of the Central Grassland Region of the United States, Ecology, 69, 40–45, https://doi.org/10.2307/1943158, 1988.
Sala, O. E., Gherardi, L. A., Reichmann, L., Jobbágy, E., and Peters, D.: Legacies of precipitation fluctuations on primary production: theory and data synthesis, Phil. Trans. R. Soc. B, 367, 3135–3144, https://doi.org/10.1098/rstb.2011.0347, 2012.
Schenk, H. J. and Jackson, R. B.: The global biogeography of roots, Ecol. Monogr., 72, 311–328, https://doi.org/10.1890/0012-9615(2002)072[0311:TGBOR]2.0.CO;2, 2002.
Seastedt, T. R.: Mass, Nitrogen, and Phosphorus Dynamics in Foliage and Root Detritus of Tallgrass Prairie, Ecology, 69, 59–65, https://doi.org/10.2307/1943160, 1988.
Shi, Z., Thomey, M. L., Mowll, W., Litvak, M., Brunsell, N. A., Collins, S. L., Pockman, W. T., Smith, M. D., Knapp, A. K., and Luo, Y.: Differential effects of extreme drought on production and respiration: synthesis and modeling analysis, Biogeosciences, 11, 621–633, https://doi.org/10.5194/bg-11-621-2014, 2014.
Shi, Z., Xu, X., Hararuk, O., Jiang, L., Xia, J., Liang, J., Li, D., and Luo, Y.: Experimental warming altered rates of carbon processes, allocation, and carbon storage in a tallgrass prairie, Ecosphere, 6, art210, https://doi.org/10.1890/ES14-00335.1, 2015.
Sinsabaugh, R. L., Lauber, C. L., Weintraub, M. N., Ahmed, B., Allison, S. D., Crenshaw, C., Contosta, A. R., Cusack, D., Frey, S., Gallo, M. E., Gartner, T. B., Hobbie, S. E., Holland, K., Keeler, B. L., Powers, J. S., Stursova, M., Takacs-Vesbach, C., Waldrop, M. P., Wallenstein, M. D., Zak, D. R., and Zeglin, L. H.: Stoichiometry of soil enzyme activity at global scale: Stoichiometry of soil enzyme activity, Ecology Letters, 11, 1252–1264, https://doi.org/10.1111/j.1461-0248.2008.01245.x, 2008.
Smith, P.: Carbon sequestration in croplands: the potential in Europe and the global context, Europ. J. Agron., 20, 229–236, 2004.
Smith, P., Andrén, O., Karlsson, T., Perälä, P., Regina, K., Rounsevell, M., and Van Wesemael, B.: Carbon sequestration potential in European croplands has been overestimated, Global Change Biol., 11, 2153–2163, 2005.
Smith, P.: Do grasslands act as a perpetual sink for carbon?, Global Change Biol., 20, 2708–2711, https://doi.org/10.1111/gcb.12561, 2014.
Soong, J. L. and Cotrufo, M. F.: Annual burning of a tallgrass prairie inhibits C and N cycling in soil, increasing recalcitrant pyrogenic organic matter storage while reducing N availability, Global Change Biol., 21, 2321–2333, https://doi.org/10.1111/gcb.12832, 2015.
Soussana, J. F., Allard, V., Pilegaard, K., Ambus, P., Amman, C., Campbell, C., Ceschia, E., Clifton-Brown, J., Czobel, S., Domingues, R., Flechard, C., Fuhrer, J., Hensen, A., Horvath, L., Jones, M., Kasper, G., Martin, C., Nagy, Z., Neftel, A., Raschi, A., Baronti, S., Rees, R. M., Skiba, U., Stefani, P., Manca, G., Sutton, M., Tuba, Z., and Valentini, R.: Full accounting of the greenhouse gas (CO2, N2O, CH4) budget of nine European grassland sites, Agr. Ecosyst. Environ., 121, 121–134, https://doi.org/10.1016/j.agee.2006.12.022, 2007.
Sperow, M.: Estimating carbon sequestration potential on US agricultural topsoils, Soil Tillage Res., 155, 390-400, 2016.
Stielstra, C. M., Lohse, K. A., Chorover, J., McIntosh, J. C., Barron-Gafford, G. A., Perdrial, J. N., Litvak, M., Barnard, H. R., and Brooks, P. D.: Climatic and landscape influences on soil moisture are primary determinants of soil carbon fluxes in seasonally snow-covered forest ecosystems, Biogeochemistry, 123, 447–465, https://doi.org/10.1007/s10533-015-0078-3, 2015.
Sulman, B. N., Moore, J. A. M., Abramoff, R., Averill, C., Kivlin, S., Georgiou, K., Sridhar, B., Hartman, M. D., Wang, G., Wieder, W. R., Bradford, M. A., Luo, Y., Mayes, M. A., Morrison, E., Riley, W. J., Salazar, A., Schimel, J. P., Tang, J., and Classen, A. T.: Multiple models and experiments underscore large uncertainty in soil carbon dynamics, Biogeochemistry, 141, 109–123, https://doi.org/10.1007/s10533-018-0509-z, 2018.
Sulzman, E. W., Brant, J. B., Bowden, R. D., and Lajtha, K.: Contribution of aboveground litter, belowground litter, and rhizosphere respiration to total soil CO2 efflux in an old growth coniferous forest, Biogeochemistry, 73, 231–256, https://doi.org/10.1007/s10533-004-7314-6, 2005.
Taylor, J. P., Wilson, B., Mills, M. S., and Burns, R. G.: Comparison of microbial numbers and enzymatic activities in surface soils and subsoils using various techniques, Soil Biol. Biochem., 34, 387–401, https://doi.org/10.1016/S0038-0717(01)00199-7, 2002.
Telles, E. de C. C., de Camargo, P. B., Martinelli, L. A., Trumbore, S. E., da Costa, E. S., Santos, J., Higuchi, N., and Oliveira, R. C.: Influence of soil texture on carbon dynamics and storage potential in tropical forest soils of Amazonia: Carbon storage potential of tropical soils, Global Biogeochem. Cy., 17, 1–12, https://doi.org/10.1029/2002GB001953, 2003.
Thomey, M. L., Collins, S. L., Vargas, R., Johnson, J. E., Brown, R. F., Natvig, D. O., and Friggens, M. T.: Effect of precipitation variability on net primary production and soil respiration in a Chihuahuan Desert grassland: Precipitation variability in desert grassland, Global Change Biol., 17, 1505–1515, https://doi.org/10.1111/j.1365-2486.2010.02363.x, 2011.
Todd-Brown, K. E. O., Randerson, J. T., Hopkins, F., Arora, V., Hajima, T., Jones, C., Shevliakova, E., Tjiputra, J., Volodin, E., Wu, T., Zhang, Q., and Allison, S. D.: Changes in soil organic carbon storage predicted by Earth system models during the 21st century, Biogeosciences, 11, 2341–2356, https://doi.org/10.5194/bg-11-2341-2014, 2014.
Wang, Y., Xie, Z., and Jia, B.: Incorporation of a dynamic root distribution into CLM4.5: Evaluation of carbon and water fluxes over the Amazon, Adv. Atmos. Sci., 33, 1047–1060, https://doi.org/10.1007/s00376-016-5226-8, 2016.
Weng, E. and Luo, Y.: Soil hydrological properties regulate grassland ecosystem responses to multifactor global change: A modeling analysis, J. Geophys. Res., 113, G03003, https://doi.org/10.1029/2007JG000539, 2008.
Wiesmeier, M., Urbanski, L., Hobley, E., Lang, B., von Lützow, M., Marin-Spiotta, E., van Wesemael, B., Rabot, E., Ließ, M., Garcia-Franco, N., Wollschläger, U., Vogel, H.-J., and Kögel-Knabner, I.: Soil organic carbon storage as a key function of soils - A review of drivers and indicators at various scales, Geoderma, 333, 149–162, https://doi.org/10.1016/j.geoderma.2018.07.026, 2019.
Wilcox, K. R., Blair, J. M., and Knapp, A. K.: Stability of grassland soil C and N pools despite 25 years of an extreme climatic and disturbance regime: precipitation impacts on soil C and N, J. Geophys. Res.-Biogeo., 121, 1934–1945, https://doi.org/10.1002/2016JG003370, 2016.
Williams, M. A. and Rice, C. W.: Seven years of enhanced water availability influences the physiological, structural, and functional attributes of a soil microbial community, Appl. Soil Ecol., 35, 535–545, https://doi.org/10.1016/j.apsoil.2006.09.014, 2007.
Wu, D., Piao, S., Zhu, D., Wang, X., Ciais, P., Bastos, A., Xu, X., and Xu, W.: Accelerated terrestrial ecosystem carbon turnover and its drivers, Global Change Biol., 26, 5052–5062, https://doi.org/10.1111/gcb.15224, 2020.
Wu, Z., Dijkstra, P., Koch, G. W., Peñuelas, J., and Hungate, B. A.: Responses of terrestrial ecosystems to temperature and precipitation change: a meta-analysis of experimental manipulation: Meta-analysis of experimental manipulation, Global Change Biol., 17, 927–942, https://doi.org/10.1111/j.1365-2486.2010.02302.x, 2011.
wilcoxkr/AssessingCarbonCapacity: Assessing Carbon Capacity, Github [code], https://github.com/wilcoxkr/AssessingCarbonCapacity, last access: 4 August 2022.
Xu, T., White, L., Hui, D., and Luo, Y.: Probabilistic inversion of a terrestrial ecosystem model: Analysis of uncertainty in parameter estimation and model prediction: probabilistic inversion of terrestrial ecosystem, Global Biogeochem. Cy., 20, 1–15 https://doi.org/10.1029/2005GB002468, 2006.
Yahdjian, L., Sala, O. E., and Austin, A. T.: Differential controls of water input on litter decomposition and nitrogen dynamics in the Patagonian steppe, Ecosystems, 9, 128–141, 2006.
You, Y., Wang, J., Huang, X., Tang, Z., Liu, S., and Sun, O. J.: Relating microbial community structure to functioning in forest soil organic carbon transformation and turnover, Ecol. Evol., 4, 633–647, https://doi.org/10.1002/ece3.969, 2014.
Zhao, Y. F., Wang, X., Jiang, S. L., Zhou, X. H., Liu, H. Y., Xiao, J. J., Hao, Z. G., and Wang, K. C.: Climate and geochemistry interactions at different altitudes influence soil organic carbon turnover times in alpine grasslands, Agr. Ecosyst. Environ., 320, 107591, https://doi.org/10.1016/j.agee.2021.107591, 2021.
Zhou, T. and Luo, Y.: Spatial patterns of ecosystem carbon residence time and NPP-driven carbon uptake in the conterminous United States: carbon residence time and carbon uptake, Global Biogeochem. Cy., 22, 1–15, https://doi.org/10.1029/2007GB002939, 2008.
Zhou, X., Talley, M., and Luo, Y., Biomass, litter, and soil respiration along a precipitation gradient in southern Great Plains, USA, Ecosystems, 12, 1369–1380, 2009.
Zhou, X., Zhou, T., and Luo, Y.: Uncertainties in carbon residence time and NPP-driven carbon uptake in terrestrial ecosystems of the conterminous USA: a Bayesian approach, Tellus B, 64, 17223, https://doi.org/10.3402/tellusb.v64i0.17223, 2012.