the Creative Commons Attribution 4.0 License.
the Creative Commons Attribution 4.0 License.
 | 12 Jul 2023
Revisiting and attributing the global controls over terrestrial ecosystem functions of climate and plant traits at FLUXNET sites via causal graphical models
Haiyang Shi
Geping Luo
Olaf Hellwich
Alishir Kurban
Philippe De Maeyer
Tim Van de Voorde
Using statistical methods that do not directly represent the causality between variables to attribute climate and plant traits as controlling ecosystem functions may lead to biased perceptions. We revisited this issue using a causal graphical model, the Bayesian network (BN), capable of quantifying causality by conditional probability tables. Based on expert knowledge and climate, vegetation, and ecosystem function data from the FLUXNET flux stations, we constructed a BN representing the causal relationship of climate–plant-trait–ecosystem functions. Based on the sensitivity analysis function of the BN, we attributed the control of climate and plant traits over ecosystem functions and compared the results with those based on random forests and correlation analysis. The main conclusions of this study include the following: BN can be used for the quantification of causal relationships between complex ecosystems in response to climate change and enables the analysis of indirect effects among variables. The causality reflected in the BN is as good as the expert knowledge of the causal links. Compared to BN, the feature importance difference between “mean vapor pressure deficit and cumulative soil water index” and “maximum leaf area index and maximum vegetation height” reported by random forests is higher and can be overestimated. With the causality relation between correlated variables constructed, a BN-based sensitivity analysis can reduce the uncertainty in quantifying the importance of correlated variables. The understanding of the mechanism of indirect effects of climate variables on ecosystem functions through plant traits can be deepened by the chain casuality quantification in BNs.
- Article
(4453 KB) - Full-text XML
-
Supplement
(535 KB) - BibTeX
- EndNote


Ecosystem functions are the capacity of natural processes and components to provide goods and services that satisfy human needs, either directly or indirectly (de Groot et al., 2002). Ecosystem functions include the physicochemical and biological processes within the ecosystem to maintain terrestrial life. Terrestrial ecosystems have provided a variety of important ecosystem functions for our society (Manning et al., 2018). Plant traits' role as important determinants of ecosystem functions has been widely recognized (Chapin et al., 2000), and various trait syndromes can result in distinct broad differences in ecosystem functions (Reichstein et al., 2014). In the context of global climate change, it is also essential to understand the potential changes in ecosystem functions (Grimm et al., 2013). The response of terrestrial ecosystem functions to changes in climate, plant traits, and the corresponding mechanisms is complex due to enormous spatial and temporal variations across ecosystems, climate zones, and also space scales and timescales (Diaz and Cabido, 1997; Madani et al., 2018; Myers-Smith et al., 2019). Given the enormous variations, on the global scale, these issues have not been clarified well.
In the past decades, measurements of ecosystem functions have been increasingly available to support studies of the relations between ecosystem functions and climate variables. For example, eddy-covariance flux tower observations (Baldocchi, 2014) for carbon flux (i.e., net ecosystem exchange – NEE) and water flux (i.e., evapotranspiration – ET) have been widely used to investigate changes in ecosystem functions and their responses to climate change, vegetation condition changes, etc. (Jung et al., 2020, 2010; Migliavacca et al., 2021; Peaucelle et al., 2019). With the increase in such observations, various statistical analysis approaches such as machine learning (Barnes et al., 2021; Migliavacca et al., 2021; Reichstein et al., 2019; Shi et al., 2022a, b; Tramontana et al., 2016) have been used to mine the hidden information on the effects of climate change and its induced changes in, for example, vegetation on ecosystem function variables such as carbon and water flux, which has not been understood in depth by process-based models (e.g., biogeochemistry models; Sakschewski et al., 2016). For example, using random forests (RFs) and principal component analysis (PCA), a recent study (Migliavacca et al., 2021) quantified the three main axes of terrestrial ecosystem functions and their drivers based on observations of carbon and water fluxes at FLUXNET stations (Pastorello et al., 2020) and various climate and plant trait variables. Generally, data-driven approaches have become increasingly important recently in this area (Reichstein et al., 2019).
However, compared to the process-based models, most of these data-driven approaches lack representation of the causality and detailed processes in the relations between ecosystem functions and climate despite the widely recognized complex causal interactions between ecosystems and climate systems (Reichstein et al., 2014). Conventional methods such as multiple linear regression have been questioned in attribution studies of the relationship between climate and the carbon cycle (Wang et al., 2022). For example, the use of multiple linear regression may underestimate the direct effect of soil moisture possibly due to the covariance between variables (Wang et al., 2022). For machine learning techniques, current common algorithms such as RF (Migliavacca et al., 2021) can report the importance of features (IMP) to measure their contributions to the prediction model. However, IMP-based attribution to the target variable can also be unreliable if considerable confounders and correlations between predictor variables exist (Strobl et al., 2008; Toloşi and Lengauer, 2011). The less relevant predictors can replace the predictive predictors (due to correlation) and thus receive undeserved high feature importance (Strobl et al., 2008). Correlations between predictors can lead to biased IMP-based findings. It is thus important to recognize the difference between correlation and causality in these approaches and represent detailed causal relations between features rather than the unreliable IMP rankings generated from correlated features.
Bayesian network (BN) is a causal graphical model based on conditional probability representation (Friedman et al., 1997; Pearl, 1985) that characterizes the transmission of cause and effect through conditional probabilities between variables. Currently, BN has been used in modeling causal relationships in many fields and has demonstrated advantages in causal interpretation, including in the fields such as hydrology and ecology (Chan et al., 2010; Keshtkar et al., 2013; Milns et al., 2010; Pollino et al., 2007; Shi et al., 2021a, b; Trifonova et al., 2015). However, BN has rarely been used in the study of the attribution of changes in ecosystem functions. Therefore, this study used BN to attribute the controls of climate and plant traits over ecosystem functions by quantifying the causal relationships involved. The data used were from a previous study (Migliavacca et al., 2021) which extracted ecosystem function, climate, and plant trait variables from FLUXNET flux stations. The construction of the causal structure of BN referred to the previous expert knowledge of this system (Reichstein et al., 2014). Further, by comparing BN-based attribution analysis, linear correlation analysis, and RF-based IMP reported by the previous study (Migliavacca et al., 2021), we investigated the added value of using BN for causal analysis and discuss its prospects in this paper.
2.1 Data
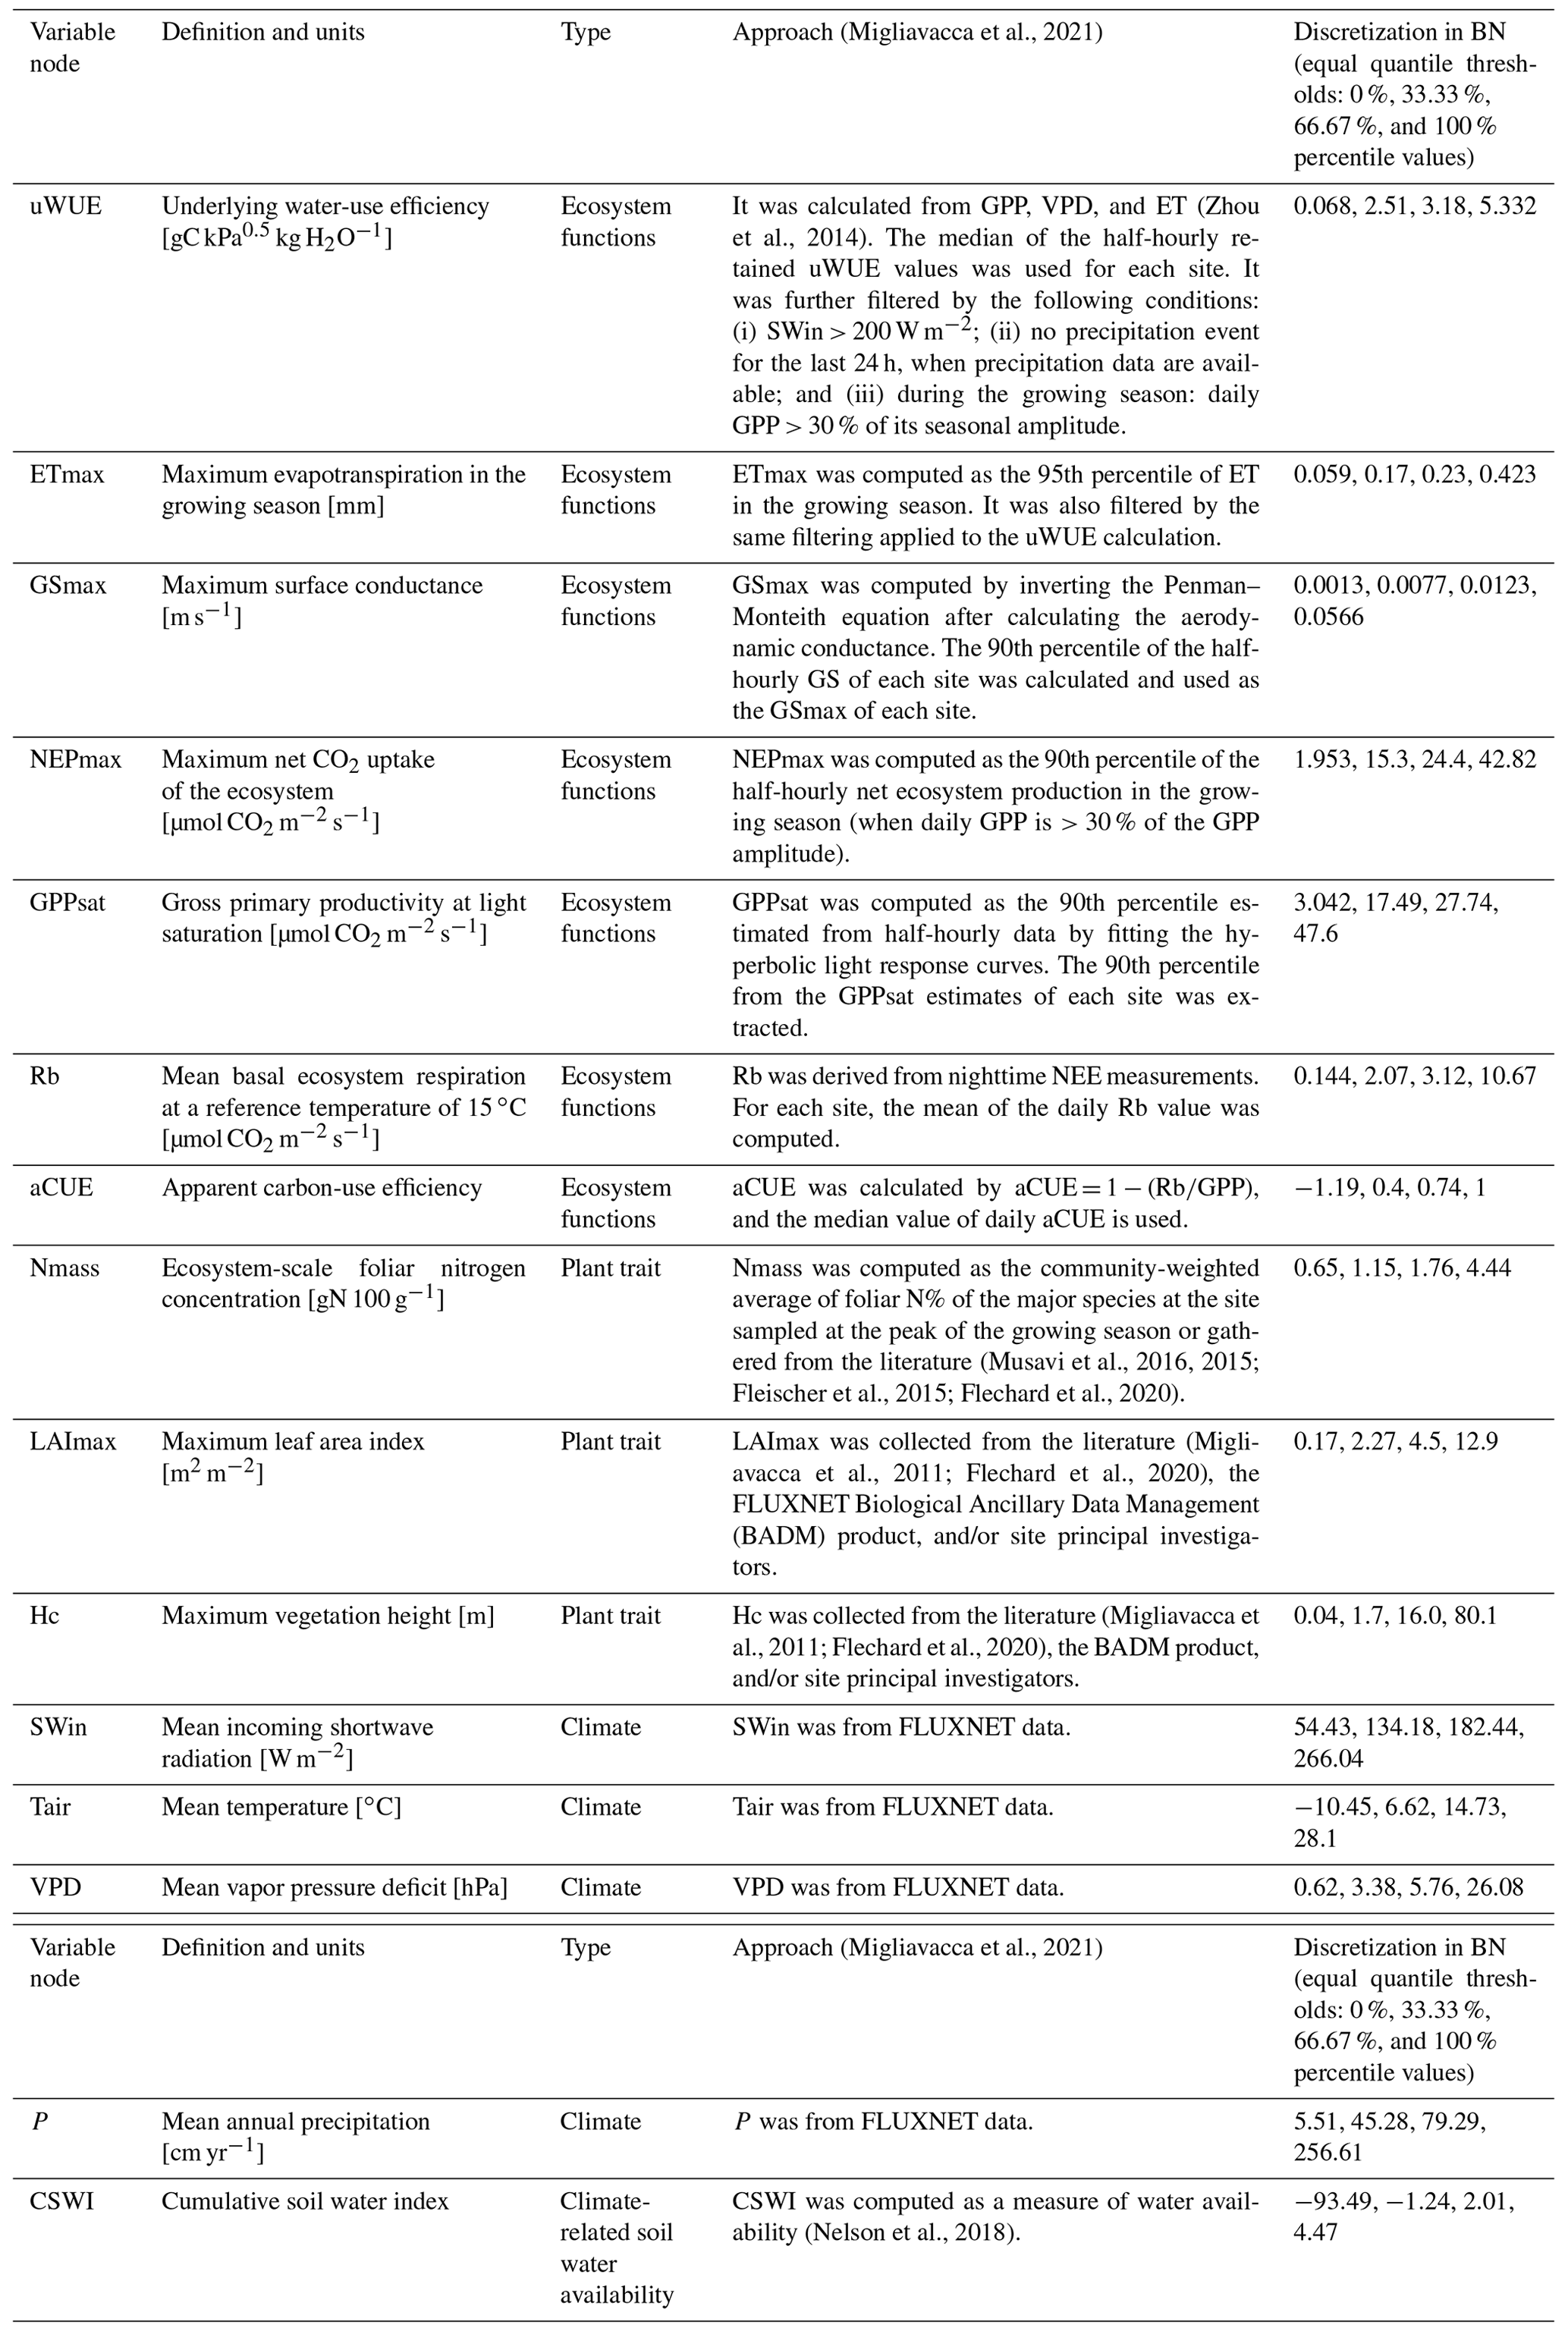
The used variables (Table 1) include the carbon and water fluxes of the FLUXNET flux tower sites and the ecosystem function variables derived from them, as well as information on the corresponding climate variables and plant traits:
- a.
Ecosystem function variables: underlying water-use efficiency (uWUE), maximum evapotranspiration (ETmax), maximum surface conductance (GSmax), maximum net CO2 uptake of the ecosystem (NEPmax), gross primary productivity at light saturation (GPPsat), mean basal ecosystem respiration at a reference temperature of 15 ∘C (Rb), and apparent carbon-use efficiency (aCUE).
- b.
Plant trait variables: ecosystem-scale foliar nitrogen concentration (Nmass), maximum leaf area index (LAImax), and maximum vegetation height (Hc) (of the 202 sites in total (Migliavacca and Musavi, 2021), 101 sites have Nmass data, 153 sites have LAImax data, and 199 sites have Hc data, and only 98 have data on all these three plant trait variables).
- c.
Climate variables: mean incoming shortwave radiation (SWin), mean temperature (Tair), mean vapor pressure deficit (VPD), mean annual precipitation (P), and cumulative soil water index (CSWI).
These data have different producing processes, including those calculated from flux data and site records and those extracted from remote sensing data. The detailed calculation methods can be found in Migliavacca et al. (2021).
2.2 BN for analyzing causal relations
2.2.1 BN structures
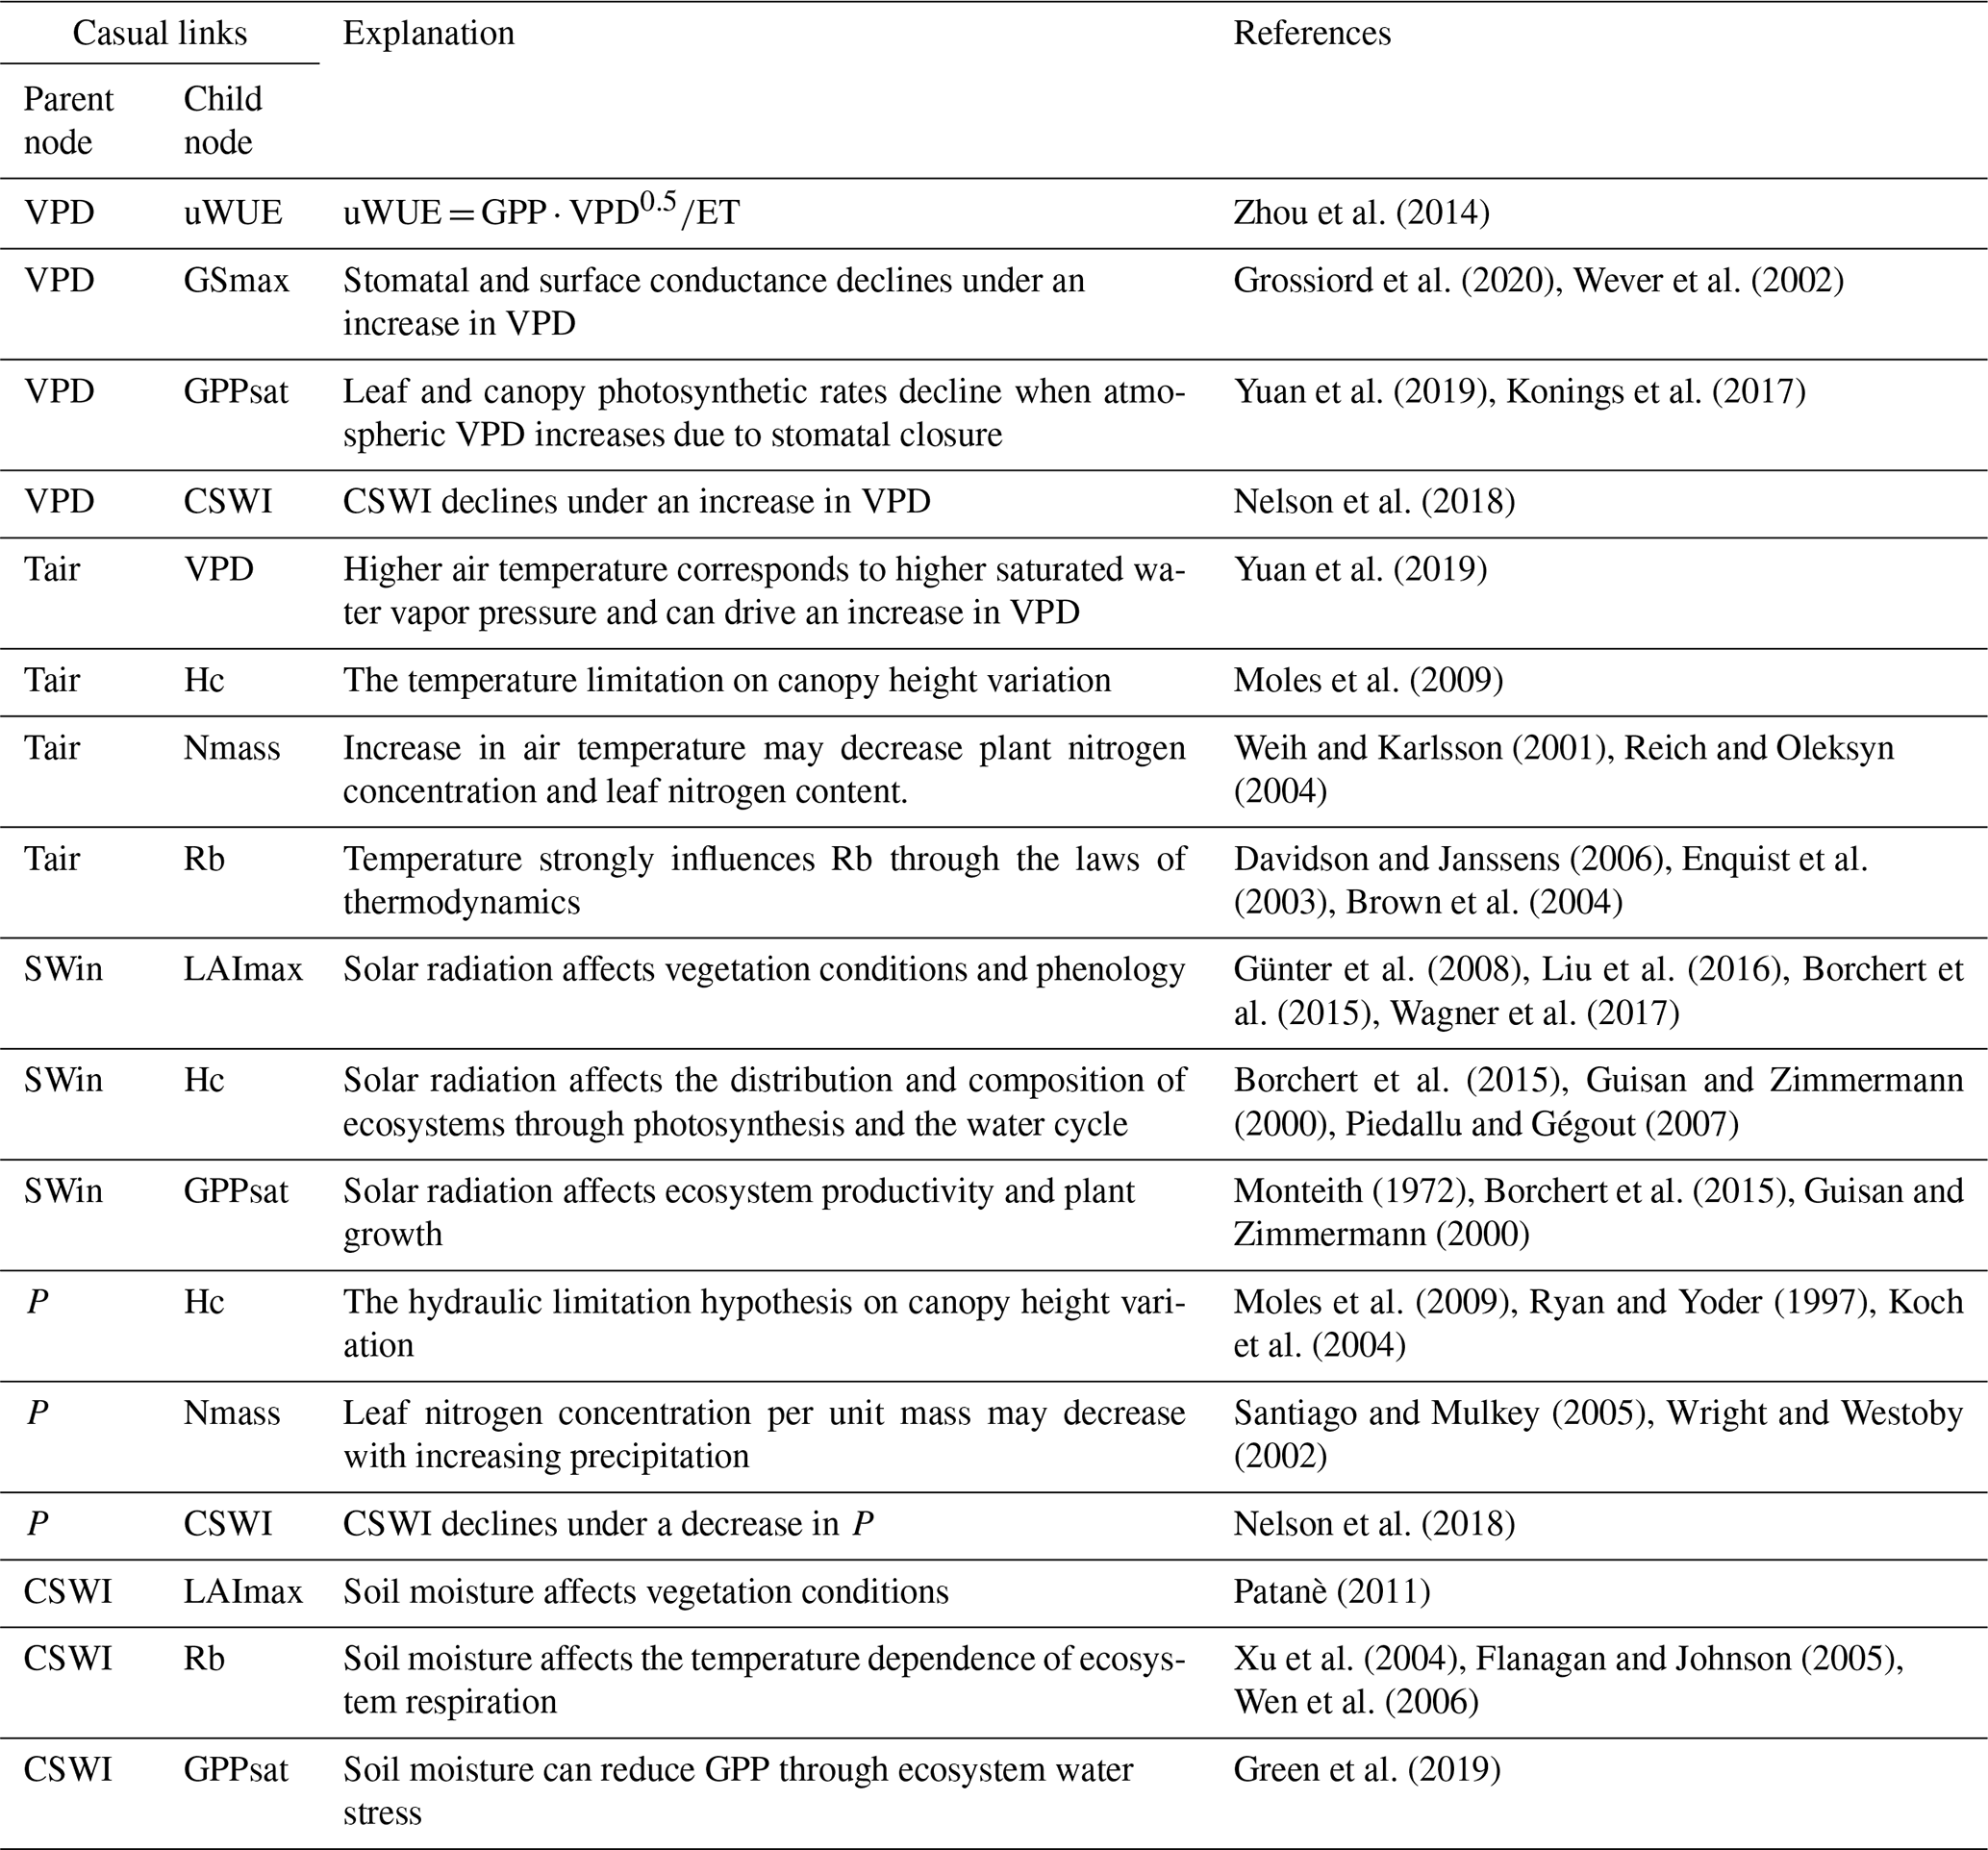
Based on expert knowledge (Reichstein et al., 2014), we constructed the structure of BN containing the causal relationships between plant traits and ecosystem function variables: “BN_plant_trait”. The causal links between the variables are referred to in the relationship diagram in the upper part of Fig. 1. Further, we added the climate variables and the corresponding causal relationships, expanding “BN_plant_trait” to “BN_plant_trait_climate”, which further incorporates the climate variables and their impacts on the system (Fig. 1). The explanation of added causal links was shown in Table 2.
Each node is discretized for the BN compiling by the software Netica. The equal quantile (Nojavan et al., 2017) three-level discretization (the distribution of nodes (Fig. S1 in the Supplement) is divided into three levels) for each node is applied by the discretization thresholds of 0 %, 33.33 %, 66.67 %, and 100 % percentile values of the data distribution (Table 1) given the limitation of the amount of training data.
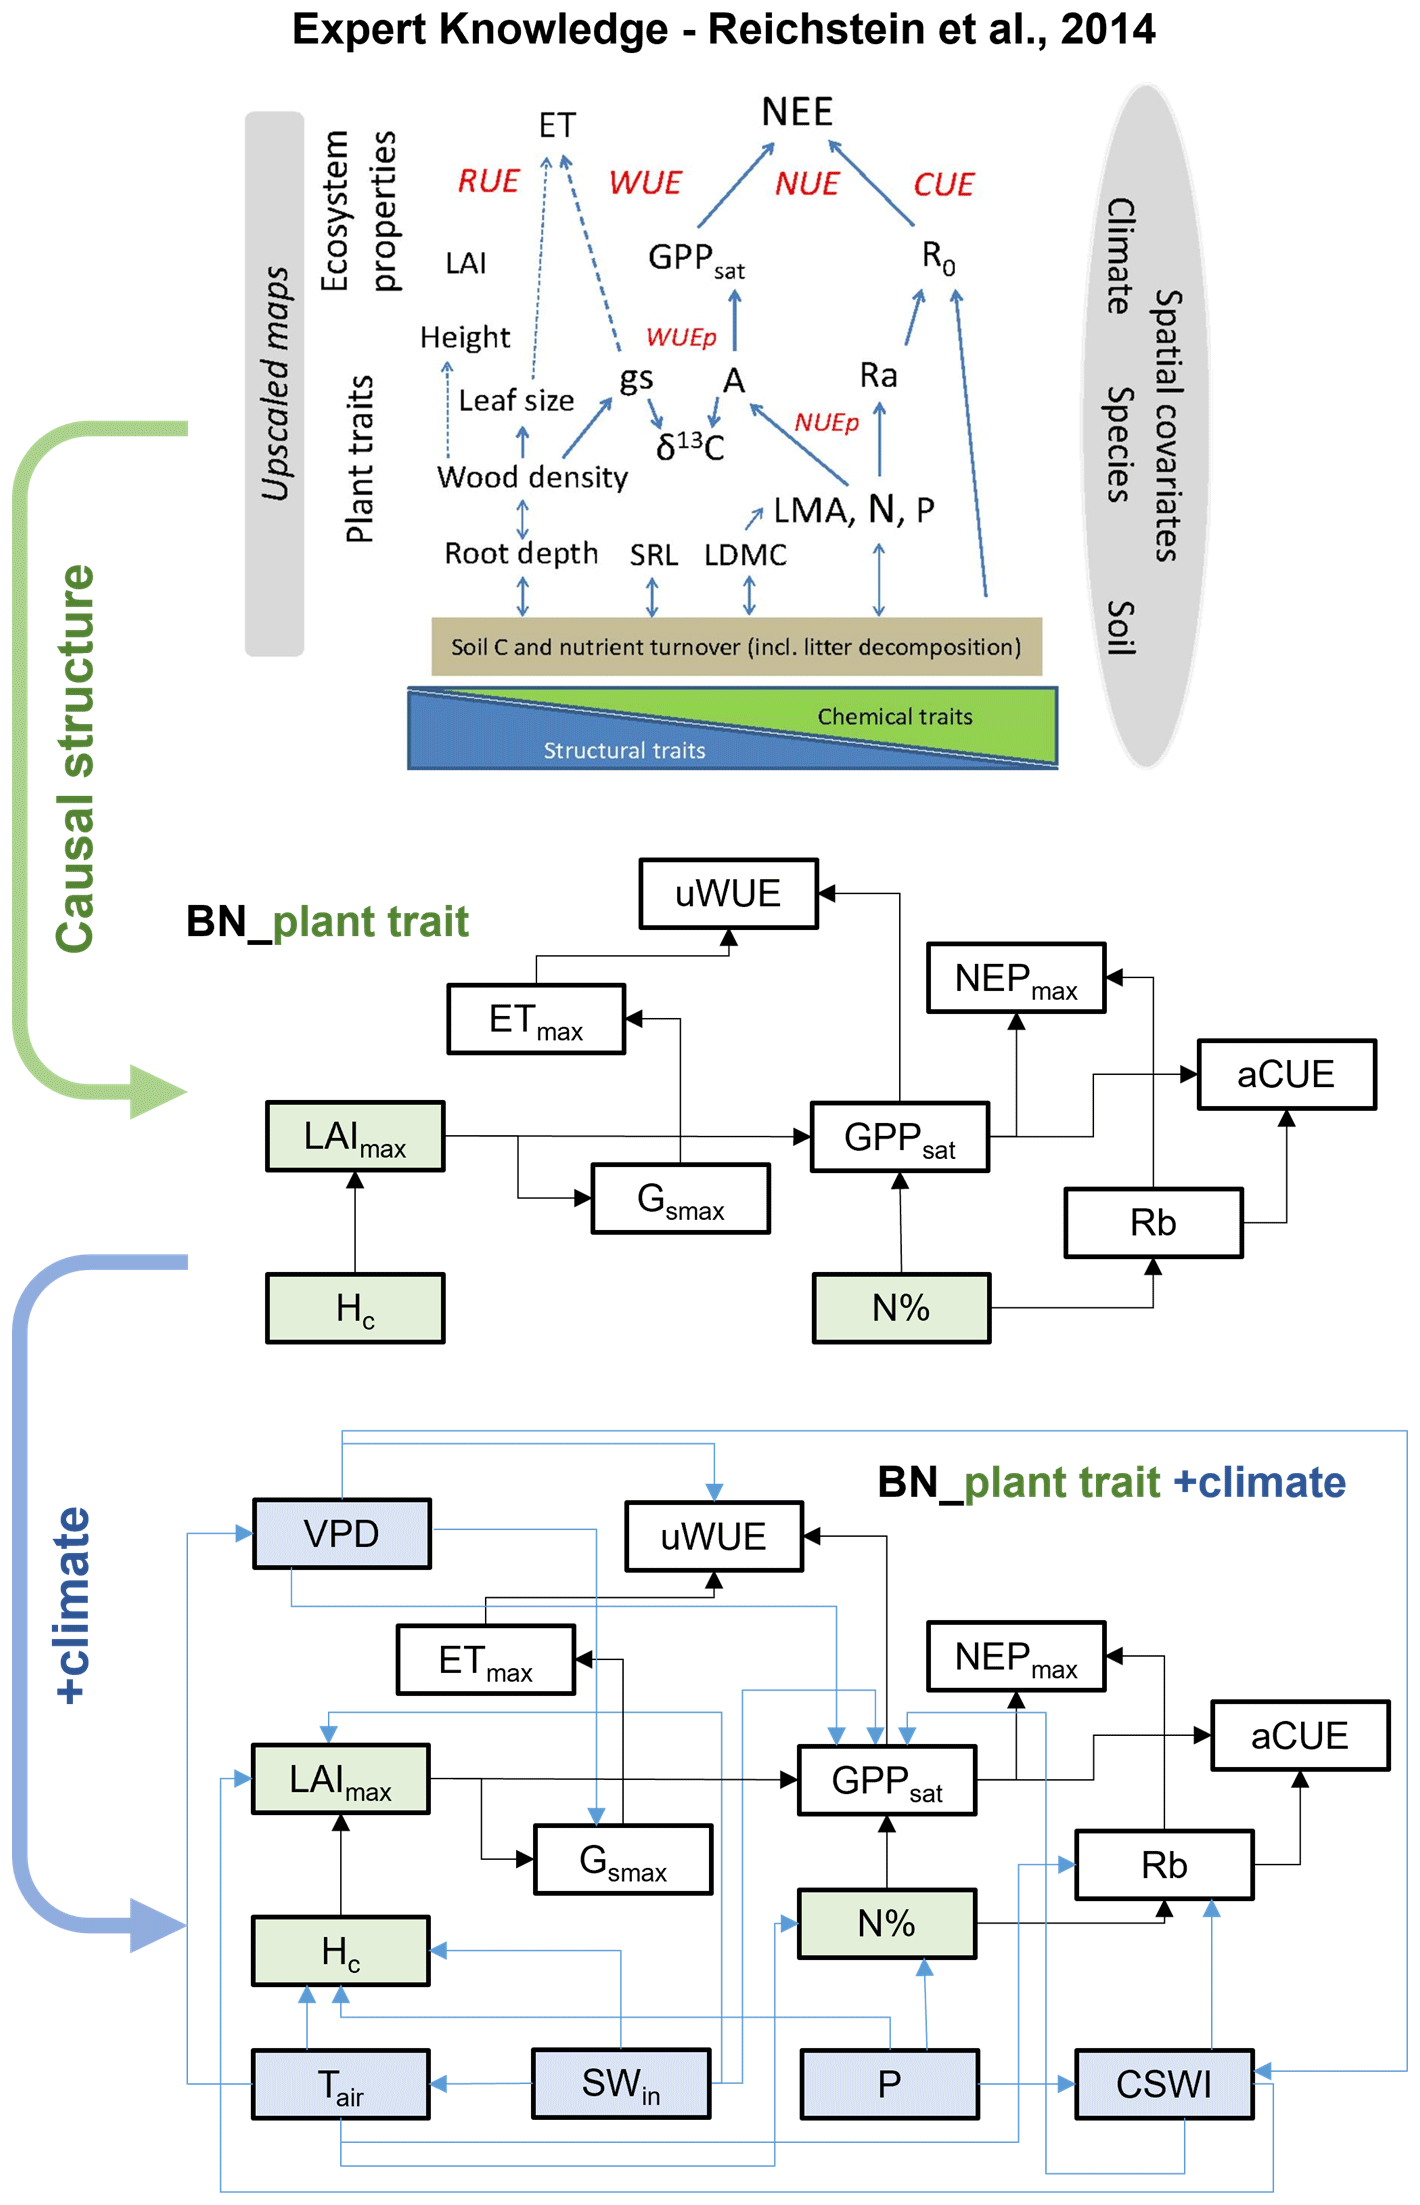
Figure 1The structure of two Bayesian networks (BNs) for the attribution of variations in ecosystem functions. “BN_plant_trait” in the median part incorporated the causal effects of plant traits (slight green boxes) on ecosystem functions (white boxes) from expert knowledge as shown in the relation diagram in the upper part (Reichstein et al., 2014). “BN_plant_trait_climate” in the lower part further incorporated the causal impacts of climate variables (light blue boxes).
Table 2Explanation of the added causal links between climate variable nodes, plant trait nodes, and ecosystem function variable nodes in the BNs.
2.2.2 BN evaluation and node sensitivity analysis
Based on the Bayesian network (BN), the joint impacts of multiple variables and their causal relations are analyzed. A BN can be represented by nodes X1, X2, X3 to Xn and the joint distribution (Pearl, 1985):
where pa(Xi) is the probability of the parent node Xi. Expectation–maximization (Moon, 1996) is used to address the data with missing values and then compile the BN.
We used k-fold cross-validation to verify the reliability of the BN. The k-fold approach has been widely used in previous studies for the validation of BNs (Marcot, 2012). In this study, k is set as 10, as commonly done (Marcot and Hanea, 2021). We choose ETmax, GPPsat, and NEPmax for the cross-validation of accuracy; the predicted status (status with the highest probability bar value) of the nodes will be compared with the actual status, and the classification accuracy will be calculated. These three nodes are the main terminal nodes and primary objectives of the BN and represent the main water- and carbon-related ecosystem functions, respectively. The accuracy of these three variables can largely reflect the overall performance of BN.
A sensitivity analysis is used for the evaluation of the strength of the causal relations between nodes based on mutual information (MI). MI is calculated as the entropy reduction in the child node resulting from changes found at the parent node (Shi et al., 2020):
where H represents the entropy, Q represents the target node, F represents the set of other nodes, and q and f represent the status of Q and F. In this study, we assessed the sensitivity of ecosystem function variables to climate and plant trait variables.
2.2.3 Comparing different approaches used for attribution analysis
Further, to clarify the added value of considering causality in the attribution analysis of controls over ecosystem functions, the results of the BN-based sensitivity analysis (BN_sens) were compared with the other two approaches. They are the results of the absolute values of additional linear correlation analysis (linear_corr) in this study and the findings in Migliavacca et al. (2021) using RF feature importance (RF_imp). BN_sens and linear_corr directly measure the effects of plant traits and climate variables on ecosystem function variables, while RF_imp measures their effects on the three principal components (PC1, PC2, and PC3) of ecosystem function variables, which were reported as the three major axes of ecosystem functions by Migliavacca et al. (2021). It was obtained from a principal component analysis of 12 ecosystem function variables which included the six variables uWUE, ETmax, GSmax, NEPmax, GPPsat, and Rb used in the methods BN_sens and linear_corr. The first axis (PC1) explains 39.3 % of the variance and is dominated by maximum ecosystem productivity properties, as indicated by the loadings of GPPsat and NEPmax, and maximum evapotranspiration (ETmax). The second axis (PC2) explains 21.4 % of the variance and refers to water-use strategies as shown by the loadings of water-use efficiency metrics, evaporative fraction, and GSmax. The third axis (PC3) explains 11.1 % of the variance and includes key attributes that reflect the carbon-use efficiency of ecosystems. PC3 is dominated by apparent carbon-use efficiency, basal ecosystem respiration (Rb), and the amplitude of evaporative fraction (Migliavacca et al., 2021).
3.1 Correlation analysis
A linear correlation analysis of the variables (Fig. 2) showed significant (P<0.05) linear correlations between the ecosystem function variables and some of the climate and plant trait variables. SWin and VPD showed negative correlations with these ecosystem function variables. LAImax and Hc showed significant positive relationships with most of the ecosystem function variables and significant negative relationships with SWin and VPD. Nmass only showed a positive relationship with ETmax. In addition, the majority of the ecosystem function variables showed significant (P<0.05) positive correlations with each other.
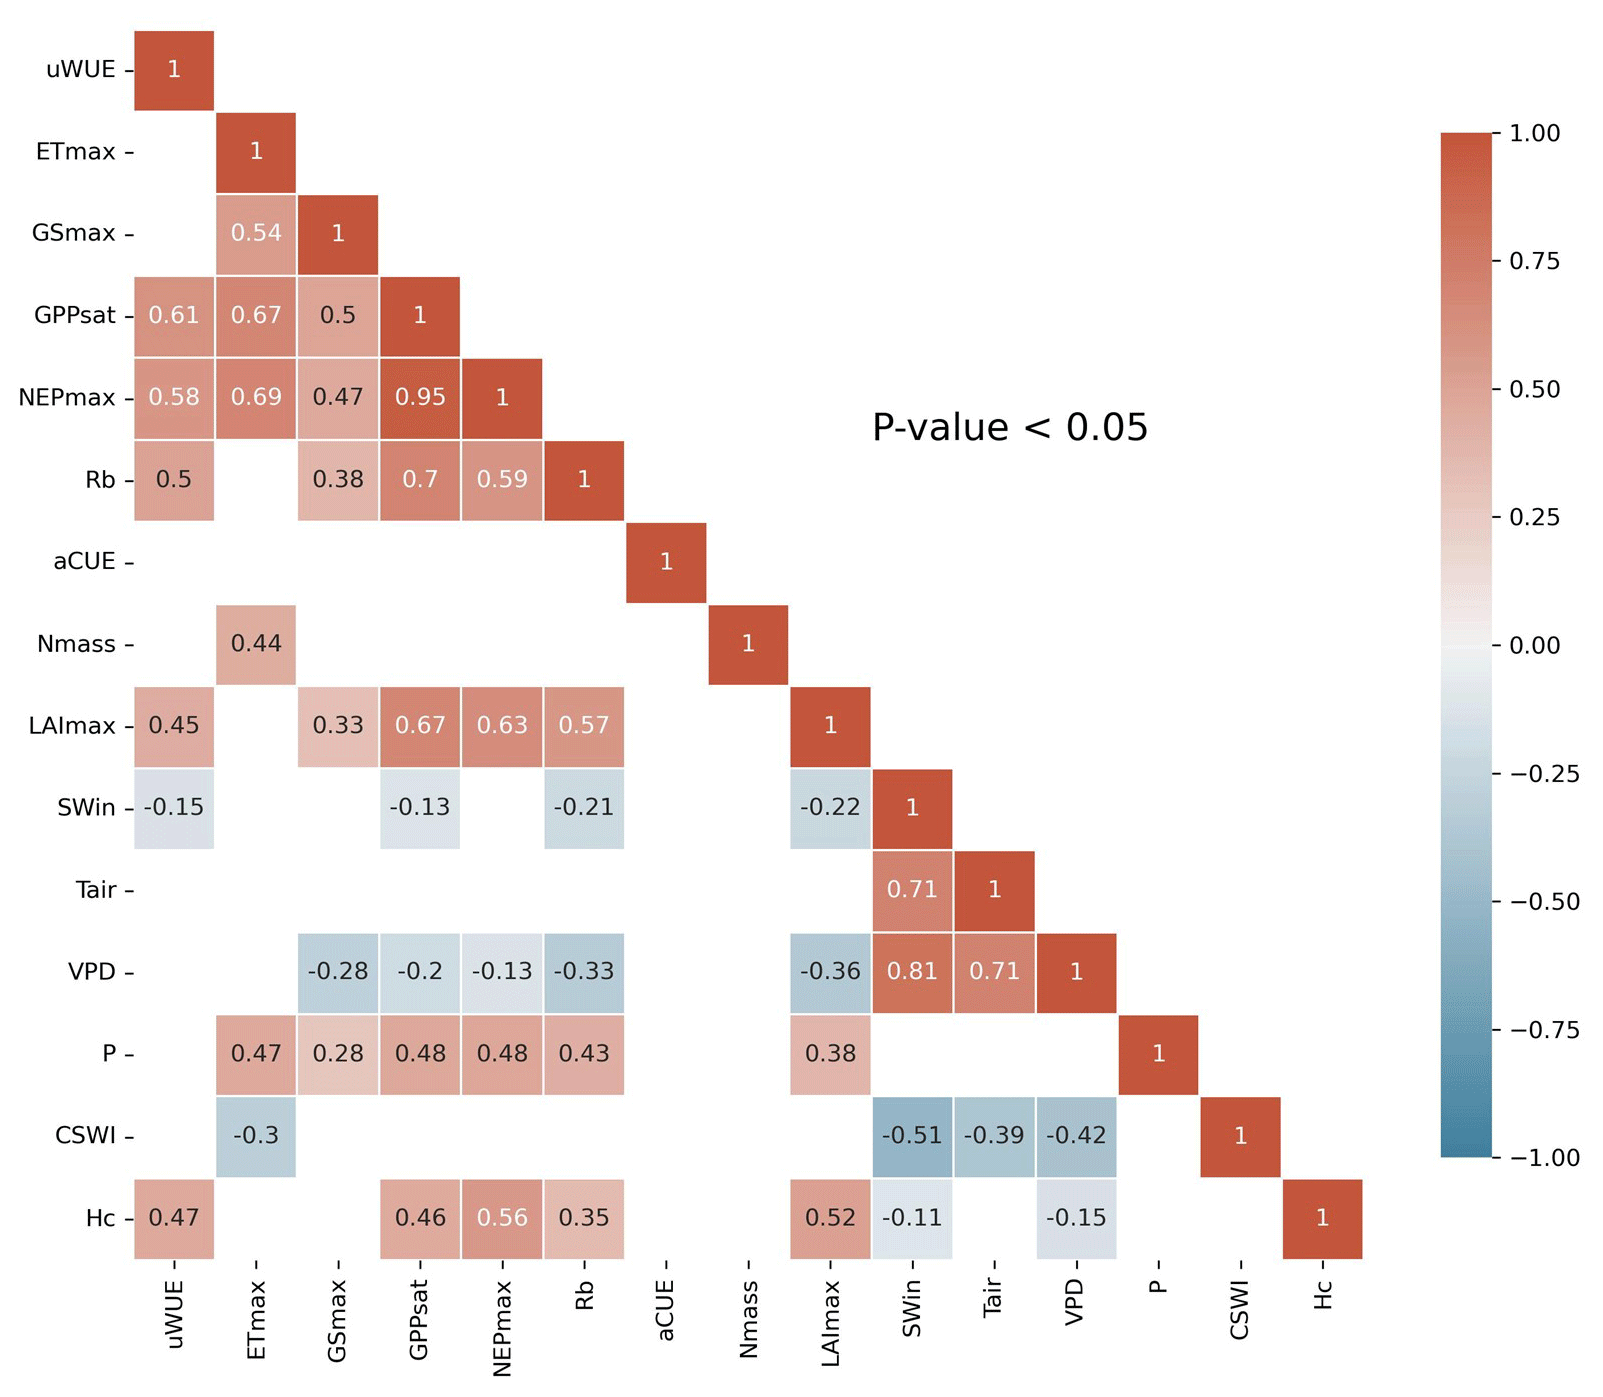
Figure 2Correlation coefficient matrix of ecosystem functions and climate and plant trait variables for FLUXNET sites. Only correlation coefficients with p values less than the 0.05 level of significance are shown.
3.2 BN-based analysis
We compiled two different BNs (i.e., BN_plant_trait and BN_plant_trait_climate) (Fig. 3) and found that the probability distributions of the values of the common nodes (ecosystem function and plant trait variable nodes) differed a little (e.g., in the probability distribution of LAImax, Hc, and Nmass) between the two BNs. Compared to BN_plant_ trait, in BN_plant_trait_climate, the climate variables of sites with missing plant trait data forced the changes in the probability distributions of LAImax, Hc, and Nmass. In the EM algorithm, for sites with missing plant trait data, existing relationships (obtained from observations from other sites) between plant trait variables and climate variables are used in the data interpolation of plant trait variables. In BN_plant_ trait_climate, the added linkages of climate variables to plant trait variables resulted in higher probability values of the low-value status of the plant trait variables.
The 10-fold cross-validation of the nodes ETmax, GPPsat, and NEPmax showed relatively high accuracy. The classification accuracy (Table S1 in the Supplement) of the status of ETmax was 60.9 %, the classification accuracy of the status of NEPmax was 84.2 %, and the classification accuracy of the status of GPPsat was 75.2 %.
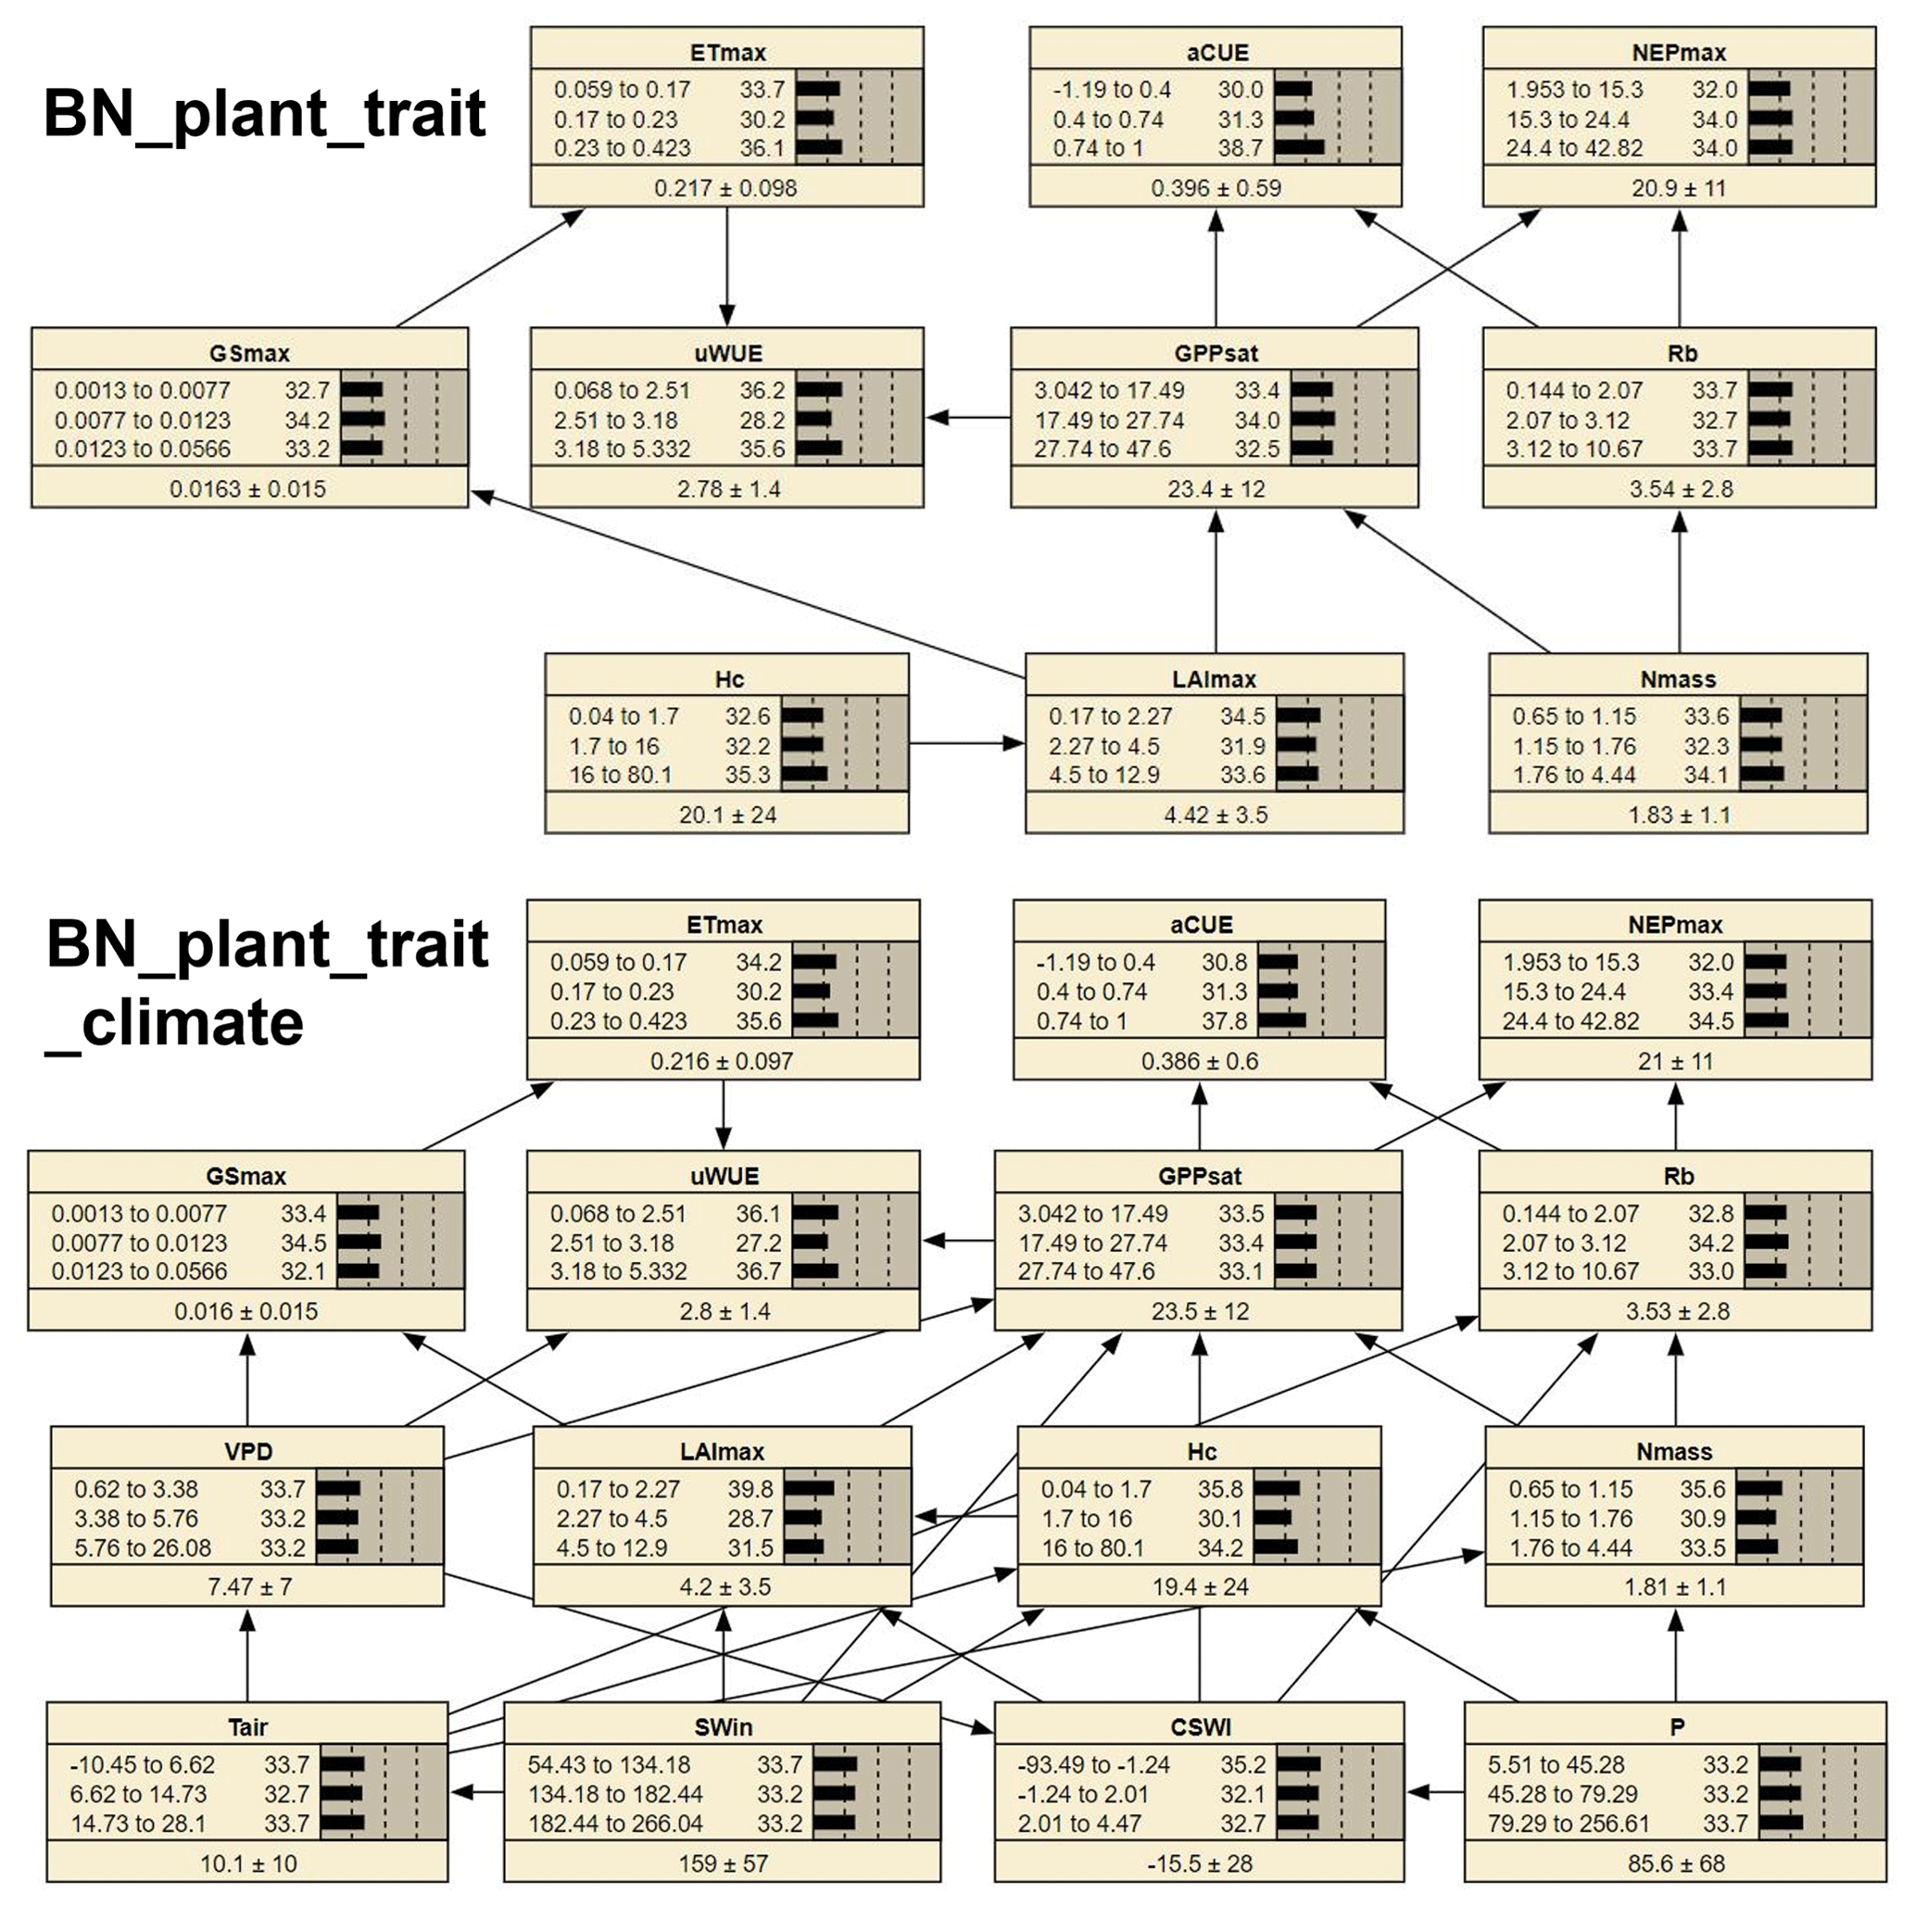
Figure 3The two compiled BNs (“BN_plant_trait” and “BN_ plant_trait_climate”). The bars of each node represent its probability distribution. At the bottom part of each node, the left and right side values of the “±” are the mean and standard deviation of the distribution, respectively.
We performed sensitivity analyses (Fig. 4) on the ecosystem function variables in both BNs to assess their sensitivity to various climate and plant trait variables. We also calculated the difference in sensitivity MI between the two BNs (Fig. 4) to compare the change in sensitivity of ecosystem functions to each variable after adding further climate variables to the plant trait variables only. The sensitivity of different ecosystem function variables to plant traits and climate variables was highly variable in both BNs. The magnitude of sensitivity of ecosystem function nodes to plant traits and climate variables was related to whether these plant traits and climate variables were set as their parent nodes. In BN_plant_trait, carbon fluxes GPPsat and NEPmax were more sensitive to Nmass and LAImax due to the parent node setting. For the water flux ETmax, it does not have high sensitivity to plant trait variables such as LAImax and Hc, although these plant trait variables are set as the parent nodes of ETmax. This indicates the difference in the strength of the control effects of plant traits on carbon and water fluxes.
In the sensitivity analysis of BN_plant_trait_climate, the sensitivity patterns of the ecosystem function variables changed as a result of the inclusion of climate variables and the change in causality they introduced. The sensitivity of the ecosystem function variables to climate variables was significantly increased (especially for Tair, VPD, and CSWI). The control of plant traits over ecosystem functions in BN_plant_trait is also partially transformed into an indirect effect of climate variables by first controlling plant trait variables and then controlling ecosystem functions. For example, in BN_plant_trait_climate, for GPPsat, a decrease in the sensitivity of GPPsat to LAImax and an increase in the sensitivity to Tair was observed after the causal chain of Tair influencing Hc, LAImax, and then GPPsat was set. This can be explained by the fact that higher temperatures promote vegetation growth and thus may increase LAImax, which then indirectly alters the probability distribution of the GPPsat node. In previous studies based on statistical methods that did not consider the chain causality, this indirect control over GPPsat from Tair may have been included in the contribution of LAImax to GPPsat. Similarly, a chain causality of P by first affecting Nmass and then indirectly GPPsat was also found. However, the effect of P by first affecting Hc and LAImax and then indirectly affecting ETmax and GSmax appears to be not large.
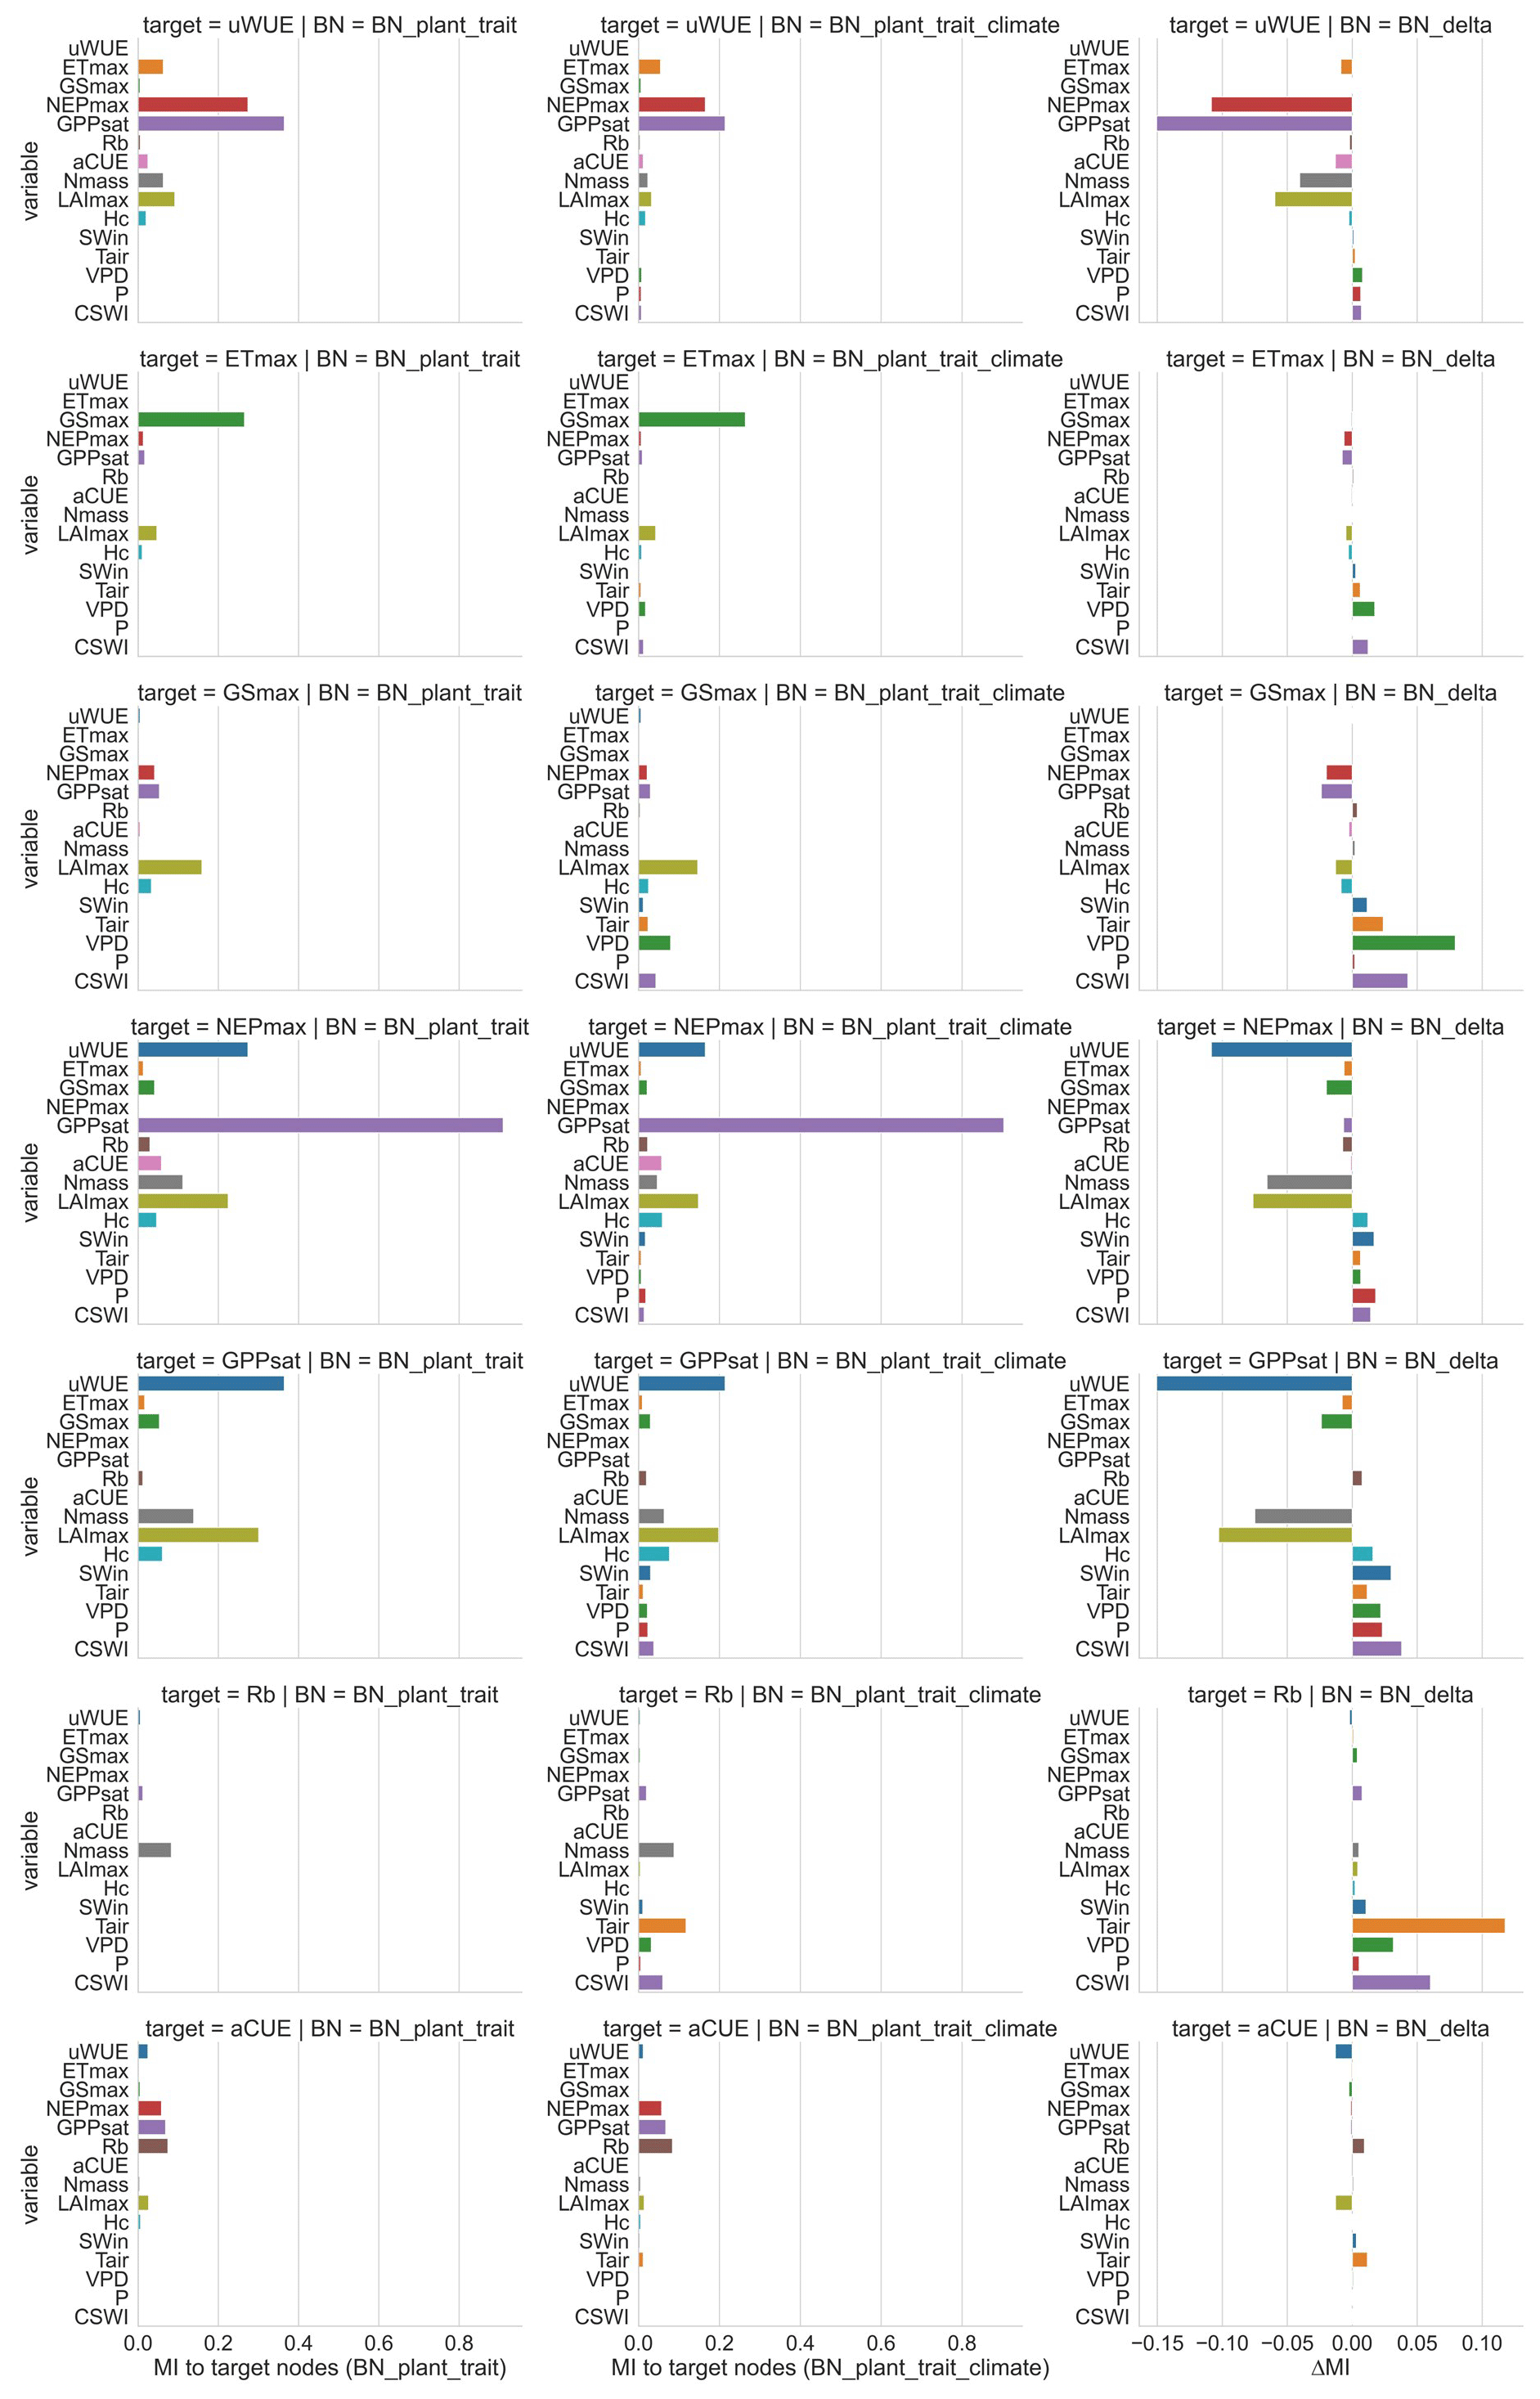
Figure 4Sensitivity of ecosystem function variables to other variables in different networks based on mutual information (MI). The left column is the sensitivity analysis of BN_plant_trait, the middle column is the sensitivity analysis of BN_plant_ trait_climate, and the right column is the difference between the reported sensitivity of BN_plant_ trait_climate and the sensitivity of BN_plant_trait. For BN_plant_trait, the MI values of climate variables to ecosystem function variables are all 0 because they do not contain climate variables. For each ecosystem function in these two BNs, its sensitivity to its child node is not shown (set as 0) because child nodes are not considered causal variables and thus are not evaluated in the attribution.
3.3 Comparing results from RF-based, BN-based analysis, and correlation analysis
All three methods show the importance of the plant trait variables in explaining the variation in various ecosystem function variables (Table 3). LAImax was the most important of the three methods in explaining the variation in maximum ecosystem productivity properties (corresponding to PC1). In contrast to the results of the other two methods, in linear_corr, SWin and VPD were the least important, while P was more important. Comparing RF_imp and BN_sens, the overall pattern of importance is similar, but there are differences. For water-use strategies (corresponding to PC2), Hc is ranked first and LAI last in RF_imp, but in BN_sens, LAI is slightly more important than Hc. In linear_corr, Hc and LAI are of similar importance. For PC3, VPD ranks first and is more important than Tair in RF_imp. But in BN_sens, Tair is more important than VPD. Among the three moisture-related climate variables (i.e., VPD, P, and CSWI), CSWI appears to be the least important in RF_imp but is comparable to VPD in BN_sens.
Given the limitations of RF_imp in responding to the correlated variables (Strobl et al., 2008), the difference between the significance of VPD and CSWI reported by RF_imp may be overestimated. For the ecosystem functions related to water-use strategies, the difference between LAImax and Hc reported by BN_sens is also much smaller than the difference reported by RF_imp. It implied that, with the causality relation between correlated variables constructed, BN_sens reduced the uncertainty in quantifying the importance of correlated variables.
Table 3Comparisons of relationships of ecosystem functional variables to plant traits and climate variables in different analyses.
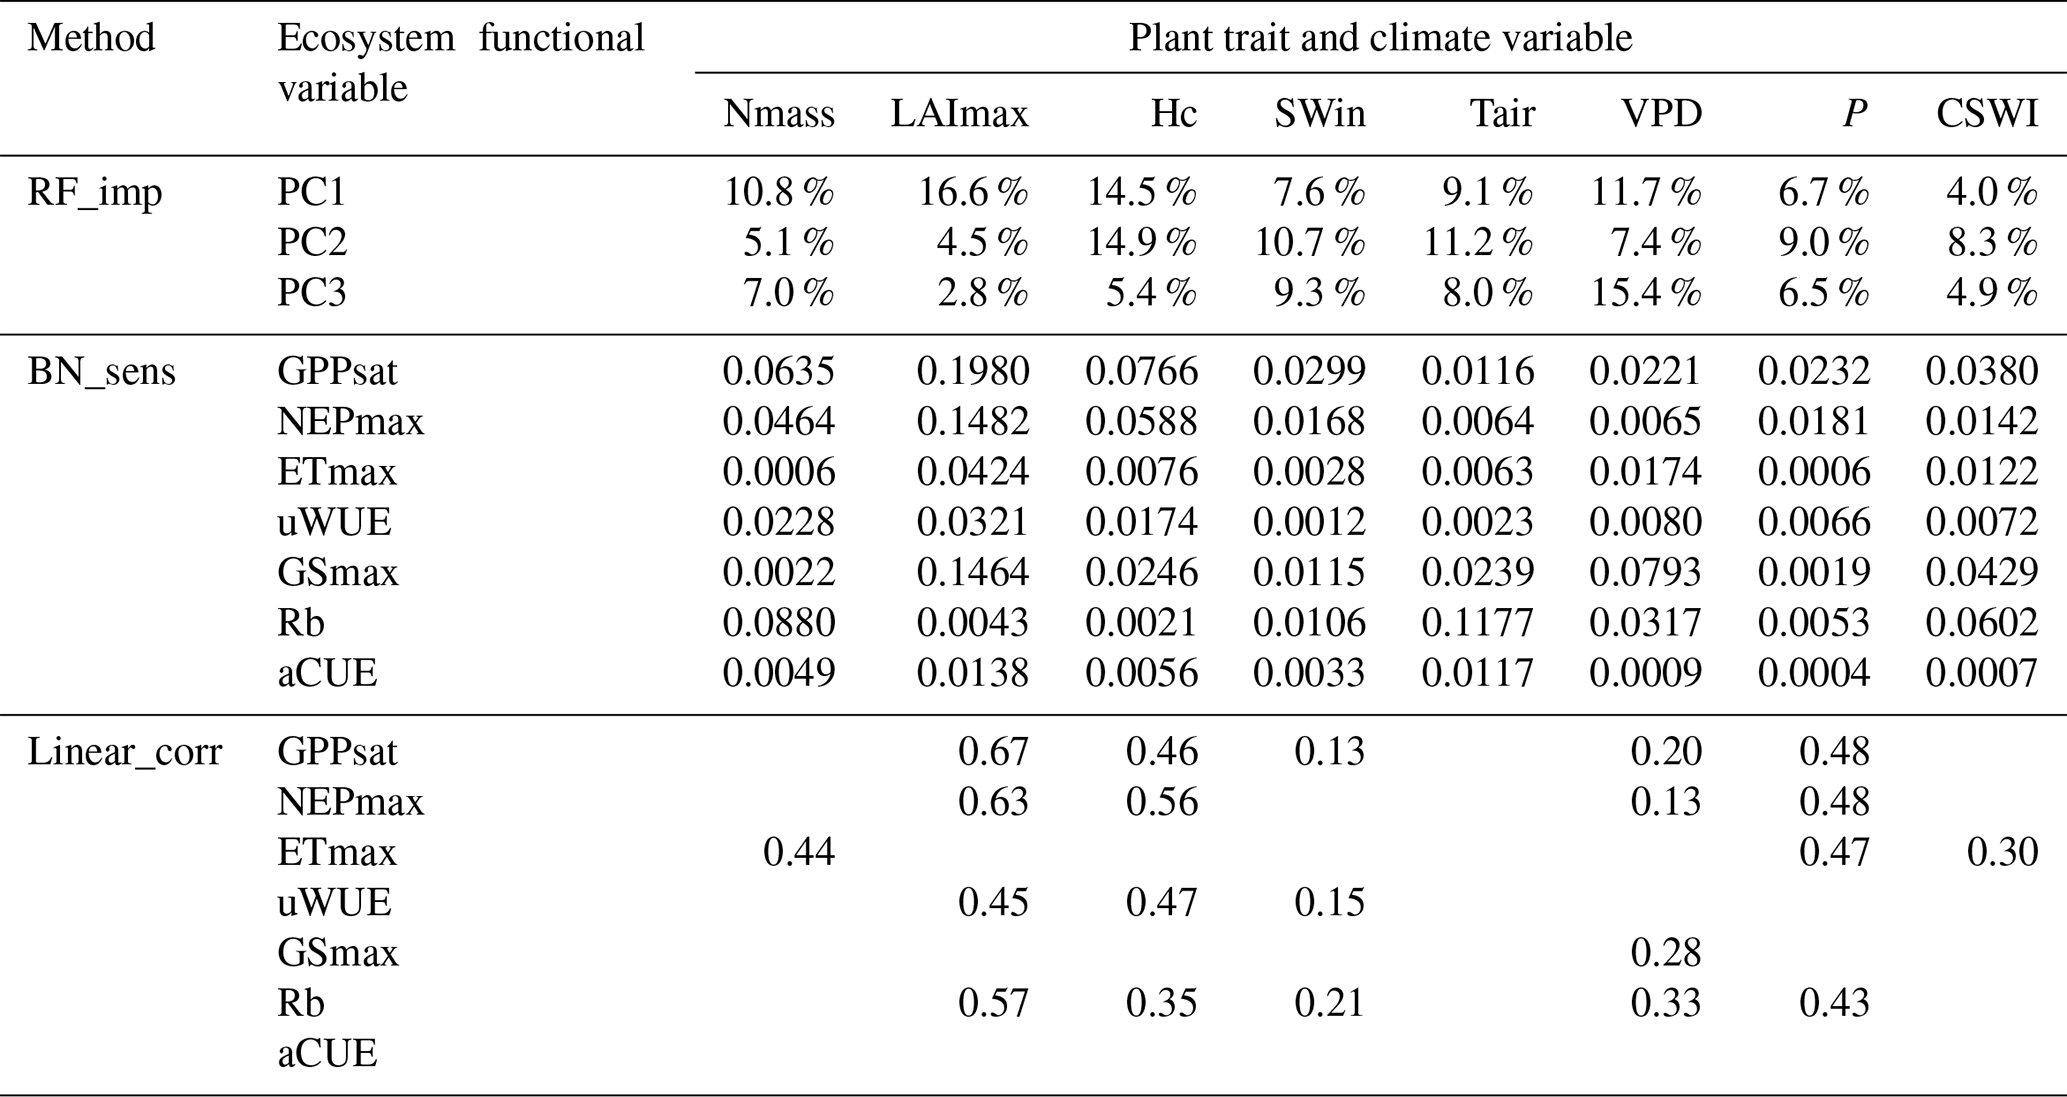
Note: method RF_imp is random forest variable importance (Migliavacca et al., 2021) (see Methodology section). Method linear_corr is linear correlation analysis with the absolute values of Pearson correlation coefficients (see Methodology section). Method BN_sens is a BN-based sensitivity analysis with sensitivity MI values reported.
Based on BN, this study investigates the prospect of using causal graphical models to revisit and attribute the control of climate and plant trait variations over ecosystem functions. Because of the inclusion of the constraints provided by expert knowledge (Reichstein et al., 2014) and other perceptions from many previous studies, a BN-based attribution analysis is relatively reliable in terms of the represented mechanisms of causal links. It can update our knowledge of the contribution of some teleconnection variables through causal chains. The effective implementation of BN-based causal analysis may depend on the reliability of the causal relationships provided by expert knowledge (directional links between variables). We can establish the connection relationships and network structures between variables from expert knowledge and assign the specific quantification of the connection relationships (conditional probability tables) to observations (Shi et al., 2021a). If further combined with findings from process-based models, it is promising to significantly improve our understanding of the complex climate–plant-trait–ecosystem function relationships by comparing detailed relationships and structural influences between variables.
BN essentially factorized the joint probability distribution between various variables into a series of conditional probability distributions (Ramazi et al., 2021), and the reliability of this approach relied on the setting of causal control relationships between nodes. Expert knowledge was thus critical in the construction of BNs, especially when modeling complex systems. In addition to the causal relationship between nodes, the meaning represented by each node, the data source and/or approach, and the spatial and temporal resolutions may also have impacts on the results. For example, in this study, for multiple water-use efficiency-related variables in Migliavacca et al. (2021), uWUE was chosen, and for Rb, the mean value of Rb was chosen. The results of BN-based analysis may vary if different representations or meanings of nodes are selected. The way the data of each variable is observed and produced, the spatial and temporal resolutions of the data, and other issues can also affect the understanding of the role of these variables in the data-driven BN. Some variables may be very important in the attribution of actual ecosystem function variation, but their importance may be underestimated due to limitations in the inherent observational accuracy of their data and differences in their spatial and temporal scales from other variables. In addition, some variables such as soil moisture may be difficult to obtain due to the lack of continuous site-scale long-term observations. Using the water balance method to calculate CSWI as a proxy may introduce errors. Since the CSWI calculation method relies on P, the obtained relationship between P, CSWI, and other nodes may have contained empirical components. If the availability of measurements of some nodes is low, modelers should be cautious about the empirical dependencies with other nodes that may be included in the alternative data approaches. Thus, the alternative use of multiple derivatives of a variable and data generated by different methods for the construction of different BNs can help us to recognize how the uncertainty in the nodes and data can influence BN-based attribution findings. Different node discretization schemes may also affect the conditional probability table between nodes as well as the sensitivity (Nojavan et al., 2017). Other alternative discretization schemes with the commonly used three levels may also be effective, such as using “mean − SD” (mean minus 1 standard deviation) and “mean + SD” (mean plus 1 standard deviation) as discretization thresholds, which will result in a change in the relationship between BN nodes. Further if extreme values such as the 5th and 95th percentiles are used in the node value discretization, it may be beneficial for quantifying the causal control of extreme conditions of nodes over other nodes.
When considering higher-order effects (Bairey et al., 2016), the relationships between plant traits, climate variables, and ecosystem function variables can be very complex. One variable may affect the relationship between two other variables rather than directly affecting these two variables (Bairey et al., 2016). BN may have limitations in directly analyzing such higher-order effects because BN requires the modeler to explicitly set direct causal relationships between nodes. To analyze the higher-order effects, we can add nodes that directly represent the relationship between the variables. For example, the correlation coefficient of two variables can be used as a node, and this node is connected to other nodes in the BN so that the control effect of other nodes on this correlation coefficient can be explored. Such implements may be useful to deepen the impact of various higher-order effects.
Moreover, the BN in this study was mainly based on data averaged over multiple years, thus possibly partially underestimating the effect of temporal variations in the relationships between variables. Another limitation of the BN proposed above is that the causal relationships between variables are unidirectional, while it is difficult to represent interactions and feedback between variables (Marcot and Penman, 2019). In future studies, to address these two issues, a BN based on temporal dynamics can be promising (Fig. 5). By refining the interaction of temporal lags between variables, it is possible not only to incorporate temporal variation but also to control factors that attribute interactions and feedback between variables. For example, the interaction and feedback mechanisms of VPD, soil moisture, and ET with lag effects (Fig. 5) and their impacts on ecosystems have attracted extensive interest from researchers (Anderegg et al., 2019; Humphrey et al., 2021; Lansu et al., 2020; Liu et al., 2020; Xu et al., 2022; Zhou et al., 2019), but conventional statistical methods have been ineffective in analyzing such relationships with both interactive causality and temporal lags. In contrast, the BN proposed here, which incorporates feedback effects and lagged effects that were common in climate–ecosystem relations (Lin et al., 2019), is potentially able to address this issue from a data-driven approach. In the practical modeling, different periods of the same node may still not be independent. Therefore, the split scheme of such periods may be critical. For example, a period between two precipitation events can be treated as one sample, which can enhance independence between periods. Subsequently, such a period can be divided into smaller periods such as t, t−1, and t−2 to aggregate the node values to appropriate timescales. Thus one sample can represent the interaction relationship between variables with lags in this period. Finally, we can integrate records of such periods between two precipitation events from sites across different climate zones and biomes to build synthesis models for a global analysis of such problems. Such research frameworks in BN-based modeling may be difficult due to high computational costs given the large amount of data. Fortunately, recently proposed new causal models have the potential to address this limitation, such as the introduction of causality into deep learning frameworks (Luo et al., 2020; Cui and Athey, 2022). If further combined with the findings of process-based models, our understanding of climate and ecosystem interactions and feedback and their mechanisms in time will hopefully be deepened.
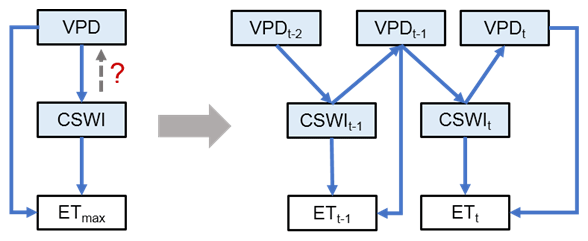
Figure 5The future BNs with the temporal causality further considered addressing the causality of the interaction between variables. The VPD–CSWI–ET relationship is used here as an example. t, t−1, and t−2 denote the current period, the last period, and the period before the last period, respectively. The network on the left only considers the effect of VPD on CSWI without considering the feedback of CSWI on the VPD. The network on the right characterizes the VPD–CSWI interaction with the feedback from CSWI at period t−1 to VPD at period t.
Based on BN, we revisited and attributed the contribution of climate and plant traits to global terrestrial ecosystem functions. The major conclusions of this study include the following:
-
BN can be used for the quantification of causal relationships between complex ecosystems in response to climate change and enables the analysis of indirect effects among variables.
-
Compared to BN, the feature importance difference between “VPD and CSWI” and “LAImax and Hc” reported by random forests is higher and can be overestimated.
-
With the causality relation between correlated variables constructed, BN_sens can reduce the uncertainty in quantifying the importance of correlated variables.
-
The understanding of the mechanism of indirect effects of climate variables on ecosystem functions through plant traits can be deepened by the chain casuality quantification in BNs.
The codes and data that were used for all analyses are available from the first author (shihaiyang16@mails.ucas.ac.cn) upon request.
The supplement related to this article is available online at: https://doi.org/10.5194/bg-20-2727-2023-supplement.
HS and GL initiated this research and were responsible for the integrity of the work as a whole. HS performed formal analysis and calculations and drafted the manuscript. HS was responsible for the data collection and analysis. GL, PDM, TVdV, OH, and AK contributed resources and financial support.
The contact author has declared that none of the authors has any competing interests.
Publisher’s note: Copernicus Publications remains neutral with regard to jurisdictional claims in published maps and institutional affiliations.
We are grateful to the two anonymous reviewers for their thorough and careful review that led to substantial improvements in the manuscript. We are also grateful to Kirsten Thonicke for being the associate editor.
This research was supported by the Tianshan Talent Cultivation (grant no.
2022TSYCLJ0001), the Key projects of the Natural Science Foundation of
Xinjiang Autonomous Region (grant no. 2022D01D01), the Strategic Priority
Research Program of the Chinese Academy of Sciences (grant no. XDA20060302),
and High-End Foreign Experts Project.
This open-access publication was funded by Technische Universität Berlin.
This paper was edited by Kirsten Thonicke and reviewed by two anonymous referees.
Anderegg, W. R., Trugman, A. T., Bowling, D. R., Salvucci, G., and Tuttle, S. E.: Plant functional traits and climate influence drought intensification and land–atmosphere feedbacks, P. Natl. Acad. Sci. USA, 116, 14071–14076, 2019.
Bairey, E., Kelsic, E. D., and Kishony, R.: High-order species interactions shape ecosystem diversity, Nat. Commun., 7, 1–7, https://doi.org/10.1038/ncomms12285, 2016.
Baldocchi, D.: Measuring fluxes of trace gases and energy between ecosystems and the atmosphere–the state and future of the eddy covariance method, Glob. Change Biol., 20, 3600–3609, 2014.
Barnes, M. L., Farella, M. M., Scott, R. L., Moore, D. J. P., Ponce-Campos, G. E., Biederman, J. A., MacBean, N., Litvak, M. E., and Breshears, D. D.: Improved dryland carbon flux predictions with explicit consideration of water-carbon coupling, Commun. Earth Environ., 2, 1–9, https://doi.org/10.1038/s43247-021-00308-2, 2021.
Borchert, R., Calle, Z., Strahler, A. H., Baertschi, A., Magill, R. E., Broadhead, J. S., Kamau, J., Njoroge, J., and Muthuri, C.: Insolation and photoperiodic control of tree development near the equator, New Phytol., 205, 7–13, 2015.
Brown, J. H., Gillooly, J. F., Allen, A. P., Savage, V. M., and West, G. B.: Toward a metabolic theory of ecology, Ecology, 85, 1771–1789, 2004.
Chan, T., Ross, H., Hoverman, S., and Powell, B.: Participatory development of a Bayesian network model for catchment-based water resource management, Water Resour. Res., 46, W07544, https://doi.org/10.1029/2009WR008848, 2010.
Chapin III, F. S., Zavaleta, E. S., Eviner, V. T., Naylor, R. L., Vitousek, P. M., Reynolds, H. L., Hooper, D. U., Lavorel, S., Sala, O. E., and Hobbie, S. E.: Consequences of changing biodiversity, Nature, 405, 234–242, 2000.
Cui, P. and Athey, S.: Stable learning establishes some common ground between causal inference and machine learning, Nat. Mach. Intell., 4, 110–115, https://doi.org/10.1038/s42256-022-00445-z, 2022.
Davidson, E. A. and Janssens, I. A.: Temperature sensitivity of soil carbon decomposition and feedbacks to climate change, Nature, 440, 165–173, 2006.
Diaz, S. and Cabido, M.: Plant functional types and ecosystem function in relation to global change, J. Veg. Sci., 8, 463–474, https://doi.org/10.2307/3237198, 1997.
Enquist, B. J., Economo, E. P., Huxman, T. E., Allen, A. P., Ignace, D. D., and Gillooly, J. F.: Scaling metabolism from organisms to ecosystems, Nature, 423, 639–642, 2003.
Flanagan, L. B. and Johnson, B. G.: Interacting effects of temperature, soil moisture and plant biomass production on ecosystem respiration in a northern temperate grassland, Agr. Forest Meteorol., 130, 237–253, 2005.
Flechard, C. R., Ibrom, A., Skiba, U. M., de Vries, W., van Oijen, M., Cameron, D. R., Dise, N. B., Korhonen, J. F. J., Buchmann, N., Legout, A., Simpson, D., Sanz, M. J., Aubinet, M., Loustau, D., Montagnani, L., Neirynck, J., Janssens, I. A., Pihlatie, M., Kiese, R., Siemens, J., Francez, A.-J., Augustin, J., Varlagin, A., Olejnik, J., Juszczak, R., Aurela, M., Berveiller, D., Chojnicki, B. H., Dämmgen, U., Delpierre, N., Djuricic, V., Drewer, J., Dufrêne, E., Eugster, W., Fauvel, Y., Fowler, D., Frumau, A., Granier, A., Gross, P., Hamon, Y., Helfter, C., Hensen, A., Horváth, L., Kitzler, B., Kruijt, B., Kutsch, W. L., Lobo-do-Vale, R., Lohila, A., Longdoz, B., Marek, M. V., Matteucci, G., Mitosinkova, M., Moreaux, V., Neftel, A., Ourcival, J.-M., Pilegaard, K., Pita, G., Sanz, F., Schjoerring, J. K., Sebastià, M.-T., Tang, Y. S., Uggerud, H., Urbaniak, M., van Dijk, N., Vesala, T., Vidic, S., Vincke, C., Weidinger, T., Zechmeister-Boltenstern, S., Butterbach-Bahl, K., Nemitz, E., and Sutton, M. A.: Carbon–nitrogen interactions in European forests and semi-natural vegetation – Part 1: Fluxes and budgets of carbon, nitrogen and greenhouse gases from ecosystem monitoring and modelling, Biogeosciences, 17, 1583–1620, https://doi.org/10.5194/bg-17-1583-2020, 2020.
Fleischer, K., Wårlind, D., Van der Molen, M. K., Rebel, K. T., Arneth, A., Erisman, J. W., Wassen, M. J., Smith, B., Gough, C. M., and Margolis, H. A.: Low historical nitrogen deposition effect on carbon sequestration in the boreal zone, J. Geophys. Res.-Biogeo., 120, 2542–2561, 2015.
Friedman, N., Geiger, D., and Goldszmidt, M.: Bayesian network classifiers, Mach. Learn., 29, 131–163, 1997.
Green, J. K., Seneviratne, S. I., Berg, A. M., Findell, K. L., Hagemann, S., Lawrence, D. M., and Gentine, P.: Large influence of soil moisture on long-term terrestrial carbon uptake, Nature, 565, 476–479, 2019.
Grimm, N. B., Chapin III, F. S., Bierwagen, B., Gonzalez, P., Groffman, P. M., Luo, Y., Melton, F., Nadelhoffer, K., Pairis, A., and Raymond, P. A.: The impacts of climate change on ecosystem structure and function, Front. Ecol. Environ., 11, 474–482, 2013.
de Groot, R. S., Wilson, M. A., and Boumans, R. M. J.: A typology for the classification, description and valuation of ecosystem functions, goods and services, Ecol. Econ., 41, 393–408, https://doi.org/10.1016/S0921-8009(02)00089-7, 2002.
Grossiord, C., Buckley, T. N., Cernusak, L. A., Novick, K. A., Poulter, B., Siegwolf, R. T. W., Sperry, J. S., and McDowell, N. G.: Plant responses to rising vapor pressure deficit, New Phytol., 226, 1550–1566, https://doi.org/10.1111/nph.16485, 2020.
Guisan, A. and Zimmermann, N. E.: Predictive habitat distribution models in ecology, Ecol. Model., 135, 147–186, 2000.
Günter, S., Stimm, B., Cabrera, M., Diaz, M. L., Lojan, M., Ordonez, E., Richter, M., and Weber, M.: Tree phenology in montane forests of southern Ecuador can be explained by precipitation, radiation and photoperiodic control, J. Trop. Ecol., 24, 247–258, 2008.
Humphrey, V., Berg, A., Ciais, P., Gentine, P., Jung, M., Reichstein, M., Seneviratne, S. I., and Frankenberg, C.: Soil moisture–atmosphere feedback dominates land carbon uptake variability, Nature, 592, 65–69, https://doi.org/10.1038/s41586-021-03325-5, 2021.
Jung, M., Reichstein, M., Ciais, P., Seneviratne, S. I., Sheffield, J., Goulden, M. L., Bonan, G., Cescatti, A., Chen, J., de Jeu, R., Dolman, A. J., Eugster, W., Gerten, D., Gianelle, D., Gobron, N., Heinke, J., Kimball, J., Law, B. E., Montagnani, L., Mu, Q., Mueller, B., Oleson, K., Papale, D., Richardson, A. D., Roupsard, O., Running, S., Tomelleri, E., Viovy, N., Weber, U., Williams, C., Wood, E., Zaehle, S., and Zhang, K.: Recent decline in the global land evapotranspiration trend due to limited moisture supply, Nature, 467, 951–954, https://doi.org/10.1038/nature09396, 2010.
Jung, M., Schwalm, C., Migliavacca, M., Walther, S., Camps-Valls, G., Koirala, S., Anthoni, P., Besnard, S., Bodesheim, P., Carvalhais, N., Chevallier, F., Gans, F., Goll, D. S., Haverd, V., Köhler, P., Ichii, K., Jain, A. K., Liu, J., Lombardozzi, D., Nabel, J. E. M. S., Nelson, J. A., O'Sullivan, M., Pallandt, M., Papale, D., Peters, W., Pongratz, J., Rödenbeck, C., Sitch, S., Tramontana, G., Walker, A., Weber, U., and Reichstein, M.: Scaling carbon fluxes from eddy covariance sites to globe: synthesis and evaluation of the FLUXCOM approach, Biogeosciences, 17, 1343–1365, https://doi.org/10.5194/bg-17-1343-2020, 2020.
Keshtkar, A. R., Salajegheh, A., Sadoddin, A., and Allan, M. G.: Application of Bayesian networks for sustainability assessment in catchment modeling and management (Case study: The Hablehrood river catchment), Ecol. Model., 268, 48–54, 2013.
Koch, G. W., Sillett, S. C., Jennings, G. M., and Davis, S. D.: The limits to tree height, Nature, 428, 851–854, 2004.
Konings, A., Williams, A., and Gentine, P.: Sensitivity of grassland productivity to aridity controlled by stomatal and xylem regulation, Nat. Geosci., 10, 284–288, 2017.
Lansu, E. M., van Heerwaarden, C., Stegehuis, A. I., and Teuling, A. J.: Atmospheric aridity and apparent soil moisture drought in European forest during heat waves, Geophys. Res. Lett., 47, e2020GL087091, https://doi.org/10.1029/2020GL087091, 2020.
Lin, C., Gentine, P., Frankenberg, C., Zhou, S., Kennedy, D., and Li, X.: Evaluation and mechanism exploration of the diurnal hysteresis of ecosystem fluxes, Agr. Forest Meteorol., 278, 107642, https://doi.org/10.1016/j.agrformet.2019.107642, 2019.
Liu, L., Gudmundsson, L., Hauser, M., Qin, D., Li, S., and Seneviratne, S. I.: Soil moisture dominates dryness stress on ecosystem production globally, Nat. Commun., 11, 1–9, 2020.
Liu, Q., Fu, Y. H., Zeng, Z., Huang, M., Li, X., and Piao, S.: Temperature, precipitation, and insolation effects on autumn vegetation phenology in temperate China, Glob. Change Biol., 22, 644–655, https://doi.org/10.1111/gcb.13081, 2016.
Luo, Y., Peng, J., and Ma, J.: When causal inference meets deep learning, Nat. Mach. Intell., 2, 426–427, https://doi.org/10.1038/s42256-020-0218-x, 2020.
Madani, N., Kimball, J. S., Ballantyne, A. P., Affleck, D. L. R., van Bodegom, P. M., Reich, P. B., Kattge, J., Sala, A., Nazeri, M., Jones, M. O., Zhao, M., and Running, S. W.: Future global productivity will be affected by plant trait response to climate, Sci. Rep.-UK, 8, 2870, https://doi.org/10.1038/s41598-018-21172-9, 2018.
Manning, P., Van Der Plas, F., Soliveres, S., Allan, E., Maestre, F. T., Mace, G., Whittingham, M. J., and Fischer, M.: Redefining ecosystem multifunctionality, Nat. Ecol. Evol., 2, 427–436, 2018.
Marcot, B. G.: Metrics for evaluating performance and uncertainty of Bayesian network models, Ecol. Model., 230, 50–62, 2012.
Marcot, B. G. and Hanea, A. M.: What is an optimal value of k in k-fold cross-validation in discrete Bayesian network analysis?, Comput. Stat., 36, 2009–2031, https://doi.org/10.1007/s00180-020-00999-9, 2021.
Marcot, B. G. and Penman, T. D.: Advances in Bayesian network modelling: Integration of modelling technologies, Environ. Modell. Softw., 111, 386–393, 2019.
Migliavacca, M. and Musavi, T.: Reproducible Workflow: The three major axes of terrestrial ecosystem function, Zenodo, https://doi.org/10.5281/zenodo.5153538, 2021.
Migliavacca, M., Reichstein, M., Richardson, A. D., Colombo, R., Sutton, M. A., Lasslop, G., Tomelleri, E., Wohlfahrt, G., Carvalhais, N., and Cescatti, A.: Semiempirical modeling of abiotic and biotic factors controlling ecosystem respiration across eddy covariance sites, Glob. Change Biol., 17, 390–409, 2011.
Migliavacca, M., Musavi, T., Mahecha, M. D., Nelson, J. A., Knauer, J., Baldocchi, D. D., Perez-Priego, O., Christiansen, R., Peters, J., Anderson, K., Bahn, M., Black, T. A., Blanken, P. D., Bonal, D., Buchmann, N., Caldararu, S., Carrara, A., Carvalhais, N., Cescatti, A., Chen, J., Cleverly, J., Cremonese, E., Desai, A. R., El-Madany, T. S., Farella, M. M., Fernández-Martínez, M., Filippa, G., Forkel, M., Galvagno, M., Gomarasca, U., Gough, C. M., Göckede, M., Ibrom, A., Ikawa, H., Janssens, I. A., Jung, M., Kattge, J., Keenan, T. F., Knohl, A., Kobayashi, H., Kraemer, G., Law, B. E., Liddell, M. J., Ma, X., Mammarella, I., Martini, D., Macfarlane, C., Matteucci, G., Montagnani, L., Pabon-Moreno, D. E., Panigada, C., Papale, D., Pendall, E., Penuelas, J., Phillips, R. P., Reich, P. B., Rossini, M., Rotenberg, E., Scott, R. L., Stahl, C., Weber, U., Wohlfahrt, G., Wolf, S., Wright, I. J., Yakir, D., Zaehle, S., and Reichstein, M.: The three major axes of terrestrial ecosystem function, Nature, 598, 468–472, https://doi.org/10.1038/s41586-021-03939-9, 2021.
Milns, I., Beale, C. M., and Smith, V. A.: Revealing ecological networks using Bayesian network inference algorithms, Ecology, 91, 1892–1899, https://doi.org/10.1890/09-0731.1, 2010.
Moles, A. T., Warton, D. I., Warman, L., Swenson, N. G., Laffan, S. W., Zanne, A. E., Pitman, A., Hemmings, F. A., and Leishman, M. R.: Global patterns in plant height, J. Ecol., 97, 923–932, 2009.
Monteith, J. L.: Solar radiation and productivity in tropical ecosystems, J. Appl. Ecol., 9, 747–766, 1972.
Moon, T. K.: The expectation-maximization algorithm, IEEE Signal Proc. Mag., 13, 47–60, 1996.
Musavi, T., Mahecha, M. D., Migliavacca, M., Reichstein, M., van de Weg, M. J., van Bodegom, P. M., Bahn, M., Wirth, C., Reich, P. B., and Schrodt, F.: The imprint of plants on ecosystem functioning: A data-driven approach, Int. J. Appl. Earth Obs., 43, 119–131, 2015.
Musavi, T., Migliavacca, M., van de Weg, M. J., Kattge, J., Wohlfahrt, G., van Bodegom, P. M., Reichstein, M., Bahn, M., Carrara, A., and Domingues, T. F.: Potential and limitations of inferring ecosystem photosynthetic capacity from leaf functional traits, Ecol. Evol., 6, 7352–7366, 2016.
Myers-Smith, I. H., Thomas, H. J. D., and Bjorkman, A. D.: Plant traits inform predictions of tundra responses to global change, New Phytol., 221, 1742–1748, https://doi.org/10.1111/nph.15592, 2019.
Nelson, J. A., Carvalhais, N., Migliavacca, M., Reichstein, M., and Jung, M.: Water-stress-induced breakdown of carbon–water relations: indicators from diurnal FLUXNET patterns, Biogeosciences, 15, 2433–2447, https://doi.org/10.5194/bg-15-2433-2018, 2018.
Nojavan A., F., Qian, S. S., and Stow, C. A.: Comparative analysis of discretization methods in Bayesian networks, Environ. Modell. Softw., 87, 64–71, https://doi.org/10.1016/j.envsoft.2016.10.007, 2017.
Pastorello, G., Trotta, C., Canfora, E., et al.: The FLUXNET2015 dataset and the ONEFlux processing pipeline for eddy covariance data, Sci. Data, 7, 225, https://doi.org/10.1038/s41597-020-0534-3, 2020.
Patanè, C.: Leaf Area Index, Leaf Transpiration and Stomatal Conductance as Affected by Soil Water Deficit and VPD in Processing Tomato in Semi Arid Mediterranean Climate, J. Agron. Crop Sci., 197, 165–176, https://doi.org/10.1111/j.1439-037X.2010.00454.x, 2011.
Pearl, J.: Bayesian netwcrks: A model cf self-activated memory for evidential reasoning, in: Proceedings of the 7th Conference of the Cognitive Science Society, University of California, Irvine, CA, USA, 15–17, 1985.
Peaucelle, M., Bacour, C., Ciais, P., Vuichard, N., Kuppel, S., Peñuelas, J., Belelli Marchesini, L., Blanken, P. D., Buchmann, N., and Chen, J.: Covariations between plant functional traits emerge from constraining parameterization of a terrestrial biosphere model, Global Ecol. Biogeogr., 28, 1351–1365, 2019.
Piedallu, C. and Gégout, J.-C.: Multiscale computation of solar radiation for predictive vegetation modelling, Ann. For. Sci., 64, 899–909, 2007.
Pollino, C. A., Woodberry, O., Nicholson, A., Korb, K., and Hart, B. T.: Parameterisation and evaluation of a Bayesian network for use in an ecological risk assessment, Environ. Modell. Softw., 22, 1140–1152, https://doi.org/10.1016/j.envsoft.2006.03.006, 2007.
Ramazi, P., Kunegel-Lion, M., Greiner, R., and Lewis, M. A.: Exploiting the full potential of Bayesian networks in predictive ecology, Meth. Ecol. Evol., 12, 135–149, https://doi.org/10.1111/2041-210X.13509, 2021.
Reich, P. B. and Oleksyn, J.: Global patterns of plant leaf N and P in relation to temperature and latitude, P. Natl. Acad. Sci. USA, 101, 11001–11006, 2004.
Reichstein, M., Bahn, M., Mahecha, M. D., Kattge, J., and Baldocchi, D. D.: Linking plant and ecosystem functional biogeography, P. Natl. Acad. Sci. USA, 111, 13697–13702, https://doi.org/10.1073/pnas.1216065111, 2014.
Reichstein, M., Camps-Valls, G., Stevens, B., Jung, M., Denzler, J., Carvalhais, N., and Prabhat: Deep learning and process understanding for data-driven Earth system science, Nature, 566, 195–204, https://doi.org/10.1038/s41586-019-0912-1, 2019.
Ryan, M. G. and Yoder, B. J.: Hydraulic limits to tree height and tree growth, Bioscience, 47, 235–242, 1997.
Sakschewski, B., von Bloh, W., Boit, A., Poorter, L., Peña-Claros, M., Heinke, J., Joshi, J., and Thonicke, K.: Resilience of Amazon forests emerges from plant trait diversity, Nat. Clim. Change, 6, 1032–1036, https://doi.org/10.1038/nclimate3109, 2016.
Santiago, L. S. and Mulkey, S. S.: Leaf productivity along a precipitation gradient in lowland Panama: patterns from leaf to ecosystem, Trees, 19, 349–356, https://doi.org/10.1007/s00468-004-0389-9, 2005.
Shi, H., Luo, G., Zheng, H., Chen, C., Bai, J., Liu, T., Ochege, F. U., and De Maeyer, P.: Coupling the water-energy-food-ecology nexus into a Bayesian network for water resources analysis and management in the Syr Darya River basin, J. Hydrol., 581, 124387, https://doi.org/10.1016/j.jhydrol.2019.124387, 2020.
Shi, H., Luo, G., Zheng, H., Chen, C., Hellwich, O., Bai, J., Liu, T., Liu, S., Xue, J., Cai, P., He, H., Ochege, F. U., Van de Voorde, T., and de Maeyer, P.: A novel causal structure-based framework for comparing a basin-wide water–energy–food–ecology nexus applied to the data-limited Amu Darya and Syr Darya river basins, Hydrol. Earth Syst. Sci., 25, 901–925, https://doi.org/10.5194/hess-25-901-2021, 2021a.
Shi, H., Pan, Q., Luo, G., Hellwich, O., Chen, C., Voorde, T. V. de, Kurban, A., De Maeyer, P., and Wu, S.: Analysis of the Impacts of Environmental Factors on Rat Hole Density in the Northern Slope of the Tienshan Mountains with Satellite Remote Sensing Data, Remote Sens., 13, 4709, https://doi.org/10.3390/rs13224709, 2021b.
Shi, H., Luo, G., Hellwich, O., Xie, M., Zhang, C., Zhang, Y., Wang, Y., Yuan, X., Ma, X., Zhang, W., Kurban, A., De Maeyer, P., and Van de Voorde, T.: Evaluation of water flux predictive models developed using eddy-covariance observations and machine learning: a meta-analysis, Hydrol. Earth Syst. Sci., 26, 4603–4618, https://doi.org/10.5194/hess-26-4603-2022, 2022a.
Shi, H., Luo, G., Hellwich, O., Xie, M., Zhang, C., Zhang, Y., Wang, Y., Yuan, X., Ma, X., Zhang, W., Kurban, A., De Maeyer, P., and Van de Voorde, T.: Variability and uncertainty in flux-site-scale net ecosystem exchange simulations based on machine learning and remote sensing: a systematic evaluation, Biogeosciences, 19, 3739–3756, https://doi.org/10.5194/bg-19-3739-2022, 2022b.
Strobl, C., Boulesteix, A.-L., Kneib, T., Augustin, T., and Zeileis, A.: Conditional variable importance for random forests, BMC Bioinformatics, 9, 307, https://doi.org/10.1186/1471-2105-9-307, 2008.
Toloşi, L. and Lengauer, T.: Classification with correlated features: unreliability of feature ranking and solutions, Bioinformatics, 27, 1986–1994, https://doi.org/10.1093/bioinformatics/btr300, 2011.
Tramontana, G., Jung, M., Schwalm, C. R., Ichii, K., Camps-Valls, G., Ráduly, B., Reichstein, M., Arain, M. A., Cescatti, A., Kiely, G., Merbold, L., Serrano-Ortiz, P., Sickert, S., Wolf, S., and Papale, D.: Predicting carbon dioxide and energy fluxes across global FLUXNET sites with regression algorithms, Biogeosciences, 13, 4291–4313, https://doi.org/10.5194/bg-13-4291-2016, 2016.
Trifonova, N., Kenny, A., Maxwell, D., Duplisea, D., Fernandes, J., and Tucker, A.: Spatio-temporal Bayesian network models with latent variables for revealing trophic dynamics and functional networks in fisheries ecology, Ecol. Inform., 30, 142–158, https://doi.org/10.1016/j.ecoinf.2015.10.003, 2015.
Wagner, F. H., Hérault, B., Rossi, V., Hilker, T., Maeda, E. E., Sanchez, A., Lyapustin, A. I., Galvão, L. S., Wang, Y., and Aragão, L. E.: Climate drivers of the Amazon forest greening, PLoS One, 12, e0180932, https://doi.org/10.1371/journal.pone.0180932, 2017.
Wang, Z., Zhu, D., Wang, X., Zhang, Y., and Peng, S.: Regressions underestimate the direct effect of soil moisture on land carbon sink variability, Glob. Change Biol., 28, 7161–7163, https://doi.org/10.1111/gcb.16422, 2022.
Weih, M. and Karlsson, P. S.: Growth response of Mountain birch to air and soil temperature: is increasing leaf-nitrogen content an acclimation to lower air temperature?, New Phytol., 150, 147–155, https://doi.org/10.1046/j.1469-8137.2001.00078.x, 2001.
Wen, X.-F., Yu, G.-R., Sun, X.-M., Li, Q.-K., Liu, Y.-F., Zhang, L.-M., Ren, C.-Y., Fu, Y.-L., and Li, Z.-Q.: Soil moisture effect on the temperature dependence of ecosystem respiration in a subtropical Pinus plantation of southeastern China, Agr. Forest Meteorol., 137, 166–175, https://doi.org/10.1016/j.agrformet.2006.02.005, 2006.
Wever, L. A., Flanagan, L. B., and Carlson, P. J.: Seasonal and interannual variation in evapotranspiration, energy balance and surface conductance in a northern temperate grassland, Agr. Forest Meteorol., 112, 31–49, https://doi.org/10.1016/S0168-1923(02)00041-2, 2002.
Wright, I. J. and Westoby, M.: Leaves at low versus high rainfall: coordination of structure, lifespan and physiology, New Phytol., 155, 403–416, 2002.
Xu, L., Baldocchi, D. D., and Tang, J.: How soil moisture, rain pulses, and growth alter the response of ecosystem respiration to temperature, Global Biogeochem. Cy., 18, GB4002, https://doi.org/10.1029/2004GB002281, 2004.
Xu, S., McVicar, T. R., Li, L., Yu, Z., Jiang, P., Zhang, Y., Ban, Z., Xing, W., Dong, N., Zhang, H., and Zhang, M.: Globally assessing the hysteresis between sub-diurnal actual evaporation and vapor pressure deficit at the ecosystem scale: Patterns and mechanisms, Agr. Forest Meteorol., 323, 109085, https://doi.org/10.1016/j.agrformet.2022.109085, 2022.
Yuan, W., Zheng, Y., Piao, S., Ciais, P., Lombardozzi, D., Wang, Y., Ryu, Y., Chen, G., Dong, W., Hu, Z., Jain, A. K., Jiang, C., Kato, E., Li, S., Lienert, S., Liu, S., Nabel, J. E. M. S., Qin, Z., Quine, T., Sitch, S., Smith, W. K., Wang, F., Wu, C., Xiao, Z., and Yang, S.: Increased atmospheric vapor pressure deficit reduces global vegetation growth, Sci. Adv., 5, eaax1396, https://doi.org/10.1126/sciadv.aax1396, 2019.
Zhou, S., Yu, B., Huang, Y., and Wang, G.: The effect of vapor pressure deficit on water use efficiency at the subdaily time scale, Geophys. Res. Lett., 41, 5005–5013, https://doi.org/10.1002/2014GL060741, 2014.
Zhou, S., Williams, A. P., Berg, A. M., Cook, B. I., Zhang, Y., Hagemann, S., Lorenz, R., Seneviratne, S. I., and Gentine, P.: Land–atmosphere feedbacks exacerbate concurrent soil drought and atmospheric aridity, P. Natl. Acad. Sci. USA, 116, 18848–18853, 2019.