the Creative Commons Attribution 4.0 License.
the Creative Commons Attribution 4.0 License.
 | 14 Jul 2023
Burned area and carbon emissions across northwestern boreal North America from 2001–2019
Stefano Potter
Sol Cooperdock
Sander Veraverbeke
Xanthe Walker
Michelle C. Mack
Scott J. Goetz
Jennifer Baltzer
Laura Bourgeau-Chavez
Arden Burrell
Catherine Dieleman
Nancy French
Stijn Hantson
Elizabeth E. Hoy
Liza Jenkins
Jill F. Johnstone
Evan S. Kane
Susan M. Natali
James T. Randerson
Merritt R. Turetsky
Ellen Whitman
Elizabeth Wiggins
Brendan M. Rogers
Fire is the dominant disturbance agent in Alaskan and Canadian boreal ecosystems and releases large amounts of carbon into the atmosphere. Burned area and carbon emissions have been increasing with climate change, which have the potential to alter the carbon balance and shift the region from a historic sink to a source. It is therefore critically important to track the spatiotemporal changes in burned area and fire carbon emissions over time. Here we developed a new burned-area detection algorithm between 2001–2019 across Alaska and Canada at 500 m (meters) resolution that utilizes finer-scale 30 m Landsat imagery to account for land cover unsuitable for burning. This method strictly balances omission and commission errors at 500 m to derive accurate landscape- and regional-scale burned-area estimates. Using this new burned-area product, we developed statistical models to predict burn depth and carbon combustion for the same period within the NASA Arctic–Boreal Vulnerability Experiment (ABoVE) core and extended domain. Statistical models were constrained using a database of field observations across the domain and were related to a variety of response variables including remotely sensed indicators of fire severity, fire weather indices, local climate, soils, and topographic indicators. The burn depth and aboveground combustion models performed best, with poorer performance for belowground combustion. We estimate 2.37×10⁶ ha (2.37 Mha) burned annually between 2001–2019 over the ABoVE domain (2.87 Mha across all of Alaska and Canada), emitting 79.3 ± 27.96 Tg (±1 standard deviation) of carbon (C) per year, with a mean combustion rate of 3.13 ± 1.17 kg C m−2. Mean combustion and burn depth displayed a general gradient of higher severity in the northwestern portion of the domain to lower severity in the south and east. We also found larger-fire years and later-season burning were generally associated with greater mean combustion. Our estimates are generally consistent with previous efforts to quantify burned area, fire carbon emissions, and their drivers in regions within boreal North America; however, we generally estimate higher burned area and carbon emissions due to our use of Landsat imagery, greater availability of field observations, and improvements in modeling. The burned area and combustion datasets described here (the ABoVE Fire Emissions Database, or ABoVE-FED) can be used for local- to continental-scale applications of boreal fire science.
- Article
(7115 KB) - Full-text XML
-
Supplement
(26919 KB) - BibTeX
- EndNote


Fire is the dominant disturbance agent in boreal forests (Stocks et al., 2003) and places large controls on ecosystem dynamics including vegetation composition and structure, nutrient cycling, permafrost, and carbon cycling (Bonan and Shugart, 1989; Bond-Lamberty et al., 2007; Walker et al., 2019). Fire frequency, intensity, and burned area have been increasing in Alaskan and Canadian boreal forests over the last several decades (Hanes et al., 2018; Kasischke et al., 2010; Veraverbeke et al., 2017), and these trends are expected to continue throughout the 21st century due to a warmer and drier climate (Balshi et al., 2009; Boulanger et al., 2018; Young et al., 2017). Changes to the fire regime have been associated with more severe fires, which burn deeper into the organic soil profile and may be related to large-fire years and seasonal timing of burn (Turetsky et al., 2011), although this has not been tested widely. Ultimately, changes in the fire regime have the potential to transition at least some North American boreal forests from a carbon sink to a source (Dieleman et al., 2020; Li et al., 2017; Walker et al., 2019; Wang et al., 2021). To better understand how changing boreal fire regimes influence carbon dynamics, it is critical to accurately map burned area and estimate resulting carbon emissions over time.
Burned-area mapping in Alaska and Canada over long time frames (>20 years) has primarily been based on digitized maps of fire observations (both by hand and in recent decades using GPS, aerial imagery, and satellite remote sensing) from the Alaska Large Fire Database (ALFD; Kasischke et al., 2002), the Canadian National Fire Database (CNFD; Amiro et al., 2001; Stocks et al., 2003), and more recently the Canadian National Burned Area Composite (NBAC; Hall et al., 2020). These databases are updated annually in Alaska and Canada, yet substantial uncertainty remains, particularly as the databases go further back in time, when aerial and satellite imagery was less prevalent. Of particular importance is the possibility of commission errors because the databases do not typically account for unburned patches of vegetation and waterbodies within the fire perimeters, leading to an overestimation of burned area (Skakun et al., 2021). At the same time, the databases are more likely to omit fires due to lost records or missed detections in earlier decades (Kasischke et al., 2002; Stocks et al., 2003), leading to omissions. Mapping fire perimeters in recent decades has improved with the use of satellite remote sensing, particularly from 30 m Landsat (Epp and Lanoville, 1996) and 500 m Moderate Resolution Imaging Spectroradiometer (MODIS) imagery. While MODIS imagery is at coarser resolution than Landsat, its multiple acquisitions per day are highly amenable to burned-area mapping, although there are known omission errors due to small (<100 ha) burns as well as an overestimation of burned area at the pixel level due to the relatively coarse 500 m resolution, which misses some unburned vegetation patches and waterbodies (Giglio et al., 2018). Landsat imagery can largely bypass these issues of spatial resolution (Guindon et al., 2018; Walker et al., 2018), but the relatively infrequent overpass times and typical cloudy environments in the tundra and boreal biome result in data gaps, particularly prior to the launch of Landsat 7 (1999) due to data relay issues and limited tasking.
Traditionally, carbon emissions from wildfires have been calculated as a function of burned area, fuel consumption, and emission factors (French et al., 2011; Seiler and Crutzen, 1980). Carbon emissions in these models are based on observed relationships between fuel consumption, fire weather, and fuel type. Current models that are built with this framework include the Wildland Fire Emissions Information System (WFEIS; French et al., 2011, 2014), the Fire Inventory from the National Center for Atmospheric Research (FINN; Wiedinmyer et al., 2011), and the Global Fire Emission Database (GFED; van der Werf et al., 2017). In addition to these regional and global products, there are several model products that provide estimates in boreal ecosystems of Alaska (French et al., 2002; Kasischke and Hoy, 2012; Tan et al., 2007; Veraverbeke et al., 2015) and Canada (Amiro et al., 2001; de Groot et al., 2007). Researchers have also made improvements to process-based models' representation of fire occurrence and effects (Hantson et al., 2016; Rabin et al., 2017; Zhao et al., 2021). These models can be used to explore causal relationships and have the benefit of estimating how burn rates and carbon emissions may vary under differing future climate change scenarios.
In addition to simple empirical and process-based models of carbon combustion, several recent studies have implemented statistical techniques to model combustion based on field observations, satellite remote sensing imagery, and other geospatial data (Dieleman et al., 2020; Rogers et al., 2014; Veraverbeke et al., 2015, 2017; Walker et al., 2018). These advances are possible due to the increasing volume of field observations of combustion and have the advantages of unraveling complex relationships between combustion observations and geospatial information to extrapolate over space and time. Satellite imagery collected both pre-fire and post-fire has been particularly useful for these techniques (Hudak et al., 2007; Key and Benson, 2006). Specifically, the differenced normalized burn ratio (dNBR) combines the near-infrared and shortwave infrared bands obtained before and after a fire, and the spectral information retained is sensitive to reductions in vegetation and moisture content post-fire. Due to these qualities dNBR correlates relatively strongly with aboveground biomass loss, but there have been conflicting findings on the strength of the relationship with belowground fire severity, which is particularly important in boreal ecosystems (Kasischke and Hoy, 2012; McGuire et al., 2009). Additional environmental predictors have been combined with dNBR to statistically model aboveground and belowground combustion across Alaska and Canada, including quantified uncertainties (Dieleman et al., 2020; Rogers et al., 2014; Veraverbeke et al., 2015, 2017; Walker et al., 2018). Veraverbeke et al. (2015) found topographic variables (elevation, slope, northness), pre-fire vegetation cover (% tree cover), and day of burning to be important predictors for both aboveground and belowground combustion and more specifically the combination of dNBR, day of burning, elevation, and tree cover to be the most informative in Alaska. Walker et al. (2018) considered 71 variables associated with topography, permafrost condition, fire severity, fire weather, and soil properties and found that dNBR, change in pre- and post-fire tree cover, terrain ruggedness, topographic wetness, percent black spruce, and percent sand were the most informative for the 2014 Northwest Territories fires. Although these results have been encouraging, extrapolations have been limited to specific regions in Canada and Alaska and often to specific fire years. It is likely that the inclusion of additional field data across a more representative selection of field locations in Alaska and Canada would improve model fits and allow for extrapolation over a larger domain and longer time periods.
In this study we first derived a new 500 m burned-area product for all of Alaska and Canada during 2001–2019. Our approach builds on previous satellite-based burned-area mapping efforts (Chen et al., 2020; Dieleman et al., 2020; Loboda et al., 2018; van der Werf et al., 2017; Veraverbeke et al., 2015; Walker et al., 2018) with 500 m MODIS data but advances these by using 30 m Landsat imagery to both improve accuracy and account for the presence of unburnable land cover. Using this burned-area product, along with a new comprehensive database of combustion observations in Alaska and central/western Canada (Walker et al., 2020a), we used machine learning to estimate burn depth and fire carbon emissions across the Arctic–Boreal Vulnerability Experiment (ABoVE) domain. We compare our product to a suite of previous efforts and use it to test previously hypothesized relationships between fire severity, annual burned area, and seasonal timing of burning.
2.1 Study area
The spatial domain of this study includes all of Alaska and Canada for our burned-area product and the ABoVE core and extended domain (hereafter the “ABoVE domain”; Loboda et al., 2019) for our combustion and burn depth product (Fig. 1). The combustion and burn depth products were not derived beyond the ABoVE domain due to a lack of field observations in eastern Canada. The temporal domain for all products is 2001–2019. Our study area includes all natural boreal and arctic vegetation within the ABoVE domain, including boreal forests, boreal wetlands, grasslands, tundra, and tundra wetlands. To determine these locations we derived a vegetation mask using the 2005 Land Cover of North America product (250 m; CCRS, 2013; Pouliot and Latifovic, 2013; Pouliot et al., 2014), MODIS land cover type with International Geosphere–Biosphere Programme (IGBP) classification (Collection 6, year 2005, 500 m; Friedl and Sulla-Menashe, 2019), the Circumpolar Arctic Vegetation Map (CAVM; Raynolds et al., 2019), and long-term climate (1970–2000, ∼ 1 km; Fick and Hijmans, 2017), all re-gridded to 500 m resolution on the MODIS sinusoidal projection (Fig. S1 in the Supplement). Boreal vegetation was distinguished from temperate using a mean annual temperature threshold of 3 ∘C, as recommended in Wolfe (1979) and implemented in Rogers et al. (2015). Pixels were designated as urban, crop, crop/natural vegetation mosaic, or water if they were represented as such in either the Land Cover of North America or MODIS land cover products. Pixels were designated as tundra if they were within the CAVM domain.
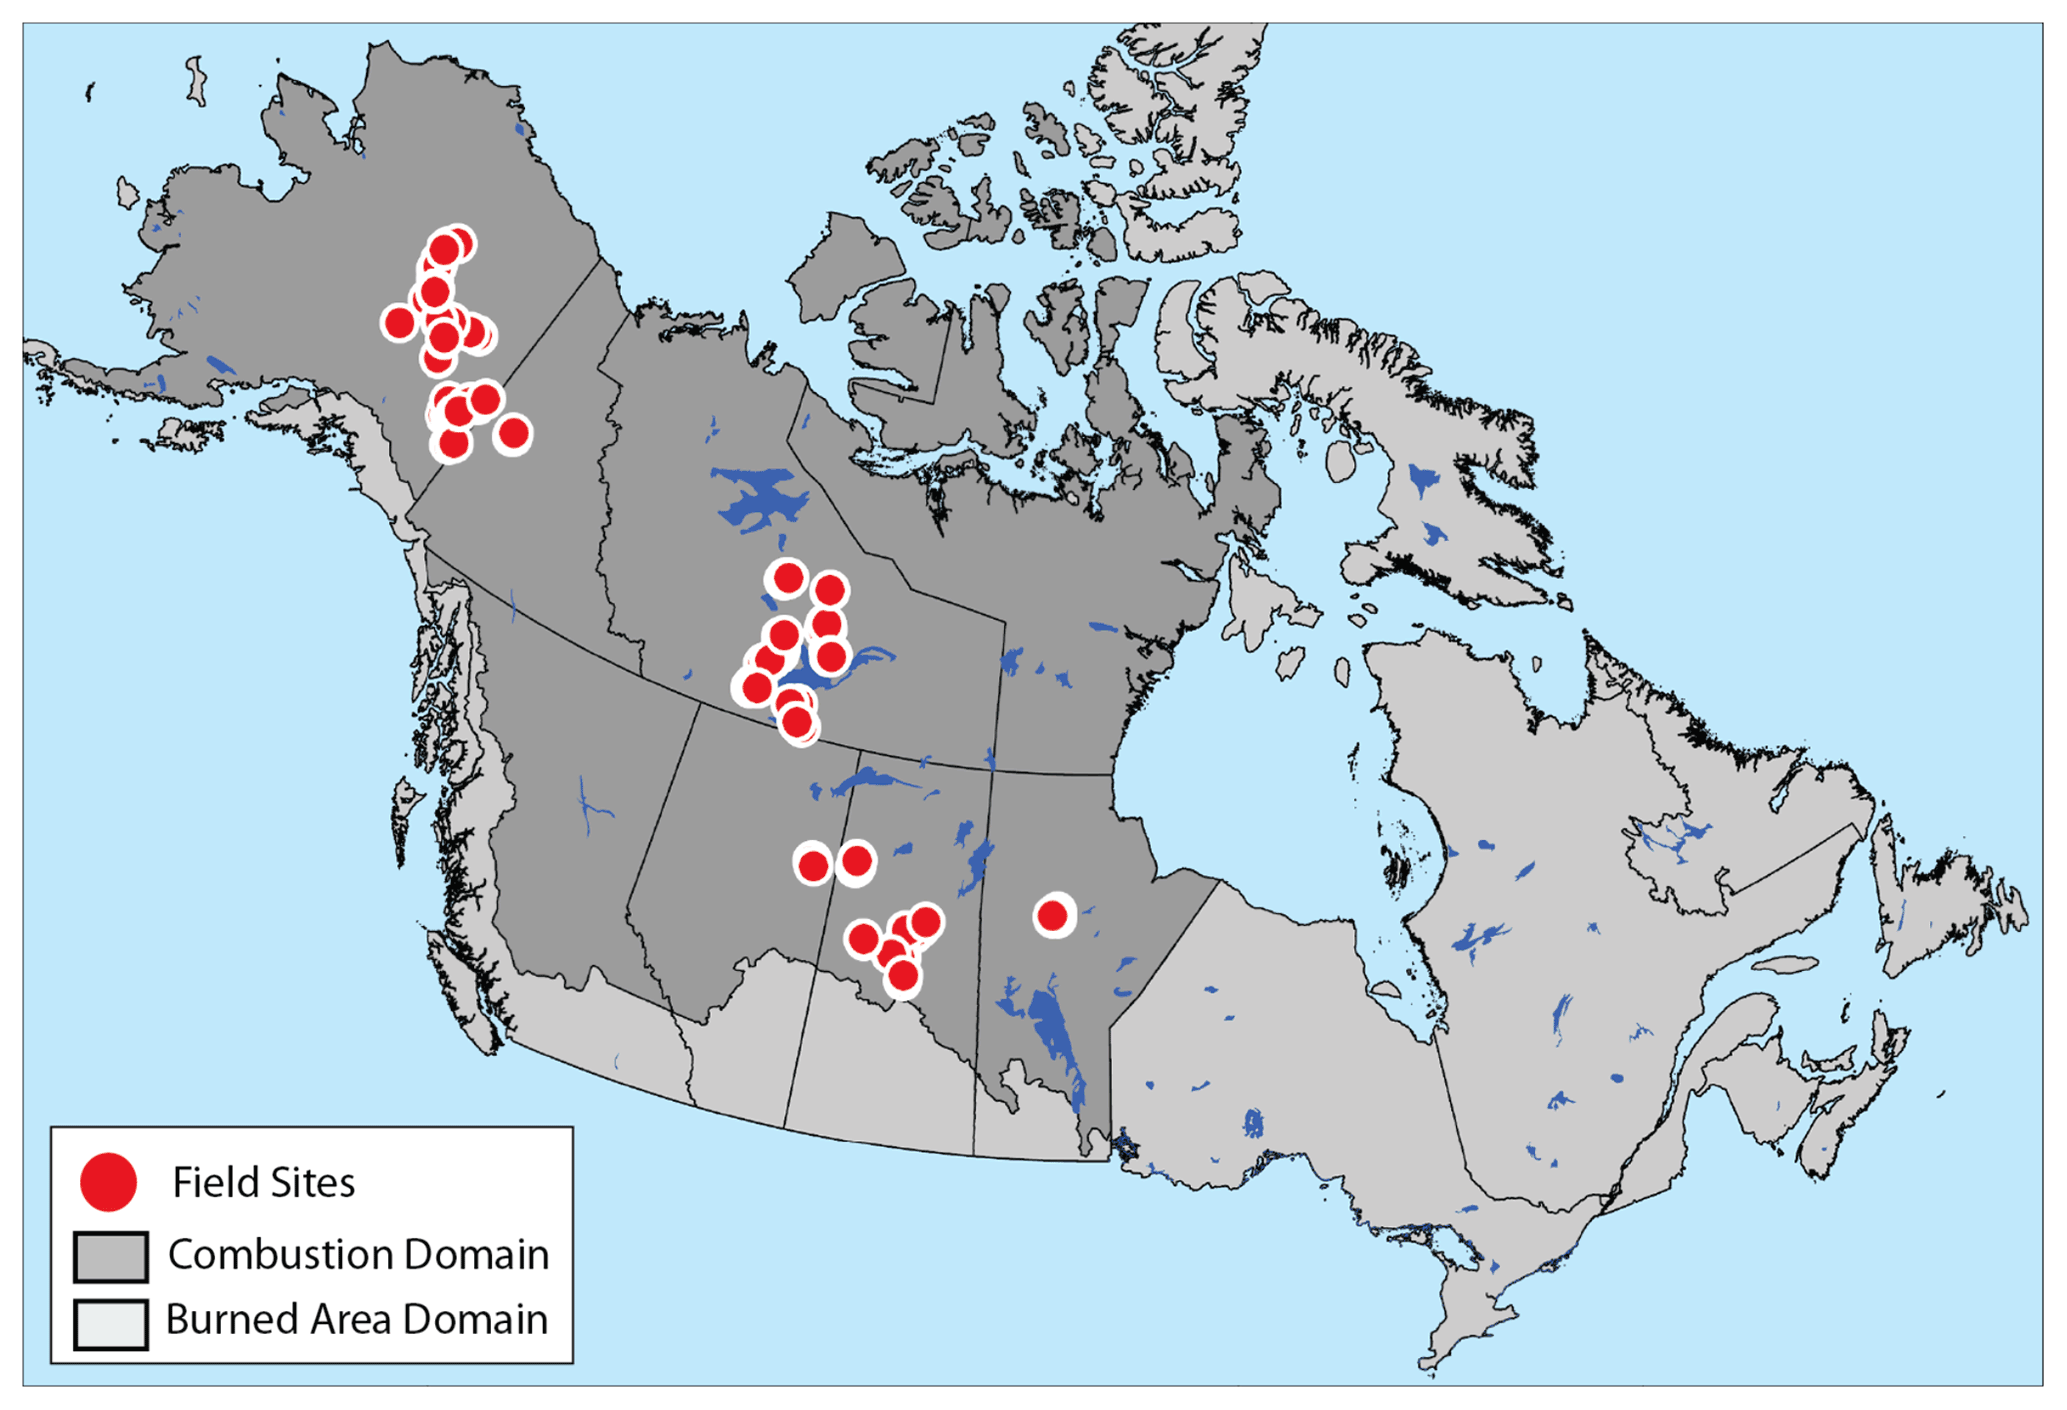
Figure 1Study domain. Locations of combustion observations (red), the burned-area product domain (light gray), and the combustion and burned-depth product domain (dark gray).
2.2 Field data
Field measurements of burn depth and combustion were derived from numerous data sources across different research groups that represent a major synthesis effort sponsored by the NASA ABoVE program (Boby et al., 2010; Dieleman et al., 2020; de Groot et al., 2009; Hoy et al., 2016; Rogers et al., 2014; Turetsky et al., 2011; Veraverbeke et al., 2015; Walker et al., 2018). Detailed descriptions of data collection methods can be found in the contributing publications. All field site information was standardized and aggregated into a single publicly available database (Walker et al., 2020a), which has been used to assess patterns and drivers of ecosystem structure and combustion across ecoregions (Walker et al., 2020b, c). Although the field database only includes measurements from boreal ecosystems, our combustion and burn depth predictions include both boreal and tundra ecosystems. Of all the pixels for which we predicted combustion and burn depth, only 0.78 % are in tundra landscapes.
2.3 Burned-area mapping
The ABoVE Fire Emissions Database (ABoVE-FED) burned-area product is derived from a dNBR thresholding approach, which has previously been successfully employed for burned-area mapping in the region (Rogers et al., 2014; Veraverbeke et al., 2015; Walker et al., 2018). Our primary approach was to use Landsat imagery to separate burned from unburned pixels at 30 m. However, because Landsat imagery was not available for all regions and time periods, we used MODIS imagery to map burned pixels when necessary and upscaled our Landsat-based product to 500 m MODIS resolution. More specifically we used pre- and post-fire near-infrared (NIR) and shortwave infrared (SWIR) bands from Aqua (MYD09GA Collection 6; Vermote and Wolfe, 2015a), Terra (MOD09GA Collection 6; Vermote and Wolfe, 2015b), and Landsat 5–8, calculating dNBR as the difference in pre-fire normalized burn ratio (NBR) and post-fire NBR, where NBR is near-infrared minus shortwave infrared divided by near-infrared plus shortwave infrared.
This approach had the added advantage of accuracy; whereas a Landsat dNBR threshold tends to be surpassed at the site level in a diffuse manner across the landscape, due to stochastic site-level disturbances such as tree mortality, herbivory, flooding, or small-scale dieback, it is much less common for these small-scale disturbances to influence the majority of a 500 m pixel. We also minimized mapping non-fire disturbances by following the approach of Veraverbeke et al. (2015) and applying our dNBR approach to (1) mapped fire polygons from the ALFD and CNFD (93 % of total burned pixels; hereafter collectively referred to as the National Large Fire Databases, NLFD) and (2) MODIS active-fire acquisitions (MOD14A1 Collection 6 and MYD14A1 Collection 6; Giglio et al., 2018) outside these polygons (7 % of total burned pixels). In each case we applied a 1 km buffer (Veraverbeke et al., 2015) to capture burned pixels immediately outside these areas. Finally, our approach is motivated by a desire to balance commission and omission errors at both the 30 and 500 m scales, thereby providing an unbiased estimate of total burned area.
To map 30 m burned pixels, we first extracted dNBR at both burned and unburned control sites in our aggregated field database using available cloud-free Landsat 5, 7, and 8 Tier 1 surface reflectance images in Google Earth Engine (Gorelick et al., 2017). Landsat 5 and 7 were atmospherically corrected using the Landsat Ecosystem Disturbance Adaptive Processing System (LEDPAS; Schmidt et al., 2013), while Landsat 8 was atmospherically corrected using Land Surface Reflectance Code (LaSRC; Vermote et al., 2016). Pre- and post-fire normalized burn ratio (NBR) was calculated as the mean of all available Landsat observations between July and August. Pre-fire values were extracted 1 year before a given fire, and post-fire values were extracted 1 year after a fire. We then selected a 30 m Landsat dNBR threshold that most effectively separated burned and unburned control sites. Because there are many fewer unburned control sites in the Walker et al. (2020a) combustion database, we derived additional control sites by extracting dNBR at burned sites 2 years before a given fire, which had the advantage of controlling for any site-level spectral differences between burned and control sites represented in the database. This process generated a dNBR threshold of 0.084, which minimized 30 m site-level commission and omission errors to 6.6 % (Fig. S2).
We then created a mask at 30 m to account for unburnable land cover (i.e., non-vegetated pixels). This was created using two sources: the Joint Research Center's yearly water history product (Pekel et al., 2016) and the 2010 land cover product of the North American Land Change Monitoring System (NALCM) at 30 m resolution (Latifovic et al., 2012). The first product allowed us to capture transient water pixels in our time series, while the NALCM land cover product classified each pixel into 19 different land cover classes, from which we masked out non-vegetated pixels, including ice, water, barren land, and cropland. These two sources were combined into separate masks for each year between 2001–2019. Because areas that burned in 2010 were often classified as barren lands in the 2010 NALCM product, we considered barren lands to be vegetated in our mask for the year 2010.
Using the vegetation mask and the dNBR threshold, we created a binary burned/unburned 30 m Landsat product and upscaled this to the native MODIS 500 m resolution and projection. To determine whether or not a given 500 m pixel was classified as burned or unburned, we calculated the percentage of 30 m vegetated pixels that burned within its footprint. If more than 50 % of the 30 m vegetated pixels within the larger 500 m pixel burned (i.e., were tripped by the dNBR threshold), the entire pixel was assigned as burned, and the burned fraction was calculated as the percent of the burnable land cover (vegetation) in the 500 m pixel. Note we did not use the percent of burned 30 m pixels to determine burn fraction within a given 500 m pixel, primarily because of limitations imposed by frequently missing Landsat imagery (detailed below).
We used this approach whenever 500 m pixels contained 100 % coverage by Landsat imagery at 30 m. When, however, there was less than 100 % Landsat coverage, we needed to determine if it was more accurate to classify 500 m pixels using Landsat (with partial coverage) or MODIS Collection 6 imagery (Vermote and Wolfe, 2015a, b). To do so, we analyzed all MODIS pixels with complete Landsat coverage and masked out increasing numbers of Landsat pixel strips within the larger MODIS footprint (using increments of 5 %). After each removal of Landsat pixels, we compared the accuracy of the resulting burned/unburned classification using (i) Landsat imagery with partial coverage and (ii) MODIS imagery. This procedure suggested that using MODIS dNBR was more accurate than Landsat when less than 85 % of a 500 m MODIS pixel was covered by Landsat imagery. We therefore used Landsat to classify burned pixels when at least 85 % of a 500 m pixel was covered by Landsat imagery and otherwise used MODIS. Burned pixels were assigned a quality flag of 0 when there was complete Landsat coverage; a quality flag of 1 when Landsat coverage was less than 100 % but greater than 85 %; and a quality flag of 2 when Landsat coverage was less than 85 %, and therefore MODIS imagery was used to classify burn status. Overall, 81 % of total burned pixels were derived using Landsat (66 % from full coverage and 15 % from partial coverage), although particular regions (notably Alaska and Newfoundland and Labrador) tend to rely more on MODIS due to more limited availability of Landsat imagery (Fig. S3).
We developed a correction factor for MODIS-based dNBR to account for differences between Landsat and MODIS NIR and SWIR spectra, as well as the influence of vegetation fraction on 500 m dNBR signals. To do so, we calculated pre- and post-fire NIR and SWIR bands from MODIS and Landsat (resampled to 500 m) for a 50 % random sample of burned pixels. We then differenced the Landsat 500 m resampled bands from the 500 m MODIS bands and regressed them onto vegetation fraction to obtain a correction factor. The regression yielded an R2 of 0.74 and an equation of , which was applied to all pixels where burn status was classified by MODIS. We then calculated a new dNBR threshold to classify pixels at 500 m in an unbiased manner. To do so, we determined the MODIS dNBR threshold that evenly split omissions and commissions based on pixels mapped with complete Landsat coverage. This threshold was determined to be 0.0725, resulting in an omission/commission error of 14.2 % at 500 m when using MODIS.
One issue with a burned-area mapping approach such as ours that utilizes post-fire imagery 1 year after a fire is that it is difficult to determine the year(s) of burn where overlapping burns occurred in successive years. To address these cases, we created a seasonal MODIS-based product following the methodology of Giglio et al. (2018). The dNBR for each day between 15 January and 15 December was calculated using the 30 preceding days as pre-fire NBR and the 30 d after as post-fire NBR. Any pixels with fewer than 10 valid observations in either window were masked out. We used a similar thresholding approach to that described above for mapping burned pixels with MODIS, resulting in a seasonal dNBR threshold of 0.23. Any pixel mapped using the MODIS seasonal approach was assigned a quality flag of 3.
In addition to determining fire locations, fire year, and the burned fraction, we also determined the day of burning for each pixel. When possible, day of burn was taken directly from the thermal-anomaly active-fire detections from MOD14A1 Collection 6 and MYD14A1 Collection 6 (Giglio et al., 2018) active-fire products. Where an active fire was registered, day of burn was assigned by taking the earliest active-fire acquisition during the year. When an active fire was not registered for a given burned pixel, we utilized a multi-tiered approach to assign day of burn. When possible, we used a kriging technique to interpolate day of burn using the active-fire detections within each fire polygon in the NLFD following Veraverbeke et al. (2015). To implement this, we required fire polygons to contain at least five active-fire acquisitions within their boundaries and have some level of temporal variation (i.e., not all active-fire acquisitions on the same day). When this was not the case, day of burn was assigned using the closest active-fire pixel. Finally, when no active-fire acquisitions were associated with a given fire polygon, we used our MODIS-based seasonal mapping approach to determine day of burn by locating the day of maximal dNBR within a given year. For fires that were detected by MODIS thermal anomalies but were not contained in the NLFD (7 % of all burned area), we created our own polygons around the burned pixels (by converting pixels to vectors and buffering them) and used the same method to assign day of burn. Quality flags for our burn day product represent this tiered approach, with a flag of 0 for pixels with direct active-fire hits, a flag of 1 for pixels whose day of burn was determined by interpolation, and a flag of 2 for pixels whose day of burn was determined using the MODIS seasonal burned-area product. A simplified flowchart of burned-area processing methods is shown in Fig. S4.
We compared ABoVE-FED burned area to several other products including the NLFD, NBAC, MCD64A1 Collection 5, MCD64A1 Collection 6, the Alaska Fire Emissions Database version 2 (AKFED; Veraverbeke et al., 2017), GFED4s (van der Werf et al., 2017), a 500 m model by van Wees et al. (2022), and the Fire Model Intercomparison Project (FireMIP; Hantson et al., 2016; Rabin et al., 2017; Table S1 in the Supplement). NBAC is a Canada-only product and is related to the CNFD but improves upon it by incorporating multi-sensor remote sensing imagery (including Landsat) to account for waterbodies and unburned vegetation patches. FireMIP includes simulations performed by coupled fire–vegetation models forced with a standardized set of input data. We also visually compared our product and others to high-resolution imagery of fires from the WorldView-2 (1.84 m) satellite, available through DigitalGlobe, Inc., a Maxar company under the NextView license agreement through the National Geospatial Intelligence Agency (Neigh et al., 2013).
2.4 Combustion and burn depth models
We built and applied statistical models of aboveground combustion, belowground combustion, and burn depth to every mapped burned pixel in the ABoVE domain based on field observations across Alaska and western Canada (Walker et al., 2020a). Because not all field sites included estimates of both aboveground and belowground combustion, we created two separate combustion models, one utilizing all available aboveground combustion measurements (n=515) and one utilizing all available belowground combustion measurements (n=769). Our burn depth model utilized the same field sites as belowground combustion. Further discussion of models implemented can be found in the Supplement.
2.4.1 Predictor variables
Combustion and burn depth measurements from Walker et al. (2020a) were related to a variety of spatial predictors including remotely sensed indicators of fire severity, topography, soils, climate, and fire weather. We initially acquired 75 covariates associated with environmental conditions such as long-term climate, fire weather, topography, vegetation type, soil type, remotely sensed vegetation indices (e.g., normalized difference vegetation index, NDVI; Tucker, 1979), and permafrost condition (Table S2).
2.4.2 Climate variables
Long-term climate was acquired from ClimateNA (CNA; Wang et al., 2016; Table S2), which provides point estimates of mean climate from 1981–2010 based on the Climate Research Unit (CRU; Mitchell and Jones, 2005). ClimateNA uses finer-resolution PRISM (Daly et al., 2002, 2008) and ANUSPLIN (Hutchinson, 1989) climate normals to downscale coarse-resolution monthly climate data to a 4×4 km grid, followed by bilinear interpolation and a locally derived elevation adjustment to estimate point data. CNA variables were represented as both annual and summer means (June–August) and were included to capture the influence of long-term climate on vegetation, fuel loads, and fuel moisture, which drive combustion (Walker et al., 2020b).
2.4.3 Fire weather indices
Fire weather indices (FWIs) represent the meteorology at the timing of fire occurrence and have been associated with fire behavior and carbon emissions due to their influence on fuel moisture and fire spread (e.g., Di Giuseppe et al., 2018; French et al., 2011; Ivanova et al., 2011; Veraverbeke et al., 2017). We acquired FWIs from the Global Fire Weather Emissions Database (GFWED v2.0; Field et al., 2015) at 0.5∘ × 0.66∘ resolution. FWI information was extracted for the day of burn for all fires in the field database. Since FWI data were not available for all burned pixels in our fire product due to missing data in the shoulder seasons, we developed two versions of our aboveground combustion, belowground combustion, and burn depth models: a primary model that included FWIs in training and a secondary one that did not. Mapped pixels from the primary model were assigned a quality flag of 0, and pixels from the secondary model were assigned a flag of 1. Of the 2 123 730 pixels that burned between 2001–2019, 4.4 % did not have FWI data available and necessitated the use of these secondary models.
2.4.4 Environmental variables
We acquired a variety of environmental covariates related to soils, topography, vegetation type, and permafrost occurrence (Table S2). Soil properties were taken from SoilGrids at 250 m resolution (Hengl et al., 2017), including percent clay (0–2 µm), silt (2–50 µm), sand (50–2000 µm), coarse material (>2000 µm), bulk density (g cm−3), soil organic carbon stock (t ha−1), and soil water pH. We integrated all variables across the top 30 cm of the soil profile.
Topographic variables, including elevation (m), aspect (∘), and slope (∘), were derived from a 10 m digital elevation model (DEM) of the ABoVE domain, which, in turn, was derived from a higher-resolution Arctic DEM (Porter et al., 2018) and gap-filled with additional DEM datasets (Burns et al., 2023). This 10 m DEM was resampled to 500 m, and then aspect and slope were both calculated as the local gradient of the four connected neighbors of each pixel. After resampling to 500 m we also calculated a topographic wetness index (TWI) for each pixel that represents soil drainage patterns based on the slope and upslope area draining through a particular point (Beven and Kirkby, 1979).
Vegetation type was represented by the percent cover over seven broad classes, including black spruce (Picea mariana), white spruce (Picea glauca), jack pine (Pinus banksiana), deciduous broadleaf species, other conifers, grasslands, and non-vegetated areas (Beaudoin et al., 2014; Ottmar et al., 2007). We use pre-fire tree cover (Sexton et al., 2013) from either 2000, 2005, 2010, or 2015, depending on fire year.
Lastly, we acquired a permafrost zonation and a surface roughness index, which is a measure of terrain complexity (Gruber, 2012).
2.4.5 Remotely sensed variables
We derived numerous remotely sensed vegetation indices from Landsat, including the NDVI, the normalized difference infrared index (NDII; Hardisky et al., 1983), dNBR (Key and Benson, 2006), the relative difference normalized burn ratio (RdNBR; Miller and Thode, 2007), the relativized burn ratio (RBR; Parks et al., 2014), tasseled cap greenness, wetness and brightness (Kauth and Thomas, 1976), and pre-fire tree cover (Sexton et al., 2013). NDVI, NDII, and tasseled cap indices were acquired as a mean composite between 15 May and 15 June in the post-fire years, while dNBR, RdNBR, and RBR were based on mean composites between 1 June and 31 August for both the pre- and post-fire years.
For model training all remotely sensed variables were extracted from Landsat 5–8 Tier 1 surface reflectance at 30 m with clouds, cloud shadows, and snow masked out using the C Function of Mask algorithm (CFMask; Foga et al., 2017). We applied corrections due to spectral differences between Landsat 8 and 7 using a regression technique (Roy et al., 2016). Although our model was trained with Landsat imagery at 30 m, we predicted combustion and burn depth at 500 m across the domain using MODIS imagery. All MODIS variables were extracted in Google Earth Engine at ideal MODIS quality flags (bit flag of 0). We then implemented a correction factor to account for sensor and spatial-scaling issues in model predictions (Sect. 2.4.7).
2.4.6 Feature selection and model comparisons
We reduced our initial 75 covariates to an optimal number using recursive feature elimination (Guyon et al., 2002). Recursive feature elimination iteratively removes variables until a desired number remains, which in this case is defined by the number of covariates necessary to achieve the minimum root mean square error (RMSE). Recursive feature elimination achieves this by fitting a secondary machine learning model that can rank features by importance and discards the least important ones at each iteration. We used a random forest (Breiman, 2001) as the measure of importance and repeated our recursive feature elimination three times across a 5-fold cross-validation to determine the optimal subset of covariates (Table S2). For the primary aboveground combustion, belowground combustion, and burn depth models, the optimal number of variables was 15, 45, and 40 (Fig. S5), respectively, and for the secondary models the optimal number of variables was 15, 64, and 48. While it is possible a similar RMSE could have been achieved with reduced model complexity (reduced number of variables), we chose to directly use RMSE reduction as our threshold for feature selection.
We then tested a suite of statistical models across the selected feature space to compare predictive power. For each model, we searched for optimal model parameters using a 10-fold cross-validation repeated three times and a random search grid of length 10 (i.e., for any given model parameter, 10 random numbers were selected per parameter and tested for each parameter combination). After optimizing model parameters, we compared final model fits with a 10-fold cross-validation repeated 100 times. After comparing the median R2 for each model across these 1000 iterations, we selected the best-performing model and chose it for the final model implementation. All model training took place in R (R Core Team, 2021). In all cases the best-performing model was a ranger random forest, although there were differences in the optimal parameters chosen (Table S3).
2.4.7 Spatial scaling
Our combustion and burn depth models were developed using site-level data (most plots utilized a 30 × 30 m design) and geospatial predictors at their native resolution, including a variety of 30 m Landsat indices. However, our spatial model was applied at 500 m to match the resolution of our burned-area product, ultimately because missing imagery prevented comprehensive burned-area mapping at 30 m. To explore potential issues associated with implementing the model at these different spatial scales, we randomly sampled two hundred 500 m pixels from each year in 2004, 2006, 2012, 2014, and 2015 for a total of 1000 pixels. We then implemented our combustion and burn depth models at both 30 and 500 m to assess biases and errors introduced by both spatial and sensor differences. When models were assessed at 30 m, all predictor variables were acquired at their native resolutions (Table S2); when models were assessed at 500 m, all variables were resampled to 500 m. Any variables described in Sect. 2.4.5 that were derived from Landsat were instead collected at 500 m from MODIS (using MOD09A1 Collection 6 and MYD09A1 Collection 6). We used MODIS-provided quality flags to select pixels that were corrected at ideal quality and masked out clouds and snow. All other variables were resampled to 500 m using bilinear interpolation if the native resolution was >500 m and using mean values within pixel boundaries if the native resolution was <500 m. We then compared the predictions at 500 m resolution to the mean across all the 30 m sub-pixels and built type 2 linear regression models to correct for potential biases. The coefficients from these models were then used to adjust the final predictions for the combustion models across the full domain.
2.4.8 Combustion and burned-depth predictions and quality flags
Predictor variables for all burn pixels across the domain were collected in Google Earth Engine. Since the ideal MODIS quality flag criteria (Sect. 2.4.5) left 0.31 % of the total burned pixels missing, we collected predictors for these pixels with no MODIS quality flag applied and assigned our own quality flag to distinguish these samples. We provide four separate quality flags indicating whether our primary or secondary models (no FWIs) were implemented and whether MODIS quality flags were applied. Our four flags have the following associations: flag 1 – primary model with MODIS quality flag criteria (95.32 % of pixels), flag 2 – primary model with no MODIS quality flag criteria (0.26 % of pixels), flag 3 – secondary model with MODIS quality flag criteria (4.37 % of pixels), flag 4 – secondary model with no MODIS quality flag criteria (0.05 % of pixels).
2.4.9 Monte Carlo analysis
To derive a measure of prediction uncertainty, we implemented a Monte Carlo analysis with 500 simulations that incorporated uncertainty from both the field-measured combustion and the random forest models. Our approach was based on techniques implemented in Rogers et al. (2014), Veraverbeke et al. (2015), Walker et al. (2018), and Dieleman et al. (2020). To account for uncertainty in field estimates of belowground combustion, we used the standard error in observed site-level combustion when it was available. In total, 271 field sites recorded standard error: 22 in Alaska, 47 in Saskatchewan, and 202 in the Northwest Territories. Standard error was estimated for both aboveground and belowground combustion in Alaska and Saskatchewan and only for belowground in the Northwest Territories. For each Monte Carlo simulation, we derived an adjustment factor by multiplying a site's standard error by a random number from a normal distribution with a standard deviation of 1 and centered around 0. This resulting number was then added to the measured combustion.
Uncertainty in aboveground combustion in the Northwest Territories was calculated by first creating a random bias for the percent carbon content of trees (central estimate of 0.5), which varied randomly within a normal distribution with 3 % standard deviation systematically across all trees measured for each Monte Carlo simulation (based on Rogers et al., 2014). We similarly included a 20 % error in visual estimates of tree consumption (Dieleman et al., 2020; French, 2004; Walker et al., 2018), which also varied systematically across all trees measured. Aboveground combustion in each simulation was then altered using these adjustment terms (adding the carbon fraction adjuster and multiplying the tree consumption adjuster).
Since these procedures only accounted for uncertainty of 271 of the possible samples, uncertainty for the remaining 245 aboveground and 499 belowground samples was derived using an alternate approach. To do so, we first linearly regressed the aboveground and belowground combustion standard error derived from Monte Carlo simulations against measured aboveground and belowground combustion, respectively. The coefficients from these two separate models were then used to predict the standard errors for all remaining samples (Fig. S6).
In addition to uncertainty in field measurements, there is also uncertainty in the random forest model used to predict combustion across the ABoVE domain. To account for this, we leveraged the fact that model residual errors tended to increase in proportion to combustion level, similar to Rogers et al. (2014) and Dieleman et al. (2020). To estimate this relationship, we split the original model predictions (from the 10-fold cross-validation repeated 100 times) into 15 bins based on quantiles of total combustion and then calculated the standard deviation of the residual error within each bin. We then used a general additive model to smooth the standard deviation of the residuals across the bins (Fig. S7). For each of the 500 Monte Carlo simulations using adjusted field estimates of combustion (derived from procedures described above), new random forest model predictions were assigned a standard error based on total combustion using the smoothed relationship. These standard errors were then multiplied by a random bias factor with a standard deviation of 1 centered around 0, which was then added back into the combustion predictions to derive a final uncertainty estimate for each predicted combustion pixel across the ABoVE domain.
We quantified uncertainty in our predictions in three ways: (1) pixel-level uncertainty, (2) uncertainty in mean combustion, and (3) uncertainty in total emissions for a given region of interest. In each case, uncertainties derived from the Monte Carlo simulations were adjusted by the ratios of mean combustion from the primary model to that of the Monte Carlo simulations in order to account for different mean combustion levels, and hence emissions, between the models (which were minor). (1) Pixel-level uncertainty was calculated as the standard error in combustion for a given pixel across the Monte Carlo simulations. (2) Uncertainty in mean combustion for a given region was calculated as the standard error in mean combustion across the 500 Monte Carlo simulations for that region. In this case note that mean combustion was calculated by weighting pixels by their vegetated (burned) fractions. (3) Uncertainty in total emissions for a given region of interest was calculated as the standard error in total emissions for that region across the 500 Monte Carlo simulations. A simplified flow chart of the combustion/burned-depth modeling methodology is shown in Fig. S8.
2.5 Relationships between belowground fire severity, annual burned area, and timing of burn
Turetsky et al. (2011) discovered a positive relationship between burn depth, annual burned area, and timing of burn (day of year) in black spruce forests and peatlands of interior Alaska and also noted the influence of burn timing was more important in small-fire years. To test if these relationships held true with a larger field database in Alaska (n=286 for ABoVE-FED compared to n=178 in Turetsky et al., 2011), we performed a multiple regression of burn depth and belowground combustion using annual burned area and day of year as predictor variables. We also tested how burn depth and belowground combustion varied as a function of day of year within both small- and large-fire years. To do so, we split the field sites in Alaska into four quantiles based on annual burned area and then regressed burn depth and belowground combustion against day of year within each quantile. We also conducted this analysis using a sample of 500 ABoVE-FED pixels in Alaska instead of field observations and then repeated both of these analyses using all available field observations and 500 random pixels within the broader ABoVE domain. In each case, we sampled 500 pixels instead of using all available pixels to minimize the effect of large sample sizes on p values.
3.1 Burned area
Temporally there was high variability in burned area year to year (Fig. 2a). Across the domain, ABoVE-FED reported similar burned-area totals compared to the NLFD (average of 2.87 Mha yr−1 for ABoVE-FED compared to 2.90 Mha yr−1 for NLFD; Fig. 3), although there was variability in this relationship (NLFD estimated larger annual burned area in 11 years and smaller burned area in 8 years between 2001–2019). This was the net result of two contrasting patterns: ABoVE-FED tended to report less burned area within mapped polygons, due to unmapped unburned patches and unburnable land cover (e.g., small waterbodies) in the government fire databases, but detected additional burned areas associated with MODIS active-fire acquisitions well outside mapped fire polygons (7 % of total burned area in ABoVE-FED, 6 % of total emissions; Fig. S9). The state/territory with the most burned area detected outside the mapped polygons was British Columbia (31 % of the 7 % total burned area mapped outside NLFD polygons; Fig. S9). Exploratory analysis revealed this was likely a result of commission errors due to logging (i.e., logged areas tripping dNBR thresholds in conjunction with small fires registered by MODIS active-fire hits). Across the domain, the mean fire size coincident with NLFD polygons was much larger (4954 ha) than the mean fire size outside the polygons (166 ha). Because the NBAC product accounts for more of these unburned patches within polygons (Hall et al., 2020), it tended to report lower total burned area compared to ABoVE-FED (Fig. S10). ABoVE-FED burned area was higher than MCD64A1 (Collection 5 and 6; Fig. 3) in all years, which is consistent with known omissions in these global products for boreal North America (Giglio et al., 2018; Randerson et al., 2012; Fig. S11). These large-scale patterns were corroborated by high-resolution imagery of particular fire events (Figs. 4, S12–S19). ABoVE-FED identified more burned pixels than MCD64A1 Collection 6 by being more sensitive to fire-induced spectral changes but also accounted for unburnable portions of the landscape (Fig. S20). GFED4s burned area was slightly higher (Fig. S21; average of 2.38 Mha yr−1 during 2001–2016) than both MODIS products (Fig. 3; average of 2.93 Mha yr−1 during 2001–2016), but lower than the NLFD and ABoVE-FED (Fig. 3). The MCD64A1 Collection 5 and Collection 6 and GFED4s databases underestimated burned area by 32 %, 23 %, and 18 % compared to ABoVE-FED, respectively.
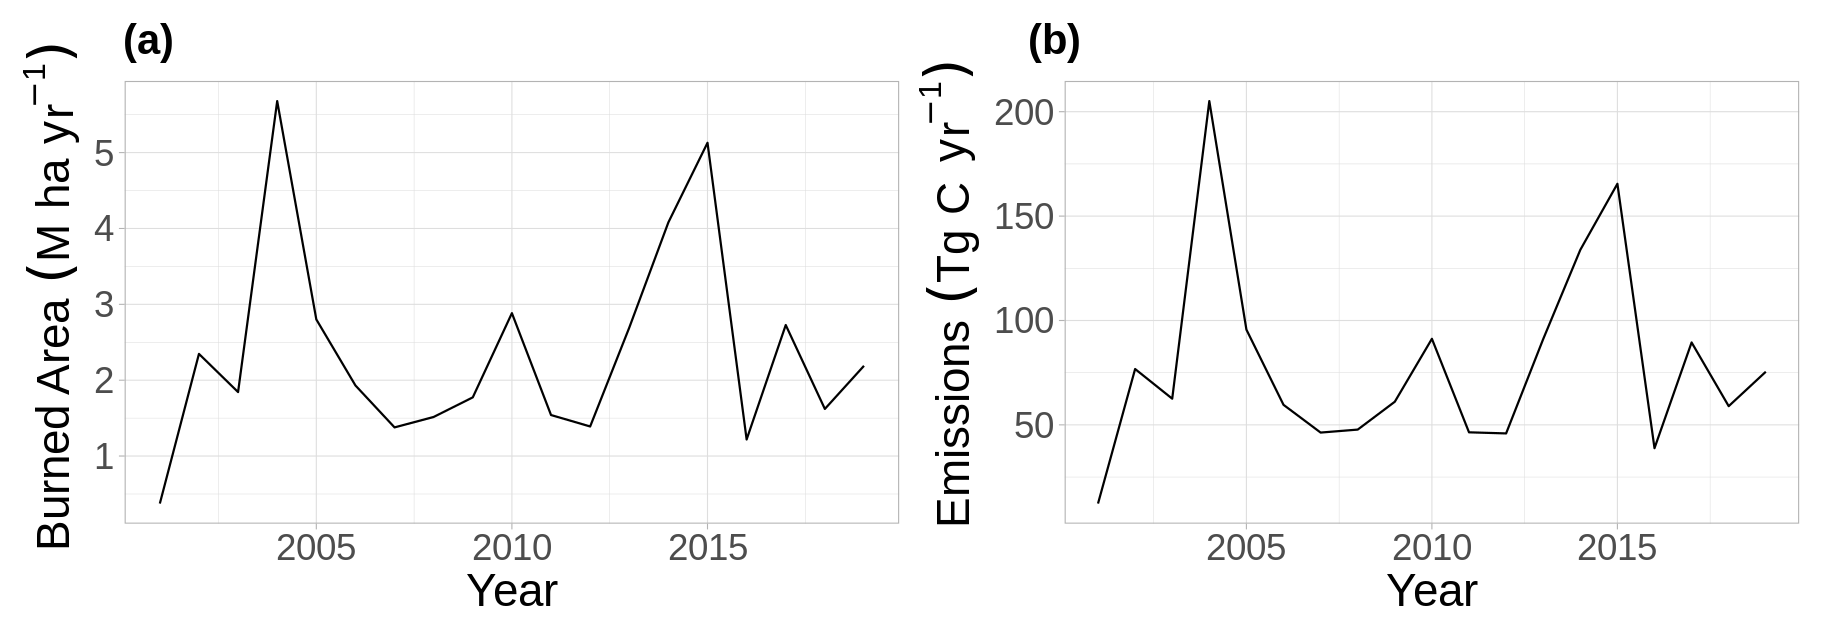
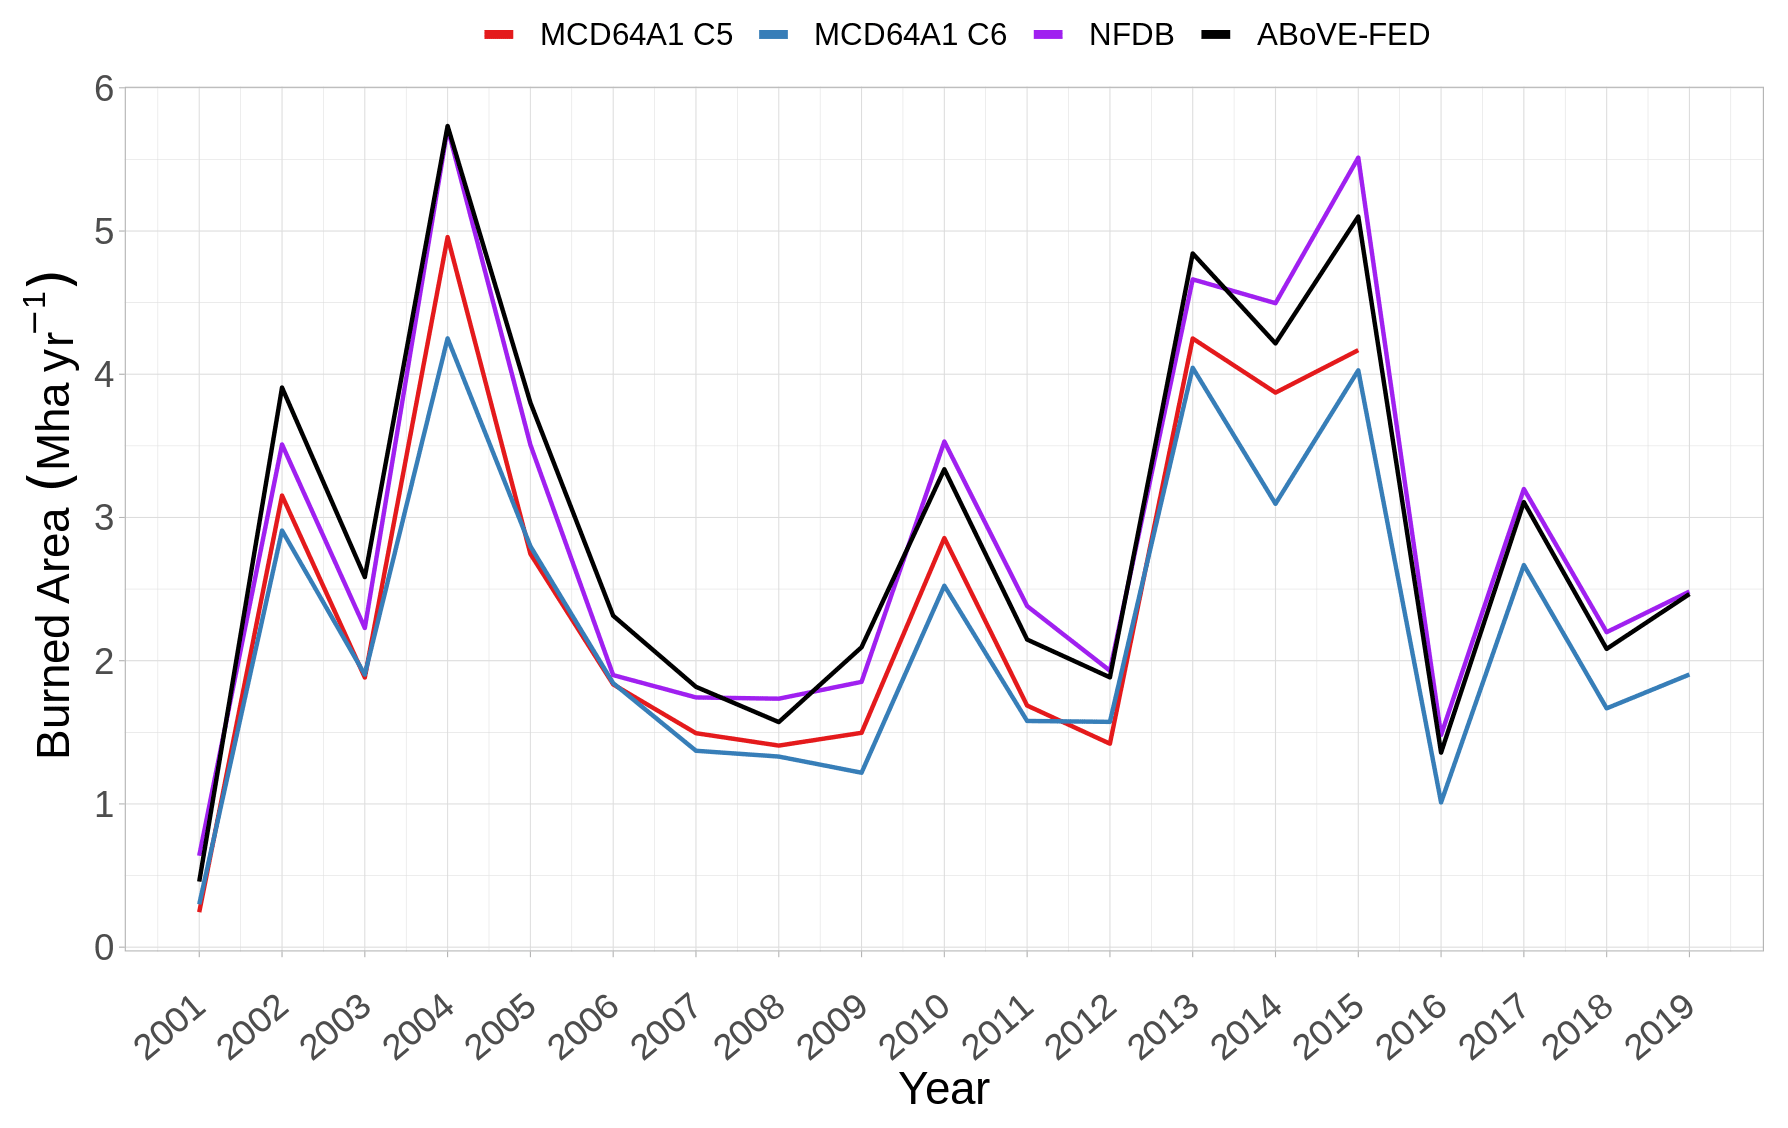
Figure 3Comparison of ABoVE-FED burned area across Canada and Alaska to MODIS MCD64A1 Collection 5 (C5), MCD64A1 Collection 6 (C6), and the Alaskan and Canadian National Fire Databases (NFDB).
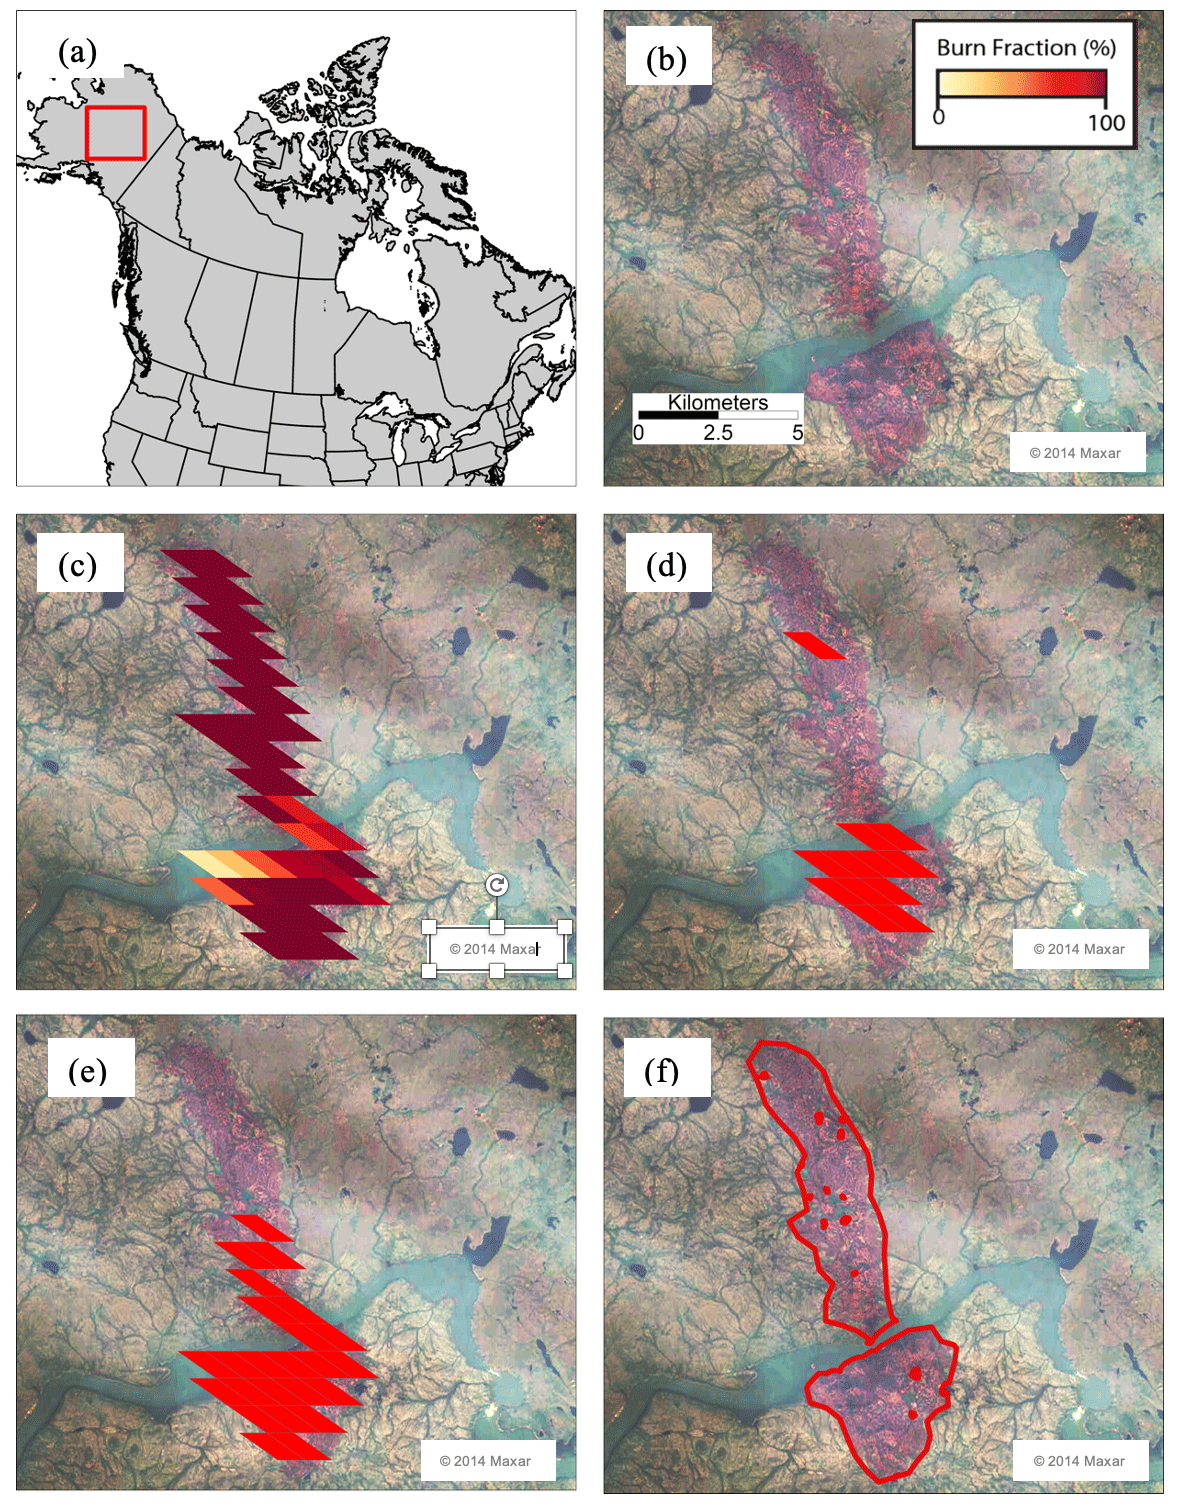
Figure 4Comparison of high-resolution imagery and burned-area products for a fire in Manitoba in 2014 (a). Panels show WorldView-2 imagery (fire shown in purple shades) (b), ABoVE-FED (c), MODIS Collection 6 (d), MODIS Collection 5 (e), and the Canadian National Fire Database (f).
ABoVE-FED burned area was similar to AKFED where it was available (Alaska, the Northwest Territories, and the Yukon Territory; Fig. S22; average of 1.27 Mha yr−1 for ABoVE-FED during 2001–2015 compared to 1.22 Mha yr−1 for AKFED). All models participating in FireMIP simulated smaller burned area than ABoVE-FED, and with a very high level of variability between models (1.34 ± 0.83 Mha yr−1 across Alaska and Canada during 2001–2012; Fig. S23a).
Burned area was highly variable interannually (Figs. S21, S24), with the largest-fire years occurring in 2004 in Alaska and the Yukon Territory; 2015 in Alaska, Saskatchewan, and Alberta; 2014 in the Northwest Territories; and 2013 in Manitoba and Quebec. Across states, provinces, and territories, total burned area was highest in Alaska, the Northwest Territories, and Saskatchewan. A total of 54 Mha burned across Alaska and Canada during all years, and 45 Mha burned in the ABoVE domain, with an annual mean of 2.87 Mha yr−1 across Alaska and Canada and 2.37 Mha yr−1 in the ABoVE domain.
Spatially ABoVE-FED estimated the most burned area in Alaska, the Northwest Territories, and Saskatchewan (Figs. 5a, S21, S24).
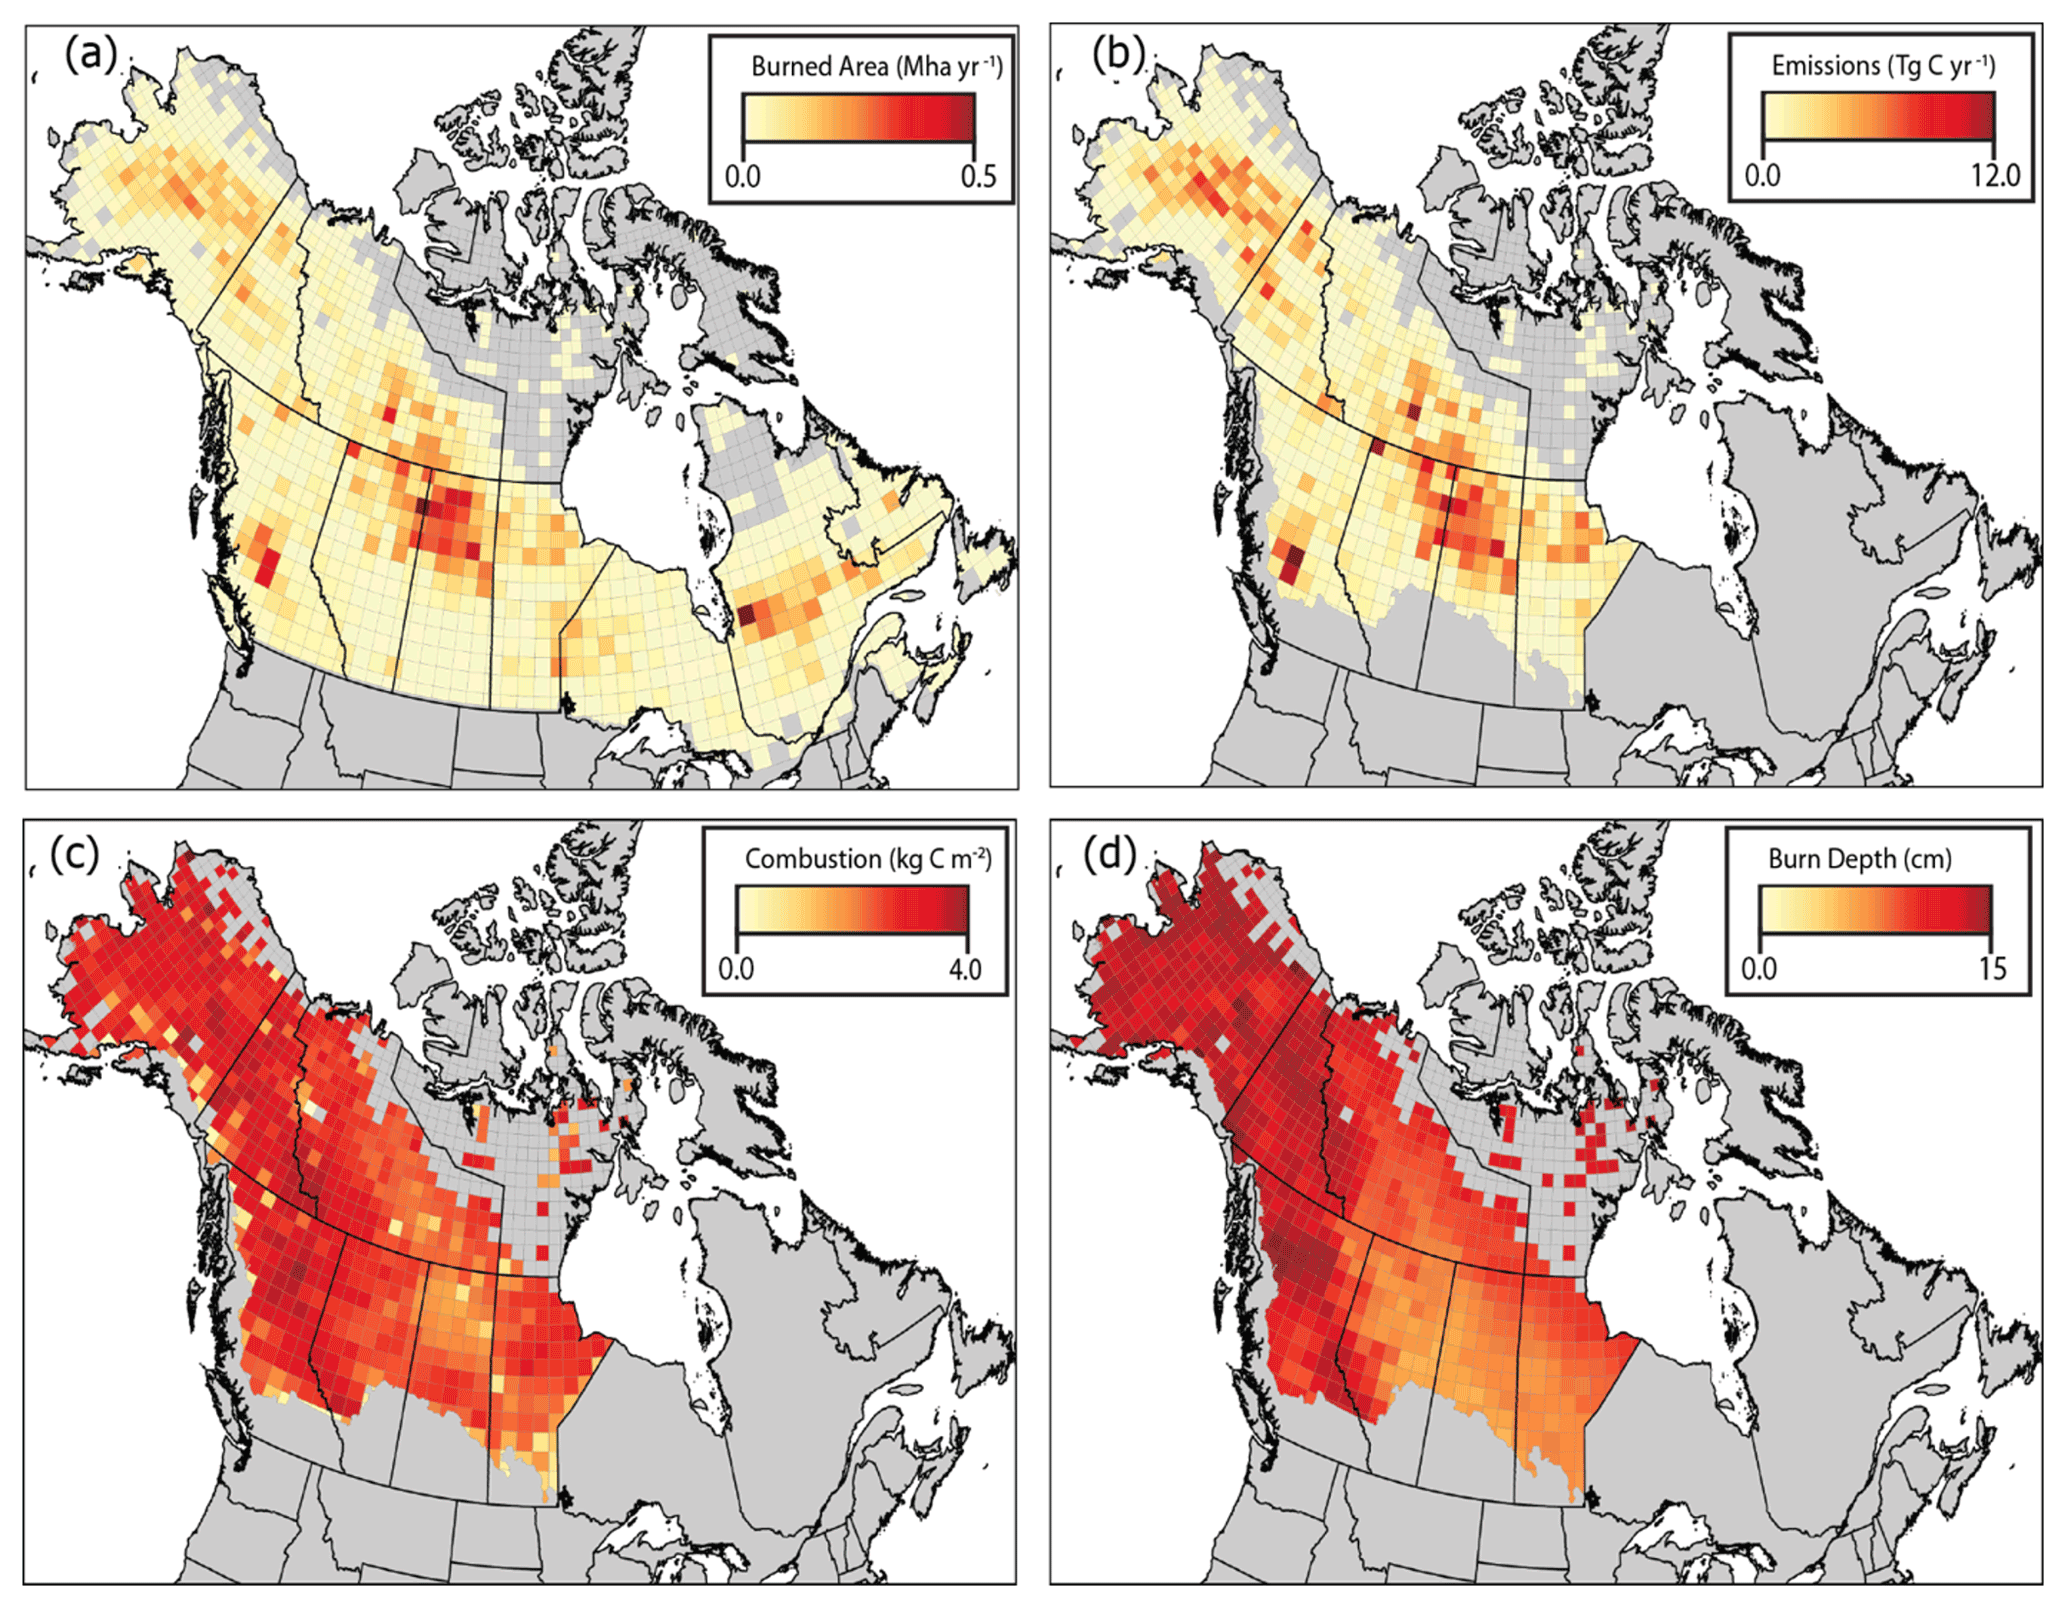
Figure 5Total burned area (a), total carbon emissions (b), mean combustion (c), and mean burn depth (d) between 2001–2019 aggregated to a 70 km grid. Note that burned area (a) covers all of Alaska and Canada, whereas all other metrics cover the ABoVE extended domain.
3.2 Combustion and burn depth models
Our aboveground and belowground combustion models performed well, although the aboveground model performed significantly better across the suite of models examined (Fig. 6a, b). A ranger random forest model (Wright and Ziegler, 2017) performed best for aboveground and belowground combustion, with a median R2 of 0.46 and 0.25, respectively, across the 10-fold cross-validation repeated 100 times. Our secondary models that did not include information on FWIs (Sect. 2.4.3) performed similarly to our primary models, with R2 values for aboveground and belowground combustion of 0.45 and 0.24, respectively. Although both the aboveground and belowground models performed reasonably well at predicting lower and moderate combustion values, which includes the majority of field observations, they both struggled to predict larger combustion values (Fig. S25a, b). The burn depth model performed better than both combustion models, with a median R2 of 0.53 using a ranger random forest model (Fig. 6c).
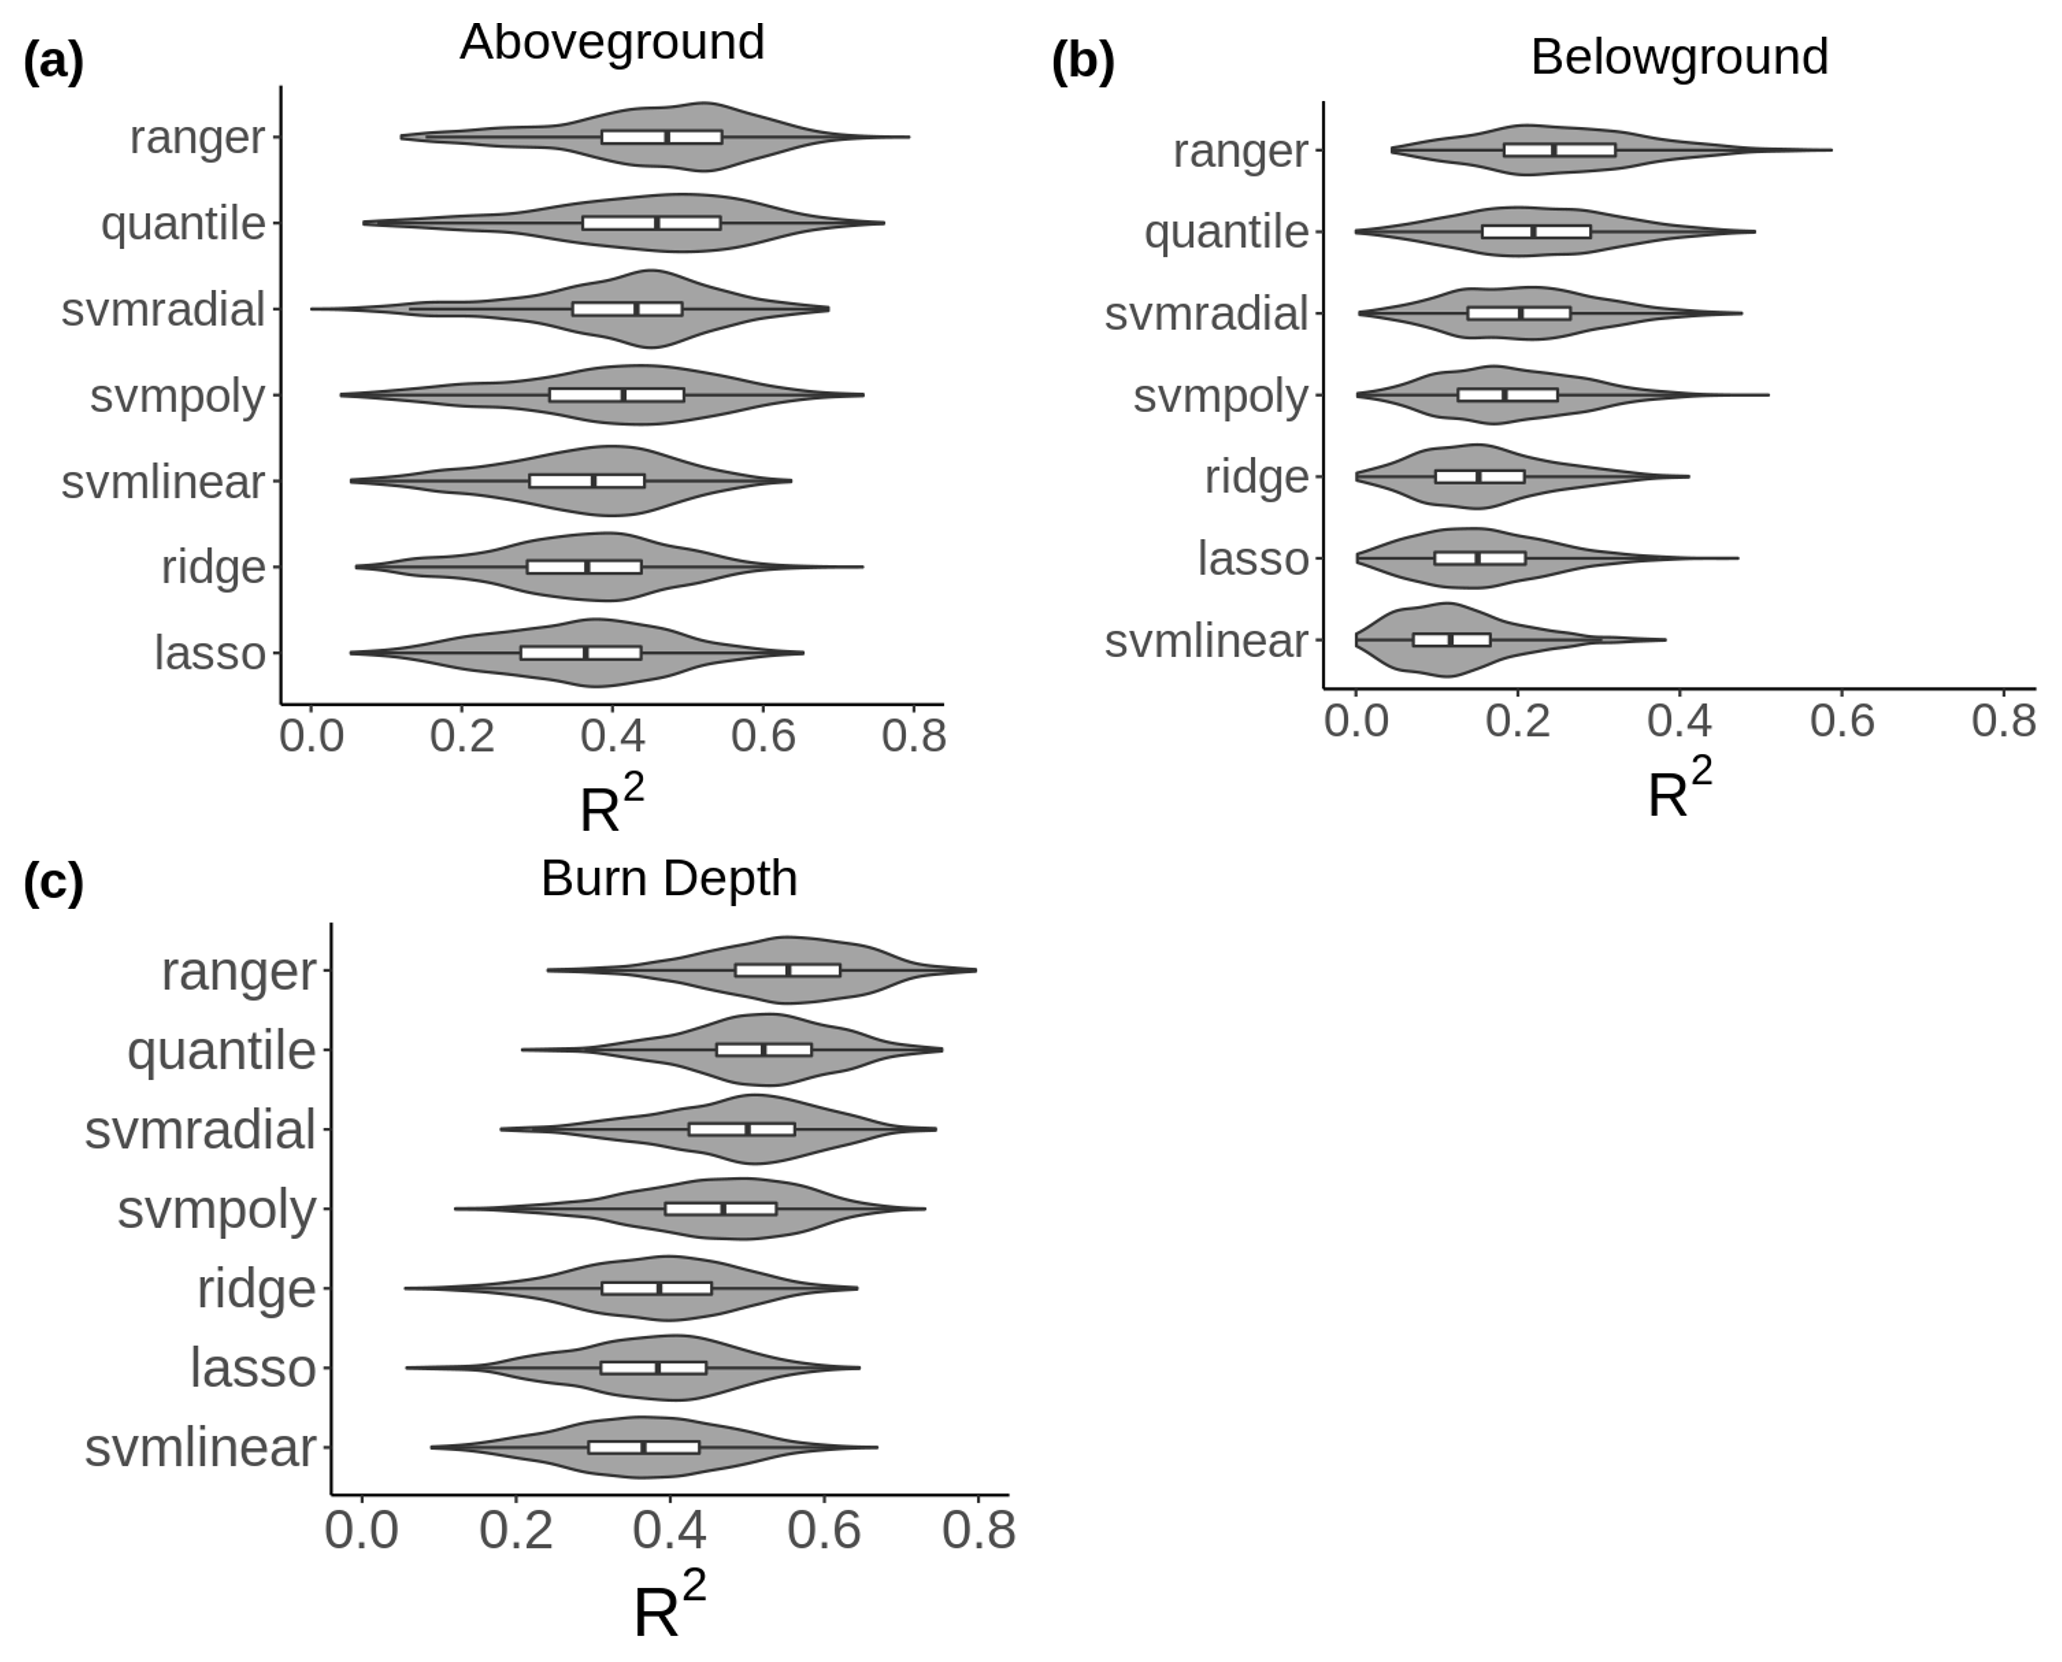
Figure 6Comparison of the spread and median R2 values across a 10-fold cross-validation repeated 100 times for our aboveground combustion (a), belowground combustion (b), and burn depth (c) models. Models compared include a ranger random forest (ranger), a quantile random forest (quantile), radial support vector machines (svmradial), polynomial support vector machines (svmpoly), linear support vector machines (svmlinear), ridge regression (ridge), and lasso regression (lasso).
There were notable differences in the feature importance of the aboveground and belowground models (Fig. S26a, b). The aboveground model was heavily influenced by its top predictor, pre-fire tree cover, followed by metrics of relative humidity, with other variables including remotely sensed fire severity and vegetation moisture content having significant but relatively low importance. In contrast, the belowground model was influenced strongly by a number of soil, terrain, climate, and tree cover variables. The most important features for the burn depth model were similar to the belowground model, with soil properties, tree cover, and climate being the most influential (Fig. S26c). Overall, the distribution of variables used in the training dataset and predicting dataset were similar (Fig. S27), with the exception of slope. Most field sites were located in relatively flat terrain, whereas the combustion predictions included locations with steeper terrain.
Spatial patterns of mean burn depth and combustion tended to follow a gradient of higher burn depth and mean combustion in the western part of the ABoVE domain (Alaska, Yukon Territory, and Alberta) to lower mean combustion in central–western Canada (Saskatchewan, Northwest Territories, and Manitoba) (Figs. 5c, d, S28). There was, however, considerable fine-scale variability at 500 m within these regions (Fig. 7), and spatial patterns were relatively consistent with previous combustion mapping efforts.
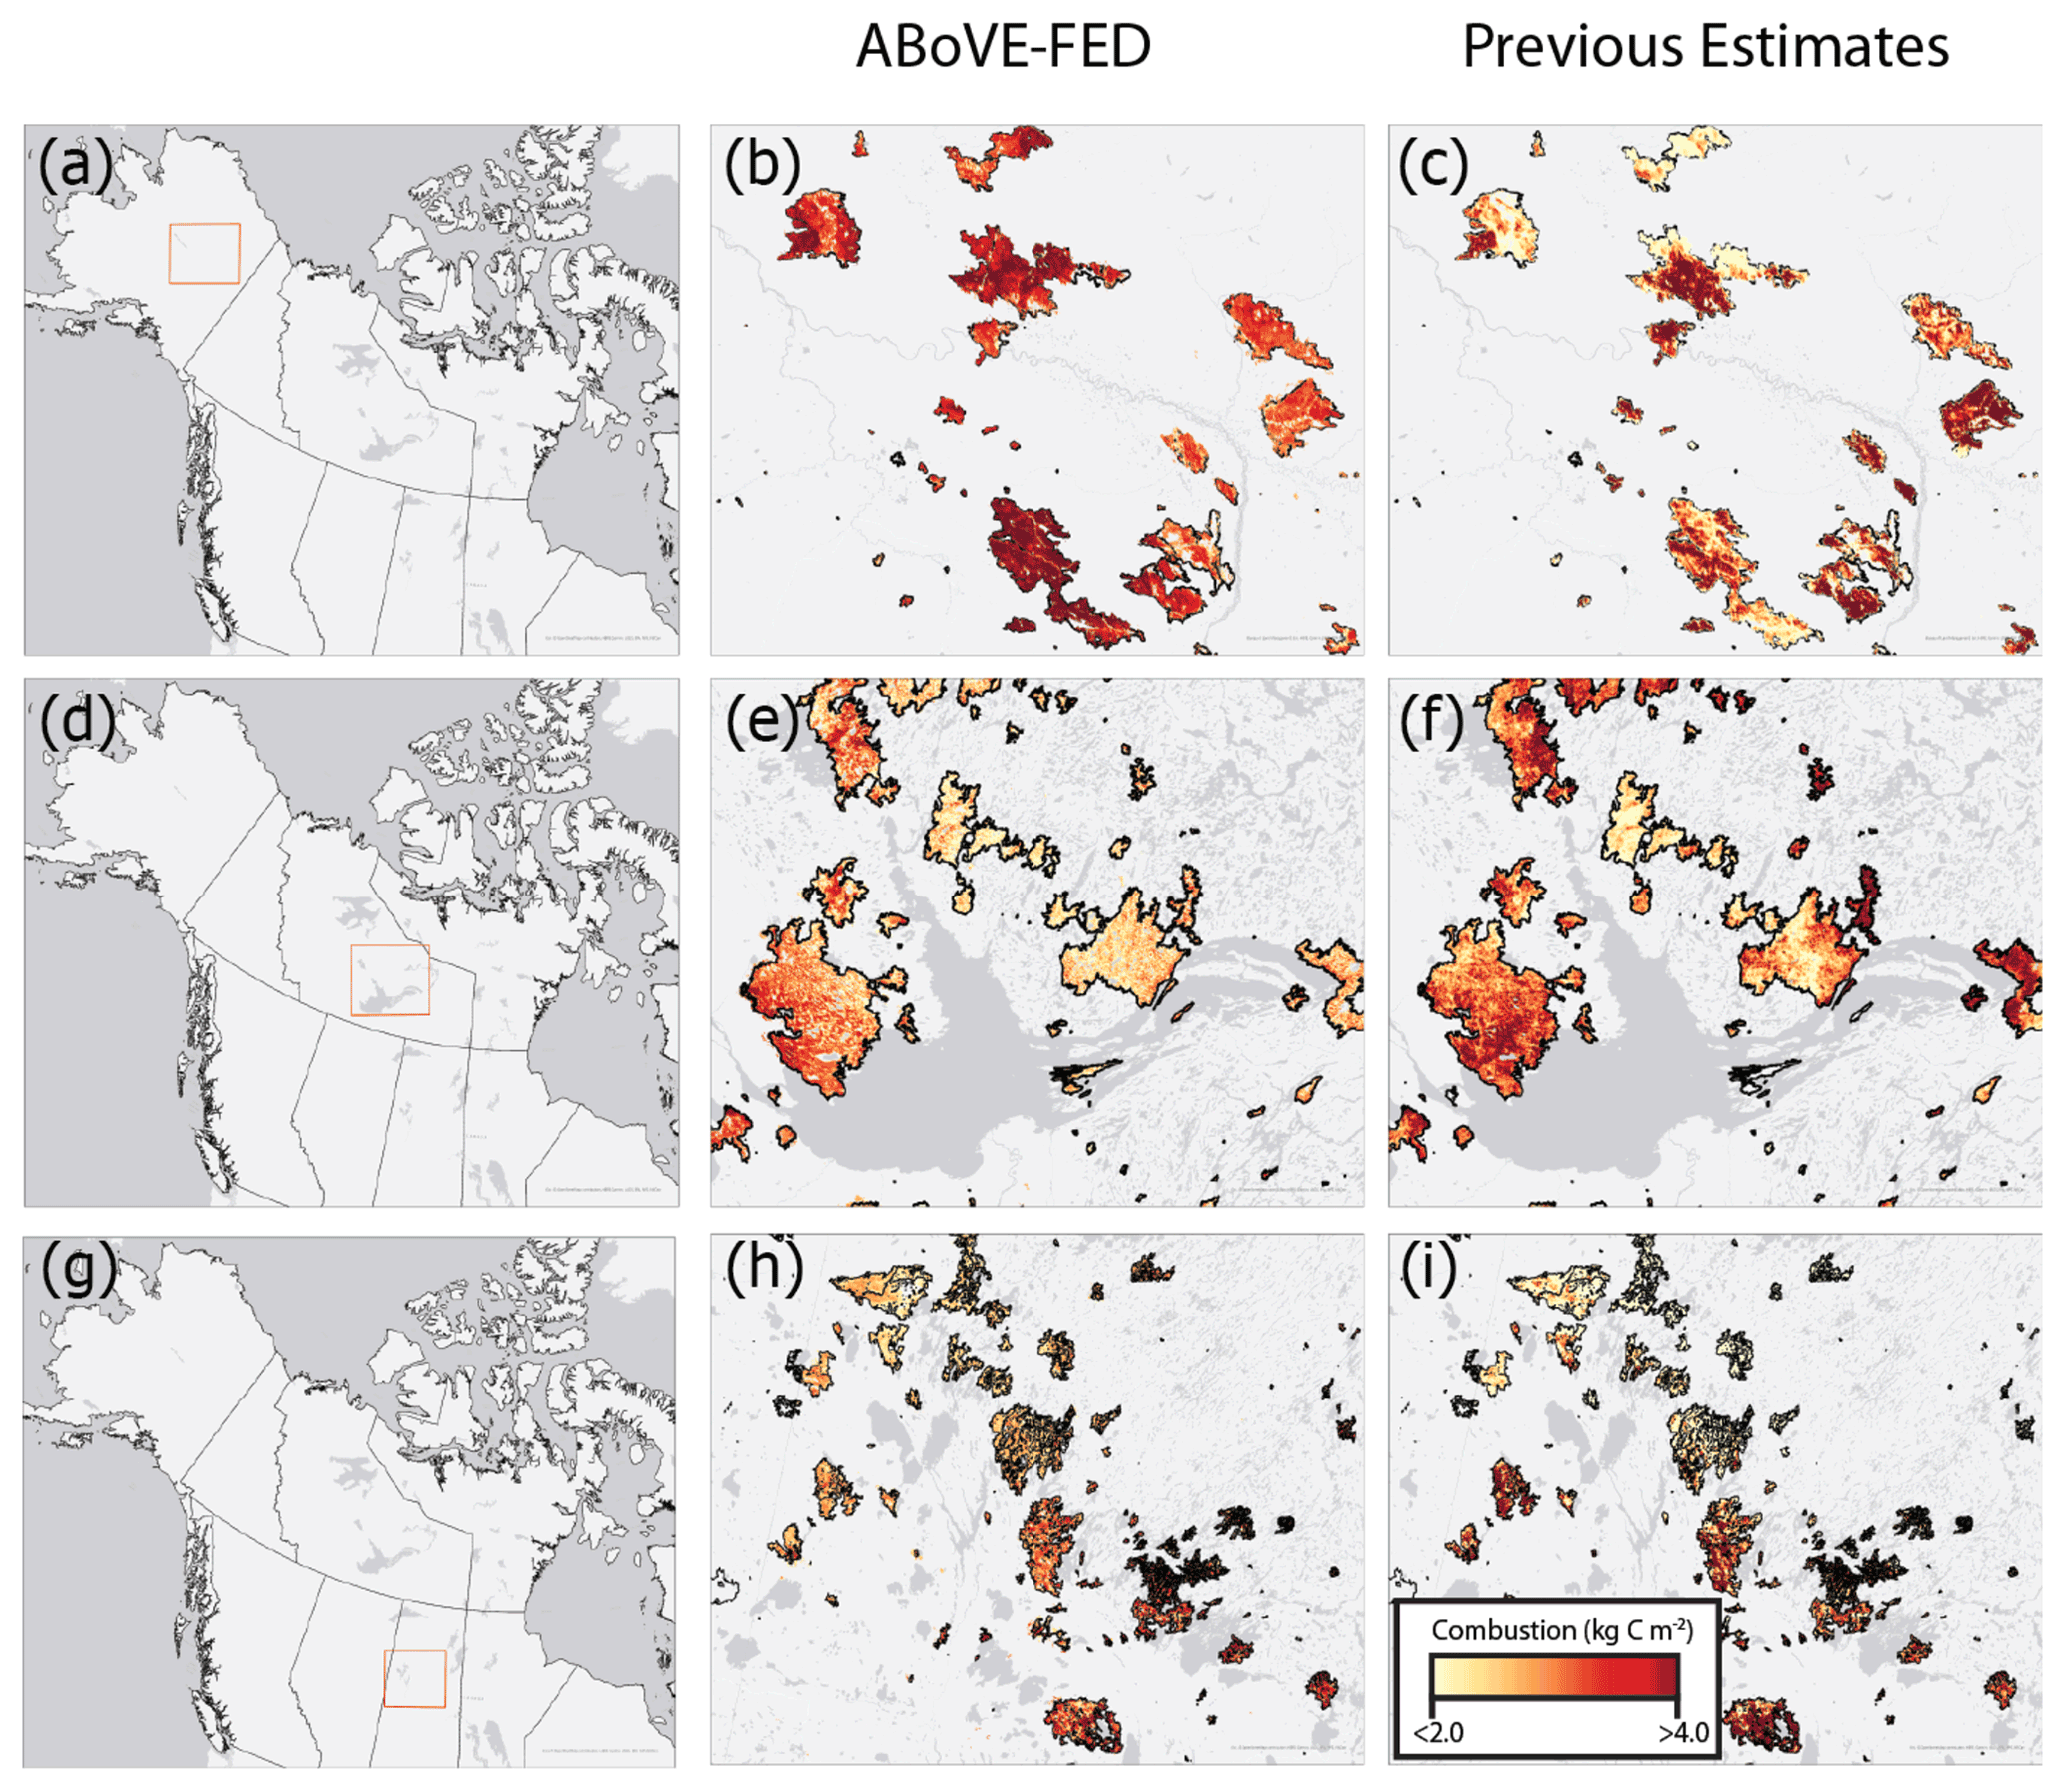
Figure 7Comparison of Alaskan fires in 2004 (a) for ABoVE-FED (b) and AKFED (c), the Northwest Territories fires in 2014 (d) for ABoVE-FED (e) and Walker et al. (2018) (f), and the Saskatchewan fires in 2015 (g) for ABoVE-FED (h) and Dieleman et al. (2020) (i). Basemap sources: Esri, ©OpenStreetMap Contributors, HERE, Garmin, USGS, EPA, NPS, NRCran.
Across the ABoVE domain, 1.51 ± 0.53 Pg C was emitted over the 2001–2019 period, with a mean of 79.3 ± 27.96 Tg C yr−1. Mean combustion across all years and regions was 3.13 ± 1.17 kg C m−2. Pixel-level uncertainty (Fig. S29) tended to follow spatial patterns of mean combustion (Fig. 5c) and was relatively consistent across years (Fig. S30), with a mean value of 2.86 kg C m−2. Seasonally, the majority of burned area occurred during June, July, and August (Fig. 8), although there were substantial regional differences, with some regions recording a large fraction of burned area outside this window (e.g., May fires in Alberta). In general, monthly patterns in emissions (Fig. S31) followed patterns in burned area. Overall, combustion tended to be highest in summer compared to spring and fall fires, although this pattern was most pronounced in the Yukon Territory, Northwest Territories, Saskatchewan, and Alaska (Fig. S32).
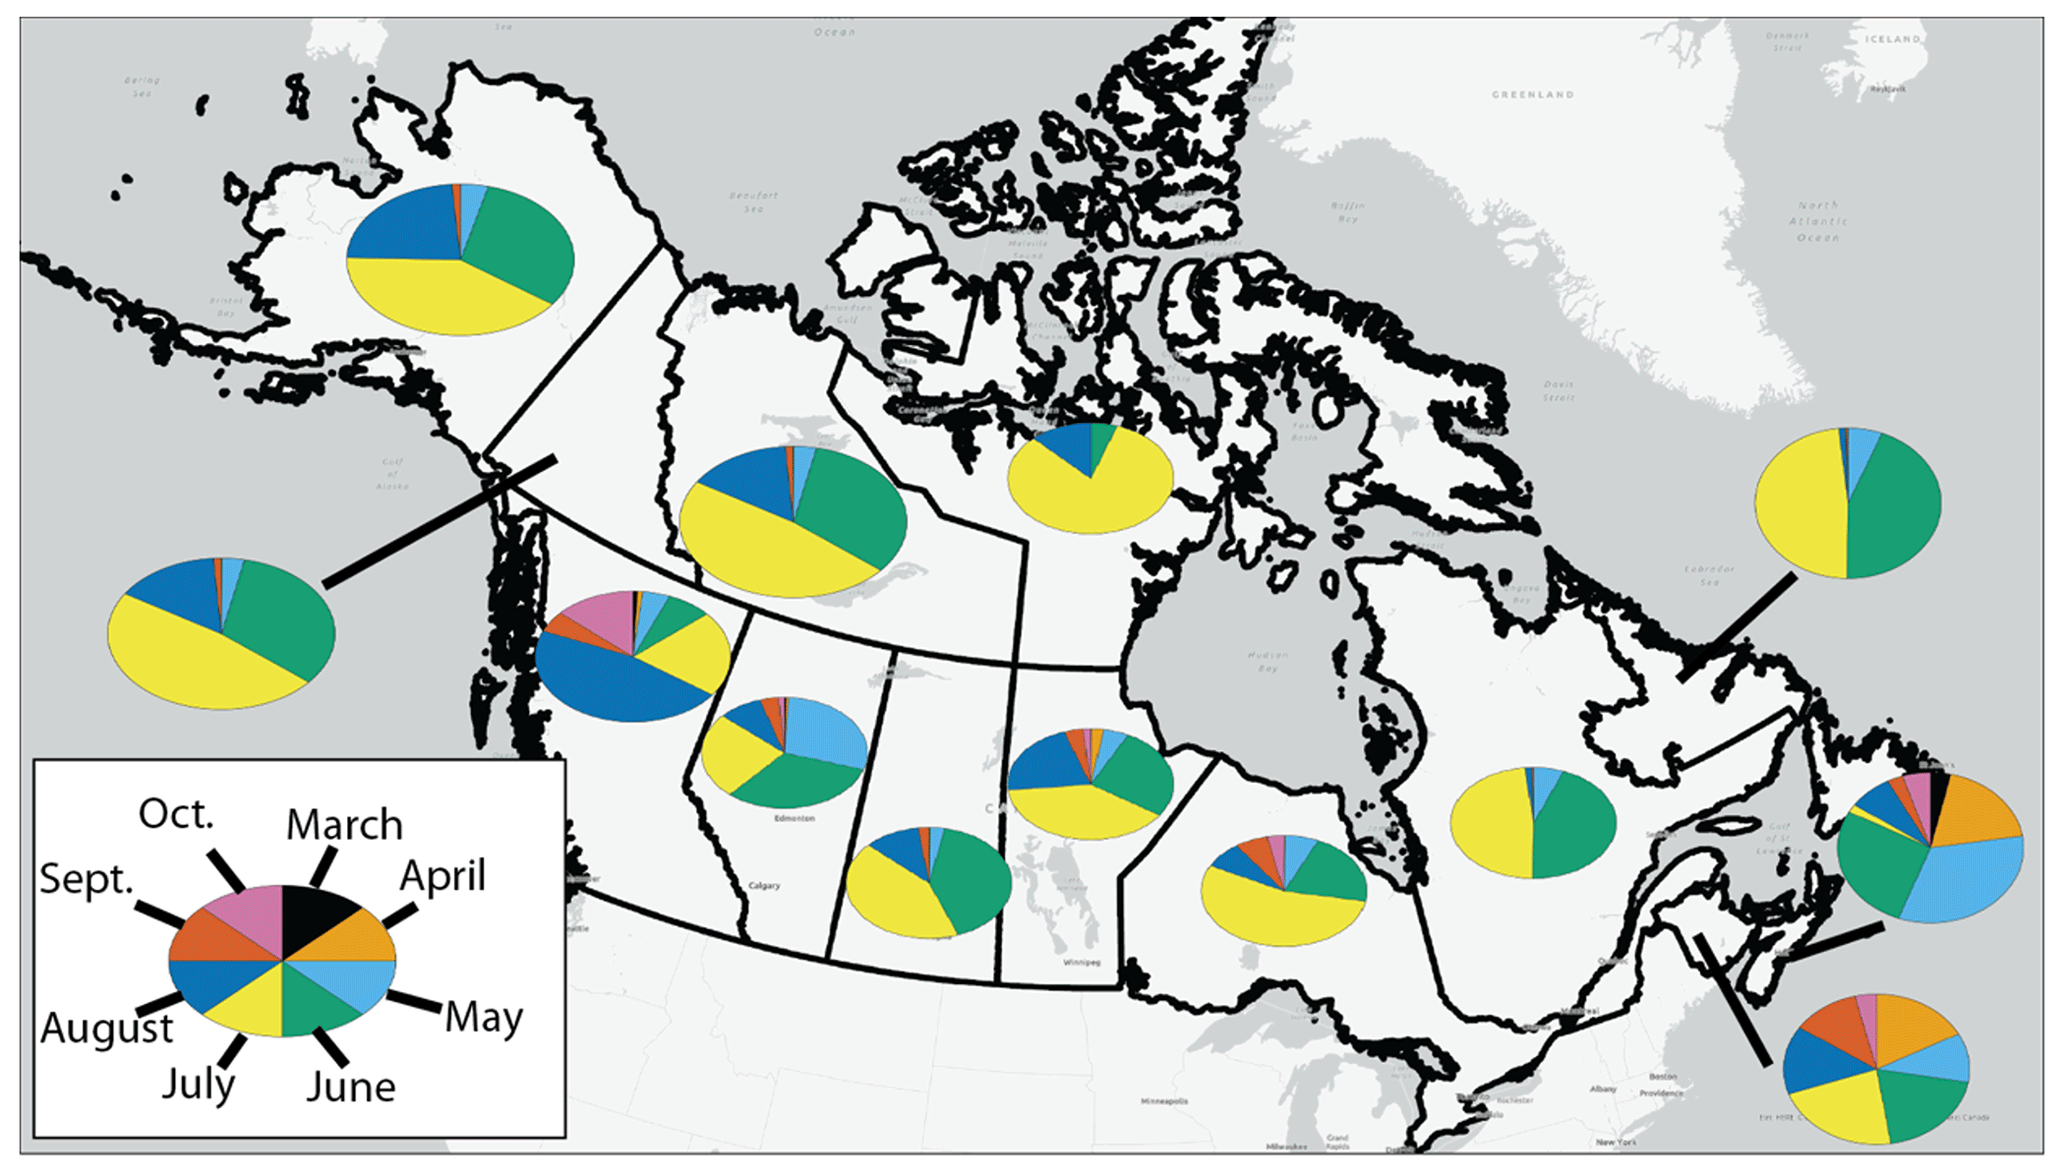
Figure 8Monthly burned area across states and Canadian provinces and territories between 2001–2019. January, February, November, and December have been omitted due to low fire occurrence (less than 2 % of total burned area between 2001–2019).
Estimates of total carbon emissions in ABoVE-FED were similar to AKFED (Fig. S22, Table S4), with the notable exception of 2014 in the Northwest Territories: AKFED estimated 164 Tg C, and ABoVE-FED estimated 89.7 Tg C. This was primarily a result of differences in mean modeled combustion in the Northwest Territories 2014 fires, with AKFED exhibiting its highest mean combustion in 2014 (Fig. S21; 4.81 kg C m−2 in AKFED compared to 2.89 kg C m−2 in ABoVE-FED). In general, ABoVE-FED estimated slightly higher mean combustion levels than AKFED in Alaska (3.34 kg C m−2 in ABoVE-FED and 3.03 kg C m−2 in AKFED), lower combustion in the Northwest Territories (3.29 kg C m−2 in ABoVE-FED and 3.44 kg C −2 in AKFED), and substantially higher combustion in the Yukon Territory (3.71 kg C m−2 in ABoVE-FED and 2.26 kg C m−2 in AKFED) (Fig. S22, Table S4). ABoVE-FED carbon emissions were relatively similar to Walker et al. (2018) for the 2014 Northwest Territories fires and to Dieleman et al. (2020) for the 2015 Saskatchewan fires (Fig. 7, Table S4). Total carbon emissions from ABoVE-FED were substantially higher than GFED4s (Fig. S33), with the largest differences occurring in Alaska. This was primarily a function of higher mean combustion values in ABoVE-FED compared to GFED4s (Fig. S34). Between 2001–2016, ABoVE-FED estimated 80 Tg C yr−1 total emissions with a mean combustion value of 3.39 kg C m−2, and GFED4s estimated 51 Tg C yr−1 total emissions with a mean combustion value of 2.30 kg C m−2 (Table S4). However, more recently a 500 m model by van Wees et al. (2022) was completed, and both emissions and combustion match more closely to ABoVE-FED. Between 2002–2019 this 500 m product estimates 73 Tg C yr−1 total emissions (Fig. S33) with a mean combustion value of 3.38 kg C m−2 (Fig. S34). Meanwhile, between 2002–2019 ABoVE-FED estimates 83 Tg C yr−1 total emissions with a mean combustion value of 3.16 kg C m−2. Compared to GFED4s these larger emission and combustion estimates in the 500 m product are largely due to increased estimates of belowground combustion, as the van Wees et al. (2022) model is informed by the same field measurements used in ABoVE-FED.
Differences in combustion and carbon emissions were very large between ABoVE-FED and fire–vegetation models participating in FireMIP (Fig. S23b). ABoVE-FED estimated much higher emissions than FireMIP (70.1 Tg C yr−1 for ABoVE-FED during 2001–2012 compared to 4.0 Tg C yr−1 for FireMIP). This is likely because models in FireMIP mostly combust aboveground vegetation, whereas combustion from belowground sources (primarily soil organic matter) comprises 90 % of total carbon emissions in ABoVE-FED (Fig. S35) and 88 % in the field plots from Walker et al. (2020a). ABoVE-FED mean aboveground combustion (7.84 Tg C yr−1 during 2001–2012) was much more similar to FireMIP's 4.0 Tg C yr−1.
We found multiple lines of evidence that belowground fire severity (burn depth and belowground combustion) is positively related to annual burned area and seasonal day of burn (Tables S5, S6). In general, mean annual burned area had a stronger relationship with fire severity than did burn day of year using multiple linear regression. However, within quantiles of annual burned area (i.e., small- vs. large-fire years), day of year was strongly related to fire severity (particularly belowground combustion), and the slope of this relationship was generally larger in small-fire years (Table S6). When assessed using domain-wide mean severity from mapped ABoVE-FED pixels, we found no significant relationship of burn depth with burned area or combustion (Fig. S36).
There were also no significant (p value ≤ 0.10) trends in burned area, combustion, or emissions across the 2001–2019 time series (Figs. 2a, b, S37).
4.1 Burned area
Our approach to mapping burned area across boreal North America has several advantages compared to past approaches. Although our burned-area product is at 500 m resolution, the majority of pixels (81 %) were mapped using 30 m Landsat imagery. Using finer-scale 30 m imagery allowed us to directly calibrate dNBR thresholds to site-level information and account for unburnable fractions of 500 m pixels. We also calibrated these dNBR thresholds for both 30 m Landsat and 500 m MODIS imagery to most effectively balance omissions and commissions. This allowed us to provide an unbiased estimate of burned area, which is a critical variable for understanding the impacts of fire on arctic–boreal ecosystems and climate.
In theory, ABoVE-FED burned area would be expected to be higher than other available products because of its increased sensitivity to fire-induced spectral changes (compared to, for example, global MODIS burned-area products, via our focus on splitting omissions and commissions) and our accounting for active-fire acquisitions outside mapped fire polygons by the Alaskan and Canadian government agencies. Alternatively, ABoVE-FED accounts for sub-pixel heterogeneity of burnable land surfaces, which would otherwise result in lower burned-area estimates compared to existing products. The net result is that ABoVE-FED burned area tends to be higher than other products, but not exclusively.
We suggest future research efforts focused on burned-area mapping in arctic–boreal environments could be conducted at resolutions finer than 500 m. Doing so will allow for improved understanding of fire spread and behavior patterns and interactions between fire behavior and vegetation/land cover type. Finer-scale mapping should also allow for more accurate assessments of burned area by accounting for the presence of unburned patches of vegetation and waterbodies, thereby facilitating increased understanding of the drivers of fire spread and effects on ecosystem processes (Hall et al., 2020). Fires have typically been mapped at landscape scales using 500 m MODIS imagery because of the frequent revisit times (multiple acquisitions per day). With a resolution of 30 m, Landsat imagery has been less commonly used for mapping burned area at landscape scales because the revisit time (16 d) is much longer and because data coverage can be highly variable regionally and spatially depending on available downlink stations and cloud cover (Hilker et al., 2009; Ju and Masek, 2016; Fig. S3), but this revisit frequency is improving with two Landsat satellites (Landsat 8 and 9) and two Sentinel satellites (2a and 2b) in orbit, which provide much more frequent overpasses (2–3 d when combined).
Similar to ABoVE-FED, approaches for mapping burned area using satellite imagery have typically relied on image differencing of vegetation indices, particularly dNBR (French et al., 2015). This requires pre- and post-fire image pairs and thus compounds issues related to image availability at fine scales (30 m; Chen et al., 2021). Future burned-area mapping at landscape scales could potentially be improved by using machine learning. More specifically, deep learning approaches have been shown to be highly effective at mapping wildfires across different landscapes and vegetation types (Jain et al., 2020; Knopp et al., 2020). Convolutional neural networks, which use a spatial moving window and therefore account for the spatial characteristics of fire scars (Jain et al., 2020), are particularly promising. Finally, developing burned-area products in near real time, as opposed to active-fire-based assessments of hot pixel counts, would help scientists, fire managers, and society contextualize and potentially mitigate rapidly progressing fire seasons as they evolve.
4.2 Combustion and burn depth models
Similar to previous studies (e.g., Veraverbeke et al., 2015), our aboveground combustion model performed substantially better than our belowground model. This is due primarily to the challenge of estimating belowground carbon consumption using remote-sensing-based observations, which are more sensitive to aboveground properties. For example, the ABoVE-FED aboveground combustion model was heavily influenced by remotely sensed properties such as pre-fire tree cover, fire severity (represented by dNBR), and vegetation wetness (represented by NDII), whereas the belowground model was strongly influenced by soil metrics, topography, and solar radiation (Fig. S26). This occurred despite our model utilizing considerably more field observations (n=515 for aboveground combustion and 769 for belowground) than past efforts in boreal North America (e.g., Dieleman et al., 2020: n=47; Veraverbeke et al., 2015: n=126; Walker et al., 2018: n=211), suggesting an inherently limited capacity to model belowground combustion using these techniques. Previous analysis of the field observations we used showed site-level drainage is the dominant driver of combustion in the ABoVE domain, due in part to the large contribution towards total combustion from belowground carbon stocks (Walker et al., 2018, 2020b). We therefore suggest prioritizing the use of geospatial products that adequately capture drainage, and thereby its impact on belowground carbon stocks and vulnerability to combustion, for improving future estimates of carbon emissions from fire disturbance across boreal North America.
Despite these limitations, our model performance is similar to past efforts. For example, Veraverbeke et al. (2015) reported an aboveground combustion model fit of R2=0.53 and a belowground fit of R2=0.29 for Alaska. Walker et al. (2018) implemented a 10-fold cross-validation approach and reported a model fit of R2=0.26 for total (aboveground and belowground) combustion in the Northwest Territories, Canada. Comparatively, we report a median R2 of 0.46 and 0.25 for ABoVE-FED aboveground and belowground combustion models, respectively. However, model performance was substantially higher in Dieleman et al. (2020), who reported a cross-validated R2 of 0.73 for total combustion in Saskatchewan. This is likely due to the higher relative contribution from aboveground combustion in the younger and more productive boreal forests of southern Canada, combined with high-quality provincial spatial datasets such as logging history (Dieleman et al., 2020). In all these cases, spatial patterns from ABoVE-FED are generally consistent with previous efforts (Fig. 7), lending confidence to assessments of drivers and spatiotemporal patterns of combustion.
Somewhat surprisingly, our models of burn depth performed better than both aboveground and belowground combustion models (cross-validated R2=0.53), which is considerably better than the R2 model fit of 0.40 reported for the burn depth model in Veraverbeke et al. (2015). This suggests substantial uncertainty in translating burn depth to carbon emissions in these boreal forests, which underscores the need for improved spatial layers of soil properties such as bulk density (Houle et al., 2017) and carbon fraction. The field and laboratory techniques used to calculate carbon emissions from burn depth also contain uncertainty, which is not always quantified. These errors are likely compounded when aggregating data across field campaigns, ecozones, and research groups, such as we did here. Nevertheless, burn depth is a critical fire severity property in its own right, with applications ranging from understanding the changing boreal carbon cycle (Walker et al., 2019) to post-fire succession and vegetation patterns (Baltzer et al., 2021; Johnstone et al., 2010). Our results suggest geospatial statistical modeling is well suited for capturing and extrapolating depth of burn in organic soils, at least within the ABoVE domain.
Finally, we assessed the influence of spatial and sensor differences when building the combustion and burn depth models at 30 m but predicting them at 500 m. Overall, biases introduced by model nonlinearities, sub-grid heterogeneity, and vegetation fractions were found to be negligible (slope = 0.98 for aboveground and 0.97 for belowground combustion when regressing 500 m against aggregated 30 m predictions). This suggests that approaches to map fire carbon emissions at large scales using 500 m MODIS imagery are not fundamentally biased because of spatial scale.
The machine learning models we employed allow insights into the drivers of both aboveground and belowground combustion. Partial dependence plots indicated that aboveground combustion tended to increase when tree cover and dNBR increased and when relative humidity and vegetation water content (NDII) decreased (Fig. S38). These patterns are consistent with understanding of fire behavior and aboveground consumption dynamics, which are generally driven by aboveground fuels and climate conditions that facilitate fuel drying and fire spread (Beck et al., 2011; Rogers et al., 2014; Walker et al., 2020b). Alternatively, belowground combustion increased with higher silt (and lower sand) content, higher tree cover, and lower relative humidity (Fig. S39). At moderate slopes (less than 20 %), at which the majority of field observations were located, belowground combustion was higher in flatter landscapes. These relationships are consistent with current understanding about the drivers of soil organic matter accumulation and vulnerability to combustion (Walker et al., 2018, 2020b; Scholten et al., 2021). Drivers of burn depth were similar to those for belowground combustion, with the exception of higher burn depth occurring in areas with lower extreme maximum temperatures and tasseled cap greenness (Fig. S40). The former is likely related to deeper burn depths occurring in the northern portions of the ABoVE domain (Fig. 5d), where long-term maximum temperatures are generally lower. Tasseled cap greenness was assessed after a given fire and can therefore be considered to be a metric of fire severity (low greenness = high severity).
Total emissions from ABoVE-FED are relatively consistent with past efforts, including AKFED and GFED4s, but with some important differences. Total emissions and mean combustion (Fig. S22) in Alaska were similar between ABoVE-FED and AKFED, which is expected given the similar field observations from Alaska used to develop these models. However, although AKFED was extended to the Yukon and Northwest Territories (Veraverbeke et al., 2017), it did not incorporate field observations from these regions. By utilizing 797 field plots across these provinces (albeit heavily dominated by the Northwest Territories), our results suggest AKFED tended to underestimate combustion in the Yukon and overestimate combustion in the Northwest Territories, especially during the large-fire year of 2014. ABoVE-FED also includes many more predictor variables than AKFED and is based on a different statistical model. We did not find large variations in mean combustion from year to year (Fig. 2), which is likely related to both the tendency of the random forest models to regress to the mean (Fig. S25) and relatively consistent observed mean combustion across large regions of the ABoVE domain (Walker et al., 2020a, c).
GFED4s is a widely used data source for global and regional burned area and fire emissions. Our results suggest GFED4s underestimates combustion across the ABoVE domain by roughly (32 %; Fig. S34; mean of 3.39 kg C m−2 in ABoVE-FED compared to 2.30 kg C m−2 in GFED4s), leading to 36 % lower total emissions compared to ABoVE-FED (Fig. S33). This is consistent with previous regional studies noting a consistent underestimation for GFED4s emissions in Alaska (Veraverbeke et al., 2015) and the Northwest Territories (Walker et al., 2018). This result has important implications for quantifying and understanding the role of arctic–boreal fires in the global carbon cycle and climate. Regional- to continental-scale upscaling efforts such as ABoVE-FED, including the underlying field observation database (Walker et al., 2020a), can help inform further versions of global fire models and thereby improve our quantification and understanding of the role of wildfire in the global carbon cycle.
In contrast to AKFED and GFED4s, fire carbon emissions in FireMIP were an order of magnitude lower (94 %) than ABoVE-FED (Fig. S23b). This is likely due to the fact that most models in FireMIP only combust aboveground vegetation, whereas combustion of belowground soil organic matter constitutes the majority of emissions in boreal Alaska and Canada. This underscores the importance of developing algorithms that accumulate and burn soil organic matter within global fire models, which is important for both direct fire emissions and post-fire permafrost thaw and degradation (Genet et al., 2013; Jafarov et al., 2013; Natali et al., 2021; Treharne et al., 2022).
ABoVE-FED confirms the high interannual variability in fire carbon emissions in the ABoVE domain, including the large-fire years of 2004 in Alaska and the Yukon Territory, 2005 in Alaska, 2010 in Saskatchewan, 2014 in the Northwest Territories, and 2015 in Alaska and Saskatchewan. We also found general agreement with previous work (Turetsky et al., 2011) that large-fire years and later-season fires facilitate deeper burning and higher belowground carbon emissions, including the phenomenon that burn timing has a stronger influence on severity in small-fire years (i.e., extreme fire years result in high severity regardless of timing). However, these relationships varied depending on region and analysis technique and were often confounded by site-level factors and fire weather at the time of burn. Overall, however, this underscores the influence that climate change (warming, drying, and longer fire seasons) has on boreal fire severity.
Consistent with previous studies (Rogers et al., 2014; Veraverbeke et al., 2015; Walker et al., 2018; Dieleman et al., 2020), ABoVE-FED includes high uncertainty in combustion at the pixel level (2.86 kg C m−2). Much of this uncertainty likely arises from difficulty in predicting large combustion values, particularly from belowground sources (Fig. S25b). This suggests ABoVE-FED is underpredicting emissions coming from the most severe fire events between 2001–2019. We attempted to correct for this bias in a number of ways, including testing a variety of models (Fig. 6), tuning model parameters, assigning higher weights to the highest combustion values, and applying the synthetic minority oversampling technique (SMOTE; Chawla et al., 2002) to synthetically create more samples with higher combustion values. Ultimately, none of these approaches were able to correct for the low bias at high combustion levels without sacrificing performance for low combustion values. More field observations of high combustion combined with improved predictor variables (particularly drainage) may improve future model performance. Also consistent with previous studies, these pixel-level uncertainties were dampened through spatial averaging, such that domain-wide mean combustion had comparatively lower uncertainty (3.13 ± 1.17 kg C m−2).
Here we used 30 m Landsat and 500 m MODIS imagery to map burned area across Alaska and Canada and map fire carbon emissions across the ABoVE domain over a 19-year period between 2001–2019. We utilized a recent field database of combustion observations across the ABoVE domain (Walker et al., 2020a), which represents the largest of its kind for any biome on Earth. We found burned area and total emissions are highly variable by year, averaging 2.37 Mha of burned area and 79.26 ± 28.65 Tg C emitted per year across the ABoVE domain (2.87 Mha of burned area across all of Alaska and Canada), with a mean combustion level of 3.13 ± 1.20 kg C m−2. When compared to previous products we report more burned area than GFED4s and the MODIS MC64A1 Collection 5 and 6 products. We report similar carbon emissions to AKFED, but more emissions than both GFED4s and FireMIP. ABoVE-FED can be used to understand patterns of fire behavior and effects across central and western boreal North America and to continue monitoring intensifying fire regimes in boreal forests.
The burned-area, combustion, and burned-depth databases associated with this publication can be found in Potter et al. (2022; https://doi.org/10.3334/ORNLDAAC/2063). Code is available upon request from the corresponding author.
The supplement related to this article is available online at: https://doi.org/10.5194/bg-20-2785-2023-supplement.
SP and BMR contributed to original draft writing. SV, XW, MCM, SJG, JB, LBC, NF, EEH, LJ, JFJ, ESK, SMN, JTR, MRT, and BMR contributed to conceptualization. SP, SC, SH, and BMR contributed to formal analysis. SV, XW, MCM, SJG, LBG, NF, SMN, JTR, MRT, and BMR contributed to funding acquisition. SP, SC, SV, XW, JTR, and BMR contributed to investigation. SP, SC, SV, XW, MCM, SJG, JTR, and BMR contributed to methodology. BMR was project administrator. EEH contributed project resources. SV, XW, MCM, SJG, SMN, JTR, and BMR contributed to project supervision. SP and SC contributed to data curation, validation and visualization, and software development. All authors contributed to the writing–review process.
The contact author has declared that none of the authors has any competing interests.
Publisher's note: Copernicus Publications remains neutral with regard to jurisdictional claims in published maps and institutional affiliations.
This article is part of the special issue “The role of fire in the Earth system: understanding interactions with the land, atmosphere, and society (ESD/ACP/BG/GMD/NHESS inter-journal SI)”. It is a result of the EGU General Assembly 2020, 4–8 May 2020.
Computing resources for this work were provided by the NASA High-End Computing Program through the NASA Center for Climate Simulation at Goddard Space Flight Center.
This work was funded by the National Aeronautics and Space Administration (NASA) Arctic–Boreal Vulnerability Experiment (ABoVE grants NNX15AU56A and NX15AT71A to Brendan M. Rogers and Michelle C. Mack and grants NNX15AT83A and 80NSSC19M0107 to Laura Bourgeau-Chavez, Nancy H. French, and Liza Jenkins), the Gordon and Betty Moore Foundation (grant no. 8414), the Woodwell Climate Research Center's Fund for Climate Solutions, and the Department of Defense (DoD) Strategic Environmental Research and Development Program (SERDP contract RC18-1183). Sander Veraverbeke was supported by the Dutch Research Council through Vidi grant 016.Vidi.189.070 and by the European Research Council under the European Union's Horizon 2020 research and innovation program (grant agreement no. 101000987). In-kind support was provided through Bonanza Creek LTER with funding from the National Science Foundation (DEB-1636476) and the USDA Forest Service, Pacific Northwest Research Station (RJVA-PNW-01-JV-11261952-231).
This paper was edited by Renata Libonati and reviewed by João Silva and three anonymous referees.
Amiro, B. D., Todd, J. B., Wotton, B. M., Logan, K. A., Flannigan, M. D., Stocks, B. J., Mason, J. A., Martell, D. L., and Hirsch, K. G.: Direct carbon emissions from Canadian forest fires, 1959–1999, Can. J. Forest Res., 31, 512–525, https://doi.org/10.1139/cjfr-31-3-512, 2001.
Balshi, M. S., Mcguire, A. D., Duffy, P., Flannigan, M., Kicklighter, D. W., and Melillo, J.: Vulnerability of carbon storage in North American boreal forests to wildfires during the 21st century, Glob. Change Biol., 15, 1491–1510, https://doi.org/10.1111/j.1365-2486.2009.01877.x, 2009.
Baltzer, J. L., Day, N. J., Walker, X. J., Greene, D., Mack, M. C., Alexander, H. D., Arseneault, D., Barnes, J., Bergeron, Y., Boucher, Y., Bourgeau-Chavez, L., Brown, C. D., Carrière, S., Howard, B. K., Gauthier, S., Parisien, M.-A., Reid, K. A., Rogers, B. M., Roland, C., Sirous, C., Stehn, S., Thompson, D. K., Turetsky, M. R., Veraverbeke, S., Whitman, E., Yang, J., and Johnstone, J. F.: Increasing fire and the decline of fire adapted black spruce in the boreal forest, P. Natl. Acad. Sci. USA, 118, e2024872118, https://doi.org/10.1073/pnas.2024872118, 2021.
Beaudoin, A., Bernier, P., Guindon, L., Villemaire, P., Guo, X. J., Stinson, G., Magnussen, S., and Hall, R. J.: Mapping attributes of Canada's forests at moderate resolution through kNN and MODIS imagery, Can. J. Forest Res., 44, 521–532, https://doi.org/10.1139/cjfr-2013-0401, 2014.
Beck, P. S. A., Goetz, S. J., Mack, M. C., Alexander, H. D., Jin, Y., Randerson, J. T., and Loranty, M. M.: The impacts and implications of an intensifying fire regime on Alaskan boreal forest composition and albedo, Glob. Change Biol., 17, 2853–2866, https://doi.org/10.1111/j.1365-2486.2011.02412.x, 2011.
Beven, K. J. and Kirkby, M. J.: A physically based, variable contributing area model of basin hydrology, Hydrol. Sci. B., 24, 43–69, https://doi.org/10.1080/02626667909491834, 1979.
Boby, L. A., Schuur, E. A. G., Mack, M. C., Verbyla, D., and Johnstone, J. F.: Quantifying fire severity, carbon, and nitrogen emissions in Alaska's boreal forest, Ecol. Appl., 20, 1633–1647, https://doi.org/10.1890/08-2295.1, 2010.
Bonan, G. B. and Shugart, H. H.: Environmental Factors and Ecological Processes in Boreal Forests, Annu. Rev. Ecol. Syst., 20, 1–28, 1989.
Bond-Lamberty, B., Peckham, S. D., Ahl, D. E., and Gower, S. T.: Fire as the dominant driver of central Canadian boreal forest carbon balance, Nature, 450, 89–92, https://doi.org/10.1038/nature06272, 2007.
Boulanger, Y., Parisien, M.-A., and Wang, X.: Model-specification uncertainty in future area burned by wildfires in Canada, Int. J. Wildland Fire, 27, 164–175, https://doi.org/10.1071/WF17123, 2018.
Breiman, L.: Random Forests, Mach. Learn., 45, 5–32, https://doi.org/10.1023/A:1010933404324, 2001.
Burns, P. J., Massey, R. M., Shean, D., Husby, E. B., and Goetz, S. G.: NASA ABoVE 10m Composite Digital Elevation Model, Arctic Data Center [data set], https://doi.org/10.18739/A2057CT8Q, 2023.
Chawla, N. V., Bowyer, K. W., Hall, L. O., and Kegelmeyer, W. P.: SMOTE: Synthetic Minority Over-sampling Technique, J. Artif. Intell. Res., 16, 321–357, https://doi.org/10.1613/jair.953, 2002.
Chen, D., Loboda, T. V., and Hall, J. V.: A systematic evaluation of influence of image selection process on remote sensing-based burn severity indices in North American boreal forest and tundra ecosystems, ISPRS J. Photogramm., 159, 63–77, https://doi.org/10.1016/j.isprsjprs.2019.11.011, 2020.
Chen, D., Fu, C., Hall, J. V., Hoy, E. E., and Loboda, T. V.: Spatio-temporal patterns of optimal Landsat data for burn severity index calculations: Implications for high northern latitudes wildfire research, Remote Sens. Environ., 258, 112393, https://doi.org/10.1016/j.rse.2021.112393, 2021.
Daly, C., Gibson, W., Taylor, G., Johnson, G., and Pasteris, P.: A knowledge-based approach to the statistical mapping of climate, Clim. Res., 22, 99–113, https://doi.org/10.3354/cr022099, 2002.
Daly, C., Halbleib, M., Smith, J. I., Gibson, W. P., Doggett, M. K., Taylor, G. H., Curtis, J., and Pasteris, P. P.: Physiographically sensitive mapping of climatological temperature and precipitation across the conterminous United States, Int. J. Climatol., 28, 2031–2064, https://doi.org/10.1002/joc.1688, 2008.
de Groot, W.J., Landry, R., Kurz, W. A., Anderson, K. R., Englefield, P., Fraser, R. H., Hall, R. J., Banfield, E., Raymond, D. A., Decker, V., Lynham, T. J., and Pritchard, J. M.: Estimating direct carbon emissions from Canadian wildland fires, Int. J. Wildland Fire, 16, 593–606, https://doi.org/10.1071/WF06150, 2007.
de Groot, W. J., Pritchard, J. M. P. M., and Lynham, T. J. L. J.: Forest floor fuel consumption and carbon emissions in Canadian boreal forest fires, Can. J. Forest Res., 39, 367–382, https://doi.org/10.1139/X08-192, 2009.
Di Giuseppe, F., Rémy, S., Pappenberger, F., and Wetterhall, F.: Using the Fire Weather Index (FWI) to improve the estimation of fire emissions from fire radiative power (FRP) observations, Atmos. Chem. Phys., 18, 5359–5370, https://doi.org/10.5194/acp-18-5359-2018, 2018.
Dieleman, C. M., Rogers, B. M., Potter, S., Veraverbeke, S., Johnstone, J. F., Laflamme, J., Solvik, K., Walker, X. J., Mack, M. C., and Turetsky, M. R.: Wildfire combustion and carbon stocks in the southern Canadian boreal forest: Implications for a warming world, Glob. Change Biol., 26, 6062–6079, https://doi.org/10.1111/gcb.15158, 2020.
Epp, H. and Lanoville, R.: Satellite data and geographic information systems for fire and resource management in the Canadian arctic, Geocarto Int., 11, 97–103, https://doi.org/10.1080/10106049609354537, 1996.
Fick, S. E. and Hijmans, R. J.: WorldClim 2: New 1-km spatial resolution climate surfaces for global land areas, Int. J. Climatol., 37, 4302–4315, https://doi.org/10.1002/joc.5086, 2017.
Field, R. D., Spessa, A. C., Aziz, N. A., Camia, A., Cantin, A., Carr, R., de Groot, W. J., Dowdy, A. J., Flannigan, M. D., Manomaiphiboon, K., Pappenberger, F., Tanpipat, V., and Wang, X.: Development of a Global Fire Weather Database, Nat. Hazards Earth Syst. Sci., 15, 1407–1423, https://doi.org/10.5194/nhess-15-1407-2015, 2015.
Foga, S., Scaramuzza, P. L., Guo, S., Zhu, Z., Dilley, R. D., Beckmann, T., Schmidt, G. L., Dwyer, J. L., Hughes, M. J., and Laue, B.: Cloud detection algorithm comparison and validation for operational Landsat data products, Remote Sens. Environ., 194, 379–390, https://doi.org/10.1016/j.rse.2017.03.026, 2017.
French, N. H. F.: Uncertainty in estimating carbon emissions from boreal forest fires, J. Geophys. Res., 109, D14S08, https://doi.org/10.1029/2003JD003635, 2004.
French, N. H. F., Kasischke, E. S., and Williams, D. G.: Variability in the emission of carbon-based trace gases from wildfire in the Alaskan boreal forest, J. Geophys. Res., 108, 8151, https://doi.org/10.1029/2001JD000480, 2002.
French, N. H. F., Groot, W. J. de, Jenkins, L. K., Rogers, B. M., Alvarado, E., Amiro, B., Jong, B. de, Goetz, S., Hoy, E., Hyer, E., Keane, R., Law, B. E., McKenzie, D., McNulty, S. G., Ottmar, R., Pérez-Salicrup, D. R., Randerson, J., Robertson, K. M., and Turetsky, M.: Model comparisons for estimating carbon emissions from North American wildland fire, J. Geophys. Res.-Biogeo., 116, G00K05, https://doi.org/10.1029/2010JG001469, 2011.
French, N. H. F., McKenzie, D., Erickson, T., Koziol, B., Billmire, M., Endsley, K. A., Yager Scheinerman, N. K., Jenkins, L., Miller, M. E., Ottmar, R., and Prichard, S.: Modeling Regional-Scale Wildland Fire Emissions with the Wildland Fire Emissions Information System, Earth Interact., 18, 1–26, https://doi.org/10.1175/EI-D-14-0002.1, 2014.
French, N. H. F., Jenkins, L. K., Loboda, T. V., Flannigan, M., Jandt, R., Bourgeau-Chavez, L. L., and Whitley, M.: Fire in arctic tundra of Alaska: Past fire activity, future fire potential, and significance for land management and ecology, Int. J. Wildland Fire, 24, 1045, https://doi.org/10.1071/WF14167, 2015.
Friedl, M. and Sulla-Menashe, D.: MCD12Q1 MODIS/Terra+Aqua Land Cover Type Yearly L3 Global 500 m SIN Grid V006, NASA EOSDIS Land Processes DAAC [data set], https://doi.org/10.5067/MODIS/MCD12Q1.006, 2019.
Genet, H., McGuire, A. D., Barrett, K., Breen, A., Euskirchen, E. S., Johnstone, J. F., Kasischke, E. S., Melvin, A. M., Bennett, A., Mack, M. C., Rupp, T. S., Schuur, A. E. G., Turetsky, M. R., and Yuan, F.: Modeling the effects of fire severity and climate warming on active layer thickness and soil carbon storage of black spruce forests across the landscape in interior Alaska, Environ. Res. Lett., 8, 045016, https://doi.org/10.1088/1748-9326/8/4/045016, 2013.
Giglio, L., Boschetti, L., Roy, D. P., Humber, M. L., and Justice, C. O.: The Collection 6 MODIS burned area mapping algorithm and product, Remote Sens. Environ., 217, 72–85, https://doi.org/10.1016/j.rse.2018.08.005, 2018.
Gorelick, N., Hancher, M., Dixon, M., Ilyushchenko, S., Thau, D., and Moore, R.: Google Earth Engine: Planetary-scale geospatial analysis for everyone, Remote Sens. Environ., 202, 18–27, https://doi.org/10.1016/j.rse.2017.06.031, 2017.
Gruber, S.: Derivation and analysis of a high-resolution estimate of global permafrost zonation, The Cryosphere, 6, 221–233, https://doi.org/10.5194/tc-6-221-2012, 2012.
Guindon, L., Bernier, P., Gauthier, S., Stinson, G., Villemaire, P., and Beaudoin, A.: Missing forest cover gains in boreal forests explained, Ecosphere, 9, e02094, https://doi.org/10.1002/ecs2.2094, 2018.
Guyon, I., Weston, J., Barnhill, S., and Vapnik, V.: Gene Selection for Cancer Classification Using Support Vector Machines, Mach. Learn., 46, 389–422, 2002.
Hall, R. J., Skakun, R. S., Metsaranta, J. M., Landry, R., Fraser, R. H., Raymond, D., Gartrell, M., Decker, V., Little, J., Hall, R. J., Skakun, R. S., Metsaranta, J. M., Landry, R., Fraser, R. H., Raymond, D., Gartrell, M., Decker, V., and Little, J.: Generating annual estimates of forest fire disturbance in Canada: The National Burned Area Composite, Int. J. Wildland Fire, 29, 878–891, https://doi.org/10.1071/WF19201, 2020.
Hanes, C. C., Wang, X., Jain, P., Parisien, M.-A., Little, J. M., and Flannigan, M. D.: Fire-regime changes in Canada over the last half century, Can. J. Forest Res., 49, 256–269, https://doi.org/10.1139/cjfr-2018-0293, 2018.
Hantson, S., Arneth, A., Harrison, S. P., Kelley, D. I., Prentice, I. C., Rabin, S. S., Archibald, S., Mouillot, F., Arnold, S. R., Artaxo, P., Bachelet, D., Ciais, P., Forrest, M., Friedlingstein, P., Hickler, T., Kaplan, J. O., Kloster, S., Knorr, W., Lasslop, G., Li, F., Mangeon, S., Melton, J. R., Meyn, A., Sitch, S., Spessa, A., van der Werf, G. R., Voulgarakis, A., and Yue, C.: The status and challenge of global fire modelling, Biogeosciences, 13, 3359–3375, https://doi.org/10.5194/bg-13-3359-2016, 2016.
Hardisky, M. A., Klemas, V., and Smart, R. M.: The influences of soil salinity, growth form, and leaf moisture on the spectral reflectance of Spartina alterniflora canopies, Photogramm. Eng. Rem. S., 49, 77–83, 1983.
Hengl, T., de Jesus, J. M., Heuvelink, G. B. M., Gonzalez, M. R., Kilibarda, M., Blagotić, A., Shangguan, W., Wright, M. N., Geng, X., Bauer-Marschallinger, B., Guevara, M. A., Vargas, R., MacMillan, R. A., Batjes, N. H., Leenaars, J. G. B., Ribeiro, E., Wheeler, I., Mantel, S., and Kempen, B.: SoilGrids250m: Global gridded soil information based on machine learning, PLOS ONE, 12, e0169748, https://doi.org/10.1371/journal.pone.0169748, 2017.
Hilker, T., Wulder, M. A., Coops, N. C., Linke, J., McDermid, G., Masek, J. G., Gao, F., and White, J. C.: A new data fusion model for high spatial- and temporal-resolution mapping of forest disturbance based on Landsat and MODIS, Remote Sens. Environ., 113, 1613–1627, https://doi.org/10.1016/j.rse.2009.03.007, 2009.
Hoy, E. E., Turetsky, M. R., and Kasischke, E.: More frequent burning increases vulnerability of Alaskan boreal black spruce forests, Environ. Res. Lett., 11, 095001, https://doi.org/10.1088/1748-9326/11/9/095001, 2016.
Hudak, A. T., Morgan, P., Bobbitt, M. J., Smith, A. M. S., Lewis, S. A., Lentile, L. B., Robichaud, P. R., Clark, J. T., and McKinley, R. A.: The Relationship of Multispectral Satellite Imagery to Immediate Fire Effects, Fire Ecol., 3, 64–90, https://doi.org/10.4996/fireecology.0301064, 2007.
Houle, G. P., Kane, E. S., Kasischke, E. S., Gibson, C., and Turetsky, M. R.: Recovery of Carbon Pools a Decade Following Wildfire in Black Spruce Forests of Interior Alaska: Effects of Soil Texture and Landscape Position, Can. J. Forest Res., 48, 1–10, https://doi.org/10.1139/cjfr-2017-0236, 2017.
Hutchinson, M. F.: A new objective method for spatial interpolation of meteorological variables from irregular networks applied to the estimation of monthly mean solar radiation, temperature, precip- itation and windrun, CSIRO Division of Water Resources Tech. Memo., 89, 95–104, 1989.
Ivanova, G. A., Conard, S. G., Kukavskaya, E. A., and McRae, D. J.: Fire impact on carbon storage in light conifer forests of the Lower Angara region, Siberia, Environ. Res. Lett., 6, 045203, https://doi.org/10.1088/1748-9326/6/4/045203, 2011.
Jafarov, E. E., Romanovsky, V. E., Genet, H., McGuire, A. D., and Marchenko, S. S.: The effects of fire on the thermal stability of permafrost in lowland and upland black spruce forests of interior Alaska in a changing climate, Environ. Res. Lett., 8, 035030, https://doi.org/10.1088/1748-9326/8/3/035030, 2013.
Jain, P., Coogan, S. C. P., Subramanian, S. G., Crowley, M., Taylor, S., and Flannigan, M. D.: A review of machine learning applications in wildfire science and management, Environ. Rev., 28, 478–505, https://doi.org/10.1139/er-2020-0019, 2020.
Johnstone, J. F., Chapin, F. S., Hollingsworth, T. N., Mack, M. C., Romanovsky, V., and Turetsky, M.: Fire, climate change, and forest resilience in interior AlaskaThis article is one of a selection of papers from The Dynamics of Change in Alaska's Boreal Forests: Resilience and Vulnerability in Response to Climate Warming, Can. J. Forest Res., 40, 1302–1312, https://doi.org/10.1139/X10-061, 2010.
Ju, J. and Masek, J. G.: The vegetation greenness trend in Canada and US Alaska from 1984–2012 Landsat data, Remote Sens. Environ., 176, 1–16, https://doi.org/10.1016/j.rse.2016.01.001, 2016.
Kasischke, E. S. and Hoy, E. E.: Controls on carbon consumption during Alaskan wildland fires, Glob. Change Biol., 18, 685–699, https://doi.org/10.1111/j.1365-2486.2011.02573.x, 2012.
Kasischke, E. S., Williams, D., and Barry, D.: Analysis of the patterns of large fires in the boreal forest region of Alaska, Int. J. Wildland Fire, 11, 131–144, https://doi.org/10.1071/wf02023, 2002.
Kasischke, E. S., Verbyla, D. L., Rupp, T. S., McGuire, A. D., Murphy, K. A., Jandt, R., Barnes, J. L., Hoy, E. E., Duffy, P. A., Calef, M., and Turetsky, M. R.: Alaska's changing fire regime – implications for the vulnerability of its boreal forestsThis article is one of a selection of papers from The Dynamics of Change in Alaska's Boreal Forests: Resilience and Vulnerability in Response to Climate Warming, Can. J. Forest Res., 40, 1313–1324, https://doi.org/10.1139/X10-098, 2010.
Kauth, R. J. and Thomas, G. S.: The Tasselled Cap – A Graphic Description of the Spectral-Temporal Development of Agricultural Crops as Seen by LANDSAT, LARS Symposia, paper 159, 1976.
Key, C. H. and Benson, N. C.: Landscape Assessment: Ground measure of severity, the Composite Burn Index; and Remote sensing of severity, the Normalized Burn Ratio (Report RMRS-GTR-164-CD: LA 1-51), USGS Publications Warehouse, http://pubs.er.usgs.gov/publication/2002085 (last access: 10 July 2023), 2006.
Knopp, L., Wieland, M., Rättich, M., and Martinis, S.: A Deep Learning Approach for Burned Area Segmentation with Sentinel-2 Data, Remote Sens., 12, 2422, https://doi.org/10.3390/rs12152422, 2020.
Latifovic, R., Homer, C., Ressl, R., Pouliot, D. A., Hossian, S., Colditz, R., Olthof, I., Chandra, G., and Victoria, A.: North American Land Change Monitoring System, in: Remote Sensing of Land Use and Land Cover: Principles and Applications, CRC Press, 303–324, https://doi.org/10.1201/b11964-24, 2012.
Li, F., Lawrence, D. M., and Bond-Lamberty, B.: Impact of fire on global land surface air temperature and energy budget for the 20th century due to changes within ecosystems, Environ. Res. Lett., 12, 044014, https://doi.org/10.1088/1748-9326/aa6685, 2017.
Loboda, T. V., Chen, D., Hall, J. V., and He, J.: ABoVE: Landsat-derived Burn Scar dNBR across Alaska and Canada, 1985–2015, ORNL DAAC, Oak Ridge, Tennessee, USA [data set], https://doi.org/10.3334/ORNLDAAC/1564, 2018.
Loboda, T. V., Hoy, E. E., and Carroll, M. L.: ABoVE: Study Domain and Standard Reference Grids, Version 2. ORNL DAAC, Oak Ridge, Tennessee, USA [data set], https://doi.org/10.3334/ORNLDAAC/1527, 2019.
McGuire, A. D., Anderson, L. G., Christensen, T. R., Dallimore, S., Guo, L., Hayes, D. J., Heimann, M., Lorenson, T. D., Macdonald, R. W., and Roulet, N.: Sensitivity of the Carbon Cycle in the Arctic to Climate Change, Ecol. Monogr., 79, 523–555, 2009.
Miller, J. D. and Thode, A. E.: Quantifying burn severity in a heterogeneous landscape with a relative version of the delta Normalized Burn Ratio (dNBR), Remote Sens. Environ., 109, 66–80, https://doi.org/10.1016/j.rse.2006.12.006, 2007.
Mitchell, T. D. and Jones, P. D.: An improved method of constructing a database of monthly climate observations and associated high-resolution grids, Int. J. Climatol., 25, 693–712, https://doi.org/10.1002/joc.1181, 2005.
Natali, S. M., Holdren, J. P., Rogers, B. M., Treharne, R., Duffy, P. B., Pomerance, R., and MacDonald, E.: Permafrost carbon feedbacks threaten global climate goals, P. Natl. Acad. Sci. USA, 118, e2100163118, https://doi.org/10.1073/pnas.2100163118, 2021.
Neigh, C. S. R., Masek, J. G., and Nickeson, J. E.: High-Resolution Satellite Data Open for Government Research, EOS T. Am. Geophys. Un., 94, 121–123, https://doi.org/10.1002/2013EO130002, 2013.
Ottmar, R. D., Sandberg, D. V., Riccardi, C. L., and Prichard, S. J.: An overview of the Fuel Characteristic Classification System – Quantifying, classifying, and creating fuelbeds for resource planning, Can. J. Forest Res., 37, 2383–2393, https://doi.org/10.1139/X07-077, 2007.
Parks, S., Dillon, G., and Miller, C.: A New Metric for Quantifying Burn Severity: The Relativized Burn Ratio, Remote Sens., 6, 1827–1844, https://doi.org/10.3390/rs6031827, 2014.
Pekel, J.-F., Cottam, A., Gorelick, N., and Belward, A. S.: High-resolution mapping of global surface water and its long-term changes, Nature, 540, 418–422, https://doi.org/10.1038/nature20584, 2016.
Porter, C., Morin, P., Howat, I., Noh, M., Bates, B., Peterman, K., Keesey, S., Schlenk, M., Gardiner, J., Tomko, K., Willis, M., Kelleher, C., Cloutier, M., Husby, E., Foga, S., Nakamura, H., Platson, M., Wethington, M., Williamson, C., Bauer, G., Enos, J., Arnold, G., Kramer, W., Becker, P., Doshi, A., D'Souza, C., Cummens, P., Laurier, F., and Bojesen, M.: ArcticDEM, V1, Harvard Dataverse [data set], https://doi.org/10.7910/DVN/OHHUKH, 2018.
Potter, S., Veraverbeke, S., Walker, X. J., Mack, M. C., Goetz, S. J., Baltzer, J. L., Dieleman, C., French, N. H. F., Kane, E. S., Turetsky, M. R., Wiggins, E. B., and Rogers, B. M.: ABoVE: Burned Area, Depth, and Combustion for Alaska and Canada, 2001–2019, ORNL DAAC, Oak Ridge, Tennessee, USA [data set], https://doi.org/10.3334/ORNLDAAC/2063, 2022.
Pouliot, D. and Latifovic, R.: Accuracy assessment of annual land cover time series derived from change-based updating, Banff, Canada, Institute of Electrical and Electronics Engineers [data set], https://doi.org/10.1109/Multi-Temp.2013.6866005, 2013.
Pouliot, D., Latifovic, R., Zabcic, N., Guindon, L., and Olthof, I.: Development and assessment of a 250 m spatial resolution MODIS annual land cover time series (2000–2011) for the forest region of Canada derived from change-based updating, Remote Sens. Environ., 140, 731–743, https://doi.org/10.1016/j.rse.2013.10.004, 2014.
Rabin, S. S., Melton, J. R., Lasslop, G., Bachelet, D., Forrest, M., Hantson, S., Kaplan, J. O., Li, F., Mangeon, S., Ward, D. S., Yue, C., Arora, V. K., Hickler, T., Kloster, S., Knorr, W., Nieradzik, L., Spessa, A., Folberth, G. A., Sheehan, T., Voulgarakis, A., Kelley, D. I., Prentice, I. C., Sitch, S., Harrison, S., and Arneth, A.: The Fire Modeling Intercomparison Project (FireMIP), phase 1: experimental and analytical protocols with detailed model descriptions, Geosci. Model Dev., 10, 1175–1197, https://doi.org/10.5194/gmd-10-1175-2017, 2017.
Randerson, J. T., Chen, Y., Werf, G. R. van der, Rogers, B. M., and Morton, D. C.: Global burned area and biomass burning emissions from small fires, J. Geophys. Res.-Biogeo., 117, G04012, https://doi.org/10.1029/2012JG002128, 2012.
Raynolds, M. K., Walker, D. A., Balser, A., Bay, C., Campbell, M., Cherosov, M. M., Daniëls, F. J. A., Eidesen, P. B., Ermokhina, K. A., Frost, G. V., Jedrzejek, B., Jorgenson, M. T., Kennedy, B. E., Kholod, S. S., Lavrinenko, I. A., Lavrinenko, O. V., Magnússon, B., Matveyeva, N. V., Metúsalemsson, S., Nilsen, L., and Troeva, E.: A raster version of the Circumpolar Arctic Vegetation Map (CAVM), Remote Sens. Environ., 232, 111297, https://doi.org/10.1016/j.rse.2019.111297, 2019.
R Core Team: R: A language and environment for statistical computing, R Foundation for Statistical Computing, Vienna, Austria, https://www.R-project.org/ (last access: 1 April 2023), 2021.
Rogers, B. M., Veraverbeke, S., Azzari, G., Czimczik, C. I., Holden, S. R., Mouteva, G. O., Sedano, F., Treseder, K. K., and Randerson, J. T.: Quantifying fire-wide carbon emissions in interior Alaska using field measurements and Landsat imagery, J. Geophys. Res.-Biogeo., 119, 1608–1629, https://doi.org/10.1002/2014JG002657, 2014.
Rogers, B. M., Soja, A. J., Goulden, M. L., and Randerson, J. T.: Influence of tree species on continental differences in boreal fires and climate feedbacks, Nat. Geosci., 8, 228–234, https://doi.org/10.1038/ngeo2352, 2015.
Roy, D. P., Kovalskyy, V., Zhang, H. K., Vermote, E. F., Yan, L., Kumar, S. S., and Egorov, A.: Characterization of Landsat-7 to Landsat-8 reflective wavelength and normalized difference vegetation index continuity, Remote Sens. Environ., 185, 57–70, https://doi.org/10.1016/j.rse.2015.12.024, 2016.
Scholten, R. C., Jandt, R., Miller, E. A., Rogers, B. M., and Veraverbeke, S.: Overwintering fires in boreal forests, Nature, 593, 399–404, https://doi.org/10.1038/s41586-021-03437-y, 2021.
Schmidt, G., Jenkerson, C. B., Masek, J., Vermote, E., and Gao, F.: Landsat ecosystem disturbance adaptive processing system (LEDAPS) algorithm description (Report No. 2013–1057; Open-File Report, p. 27), USGS Publications Warehouse, https://doi.org/10.3133/ofr20131057, 2013.
Seiler, W. and Crutzen, P. J.: Estimates of gross and net fluxes of carbon between the biosphere and the atmosphere from biomass burning, Climatic Change, 2, 207–247, https://doi.org/10.1007/BF00137988, 1980.
Sexton, J. O., Song, X.-P., Feng, M., Noojipady, P., Anand, A., Huang, C., Kim, D.-H., Collins, K. M., Channan, S., DiMiceli, C., and Townshend, J. R.: Global, 30-m resolution continuous fields of tree cover: Landsat-based rescaling of MODIS vegetation continuous fields with lidar-based estimates of error, Int. J. Digit. Earth, 6, 427–448, https://doi.org/10.1080/17538947.2013.786146, 2013.
Skakun, R., Whitman, E., Little, J. M., and Parisien, M.-A.: Area burned adjustments to historical wildland fires in Canada, Environ. Res. Lett., 16, 064014, https://doi.org/10.1088/1748-9326/abfb2c, 2021.
Stocks, B. J., Mason, J. A., Todd, J. B., Bosch, E. M., Wotton, B. M., Amiro, B. D., Flannigan, M. D., Hirsch, K. G., Logan, K. A., Martell, D. L., and Skinner, W. R.: Large forest fires in Canada, 1959–1997, J. Geophys. Res.-Atmos., 107, FFR 5-1–FFR 5-12, https://doi.org/10.1029/2001JD000484, 2003.
Tan, Z., Tieszen, L. L., Zhu, Z., Liu, S., and Howard, S. M.: An estimate of carbon emissions from 2004 wildfires across Alaskan Yukon River Basin, Carbon Balance and Management, 2, 12, https://doi.org/10.1186/1750-0680-2-12, 2007.
Tucker, C. J.: Red and photographic infrared linear combinations for monitoring vegetation, Remote Sens. Environ., 8, 127–150, https://doi.org/10.1016/0034-4257(79)90013-0, 1979.
Turetsky, M. R., Kane, E. S., Harden, J. W., Ottmar, R. D., Manies, K. L., Hoy, E., and Kasischke, E. S.: Recent acceleration of biomass burning and carbon losses in Alaskan forests and peatlands, Nat. Geosci., 4, 27–31, https://doi.org/10.1038/ngeo1027, 2011.
Treharne, R., Rogers, B. M., Gasser, T., MacDonald, E., and Natali, S.: Identifying Barriers to Estimating Carbon Release From Interacting Feedbacks in a Warming Arctic, Front. Climate, 3, 716464, https://doi.org/10.3389/fclim.2021.716464, 2022.
van der Werf, G. R., Randerson, J. T., Giglio, L., van Leeuwen, T. T., Chen, Y., Rogers, B. M., Mu, M., van Marle, M. J. E., Morton, D. C., Collatz, G. J., Yokelson, R. J., and Kasibhatla, P. S.: Global fire emissions estimates during 1997–2016, Earth Syst. Sci. Data, 9, 697–720, https://doi.org/10.5194/essd-9-697-2017, 2017.
van Wees, D., van der Werf, G. R., Randerson, J. T., Rogers, B. M., Chen, Y., Veraverbeke, S., Giglio, L., and Morton, D. C.: Global biomass burning fuel consumption and emissions at 500 m spatial resolution based on the Global Fire Emissions Database (GFED), Geosci. Model Dev., 15, 8411–8437, https://doi.org/10.5194/gmd-15-8411-2022, 2022.
Veraverbeke, S., Rogers, B. M., and Randerson, J. T.: Daily burned area and carbon emissions from boreal fires in Alaska, Biogeosciences, 12, 3579–3601, https://doi.org/10.5194/bg-12-3579-2015, 2015.
Veraverbeke, S., Rogers, B. M., Goulden, M. L., Jandt, R. R., Miller, C. E., Wiggins, E. B., and Randerson, J. T.: Lightning as a major driver of recent large fire years in North American boreal forests, Nat. Clim. Change, 7, 529–534, https://doi.org/10.1038/nclimate3329, 2017.
Vermote, E. and Wolfe, R.: MOD09GA MODIS/Terra Surface Reflectance Daily L2G Global 1 km and 500 m SIN Grid V006, NASA EOSDIS Land Processes DAAC [data set], https://doi.org/10.5067/MODIS/MYD09GA.006, 2015a.
Vermote, E. and Wolfe, R.: MOD09GA MODIS/Terra Surface Reflectance Daily L2G Global 1 km and 500 m SIN Grid V006, NASA EOSDIS Land Processes DAAC [data set], https://doi.org/10.5067/MODIS/MOD09GA.006, 2015b.
Vermote, E., Justice, C., Claverie, M., and Franch, B.: Preliminary analysis of the performance of the Landsat 8/OLI land surface reflectance product, Remote Sens. Environ., 185, 46–56, https://doi.org/10.1016/j.rse.2016.04.008, 2016.
Walker, X. J., Rogers, B. M., Baltzer, J. L., Cumming, S. G., Day, N. J., Goetz, S. J., Johnstone, J. F., Schuur, E. A. G., Turetsky, M. R., and Mack, M. C.: Cross-scale controls on carbon emissions from boreal forest megafires, Glob. Change Biol., 24, 4251–4265, https://doi.org/10.1111/gcb.14287, 2018.
Walker, X. J., Baltzer, J. L., Cumming, S. G., Day, N. J., Ebert, C., Goetz, S., Johnstone, J. F., Potter, S., Rogers, B. M., Schuur, E. A. G., Turetsky, M. R., and Mack, M. C.: Increasing wildfires threaten historic carbon sink of boreal forest soils, Nature, 572, 520–523, https://doi.org/10.1038/s41586-019-1474-y, 2019.
Walker, X. J., Baltzer, J. L., Bourgeau-Chavez, L. L., Day, N. J., de Groot, W. J., Dieleman, C., Hoy, E. E., Johnstone, J. F., Kane, E. S., Parisien, M. A., Potter, S., Rogers, B. M., Turetsky, M. R., Veraverbeke, S. R., Whitman, E. and Mack, M. C.: ABoVE: Synthesis of Burned and Unburned Forest Site Data, AK and Canada, 1983–2016, ORNL DAAC, Oak Ridge, Tennessee, USA [data set], https://doi.org/10.3334/ORNLDAAC/1744, 2020a.
Walker, X. J., Rogers, B. M., Veraverbeke, S., Johnstone, J. F., Baltzer, J. L., Barrett, K., Bourgeau-Chavez, L., Day, N. J., de Groot, W. J., Dieleman, C. M., Goetz, S., Hoy, E., Jenkins, L. K., Kane, E. S., Parisien, M.-A., Potter, S., Schuur, E. A. G., Turetsky, M., Whitman, E., and Mack, M. C.: Fuel availability not fire weather controls boreal wildfire severity and carbon emissions, Nat. Clim. Change, 10, 1130–1136, https://doi.org/10.1038/s41558-020-00920-8, 2020b.
Walker, X. J., Baltzer, J. L., Bourgeau-Chavez, L., Day, N. J., Dieleman, C. M., Johnstone, J. F., Kane, E. S., Rogers, B. M., Turetsky, M. R., Veraverbeke, S., and Mack, M. C.: Patterns of Ecosystem Structure and Wildfire Carbon Combustion Across Six Ecoregions of the North American Boreal Forest, Frontiers in Forests and Global Change, 3, 87, https://doi.org/10.3389/ffgc.2020.00087, 2020c.
Wang, J. A., Baccini, A., Farina, M., Randerson, J. T., and Friedl, M. A.: Disturbance suppresses the aboveground carbon sink in North American boreal forests, Nat. Clim. Change, 11, 435–441, 2021.
Wang, T., Hamann, A., Spittlehouse, D., and Carroll, C.: Locally Downscaled and Spatially Customizable Climate Data for Historical and Future Periods for North America, PLOS ONE, 11, e0156720, https://doi.org/10.1371/journal.pone.0156720, 2016.
Wiedinmyer, C., Akagi, S. K., Yokelson, R. J., Emmons, L. K., Al-Saadi, J. A., Orlando, J. J., and Soja, A. J.: The Fire INventory from NCAR (FINN): a high resolution global model to estimate the emissions from open burning, Geosci. Model Dev., 4, 625–641, https://doi.org/10.5194/gmd-4-625-2011, 2011.
Wright, M. and Ziegler, A.: ranger: A Fast Implementation of Random Forests for High Dimensional Data in C and R, J. Stat. Softw., 77, 1–17, https://doi.org/10.18637/jss.v077.i01, 2017
Wolfe, J. A.: Temperature parameters of humid to mesic forests of Eastern Asia and relation to forests of other regions of the Northern Hemisphere and Australasia: analysis of temperature data from more than 400 stations in Eastern Asia (U.S. Geological Survey Professional Paper No. 1106), Washington, DC, US Dep. Int., https://doi.org/10.3133/pp1106, 1979.
Young, A. M., Higuera, P. E., Duffy, P. A., and Hu, F. S.: Climatic thresholds shape northern high-latitude fire regimes and imply vulnerability to future climate change, Ecography, 40, 606–617, https://doi.org/10.1111/ecog.02205, 2017.
Zhao, B., Zhuang, Q., Shurpali, N., Köster, K., Berninger, F., and Pumpanen, J.: North American boreal forests are a large carbon source due to wildfires from 1986 to 2016, Sci. Rep., 11, 7723, https://doi.org/10.1038/s41598-021-87343-3, 2021.