the Creative Commons Attribution 4.0 License.
the Creative Commons Attribution 4.0 License.
 | 03 Aug 2023
Properties of exopolymeric substances (EPSs) produced during cyanobacterial growth: potential role in whiting events
Marlisa Martinho de Brito
Irina Bundeleva
Frédéric Marin
Emmanuelle Vennin
Annick Wilmotte
Laurent Plasseraud
Pieter T. Visscher
Extracellular polymeric substances (EPSs) are an important organic carbon reservoir in many pelagic and benthic environments. The production of EPS is intimately associated with the growth of phyto- and picoplankton. EPS plays a critical role in carbonate precipitation through the binding of cations and by acting as a nucleation site for minerals. Large-scale episodes of fine-grained calcium carbonate precipitation in the water column (whiting events) have been linked to cyanobacterial blooms, including of Synechococcus spp. The mechanisms that trigger these precipitation events are still debated. We pose that the cyanobacterial EPS, produced during exponential and stationary growth phases, plays a critical role in the formation of whitings. The aim of this study was to investigate the production of EPS during a 2-month cyanobacterial growth, mimicking a bloom. The production and characteristics of EPS were examined in different growth stages of Synechococcus spp. using various techniques such as Fourier transform infrared (FT-IR) spectroscopy as well as colorimetric and sodium dodecyl sulfate–polyacrylamide gel electrophoresis (SDS–PAGE) assays. We further evaluated the potential role of EPS in carbonate precipitation through in vitro-forced precipitation experiments. EPS produced during the early and late stationary phase contained a larger amount of negatively charged groups than present in EPS produced during the exponential phase. Consequently, a higher Ca2+-binding affinity of the stationary-phase EPS led to the formation of a larger amount of smaller carbonate minerals (< 50 µm) compared to crystals formed in exponential-phase EPS, which were less abundant and larger (> 50 µm). These findings were used to establish a conceptual model for picoplankton-bloom-mediated CaCO3 precipitation that can explain the role of EPS in whitings.
- Article
(4457 KB) - Full-text XML
-
Supplement
(840 KB) - BibTeX
- EndNote


1.1 Significance of this study
Massive carbonate precipitation episodes in the water column, also referred to as “whiting events”, are a well-known phenomenon of modern freshwater (Schultze-Lam et al., 1997; Hodell et al., 1998; Stanton et al., 2023) and marine environment (Shinn et al., 1989; Robbins and Blackwelder, 1992; Larson and Mylroie, 2014). Whitings are caused by large-scale precipitation of micrometre-sized calcium carbonate particles (visible from space) and represent a major sink in the carbon cycle. The particles associated with whitings can make up a major sedimentary constituent of the modern-day and ancient carbonate rock records (Pomar and Hallock, 2008). Whiting events can be triggered by a combination of biological and physicochemical processes. Among the biological mechanisms that have been studied in this context, picocyanobacterial proliferations have often been invoked in the initiation of whitings (Hodell et al., 1998; Thompson, 2000; Obst et al., 2009). Photosynthesis increases pH levels and alkalinity during cyanobacterial blooms, ultimately causing the saturation state of calcium carbonate to rise, thereby leading to its potential precipitation. The role of Synechococcus spp. bloom-forming cyanobacteria in CaCO3 precipitation has been demonstrated in laboratory experiments (Yates and Robbins, 1998; Dittrich et al., 2003; Obst et al., 2009; Bundeleva et al., 2014; Martinho de Brito et al., 2022) and observed in field investigations (Wells and Iling, 1964; Thompson et al., 1990; Dittrich and Obst., 2004). Change in temperature, salinity and CO2 pressure as well as turbulence are some of the physicochemical factors that can lead to the formation of supersaturated solutions and subsequent precipitation of CaCO3, thus initiating the whiting. Even though several possible biogenic and abiotic mechanisms have been identified, the formation of whitings is still poorly understood.
1.2 Overview of phytoplankton blooms
Phytoplankton blooms, including those of picoplankton, are dense accumulations of cells resulting in a visible discolouration of the surface water layers (Reynolds and Walsby, 1975; Huisman et al., 2018). Their occurrence has been recorded worldwide in marine and freshwater bodies (Paerl et al., 2001; Paerl and Huisman, 2008; Ploug, 2008). Light intensity, water temperature, nutrient availability, weather conditions and hydrodynamics are key factors that determine the onset and persistence of a bloom. Blooms are typically seasonal, frequently observed during late spring or summer, and can be dominated by picoplankton (Huisman et al., 2018). Some phytoplankton organisms, notably cyanobacteria, may produce toxins and form large-scale harmful algal blooms (Paerl et al., 2001). The intensity and frequency of cyanobacterial blooms have been increasing due to anthropogenic eutrophication (Heisler et al., 2008; O'Neil et al., 2012), a trend expected to exacerbate due to climate change (Lürling et al., 2018). Cyanobacteria comprise a diverse group of photoautotrophic organisms that play a pivotal role in global primary production and are key players in the biogeochemical cycles of carbon, nitrogen and oxygen (Callieri and Stockner, 2000; Raven et al., 2017). The unicellular cyanobacterium Synechococcus is one of the most abundant photosynthetic microorganisms on Earth (Whitton and Potts, 2012), which contributes substantially to the picoplankton community in marine (Murphy and Haugen, 1985; Coello-Camba and Agustí, 2021) and freshwater environments (Weisse, 1993), and can form dense blooms (Schultze-Lam et al., 1992; Phlips et al., 1999; Dittrich and Obst, 2004).
1.3 Phytoplankton blooms and CaCO3 precipitation
During the occurrence of dense phytoplankton blooms, high rates of photosynthetic activity lead to a rapid depletion in CO2 in the surface waters, increasing alkalinity. Depending on the buffering capacity of the water, this could result in pH values ≥ 9 to as high as 11 (Ibelings and Maberly, 1998; Zepernick et al., 2021). Consequently, the inorganic carbonate equilibrium shifts towards carbonate (). Some cyanobacteria possess a carbon concentrating mechanism (CCM) that converts to CO2 through the action of carbonic anhydrase enzymes (Price et al., 1998; Badger et al., 2002) and produce hydroxide ions (Kupriyanova and Pronina, 2011). The activity of extracellular carbonic anhydrase (eCA) may contribute to the creation of an alkaline microenvironment in the extracellular polymeric substances (EPSs) surrounding the cyanobacterial cells (Price et al., 2002; Dupraz et al., 2009). When OH− ions are released during photosynthesis it causes the pH to rise, which favours carbonate mineral precipitation, assuming there are enough calcium ions available (Kamennaya et al., 2012). Consequently, during blooms, carbonate minerals can form on EPS or be precipitated in the microenvironment surrounding cyanobacterial cells.
1.4 The role of EPS
Cyanobacteria are known producers of EPS, especially during blooms (Pannard et al., 2016; Liu et al., 2018). EPSs serve as a boundary between cells and their immediate environment (Whitton and Potts, 2012) and may act as a template for CaCO3 nucleation (Dupraz and Visscher, 2005; Dupraz et al., 2009; Kamennaya et al., 2012). EPSs are high-molecular-weight organic molecules composed of polysaccharides, proteins, nucleic acids and lipids (Pereira et al., 2009; Marvasi et al., 2010; Decho and Gutierrez, 2017). This complex mixture of molecules may contain specific monomer components, such as uronic or sialic acids (monosaccharides), aspartic or glutamic acids (amino acids), or functions (sulfate, phosphate), which carry negative charges in physiological conditions and can therefore bind cations, such as Ca2+, and promote the nucleation of CaCO3 crystals (Trichet and Defarge, 1995; Dupraz et al., 2009; Walker et al., 2019). Conversely, polyanionic EPS in solution can inhibit crystal growth by poisoning the faces of growing nuclei by an adsorption mechanism, according to a classical and accepted view prevailing for other macromolecules of similar charge properties: synthetic peptides (Wheeler et al., 1981), skeletal proteins (Wheeler et al., 1981; Addadi and Weiner, 1985), coccolith-associated polysaccharides (Borman et al., 1982) or natural organic matter dissolved in seawater (Mitterer and Cunningham, 1985). The production and composition of EPS differ among different species of microorganisms and their type of metabolism and depend on the environment in which they live, stressors (e.g. nutrient availability, pH, temperature, light, salinity) and the stage of their growth (Pereira et al., 2009; Pannard et al., 2016; Martinho de Brito et al., 2022). The deprotonation of functional groups at elevated pH enhances the binding capacity of cations such as Ca2+ and controls crystal nucleation and growth by reducing the interfacial energy barrier between the crystal and the EPS substrate (Dupraz et al., 2009; Dittrich and Sibler, 2010). EPSs play a twofold role in carbonate formation by initially inhibiting (through Ca2+ binding) and subsequently promoting carbonate precipitation by releasing calcium ions during EPS alteration and degradation (Dupraz and Visscher, 2005). Furthermore, through specific functional group composition and structural architecture, EPS may also exert control over the mineralogy, morphology and/or abundance of the minerals that are formed (Trichet and Defarge, 1995; Dupraz et al., 2009).
1.5 The goal of this study
We have previously reported that the pH of Synechococcus cultures increased when grown in a non-buffered medium (Martinho de Brito et al., 2022). In these growth conditions, the production of EPS was enhanced compared to growth in a buffered medium. Furthermore, the EPS from cells grown in non-buffered conditions contained more negatively charged functional groups that impacted the properties of the carbonate minerals that precipitated. The current study further investigates the properties of EPS produced during different growth phases of Synechococcus spp. over an extended incubation time (mimicking a prolonged natural bloom). We aim to better understand the role of cyanobacterial blooms in carbonate precipitation through EPS production and develop a conceptual model of picoplankton-mediated organomineralization to explain the biological origin of whiting events.
2.1 Synechococcus PCC7942 strain and culture growth conditions
Synechococcus PCC7942 was obtained from the Centre de Ressources Biologiques de l'Institut Pasteur (Paris). Cultures were grown in a one-third-strength non-buffered liquid BG-11 medium (Allen, 1968; Rippka et al., 1979). The medium consists of (per litre) 1.5 g NaNO3, 0.04 g K2HPO42H2O, 0.075 g MgSO47H2O, 0.036 g CaCl22H2O, 6 mg citric acid combined with 6 mg ferric citrate, 0.001 g Na2EDTA2H2O and 0.02 g Na2CO3. Trace metal solutions contained (per litre) 2.86 mg H3BO3, 1.81 mg MnCl24H2O, 0.222 mg ZnSO47H2O, 0.39 mg Na2MoO42H2O, 0.079 mg CuSO45H2O and 0.0494 mg Co(NO3)26H2O. Cultures were incubated at room temperature (21 ∘C ± 2), with a cycle of 12 h of light and 12 h of darkness under 36.8 photon irradiance while shaken at 200 rpm with the Cimarec i multipoint stirrer (6 position, 2000 rpm, 3 L per multipoint, 100–240 VAC rotary shaker).
2.2 Experimental design of Synechococcus-bloom formation
Two independent growth experiments were performed in 1 L glass serum bottles containing 800 mL BG-11 medium adjusted to pH 7.5, sealed with silicone caps to allow gas exchange. Cells used for the inoculum (pH = 9.2) were pre-cultured in a full-strength BG-11. Immediately after inoculation (30 mL per bottle), the pH increased to approximately 8.2.
2.2.1 Experiment I
In the first growth experiment, six bottles were inoculated with Synechococcus PCC7942. Cell growth and EPS production were examined. Optical density (OD750 nm), pH and cell counts were monitored weekly (2–3 times per week). EPS was extracted on days 14, 28 and 56 of cultivation (two bottles were harvested at each sampling time).
2.2.2 Experiment II
The second growth experiment was performed in quadruplicate. Chlorophyll a (Chl a), extracellular carbonic anhydrase activity (eCA), nutrients ( and ) and calcium concentration were analysed at 0, 14, 28 and 56 d of cultivation. pH values, OD and cell counts were also assessed at longer intervals (once per week) than in Experiment I.
2.3 Growth assessment
2.3.1 pH values, optical density (OD) and cell counts
The pH value was measured about 3–4 h after the light cycle started with a CRISON GLP 21 pH meter (Crison Instruments SA, Alella, Spain). Cell growth was monitored through cell counts and OD750 measurements. Cell counts were performed using a counting chamber (Neubauer, Mariangela, Germany) by randomly selecting five fields of view and counting approximately 100–200 cells. The OD at 750 nm of a 1 mL sample of the culture was measured with the Bio-Rad SmartSpec Plus spectrophotometer (Bio-Rad, Hercules, CA, USA).
2.3.2 Chlorophyll a extraction
Chl a was extracted from 2 mL culture aliquots using a methanol extraction method (Stal et al., 1984). Following the extraction in the dark at 4 ∘C, samples were centrifuged. The Chl a absorbance was measured in the supernatant at 665 nm using the Bio-Rad SmartSpec Plus spectrophotometer (Bio-Rad, Hercules, CA, USA).
2.3.3 Extracellular carbonic anhydrase activity
The extracellular carbonic anhydrase (eCA) activity was measured using the BioVision Carbonic Anhydrase Activity Assay Kit (BioVision, ref. K472-100, Abcam, Waltham, MA, USA) according to the manufacturer's specifications. Aliquots of ∼ 5 mL were analysed immediately after the collection. To avoid cell lysis and intracellular CA contamination, samples were not centrifuged. The cells were separated from the supernatant by using a 1 mL syringe and a 0.20 µm NALGENE® syringe filter. The absorbance was measured with the Bio-Rad Model 680 microplate reader at 405 nm.
2.3.4 Nitrogen, phosphorus and calcium measurements
Phosphate, nitrate and calcium concentrations were determined in the growth medium at 0, 14, 28 and 56 d of cultivation. Cells were removed by centrifugation and filtration through a 0.20 µm Millipore filter under a mild vacuum. The samples were stored at 4 ∘C in the dark until measured by ion chromatography. Analyses were realized within the PEA2t technical platform of the Chrono-Environment Laboratory UMR6249 (Université de Franche-Comté, Besançon, France), and the Ca2+ concentration was determined by ICP-AES (dual axial and radial view iCAP Pro XP model with a fast loop, Thermo Fisher Scientific, Courtaboeuf, France) available at the University of Franche-Comté, Besançon, France.
2.4 EPS extraction and purification
EPSs were extracted from the Synechococcus cultures as previously described by Martinho de Brito et al. (2022). EPSs were harvested after 14, 28 and 56 d of cultivation. Cyanobacterial cells were inspected by microscopy to ensure that no cell lysis had occurred during the extraction process. The pure EPS fractions were obtained by ultrafiltration (retentate > 10 kDa) to reduce volume. The weight of the material was determined after dialysis (using a 1 kDa membrane) and lyophilization; the measurement was carried out on a high-precision analytical balance (Quintix 35-1S, Sartorius, Göttingen, Germany).
2.5 EPS characterization
2.5.1 Fourier transform infrared spectroscopy
FT-IR spectra were obtained from freeze-dried EPS on an FT-IR Bruker ALPHA spectrometer (Bruker Optics SARL, Marne la Vallée, France) fitted with an attenuated total reflectance (ATR) ALPHA-P device equipped with a mono-reflection diamond crystal. A total of 24 scans were performed on each sample at a spectral resolution of 4 cm−1 in the 4000–375 cm−1 wavenumber range. The qualitative assignment of absorption bands was performed by comparison with spectra available in the literature (Coates, 2000).
2.5.2 Protein, sugar and glycosaminoglycan (quantification)
The total protein content of EPS was determined using the Bicinchoninic acid assay (Pierce® BCA Protein Assay Kit) and bovine serum albumin as the standard. The total sugar content was determined by a modified phenol–sulfuric acid method (Dubois et al., 1956), and xanthan and dextran were used as standards (Sigma-Aldrich, St. Louis, MO, USA). The total glycosaminoglycan (GAG) content was quantified using the Blyscan assay according to the manufacturer's protocol (Blyscan Kit B1000, Biocolor Ltd., Antrim, UK) with chondroitin sulfate as the standard. All assays were carried out in duplicated EPS samples.
2.5.3 Visualization of polyanionic macromolecules on Alcian Blue-stained gels
Sodium dodecyl sulfate–polyacrylamide gel electrophoresis (SDS–PAGE) followed by Alcian Blue staining (Wall and Gyi, 1988) were used to separate and stain negatively charged macromolecules (10 to > 170 kDa), respectively. Alcian Blue is a dye that specifically binds to glycoconjugates with an acidic character (e.g. containing carboxylated or sulfated functional groups). Samples were analysed on one-dimensional precast gradient protein gels (TGX Gel 4 %–15 %, 90 mm × 70 mm) on a Mini-PROTEAN 3 cell (Bio-Rad, Hercules, CA, USA), according to the method previously described by Martinho de Brito et al. (2022). Prior to migration, samples were heat-denatured in a standard 2× Laemmli sample buffer (5 min, 99 ∘C, ref. 1610737, Bio-Rad). A pre-stained protein ladder (Euromedex, ref. 06P-0111; MW: 10 kDa to > 170 kDa) was used as a reference.
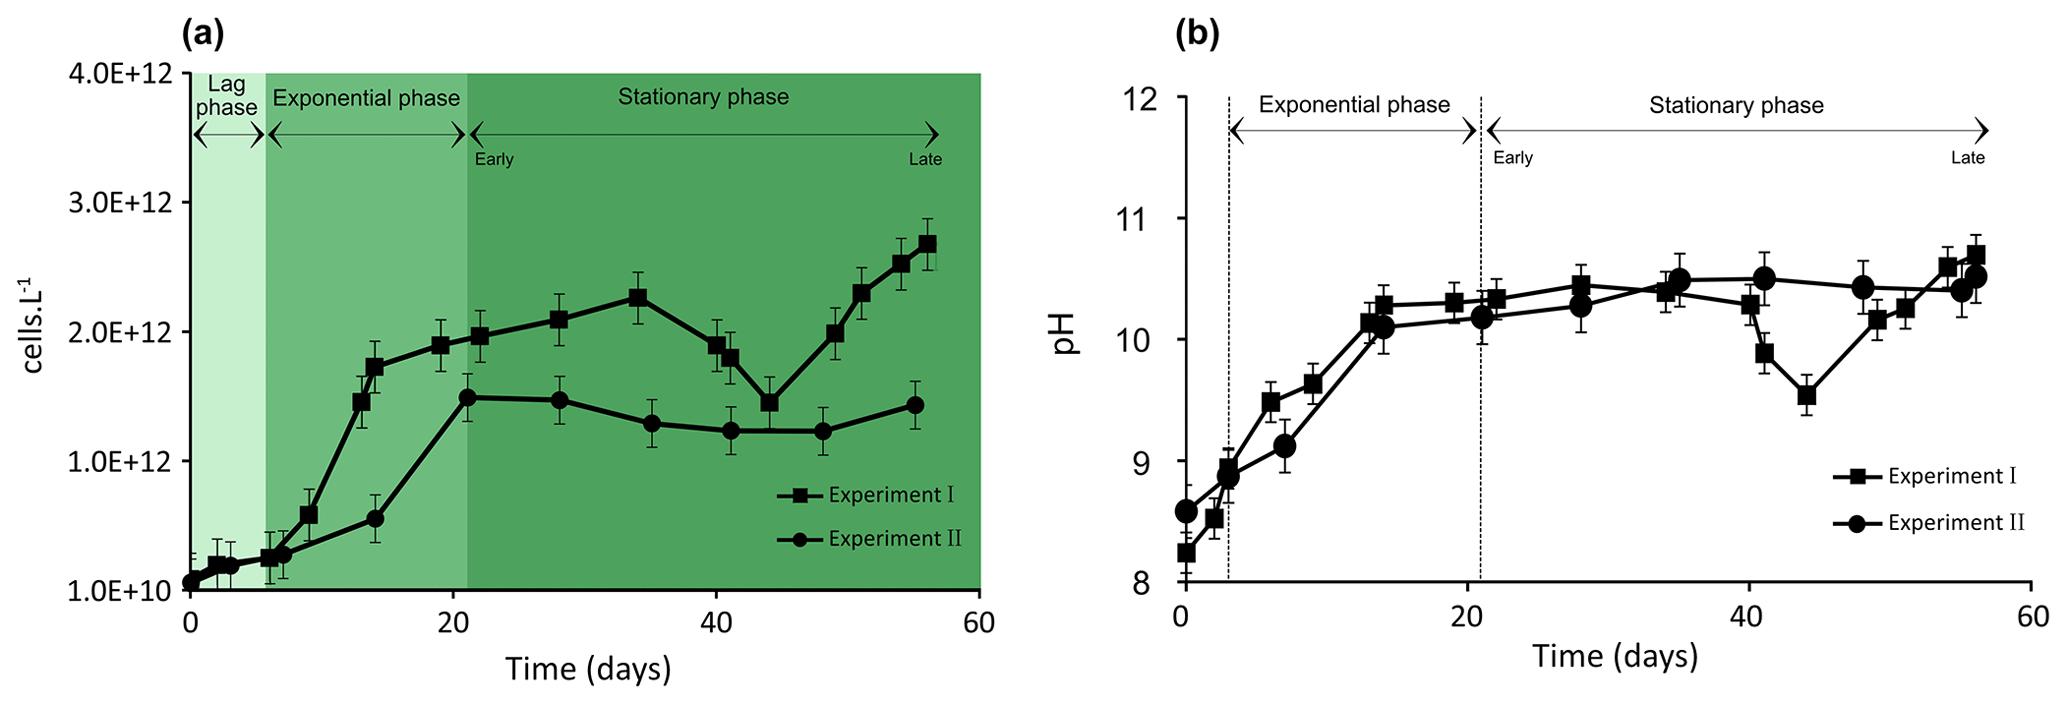
Figure 1Evolution of biomass of Synechococcus PCC7942 culture (a) and pH evolution (b) during exponential as well as early and late stationary phases. The vertical dotted lines (b) represent the stage transition between lag, exponential and stationary phases. Each value is the mean ± SD of all replicate values.
2.5.4 Inhibitory effect of EPS using pH-drift assay
The capacity of negatively charged functional groups in EPS to inhibit the in vitro precipitation of calcium carbonate was tested with the pH-drift assay (Wheeler et al., 1981; Marin et al., 2000; Kawaguchi and Decho, 2002). This assay was performed as previously described by Martinho de Brito et al. (2022). Briefly, the pH was recorded by a pH meter (laboratory-research-grade benchtop pH/mV meter with 0.001 pH resolution: HI5221) connected to a PC via a USB cable. Data were recorded by the HANNA HI92000 software. The pH was measured every 2 s for ∼ 15 min. The shape of the curve (after reaching its maximum, about 1 min after T0) directly reflects the inhibitory capacity of the tested EPS: a fast decrease in pH (decreasing exponential) indicates ongoing precipitation, i.e. the absence of inhibition. A delayed decrease in pH, resulting in a plateau around pH 8, indicates an inhibitory effect, proportional to the length of the plateau. Between each experiment, the electrode was refreshed with dilute acid, and blank tests (without EPS) were performed.
2.6 Interaction of EPS with the in vitro precipitation of CaCO3
The potential of the EPS matrix to interact with the precipitation of calcium carbonate was tested via the diffusion method in the presence of a closed ammonia–CO2-saturated atmosphere (Albeck et al., 1993). A total of 200 µL of the mixture containing pre-filtered (0.22 µm) CaCl2 solution (10 mM) and EPS at increasing concentrations (3, 18, and 36 µg mL−1) were incubated in duplicate in 16-well plates (Lab-Tek, Nunc/Thermo Scientific, Rochester, NY, USA). The EPS concentrations were selected to match the EPS yields at the extraction times (14, 28 and 56 d of cultivation). The plastic covers of the well plates were perforated to allow the reaction between CaCl2 solutions containing EPS and ammonium bicarbonate. The well plates were placed in a desiccator that was incubated at 4 ∘C in the dark for 72 h. At the completion of the incubation period, the pH value was measured in each well, the overlying solutions were carefully removed to dryness and CaCO3 crystals were analysed. Blank experiments were performed without any EPS. The experiment was carried out in duplicates.
2.6.1 Morphology and mineralogy of the crystals
The 16-well plates containing crystals were used in two manners: first, the morphology of the CaCO3 crystals was checked with a tabletop scanning electron microscope (Hitachi TM 1000, Ibariki, Japan) in backscattered electron mode. To this end, the glass plate base was unsealed from its plastic well part and directly observed without carbon or gold sputtering. Secondly, the polymorph of the calcium carbonate minerals was determined by FT-IR spectroscopy using an FT-IR Bruker ALPHA (Bruker Optics, SARL, Champs-sur-Marne, France). Mineral phases were determined by comparison of the spectra with the reference spectra available in the RRUFF Project database (https://rruff.info, last access: 1 January 2022).
2.6.2 Crystal counts and size distribution
CaCO3 crystals were counted directly in the 16-well plates using an inverted microscope (Nachet, Paris, France) equipped with Mosaic 2.2.1 image analysis software. Images were processed to obtain crystal sizes (average width and length of size classes < 50 and > 50 µm) and the total count of crystals in each well. A total of 10 fields of view (10 squares) accounting for 15.5 mm2 were analysed. The results are reported as the mean ± standard deviation.
2.7 Statistical analysis
All the data concerning Synechococcus growth and EPS production are representative of two independent experiments with two technical replicates (four replicates for EPS extracted at 56 d of culture). The results are reported as the mean ± standard error of the mean. Statistical significance was assessed by performing single-factor ANOVA tests; p values < 0.05 were statistically different.
Table 1Concentrations of , and Ca2+ (µM) in the culture medium before inoculation (initial concentrations in the medium) and during exponential as well as early and late stationary Synechococcus growth phases are given as mean concentrations of four replicates (n=4).
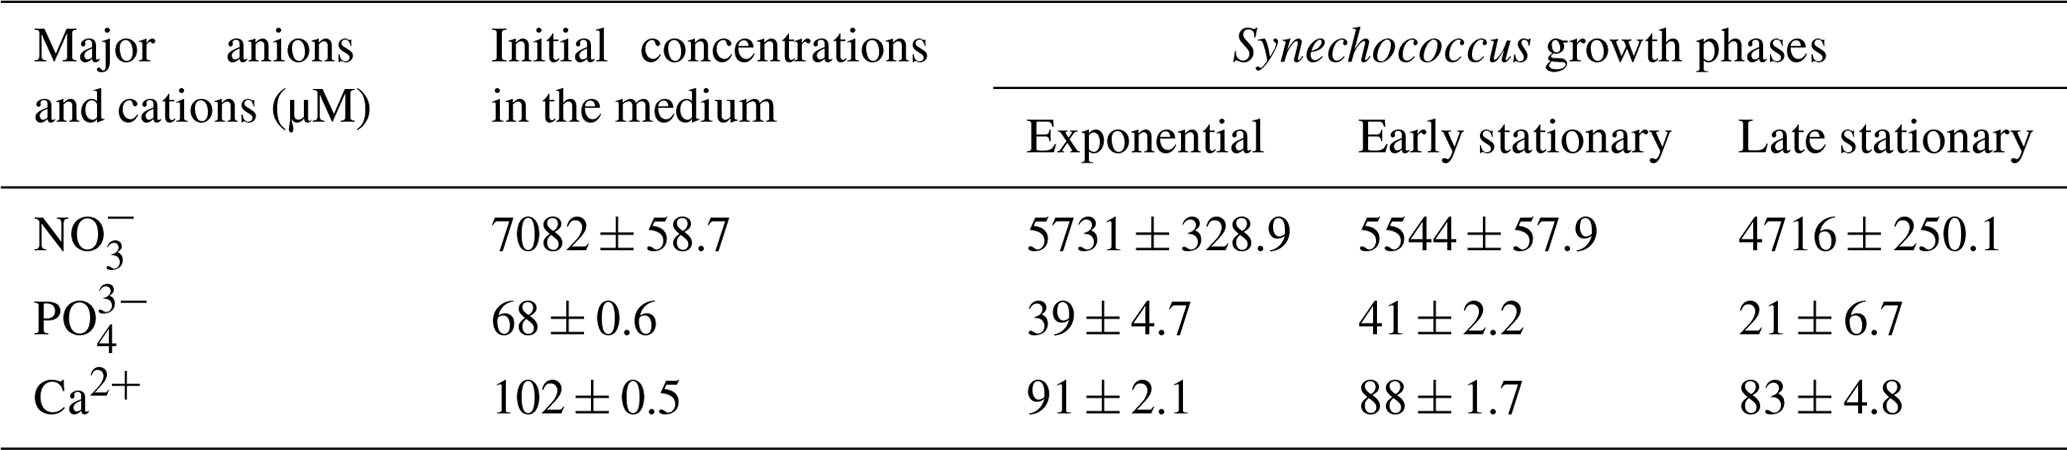
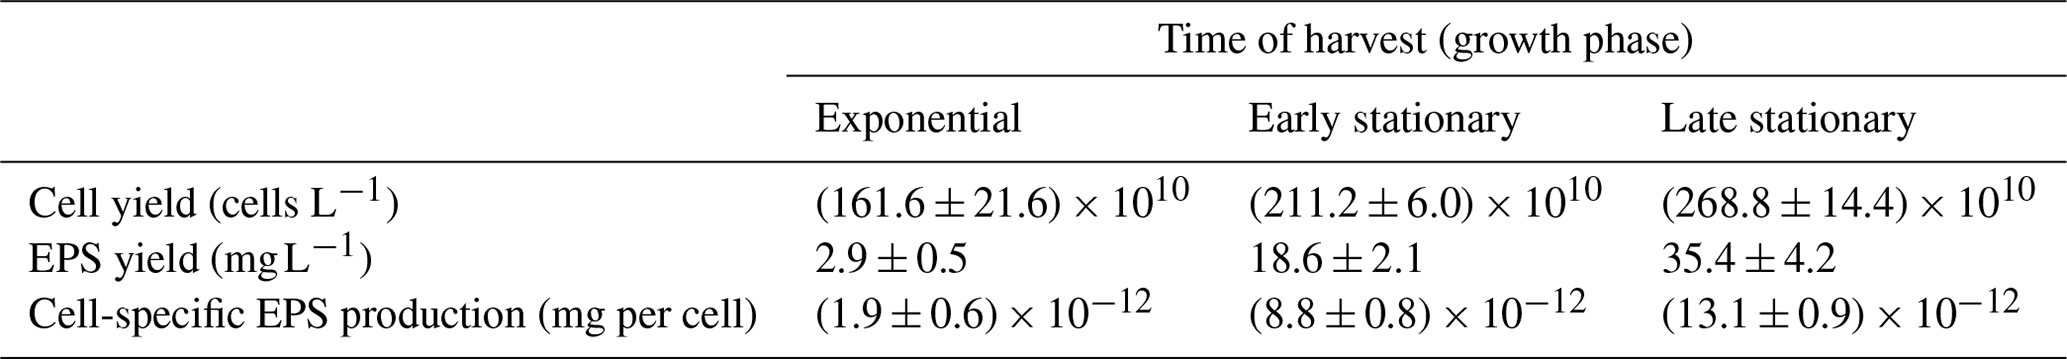
Table 2Cell yield, total EPS production and cell-specific EPS production in Synechococcus PCC7942 cultures during exponential as well as early and late stationary growth phases. Data represent the means of two independent experiments.
3.1 Trends in Synechococcus PCC7942 growth experiments and pH evolution
Cell density and pH values increased over the Synechococcus cultivation period (Fig. 1a and b). The growth of Synechococcus cells showed a typical pattern including a brief lag phase (∼ 6–7 d) followed by a 7 d (Experiment I) and 14 d (Experiment II) exponential phase and finally a stationary phase. The stationary phase (early stationary phase) was reached after 14 and 21 d of growth in Experiment I and II, respectively, and lasted until day 56 of cultivation in both experiments (late stationary phase) (Fig. 1a). Growth experiments I and II started with a similar cell density of approximately 1010 cells L−1 and demonstrated reproducible growth patterns (p value = 0.91). At the time of inoculation, cell density was 9.5 × 10¹⁰ in Experiment I and 7.11010 cells L−1 in Experiment II (Fig. 1a). Synechococcus grew exponentially until reaching a maximum of 1.7 × 10¹² in Experiment I at 14 d of growth and 1.5 × 10¹² cells L−1 after 21 d of growth in Experiment II. At the end of the exponential growth phase, the cell numbers levelled off and achieved a stable growth stage (stationary phase). Typical evolutions of pH values in culture media during the Synechococcus growth experiments are presented in Fig. 1b. As a general trend, pH is linked to the photosynthetic activity of cyanobacteria. The pH levels rose rapidly during the exponential phase in both experiments, reaching around 10, and stayed steady during the stationary phase. While Experiment I experienced significant pH fluctuations during the latter part of the stationary phase, overall, the pH evolution trends for both experiments are comparable (p value = 0.91; Fig. 1b). The p values for pH and cell numbers showed that the two independent growth experiments are not significantly different.
3.2 Extracellular carbonic anhydrase
The activity of extracellular carbonic anhydrase (eCA) in solution changed slightly over the growth experiment (Fig. S1 in the Supplement). The highest eCA activity (∼ 1600) was detected after 14 d of culture during the exponential phase. The lowest activity was measured after 56 d of growth in the late stationary phase.
3.3 Nutrient concentrations during growth
High nitrate concentrations supported exponential growth and high cell density (Table 1). The results show that a major decrease in nitrate and phosphate concentrations occurred during the exponential growth phase and remained slowed down progressively over the stationary phase. At the end of the stationary phase, the phosphate concentration had decreased to approximately 30 % of its initial level. On the other hand, the nitrate concentration was still high, with approximately 67 % of its initial concentration remaining. Ammonium concentration was below the limit of detection (2.22 µM). Calcium concentrations decreased gradually and accounted for a total calcium concentration of 81 % in the late stationary phase. Other medium constituents should be present in excess and were thus not measured.
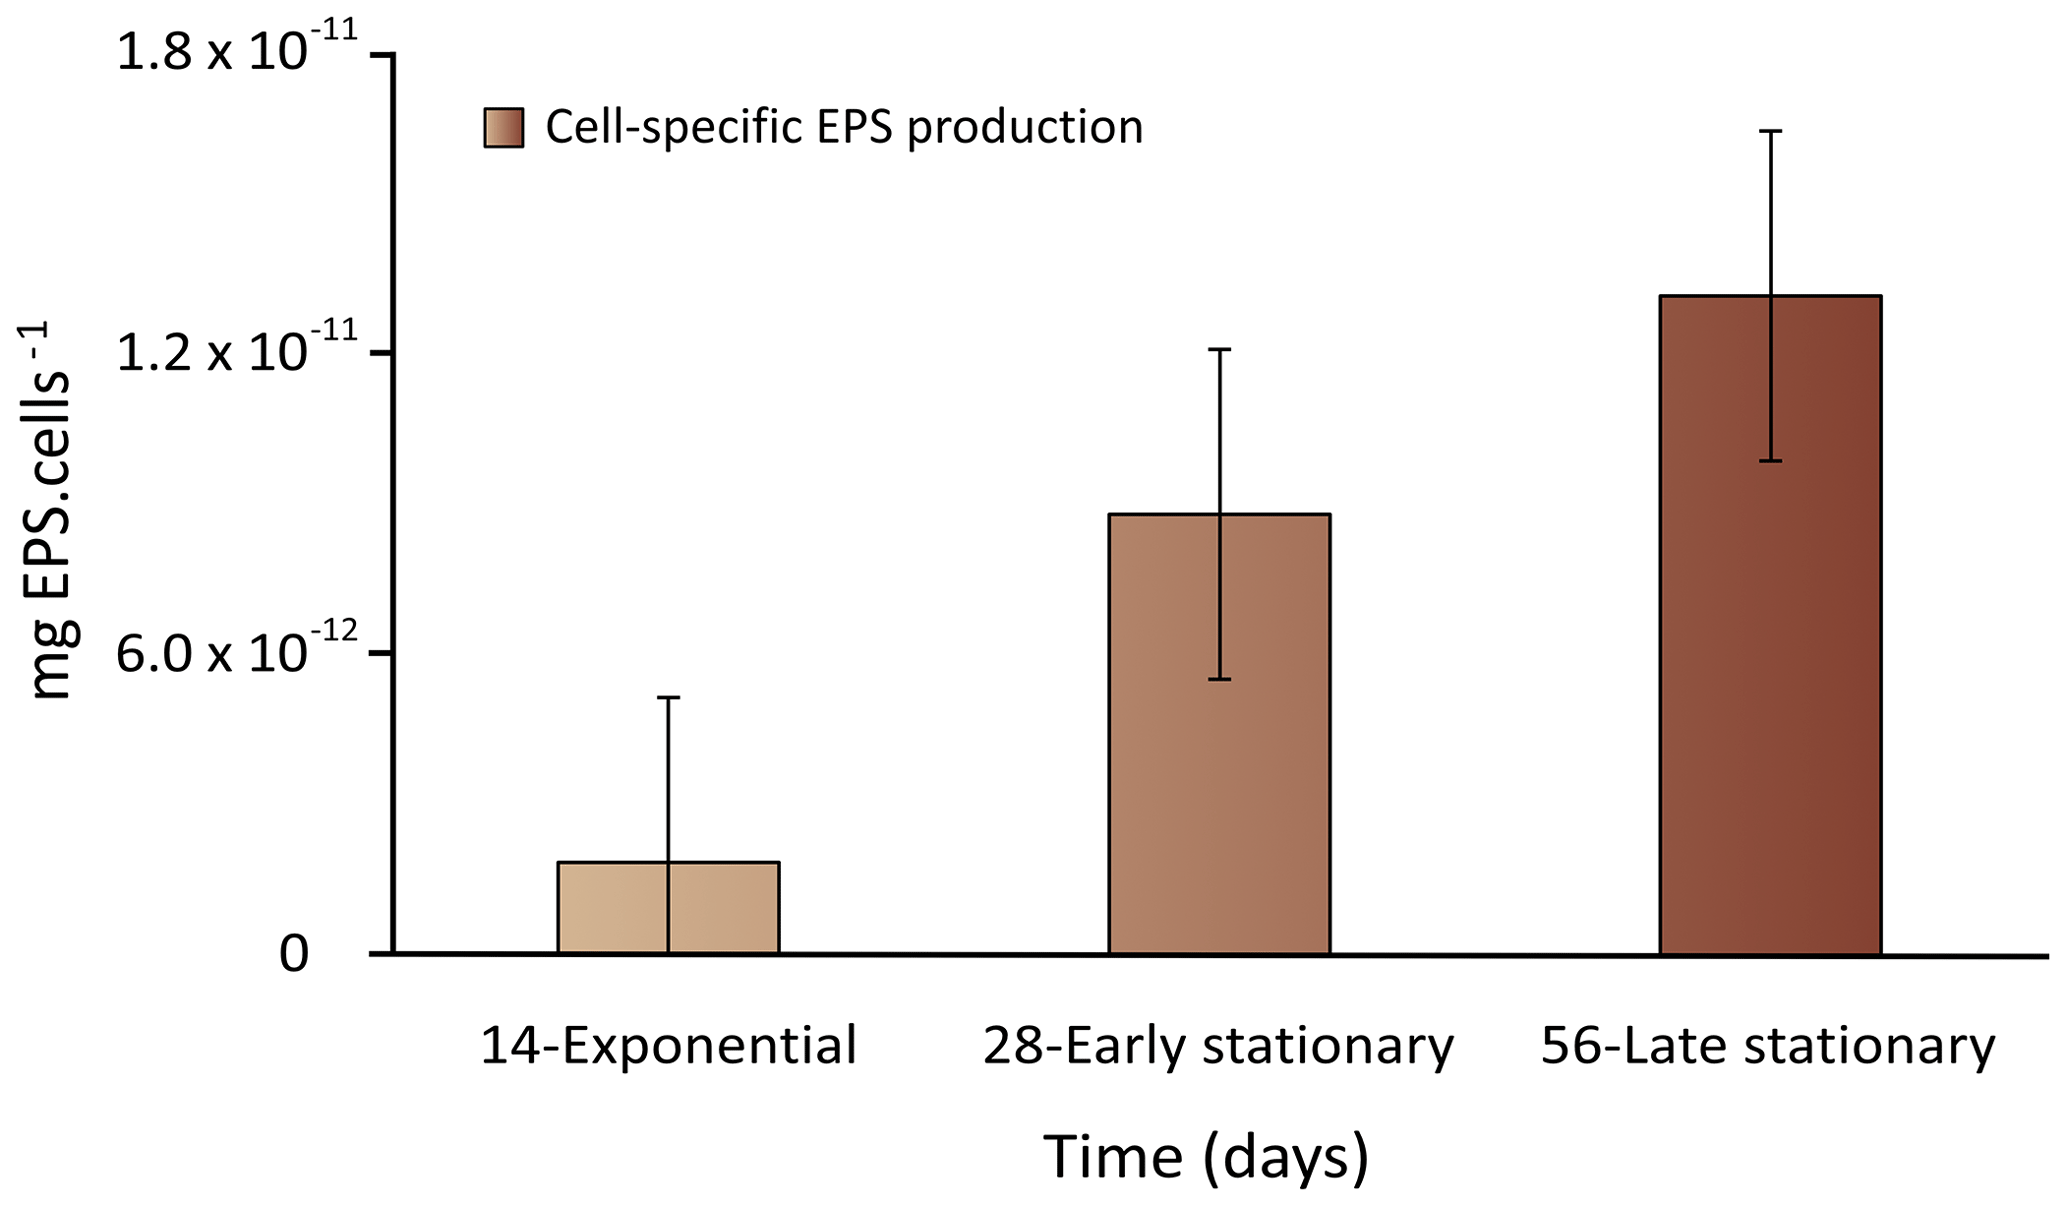
Figure 2Cell-specific EPS production during the exponential as well as early and late stationary phases. Each value is the mean ± SD of two replicate values (n=2).
3.4 Abundance of EPS
The recovery yields of the EPS produced (mean ± SD) resulting from the applied extraction method are listed in Table 2. The EPS yields varied from 2.9 ± 0.5 to 18.6 ± 2.1 mg L−1 during exponential and early stationary phases and reached the highest yield of 35.4 ± 4.2 mg L−1 at 56 d of culture in the late stationary phase (Table 2). When the values were normalized per cell yield, results showed that the EPS concentration increased significantly between the exponential and late stationary phases (p value < 0.05) (Fig. 2). Synechococcus continuously produced EPS during the 56 d experiment. In the first 14 d of growth, cells grew exponentially and EPS production was deficient. Between exponential and early stationary phases, EPS production increased by a factor of 5 to 7, reaching a maximum in the late stationary phase, after the 56 d growth experiment.
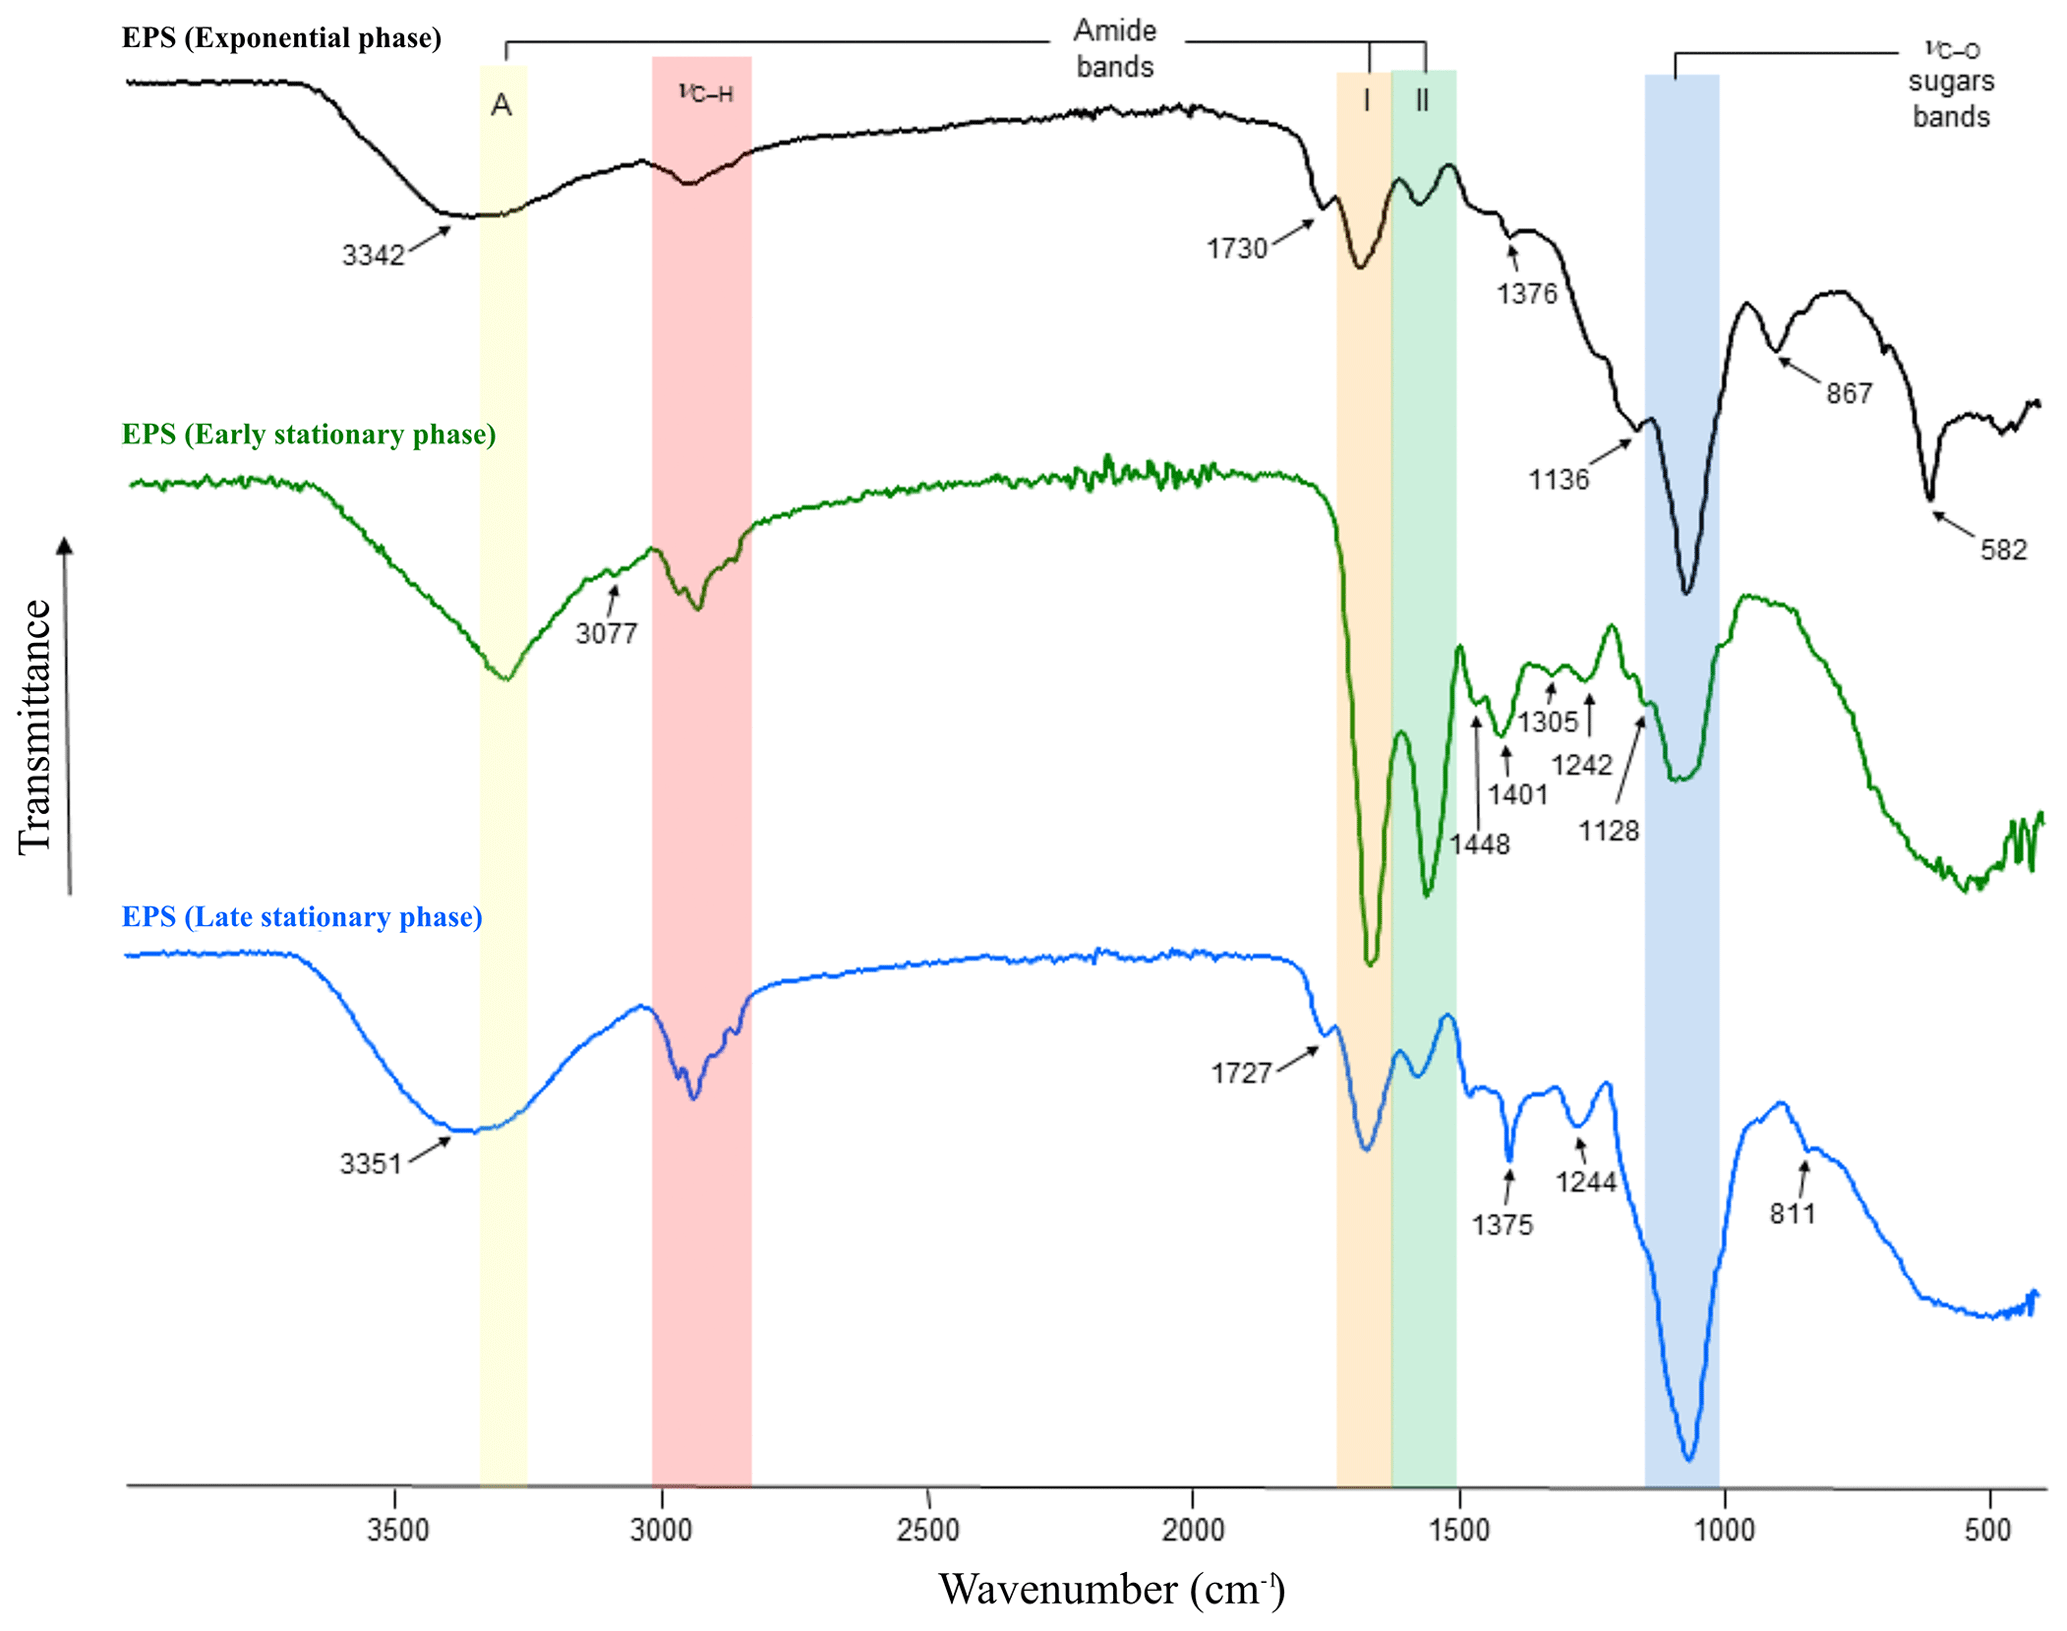
Figure 3FT-IR spectra of EPS produced during the exponential (black line) as well as early (green line) and late (blue line) stationary phases. Amide A absorbs in the range of 3342–3351 cm−1 (yellow area), amides I–II absorb at 1542–1650 cm−1 (orange and green areas), sulfate groups at ∼ 1242–1244 cm−1 and polysaccharides at ∼ 1040–1070 cm−1 (blue area). The β-glycosidic linkages are visible as a shoulder at ∼ 867 cm−1.
3.5 Chemical properties of EPS
3.5.1 FT-IR spectroscopy of EPS
FT-IR spectroscopy was used to check the overall EPS properties and composition. The IR spectra of EPS harvested during the exponential as well as early and late stationary phases of the growth experiment are depicted in Fig. 3. The three spectra show strong similarities, exhibiting characteristic absorption bands for polysaccharides and protein moieties (highlighted in Fig. 3 by vertical-coloured areas). However, differences in sample composition were also revealed by the presence of additional absorptions indicated by arrows in Fig. 3. Interestingly, the spectrum of the exponential-phase EPS exhibits a strong band, isolated at 582 cm−1, which according to the literature on EPS could be assigned to a C–X stretch of alkyl halides (Kavita et al., 2011). Bands at 811–868 cm−1, most likely representing the glycosidic linkage between sugar monomers, were only present in EPS extracts in the early and late stationary phases. Bands at 1039–1128 cm−1 (C–O and C–O–C stretching vibrations) could be assigned to polysaccharides and polysaccharide-like structures (Wang et al., 2012) and were observed in all EPS samples (Fig. 3, blue area). In contrast, the small shoulders observed in the early- and late-stationary-phase EPS at ∼ 1242 and 1244 cm−1 correspond to sulfate groups (nS=O stretching vibrations). Low-intensity bands observed in the range of 1370–1450 cm−1 are assigned to CH3 and CH2 deformations (bends) of proteins (Kansiz et al., 1999). These absorption bands were more evident in EPS obtained during the early stationary phase. The bands present in the range of 1660 and 1540 cm−1 are attributed to C=O and C–N stretching vibrations and are characteristic of Amide I and II functions (Fig. 3, orange and green areas, respectively), which are typically associated with proteins (Coates, 2000). Spectra of the early-stationary-phase EPS showed higher peaks of protein than those observed in EPS from exponential and late stationary phases. The medium bands at 1730 and 1727 cm−1, present in samples extracted from exponential and late stationary phases, can be attributed to C=O stretching vibrations resulting from lipids and fatty acids (Kansiz et al., 1999). Absorptions in the range of 2960–2850 cm−1 corresponding to C–H stretching vibrations of aliphatic hydrocarbons and possibly indicative of long-chain polymers (e.g. sugars or proteins) were observable in all EPS extracts. The amide A band (3345 cm−1), characteristic of the N–H vibration of peptide groups in proteins, is present in all spectra (Fig. 3, yellow area) but is particularly visible on the early-stationary-phase EPS spectrum. In the samples at 14 and 56 d of growth, this band is included in shoulders due to the presence of OH absorptions centred at 3342 and 3351 cm−1, respectively. The list of band assignments is summarized in Table S1 in the Supplement.
Table 3Protein, sugar and glycosaminoglycan content of the harvested EPS at 14, 28 and 56 d of the Synechococcus PCC7942 culture. Values represent the average of four, three and two measurements of protein, sugar and GAGs, respectively, in two EPS-replicated samples (n=2).
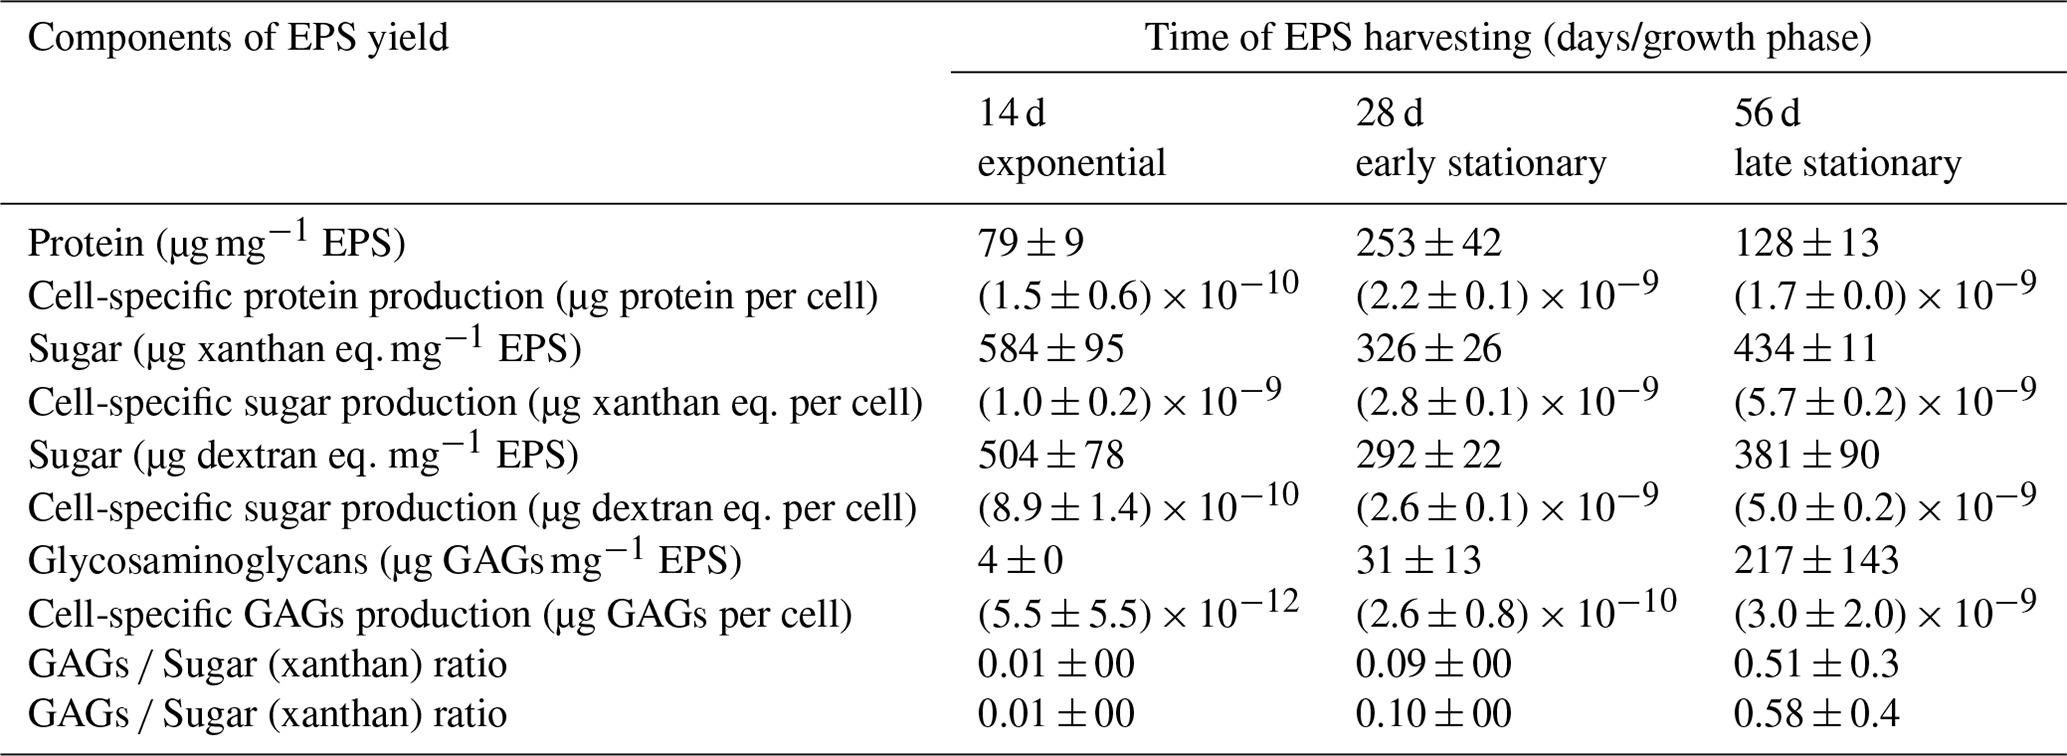
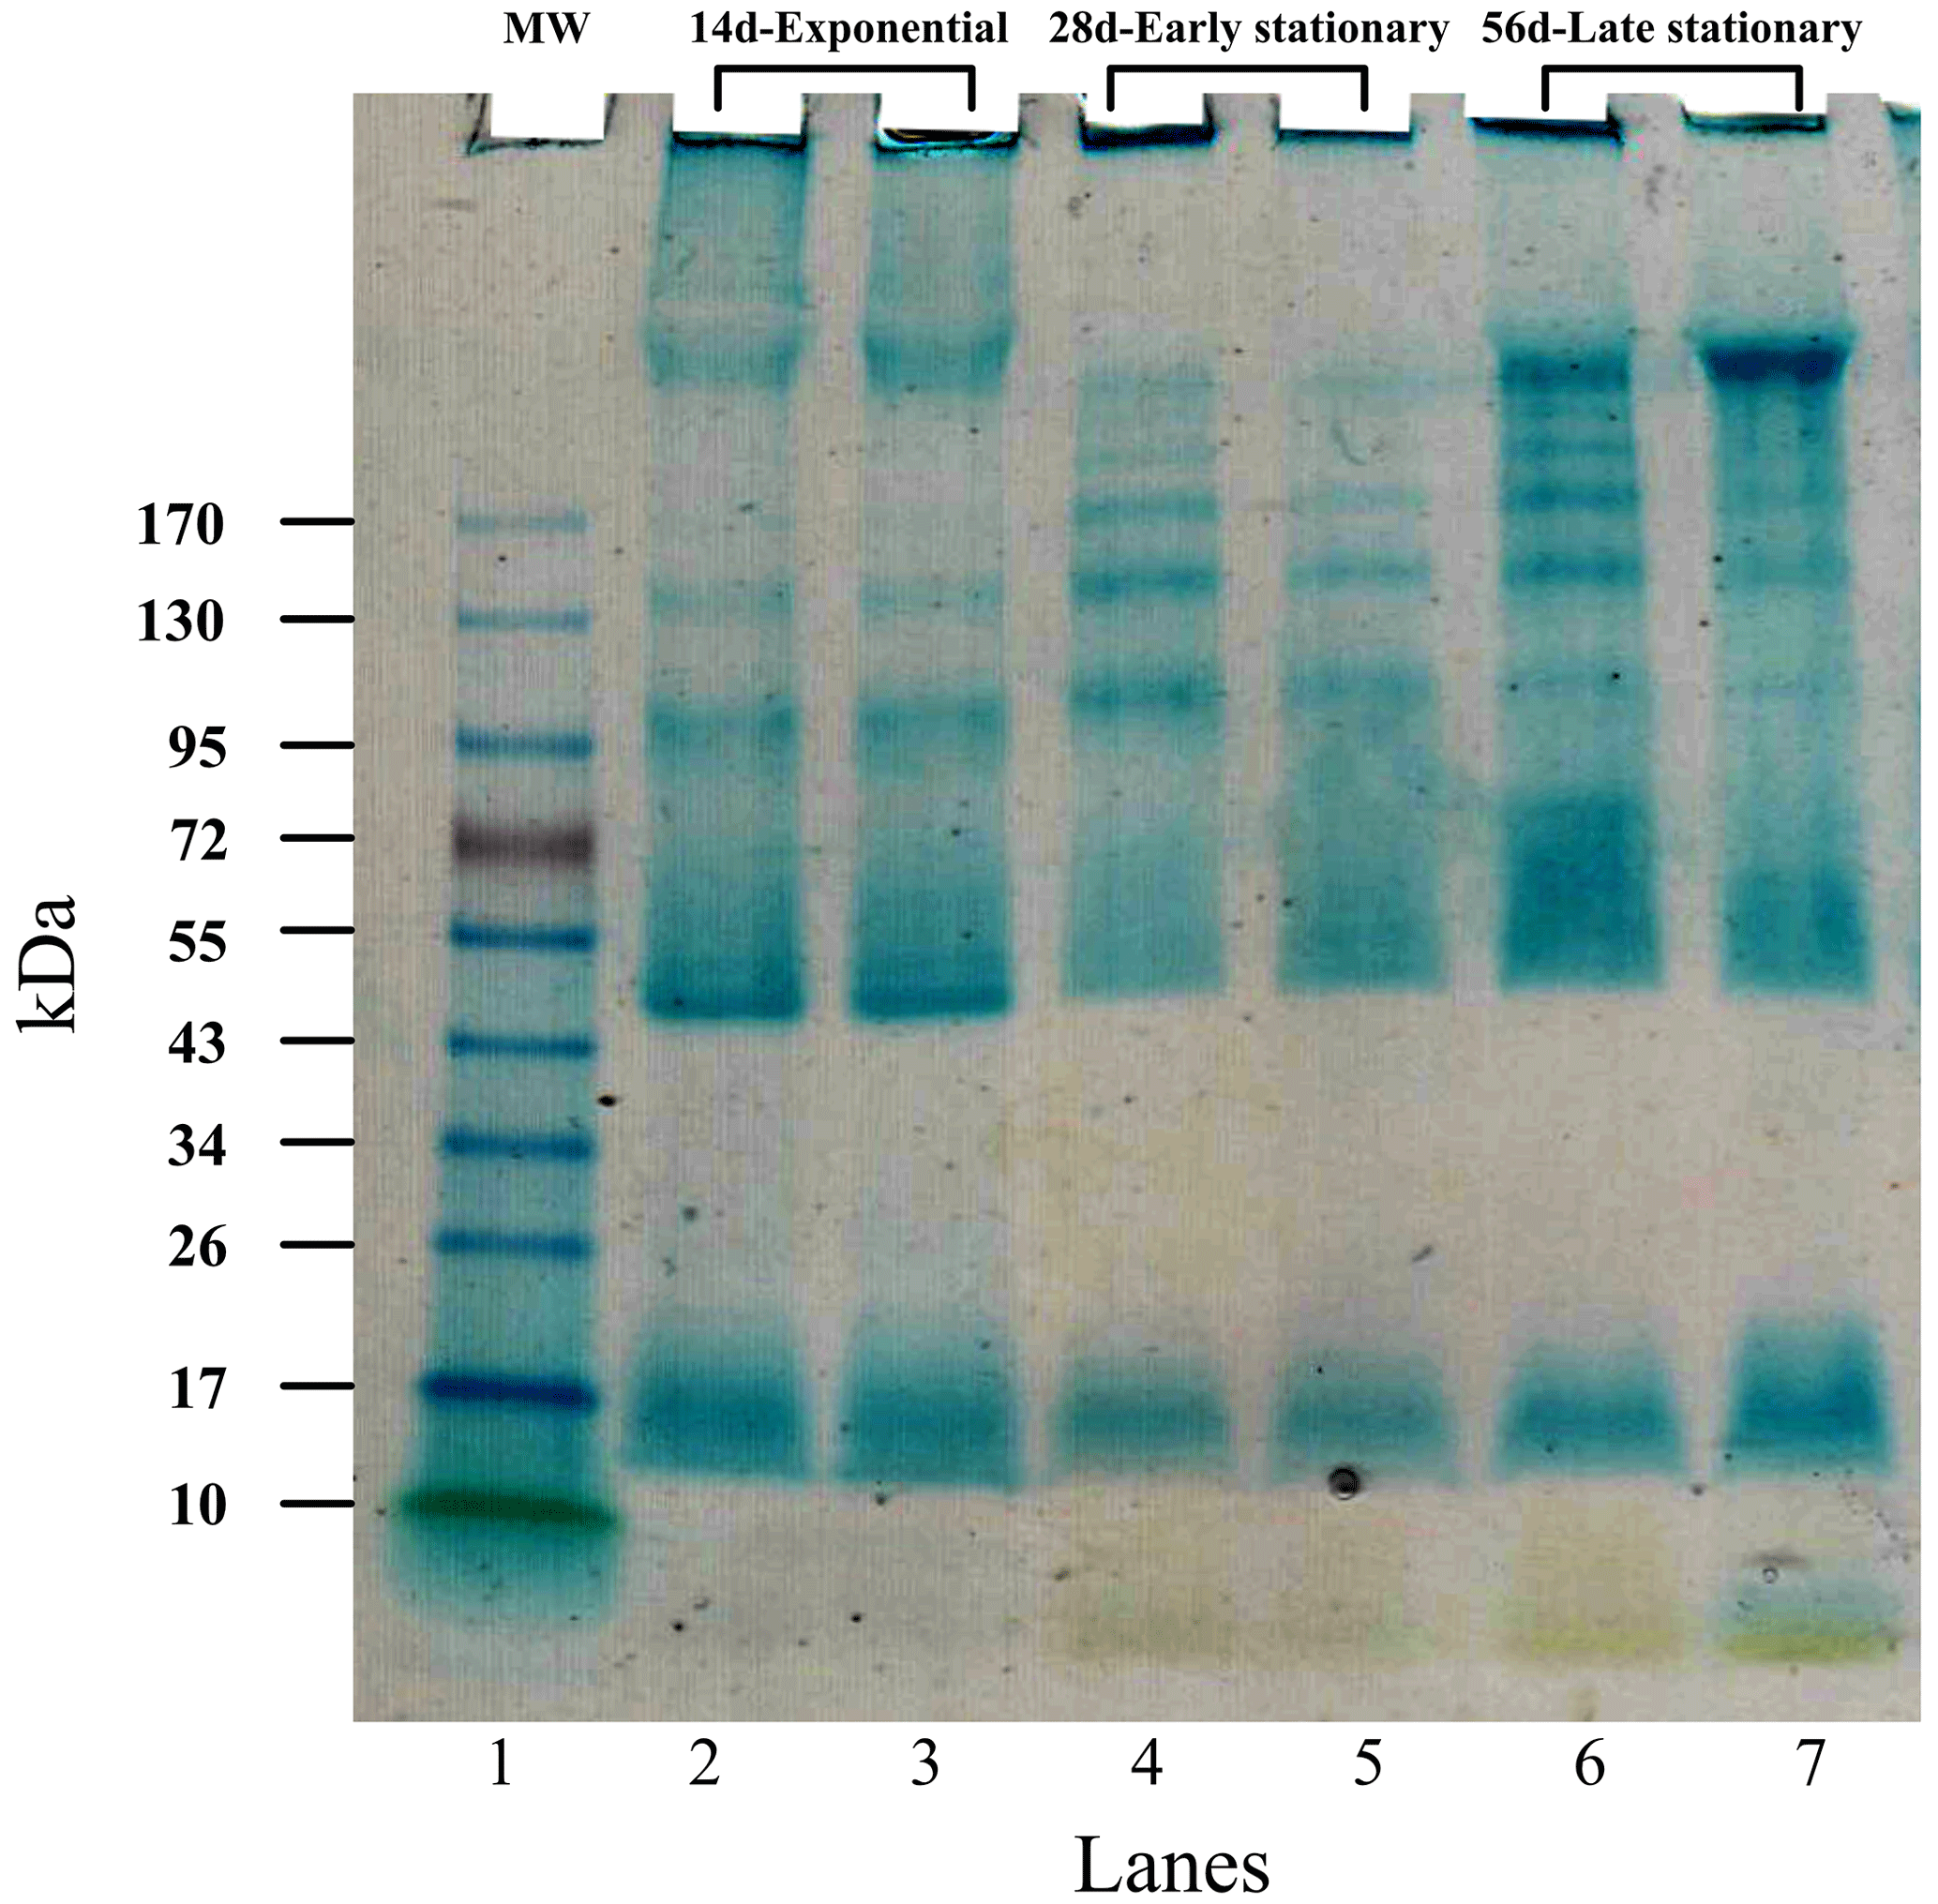
Figure 4SDS–PAGE of EPS harvested during exponential (lanes 2–3) as well as early (lanes 4–5) and late (lanes 6–7) stationary phases. Alcian Blue staining was applied. The molecular ladder (MW) reference is shown in lane 1.
3.5.2 Protein, sugar and glycosaminoglycan (GAG) contents
The EPS produced during the exponential growth phase revealed the lowest concentration of protein (79 ± 9 µg mg−1 EPS) (Table 3). The highest protein concentration was measured in EPS produced during the early stationary phase (253 ± 42,µg mg−1 EPS), whereas during the late-stationary-phase EPS, the protein concentration decreased ∼ 2-fold. When accounting for the cell yield at times of EPS extraction, cells produced EPS with ca. 11–15 times more protein in the stationary phase than in the exponential phase. The sugar content in the EPS harvested during the three different growth stages did not vary significantly. The EPS produced during the exponential phase contained a slightly higher sugar content (584 ± 9 µg EPS and 504 ± 78 µg EPS) than that measured in EPS produced during the early and late stationary phases (1.8 times and 1.3 times lower, respectively). Our results show that, over the cultivation time, cells enhanced the production of larger amounts of glycosaminoglycans (GAGs), which can be associated with amino sugars and glycoproteins. The highest fraction of sulfated groups (GAGs) to total EPS (217 ± 143 µg GAGs mg mg−1 EPS) was found in the late-stationary-phase EPS.
3.5.3 SDS–PAGE
The results of gel electrophoresis after the migration of exponential- as well as early-stationary- and late-stationary-phase EPS samples are illustrated in Fig. 4. Replicates showed similar band patterns that are distributed between 10 and > 170 kDa. A sharp-greenish band in the migration front is strongly stained in late-stationary-phase EPS (Fig. 4) and may correspond to chlorophyll. A less pronounced smear is visible in extracts obtained from the early stationary phase (lanes 4 and 5). Bands of < 10 kDa were not detected in the EPS produced during the exponential phase (lanes 2 and 3). A marked smear pattern is evidenced in all EPSs extracted between 10–26 kDa: one prominent band was individualized at 17 kDa. A discrete blue smear (> 17–43 or 55 kDa) is evidenced in exponential-phase EPS samples (lanes 2 and 3) and is less obvious in EPS samples from the early and late stationary phase (lanes 4–5 and 6–7, respectively). No specific bands were individualized in the > 17–43 kDa molecular mass range for the three growth phases. A band at about 45–47 kDa was strongly stained in the exponential phase only. An area between 43 and 170 kDa was noted in all EPS extracts, accounting for five–six individualized bands that may correspond to the consecutive addition of an identical “module” because the progression is logarithmic: it is clearly seen in the early- and late-stationary-phase lanes (lanes 4–7). The individualized bands were densely stained in EPS from the late stationary phase, including a smear at ∼ 43–55 or 72 kDa (lanes 6 and 7) and a prominent band at > 170 kDa (lanes 6 and 7).
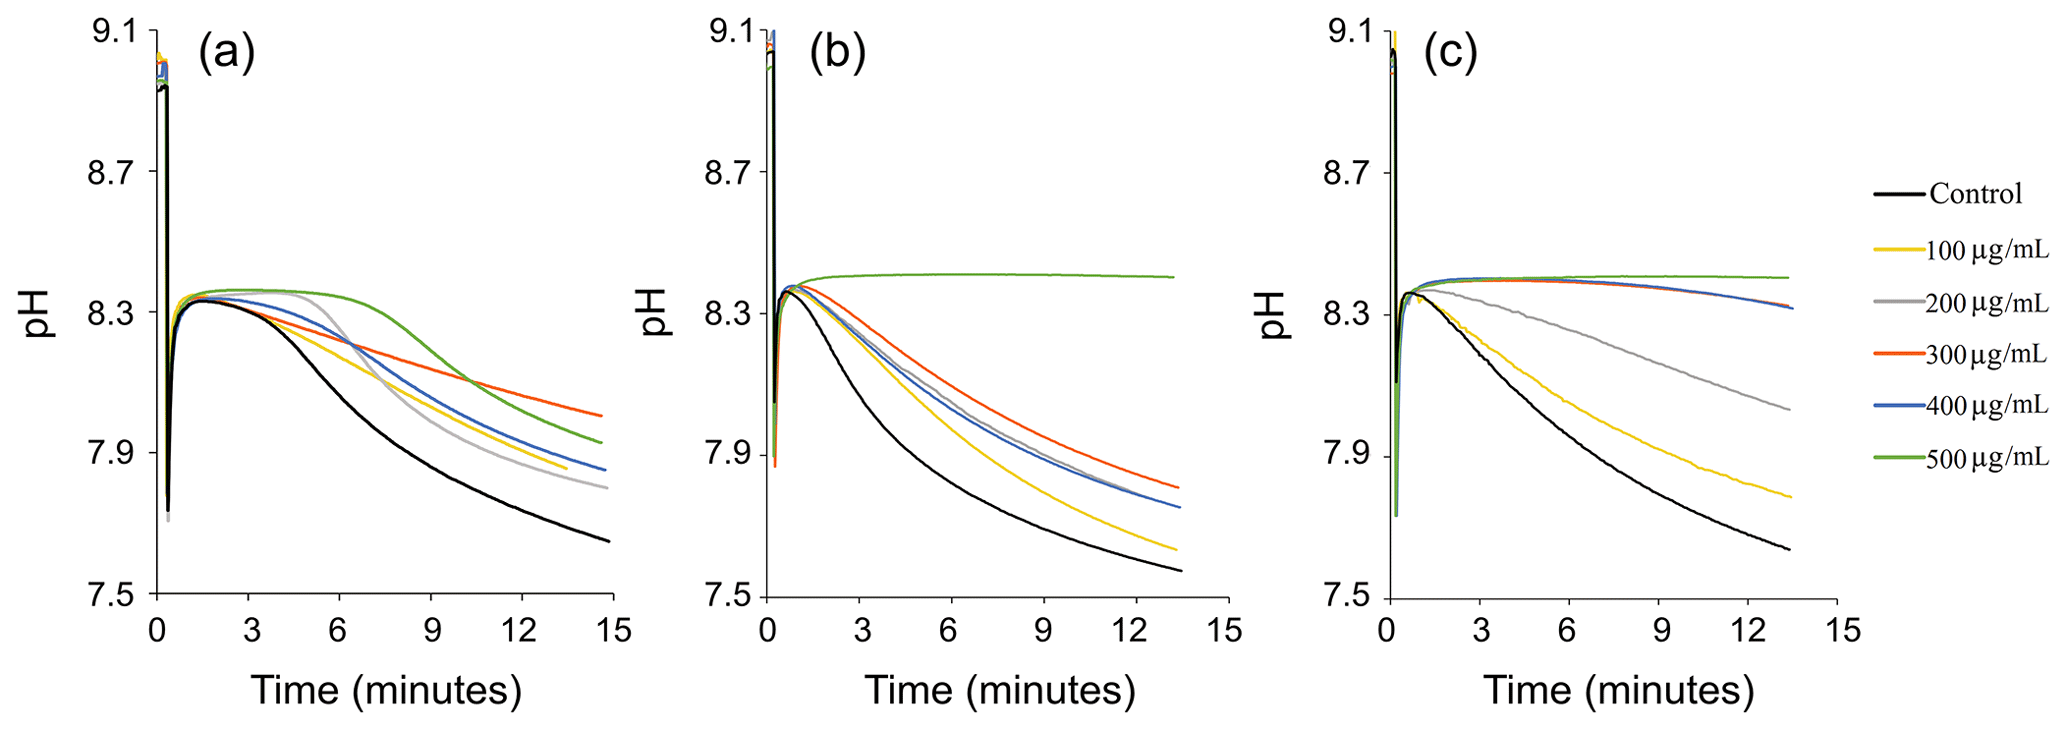
Figure 5In vitro inhibition of calcium carbonate precipitation by using EPS extracted during exponential (a) as well as early (b) and late (c) stationary phases. Each panel shows the effect of six different EPS concentrations (0, 100, 200, 300, 400 and 500 µg EPS mL−1) on CaCO3 precipitation using the pH-drift-assay method. The drop in pH indicates nucleation of CaCO3 (= precipitation), and a plateau indicates inhibition of precipitation. A larger plateau indicates a higher Ca-binding capacity of the matrix and thus stronger inhibition. Complete inhibition was observed when 50 µg EPS solution from early and late stationary phases were used (e.g. see arrows). The results in each panel represent single experiments. Replication showed identical results (see Fig. S2 in the Supplement).
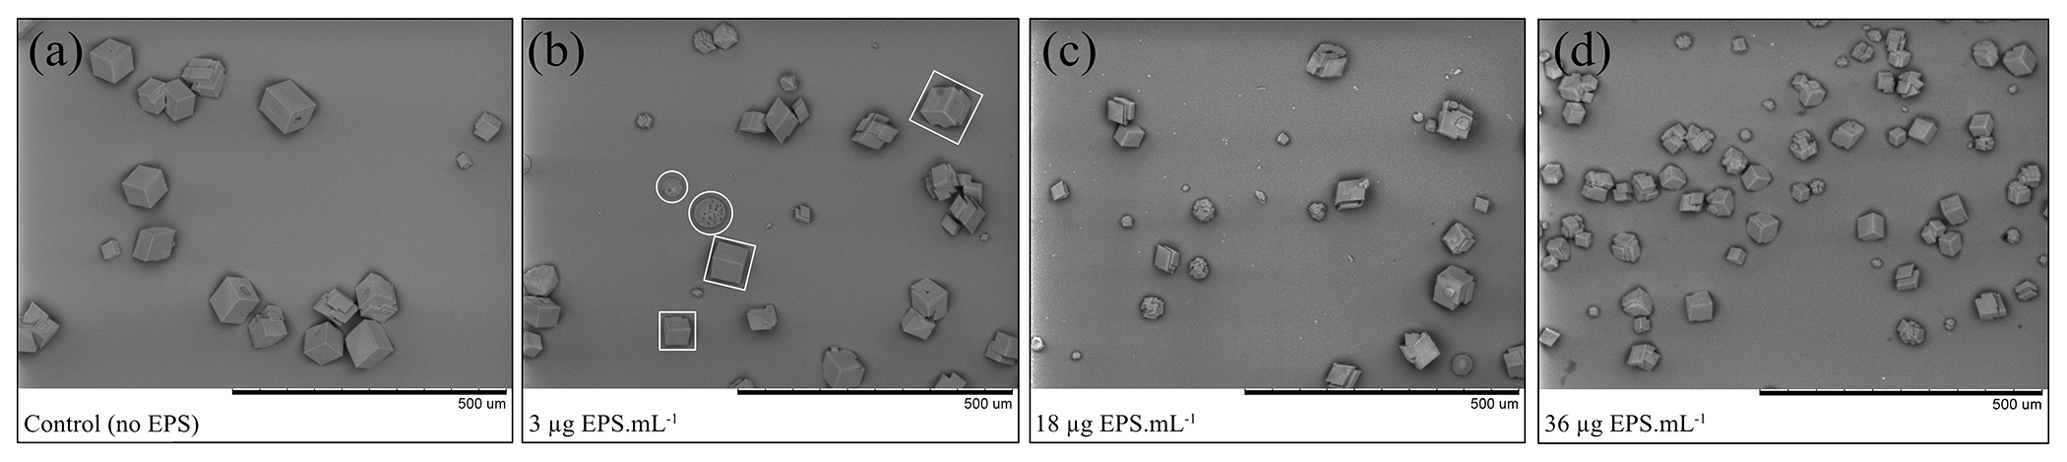
Figure 6In vitro-forced CaCO3 precipitation assay in (a) the absence of the EPS (control solution) and in the presence of EPS extracted during the (b) exponential as well as (c) early and (d) late stationary phases under increasing EPS concentrations of 3, 18 and 36 µg mL−1, respectively. The images show two different CaCO3 morphologies: rhombohedral (white squares) and spheroidal (white circles), in some cases shown as polycrystalline crystals. The scale bar (black) at the bottom right of the images is 500 µm.
3.5.4 pH-drift assay
Recordings of the pH-drift assay are shown in Fig. 5. The pH-drift assay determined the inhibitory effect of the EPS matrix (e.g. negatively charged functional groups) on the rate of CaCO3 precipitation. Negatively charged groups of EPS can bind calcium ions from the solution and inhibit the nucleation of carbonates. When CaCO3 minerals start to nucleate, the pH of the solution decreases. Results show that the inhibitory effect was concentration-dependent, and clear differences were visible between EPS extracted in the exponential (Fig. 5a), early (Fig. 5b) and late (Fig. 5c) growth phases. EPS matrices from the stationary phase of culture growth (Fig. 5b and c) exhibited a stronger inhibitory effect on CaCO3 precipitation than the EPS extracted during the exponential phase (Fig. 5a). Complete inhibition was only reached in EPS from early and late stationary phases when 50 µg EPS mL−1 was tested. In this case, a drop in pH was not observed, and nucleation of crystals did not occur (Fig. 5b and c), which means that the inhibition was total. Conversely, the exponential-phase EPS exhibited less inhibition of CaCO3 precipitation (Fig. 5a). The shorter plateau shows that the mineral-binding capacity of the matrix delayed CaCO3 precipitation but that consequently the pH dropped and visible precipitates formed, showing a less powerful inhibitory effect of the EPS compared to stationary-phase EPS matrices.
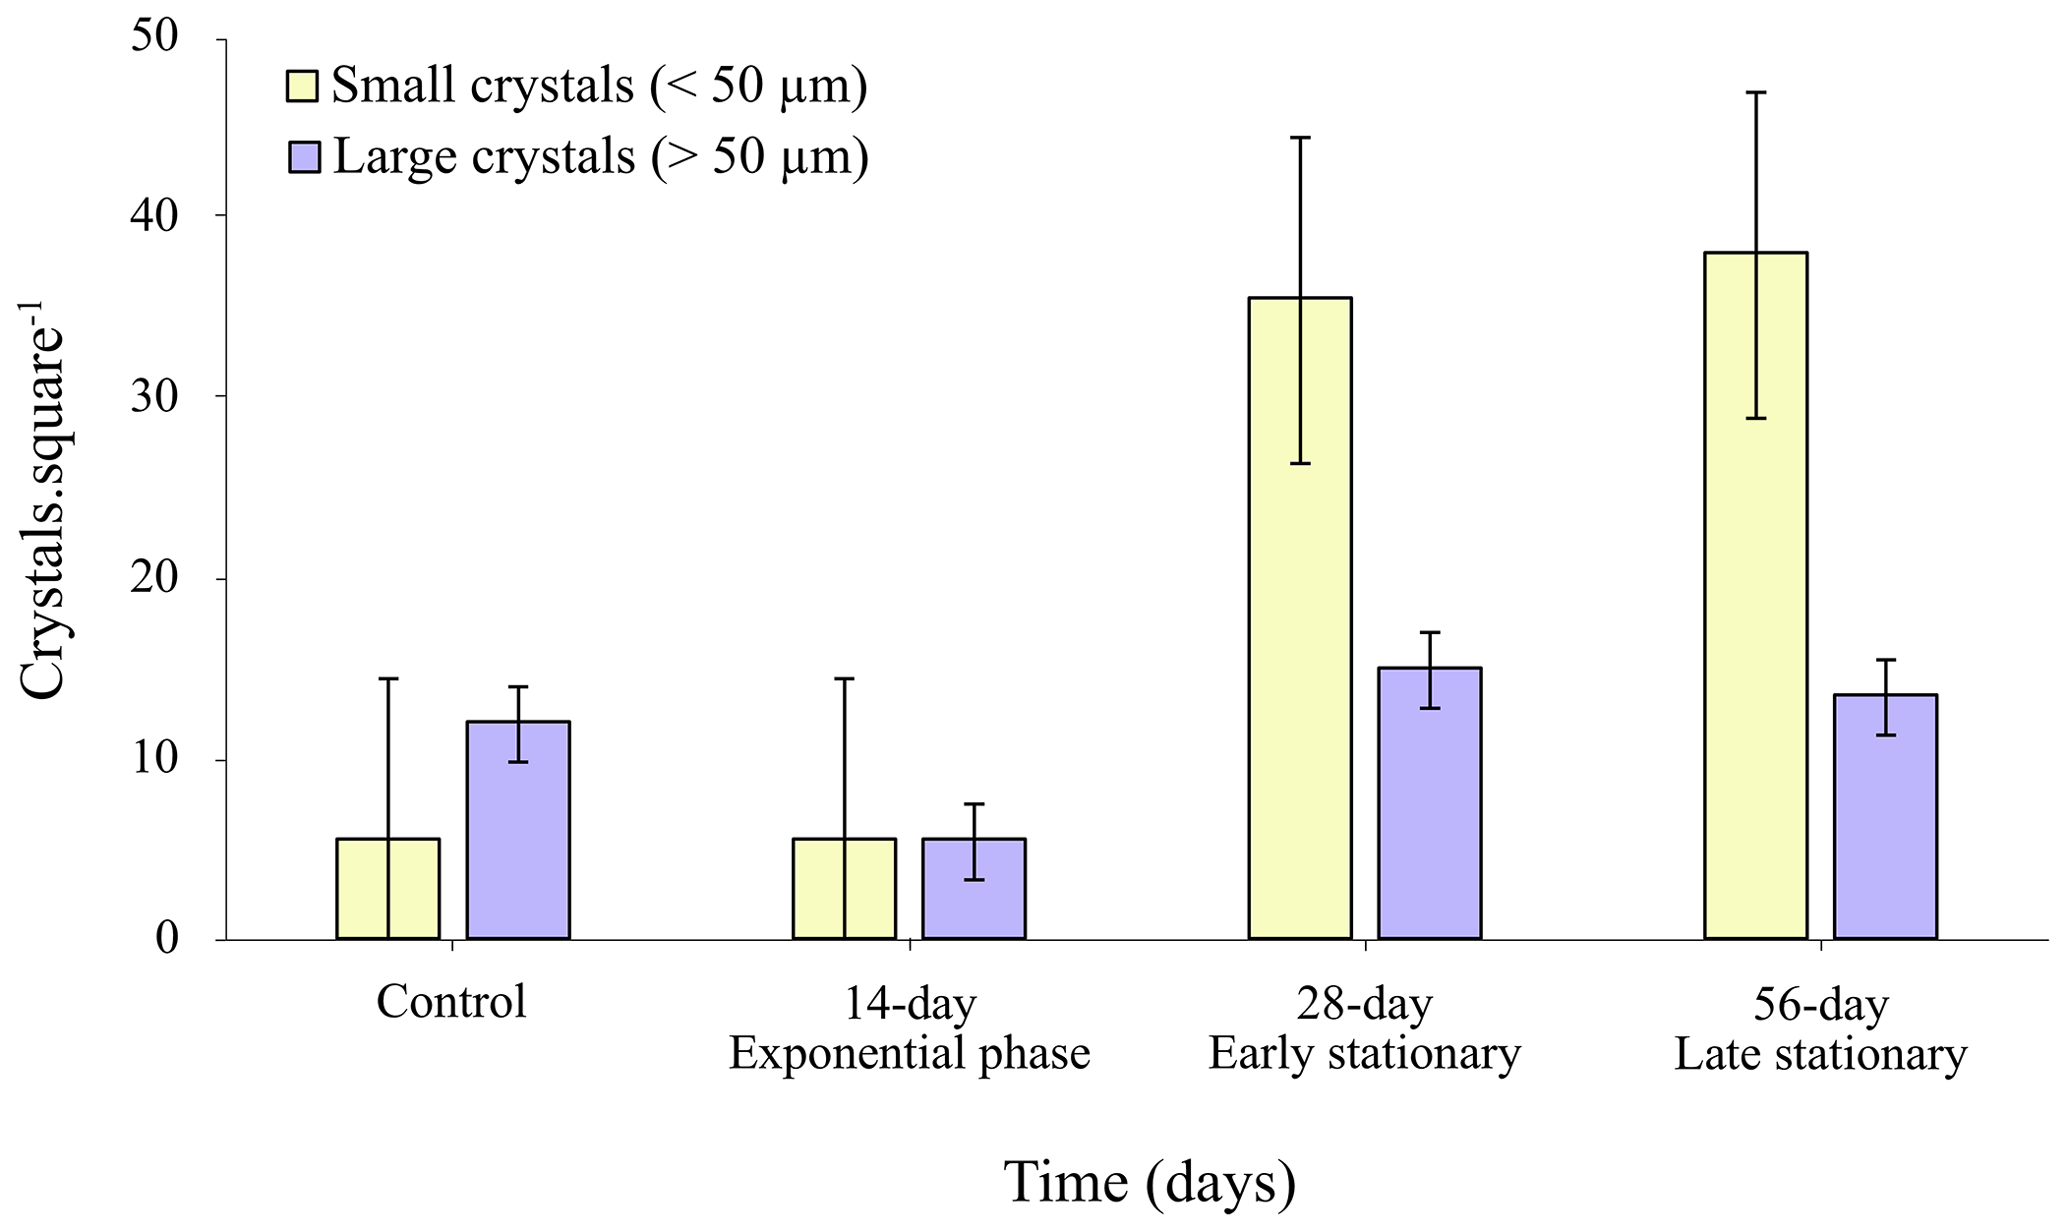
Figure 7Total number of small (< 50 µm) and large (> 50 µm) crystal size classes of precipitated CaCO3 in EPS solutions obtained from exponential and stationary phases in EPS concentrations of 3, 18 and 36 µg mL−1, respectively.
3.6 Calcium carbonate crystallization in the presence of EPS
Forced CaCO3 experiments were performed using a control solution (without EPS) and EPS solutions, at the same pH, with concentrations of 3, 18 and 36 µg mL−1. Each concentration corresponds to the EPS yield at different growth stages: exponential phase (= 3 µg EPS mL−1) as well as early (18 µg EPS mL−1) and late (36 µg EPS mL−1) stationary phases. The crystals formed in the various EPS solutions showed different morphological (Fig. 6) and mineralogical (Fig. S3 in the Supplement) features as well as distinct crystal sizes and distributions compared to those formed in the control solution (Fig. 7).
3.6.1 Mineral morphology
A preliminary light microscopic analysis was carried out in order to identify the most significant samples to analyse by SEM (Fig. 6). The morphology of crystals precipitated in the negative controls was very homogeneous and predominantly composed of calcite rhombohedrons that sometimes formed polycrystalline aggregates of size > 50 µm (Fig. 6a). All control solutions tested for the various EPSs harvested during exponential and stationary phases showed similar crystal characteristics. In the EPS solutions, CaCO3 crystals showed both rhombohedral and spheroidal morphologies (Fig. 6b–d). The morphology of crystals appears to change with increasing EPS concentrations. Spherical mineral formation was observed in the exponential-phase EPS solution (Fig. 6b) and was less frequent in the EPS solution from the early stationary phase (Fig. 6c). In the late-stationary-phase EPS solution, rhombohedrons represented the prevalent crystal morphology, while spherical minerals were absent (Fig. 6d).
3.6.2 Crystal mineralogy
The crystals' mineralogy was assessed by FT-IR microscopy performed on selected individual crystals of > 10 µm (Fig. S3). The results revealed that calcite was the only CaCO3 polymorph formed in the control solution. Calcite and vaterite formed in all EPS solutions tested. The FT-IR spectra revealed that all rhombohedrons and polycrystalline aggregates with “sharp edges” represent calcite polymorphs. In contrast, spheroidal crystals revealed a vaterite signature (Fig. S3).
3.6.3 Crystal size and distribution
The results from image analysis showed that a larger quantity of crystals precipitated in the stationary-phase (early and late) EPS solutions (Fig. 7) and that major differences were also observed in crystal size distribution (Fig. 7). A comparison of the class of small crystal sizes (< 50 µm) with the large crystal size class (> 50 µm) showed a clear trend of an increasing total number of small crystals in the stationary-phase EPS solutions compared to those formed in the EPS solutions from the exponential phase. The size reduction in the crystals at 18 and 36 mg L−1 (Fig. 7, early and late stationary phases) suggests a partial inhibitory effect of the EPS on the formation of calcium carbonate.
Our study demonstrates that the amount and properties of EPS change significantly (p value < 0.05) at the three different stages of Synechococcus growth in an artificial bloom experiment. Cells continuously produce EPS that increases in concentration and become more negatively charged in the stationary phase. We sampled this EPS over the exponential as well as early and late stationary phases and studied its role in carbonate mineral precipitation. Based on this, a conceptual model was developed to correlate the findings of this investigation with the potential EPS production of the naturally occurring picoplankton blooms and its possible involvement in whiting events. Though natural blooms experience a variety of factors that are not represented in the experiments described in this paper, the first part of the Discussion is focussing only on the experimental data, whereas the interaction of these basic processes with other biotic and abiotic factors acting in the environment is discussed afterwards.
4.1 Exponential growth phase
Macronutrients, such as nitrogen (N) and phosphorus (P), promote the initiation of cyanobacterial blooms (Reynolds and Walsby, 1975; Paerl, 2008; Xu et al., 2015). In our growth experiment, the beginning of the exponential phase (and the persistence of bloom) (Fig. 1a) was positively correlated with the high initial nutrient concentration in the medium (Table 1). Environmental factors such as water temperature, light intensity. hydrodynamics and availability of dissolved inorganic carbon (DIC) are also important determinants of cyanobacteria bloom development (Clark and Flynn, 2000; Dokulil and Teubner, 2000; Havens, 2008). Blooms can dramatically alter the supply of inorganic carbon for photosynthesis, which causes the pH to increase (Ibelings and Maberly, 1998). In the early exponential phase of our batch cultures, the high photosynthetic activity of cyanobacteria cultures resulted in fast pH increase, thereby reducing the total inorganic carbon of the grown medium. Light and CO2 are the sources of energy and carbon for cyanobacteria and are of critical importance for their growth (Takahashi et al., 2004). At pH 9 (Fig. 1b), the concentration of CO2 predicted is close to zero (< 1 µM), and the concentration is 475 µM (PHREEQC data). A similar scenario was observed in natural bloom occurrence: the population of cyanobacteria draws down the partial pressure of CO2 (pCO2) in the photic zone, increasing the surface water pH by up to 9–10 (Ibelings and Maberly, 1998; Verspagen et al., 2014), and CO2 concentration can become completely depleted or reach values close to zero (Maberly, 1996). Under extreme conditions, the concentration of can also become markedly reduced (Talling, 1976; Maberly, 1996). When the rate of photosynthesis is greater than the combined rate of resupply of CO2 from the atmosphere and DIC in the hypolimnion, deviation from the air equilibrium occurs, favouring CaCO3 precipitation. The pH of most aquatic systems ranges from 7.5–8.1 and keeps inorganic carbon primarily in the form of bicarbonate (O'Neil et al., 2012). In poorly buffered systems, such as highly productive lakes, the pH and speciation of DIC experience large fluctuations which vary widely on a scale from daily (diel) to episodic to seasonal (Maberly, 1996), with diel variations as high as two pH units and 60 µmol DIC L−1 (Maberly, 1996). Because CO2 favours the C3 photosynthesis (C3 cycle operation of Calvin–Beson cycle), the high pH of ∼ 10 in our growth medium could be associated with carbon limitation (Ibelings and Maberly, 1998; Verspagen et al., 2014).
To alleviate CO2 limitation, cyanobacteria have developed an efficient CO2-concentrating mechanism (CCM) (Aizawa and Miyachi, 1986; Badger and Price, 1992; Badger et al., 2002; Burnap et al., 2015) and can use bicarbonate as an inorganic carbon source for photosynthesis (Price et al., 1998; Giordano et al., 2005; Sandrini et al., 2016). By activating CCM, cyanobacteria concentrate CO2 by a factor of up to 1000 (Badger and Andrews, 1982; Badger et al., 2002; Price, 2011). CO2-deficient conditions experienced during the exponential phase of our growth experiment, coupled with the continuous cellular demand for inorganic carbon to support photosynthetic carbon fixation, likely led the cells to activate CCM. The predicted concentrations of CO2 and in the growth medium (PHREEQC data) in the early and late exponential phase infer that Synechococcus cells were actively transported across the membrane and accumulated DIC into the cell, where the pool was utilized to generate elevated CO2 levels around RuBisCO (ribulose-1,5-bisphosphate carboxylase/oxygenase; Badger et al., 2002; Price et al., 2008). The CCM of cyanobacteria accomplishes very high carbon-concentrating factors (Cexternal : Cinternal) at deficient specificity factors of RuBisCO (Tortell, 2000; Tortell et al., 2000). CCM involves bicarbonate transporters in the cell membrane, intracellular (iCA) and extracellular (eCA) carbonic anhydrase enzymes, and concentrated RuBisCO activity located in carboxysomes (Badger et al., 2006; Price et al., 2008; Rae et al., 2013). CA converts to CO2 (Badger and Price, 1994), which increases the external pH in close proximity to the cells. In our study, eCA activity was ∼ 1.6–2.0 times higher during the exponential growth phase and reduced gradually through the stationary phase (Fig. S1). The strongly stained band only present in the exponential-phase EPS at around 45–47 kDa (Fig. 4, lanes 2, 3) may be indicative of eCA, as reported by Kupriyanova et al. (2018), but this requires further investigation. Another plausible explanation for the 45–47 kDa band could be the presence of chlorophyll f synthase, which typically migrates at around 46 kDa (Shen et al., 2019). Similarly, Yang et al. (2023) measured the CA anhydrase in solution over a 30 d growth experiment with Synechococcus PCC7942 and reported an increase over the lag phase and large fluctuations over the exponential phase. During the stationary phase, CA did not vary greatly, but a minor decrease was recorded in the late stationary phase (Yang et al., 2023). In our study, the higher eCA activity recorded could explain the strongly stained ∼ 45–47-kDa band that was only identified in our SDS–PAGE gels of EPS produced during the exponential phase (Fig. 4, lanes 2–3). The molecular weight (MW) of this band is similar to a 42–43 kDa eCA previously identified by Kupriyanova et al. (2018) and discussed by Martinho de Brito et al. (2022). As explained in the Results, Sect. 3.4.3, we cannot exclude that the band is chlorophyll f synthase, which seems to show up around 46 kDa. A more substantiated demonstration of the identity of the SDS–PAGE band will require other approaches (beyond the scope of the present study), such as micro-sequencing of the purified 43 kDa band or the use of a CA-specific antibody.
Active uptake of and accumulation of Ci species require the input of metabolic energy, e.g. ATP (BCT1 transporter), NADPH or reduced ferredoxin (CO2 uptake), or coupling to an electrochemical Na+ gradient (SbtA or BicA transport) (Badger et al., 2002; Price et al., 2008). This energetic cost may therefore reflect the growth rates achieved. Synechococcus PCC7942 grows at > 80 % of its maximum growth rate when provided with as its main inorganic carbon source (Miller et al., 1984). During the exponential phase, the carbon production from photosynthesis is mainly allocated to biomass production, not to EPS synthesis. During this phase (Fig. 2 and Table 2), the small amount of EPS produced comprises a higher proportion of sugars and lower amounts of protein and GAG compared to EPS produced during the stationary phase (Fig. 3 and Table 3). Our study indicates that rather than proteins, sugars are the major component in all EPS extracts. This finding is supported by the data obtained from FT-IR analysis (Fig. 3). The smaller amount of negatively charged groups of the EPS during the exponential phase (Fig. 4, lanes 2–3) compared to those of EPS from the early and late stationary phases (Fig. 4, lanes 4–7) resulted in weak to moderate inhibitory capacity (Fig. 5a). The main phenomenon observed in the pH-drift assay (Fig. 5) is the initial Ca binding to negatively charged groups in EPS prior to carbonate addition, which initiates CaCO3 precipitation. This results in a decrease in pH. The pH-drift assay showed that EPS from the exponential phase (Fig. 5c) has a larger plateau and thus a lower calcium-binding capacity than the EPS from the stationary phase. This observation was further corroborated by the forced precipitation experiments, which showed that EPS from the exponential phase induced a small amount of mostly large-sized carbonate crystals (> 50 µm), very similar to the negative control experiment (Fig. 7) (Martinho de Brito et al., 2022). The high concentration of Ca2+ in the medium (83 µM) compared to the initial (Ca2+) at the beginning of the experiment (103 µM) indicates that a small amount of calcium ions was bound to negatively charged functional groups of EPS (Table 1; see (Ca2+)).
In our batch experiment, cells continue to grow exponentially for ∼ 20 d of cultivation. At this point, cultures reached the maximum cell density (Fig. 1a), and pH values ranged between 10–11 (Fig. 1b). Based on our calculations, under these alkaline conditions, CO2 was completely depleted (1.7 × 10⁻³ µM) in the growth medium, whereas was extremely low (∼ 79 µM). Thus, the dominant inorganic carbon speciation was (421 µM). Because cells cannot take up , and concentration seems to be insufficient to cover the carbon demands of cyanobacterial growth, we assume that this may have been the cause of cell numbers starting to level off (Fig. 1a, early stationary phase). Consequently, cultures entered a stationary state due to a lack of inorganic carbon availability required to increase cell population (Miller et al., 1984; Mayo et al., 1989; Verspagen et al., 2014). The excess of nutrients measured in the medium in the late exponential phase (Table 1) suggested that the specific growth rate was not limited by nutrient availability but by a rather low level of CO2 carbon content.
4.2 Early stationary phase
Insufficient CO2 availability is considered to be the external stress factor constraining the growth rate of cyanobacteria (Maberly, 1996; Hein, 1997; Ibelings and Maberly, 1998), and low () could sustain a constant population density for at least ∼ 40 d (see Fig. 1a, stationary phase). Our results suggest that at this point carbon fixation was allocated to EPS synthesis, not to biomass production (Miller et al., 1984). Increased EPS production is usually associated with external stress factors (Rossi and De Philippis, 2015), including high-pH conditions (Martinho de Brito et al., 2022). Moreover, metabolic stress may also alter the composition of EPS (Babele et al., 2019; Martinho de Brito et al., 2022). In the present study, the negative functional group abundance increased, resulting in a higher acidity of EPS (Fig. 4, lanes 4–5) due to an increase in protein and sulfated glycan (GAG) (Table 3). In the pH conditions of the early stationary phase, all the functional groups of the EPS matrix are deprotonated and are able to bind calcium ions present in the solution (Fig. 5b) (Dupraz and Visscher, 2005; Braissant et al., 2007; Dittrich and Sibler, 2010). This EPS binds calcium more efficiently than nanometric nuclei in formation (if their formation is thermodynamically favoured). We suggest that the increased calcium-binding capacity of the EPS probably accounts for the lower Ca2+ concentration measured in the medium (Table 2; see (Ca2+)). In our in vitro-forced precipitation assay, we measure the second effect, the inhibitory one (mineral-binding effect), which results in the production of small-sized calcium carbonate crystals (< 50 µm), in comparison to what happens in the exponential phase (Fig. 7).
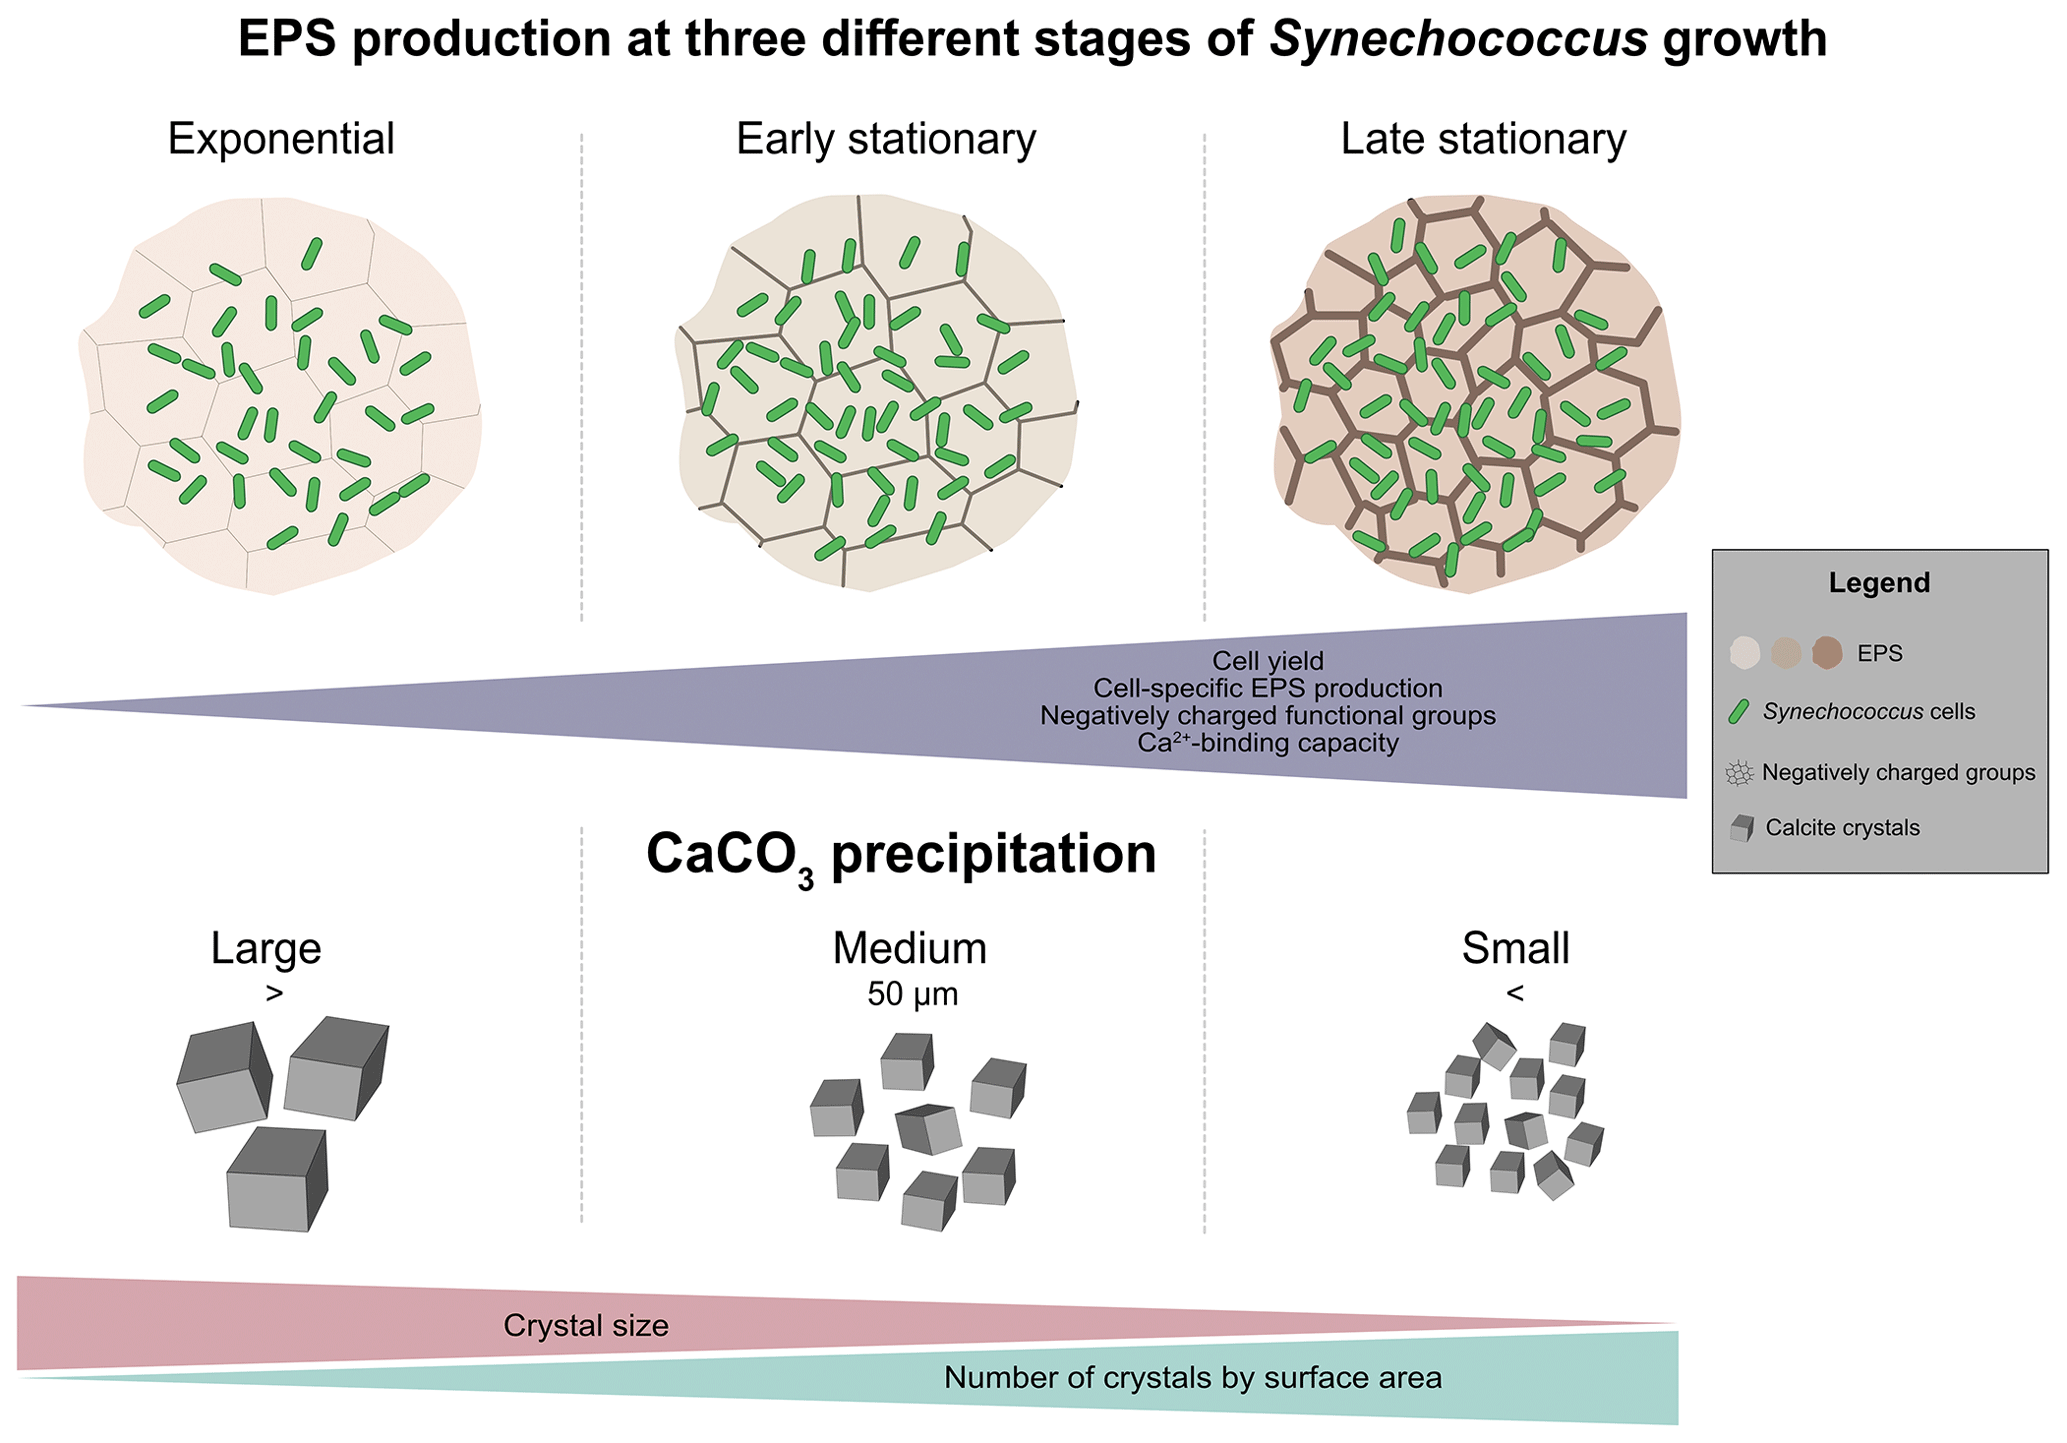
Figure 8Conceptual diagram of proposed EPS-supported carbonate precipitation mechanism explaining the origin of whiting events.
4.3 Late stationary phase
As mentioned above, we assume that the continuous increase in EPS production over the late stationary phase, including an overall augmentation of negatively charged functional groups (Fig. 4, lanes 6–7), including GAG content (Table 2), might be a specific response to a stress scenario. As expected, the present study shows that the greater amount of negatively charged functional groups of EPS from the late stationary phase (Fig. 4, lanes 6–7) resulted in a higher Ca-binding capacity than exponential- and early-stationary-phase EPS (Fig. 5c). Our forced precipitation experiments showed that minerals produced in the late-stationary-EPS solutions are smaller and more abundant than those formed in EPS solutions from the early stationary phase (Fig. 7). Under natural conditions, when the Ca2+ supply is continuous, the crystals may or may not continue to grow, depending on the physical space within the EPS matrix (Dupraz et al., 2009). Based on the high concentration of nitrate (4720 µM) measured in the late stationary phase (Table 1), we assume that the abundance of this nutrient supported the persistence of the stationary phase, i.e. similar to a prolonged bloom in natural conditions. The death phase was not observed in our 56 d long experiment. Given that our cultures were continuously stirred, we can assume that light was not limiting cyanobacterial growth. Furthermore, in natural blooms, the increase in population density may affect cells at greater depth through self-shading by decreasing the light available for photosynthesis (Townsend et al., 1994). Yet, cyanobacteria (including Synechococcus) are known to be well-adapted to low-light conditions (Campbell and Carpenter, 1986; Palenik, 2001; Callieri et al., 2011). Additionally, the presence of sulfated constituents on late-stationary-phase EPS contributes to a higher negative charge of the matrix and higher Ca-binding potential (Decho and Kawaguchi, 2003; Skoog et al., 2022) compared to EPS extracted in the exponential phase, which contained significantly lower GAG (Table 2). The present study shows that the greater amount of negatively charged functional groups of EPS from the late stationary phase (Fig. 4, lanes 6–7) resulted in a higher Ca-binding capacity than exponential- and early-stationary-phase EPS (Fig. 5c). Our forced precipitation experiments showed that minerals produced in the late stationary EPS solutions are smaller and more abundant than those formed in EPS solutions from the early stationary phase (Fig. 7), suggesting an increased inhibitory ability of the late stationary EPS.
4.4 Natural bloom and formation of whitings – conceptual model
Our observations made during exponential and stationary phases can be applied to generate a conceptual model of EPS properties during a Synechococcus bloom event (Fig. 8a–c). The onset of a bloom starts with an increase in cell numbers, with high values in spring–summer (exceeding 105–107 cells mL−1) and lower values in winter months (< 105 cells mL−1) in both marine (Agawin et al., 1998; Phlips et al., 1999) and freshwater (Maeda et al., 1992; Tai and Palenik, 2009) environments. This resembles the exponential growth phase in our study (Fig. 1, exponential phase). We predict that during the initial phase of a natural bloom, there is little EPS production: cells grow relatively quickly, and the carbon fixed during photosynthesis is predominantly allocated to biomass production (Fig. 8a). The fast growth is followed by a phase during which cell numbers level off, typically due to stress conditions, which is represented by the early stationary phase in our study. Under certain conditions, blooms can be sustained for weeks and possibly longer (Anderson et al., 2002; Havens, 2008; Zhao et al., 2013), similar to what we observed in our growth experiments (Fig. 1a, early stationary phase). The maintenance of a bloom requires continuous input of nutrients, which is also the case in our experiment (Table 1), or in the case of natural systems, a turnover from lysing cells recycled by other microbes. During this phase, we did not observe a significant increase in cell density, but the production of EPS continued at a disproportionately high rate (Fig. 8b and c). Our findings are in agreement with the lab studies using diatom cultures, which show that EPS production is low during exponential growth and increases in the stationary phase (Myklestad and Haug, 1972; Myklestad et al., 1989; Bhosle et al., 1995). These authors reported that nutrient-deficient conditions enhanced the production of EPS over the growth phases. If carbon fixation continues and some critically required nutrient is lacking from the growth medium, most likely the phototrophic organisms produce carbohydrate reservoirs (Ciebiada et al., 2020). These include storage polymers like glycogen and the production of other carbohydrate-rich compounds, including EPS (De Philippis et al., 1996, 2001; Decho and Gutierrez, 2017). The decline in blooms in natural environments is typically associated with nutrients, low or high light intensity, grazing, or viral infection. Under these stressful conditions, an increase in EPS production by the phyto-/picoplankton community may be expected.
Synechococcus spp. blooms can cause whiting events (Thompson, 2000), characterized by the presence of large amounts of CaCO3 minerals in surface water. Various mechanisms have been proposed for this phenomenon, including chemical and physical processes (Shinn et al., 1989; Larson and Mylroie, 2014), as well as biologically mediated precipitation (Thompson and Ferris, 1990; Robbins and Blackwelder, 1992; Stanton et al., 2023). However, no consensus has been reached on the precise cause of these events. Carefully transporting the results from forced precipitation experiments to a whiting event, we suggest that early in the bloom (Fig. 8a), relatively large CaCO3 crystals form, provided sufficient Ca2+ is available (Fig. 8d). As the bloom continues to grow, progressively the larger quantity of negatively charged functional groups in the EPS provides more cation-binding sites and thus inhibits calcium carbonate precipitation largely. Depending on the three-dimensional structure of the EPS and surface properties (Wang et al., 2012), nucleation may yield smaller CaCO3 crystals (Fig. 8). If this occurs, then the production of a more negatively charged matrix (largely contributed by the enrichment in sulfated polysaccharides) may offer some selective advantage to the cyanobacteria population by inhibiting and/or delaying mineral precipitation and by reducing crystal size formed around the cells. This might result in slow sinking rates, extending the residence time of the cyanobacterial community in the photic zone. If the bloom occurrence is short (e.g. similar to 14–28 d in our growth experiment), minerals making up the whiting will be relatively larger. Consequently, the aggregates of cyanobacteria, EPS and CaCO3 minerals may sink faster because mineral precipitation in EPS increases the cyanobacterial-specific density severalfold. The Synechococcus-specific density (ρ) is 1.040 g cm−3 (Reynolds, 1987), near-neutrally buoyant, whereas ρcalcite is 2.710 g cm−3 (Dean, 1999). The production of larger amounts of more negatively charged EPS may act as a protection mechanism against carbonate formation in the vicinity of the cell wall (Martinez et al., 2010; Bundeleva et al., 2012), thus allowing the organisms to reside longer in the photic zone. Interestingly, the production of EPS that contained sulfated groups among bacteria seems to be exclusive to cyanobacteria (Pereira et al., 2009; Maeda et al., 2021). Maeda et al. (2021) reported that the cyanobacterium Synechocystis 6803 produced large amounts of GAG compounds during an experimental bloom formation. The authors suggested that these constituents can be advantageous for the development of surface bloom, as it may increase the buoyancy, permitting cells to migrate upward rapidly when the water column is stable (Walsby et al., 1995). Thus, GAG production may be considered to be an alternative for organisms that lack gas vesicles to remain longer in the photic zone (Maeda et al., 2021). The negative charge of EPS produced containing high sulfated content also protects the community against viral infection (Baba et al., 1988; Ghosh et al., 2009). Therefore, the production of GAG by pelagic cyanobacteria contributes to stress tolerance and viral infectivity, helping in the persistence of bloom. In our growth experiments, a decline in cell numbers was not observed, which would represent the end of the bloom. In the natural environment, nutrient depletion, grazing or viral lysis/infection are the most likely causes of terminating a bloom (Gons et al., 2002). The cell lysis releases organic matter, which supports the growth of heterotrophic bacteria (Kjelleberg et al., 1987; Hagström et al., 1988; Kieft et al., 2021). Photosynthetically derived organic carbon is one of the major carbon and energy sources for heterotrophic bacteria (Allgaier et al., 2008). These heterotrophs can degrade EPS and liberate bound Ca2+ (Visscher et al. 1998; Ionescu et al., 2015; Diaz et al., 2017). In addition, microbial respiration will produce , increasing the saturation index of CaCO3, and may enhance the whiting (Fig. 8). Although our model is (somewhat) largely theoretical at this stage and explores the role of one picoplankton species, its merit is to focus on an overlooked actor of whiting events, the EPS. Furthermore, it provides a conceptual framework to work with, for designing novel experiments and measurements both in natural systems and at the lab bench, to validate the molecular mechanisms involved in microbial-bloom-associated CaCO3 formation in marine and lacustrine models.
All raw data can be provided by the corresponding author upon request.
The supplement related to this article is available online at: https://doi.org/10.5194/bg-20-3165-2023-supplement.
MMdB, IB and PTV designed the study in a project directed by PTV, IB and EV; MMdB, IB, PTV, FM, AW and LP developed the methodology; MMdB and IB carried out the laboratory measurements; MMdB, PTV and IB analysed the data; MMdB wrote the manuscript draft with significant contributions by PTV and IB. MMdB, PTV, IB, EV, FM, AW and LP reviewed and edited the manuscript. All authors have read and agreed to the published version of the paper.
The contact author has declared that none of the authors has any competing interests.
Publisher's note: Copernicus Publications remains neutral with regard to jurisdictional claims in published maps and institutional affiliations.
We thank Nelly Debrosse (Bourgogne Franche-Comté University, Dijon), Adrien Force (Bourgogne Franche-Comté University, Dijon) and Elodie Cognard (Bourgogne Franche-Comté University, Dijon) for helping with the measurements; Michel Picquet and Christine Stern (ICMUB Institut de Chimie Moléculaire, Bourgogne Franche-Comté University, Dijon, France) for their technical assistance with FT-IR analysis; and Christophe Loup and Nadia Crini (Laboratoire Chrono-environnement, UMR CNRS 6249, Bourgogne Franche-Comté University, Besançon, France) for their technical assistance with ion chromatography and ICP analyses. The authors would like to thank the reviewers whose work has helped to improve the paper. All individuals included in this section have consented to the acknowledgement.
This study is a contribution of the SEDS and SAMBA teams of Biogeosciences laboratory (Bourgogne Franche-Comté University, Dijon, France) to the I-SITE project UB18016-BGSIS.
This paper was edited by Cindy De Jonge and reviewed by Sven Tobias-Hunefeld and one anonymous referee.
Addadi, L. and Weiner, S.: Interactions between acidic proteins and crystals: stereochemical requirements in biomineralization, P. Natl. Acad. Sci. USA, 82, 4110–4114, 1985.
Agawin, N., Duarte, C., and Agustí, S.: Growth and abundance of Synechococcus sp. in a Mediterranean Bay: seasonality and relationship with temperature, Mar. Ecol.-Prog. Ser., 170, 45–53, https://doi.org/10.3354/meps170045, 1998.
Aizawa, K. and Miyachi, S.: Carbonic anhydrase and CO2 concentrating mechanisms in microalgae and cyanobacteria, FEMS Microbiol. Lett., 39, 215–233, https://doi.org/10.1111/j.1574-6968.1986.tb01860.x, 1986.
Albeck, S., Aizenberg, J., Addadi, L., and Weiner, S.: Interactions of various skeletal intracrystalline components with calcite crystals, J. Am. Chem. Soc., 115, 11691–11697, 1993.
Allgaier, M., Riebesell, U., Vogt, M., Thyrhaug, R., and Grossart, H.-P.: Coupling of heterotrophic bacteria to phytoplankton bloom development at different pCO2 levels: a mesocosm study, Biogeosciences, 5, 1007–1022, https://doi.org/10.5194/bg-5-1007-2008, 2008.
Allen, M. M.: Simple Conditions for Growth of Unicellular Blue-Green Algae on Plates, J. Phycol., 4, 1–4, 1968.
Anderson, D. M., Glibert, P. M., and Burkholder, J. M.: Harmful algal blooms and eutrophication: Nutrient sources, composition, and consequences, Estuaries, 25, 704–726, https://doi.org/10.1007/BF02804901, 2002.
Baba, M., Snoeck, R., Pauwels, R., and De Clercq, E.: Sulfated polysaccharides are potent and selective inhibitors of various enveloped viruses, including herpes simplex virus, cytomegalovirus, vesicular stomatitis virus, and human immunodeficiency virus, Antimicrob Agents Chemother, 32, 1742–1745, 1988.
Babele, P. K., Kumar, J., and Chaturvedi, V.: Proteomic de-regulation in cyanobacteria in response to abiotic stresses, Front. Microbiol., 10, 1315, https://doi.org/10.3389/fmicb.2019.01315, 2019.
Badger, M. R. and Andrews, T. J.: Photosynthesis and Inorganic Carbon Usage by the Marine Cyanobacterium, Synechococcus sp, Plant Physiol., 70, 517–523, https://doi.org/10.1104/pp.70.2.517, 1982.
Badger, M. R. and Price, G. D.: The CO2 concentrating mechanism in cyanobactiria and microalgae, Physiol. Plantarum, 84, 606–615, 1992.
Badger, M. R. and Price, G. D.: The role of carbonic anhydrase in photosynthesis, Annu. Rev. Plant Biol., 45, 369–392, 1994.
Badger, M. R., Hanson, D., and Price, G. D.: Evolution and diversity of CO2 concentrating mechanisms in cyanobacteria, Funct. Plant Biol., 29, 161–173, 2002.
Badger, M. R., Price, G. D., Long, B. M., and Woodger, F. J.: The environmental plasticity and ecological genomics of the cyanobacterial CO2 concentrating mechanism, J. Exp. Bot., 57, 249–265, https://doi.org/10.1093/jxb/eri286, 2006.
Bhosle, N. B., Sawant, S. S., Garg, A., and Wagh, A. B.: Isolation and Partial Chemical Analysis of Exopolysaccharides from the Marine Fouling Diatom Navicula subinflata, Bot. Mar., 38, https://doi.org/10.1515/botm.1995.38.1-6.103, 1995.
Borman, A. H., Jong, E. W., Huizinga, M., Kok, D. J., Westbroek, P., and Bosch, L.: The Role in CaCO3 Crystallization of an Acid Ca2+-Binding Polysaccharide Associated with Coccoliths of Emiliania huxleyi, Eur. J. Biochem., 129, 179–183, https://doi.org/10.1111/j.1432-1033.1982.tb07037.x, 1982.
Braissant, O., Decho, A. W., Dupraz, C., Glunk, C., Przekop, K. M., and Visscher, P. T.: Exopolymeric substances of sulfate-reducing bacteria: interactions with calcium at alkaline pH and implication for formation of carbonate minerals, G eobiology, 5, 401–411, 2007.
Bundeleva, I. A., Shirokova, L. S., Bénézeth, P., Pokrovsky, O. S., Kompantseva, E. I., and Balor, S.: Calcium carbonate precipitation by anoxygenic phototrophic bacteria, Chem. Geol., 291, 116–131, https://doi.org/10.1016/j.chemgeo.2011.10.003, 2012.
Bundeleva, I. A., Shirokova, L. S., Pokrovsky, O. S., Bénézeth, P., Ménez, B., Gérard, E., and Balor, S.: Experimental modeling of calcium carbonate precipitation by cyanobacterium Gloeocapsa sp., Chem. Geol., 374–375, 44–60, https://doi.org/10.1016/j.chemgeo.2014.03.007, 2014.
Burnap, R., Hagemann, M., and Kaplan, A.: Regulation of CO2 Concentrating Mechanism in Cyanobacteria, Life, 5, 348–371, https://doi.org/10.3390/life5010348, 2015.
Callieri, C. and Stockner, J.: Picocyanobacteria success in oligotrophic lakes: fact or fiction?, J. Limnol., 59, 72, https://doi.org/10.4081/jlimnol.2000.72, 2000.
Callieri, C., Lami, A., and Bertoni, R.: Microcolony Formation by Single-Cell Synechococcus Strains as a Fast Response to UV Radiation, Appl. Environ. Microbiol., 77, 7533–7540, https://doi.org/10.1128/AEM.05392-11, 2011.
Campbell, L. and Carpenter, E. J.: Diel patterns of cell division in marine Synechococcus spp. (Cyanobacteria): use of the frequency of dividing cells technique to measure growth rate, Mar. Ecol.-Prog. Ser., 32, 139–148, 1986.
Ciebiada, M., Kubiak, K., and Daroch, M.: Modifying the Cyanobacterial Metabolism as a Key to Efficient Biopolymer Production in Photosynthetic Microorganisms, Int. J. Mol. Sci., 21, 7204, https://doi.org/10.3390/ijms21197204, 2020.
Clark, D. R. and Flynn, K. J.: The relationship between the dissolved inorganic carbon concentration and growth rate in marine phytoplankton, P. R. Soc. Lond. B, 267, 953–959, https://doi.org/10.1098/rspb.2000.1096, 2000.
Coates, J.: Interpretation of infrared spectra, a practical approach, John Wiley & Sons, Ltd, Chichester, UK, https://doi.org/10.1002/9780470027318.a5606, 2000.
Coello-Camba, A. and Agustí, S.: Picophytoplankton Niche Partitioning in the Warmest Oligotrophic Sea, Front. Mar. Sci., 8, 651877, https://doi.org/10.3389/fmars.2021.651877, 2021.
Dean, J. A.: Table 3.21 Physical constants of inorganic compounds, Lange's Handbook of Chemistry, McGraw-Hill Inc., New York, 1999.
De Philippis, R., Sili, C., and Vincenzini, M.: Response of an exopolysaccharide-producing heterocystous cyanobacterium to changes in metabolic carbon flux, J. Appl. Phycol., 8, 275–281, 1996.
De Philippis, R., Sili, C., Paperi, R., and Vincenzini, M.: Exopolysaccharide-producing cyanobacteria and their possible exploitation: a review, J. Appl. Phycol., 13, 293–299, 2001.
Decho, A. W. and Gutierrez, T.: Microbial extracellular polymeric substances (EPSs) in ocean systems, Front. Microbiol., 8, 922, 2017.
Decho, A. W. and Kawaguchi, T.: Extracellular polymers (EPS) and calcification within modern marine stromatolites, in: Fossil and Recent Biofilms, edited by: Krumbein, W. E., Paterson, D. M., and Zavarzin, G. A., Springer, Dordrecht, 227–240, https://doi.org/10.1007/978-94-017-0193-8_14, 2003.
Diaz, M. R., Eberli, G. P., Blackwelder, P., Phillips, B., and Swart, P. K.: Microbially mediated organomineralization in the formation of ooids, Geology, 45, 771–774, https://doi.org/10.1130/G39159.1, 2017.
Dittrich, M. and Obst, M.: Are picoplankton responsible for calcite precipitation in lakes?, AMBIO, 33, 559–564, 2004.
Dittrich, M. and Sibler, S.: Calcium carbonate precipitation by cyanobacterial polysaccharides, Geological Society, London, Special Publications, 336, 51–63, 2010.
Dittrich, M., Müller, B., Mavrocordatos, D., and Wehrli, B.: Induced calcite precipitation by cyanobacterium Synechococcus, Acta Hydroch. Hydrob., 31, 162–169, 2003.
Dokulil, M. T. and Teubner, K.: Cyanobacterial dominance in lakes, Hydrobiologia, 438, 1–12, https://doi.org/10.1023/A:1004155810302, 2000.
Dubois, M., Gilles, K. A., Hamilton, J. K., Rebers, P. t, and Smith, F.: Colorimetric method for determination of sugars and related substances, Anal. Chem., 28, 350–356, 1956.
Dupraz, C. and Visscher, P. T.: Microbial lithification in marine stromatolites and hypersaline mats, Trends Microbiol., 13, 429–438, 2005.
Dupraz, C., Reid, R. P., Braissant, O., Decho, A. W., Norman, R. S., and Visscher, P. T.: Processes of carbonate precipitation in modern microbial mats, Earth-Sci. Rev., 96, 141–162, https://doi.org/10.1016/j.earscirev.2008.10.005, 2009.
Ghosh, T., Chattopadhyay, K., Marschall, M., Karmakar, P., Mandal, P., and Ray, B.: Focus on antivirally active sulfated polysaccharides: From structure-activity analysis to clinical evaluation, Glycobiology, 19, 2–15, 2009.
Giordano, M., Beardall, J., and Raven, J. A.: CO2 Concentrating Mechanisms in Algae: Mechanisms, Environmental Modulation, and Evolution, Annu. Rev. Plant Biol., 56, 99–131, https://doi.org/10.1146/annurev.arplant.56.032604.144052, 2005.
Gons, H. J., Ebert, J., Hoogveld, H. L., Takkenberg, W., and Woldringh, C. J.: Observations on cyanobacterial population collapse in eutrophic lake water, Antonie Van Leeuwenhoek, 81, 319–326, https://doi.org/10.1023/a:1020595408169, 2002.
Hagström, Å., Azam, F., Andersson, A., Wikner, J., and Rassoulzadegan, F.: Microbial loop in an oligotrophic pelagic marine ecosystem: possible roles of cyanobacteria and nanoflagellates in the organic fluxes, Mar. Ecol.-Prog. Ser., 49, 171–178, https://doi.org/10.3354/meps049171, 1988.
Havens, K. E.: Cyanobacteria blooms: effects on aquatic ecosystems, Adv. Exp. Med. Biol., 619, 733–747, https://doi.org/10.1007/978-0-387-75865-7_33, 2008.
Hein, M.: Inorganic carbon limitation of photosynthesis in lake phytoplankton, Freshwater Biol., 37, 545–552, https://doi.org/10.1046/j.1365-2427.1997.00180.x, 1997.
Heisler, J., Glibert, P. M., Burkholder, J. M., Anderson, D. M., Cochlan, W., Dennison, W. C., Dortch, Q., Gobler, C. J., Heil, C. A., Humphries, E., Lewitus, A., Magnien, R., Marshall, H. G., Sellner, K., Stockwell, D. A., Stoecker, D. K., and Suddleson, M.: Eutrophication and harmful algal blooms: A scientific consensus, Harmful Algae, 8, 3–13, https://doi.org/10.1016/j.hal.2008.08.006, 2008.
Hodell, D. A., Schelske, C. L., Fahnenstiel, G. L., and Robbins, L. L.: Biologically induced calcite and its isotopic composition in Lake Ontario, Limnol. Oceanogr., 43, 187–199, 1998.
Huisman, J., Codd, G. A., Paerl, H. W., Ibelings, B. W., Verspagen, J. M. H., and Visser, P. M.: Cyanobacterial blooms, Nat. Rev. Microbiol., 16, 471–483, https://doi.org/10.1038/s41579-018-0040-1, 2018.
Ibelings, B. W. and Maberly, S. C.: Photoinhibition and the availability of inorganic carbon restrict photosynthesis by surface blooms of cyanobacteria, Limnol. Oceanogr., 43, 408–419, 1998.
Ionescu, D., Spitzer, S., Reimer, A., Schneider, D., Daniel, R., Reitner, J., de Beer, D., and Arp, G.: Calcium dynamics in microbialite-forming exopolymer-rich mats on the atoll of Kiritimati, Republic of Kiribati, Central Pacific, Geobiology, 13, 170–180, https://doi.org/10.1111/gbi.12120, 2015.
Kamennaya, N., Ajo-Franklin, C., Northen, T., and Jansson, C.: Cyanobacteria as Biocatalysts for Carbonate Mineralization, Minerals, 2, 338–364, https://doi.org/10.3390/min2040338, 2012.
Kansiz, M., Heraud, P., Wood, B., Burden, F., Beardall, J., and McNaughton, D.: Fourier Transform Infrared microspectroscopy and chemometrics as a tool for the discrimination of cyanobacterial strains, Phytochemistry, 52, 407–417, https://doi.org/10.1016/S0031-9422(99)00212-5, 1999.
Kavita, K., Mishra, A., and Jha, B.: Isolation and physico-chemical characterisation of extracellular polymeric substances produced by the marine bacterium Vibrio parahaemolyticus, Biofouling, 27, 309–317, https://doi.org/10.1080/08927014.2011.562605, 2011.
Kawaguchi, T. and Decho, A. W.: Isolation and biochemical characterization of extracellular polymeric secretions (EPS) from modern soft marine stromatolites (Bahamas) and its inhibitory effect on CaCO3 precipitation, Prep. Biochem. Biotech., 32, 51–63, 2002.
Kieft, B., Li, Z., Bryson, S., Hettich, R. L., Pan, C., Mayali, X., and Mueller, R. S.: Phytoplankton exudates and lysates support distinct microbial consortia with specialized metabolic and ecophysiological traits, P. Natl. Acad. Sci. USA, 118, e2101178118, https://doi.org/10.1073/pnas.2101178118, 2021.
Kjelleberg, S., Hermansson, M., Marden, P., and Jones, G. W.: The transient phase between growth and non-growth of heterotrophic bacteria, with emphasis on the marine environment, Annu. Rev. Microbiol., 41, 25–49, 1987.
Kupriyanova, E. V. and Pronina, N. A.: Carbonic anhydrase: Enzyme that has transformed the biosphere, Russ. J. Plant Physl.+, 58, 197–209, https://doi.org/10.1134/S1021443711020099, 2011.
Kupriyanova, E. V., Sinetova, M. A., Bedbenov, V. S., Pronina, N. A., and Los, D. A.: Putative extracellular α-Class carbonic anhydrase, EcaA, of Synechococcus elongatus PCC 7942 is an active enzyme: A sequel to an old story, Microbiology, 164, 576–586, 2018.
Larson, E. B. and Mylroie, J. E.: A review of whiting formation in the Bahamas and new models, Carbonate. Evaporite., 29, 337–347, 2014.
Liu, L., Huang, Q., and Qin, B.: Characteristics and roles of Microcystis extracellular polymeric substances (EPS) in cyanobacterial blooms: a short review, J. Freshwater Ecol., 33, 183–193, https://doi.org/10.1080/02705060.2017.1391722, 2018.
Lürling, M., Mello, M. M. e, van Oosterhout, F., de Senerpont Domis, L., and Marinho, M. M.: Response of Natural Cyanobacteria and Algae Assemblages to a Nutrient Pulse and Elevated Temperature, Front. Microbiol., 9, 1851, https://doi.org/10.3389/fmicb.2018.01851, 2018.
Maberly, S. C.: Diel, episodic and seasonal changes in pH and concentrations of inorganic carbon in a productive lake, Freshwater Biol., 35, 579–598, https://doi.org/10.1111/j.1365-2427.1996.tb01770.x, 1996.
Maeda, H., Kawai, A., and Tilzer, M. M.: The water bloom of Cyanobacterial picoplankton in Lake Biwa, Japan, Hydrobiologia, 248, 93–103, https://doi.org/10.1007/BF00006077, 1992.
Maeda, K., Okuda, Y., Enomoto, G., Watanabe, S., and Ikeuchi, M.: Biosynthesis of a sulfated exopolysaccharide, synechan, and bloom formation in the model cyanobacterium Synechocystis sp. strain PCC 6803, Elife, 10, e66538, https://doi.org/10.7554/eLife.66538, 2021.
Marin, F., Corstjens, P., de Gaulejac, B., de Vrind-De Jong, E., and Westbroek, P.: Mucins and molluscan calcification: molecular characterization of mucoperlin, a novel mucin-like protein from the nacreous shell layer of the fan mussel Pinna nobilis (Bivalvia, Pteriomorphia), J. Biol. Chem., 275, 20667–20675, 2000.
Martinez, R. E., Gardés, E., Pokrovsky, O. S., Schott, J., and Oelkers, E. H.: Do photosynthetic bacteria have a protective mechanism against carbonate precipitation at their surfaces?, Geochim. Cosmochim. Ac., 74, 1329–1337, https://doi.org/10.1016/j.gca.2009.11.025, 2010.
Martinho de Brito, M., Bundeleva, I., Marin, F., Vennin, E., Wilmotte, A., Plasseraud, L., and Visscher, P. T.: Effect of Culture pH on Properties of Exopolymeric Substances from Synechococcus PCC7942: Implications for Carbonate Precipitation, Geosciences, 12, 210, https://doi.org/10.3390/geosciences12050210, 2022.
Marvasi, M., Visscher, P. T., and Casillas Martinez, L.: Exopolymeric substances (EPS) from Bacillus subtilis: polymers and genes encoding their synthesis, FEMS Microbiol. Lett., 313, 1–9, 2010.
Mayo, W. P., Elrifi, I. R., and Turpin, D. H.: The Relationship between Ribulose Bisphosphate Concentration, Dissolved Inorganic Carbon (DIC) Transport and DIC-Limited Photosynthesis in the Cyanobacterium Synechococcus leopoliensis Grown at Different Concentrations of Inorganic Carbon, Plant Physiol., 90, 720–727, https://doi.org/10.1104/pp.90.2.720, 1989.
Miller, A. G., Turpin, D. H., and Canvin, D. T.: Growth and Photosynthesis of the Cyanobacterium Synechococcus leopoliensis in – Limited Chemostats, Plant Physiol., 75, 1064–1070, https://doi.org/10.1104/pp.75.4.1064, 1984.
Mitterer, R. M. and Cunningham, R.: The interaction of natural organic matter with grain surfaces: implications for calcium carbonate precipitation, Soc. Econ. Paleont. Mineral., Spec. Publ., 36, 17–31, 1985.
Murphy, L. S. and Haugen, E. M.: The distribution and abundance of phototrophic ultraplankton in the North Atlantic, Limnol. Oceanogr., 30, 47–58, https://doi.org/10.4319/lo.1985.30.1.0047, 1985.
Myklestad, S. and Haug, A.: Production of carbohydrates by the marine diatom Chaetoceros affinis var. willei (Gran) Hustedt. I. Effect of the concentration of nutrients in the culture medium, J. Exp. Mar. Biol. Ecol., 9, 125–136, 1972.
Myklestad, S., Holm-Hansen, O., Vårum, K. M., and Volcani, B. E.: Rate of release of extracellular amino acids and carbohydrates from the marine diatom Chaetoceros affinis, J. Plankton Res., 11, 763–773, https://doi.org/10.1093/plankt/11.4.763, 1989.
Obst, M., Dynes, J. J., Lawrence, J. R., Swerhone, G. D., Benzerara, K., Karunakaran, C., Kaznatcheev, K., Tyliszczak, T., and Hitchcock, A. P.: Precipitation of amorphous CaCO3 (aragonite-like) by cyanobacteria: a STXM study of the influence of EPS on the nucleation process, Geochim. Cosmochim. Ac., 73, 4180–4198, 2009.
O'Neil, J. M., Davis, T. W., Burford, M. A., and Gobler, C. J.: The rise of harmful cyanobacteria blooms: The potential roles of eutrophication and climate change, Harmful Algae, 14, 313–334, https://doi.org/10.1016/j.hal.2011.10.027, 2012.
Paerl, H.: Nutrient and other environmental controls of harmful cyanobacterial blooms along the freshwater-marine continuum, Adv. Exp. Med. Biol., 619, 217–237, https://doi.org/10.1007/978-0-387-75865-7_10, 2008.
Paerl, H. W. and Huisman, J.: Blooms Like It Hot, Science, 320, 57–58, https://doi.org/10.1126/science.1155398, 2008.
Paerl, H. W., Fulton, R. S., Moisander, P. H., and Dyble, J.: Harmful Freshwater Algal Blooms, With an Emphasis on Cyanobacteria, Sci. World J., 1, 76–113, https://doi.org/10.1100/tsw.2001.16, 2001.
Palenik, B.: Chromatic Adaptation in Marine Synechococcus Strains, Appl. Environ. Microbiol., 67, 991–994, https://doi.org/10.1128/AEM.67.2.991-994.2001, 2001.
Pannard, A., Pédrono, J., Bormans, M., Briand, E., Claquin, P., and Lagadeuc, Y.: Production of exopolymers (EPS) by cyanobacteria: impact on the carbon-to-nutrient ratio of the particulate organic matter, Aquat. Ecol., 50, 29–44, https://doi.org/10.1007/s10452-015-9550-3, 2016.
Pereira, S., Zille, A., Micheletti, E., Moradas-Ferreira, P., De Philippis, R., and Tamagnini, P.: Complexity of cyanobacterial exopolysaccharides: composition, structures, inducing factors and putative genes involved in their biosynthesis and assembly, FEMS Microbiol. Rev., 33, 917–941, 2009.
Phlips, E. J., Badylak, S., and Lynch, T. C.: Blooms of the picoplanktonic cyanobacterium Synechococcus in Florida Bay, a subtropical inner-shelf lagoon, Limnol. Oceanogr., 44, 1166–1175, https://doi.org/10.4319/lo.1999.44.4.1166, 1999.
Ploug, H.: Cyanobacterial surface blooms formed by Aphanizomenon sp. and Nodularia spumigena in the Baltic Sea: Small-scale fluxes, pH, and oxygen microenvironments, Limnol. Oceanogr., 53, 914–921, https://doi.org/10.4319/lo.2008.53.3.0914, 2008.
Pomar, L. and Hallock, P.: Carbonate factories: a conundrum in sedimentary geology, Earth-Sci. Rev., 87, 134–169, 2008.
Price, G. D.: Inorganic carbon transporters of the cyanobacterial CO2 concentrating mechanism, Photosynth. Res., 109, 47–57, https://doi.org/10.1007/s11120-010-9608-y, 2011.
Price, G. D., Sültemeyer, D., Klughammer, B., Ludwig, M., and Badger, M. R.: The functioning of the CO2 concentrating mechanism in several cyanobacterial strains: a review of general physiological characteristics, genes, proteins, and recent advances, Can. J. Botany, 76, 973–1002, 1998.
Price, G. D., Maeda, S., Omata, T., and Badger, M. R.: Modes of active inorganic carbon uptake in the cyanobacterium, Synechococcus sp. PCC7942, Funct. Plant Biol., 29, 131, https://doi.org/10.1071/PP01229, 2002.
Price, G. D., Badger, M. R., Woodger, F. J., and Long, B. M.: Advances in understanding the cyanobacterial CO2-concentrating-mechanism (CCM): functional components, Ci transporters, diversity, genetic regulation and prospects for engineering into plants, J. Exp. Bot., 59, 1441–1461, https://doi.org/10.1093/jxb/erm112, 2008.
Rae, B. D., Long, B. M., Whitehead, L. F., Förster, B., Badger, M. R., and Price, G. D.: Cyanobacterial Carboxysomes: Microcompartments that Facilitate CO2 Fixation, Microb. Physiol., 23, 300–307, https://doi.org/10.1159/000351342, 2013.
Raven, J. A., Beardall, J., and Sánchez-Baracaldo, P.: The possible evolution and future of CO2-concentrating mechanisms, J. Exp. Bot., 68, 3701–3716, 2017.
Reynolds, C. S.: Cyanobacterial Water-Blooms, in: Advances in Botanical Research, edited by: Callow, J. A., Academic Press, 67–143, https://doi.org/10.1016/S0065-2296(08)60341-9, 1987.
Reynolds, C. S. and Walsby, A. E.: WATER-BLOOMS, Biol. Rev., 50, 437–481, https://doi.org/10.1111/j.1469-185X.1975.tb01060.x, 1975.
Rippka, R., Deruelles, J., Waterbury, J. B., Herdman, M., and Stanier, R. Y.: Generic assignments, strain histories and properties of pure cultures of cyanobacteria, Microbiology, 111, 1–61, 1979.
Robbins, L. and Blackwelder, P.: Biochemical and ultrastructural evidence for the origin of whitings: A biologically induced calcium carbonate precipitation mechanism, Geology, 20, 464–468, 1992.
Rossi, F. and De Philippis, R.: Role of cyanobacterial exopolysaccharides in phototrophic biofilms and in complex microbial mats, Life, 5, 1218–1238, 2015.
Sandrini, G., Tann, R. P., Schuurmans, J. M., van Beusekom, S. A. M., Matthijs, H. C. P., and Huisman, J.: Diel Variation in Gene Expression of the CO2-Concentrating Mechanism during a Harmful Cyanobacterial Bloom, Front. Microbiol., 7, 551, https://doi.org/10.3389/fmicb.2016.00551, 2016.
Schultze-Lam, S., Harauz, G., and Beveridge, T. J.: Participation of a cyanobacterial S layer in fine-grain mineral formation, J. Bacteriol., 174, 7971–7981, https://doi.org/10.1128/jb.174.24.7971-7981.1992, 1992.
Schultze-Lam, S., Schultze-Lam, S., Beveridge, T. J., and Des Marais, D. J.: Whiting events: biogenic origin due to the photosynthetic activity of cyanobacterial picoplankton, Limnol. Oceanogr., 42, 133–141, 1997.
Shen, G., Canniffe, D. P., Ho, M. Y., Kurashov, V., van der Est, A., Golbeck, J. H., and Bryant, D. A.: Characterization of chlorophyll f synthase heterologously produced in Synechococcus sp. PCC 7002, Photosynth. Res., 140, 77–92, 2019.
Shinn, E. A., Steinen, R. P., Lidz, B. H., and Swart, P. K.: Whitings, a sedimentologic dilemma, J. Sediment. Res., 59, 147–161, 1989.
Skoog, E. J., Moore, K. R., Gong, J., Ciccarese, D., Momper, L., Cutts, E. M., and Bosak, T.: Metagenomic, (bio)chemical, and microscopic analyses reveal the potential for the cycling of sulfated EPS in Shark Bay pustular mats, ISME Commun., 2, 43, https://doi.org/10.1038/s43705-022-00128-1, 2022.
Stal, L., Van Gemerden, H., and Krumbein, W.: The simultaneous assay of chlorophyll and bacteriochlorophyll in natural microbial communities, J. Microbiol. Meth., 2, 295–306, 1984.
Stanton, C., Barnes, B. D., Kump, L. R., and Cosmidis, J.: A re‐examination of the mechanism of whiting events: A new role for diatoms in Fayetteville Green Lake (New York, USA), Geobiology, 21, 210–228, https://doi.org/10.1111/gbi.12534, 2023.
Tai, V. and Palenik, B.: Temporal variation of Synechococcus clades at a coastal Pacific Ocean monitoring site, ISME J., 3, 903–915, https://doi.org/10.1038/ismej.2009.35, 2009.
Takahashi, Y., Yamaguchi, O., and Omata, T.: Roles of CmpR, a LysR family transcriptional regulator, in acclimation of the cyanobacterium Synechococcus sp. strain PCC 7942 to low-CO2 and high-light conditions: High-light and low-CO2 acclimation in cyanobacteria, Mol. Microbiol., 52, 837–845, https://doi.org/10.1111/j.1365-2958.2004.04021.x, 2004.
Talling, J. F.: The Depletion of Carbon Dioxide from Lake Water by Phytoplankton, J. Ecol., 64, 79, https://doi.org/10.2307/2258685, 1976.
Thompson, J. and Ferris, F.: Cyanobacterial precipitation of gypsum, calcite, and magnesite from natural alkaline lake water, Geology, 18, 995–998, 1990.
Thompson, J. B.: Microbial Whitings, in: Microbial Sediments, edited by: Riding, R. E. and Awramik, S. M., Springer, Berlin, Heidelberg, https://doi.org/10.1007/978-3-662-04036-2_27, 2000.
Thompson, J. B., Ferris, F. G., and Smith, D. A.: Geomicrobiology and Sedimentology of the Mixolimnion and Chemocline in Fayetteville Green Lake, New York, PALAIOS, 5, 52, https://doi.org/10.2307/3514996, 1990.
Tortell, P. D.: Evolutionary and ecological perspectives on carbon acquisition in phytoplankton, Limnol. Oceanogr., 45, 744–750, https://doi.org/10.4319/lo.2000.45.3.0744, 2000.
Tortell, P. D., Rau, G. H., and Morel, F. M. M.: Inorganic carbon acquisition in coastal Pacific phytoplankton communities, Limnol. Oceanogr, 45, 1485–1500, https://doi.org/10.4319/lo.2000.45.7.1485, 2000.
Townsend, D. W., Cammen, L. M., Holligan, P. M., Campbell, D. E., and Pettigrew, N. R.: Causes and consequences of variability in the timing of spring phytoplankton blooms, Deep-Sea Res. Pt. I, 41, 747–765, https://doi.org/10.1016/0967-0637(94)90075-2, 1994.
Trichet, J. and Defarge, C.: Non-biologically supported organomineralization, Bulletin–Institut Oceanographic Monaco, Numero Special, 203–236, 1995.
Verspagen, J. M. H., Van de Waal, D. B., Finke, J. F., Visser, P. M., Van Donk, E., and Huisman, J.: Rising CO2 Levels Will Intensify Phytoplankton Blooms in Eutrophic and Hypertrophic Lakes, PLOS ONE, 9, e104325, https://doi.org/10.1371/journal.pone.0104325, 2014.
Visscher, P. T., Reid, R. P., Bebout, B. M., Hoeft, S. E., Macintyre, I. G., & Thompson, J. A.: Formation of lithified micritic laminae in modern marine stromatolites (Bahamas); the role of sulfur cycling, Am. Mineral., 83 (11–12_Part_2), 1482–1493, 1998.
Walker, J. M., Marzec, B., Lee, R. B. Y., Vodrazkova, K., Day, S. J., Tang, C. C., Rickaby, R. E. M., and Nudelman, F.: Polymorph Selectivity of Coccolith-Associated Polysaccharides from Gephyrocapsa Oceanica on Calcium Carbonate Formation In Vitro, Adv. Funct. Mater., 29, 1807168, https://doi.org/10.1002/adfm.201807168, 2019.
Wall, R. S. and Gyi, T. J.: Alcian blue staining of proteoglycans in polyacrylamide gels using the “critical electrolyte concentration” approach, Anal. Biochem., 175, 298–299, 1988.
Wang, L.-L., Wang, L.-F., Ren, X.-M., Ye, X.-D., Li, W.-W., Yuan, S.-J., Sun, M., Sheng, G.-P., Yu, H.-Q., and Wang, X.-K.: pH dependence of structure and surface properties of microbial EPS, Environ. Sci. Technol., 46, 737–744, 2012.
Weisse, T.: Dynamics of Autotrophic Picoplankton in Marine and Freshwater Ecosystems, in: Advances in Microbial Ecology, vol. 13, edited by: Jones, J. G., Springer US, Boston, MA, 327–370, https://doi.org/10.1007/978-1-4615-2858-6_8, 1993.
Wells, A. J. and Iling, L. V.: Present-day precipitation of calcium carbonate in the Persian Gulf, in: Deltaic and shallow-water marine deposits, edited by: van Straaten, L., Elsevier Developments in Sedimentology Series, New York, 429–435, https://doi.org/10.1016/S0070-4571(08)70517-X, 1964.
Wheeler, A., George, J. W., and Evans, C.: Control of calcium carbonate nucleation and crystal growth by soluble matrx of oyster shell, Science, 212, 1397–1398, 1981.
Whitton, B. A. and Potts, M.: Introduction to the Cyanobacteria, in: Ecology of Cyanobacteria II, edited by: Whitton, B. A., Springer Netherlands, Dordrecht, 1–13, https://doi.org/10.1007/978-94-007-3855-3_1, 2012.
Xu, H., Paerl, H. W., Qin, B., Zhu, G., Hall, N. S., and Wu, Y.: Determining Critical Nutrient Thresholds Needed to Control Harmful Cyanobacterial Blooms in Eutrophic Lake Taihu, China, Environ. Sci. Technol., 49, 1051–1059, https://doi.org/10.1021/es503744q, 2015.
Yang, G., Li, F., Deng, Z., Wang, Y., Su, Z., Huang, L., Yin, L., and Ji, C.: Abnormal Crystallization Sequence of Calcium Carbonate in the Presence of Synechococcus sp. PCC 7942, Geomicrobiol. J., 40, 34–45, https://doi.org/10.1080/01490451.2022.2100948, 2023.
Yates, K. K. and Robbins, L. L.: Production of carbonate sediments by a unicellular green alga, Ame. Mineral., 83, 1503–1509, 1998.
Zepernick, B. N., Gann, E. R., Martin, R. M., Pound, H. L., Krausfeldt, L. E., Chaffin, J. D., and Wilhelm, S. W.: Elevated pH Conditions Associated With Microcystis spp. Blooms Decrease Viability of the Cultured Diatom Fragilaria crotonensis and Natural Diatoms in Lake Erie, Front. Microbiol., 12, 188 , 2021.
Zhao, H., Han, G., Zhang, S., and Wang, D.: Two phytoplankton blooms near Luzon Strait generated by lingering Typhoon Parma: Lingering Typhoon-Induced Algae Blooms, J. Geophys. Res.-Biogeo., 118, 412–421, https://doi.org/10.1002/jgrg.20041, 2013.